Using a Multimedia Aquivalence Model to Evaluate the Environmental Fate of Fe, Mn and Trace Metals in an Industrial City, China

State Key Laboratory of Water Environment Simulation, School of Environment, Beijing Normal University, Beijing 100875, China
*
Author to whom correspondence should be addressed.
Water 2020, 12(6), 1580; https://doi.org/10.3390/w12061580
Submission received: 14 April 2020
/
Revised: 21 May 2020
/
Accepted: 25 May 2020
/
Published: 2 June 2020
(This article belongs to the Section Hydraulics and Hydrodynamics)
Abstract
:The rapid expansion of urban impervious surface areas complicates urban-scale heavy metal circulation among various environmental compartments (air, soil, sediment, water, and road dust). Herein, a level III steady-state aquivalence model evaluated the fate of heavy metals in Nanjing, China. Iron was the most abundant heavy metal in all environmental compartments, while cadmium was the rarest. Most simulated concentrations agreed with measured values within three logarithmic residuals. In the simulated heavy metal cycle, industrial emission contributed almost the entire input, whereas sediment burial was the dominant output pathway. The transfer fluxes between bottom sediment and water were the highest. Thereinto, the contribution of sediment resuspension for Fe and Mn was significantly higher than that to the other metal elements, which could partly explain why Fe and Mn are the major blackening ingredients in malodorous black rivers. Road dust was also an important migration destination for heavy metals, accounting for 3–45%, although soil and sediment were the main repositories of heavy metals in the urban environment. The impact of road dust on surface water should not be neglected, with its contribution reaching 4–31%. The wash-off rate constant W for road dust–water process was proved to be consistent with that for film–water and was independent of the type of heavy metals. Sensitivity analysis highlighted the notable background value effect on Fe and Mn.

1. Introduction
Urban streams, rivers, and lakes are the final link of the urban water cycle. They receive a variety of point source and diffuse pollutants from other urban environmental media [1], including atmospheric deposition [2,3,4], soil erosion [5,6], and tailwater discharge [7,8,9]. Consequently, the receiving water readily deteriorates and even turns black and malodorous. As the city grows, the hardened impermeable area of urban roads is constantly expanding. In Shenzhen, it has been found that, when the impermeable area of the urban watershed exceeds 36.9%, irreversible river water quality degradation will occur [10]. In Korea, it is suggested that the proportion of the impervious surface area should be controlled within 10% in watersheds to mitigate water quality degradation [11]. Although the threshold of the impervious surface impact on stream health varies at different locations, the impact of urbanization on water quality in watersheds has been increasing in recent years [12]. Road dust accumulated on impervious surface areas can absorb various pollutants under the influence of intrinsic and extrinsic factors [13]. The contribution of urban runoff caused by rain wash-off to river water pollutants cannot be ignored [14,15]. Accordingly, road dust has gradually become a major environmental phase potentially threatening the urban water environment. In addition to exogenous pollution, endogenous pollution of sediment is also an important reason for long-term river water quality deterioration [16]. It is important to study the influence of road dust coupled with other environmental media on urban water quality.
As nondegradable pollutants, heavy metals in urban environments mainly originate from various natural and human activities, including crust weathering, vehicle exhaust, coal combustion, and industrial activities in cities [17,18,19]. Regardless of their origin in the urban environment, the impact of different heavy metals on water quality varies significantly. With regard to the contribution of atmospheric deposition, for certain elements (Fe, Mn, Cu, Pb, Al, V, and Cr), atmospheric deposition contributed an average of 30% of the overall amount to shallower waters. For Cd, Ni, and partly Zn, the contribution was at least 10% [20]. In terms of the release characteristics of heavy metals from sediment, although the release behavior of heavy metals is influenced by different redox conditions, the iron (Fe) and manganese (Mn) fluxes are much higher than those of other heavy metals [16]. In addition, one of the reasons urban rivers become malodorous and black is that iron and manganese adhere to the suspended particles in water in the form of black sulfide [21]. However, cadmium (Cd) poses a higher ecological risk than Mn and Zn [22]. Therefore, it is necessary to study the migration and fate of Fe, Mn, and other metallic elements in urban environmental media.
Diverse multimedia models have been constructed and exploited to quantitatively examine the fate and transport of heavy metals in the urban environment under steady or unsteady assumptions [23,24,25]. Compared with certain multimedia models, such as SimpleBox, EUSES, and POLAIR3D [26,27,28], which attained good evaluation performance at the global, continental, and regional scales, the fugacity model proposed by Donald Mackay is the most classical model and is relatively mature. However, the fugacity model approach does not apply to non-volatile metal pollutants because most metals have no vapor pressure. As a result, Mackay and Diamond improved the fugacity model and proposed another equilibrium criterion, the aquivalence, to replace the fugacity [29]. The aquivalence model is a useful tool for compartmentalizing the movement of heavy metals associated with multiple phases and environmental media. Although there are many studies on multimedia aquivalence models, most of them focus on organic compounds [30,31,32,33,34,35], while relatively few focus on non-volatile heavy metals [36], especially for those on impervious road surfaces [37,38]. Moreover, pursuant to the characteristic of heavy metals in road dust with grain size fraction [39] and index model for the evaluation of metal pollution load from wash-off of road dust [40], the migration and transformation parameters associated with the organic film that coats impervious surface in the multimedia model need to be recalculated and verified. Therefore, studying the urban-scale multimedia aquivalence model involving urban road dust will enable researchers to bridge the knowledge gap and understand the effect of the road dust on the metals fate in the built environment better.
The objectives of this study were: (1) to estimate the detailed local variations and mass fluxes of heavy metals in various environmental media based on a level III steady-state aquivalence model for a highly urbanized and industrialized city (Nanjing, China); (2) to validate the model results with systematic monitoring and literature data in different media along with a sensitivity analysis of the model parameters; and (3) to compare the effects of heavy metals in different environmental media on water quality.
2. Materials and Methods
2.1. Characteristics of the Study Area
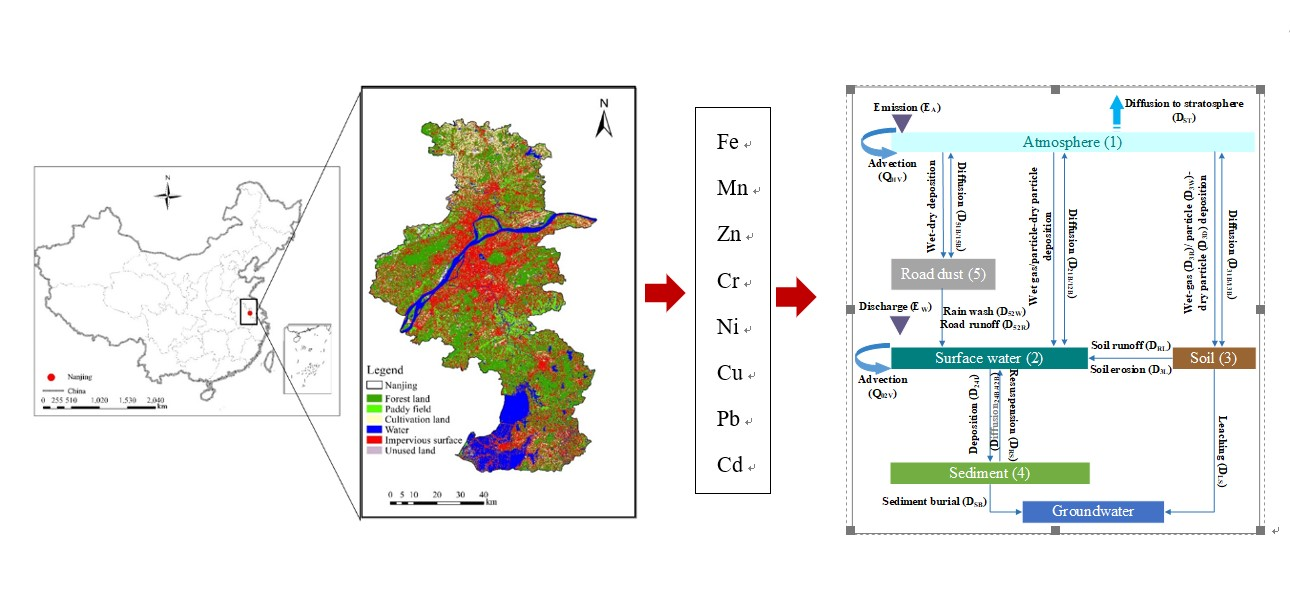
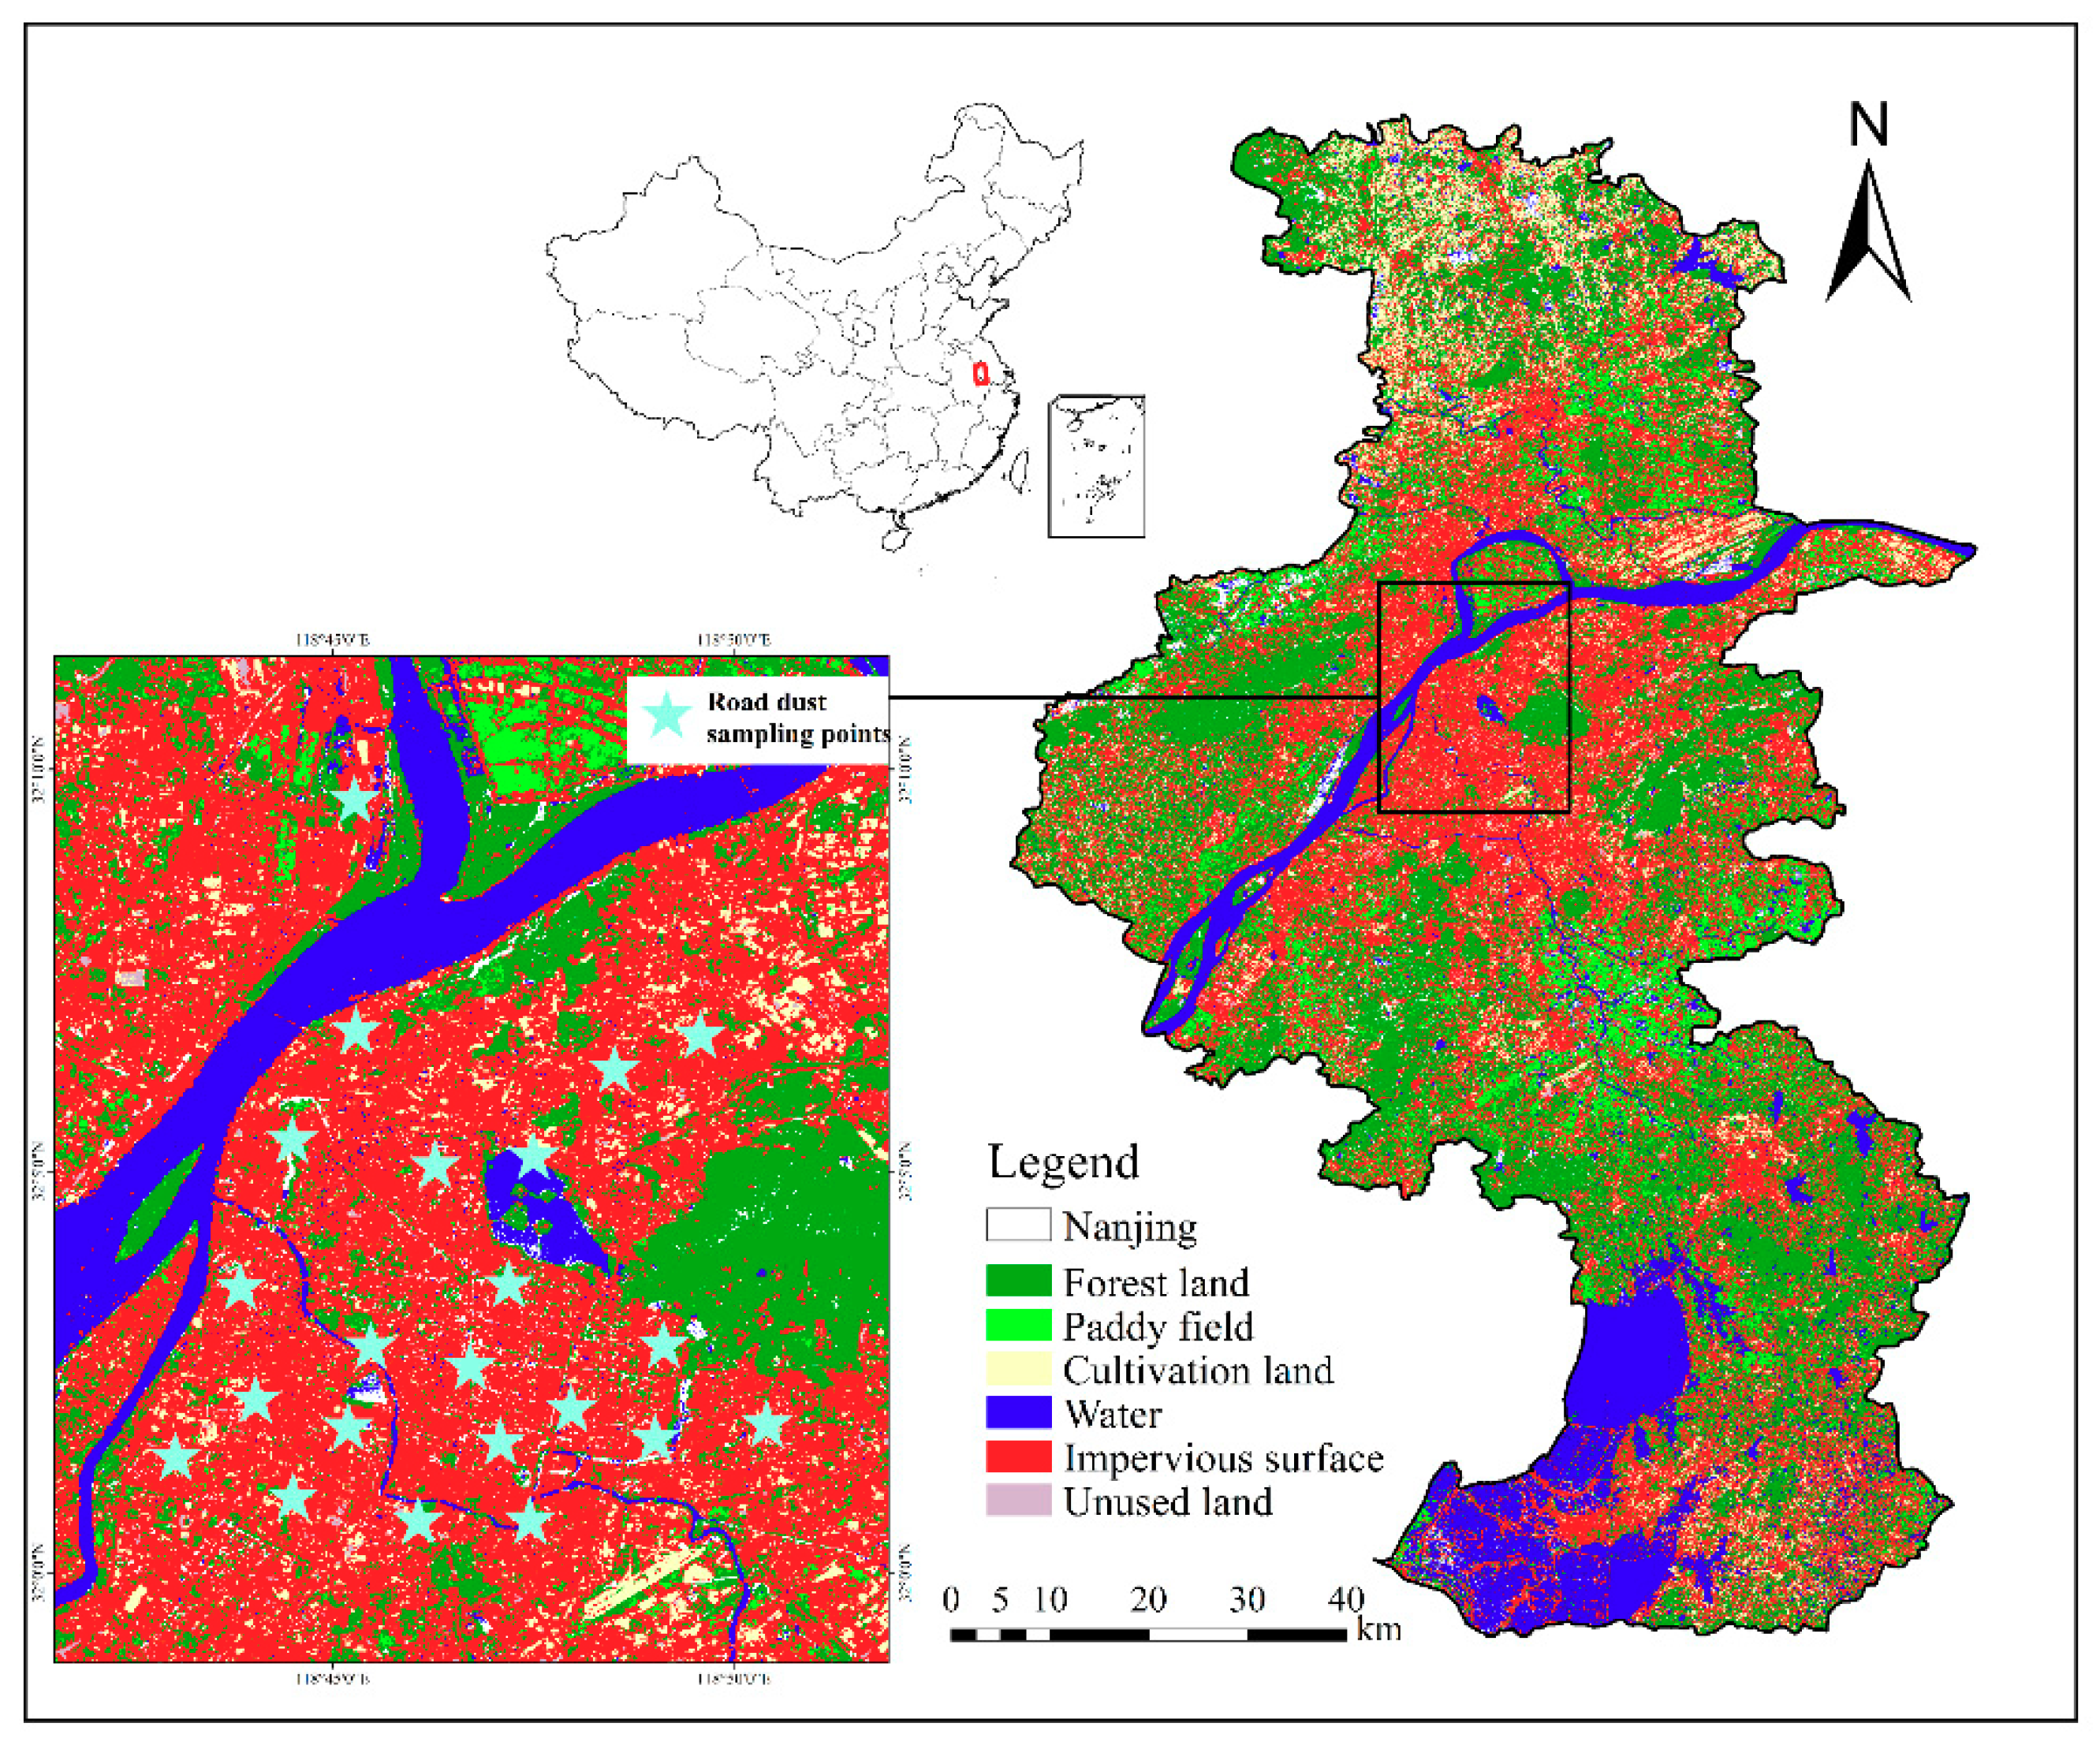
Located in the lower reaches of the Yangtze River in southeast coastal area of China (118°22″ E–119°14″ E, 31°14″ N–32°37″ N), Nanjing city has a subtropical monsoon climate with four distinct seasons and abundant rainfall. The average annual rainfall is 1106.5 mm, the relative humidity is 76%, and the annual average temperature is 15.4 °C. The terrain is relatively flat. The flow rates of urban rivers are slow. The black and odorous water bodies are easy to form. In addition, Nanjing is a nationally important comprehensive industrial production base with a GDP totaling 95.15 billion dollars in 2011. Nanjing has a high electronic chemical production capacity, a very large vehicle manufacturing scale, and advanced rail transit equipment and power grid industries. In this study, five environmental media, namely air, soil, water, sediment, and road dust, were selected. Road dust collection and heavy metal content determination were conducted by our research group.
2.2. Collection of Road Dust and Determination of Heavy Metal Content
As the impervious surface of Nanjing city is relatively concentrated, the locations of the sampling points were set based on the land use type of the city. In total, 23 road dust sampling points were arranged, and each sampling point was cleaned with a brush to collect approximately 300 g samples, which were then transferred to a polyethylene sealed bag with a plastic shovel. The samples were sent to the laboratory as soon as possible after collection. The bulk samples were separated by an electric vibrating machine with a series of nylon screens with mesh openings of 250, 125, 75, and 37 µm overlaid in sequence on the machine. About 150 g dried bulk sample was put on the top screen with mesh openings of 250 µm. When the electric vibrating machine started, the particles were sieved though the series overlaid screens and separated into sub-samples (250–500, 125–250, 75–125, 37–75, and <37 μm). The heavy metal content was tested after the bulk and sub-samples were freeze-dried. According to the detection method of national standard GB15618-1995, 0.5 g samples were digested with hydrofluoric, nitric and perchloric acids and aqua regia. Cadmium (Cd), copper (Cu), nickel (Ni), lead (Pb), and zinc (Zn) were detected by inductively coupled plasma mass spectrometry (ICP-MS). Chromium (Cr), manganese (Mn), and iron (Fe) were detected by inductively coupled plasma optical emission spectrometry (ICP-OES).
For the air, soil, water, and sediment, heavy metal concentration data were collected through literature research. Descriptive statistical results of the reference data, including arithmetic mean (AM), geometric mean (GM), median, minimum value (Min), maximum value (Max), number (N), and standard deviation (SD), are provided in the Supplementary Materials (Table S1). Table 1 is a partial summary of the descriptive statistics results.
2.3. Model Construction
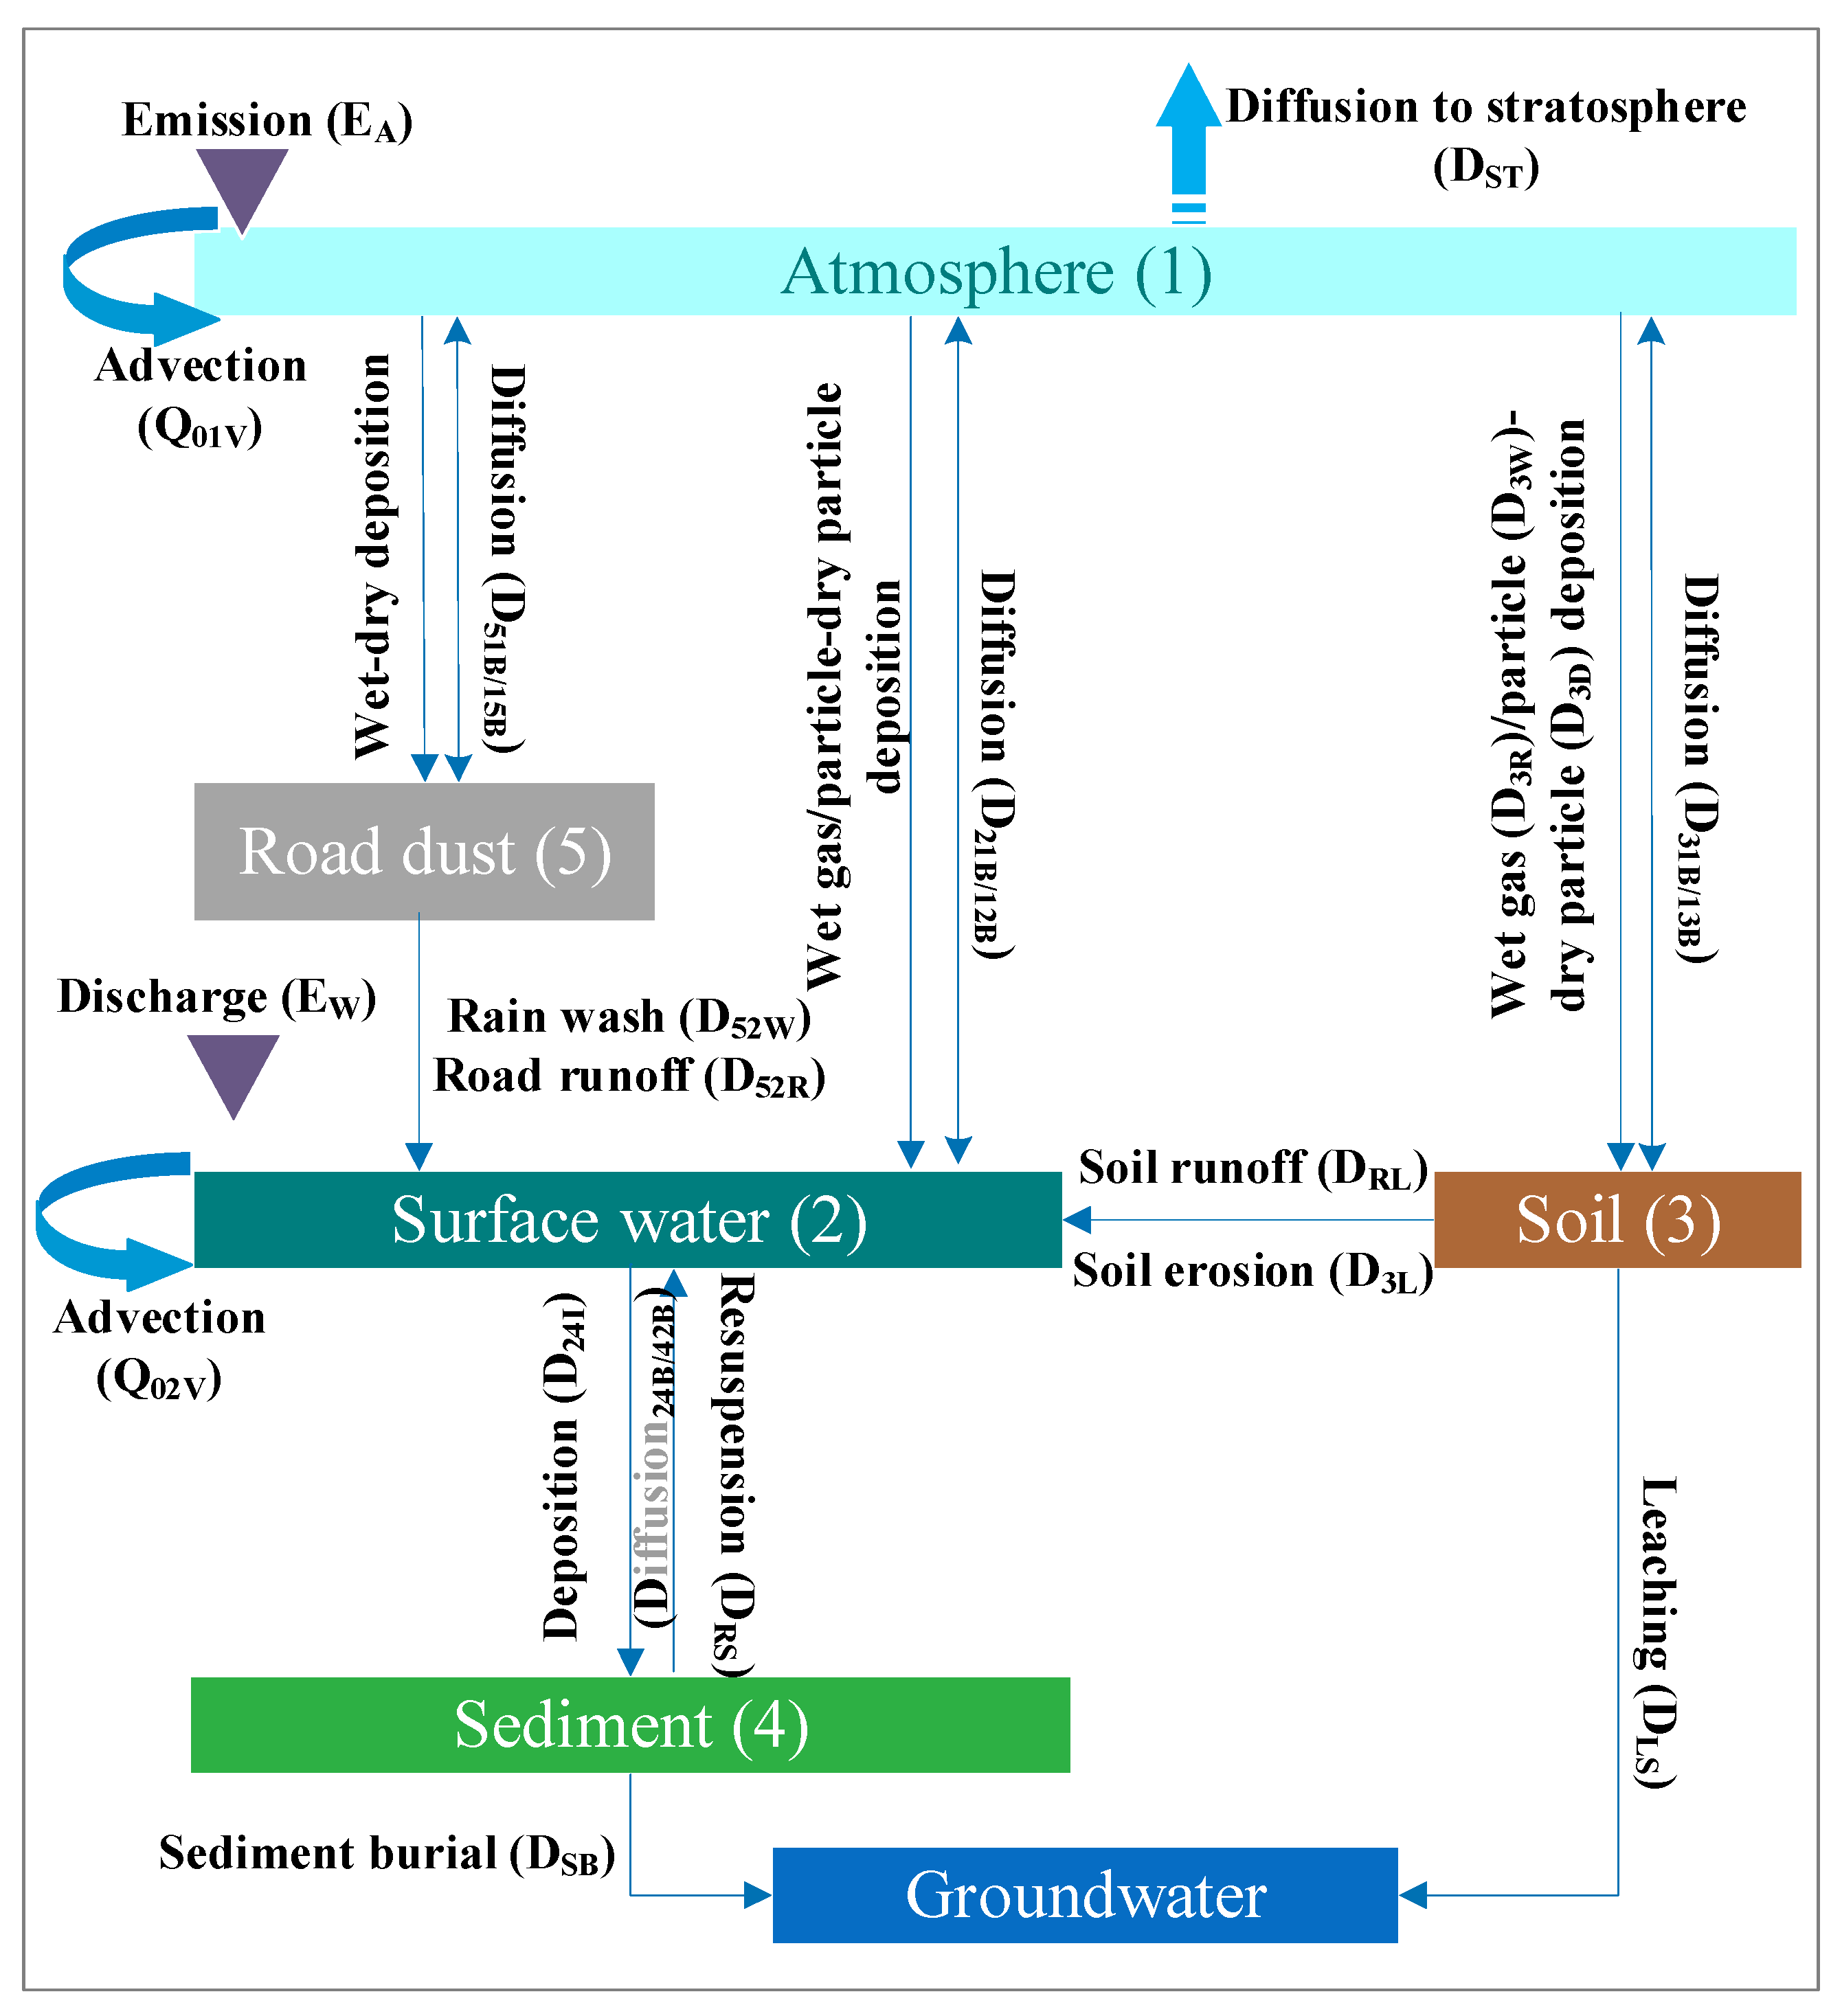
The multimedia aquivalence model proposed by Mackay and Diamond [29] was applied to characterize the dynamics of heavy metals in five compartments, namely air, water, sediment, soil, and road dust, in Nanjing, China. The migration and transformation processes involved in this model are shown in Figure 1, including atmospheric dry and wet deposition, diffusion, sediment resuspension and deposition, road dust wash-off, etc.
The basic principle of the multimedia model is the law of mass conservation. The modeling basis consists of establishing a series of mass balance equations for the pollutants in the study area. In this study, metal circulation was assumed to be stable. That is, for the five main environmental compartments in the system, the inflow fluxes are equal to the outflow fluxes. The metal flux exchanges between adjacent compartments were calculated separately using the aquivalence approach (N = D ). Based on the conceptual model, the mass balance equation for each compartment is summarized in Equations (1)–(5).
Air: Q2D21B + Q3D31B + Q5D51B + Q01V CA + EA = Q1 (D(i)R + D(i)W + D(i)D + D12B + D13B + D15B + D10V + DST)
Water: Q1 (D2R + D2W + D2D + D12B) + Q3 (D3L + DRL) + Q4 (DRS + D42B) + Q5 D52R + Q02VCW + EW = Q2 (D21B + D24B + D24I + D20V)
Soil: Q1 (D3R + D3W + D3D + D13B) = Q3 (D3L + DRL + D31B + DLS)
Sediment: Q2 (D24I + D24B) = Q4 (D42B + DRS + DSB)
Road dust: Q1 (D15B + D5R + D5W + D5D) = Q5 (D51B + D52R)
In the equations above, N (mol/h) is the transfer flux, D (m3/h) is the transport parameter of the pollutant, and D reflects the speed of mass transfer in a process. The higher the D value is, the higher the transmission rate is. The equilibrium criterion, aquivalence (Q, mol/m3), was proposed to replace fugacity, and Z (dimensionless) is the fugacity capacity. When the Z value is high, the corresponding fugacity increases little after the pollutant is absorbed by the compartment, and the pollutant tends to remain in the compartment; otherwise, it tends to escape. The molar concentration (C, mol/m3) is the product of the aquivalence Q and fugacity capacity Z (). EA and EW refer to the amounts of heavy metal pollutants discharged into the air and water in Nanjing, respectively (Table S2). The model initialized the compartmental (water, soil, sediment, and road dust) concentrations to the corresponding background values. The initial concentrations in the air compartments were 0.
The Z value for heavy metals in road dust, as particle-sorbed chemicals, is the same as that for aerosols whose major source for heavy metals is the re-suspended road dust [60]. As for those environmental compartments in direct contact with water, the Z values for heavy metals in soil, sediment and SPM was calculated based on the partition coefficients summarized in the supplementary materials (Table S3). In light of the film–water transfer process in the fugacity model, the mass transfer coefficient, krw (m/h), of the road dust–water process, is described by , where Tr is the road dust thickness (m) and W is the wash-off rate constant (h−1). To estimate a reasonable value applicable to steady state rather than event-specific conditions, we determined W by dividing the total amount of contaminants into five ranges of grain size (250–500, 125–250, 75–125, 37–75, and <37 μm) of road dust washed out by the one unwashed.
where Pi is the wash-off percentage of road dust on a grain size fraction i (%), Mi is the mass of a particular grain size fraction per unit area (mg/m2), and Ci is the measured concentration of the metal in the road dust with a grain size i (mg/kg). The wash-off percentages of road dust on each grain size fraction from impervious surface was determined on the basis of the mean mass load per unit area (around 20 mg/m2) [39]. According to the transport factor Fw (%) [40], Pi for the five grain size fractions (250–500, 125–250, 75–125, 37–75, and <37 μm) was estimated to be 6%, 11.6%, 18%, 40%, and 68%, respectively. With regard to other parameters associated with air, water, soil, and sediment, they were determined pursuant to empirical parameters listed in the Supplementary Materials. MATLAB R2019a was run to calculate the simulated concentrations in five environmental compartments (see the MATLAB Live Script in the Supplementary Materials).
As shown in Table 2, the calculated results are close to the wash-off rate constant of organic pollutants (0.25) [61]. Therefore, the rate constant is also applicable to heavy metals in road dust and is not affected by the chemical properties of pollutants. However, we do not consider residual in the rainwater pipe network or storm water treatment.
2.4. Sensitivity Analysis
Sensitivity analysis was performed to assess how each input parameter affects the model output and to identify the most influential inputs. The sensitivity coefficient (SC) was calculated as the proportion of the change in output compared to that in the tested parameters by considering their ranges as follows:
where X1.01 indicates that the input parameter is increased by 1%, that is, the value of the parameter is 101% of its mean. Y1.01 represents the output of the model when the test parameter is increased by 1%.
2.5. Model Parameterization for Nanjing
Model parameters involving environmental and physicochemical parameters were obtained from the current relevant literature and databases and were used in the model to simulate the fate and transport of heavy metals in Nanjing. Herein, a total surface area of 6.41 × 10⁹ m2 was selected. The air compartments were defined at 1000 m according to previous studies [62]. The density of the total suspended particulates was an empirical value of 1.5 × 10¹⁵ μg/m3 [63]. The water area covered 7.42 × 10⁸ m2 with an average depth of 2.48 m [64]. A depth of 10 cm was assumed for the sediment underlying the water. The urban soil and impervious surface areas were 3.08 × 10⁹ and 2.10 × 10⁹ m2, respectively (Figure 2).
3. Results
3.1. Model Simulation and Verification
The pre-processed data involving road dust, soil, atmospheric fine particulate matter (PM 2.5), surface water, sediment, and suspended particulate matter (SPM) are summarized in Table 3. The iron concentration is the highest in all environmental compartments listed, while cadmium has the lowest concentration. This is basically in line with the abundance of elements in the crust. Compared with the background values for river water in the Yangtze River system [65], the concentration proportions of Fe and Mn were not more than 0.5 (0.31 and 0.32, respectively), while the value for Cd was as high as 43.68. For the solid media, including road dust, soil, sediment, and suspended particles, the Cd concentration was 2.09–13.65 times the soil background value [66], while the Fe and Mn variations were small (1.16–2.15 and 1.04–1.64, respectively). This suggests that iron and manganese are less affected by human activities, which implies that, compared with Cd, Fe and Mn are greatly influenced by the initial value of the model—the background value. Furthermore, different environmental media are affected by human activities to different degrees. Many countries and organizations have developed sophisticated systems of standards for controlling the discharge of pollutants to air, water, and soil. However, emission standards for pollutants associated with urban street dust, such as restrictions on the use of heavy metals in tires and brake pads, are lacking.
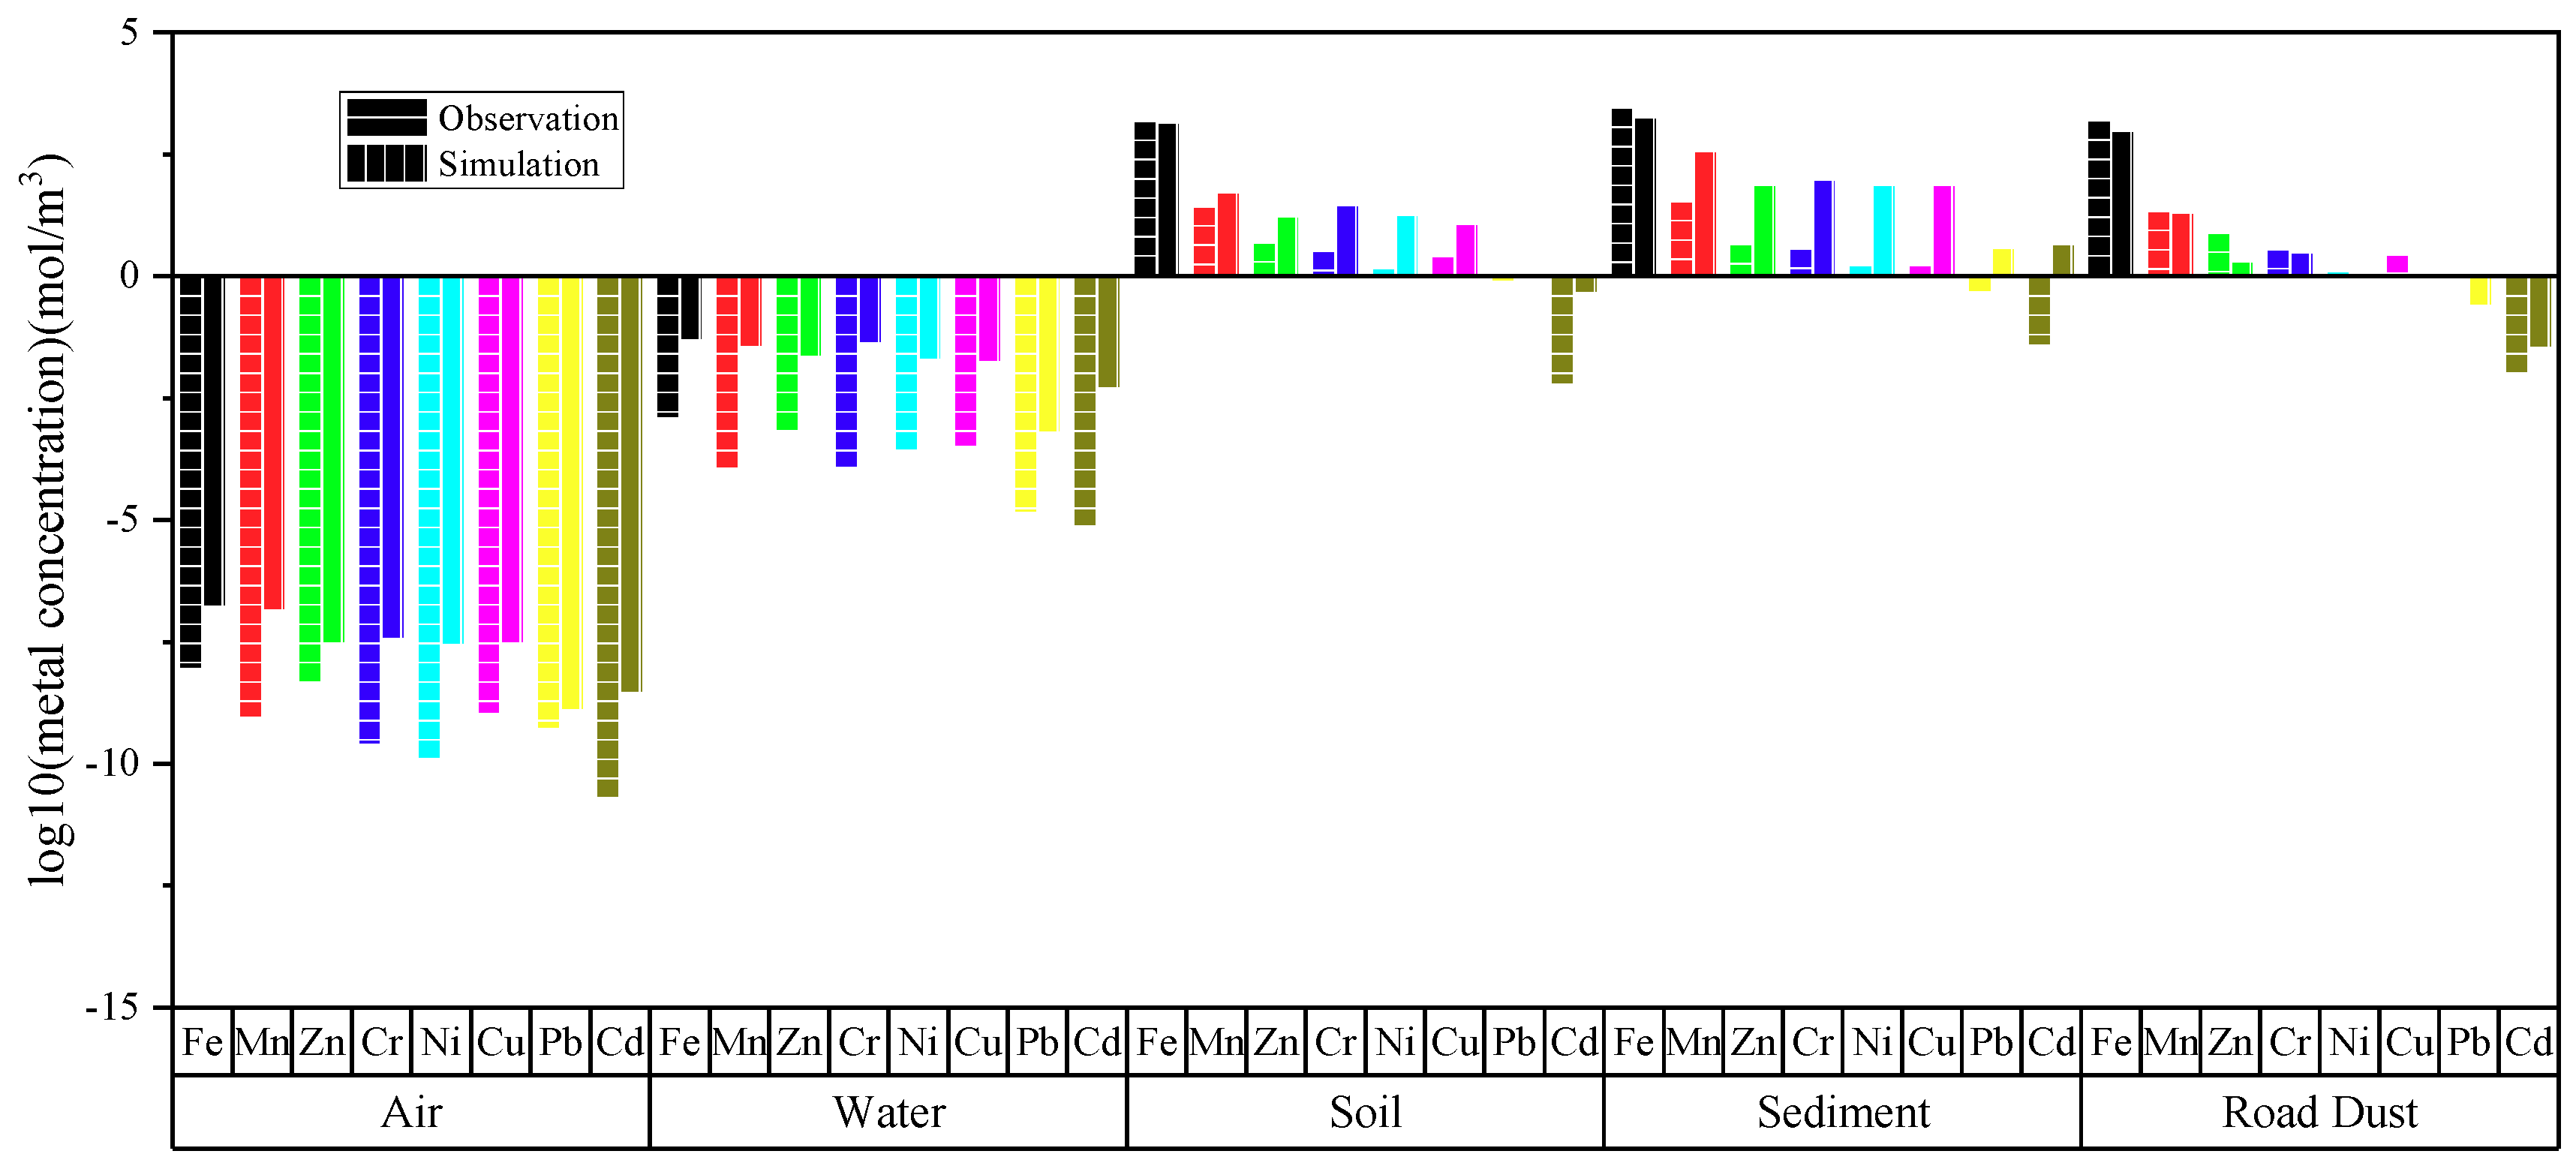
The Fe, Mn, Zn, Cr, Ni, Cu, Pb, and Cd metal element concentrations simulated by the multimedia aquivalence model were compared with observed concentrations as follows (Figure 3). The difference between the simulated and measured logarithmic molar concentrations did not exceed 3. This indicated that the model can simulate the heavy metal concentration in various environmental compartments successfully. Nevertheless, the largest cadmium variation in road dust reached 2.96. This might be related to the uncertainty of the input parameters, most of which were obtained from the literature and not from specific field investigations for the purpose of modeling [25,31]. Consequently, the sensitivity of the input parameters is examined below. For the five environmental compartments, the average logarithmic residual errors of air (1.60), soil (0.70), sediment (1.27), and road dust (0.32) were lower than that of water (2.03). This was consistent with the results of a previous study [68]. It is speculated that the larger deviation observed for the aqueous phase may be attributed to the assumption that the water depth remained consistent, and the water was uniformly mixed. Moreover, most of the simulated concentrations were higher than the measured concentrations, which might be because the maximum allowable emission concentration is used for the simulated pollutant emission concentration, and the emission amount varies from industry to industry.
3.2. The Transport and Fate of Fe, Mn, and Trace Metals in the Urban Multimedia Environment
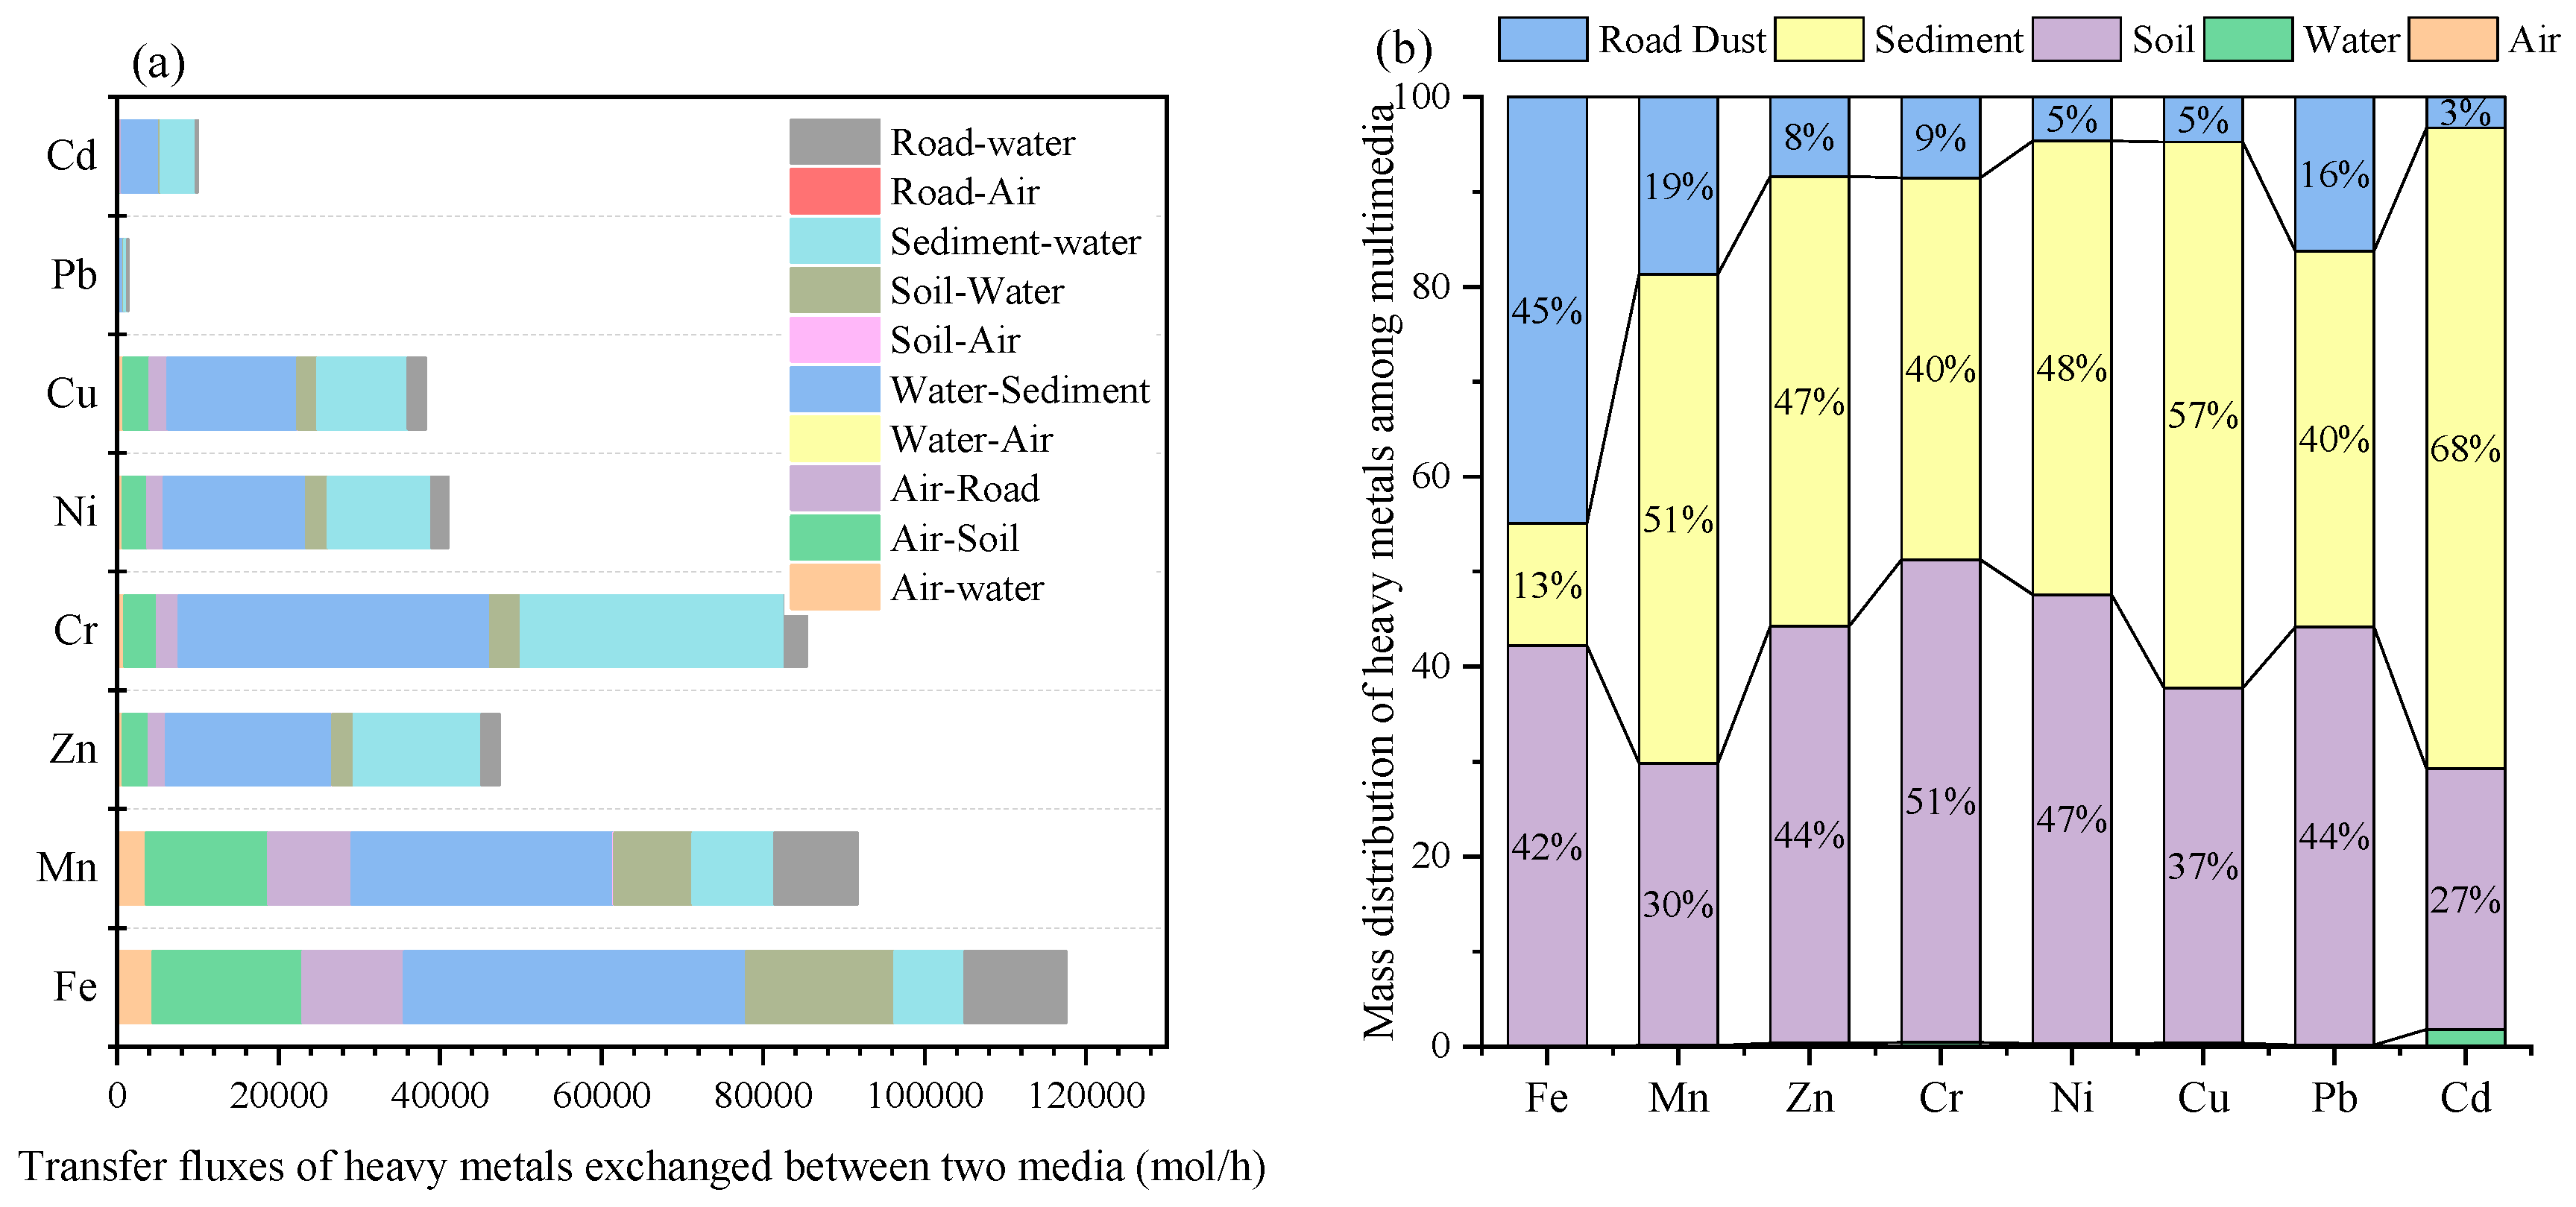
The transfer flux N (mol/h), the product of the aquivalence Q (mol/m3) and the transport or transformation parameter D (m3/h), describes the transport and fate of heavy metals in urban environments. For the whole open environmental system, the simulation results reveal that, out of all the pathways, industrial atmospheric pollutant emissions occupied almost all the heavy metal inputs, while sediment burial (77.52%) was the main output for most heavy metals. This was consistent with a study in an oilfield [25]. Water advection outflow and infiltration into groundwater accounted for 13.59% and 8.89% of the output fluxes, respectively. Diffusion into the stratosphere and air advection outflow contributed little to the output flux. For the exchange between adjacent environmental media in the system, the transport fluxes varied greatly among the different metals. The iron flux was the highest, reaching 117,585 mol/h. Nevertheless, the main transport flux was contributed by the interaction between the sediment and overlying water (Figure 4a). The migration of heavy metals from the water phase to the sediment phase was dominant (41%), but there was still a difference among the different metals, with higher proportions for cadmium (46.37%) and chromium (45.15%). Thus, sediment burial is not the best way to treat heavy metal pollutants. It is important to explore alternative strategies to inhibit the release of heavy metals from sediment.
The mass distribution rule of each heavy metal was basically in agreement with the concentration distribution (Table 3). The total mass of iron accumulated in the various environmental compartments was still the largest, reaching 60 billion tons, followed by manganese (3 billion tons). Cadmium had the smallest mass, with only 350,000 tons. However, as shown in Figure 4b, the mass proportion of each environmental phase has a certain regularity. Soil and sediment were the largest sinks of heavy metals in the urban environment, accounting for 27–51% and 13–68%, respectively. It also suggests that sediment and soil can be difficult to clean thoroughly once contaminated with heavy metal pollutants. Road dust was also an important migration destination for heavy metals, accounting for 3–45%. This indicates that impermeable roads are a significant place for metal accumulation, which is ignored in numerous studies [23,68,69]. Hence, targeted restoration measures should be developed and taken for the sustainable development of the city. In contrast, the masses for the water and air phases are negligible.
3.3. Sensitivity Analysis
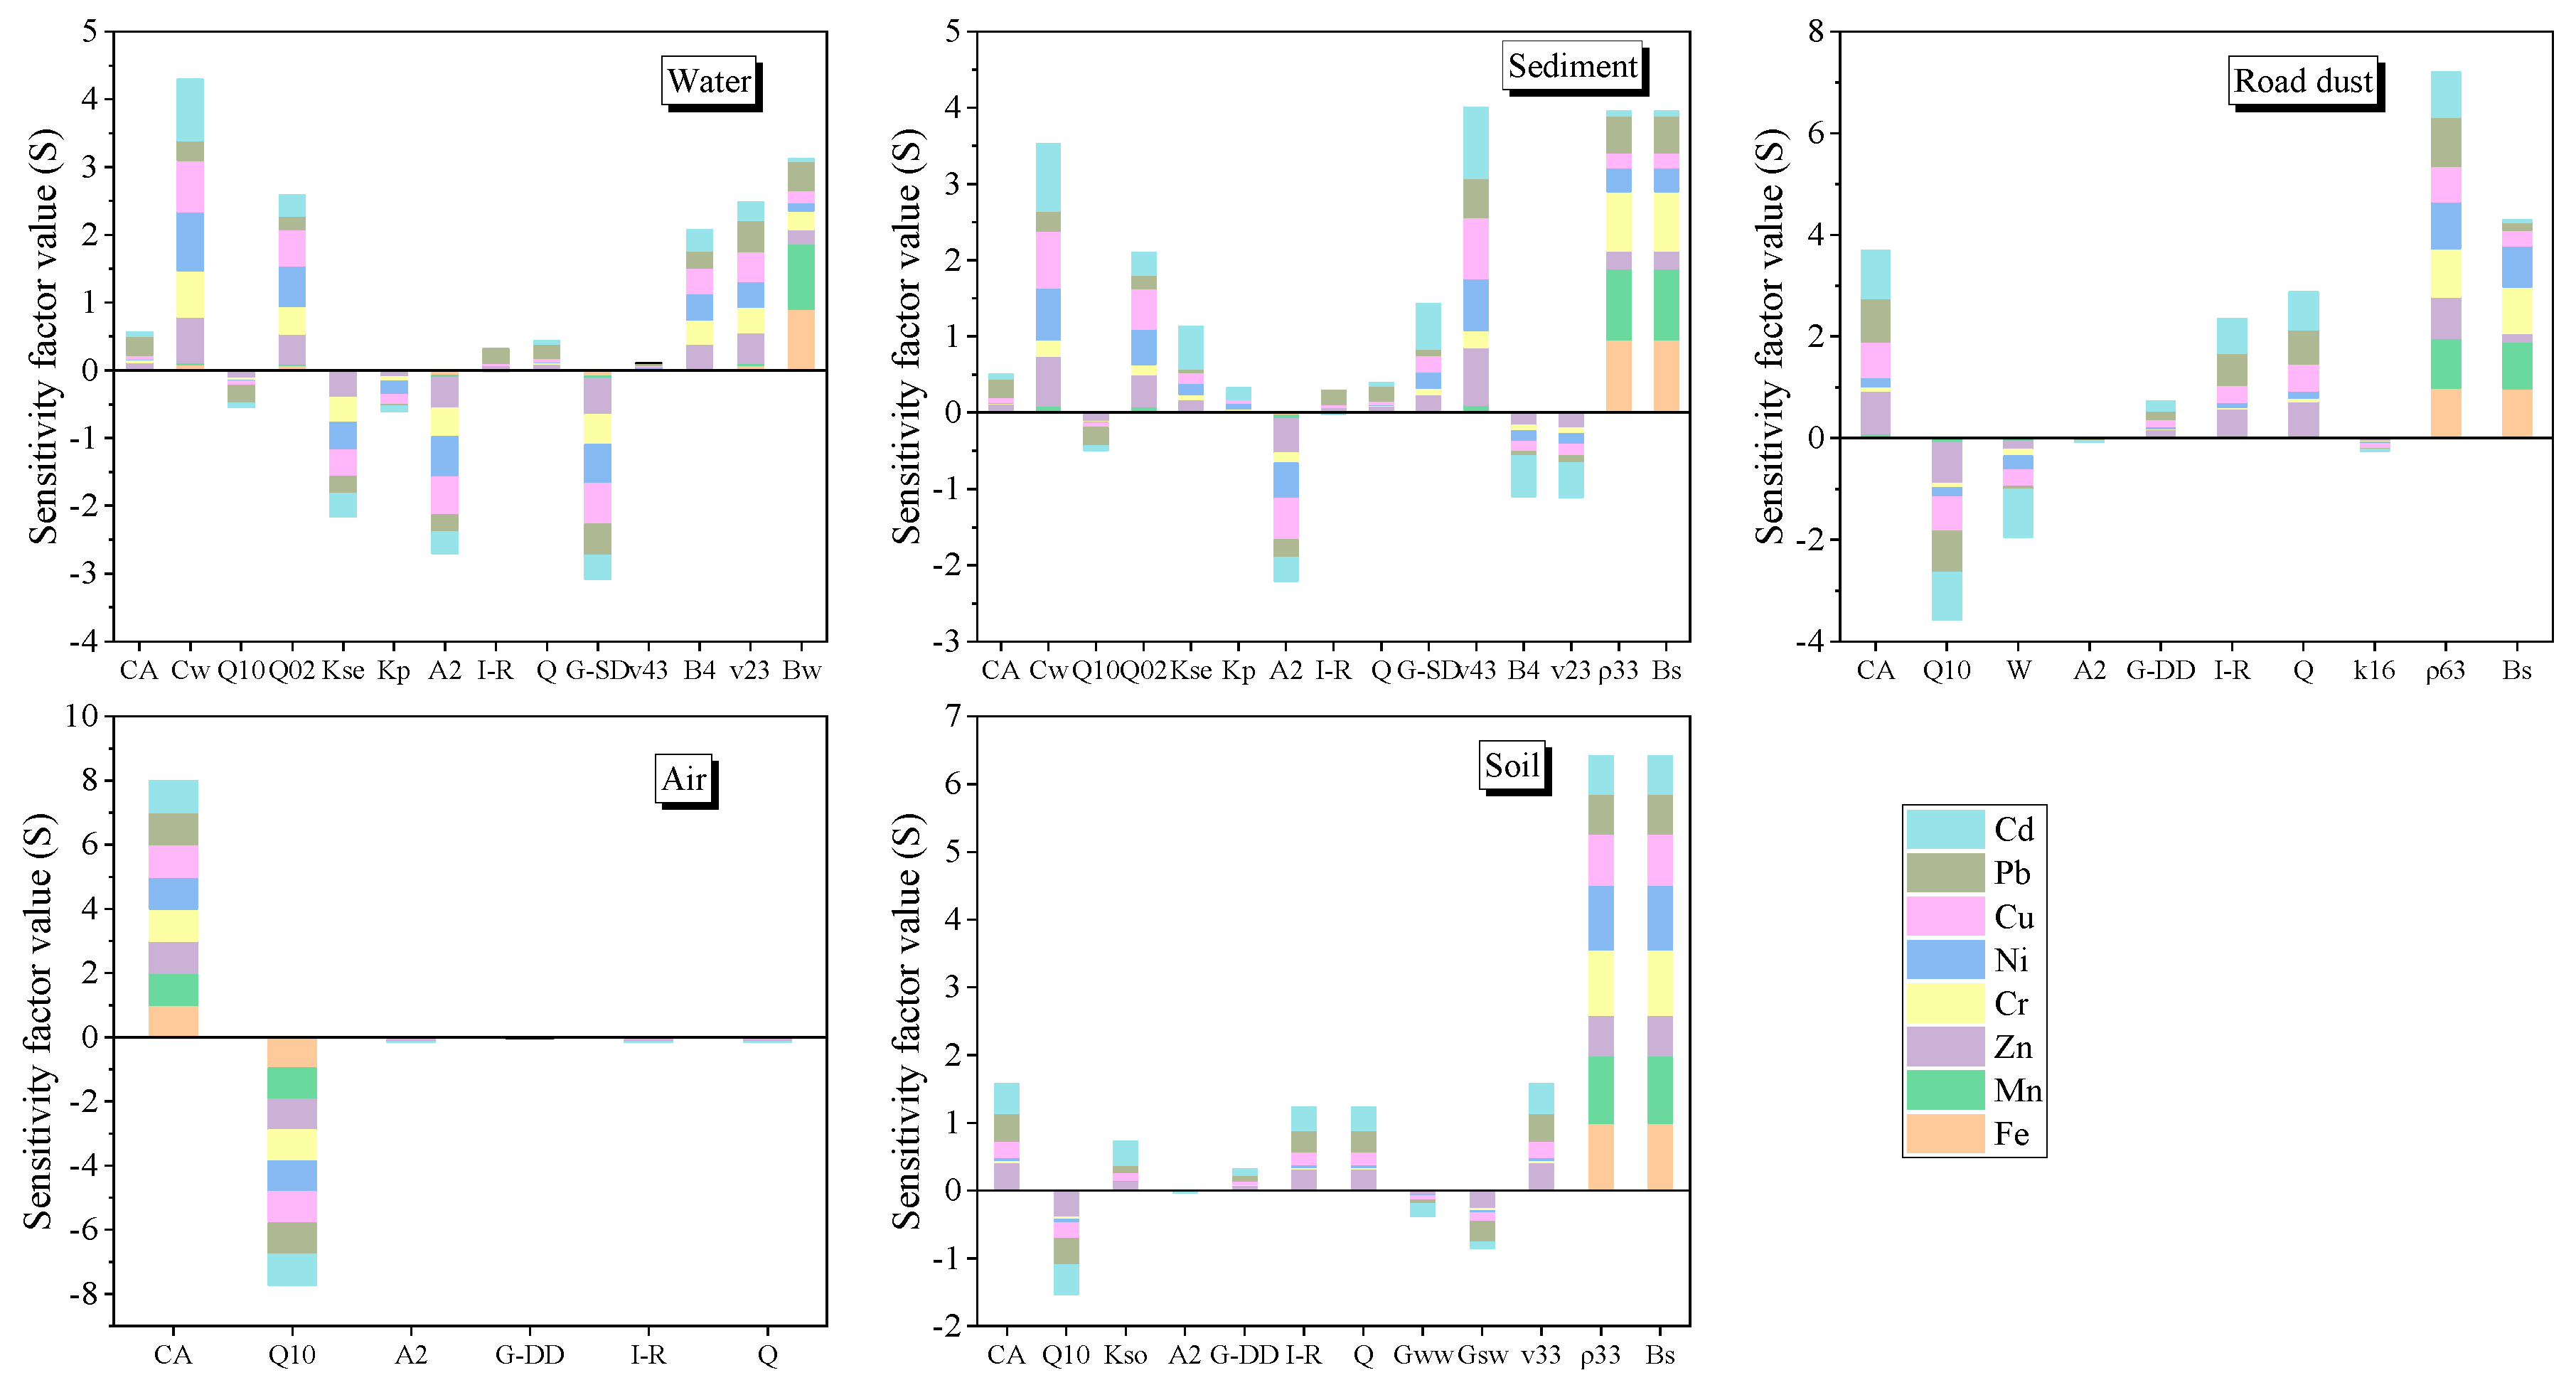
The sensitivity of 25 heavy metal parameters was identified. As shown in Figure 5, compared with the other environmental media, the number of highly sensitive parameters for the heavy metal concentrations in the air phase is much lower. Only the atmospheric background concentration (CA) and advection output rate (Q10) significantly affect the heavy metal concentration in the gas phase. The water and sediment phases both have almost the same parameter sensitivity except the density and background value. Interestingly, there are several common parameters that have opposite effects on both phases. They include the partition coefficients between sediment and water (Kse) and between suspended particles and water (Kp), sediment deposition rate (G_SD), molecular diffusion coefficient in sediment pore water (B4), and volume fraction of solids in water (v23). This may occur due to the dynamic equilibrium of heavy metals between the aqueous phase and sediment. For road dust and soil, the response of the heavy metal concentration to the partition coefficients (Kso) is still positive, but for the parameters related to wash off and erosion (W and GSW), the response is negative. Iron and manganese are less sensitive to most parameters compared to the other elements. However, this is the opposite for the background value and density. This may occur because the soil background values of Fe and Mn in the model were much higher than the concentration changes caused by transfer and transformation.
4. Discussion
4.1. Distribution and Migration of Heavy Metals among Multimedia in Urban Environment
Although soil and sediment are the main repositories of heavy metals in the urban environment, the total amount of heavy metals in urban street dust cannot be ignored, with a mass fraction ranging from 3.2% to 44.9%. However, many studies on multi-media models have done little to study this increasingly important environmental phase [23,36]. Even when studied, most researchers have focused on organic film attached to impervious road surfaces, including polychlorinated biphenyls (PCBs) [70] and polycyclic aromatic hydrocarbons (PAHs) [35], with little research on heavy metals. As for toxic heavy metal-lead, its mass load of street dust is almost half that of sediment, probably due to its extensive sources including automobile exhaust, brake pad wear, tire wear, paint, and mining emissions [71,72,73]. Moreover, lead was accumulated more than cadmium, copper, and zinc. This was consistent with the research results in Xi’an, China [74]. Unfortunately, this study only considered the influence of weather on the composition of road dust, including atmospheric deposition and precipitation scour, and did not calculate statistics on the heavy metal emissions from road dust, which will be carried out in the following studies. Nevertheless, the smallest accumulation of heavy metals in road dust is on the order of magnitude of one million tons. This can be attributed to the fact that the composition of heavy metals in road dust is influenced by both internal and external adsorption [13].
Although iron itself is not toxic, it and manganese (Mn), two of the abundant metals in the Earth’s crust, are the major blackening ingredients in malodorous black rivers. Table 3 shows that the abundance of Fe, Mn, and other trace metals in five environmental phases was similar to that in the Earth’s crust and soil background. Studies have shown that iron and manganese in river water are mainly derived from major clay minerals in sediment, including nontronite, saponite, and pennantite [21]. This was validated by the large transfer flux of iron and manganese between sediment and water (Figure 4a), which can be regulated by microorganisms [75]. Moreover, the exchange rates between sediment and water will increase with organic pollution of urban river [76]. As a result, it can be inferred that heavy metal, especially Fe and Mn, transfer between sediment and water in black and odorous water bodies will be more frequent. This will be beneficial to our further study of heavy metals in black and odorous water.
4.2. Effects of Heavy Metals in Multimedia on Urban Water Quality
The contributions calculated by the ratio of the fluxes from one medium compared to the total input fluxes quantify the sources of those metal pollutants associated with water quality impairment. The results indicate that despite the differences, endogenous sediment had the largest impact on urban water bodies (19.7–89.9% shown in Table 4). This may be affected by hydrodynamic conditions and bioturbation/bioirrigation [77,78]. This is the reason many studies have focused on the immobilization of heavy metals in sediment [79,80,81,82]. Research has shown that hydraulic mulches exhibit the highest release potential for heavy metals (4–70% of the total concentration), while netting/blanketing has the lowest release potential, particularly for Pb (0–8%) [83]. Furthermore, the main migration routes of the different metals from the sediment to the overlying water are also different. Among them, the surprising finding is that the main migration pathway for Fe and Mn is sediment resuspension. In particular, the iron proportion is as high as 17.3%. This also explains why iron and manganese are more likely to adhere to suspended particles and cause water to turn black. For the other metallic elements, such as Ni, Cu, Zn, and Cd, it has been suggested that resuspension events could cause water quality deterioration over time in both anoxic and oxic sediments [84]; notwithstanding, the main release behavior of these metal elements is diffusion. This is likely due to a combination of the fact that iron occurs at much higher concentrations than the other metals and that iron is transformed to its reduced (soluble) form at a much lower redox potential. Consequently, reductive dissolution is less effective at transforming particulate iron [85], followed by manganese and lead. The reason is that their dissolution conditions (low pH and oxidation–reduction potential (ORP)) are difficult to achieve in a natural neutral water environment.
Atmospheric deposition did not contribute as much as sediment (1.57–10.78%), but it is still important for urban waters. This conclusion is also applicable to oligotrophic open oceans and alpine lakes [86,87,88]. Compared with wet deposition, the contribution of atmospheric dry deposition is smaller for the eight heavy metals studied, with the proportion ranging from 0.47% to 3.22%. This proportion is similar to that in Lake Tahoe, where dry deposition contributed 0.03–5.7% of heavy metals [88]. This indicates that deposition in Nanjing is dominated by wet deposition instead of dry deposition. Wet deposition of heavy metals is more susceptible to regional climate characteristics, especially precipitation patterns. The eastern coastal areas of China, such as the Pearl River Delta Region [89], are affected by monsoons and experience abundant rainfall, leading to an increase in wet deposition, while dry deposition of heavy metals tends to predominate in arid and semiarid areas inland [90]. In addition, the deposition flux of wet particles is much higher than that of dry particles, which also indicates that, although wet particle deposition has a larger influence on polluting the urban receiving water, it also has a larger positive effect on the removal of atmospheric particles. Regrettably, this model does not consider the difference between the dry and wet deposition fluxes of the different metal elements, which are often affected by more complex factors, such as the water solubility of metallic elements [91]. Therefore, parameters need to be added to further optimize it.
Compared with the contributions (18–50%) in some U.S. cities [85,92,93], the impact of urban nonpoint source pollution, including road dust and soil, is relatively similar. Nevertheless, for the eight heavy metals, which are commonly found in urban storm runoff [94,95], the proportion of heavy metals carried by road runoff exceeds that of point source tailwater discharge mainly from 82 industrial enterprises among the 13 districts and counties of Nanjing. Despite the fact that metal element concentrations in runoff can vary with the time, location, and intensity of rainfall [96], this result was in line with that of the greater Los Angeles region (CA, USA), where the annual cumulative loading of total copper, lead, and zinc from three watersheds (the Los Angeles River, Ballona Creek, and Dominguez Channel) far exceeded the pollutant discharge amount from industrial point sources such as power-generating stations and oil refineries [97]. As mentioned in the literature, unlike industrial point source pollution, which has fixed treatment sites and mature treatment technologies, the control and mitigation measures of urban nonpoint source pollution are generally still in the research stage [98,99,100] and are relatively lacking in practical applications. Therefore, urban road runoff should be given sufficient attention for management.
5. Conclusions
A multimedia aquivalence model coupled with road dust on impervious surfaces was applied to assess the fate and transport of Fe, Mn, Zn, Cr, Ni, Cu, Pb, and Cd in a developed industrial city of China. The results indicate that the model can simulate the observed concentrations well, with an average logarithmic residual smaller than 3. Iron was the most abundant heavy metal in five environmental compartments. In the simulated heavy metal cycle, the transfer fluxes between bottom sediment and water were the highest. Thereinto, the contribution of sediment resuspension for Fe and Mn was significantly higher than that to the other metal elements, which could partly explain why Fe and Mn are the major blackening ingredients in malodorous black rivers. Road dust was also an important migration destination for heavy metals, accounting for 3–45%, although soil and sediment were the main repositories of heavy metals in the urban environment. The impact of road dust on surface water should not be neglected, with its contribution reaching 4–31%. The wash-off rate constant W for the road dust–water process was proved to be consistent with that for film–water and was independent of the type of heavy metals. This study not only lays a foundation for the follow-up study on the migration and transformation of heavy metals in black and odorous water, but also couples road dust into the multi-media model properly, revealing its potential impact on urban water bodies, which is conducive to the sustainable development of urban water environment.
Supplementary Materials
The following are available online at https://www.mdpi.com/2073-4441/12/6/1580/s1, Table S1: The descriptive statistics of observed concentration of metals in multimedia in Nanjing, Table S2: Discharge of heavy metal pollutants, Table S3: Summary of partition coefficients used in the model; MATLAB Live Script.
Author Contributions
Conceptualization, X.C. and Y.L.; methodology, X.C.; software, X.C.; validation, X.C. and Y.L.; formal analysis, X.C. and Y.L.; investigation, Y.L.; resources, Y.L.; data curation, Y.L.; writing—original draft preparation, X.C.; writing—review and editing, Y.L.; visualization, X.C.; supervision, Y.L.; project administration, Y.L.; and funding acquisition, Y.L. All authors have read and agreed to the published version of the manuscript.
Funding
This research was funded by the State Key Program of National Natural Science of China, grant number 41530635, and the Innovative Research Group of the National Natural Science Foundation of China, grant number 51721093.
Acknowledgments
The authors are thankful for the support provided by the Fund for National Key Research and Development Program (2016YFA0602304), the State Key Program of National Natural Science of China (Grant number 41530635), and the Innovative Research Group of the National Natural Science Foundation of China (Grant number 51721093), and the Interdisciplinary Research Funds of Beijing Normal University.
Conflicts of Interest
The authors declare no conflict of interest.
References
- Angelidis, M.O.; Markantonatos, P.G.; Bacalis, N.C. Impact of human activities on the quality of river water: The case of Evrotas River catchment basin, Greece. Environ. Monit. Assess. 1995, 35, 137–153. [Google Scholar] [CrossRef]
- Sabin, L.D.; Lim, J.H.; Stolzenbach, K.D.; Schiff, K.C. Contribution of trace metals from atmospheric deposition to stormwater runoff in a small impervious urban catchment. Water Res. 2005, 39, 3929–3937. [Google Scholar] [CrossRef] [PubMed]
- Castro, M.S.; Driscoll, C.T. Atmospheric nitrogen deposition to estuaries in the mid–Atlantic and northeastern United States. Environ. Sci. Technol. 2002, 36, 3242–3249. [Google Scholar] [CrossRef] [PubMed]
- Palani, S. Estimation of the Contribution of Atmospheric Deposition to Coastal Water Eutrophication. Ph.D Thesis, National University of Singapore, Singapore, July 2009. [Google Scholar]
- Sthiannopkao, S.; Takizawa, S.; Wirojanagud, W. Effects of soil erosion on water quality and water uses in the upper Phong watershed. Water Sci. Technol. 2006, 53, 45–52. [Google Scholar] [CrossRef] [PubMed]
- Soms, J. Modelling Soil Erosion and Associated Sediment Yield for Small Headwater Catchments of the Daugava Spillway Valley, Latvia. In Proceedings of the EGU General Assembly Conference, Vienna, Austria, 12–17 April 2015. [Google Scholar]
- Guan, Y.; Sui, M.; Qiu, C.; Hu, J.L.; Jihong, H. Analysis on the Characteristics of Dissolved Organic Matter in Receiving River Water in Wastewater Treatment Plant. In Proceedings of the IOP Conference Series, Earth and Environmental Science, Xi’an, China, July 2019; p. 042119. [Google Scholar]
- Lu, W.; Wu, J.; Li, Z. Water quality assessment of an urban river receiving tail water using the single-factor index and principle component analysis. Water. Sci. Tech. Water Supply 2018, 7. [Google Scholar] [CrossRef]
- Lei, Z. Analysis on pollution factors of urban river. GEP 2015, 3, 9–16. [Google Scholar] [CrossRef]
- Liu, Z.; Wang, Y.; Li, Z.; Jian, P. Impervious surface impact on water quality in the process of rapid urbanization in Shenzhen, China. Environ. Earth Sci. 2012, 68, 2365–2373. [Google Scholar] [CrossRef]
- Kim, H.; Jeong, H.; Jeon, J.; Bae, S. The impact of impervious surface on water quality and its threshold in Korea. Water 2016, 8, 111. [Google Scholar] [CrossRef] [Green Version]
- Luo, Y.; Zhao, Y.; Yang, K.; Chen, K.; Pan, M.; Zhou, X. Dianchi Lake watershed impervious surface area dynamics and their impact on lake water quality from 1988 to 2017. Environ. Sci. Pollut. Res. 2018, 25, 29643–29653. [Google Scholar] [CrossRef]
- Jayarathne, A.; Egodawatta, P.; Ayoko, G.A.; Goonetilleke, A. Intrinsic and extrinsic factors which influence metal adsorption to road dust. Sci. Total Environ. 2018, 618, 236–242. [Google Scholar] [CrossRef]
- Kuo, N.-W.; Chen, Y.-T.; Lee, T.-Y.; Jien, S.-H.; Hong, N.-M. Contribution of urban runoff in Taipei metropolitan area to dissolved inorganic nitrogen export in the Danshui River, Taiwan. Environ. Sci. Pollut. Res. 2017, 24, 578–590. [Google Scholar] [CrossRef] [PubMed]
- Lee, M.-H.; Lee, Y.K.; Derrien, M.; Choi, K.; Shin, K.H.; Jang, K.-S.; Hur, J. Evaluating the contributions of different organic matter sources to urban river water during a storm event via optical indices and molecular composition. Water Res. 2019, 165, 115006. [Google Scholar] [CrossRef] [PubMed]
- Xu, J.; Chao, X.; Zhou, Z.; Huang, T. Impact Of Contaminated Sediment on the Water Quality of Typical Reservoirs; Water Pollution and Water Quality Control of Selected Chinese Reservoir Basins; Springer International Publishing: Cham, Switzerland, 2016; pp. 229–262. [Google Scholar]
- Germinario, L.; Siegesmund, S.; Maritan, L.; Simon, K.; Mazzoli, C. Trachyte weathering in the urban built environment related to air quality. Herit. Sci. 2017, 5, 44. [Google Scholar] [CrossRef]
- Ermakov, V.V.; Korobova, E.M.; Degtyarev, A.P.; Tyutikov, S.F.; Karpova, E.A.; Petrunina, N.S. Impact of natural and man-made factors on migration of heavy metals in the Ardon River basin (North Ossetia). J. Soils Sediment. 2016, 16, 1253–1266. [Google Scholar] [CrossRef]
- Shruti, V.C.; Jonathan, M.P.; Rodriguez-Espinosa, P.F.; Nagarajan, R.; Escobedo-Urias, D.C.; Morales-Garcia, S.S.; Martinez-Tavera, E. Geochemical characteristics of stream sediments from an urban-volcanic zone, Central Mexico: Natural and man-made inputs. Chem. Erde-Geochem. 2017, 77, 303–321. [Google Scholar] [CrossRef]
- Theodosi, C.; Stavrakakis, S.; Koulaki, F.; Stavrakaki, I.; Moncheva, S.; Papathanasiou, E.; Sanchez-Vidal, A.; Koçak, M.; Mihalopoulos, N. The significance of atmospheric inputs of major and trace metals to the Black Sea. J. Mar. Syst. 2013, 109–110, 94–102. [Google Scholar] [CrossRef]
- Liang, Z.; Siegert, M.; Fang, W.; Sun, Y.; Jiang, F.; Lu, H.; Chen, G.; Wang, S. Blackening and odorization of urban rivers: A Bio-geochemical process. FEMS Microbiol. Ecol. 2018, 94, (fix180). [Google Scholar] [CrossRef] [Green Version]
- Ibe, F.C.; Opara, A.I.; Ibe, B.O.; Amaobi, C.E. Application of assessment models for pollution and health risk from effluent discharge into a tropical stream: Case study of Inyishi River, Southeastern Nigeria. Environ. Monit. Assess. 2019, 753, 3–15. [Google Scholar] [CrossRef]
- Kondo, A.; Yamamoto, M.; Inoue, Y.; Ariyadasa, B.H.A.K. Evaluation of lead concentration by one-box type multimedia model in Lake Biwa-Yodo River basin of Japan. Chemosphere 2013, 92, 497–503. [Google Scholar] [CrossRef]
- Sommerfreund, J.K.; Gandhi, N.; Diamond, M.L.; Mugnai, C.; Frignani, M.; Capodaglio, G.; Gerino, M.; Bellucci, L.G.; Giuliani, S. Contaminant fate and transport in the Venice Lagoon: Results from a multi-segment multimedia model. Ecotox. Environ. Safe 2010, 73, 222–230. [Google Scholar] [CrossRef]
- Hu, Y.; Wang, D.; Li, Y. Environmental behaviors and potential ecological risks of heavy metals (Cd, Cr, Cu, Pb, and Zn) in multimedia in an oilfield in China. Environ. Sci. Pollut. Res. 2016, 23, 13964–13972. [Google Scholar] [CrossRef] [PubMed]
- Hollander, A.; Schoorl, M.; van de Meent, D. SimpleBox 4.0: Improving the model while keeping it simple. Chemosphere 2016, 148, 99–107. [Google Scholar] [CrossRef]
- Wegener Sleeswijk, A.; Heijungs, R. GLOBOX: A spatially differentiated global fate, intake and effect model for toxicity assessment in LCA. Sci. Total Environ. 2010, 408, 2817–2832. [Google Scholar] [CrossRef]
- Queguiner, S.; Ciffroy, P.; Roustan, Y.; Musson-Genon, L. Multimedia Modelling of the Exposure to Cadmium and Lead Released in the Atmosphere—Application to Industrial Releases in a Mediterranean Region and Uncertainty/Sensitivity Analysis. Water Air Soil Pollut. 2009, 198, 199–217. [Google Scholar] [CrossRef]
- Mackay, D.; Diamond, M. Application of the QWASI (Quantitative Water Air Sediment Interaction) fugacity model to the dynamics of organic and inorganic chemicals in lakes. Chemosphere 1989, 18, 1343–1365. [Google Scholar] [CrossRef]
- Khpalwak, W.; Jadoon, W.A.; Abdel-dayem, S.M.; Sakugawa, H. Polycyclic aromatic hydrocarbons in urban road dust, Afghanistan: Implications for human health. Chemosphere 2019, 218, 517–526. [Google Scholar] [CrossRef]
- Chen, H.; Jing, L.; Teng, Y. Multimedia fate modeling and risk assessment of antibiotics in a water-scarce megacity. J. Hazard. Mater. 2018, 348, 75–83. [Google Scholar] [CrossRef]
- Kim, J.; Powell, D.E.; Hughes, L.; Mackay, D. Uncertainty analysis using a fugacity-based multimedia mass-balance model: Application of the updated EQC model to decamethylcyclopentasiloxane (D5). Chemosphere 2013, 93, 819–829. [Google Scholar] [CrossRef] [PubMed]
- Li, Q.; Kim, M.; Liu, Y. Quantitative assessment of human health risks induced by vehicle exhaust polycyclic aromatic hydrocarbons at Zhengzhou via multimedia fugacity models with cancer risk assessment. Sci. Total Environ. 2018, 618, 430–438. [Google Scholar] [CrossRef] [PubMed]
- Mackay, D.; Paterson, S. Evaluating the multimedia fate of organic chemicals: A level III fugacity model. Environ. Sci. Technol. 1991, 25, 427–436. [Google Scholar] [CrossRef]
- Huang, Y.; Sun, X.; Liu, M.; Zhu, J.; Yang, J.; Du, W.; Zhang, X.; Gao, D.; Qadeer, A.; Xie, Y.; et al. A multimedia fugacity model to estimate the fate and transport of polycyclic aromatic hydrocarbons (PAHs) in a largely urbanized area, Shanghai, China. Chemosphere 2019, 217, 298–307. [Google Scholar] [CrossRef] [PubMed]
- Jeon, W.; Shin, C.B.; Kim, J.H.; Kwak, B.K.; Yi, J.; Lee, J.H.; Lee, W.G.; Lee, S.W.; Park, H.S. Analysis of the distribution of lead concentration under steady state conditions in urban multimedia environment. Korean J. Chem. Eng. 2008, 25, 1401–1406. [Google Scholar] [CrossRef]
- Priemer, D.A.; Diamond, M.L. Application of the multimedia urban model to compare the fate of SOCs in an urban and forested watershed. Environ. Sci. Technol. 2002, 1004–1013. [Google Scholar] [CrossRef] [PubMed]
- Diamond, M.L.; Priemer, D.A.; Law, N.L. Developing a multimedia model of chemical dynamics in an urban area. Chemosphere 2001, 44, 1655–1667. [Google Scholar] [CrossRef]
- Zhao, H.; Li, X.; Wang, X. Heavy metal contents of road-deposited sediment along the urban-rural gradient around Beijing and its potential contribution to runoff pollution. Environ. Sci. Technol. 2011, 7120–7127. [Google Scholar] [CrossRef]
- Zhao, H.; Zhao, J.; Yin, C.; Li, X. Index models to evaluate the potential metal pollution contribution from washoff of road-deposited sediment. Water Res. 2014, 59, 71–79. [Google Scholar] [CrossRef]
- Kong, S.F.; Li, L.; Li, X.X.; Yin, Y.; Chen, K.; Liu, D.T.; Yuan, L.; Zhang, Y.J.; Shan, Y.P.; Ji, Y.Q. The impacts of firework burning at the Chinese Spring Festival on air quality: Insights of tracers, source evolution and aging processes. Atmos. Chem. Phys. 2015, 2167–2184. [Google Scholar] [CrossRef] [Green Version]
- Li, H.; Wang, Q.g.; Yang, M.; Li, F.; Wang, J.; Sun, Y.; Wang, C.; Wu, H.; Qian, X. Chemical characterization and source apportionment of PM2.5 aerosols in a megacity of Southeast China. Atmos. Res. 2016, 181, 288–299. [Google Scholar] [CrossRef]
- Ming, L.; Jin, L.; Li, J.; Fu, P.; Yang, W.; Liu, D.; Zhang, G.; Wang, Z.; Li, X. PM2.5 in the Yangtze River Delta, China: Chemical compositions, seasonal variations, and regional pollution events. Environ. Pollut. 2017, 223, 200–212. [Google Scholar] [CrossRef]
- Zheng, H.; Kong, S.; Yan, Q.; Wu, F.; Cheng, Y.; Zheng, S.; Wu, J.; Yang, G.; Zheng, M.; Tang, L.; et al. The impacts of pollution control measures on PM2.5 reduction: Insights of chemical composition, source variation and health risk. Atmos. Environ. 2019, 197, 103–117. [Google Scholar] [CrossRef]
- Wu, B.; Zhao, D.Y.; Jia, H.Y.; Zhang, Y.; Zhang, X.X.; Cheng, S.P. Preliminary risk assessment of trace metal pollution in surface water from Yangtze River in Nanjing Section, China. Bull. Environ. Contam. Toxicol. 2009, 405–409. [Google Scholar] [CrossRef] [PubMed]
- Cai, W.; Li, Y.; Wang, P.; Niu, L.; Zhang, W.; Wang, C. Revealing the relationship between microbial community structure in natural biofilms and the pollution level in urban rivers: A case study in the Qinhuai River basin, Yangtze River Delta. Water Sci. Technol. 2016, 1163–1176. [Google Scholar] [CrossRef] [PubMed] [Green Version]
- Huang, B.; Shi, X.; Yu, D.; Öborn, I.; Blombäck, K.; Pagella, T.F.; Wang, H.; Sun, W.; Sinclair, F.L. Environmental assessment of small-scale vegetable farming systems in peri-urban areas of the Yangtze River Delta Region, China. Agric. Ecosyst. Environ. 2006, 391–402. [Google Scholar] [CrossRef]
- Ma, H.; Hua, L.; Ji, J. Speciation and phytoavailability of heavy metals in sediments in Nanjing section of Changjiang River. Environ. Earth Sci. 2011, 185–192. [Google Scholar] [CrossRef]
- Song, Y.; Ji, J.; Yang, Z.; Yuan, X.; Mao, C.; Frost, R.; Ayoko, G. Geochemical behavior assessment and apportionment of heavy metal contaminants in the bottom sediments of lower reach of Changjiang River. CATENA 2011, 73–81. [Google Scholar] [CrossRef]
- Shen, Y.; Chen, Q.; Zhang, K.; Fang, Y. Risk Assessment of Heavy Metal Pollution by Three Plants at Zihu River in Nanjing, China. Energy Eng. Environ. Eng 2014, 403–408. [Google Scholar] [CrossRef]
- Yuan, X.; Zhang, L.; Li, J.; Wang, C.; Ji, J. Sediment properties and heavy metal pollution assessment in the river, estuary and lake environments of a fluvial plain, China. CATENA 2014, 52–60. [Google Scholar] [CrossRef]
- Zhang, L.; Zhang, Z.; Chen, Y.; Fu, Y. Sediment characteristics, floods, and heavy metal pollution recorded in an overbank core from the lower reaches of the Yangtze River. Environ. Earth Sci. 2015, 7451–7465. [Google Scholar] [CrossRef]
- Wang, H.; Wu, Q.; Hu, W.; Huang, B.; Dong, L.; Liu, G. Using multi-medium factors analysis to assess heavy metal health risks along the Yangtze River in Nanjing, Southeast China. Environ. Pollut. 2018, 1047–1056. [Google Scholar] [CrossRef]
- Hua, L.; Ma, H.; Ji, J. Concentration and distribution characteristic of main toxic metals in suspended particle material in Nanjing reach, Changjiang River. Environ. Monit. Assess. 2011, 361–370. [Google Scholar] [CrossRef]
- Yuan, X.; Li, J.; Li, Y.; Xiao, J. Comparative Researches on Major and Trace Elements of Suspended Particulate from Typical Sources in Nanjing Section, Yangtze River. In Proceedings of the Conference On Environmental Pollution And Public Health, Wuhan, China, 10–11 September 2010; Volumes 1–2, pp. 1294–1298. [Google Scholar]
- Lu, Y.; Gong, Z.; Zhang, G.; Burghardt, W. Concentrations and chemical speciations of Cu, Zn, Pb and Cr of urban soils in Nanjing, China. Geoderma 2003, 101–111. [Google Scholar] [CrossRef]
- Yin, Y.L.; Song, J.; Luo, Y.M.; Zhang, T.L.; He, J.F.; Xu, J.H. Assessment on variation of heavy metals in the greenbelt soils alongside urban-rural roadways in Nanjing City. Acta Ped. Sin. 2005, 20, 206–210. (In Chinese) [Google Scholar]
- Lu, D. Study on Heavy Metals Pollution of the Roadside Plant-Soil System in Nanjing; Nanjing Agricultural University: Nanjing, China, 2006. (In Chinese) [Google Scholar]
- Wang, X. The Character and Distribution of the Greenbelt Soil of Nanjing; Nanjing Forestry University: Nanjing, China, 2006. (In Chinese) [Google Scholar]
- Han, L.; Zhuang, G.; Cheng, S.; Wang, Y.; Li, J. Characteristics of re-suspended road dust and its impact on the atmospheric environment in Beijing. Atmos. Environ. 2007, 41, 7485–7499. [Google Scholar] [CrossRef]
- Ontario Ministry of the Environment (OME). Metropolitan Toronto Waterfront Wet Weather Outfall Study–Phase I; Queen’s Printer: Toronto, ON, Canada, 1995. [Google Scholar]
- Mackay, D. Multimedia Environmental Models: The Fugacity Approach; Lewis Publishers: Boca Raton, FL, USA, 2001. [Google Scholar]
- Paterson, S.; Mackay, D. Interpreting Chemical Partitioning in Soil-Plant-Air Systems with a Fugacity Model Plant Contamination, Modelling and Simulation of Organic Chemical Processes; Trapp, S., Mc Farlane, J.C., Eds.; Lewis Publishers: Boca Raton, FL, USA, 1995. [Google Scholar]
- Fang, L.J.; Liu, M.; Li, X.Y.; Gao, H. Simulating the transfer and fate of DDTs in Nanjing. China Environ. Sci. 2011, 31, 307–315. (In Chinese) [Google Scholar]
- Zhang, L.C. Study on Chemical Elements in Water Environment; China Environmental Science Press: Beijing, China, 1996. (In Chinese) [Google Scholar]
- China National Environmental Monitoring Centre (CNEMC). Background Values of Chinese Soil Elements; China Environmental Science Press: Beijing, China, 1990. (In Chinese) [Google Scholar]
- Taylor, S.R. Abundance of chemical elements in the continental crust: A new table. Geochim. Cosmochim. Acta 1964, 28, 1273–1285. [Google Scholar] [CrossRef]
- Wang, D.Z. Multimedia Environmental Ecological Risk Assessment of Heavy Metals in a Typical Oilfield. Master’s Thesis, North China Electric Power University, Beijing, China, March 2014. (In Chinese). [Google Scholar]
- Gao, J.M.; Zhang, K.; Zhou, B.; Jin, F.; Guo, J.S.; Ouyang, W.C.; Zhao, C. Simulation of multi-media transfer and fate of TBT in the aquatic environment of the Three Gorges Reservoir. Acta Sci. Circe. 2015, 1350–1357. (In Chinese) [Google Scholar]
- Csiszar, S.A.; Diamond, M.L.; Thibodeaux, L.J. Modeling urban films using a dynamic multimedia fugacity model. Chemosphere 2012, 87, 1024–1031. [Google Scholar] [CrossRef]
- Das, A.; Krishna, K.V.S.S.; Kumar, R. Lead isotopic ratios in source apportionment of heavy metals in the street dust of Kolkata, India. Int. J. Environ. Sci. Technol. 2018, 159–172. [Google Scholar] [CrossRef]
- Gabarrón, M.; Faz, A.; Acosta, J.A. Use of multivariable and redundancy analysis to assess the behavior of metals and arsenic in urban soil and road dust affected by metallic mining as a base for risk assessment. J. Environ. Manag. 2018, 206, 192–201. [Google Scholar] [CrossRef]
- Anagnostopoulou, M.A.; Day, J.P. Lead concentrations and isotope ratios in street dust in major cities in Greece in relation to the use of lead in petrol. Sci. Total Environ. 2006, 367, 791–799. [Google Scholar] [CrossRef]
- Shi, D.; Lu, X. Accumulation degree and source apportionment of trace metals in smaller than 63 μm road dust from the areas with different land uses: A case study of Xi’an, China. Sci. Total Environ. 2018, 636, 1211–1218. [Google Scholar] [CrossRef] [PubMed]
- Zhang, W.; Lei, M.; Li, Y.; Wang, P.; Wang, C.; Gao, Y.; Wu, H.; Xu, C.; Niu, L.; Wang, L.; et al. Determination of vertical and horizontal assemblage drivers of bacterial community in a heavily polluted urban river. Water Res. 2019, 161, 98–107. [Google Scholar] [CrossRef]
- Odigiea, K.O.; Cohenb, A.S.; Swarzenskic, P.W.; Flegala, A.R. Using lead isotopes and trace element records from two contrasting Lake Tanganyika sediment cores to assess watershed—Lake exchange. Appl. Geochem. 2014, 184–190. [Google Scholar] [CrossRef] [Green Version]
- He, Y.; Men, B.; Yang, X.; Li, Y.; Xu, H.; Wang, D. Investigation of heavy metals release from sediment with bioturbation/bioirrigation. Chemosphere 2017, 184, 235–243. [Google Scholar] [CrossRef]
- Shi, X.; Zhang, W. Experimental Study on Release of Heavy Metals in Sediment Under Hydrodynamic Conditions. In Proceeding of International Conference on Air Pollution and Environmental Engineering (APEE 2018), Hong Kong, China, 26–28 October 2018. [Google Scholar]
- Ndiba, P.; Axe, L.; Boonfueng, T. Heavy metal immobilization through phosphate and thermal treatment of dredged sediments. Environ. Sci. Technol. 2008, 42, 920–926. [Google Scholar] [CrossRef] [PubMed]
- Zhang, Z.; Li, M.; Chen, W.; Zhu, S.; Liu, N.; Zhu, L. Immobilization of lead and cadmium from aqueous solution and contaminated sediment using nano-hydroxyapatite. Environ. Pollut. 2010, 158, 514–519. [Google Scholar] [CrossRef]
- Li, X.; Dai, L.; Zhang, C.; Zeng, G.; Liu, Y.; Zhou, C.; Xu, W.; Wu, Y.; Tang, X.; Liu, W.; et al. Enhanced biological stabilization of heavy metals in sediment using immobilized sulfate reducing bacteria beads with inner cohesive nutrient. J. Hazard. Mater. 2017, 324, 340–347. [Google Scholar] [CrossRef] [Green Version]
- Xue, W.; Huang, D.; Zeng, G. Nanoscale zero-valent iron coated with rhamnolipid as an effective stabilizer for immobilization of Cd and Pb in river sediments. J. Hazard. Mater. 2018, 341, 381–389. [Google Scholar] [CrossRef]
- Youxian, W.; Li, Y.; Büyüksönmez, F. Evaluation of soil erosion and sediment control products for release of heavy metals. Environ. Eng. Sci. 2010, 27, 905–914. [Google Scholar] [CrossRef]
- Hwang, K.Y.; Kim, H.-S.; Hwang, I. Effect of resuspension on the release of heavy metals and water chemistry in anoxic and oxic sediments. CLEAN-Soil Air Water 2011, 39, 908–915. [Google Scholar] [CrossRef]
- Stein, E.D.; Ackerman, D. Dry weather water quality loadings in arid, urban watersheds of the Los Angeles Basin, California, USA. J. Am. Water Resour. Assoc. 2007, 43, 398–413. [Google Scholar] [CrossRef]
- Camarero, L.; Botev, I.; Muri, G.; Psenner, R.; Rose, N.; Stuchlik, E. Trace elements in alpine and arctic lake sediments as a record of diffuse atmospheric contamination across Europe. Freshwater Biol. 2009, 54, 2518–2532. [Google Scholar] [CrossRef]
- Powell, C.F.; Jickells, A.R.B.A.; Bange, H.W.; Chance, R.J.; Yodle, C. Estimation of the atmospheric flux of nutrients and trace metals to the eastern tropical North Atlantic ocean. J. Atmos. Sci. 2015, 72, 4029–4045. [Google Scholar] [CrossRef] [Green Version]
- Chien, C.-T.; Allen, B.; Dimova, N.T.; Yang, J.; Reuter, J.; Schladow, G.; Paytan, A. Evaluation of atmospheric dry deposition as a source of nutrients and trace metals to Lake Tahoe. Chem. Geol. 2019, 511, 178–189. [Google Scholar] [CrossRef]
- Ye, L.; Huang, M.; Zhong, B.; Wang, X.; Tu, Q.; Sun, H.; Wang, C.; Wu, L.; Chang, M. Wet and dry deposition fluxes of heavy metals in Pearl River Delta Region (China): Characteristics, ecological risk assessment, and source apportionment. J. Environ. Sci. 2018, 70, 106–123. [Google Scholar] [CrossRef]
- Pan, Y. Atmospheric wet and dry deposition of trace elements at 10 sites in Northern China. Atmos. Chem. Phys. 2015, 14, 951–972. [Google Scholar] [CrossRef] [Green Version]
- Morselli, L.; Olivieri, P.; Brusori, B.; Passarini, F. Soluble and insoluble fractions of heavy metals in wet and dry atmospheric depositions in Bologna, Italy. Environ. Pollut. 2003, 124, 457–469. [Google Scholar] [CrossRef]
- Van Metre, P.C.; Mahler, B.J. The contribution of particles washed from rooftops to contaminant loading to urban streams. Chemosphere 2003, 52, 1727–1741. [Google Scholar] [CrossRef]
- McPherson, T.N.T.L.; Burian, S.J.; Stenstrom, M.K.; Turin, H.J.; Brown, M.J.; Suffet, I.H. Trace metal pollutant load in urban runoff from a Southern California Watershed. J. Environ. Eng. ASCE 2005, 131, 1073–1080. [Google Scholar] [CrossRef]
- Joshi, U.M.; Balasubramanian, R. Characteristics and environmental mobility of trace elements in urban runoff. Chemosphere 2010, 80, 310–318. [Google Scholar] [CrossRef]
- Carling, G.T.; Tingey, D.G.; Fernandez, D.P.; Nelson, S.T.; Aanderud, Z.T.; Goodsell, T.H.; Chapman, T.R. Evaluating natural and anthropogenic trace element inputs along an alpine to urban gradient in the Provo River, Utah, USA. Appl. Geochem. 2015, 63, 398–412. [Google Scholar] [CrossRef] [Green Version]
- Tuccillo, M.E. Size fractionation of metals in runoff from residential and highway storm sewers. Sci. Total Environ. 2006, 355, 288–300. [Google Scholar] [CrossRef] [PubMed]
- Tiefenthaler, L.L.; Stein, E.D.; Schiff, K.C. Watershed and land use-based sources of trace metals in urban storm water. Environ. Toxicol. Chem. 2008, 27, 277–287. [Google Scholar] [CrossRef] [PubMed] [Green Version]
- Trenouth, W.R.; Gharabaghi, B. Soil amendments for heavy metals removal from stormwater runoff discharging to environmentally sensitive areas. J. Hydrol. 2015, 529, 1478–1487. [Google Scholar] [CrossRef]
- Kuoppamäki, K.; Hagner, M.; Valtanen, M.; Setälä, H. Using biochar to purify runoff in road verges of urbanised watersheds: A large-scale field lysimeter study. WEE 2019, 1, 15–25. [Google Scholar] [CrossRef]
- Negin, A.; Marc, T.; Stephanie, S.; Gregory, H.L.; David, L.S.; Richard, G.L. Evaluation of pilot-scale biochar-amended woodchip bioreactors to remove nitrate, metals, and trace organic contaminants from urban stormwater runoff. Water Res. 2019, 154, 1–11. [Google Scholar] [CrossRef]
Figure 1.
The conceptual fate and transport model of metals.

Figure 2.
The model domain and assessed study area.

Figure 3.
A comparison of the simulated and observed heavy metal concentrations in the compartments.
Figure 3.
A comparison of the simulated and observed heavy metal concentrations in the compartments.

Figure 4.
Transfer flux of the heavy metals exchanged between adjacent environmental media (a); and mass distribution of the heavy metals among the multiple media (b).
Figure 4.
Transfer flux of the heavy metals exchanged between adjacent environmental media (a); and mass distribution of the heavy metals among the multiple media (b).

Figure 5.
The sensitivity coefficients for the parameters.


Table 1.
Summary of the observed concentration of metals in multimedia in Nanjing.
| Metals | Fe * | Mn | Zn | Cr | Ni | Cu | Pb | Cd | Sources | |
|---|---|---|---|---|---|---|---|---|---|---|
| Atmosphere PM2.5 (ng/m3) | AM | 492.36 | 48.34 | 287.92 | 15.59 | 9.37 | 65.80 | 140.55 | 2.91 | [41,42,43,44] |
| N | 30 | 25 | 30 | 30 | 30 | 30 | 30 | 25 | ||
| Min | 0.36 | 1.30 | 1.30 | 1.30 | 1.30 | 1.30 | 1.00 | 0.22 | ||
| Max | 1100.00 | 115.00 | 824.00 | 39.80 | 25.20 | 176.00 | 427.00 | 7.86 | ||
| River water (μg/L) | AM | 67.25 | 6.17 | 43.15 | 5.94 | 14.43 | 20.01 | 22.00 | 0.83 | [45,46] |
| N | 43 | 3 | 43 | 43 | 3 | 43 | 43 | 43 | ||
| Min | 23.00 | 4.30 | 7.60 | 2.10 | 5.60 | 4.00 | 1.50 | 0.10 | ||
| Max | 350.50 | 8.80 | 92.00 | 24.30 | 24.30 | 41.00 | 734.00 | 6.40 | ||
| Sediment (mg/kg) | AM | 6.49 | 777.38 | 120.35 | 78.23 | 40.20 | 44.90 | 38.91 | 1.72 | [47,48,49,50,51,52,53] |
| N | 14 | 4 | 41 | 41 | 25 | 41 | 41 | 37 | ||
| Min | 2.11 | 301.00 | 0.24 | 0.01 | 6.40 | 0.25 | 0.35 | 0.03 | ||
| Max | 20.70 | 1552.00 | 1191.79 | 161.30 | 63.70 | 139.81 | 173.20 | 16.45 | ||
| SPM (mg/kg) | AM | 7.25 | 958.40 | 196.96 | 109.95 | 56.06 | 81.87 | 66.49 | 127.68 | [48,54,55] |
| N | 12 | 18 | 25 | 25 | 7 | 25 | 25 | 25 | ||
| Min | 5.69 | 512.00 | 91.90 | 79.70 | 50.20 | 38.10 | 27.90 | 0.57 | ||
| Max | 14.70 | 1157.00 | 658.00 | 265.00 | 67.90 | 205.00 | 146.00 | 1145.00 | ||
| Soil (mg/kg) | AM | 3.51 | 646.14 | 170.42 | 79.07 | 35.57 | 67.91 | 88.51 | 0.35 | [53,56,57,58,59] |
| N | 31 | 35 | 65 | 61 | 31 | 65 | 60 | 12 | ||
| Min | 1.31 | 100.20 | 41.82 | 6.89 | 9.90 | 12.20 | 9.83 | 0.10 | ||
| Max | 6.47 | 927.47 | 851.70 | 232.00 | 54.63 | 869.40 | 472.60 | 1.20 | ||
| Road dust (mg/kg) | AM | 5.10 | 678.91 | 333.12 | 119.53 | 45.21 | 100.75 | 336.08 | 0.65 | Our study |
| N | 23 | 23 | 23 | 23 | 23 | 23 | 23 | 23 | ||
| Min | 2.85 | 416.23 | 84.87 | 54.70 | 23.22 | 19.72 | 31.99 | 0.25 | ||
| Max | 10.75 | 947.36 | 788.60 | 454.96 | 90.15 | 177.65 | 2626.05 | 1.48 |
* The unit of Fe in sediment, SPM, soil, and road dust is percent.
Table 2.
Wash-off rate constant (W) for 8 heavy metals.
| Fe | Mn | Zn | Cr | Ni | Cu | Pb | Cd |
|---|---|---|---|---|---|---|---|
| 0.24 ± 0.01 | 0.25 ± 0.01 | 0.27 ± 0.01 | 0.25 ± 0.01 | 0.25 ± 0.01 | 0.25 ± 0.01 | 0.24 ± 0.01 | 0.26 ± 0.01 |
Table 3.
Summary of the contents of metal elements in the urban environmental media in Nanjing, China.
Table 3.
Summary of the contents of metal elements in the urban environmental media in Nanjing, China.
| Element | Fe | Mn | Zn | Cr | Ni | Cu | Pb | Cd | References |
|---|---|---|---|---|---|---|---|---|---|
| Road dust (mg/kg) | 4.92 (%) | 678.91 | 289.68 | 104.21 | 42.65 | 100.75 | 103.65 | 0.61 | This study |
| Soil (mg/kg) | 3.51 (%) | 610.02 | 131.76 | 69.98 | 35.57 | 67.91 | 63.68 | 0.263 | |
| Atmospheric PM2.5 (ng/m3) | 492.36 | 48.34 | 287.92 | 12.5 | 7.13 | 65.8 | 107.5 | 2.17 | |
| Surface water (μg/L) | 67.25 | 6.17 | 43.15 | 5.94 | 14.43 | 20.01 | 2.90 | 0.83 | |
| Sediment (mg/kg) | 6.49 (%) | 777.38 | 120.35 | 78.23 | 40.20 | 44.90 | 38.91 | 1.72 | |
| SPM (mg/kg) | 6.40 (%) | 958.40 | 172.30 | 101.00 | 56.06 | 70.90 | 61.01 | 1.32 | |
| Soil background value (mg/kg) | 3.02 (%) | 585 | 62.6 | 77.8 | 26.7 | 22.3 | 26.2 | 0.126 | [66] |
| Crustal abundance (mg/kg) | 5.63 (%) | 950 | 70 | 100 | 75 | 55 | 12.5 | 0.2 | [67] |
| Background value in river water (μg/L) | 215.5 | 19.31 | 4.18 | 0.9 | 0.61 | 1.26 | 0.71 | 0.019 | [65] |
Table 4.
The contribution ratios of the other environmental media to metals in urban water bodies.
| % | Atmospheric Deposition | Soil | Sediment | Road Dust | Tailwater | ||||||
|---|---|---|---|---|---|---|---|---|---|---|---|
| Total | Dry | Wet | Total | Soil Runoff | Soil Erosion | Total | Resuspension | Diffusion | Total | ||
| Fe | 10.10 | 3.02 | 7.08 | 41.57 | 0.47 | 41.10 | 19.7 | 17.3 | 2.4 | 28.60 | 0.0012 |
| Mn | 10.78 | 3.22 | 7.6 | 28.77 | 17.69 | 11.09 | 29.9 | 15.0 | 15.0 | 30.51 | 0.0011 |
| Zn | 3.56 | 1.06 | 2.49 | 12.43 | 2.60 | 9.83 | 73.9 | 5.00 | 68.9 | 10.07 | 0.0007 |
| Cr | 2.38 | 0.71 | 1.67 | 9.55 | 0.39 | 9.16 | 81.3 | 3.33 | 78.0 | 6.75 | 0.0000 |
| Ni | 3.99 | 1.19 | 2.79 | 15.06 | 1.66 | 13.40 | 69.7 | 5.95 | 63.7 | 11.28 | 0.0000 |
| Cu | 4.70 | 1.41 | 3.29 | 14.77 | 5.26 | 9.51 | 67.2 | 6.51 | 60.7 | 13.30 | 0.0005 |
| Pb | 5.66 | 1.69 | 4.0 | 20.72 | 3.08 | 17.63 | 57.6 | 8.71 | 48.9 | 16.01 | 0.0008 |
| Cd | 1.57 | 0.47 | 1.10 | 4.05 | 2.73 | 1.33 | 89.9 | 1.37 | 88.6 | 4.44 | 0.0000 |
© 2020 by the authors. Licensee MDPI, Basel, Switzerland. This article is an open access article distributed under the terms and conditions of the Creative Commons Attribution (CC BY) license (http://creativecommons.org/licenses/by/4.0/).
Share and Cite
MDPI and ACS Style
Chang, X.; Li, Y. Using a Multimedia Aquivalence Model to Evaluate the Environmental Fate of Fe, Mn and Trace Metals in an Industrial City, China. Water 2020, 12, 1580. https://doi.org/10.3390/w12061580
AMA Style
Chang X, Li Y. Using a Multimedia Aquivalence Model to Evaluate the Environmental Fate of Fe, Mn and Trace Metals in an Industrial City, China. Water. 2020; 12(6):1580. https://doi.org/10.3390/w12061580
Chicago/Turabian StyleChang, Xuan, and Yingxia Li. 2020. "Using a Multimedia Aquivalence Model to Evaluate the Environmental Fate of Fe, Mn and Trace Metals in an Industrial City, China" Water 12, no. 6: 1580. https://doi.org/10.3390/w12061580
Note that from the first issue of 2016, this journal uses article numbers instead of page numbers. See further details here.