An Analytical Model to Predict the Effects of Suspended Solids in Injected Water on the Oil Displacement Efficiency during Waterflooding

 , , and
Abstract
:1. Introduction
2. Literature Review
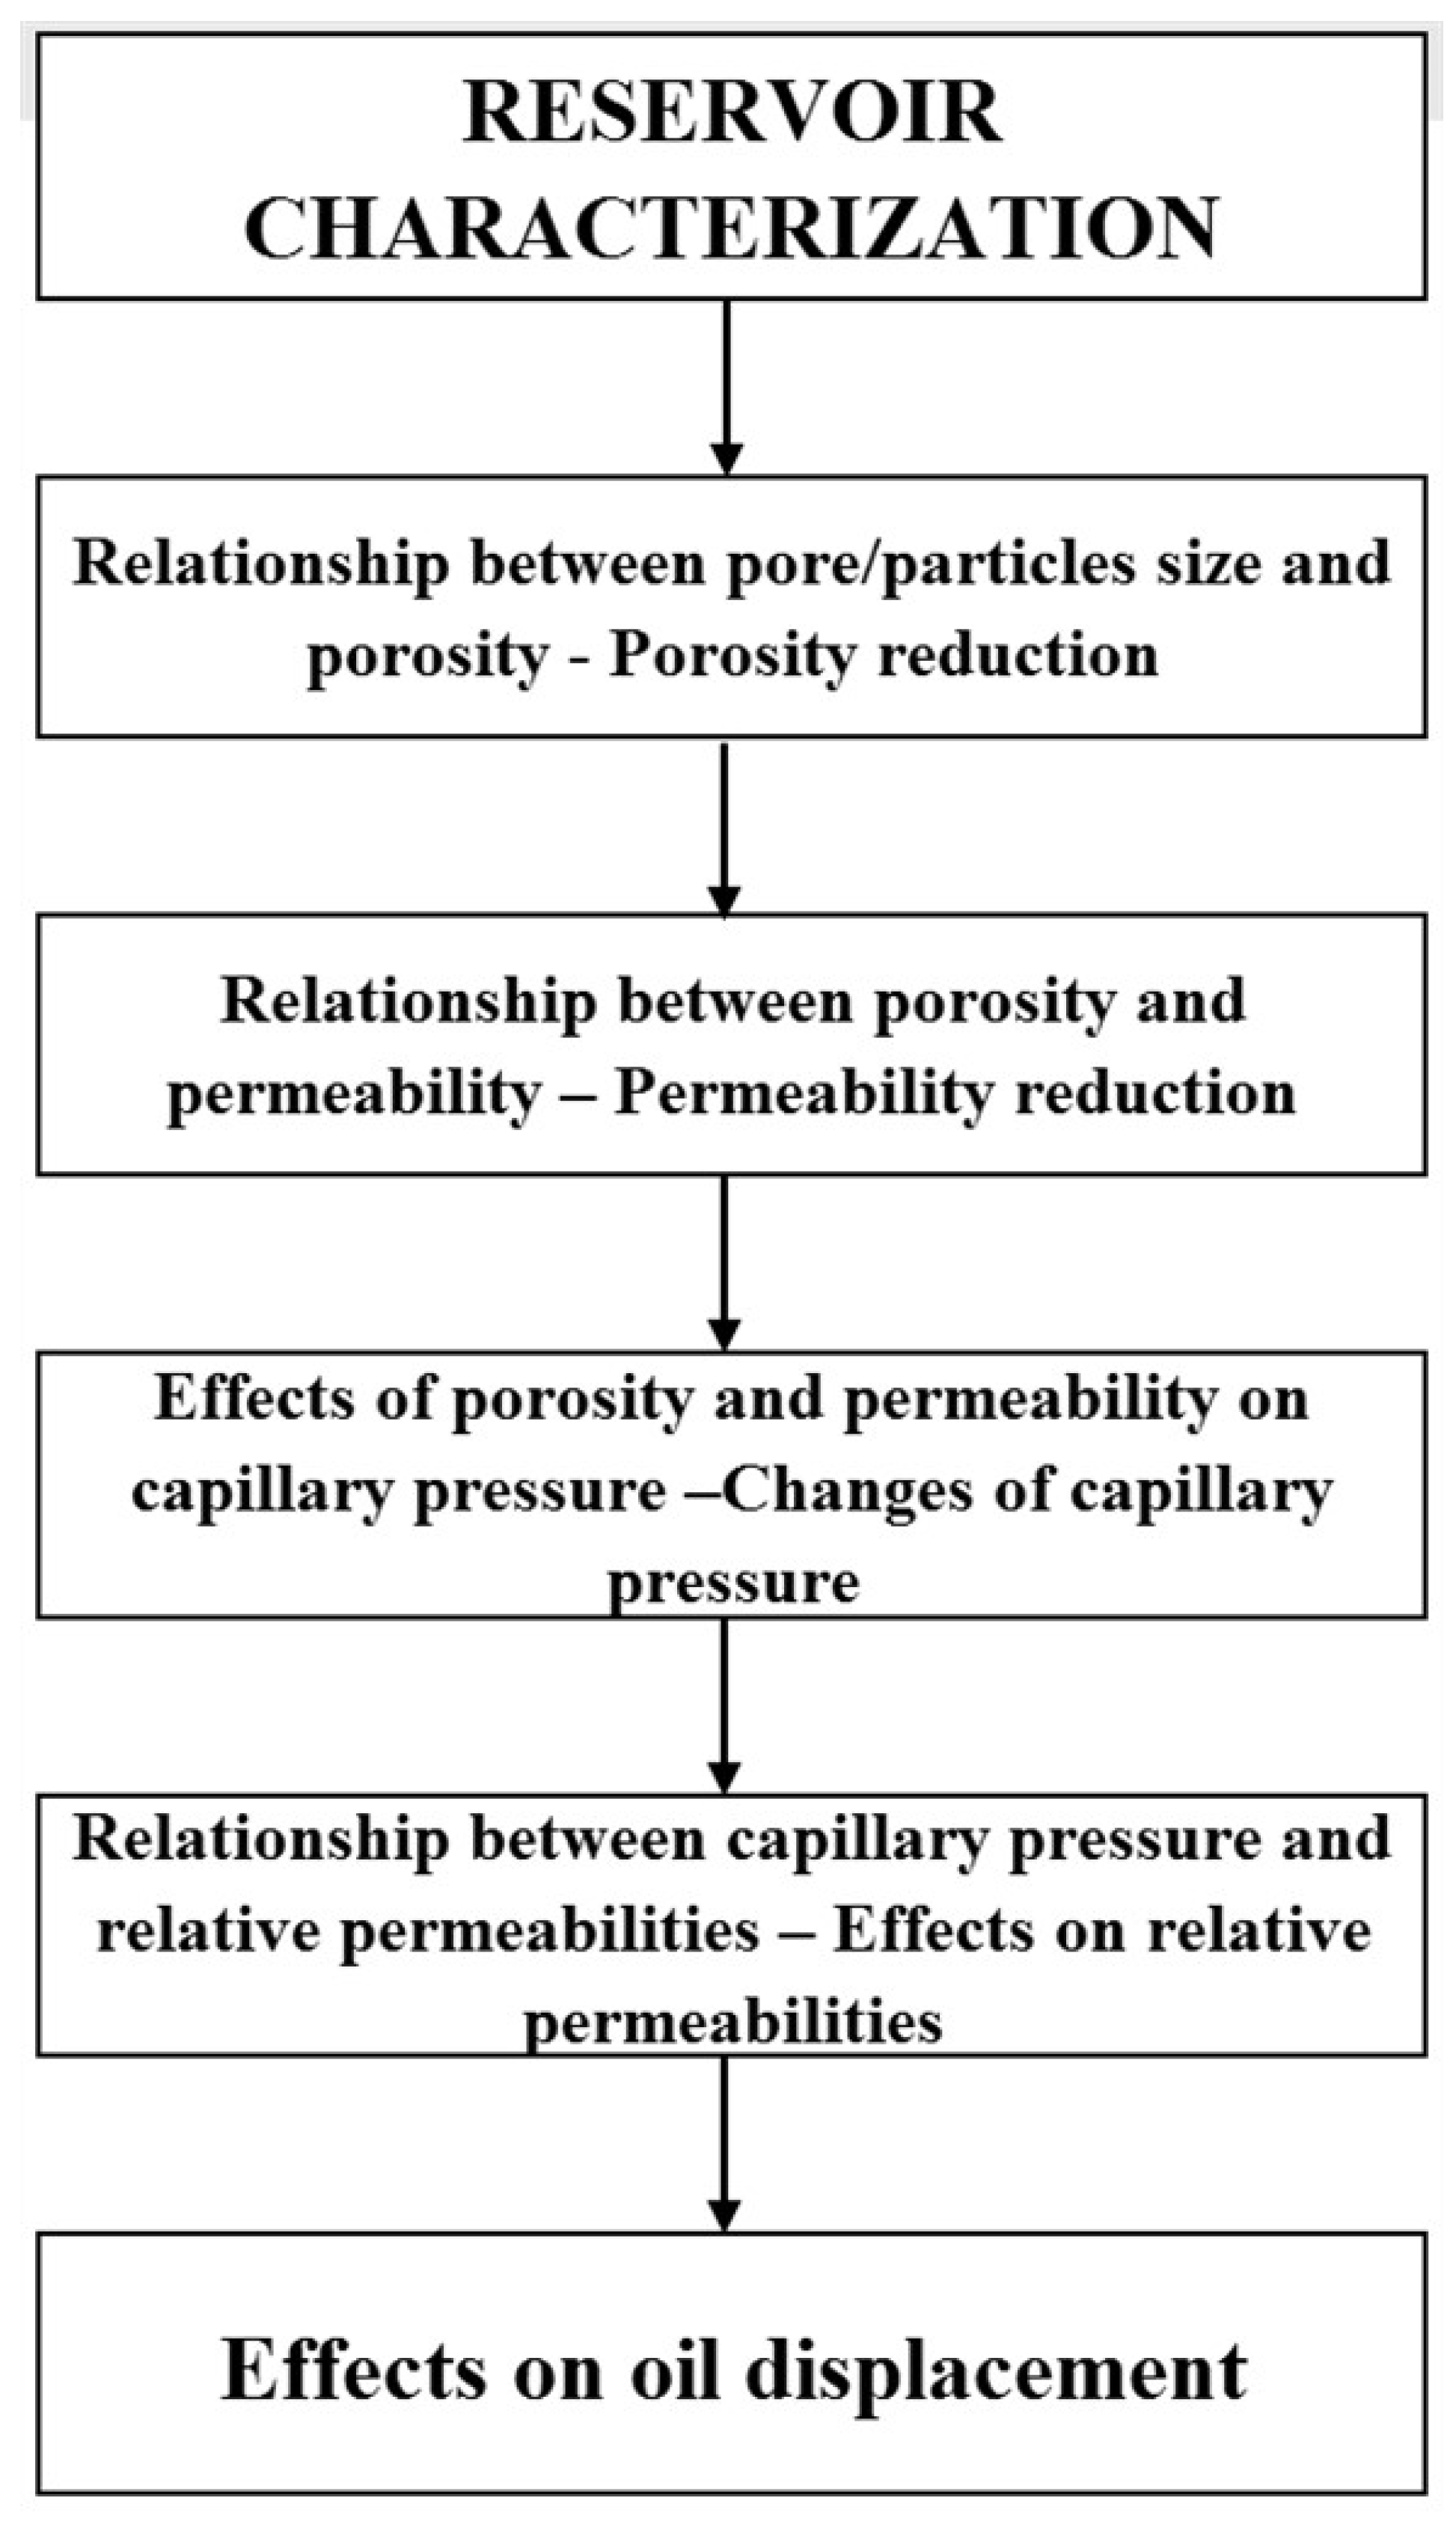
3. Materials and Methods
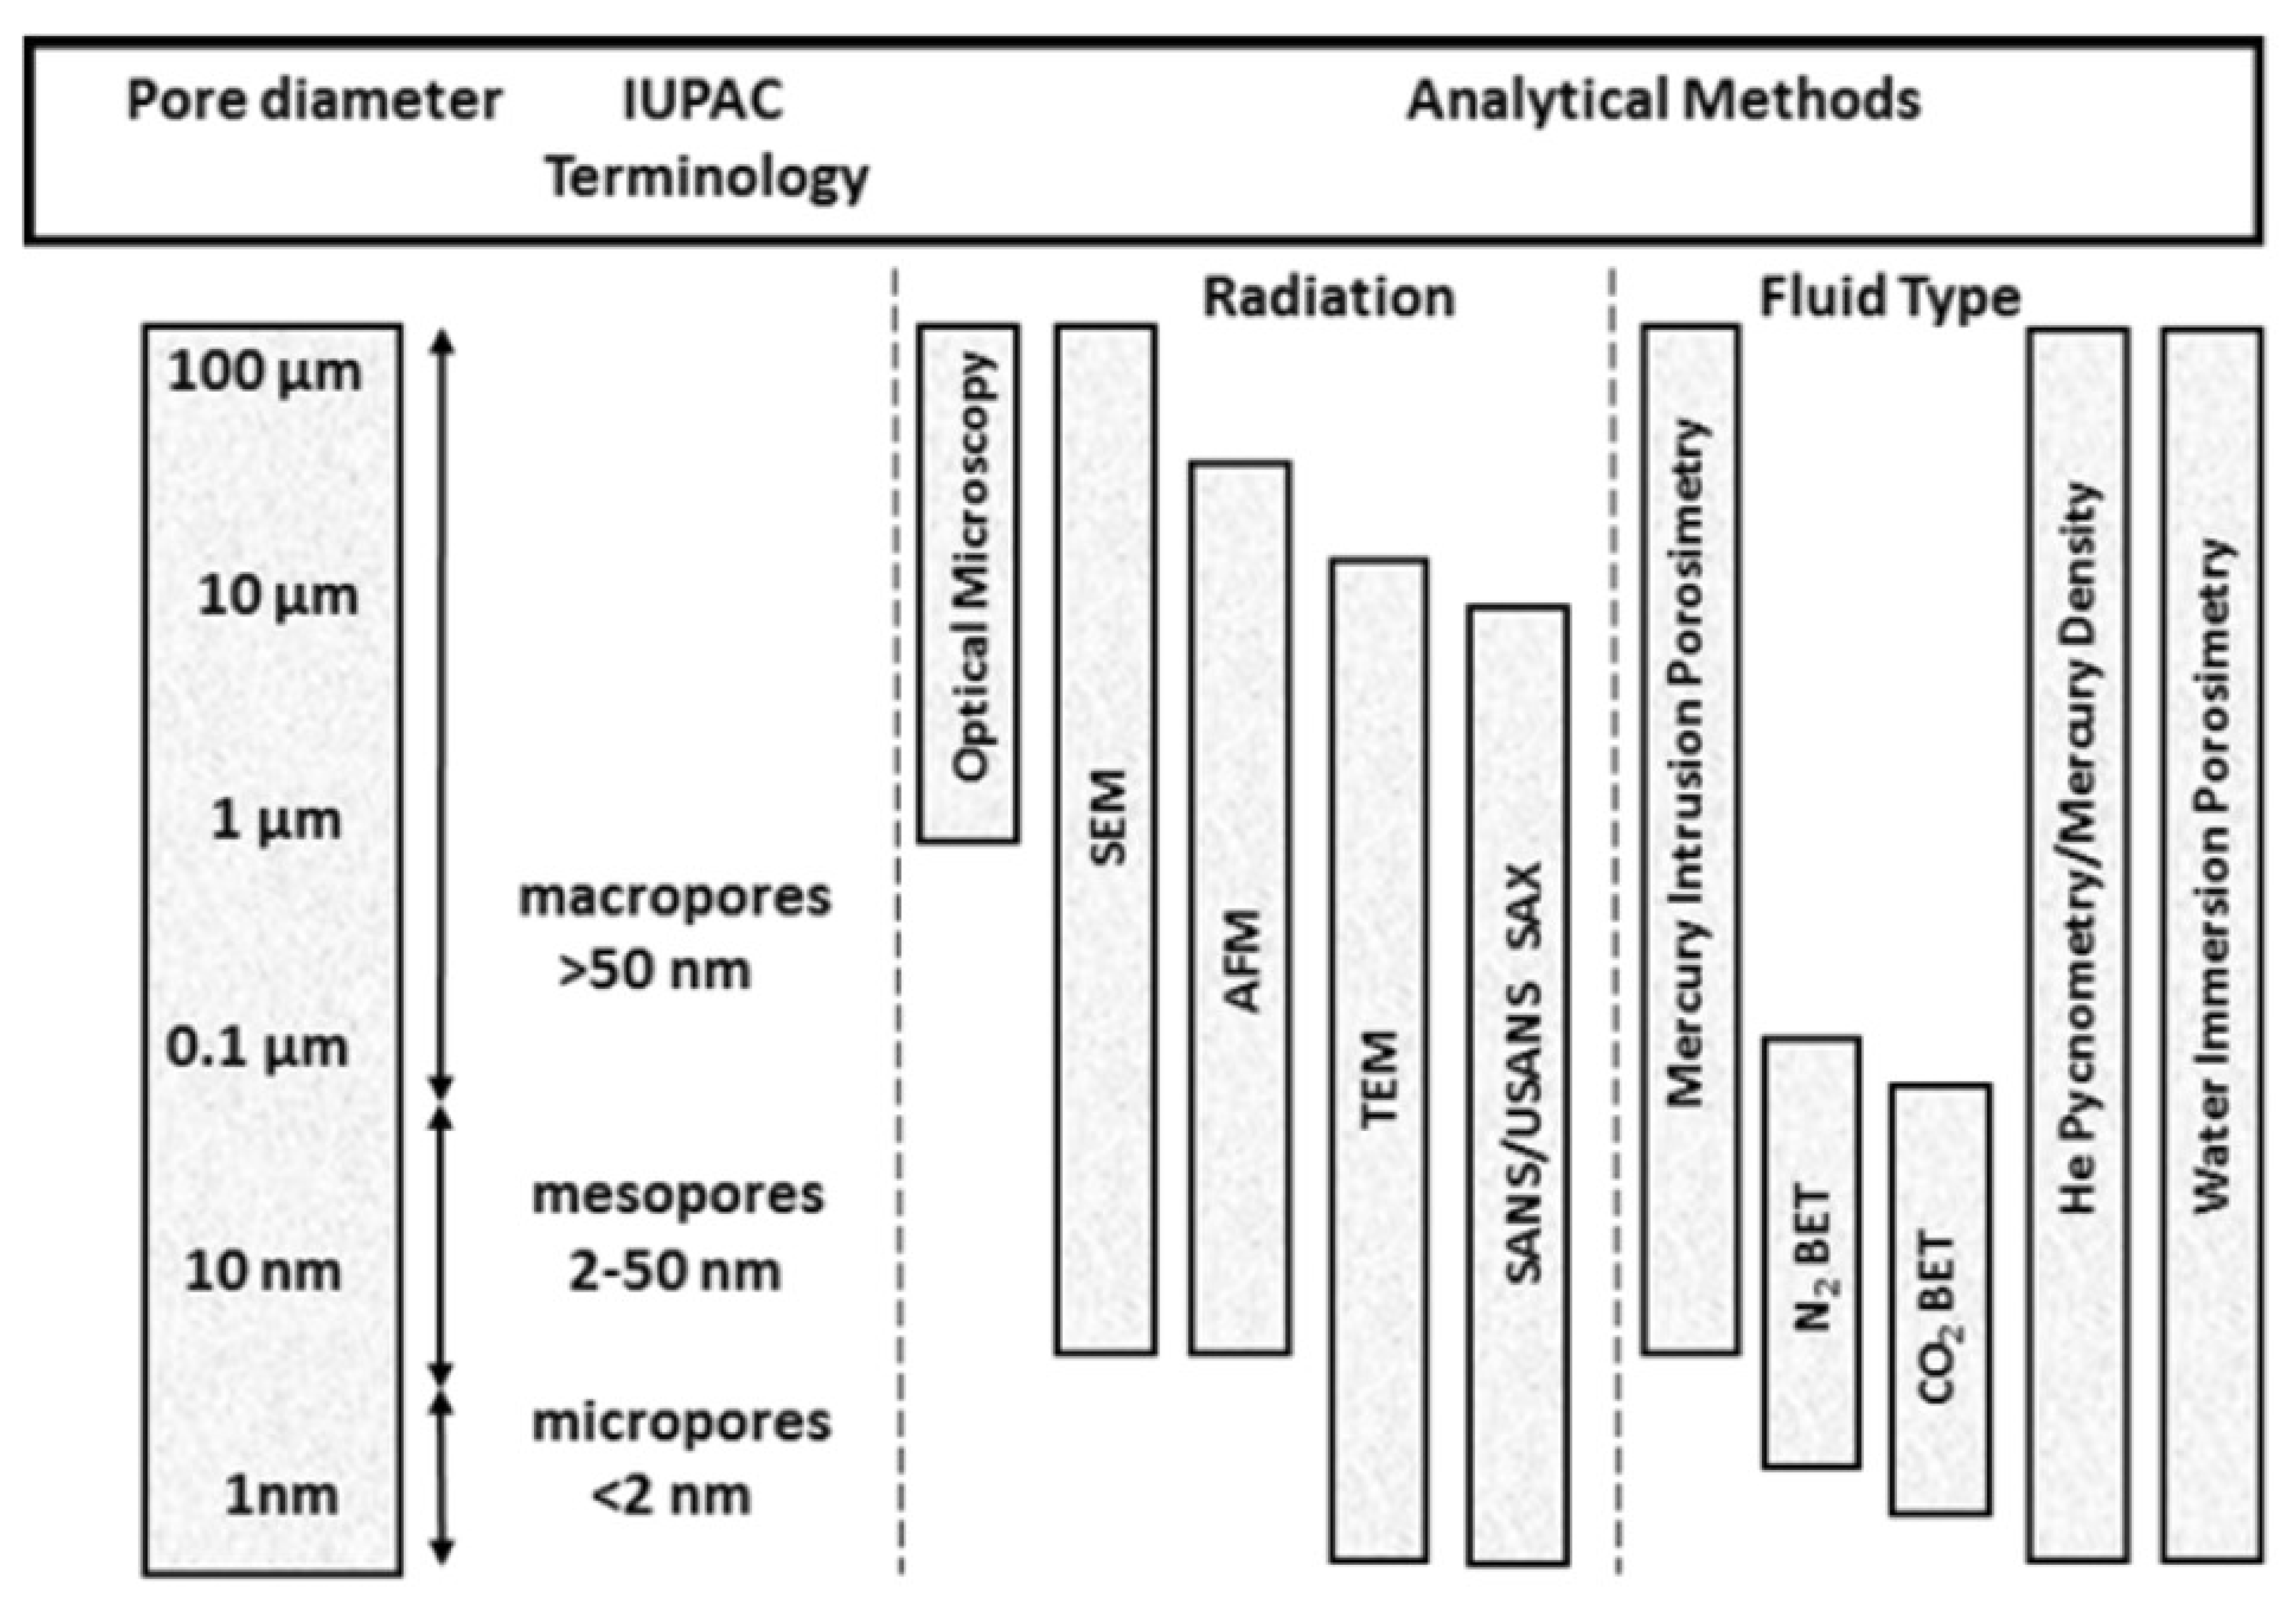
- Porosity and pore size distribution (particle size analysis (PSA), nuclear magnetic resonance (NMR))
- Reservoir permeability (permeability tests on core samples)
- Distribution of suspended solids in injected water (PSA)
- Capillary pressure (lab)
- Fluid–rock interaction is neglected;
- Compatibility of injected and reservoir water is neglected, i.e., waters are compatible
- Mechanism of suspended solids deposition is sedimentation; and
- Particle erosion during waterflooding is neglected.
3.1. Relationship between Pore/Particle Size and Porosity—Porosity Reduction Model
- If the ratio between the suspended solids fraction and pore diameter is between 0.0 and 0.7, there will be no changes in fractional porosity.
- If the ratio between the suspended solids fraction and pore diameter is between 0.7 and 1, fractional porosity for specific diameter will be multiplied by 0.8.
- If the ratio between the suspended solids fraction and pore diameter is between 1 and 2, fractional porosity for specific diameter will be multiplied by 0.6.
- If the ratio between the suspended solids fraction and pore diameter is higher than 2, fractional porosity for specific diameter will be multiplied by 0.5.
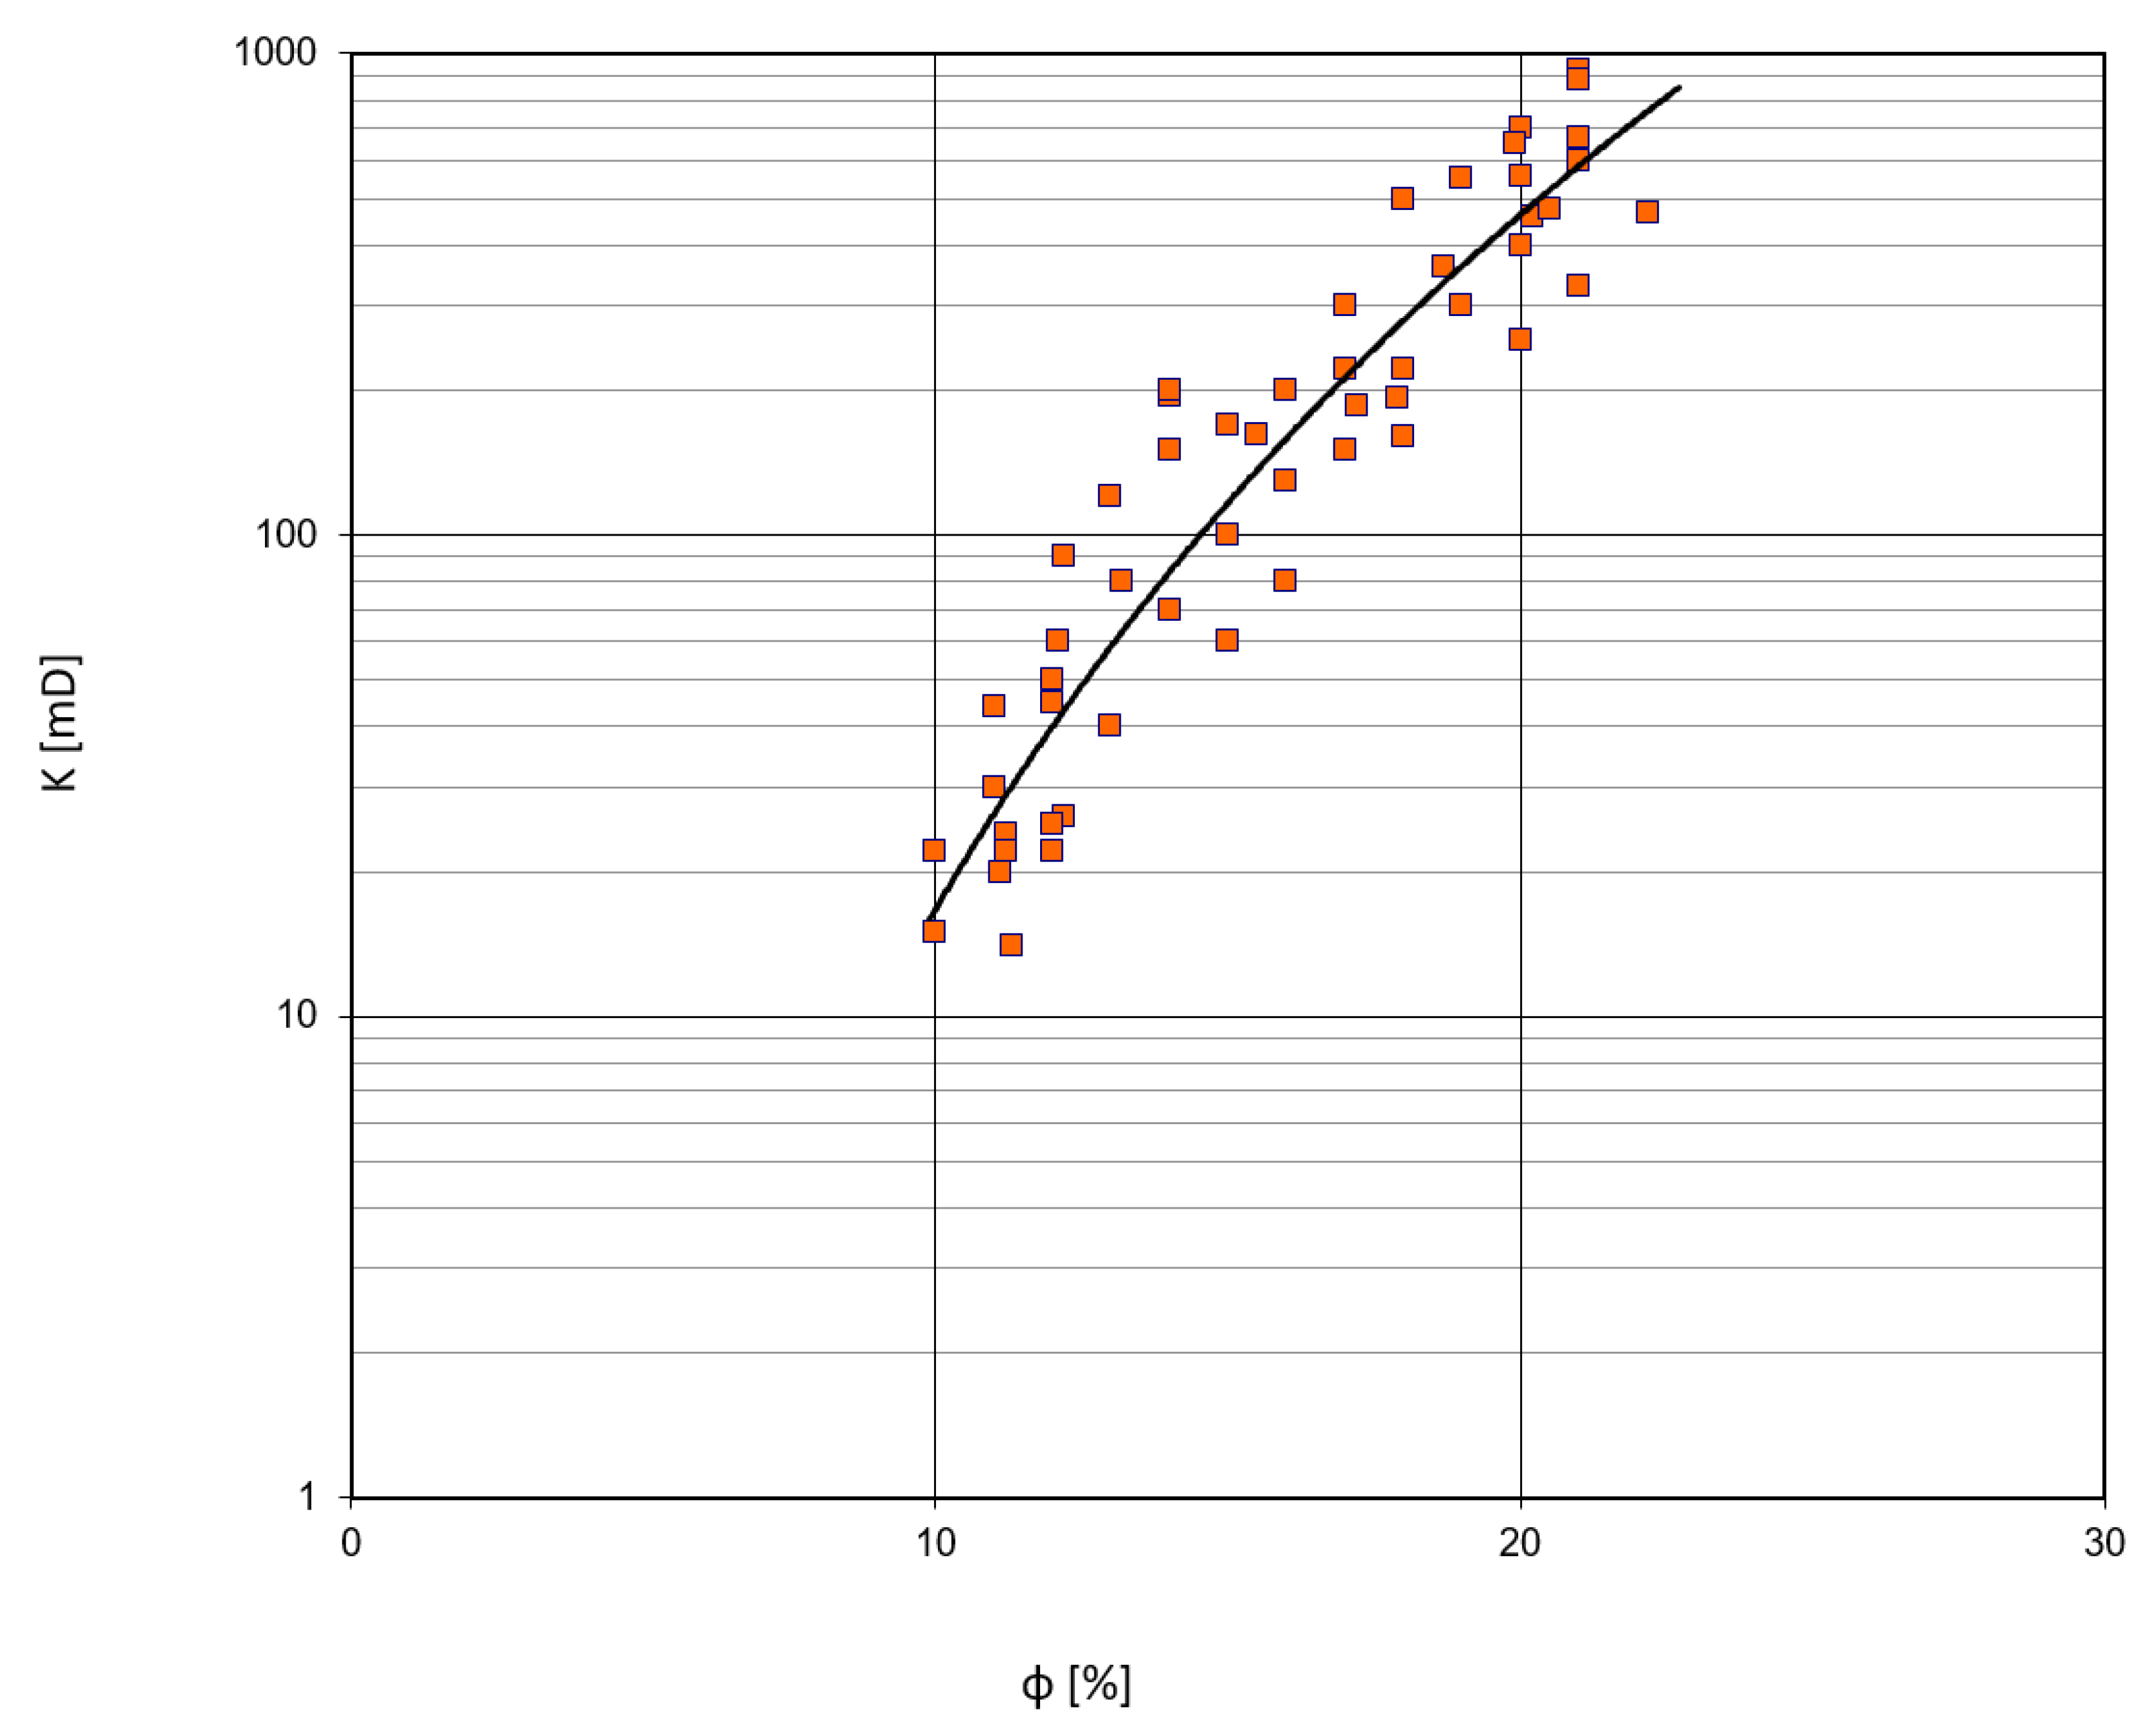
3.2. Relationship between Porosity and Permeability—Permeability Reduction Model
3.3. Effects of Porosity and Permeability on Capillary Pressure—Changes of Capillary Pressure
3.4. Relationship between Capillary Pressure and Relative Permeabilities—Effects on Relative Permeabilities
3.5. Effects on Oil Displacement
4. Results
4.1. Porosity Reduction
4.2. Permeability Reduction
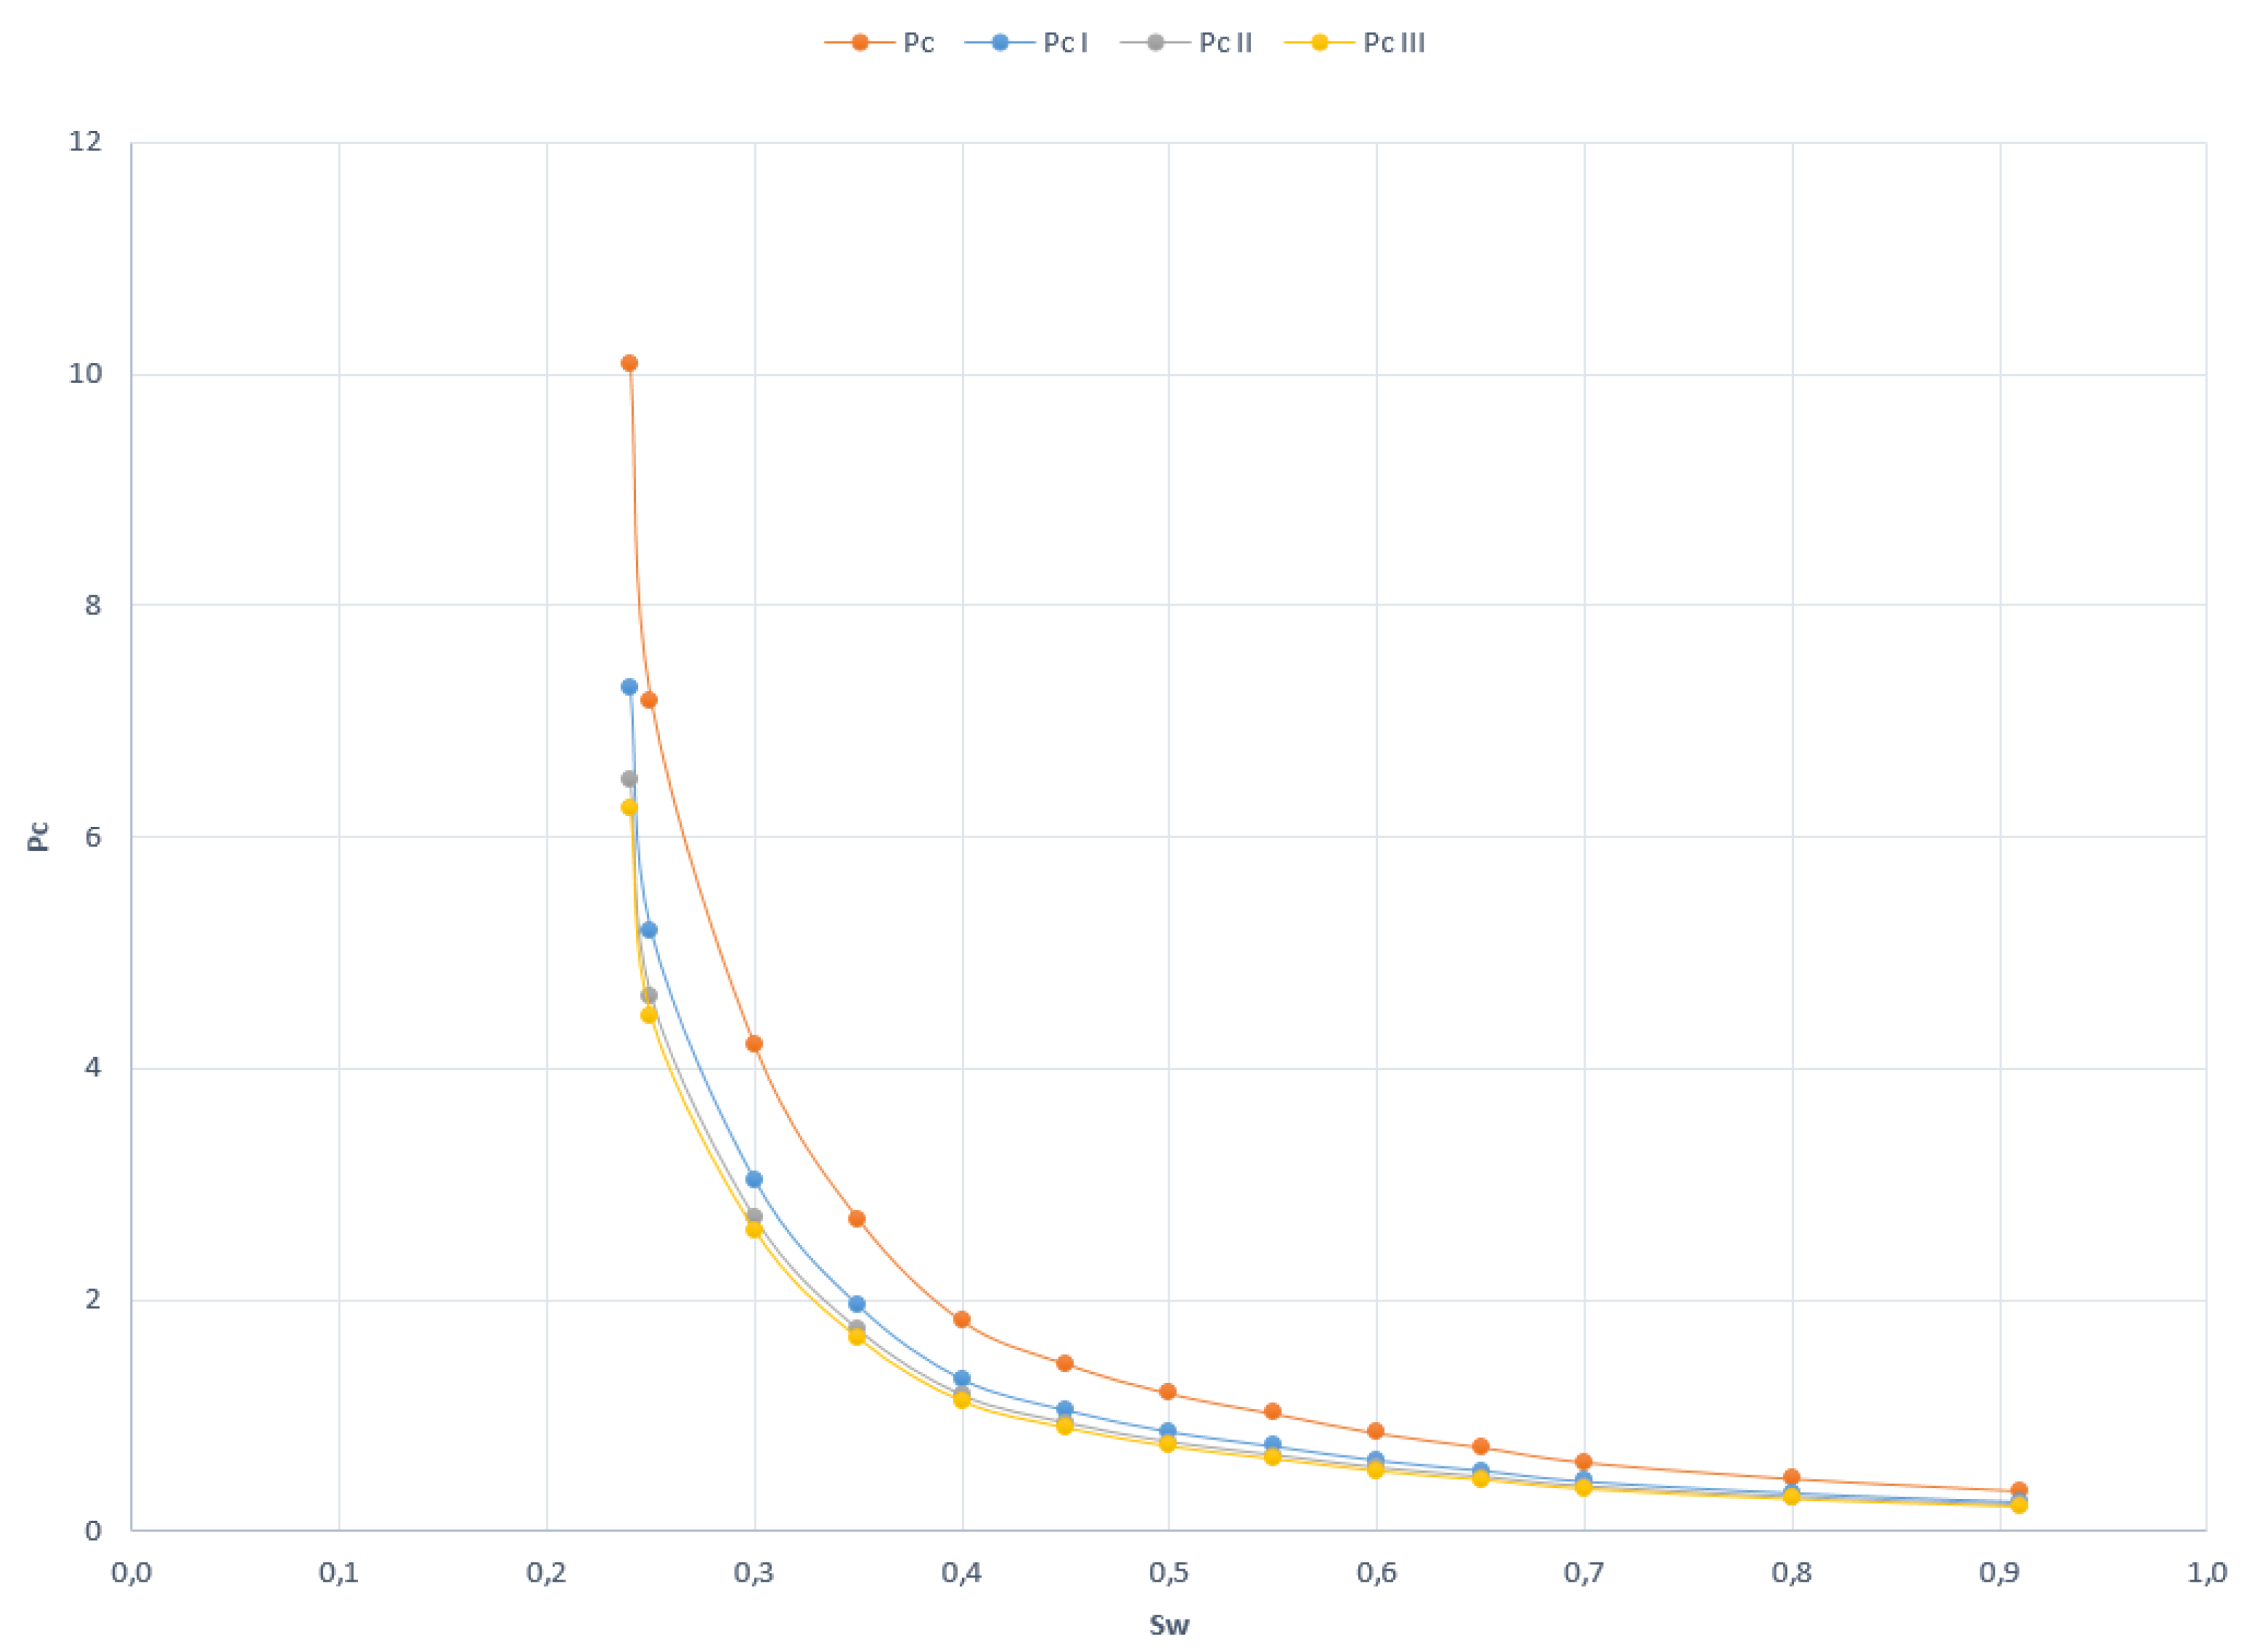
4.3. Changes in Capillary Pressure
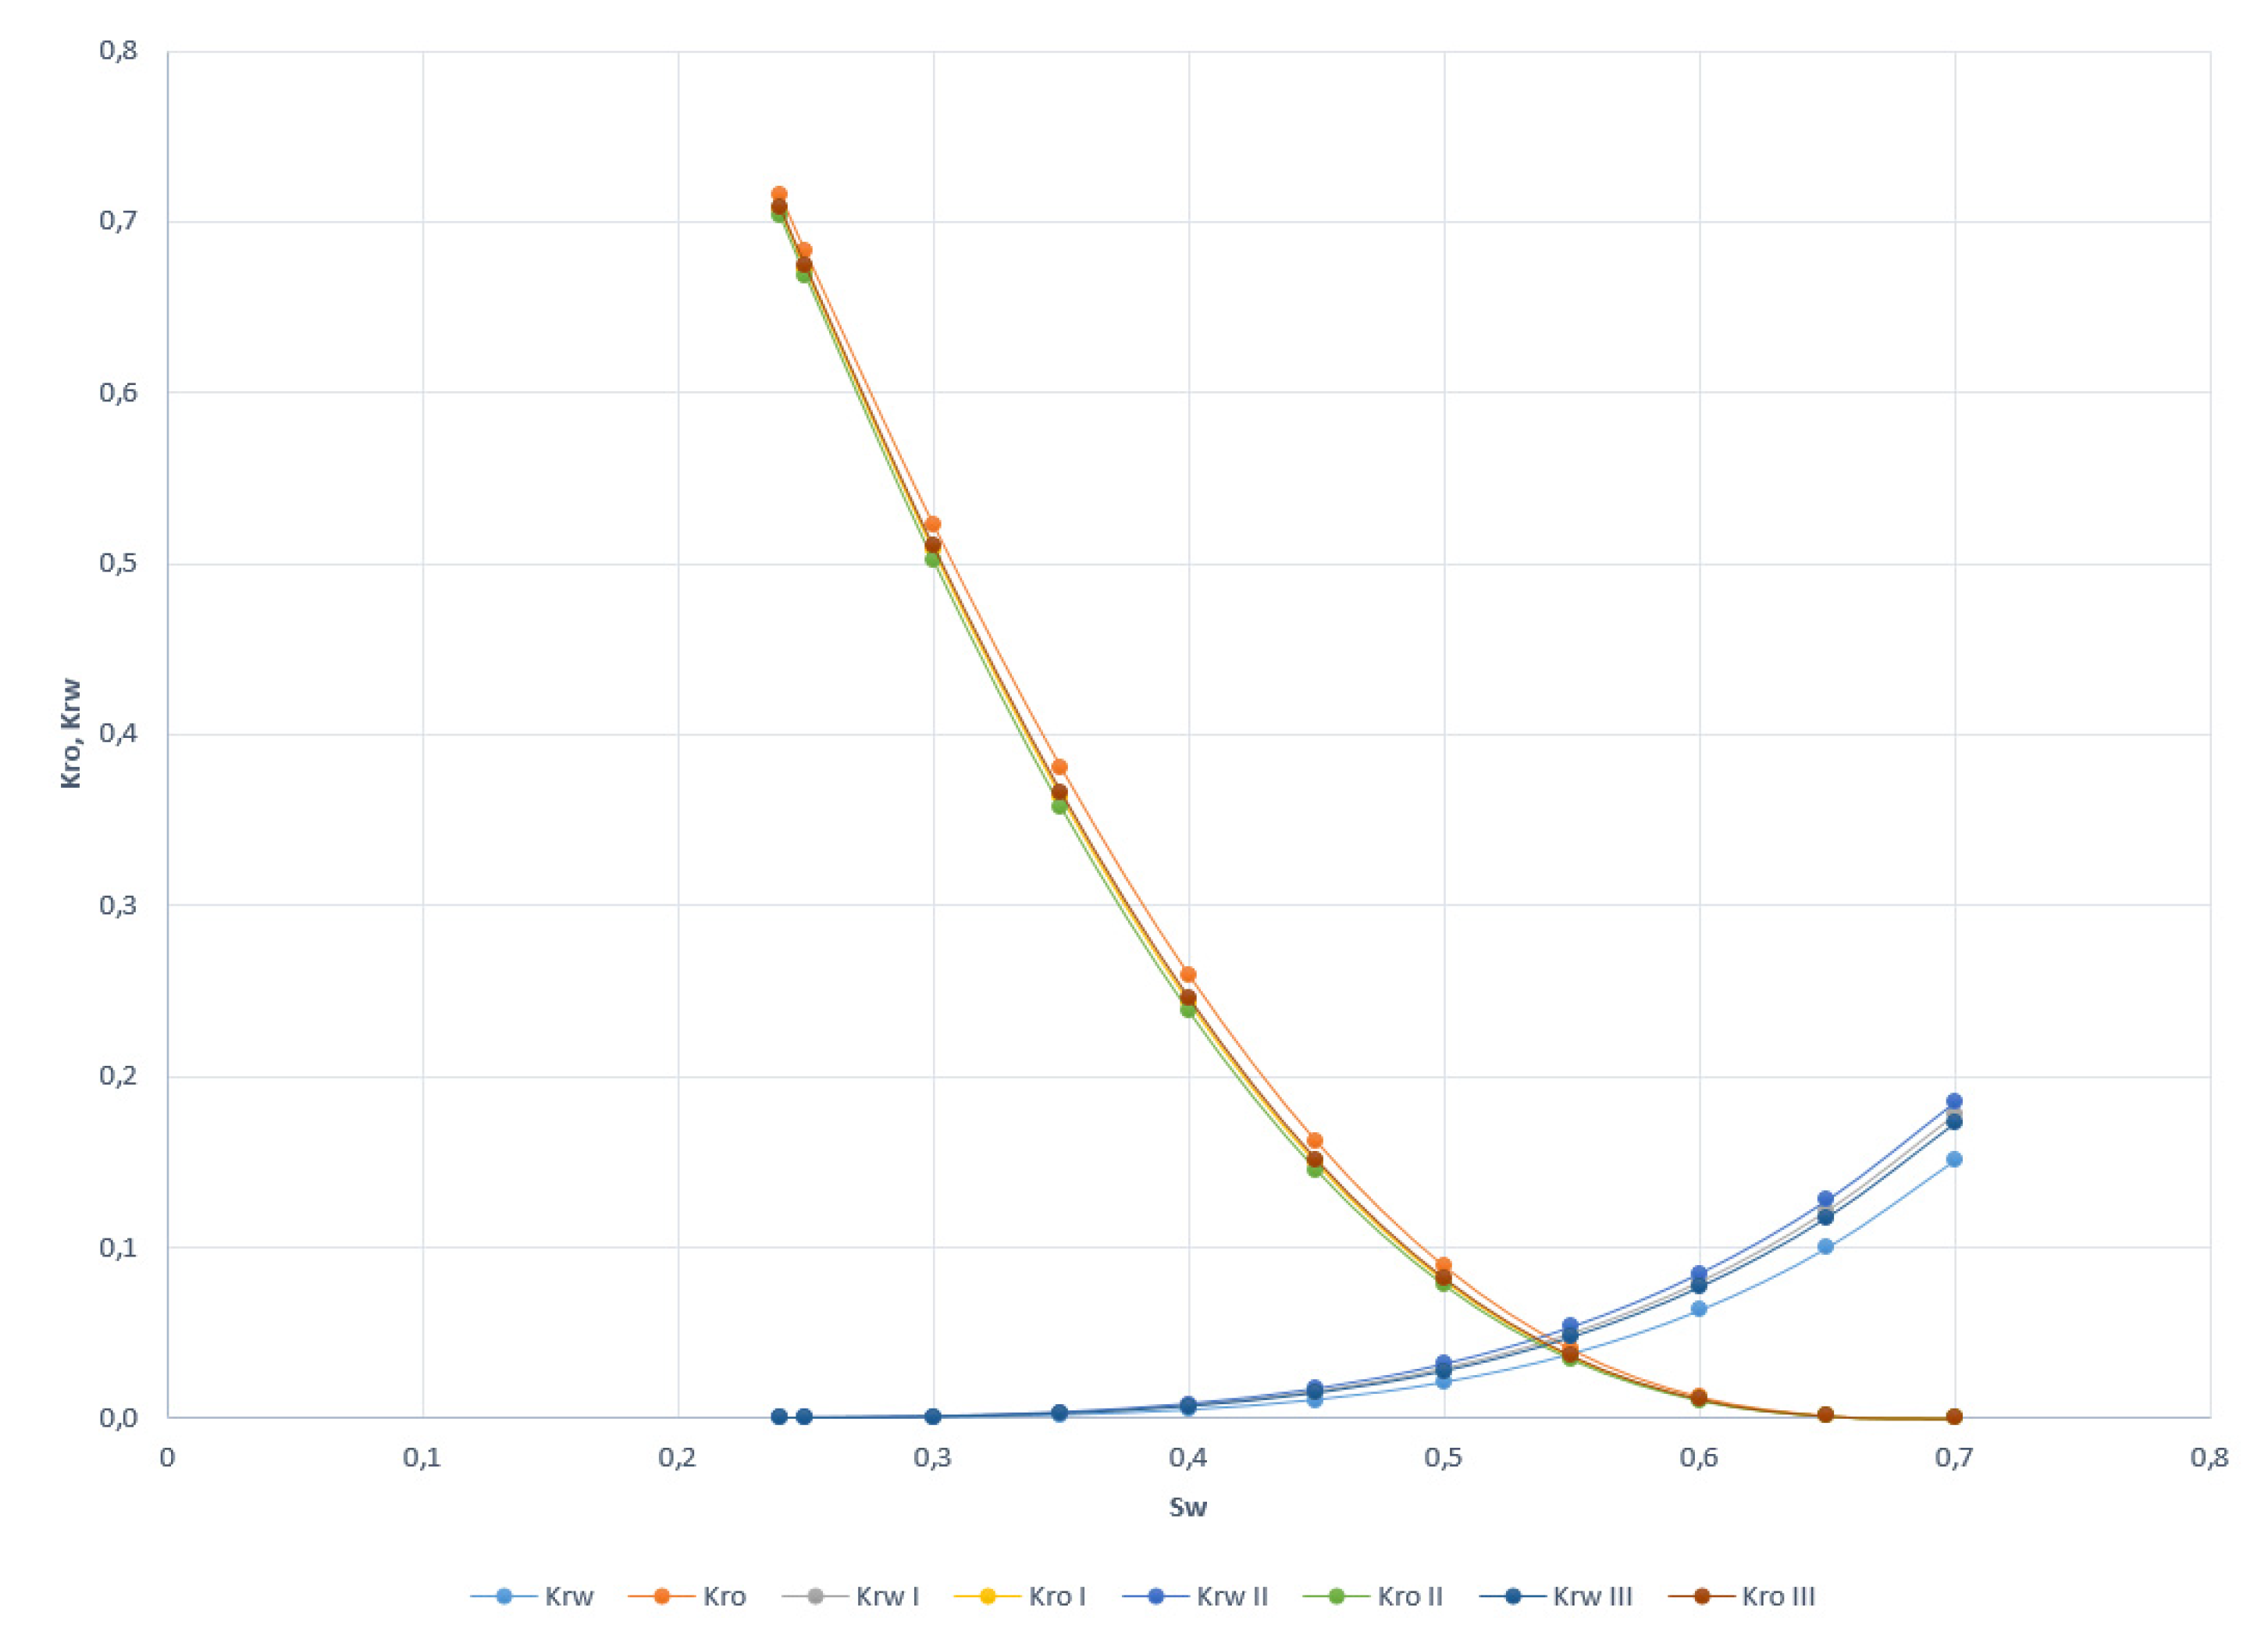
4.4. Changes of Relative Permeabilities
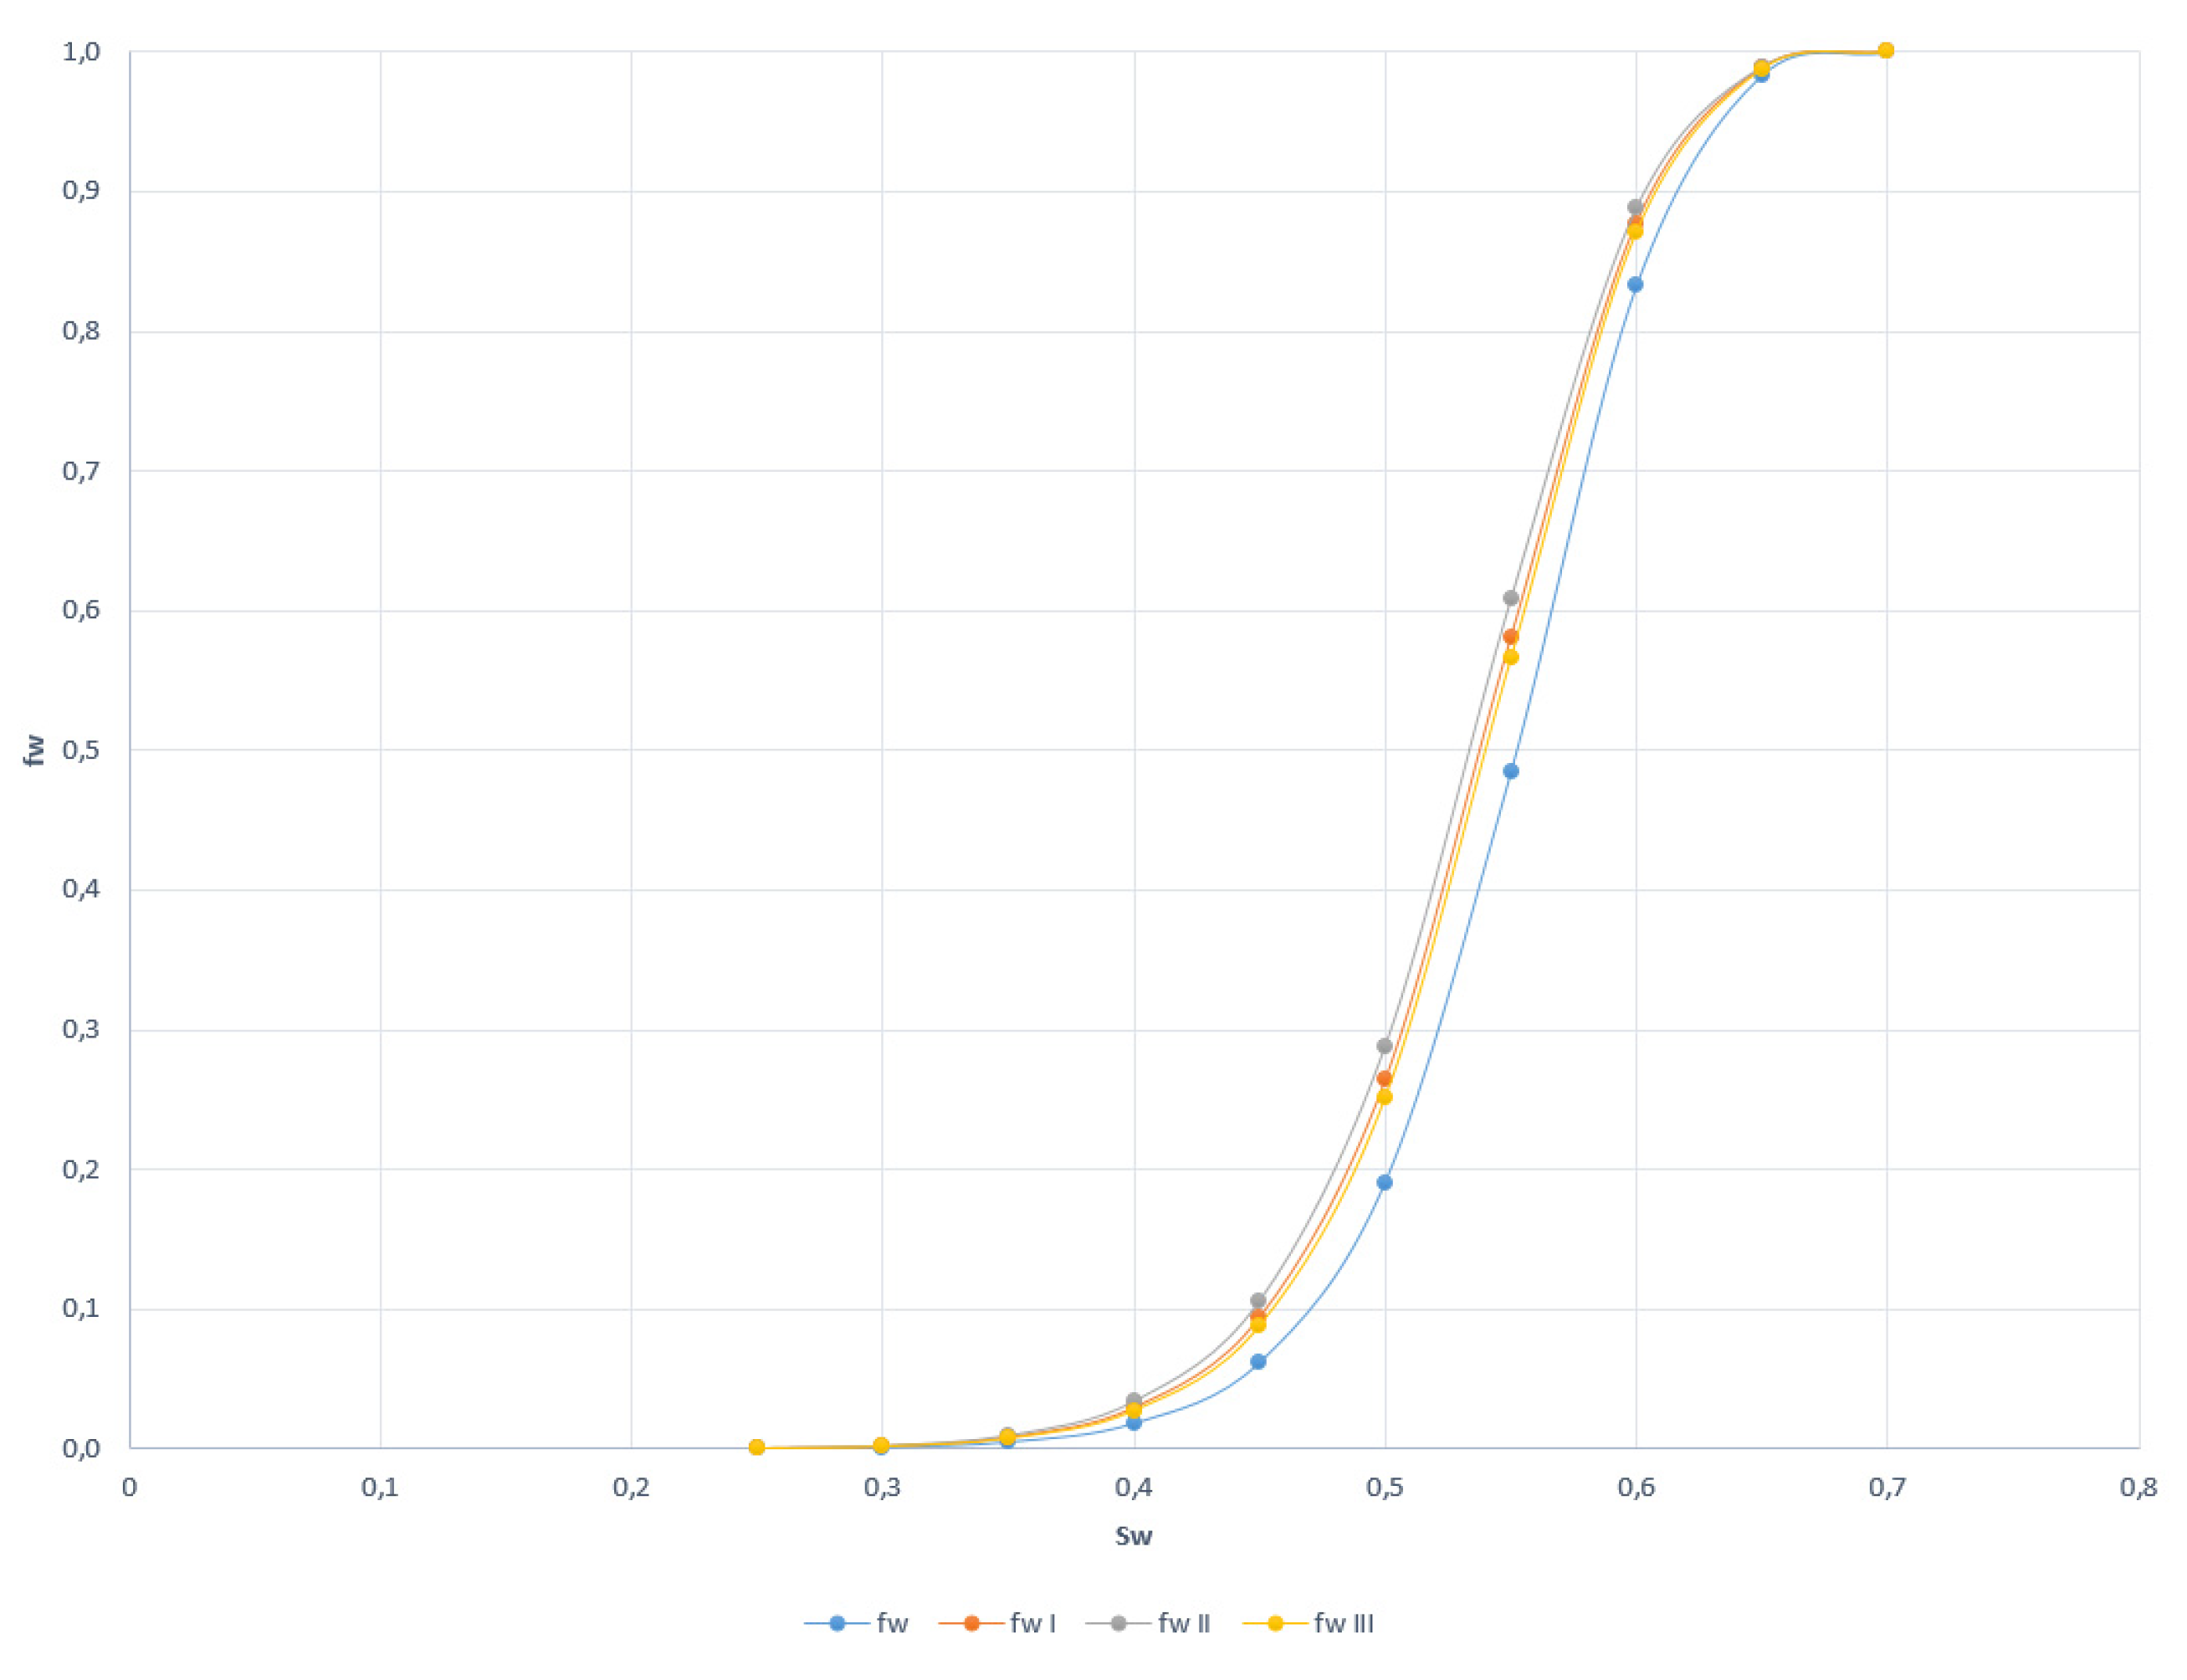
4.5. Effects on Oil Displacement
5. Discussion
6. Conclusions
Author Contributions
Funding
Conflicts of Interest
References
- Davarpanah, A.; Mirshekari, B.; Razmjoo, A.A. A Simulation Study of Water Injection and Gas Injectivity Scenarios in a Fractured Carbonate Reservoir: A Comparative Study. Pet. Res. 2019, 4, 250–256. [Google Scholar] [CrossRef]
- Davarpanah, A.; Mirshekari, B. Mathematical Modeling of Injectivity Damage with Oil Droplets in the Waste Produced Water Re-Injection of the Linear Flow. Eur. Phys. J. Plus 2019, 134, 180. [Google Scholar] [CrossRef]
- Afshin, D. Feasible Analysis of Reusing Flowback Produced Water in the Operational Performances of Oil Reservoirs. Environ. Sci. Pollut. Res. 2018, 25, 35387–35395. [Google Scholar]
- Davarpanah, A.; Mirshekari, B.; Jafari Behbahani, T.J.; Hemmati, M. Integrated production logging tools approach for convenient experimental individual layer permeability measurements in a multi-layered fractured reservoir. J. Petrol. Explor. Prod. Technol. 2018, 8, 743–751. [Google Scholar] [CrossRef] [Green Version]
- Costier, L.; van den Hoek, P.J.; Davidson, C.J.; Ding, M.; van den Berg, J.T.; Hofland, R. Establishing Water Injection Dynamics by Leading-Edge Coreflood Testing. In Proceedings of the EUROPEC/EAGE Conference and Exhibition, Amsterdam, The Netherlands, 8–11 June 2009. [Google Scholar] [CrossRef]
- Davarpanah, A.; Mirshekari, B. Experimental Investigation and Mathematical Modeling of Gas Diffusivity by Carbon Dioxide and Methane Kinetic Adsorption. Ind. Eng. Chem. Res. 2019, 58, 12392–12400. [Google Scholar] [CrossRef]
- Faruk, C. Formation Damage Mechanisms and Their Phenomenological Modeling—An Overview. In Proceedings of the European Formation Damage Conference, Scheveningen, The Netherlands, 30 May–1 June 2007. [Google Scholar] [CrossRef]
- Hussain, F.; Zeinijahromi, A.; Bedrikovetsky, P.; Badalyan, A.; Carageorgos, T.; Cinar, Y. An Experimental Study of Improved Oil Recovery through Fines-Assisted Waterflooding. J. Pet. Sci. Eng. 2013, 109, 187–197. [Google Scholar] [CrossRef]
- Faruk, C. Reservoir Formation Damage: Fundamentals, Modeling, Assessment, and Mitigation; Elsevier: Amsterdam, The Netherlands; Gulf Professional Publishing: Amsterdam, The Netherlands, 2016. [Google Scholar]
- Hofsaess, T.; Kleinitz, W. 30 Years of Predicting Injectivity after Barkman & Davidson: Where Are We Today? In Proceedings of the SPE European Formation Damage Conference, The Hague, The Netherlands, 13–14 May 2003. [Google Scholar] [CrossRef]
- Vaz, A.S.L.; Pavel, G. Bedrikovetsky, Claudio Jose Alves Furtado, Alexandre Guedes Siqueira, and Antonio Luiz Serra De Souza. In Effects of Residual Oil on Re-Injection of Produced Water. In Proceedings of the SPE Europec/EAGE Annual Conference and Exhibition, Vienna, Austria, 12–15 June 2006. [Google Scholar] [CrossRef]
- Buret, S.; Nabzar, L.; Jada, A. Water Quality & Well Injectivity: Do Residual Stable Oil-in-Water Emulsions Matter? In Proceedings of the 8th European Formation Damage Conference, Scheveningen, The Netherlands, 27–29 May 2009. [Google Scholar]
- Khatib, Z.I. Prediction of Formation Damage Due to Suspended Solids: Modeling Approach of Filter Cake Buildup in Injectors. In Proceedings of the SPE Annual Technical Conference and Exhibition, New Orleans, LA, USA, 25–28 September 1994. [Google Scholar] [CrossRef]
- Pang, S.; Sharma, M.M. A Model for Predicting Injectivity Decline in Water-Injection Wells. SPE Form. Eval. 1997, 12, 194–201. [Google Scholar] [CrossRef]
- Bedrikovetsky, P.; Marchesin, D.; Shecaira, F.; Souza, A.l.; Milanez, P.V.; Rezende, E. Characterisation of Deep Bed Filtration System from Laboratory Pressure Drop Measurements. J. Pet. Sci. Eng. 2001, 32, 167–177. [Google Scholar] [CrossRef]
- Shedid, E. A Novel Technique for the Determination of Microscopic Pore Size Distribution of Heterogemeous Reservoir Rocks. In Proceedings of the Asia Pacific Oil and Gas Conference and Exhibition, Jakarta, Indonesia, 30 October–1 November 2007. [Google Scholar]
- Gruesbeck, C.; Collins, R.E. Entrainment and Deposition of Fine Particles in Porous Media. Soc. Pet. Eng. J. 1982, 22, 847–856. [Google Scholar] [CrossRef]
- Todd, A.C.; Somerville, J.E.; Scott, G. The Application of Depth of Formation Damage Measurements in Predicting Water Injectivity Decline. In Proceedings of the SPE Formation Damage Control Symposium, Bakersfield, CA, USA, 13–14 February 1984. [Google Scholar] [CrossRef]
- Davidson, D.H. Invasion and Impairment of Formations by Particulates. In Proceedings of the SPE Annual Technical Conference and Exhibition, Las Vegas, NV, USA, 23–26 September 1979. [Google Scholar] [CrossRef]
- Vitthal, S.; Sharma, M.M.; Sepehrnoori, K. A One-Dimensional Formation Damage Simulator for Damage Due to Fines Migration. In Proceedings of the SPE Formation Damage Control Symposium, Bakersfield, CA, USA, 8–9 February 1988. [Google Scholar] [CrossRef]
- Van Oort, E.; Van Velzen, J.F.; Leerlooijer, K. Impairment by Suspended Solids Invasion: Testing and Prediction. SPE Prod. Facil. 1993, 8, 178–184. [Google Scholar] [CrossRef]
- Hutchinson, C.A. Effect of Data Errors on Typical Reservoir Engineering Calculations. In Proceedings of the Fall Meeting of the Petroleum Branch of AIME, Oklahoma City, OK, USA, 3–5 October 1951. [Google Scholar] [CrossRef]
- Ling, K.; Han, G.; Shen, Z.; Ghalambor, A.; He, J.; Pei, P. Calculating Pore Size Distribution by Using Capillary Pressure. In Proceedings of the SPE International Symposium and Exhibition on Formation Damage Control, Lafayette, LA, USA, 26–28 February 2014. [Google Scholar] [CrossRef]
- Burdine, N.T.; Gournay, L.S.; Reichertz, P.P. Pore Size Distribution of Petroleum Reservoir Rocks. J. Pet. Technol. 1950, 2, 195–204. [Google Scholar] [CrossRef]
- Klinkenberg, L.J. Pore Size Distribution of Porous Media and Displacement Experiments with Miscible Liquids. J. Pet. Technol. 1957, 9, 63–66. [Google Scholar] [CrossRef]
- Pickell, J.J.; Swanson, B.F.; Hickman, W.B. Application of Air-Mercury and Oil-Air Capillary Pressure Data in the Study of Pore Structure and Fluid Distribution. Soc. Pet. Eng. J. 1966, 6, 55–61. [Google Scholar] [CrossRef]
- Dullien, F.A.L. Determination of Pore Accessibilities—An Approach. J. Pet. Technol. 1969, 21, 14–15. [Google Scholar] [CrossRef]
- Pandey, B.P.; Singhal, A.K. Evaluation of the Capillary Pressure Curve Techniques for Determining Pore Size Distribution—A Network Approach. Powder Technol. 1976, 15, 89–96. [Google Scholar] [CrossRef]
- Yuan, H.H.; Swanson, B.F. Resolving Pore-Space Characteristics by Rate-Controlled Porosimetry. SPE Form. Eval. 1989, 4, 17–24. [Google Scholar] [CrossRef]
- Tomutsa, L.; Mahmood, S.M.; Brinkmeyer, A.; Honarpour, M. Application of Integrated Pore-to-Core Image Analysis to Study Fluid Distribution in Reservoir Rocks. In Proceedings of the SPE Annual Technical Conference and Exhibition, New Orleans, LA, USA, 23–26 September 1990. [Google Scholar]
- Bijan, B. Quantitative Characterization of Carbonate Pore Systems by Mercury- Injection Method and Image Analysis in a Homogeneous Reservoir. In Proceedings of the Middle East Oil Show, Manama, Bahrain, 9–12 June 2003. [Google Scholar] [CrossRef]
- Homgxue, H.; Maurice, B.; Ioannidis, M.; Xu, B. Multiscale Pore Structure Characterization by Combining Image Analysis and Mercury Porosimetry. In Proceedings of the SPE Europec/EAGE Annual Conference and Exhibition, Vienna, Austria, 12–15 June 2006.
- Ghazanfari, M.H.; Rashtchian, D.; Kharrat, R.; Vossoughi, S. Capillary Pressure Estimation Using Statistical Pore Size Functions. Chem. Eng. Technol. 2007, 30, 862–869. [Google Scholar] [CrossRef]
- Dong, H.; Touati, M.; Blunt, M.J. Pore Network Modeling: Analysis of Pore Size Distribution of Arabian Core Samples. In Proceedings of the SPE Middle East Oil and Gas Show and Conference, Manama, Bahrain, 11–14 March 2007. [Google Scholar]
- Martin, C.A.; Ramia, M.; Barberis, L. The Centrifuge as a Tool to Determine the Pore-Throat Size Distribution in Plugs. In Proceedings of the Latin American & Caribbean Petroleum Engineering Conference, Buenos Aires, Argentina, 15–18 April 2007. [Google Scholar]
- Kegang, L. Correlation between Rock Permeability and Formation Resistivity Factor-A Rigorous and Theoretical Derivation. In Proceedings of the SPE Middle East Unconventional Gas Conference and Exhibition, Abu Dhabi, UAE, 23–25 January 2012. [Google Scholar]
- Izadi, M.; Ghalambor, A. A New Approach in Permeability and Hydraulic Flow Unit Determination. In Proceedings of the SPE International Symposium and Exhibition on Formation Damage Control, Lafayette, LA, USA, 15–17 February 2012. [Google Scholar] [CrossRef]
- Mumuni, A.; Miadonye, A. The Accuracy of Pore Size Distribution Index Using Capillary Pressure Data: Effect of Physiochemical Factors. J. Hydrogeol. Hydrol. Eng. 2018, 6. [Google Scholar] [CrossRef]
- Anovitz, L.M.; Cole, D.R. Characterization and Analysis of Porosity and Pore Structures. Rev. Mineral. Geochem. 2015, 80, 61–164. [Google Scholar] [CrossRef] [Green Version]
- Main, G.V. Chilingar Richard. Relationship between Porosity, Permeability, and Surface Areas of Sediments. SEPM J. Sediment. Res. 1963, 33, 759–765. [Google Scholar] [CrossRef]
- Chilingar, G.V. Relationship between Porosity, Permeability, and Grain-Size Distribution of Sands and Sandstones. Dev. Sedimentol. Deltaic Shallow Mar. Depos. 1964, 71–75. [Google Scholar] [CrossRef]
- Antonio, C. Permeability-Porosity Relationship: A Reexamination of the Kozeny-Carman Equation Based on a Fractal Pore-Space Geometry Assumption. Geophys. Res. Lett. 2006, 33. [Google Scholar] [CrossRef]
- Kotyakhov, F.I. Interrelationship between major physical parameters of sandstones. Neft Khas 1949, 12, 29–32. [Google Scholar]
- Adler, P.; Jacquin, C.; Quiblier, J. Flow in simulated porous media. Int. J. Multiph. Flow 1990, 16, 691–712. [Google Scholar] [CrossRef]
- Zhang, S.; Lu, P.; Cantrell, D.; Zaretskiy, Y.; Jobe, D.; Agar, S.M. Improved Quantification of the Porosity–Permeability Relationship of Limestones Using Petrographical Texture. Pet. Geosci. 2017, 24, 440–448. [Google Scholar] [CrossRef]
- Lucia, F.J. Rock-Fabric, Petrophysical Parameters, and Classification. Carbonate Reserv. Charact. 1999, 23–57. [Google Scholar] [CrossRef]
- Nelson, H.P. Permeability-porosity Relationships in Sedimentary Rocks. Society of Petrophysicists & Well Log Analysts. Log Anal. 1994, 35, 38–62. [Google Scholar]
- Leverett, M.C.; Lewis, W.B. Steady Flow of Gas-Oil-Water Mixtures through Unconsolidated Sands. Trans. AIME 1941, 142, 107–116. [Google Scholar] [CrossRef]
- Al-Ajmi, F.A.; Holditch, S.A. Permeability Estimation Using Hydraulic Flow Units in a Central Arabia Reservoir. In Proceedings of the SPE Annual Technical Conference and Exhibition, Dallas, TX, USA, 1–4 October 2000. [Google Scholar]
- Brooks, R.H.; Corey, A.T. Properties of porous media affecting fluid flow. J. Irrig. Drain. Div. 1966, 92, 61–90. [Google Scholar]
- Buckley, S.E.; Leverett, M.C. Mechanism of Fluid Displacement in Sands. Trans. AIME 1942, 146, 107–116. [Google Scholar] [CrossRef]


| Class | 1 | 2 | 3 | 4 | 5 | 6 | 7 | 8 | 9 | 10 |
|---|---|---|---|---|---|---|---|---|---|---|
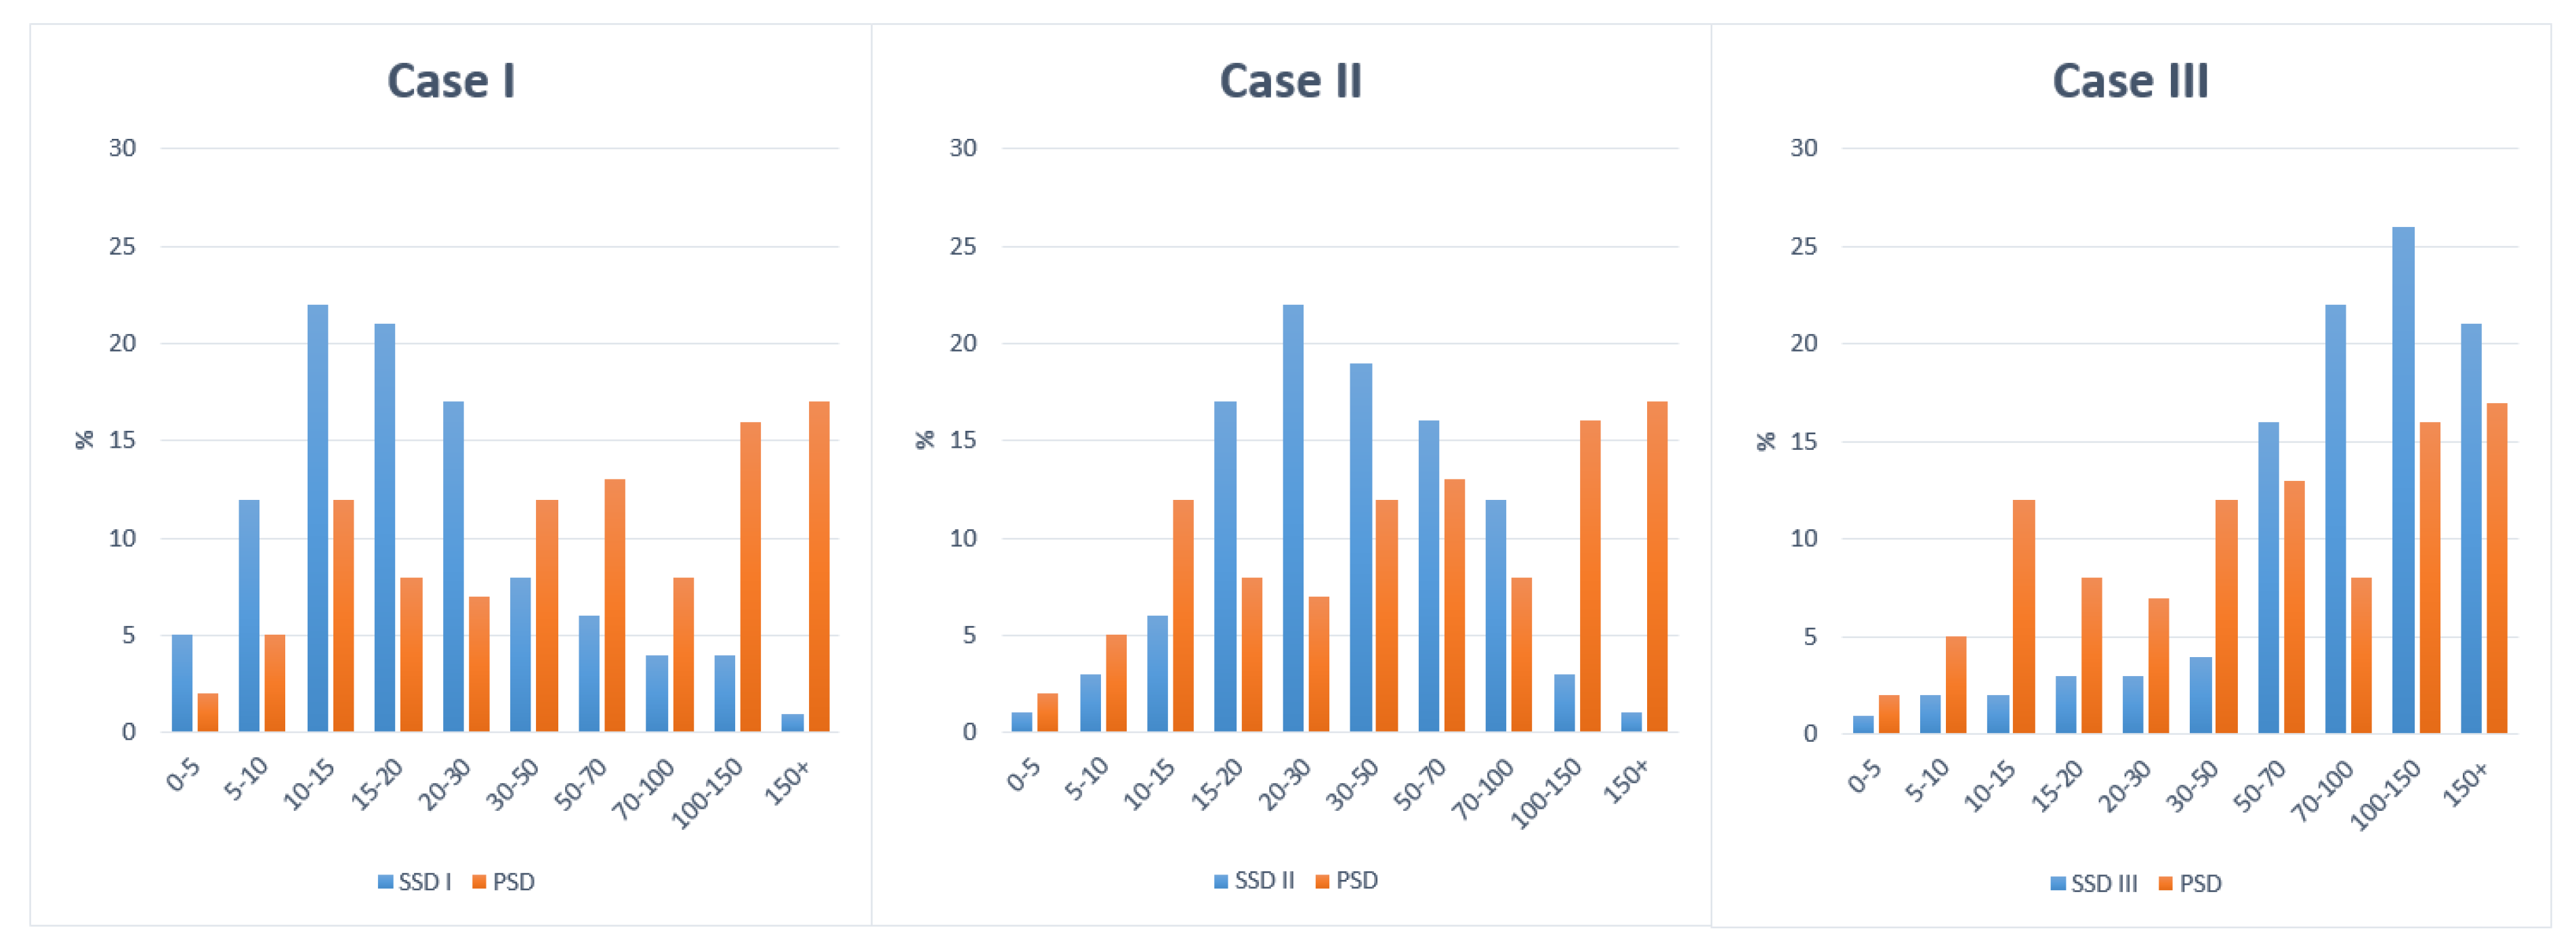
| Diameter range (µm) | 0–5 | 5–10 | 10–15 | 15–20 | 20–30 | 30–50 | 50–70 | 70–100 | 100–150 | 150+ |
| Pore size distribution (%) | dps1 | dps2 | dps3 | dps4 | dps5 | dps6 | dps7 | dps8 | dps9 | dps10 |
| Suspended solids distribution (%) | dss1 | dss2 | dss3 | dss4 | dss5 | dss6 | dss7 | dss8 | dss9 | dss10 |
| Impairment ratio (IR) | dss1/dps1 | dss2/dps2 | dss3/dps3 | dss4/dps4 | dss5/dps5 | dss6/dps6 | dss7/dps7 | dss8/dps8 | dss9/dps9 | dss10/dps10 |
| Class | Diameter Range (µm) | Reservoir | Case I | Case II | Case III | |||||||
|---|---|---|---|---|---|---|---|---|---|---|---|---|
| Pore Size Distribution (%) | Fractional Porosity | Suspended Solids Distribution (%) | IR | Porosity Decrease | Suspended Solids Distribution (%) | IR | Porosity Decrease | Suspended Solids Distribution (%) | IR | Porosity Decrease | ||
| 1 | 0–5 | 2 | 0.374 | 5 | 2.50 | 0.187 | 1 | 0.50 | 0.374 | 1 | 0.50 | 0.374 |
| 2 | 5–10 | 5 | 0.935 | 12 | 2.40 | 0.468 | 3 | 0.60 | 0.935 | 2 | 0.40 | 0.935 |
| 3 | 10–15 | 12 | 2.244 | 22 | 1.83 | 1.346 | 6 | 0.50 | 2.244 | 2 | 0.17 | 2.244 |
| 4 | 15–20 | 8 | 1.496 | 21 | 2.63 | 0.748 | 17 | 2.13 | 0.748 | 3 | 0.38 | 1.496 |
| 5 | 20–30 | 7 | 1.309 | 17 | 2.43 | 0.655 | 22 | 3.14 | 0.655 | 3 | 0.43 | 1.309 |
| 6 | 30–50 | 12 | 2.244 | 8 | 0.67 | 2.244 | 19 | 1.58 | 1.346 | 4 | 0.33 | 2.244 |
| 7 | 50–70 | 13 | 2.431 | 6 | 0.46 | 2.431 | 16 | 1.23 | 1.459 | 16 | 1.23 | 1.459 |
| 8 | 70–100 | 8 | 1.496 | 4 | 0.50 | 1.496 | 12 | 1.50 | 0.898 | 22 | 2.75 | 0.748 |
| 9 | 100–150 | 16 | 2.992 | 4 | 0.25 | 2.992 | 3 | 0.19 | 2.992 | 26 | 1.63 | 1.795 |
| 10 | 150+ | 17 | 3.179 | 1 | 0.06 | 3.179 | 1 | 0.06 | 3.179 | 21 | 1.24 | 1.907 |
| Total | 100 | 18.7 | 100 | 15.75 | 100 | 14.83 | 100 | 14.52 | ||||
| Reservoir | Case I | Case II | Case III | |
|---|---|---|---|---|
| ϕ | 18.70 | 15.75 | 14.83 | 14.51 |
| K | 335.32 | 147.19 | 110.46 | 99.57 |
| Reservoir | Case I | Case II | Case III | |||||
|---|---|---|---|---|---|---|---|---|
| Sw | Pc (bar) | J (Sw) | J (Sw) | Pc (bar) | J (Sw) | Pc (bar) | J (Sw) | Pc (bar) |
| 0.24 | 10.0869 | 12.2830 | 8.8115 | 7.2830 | 7.8656 | 6.5012 | 7.5493 | 6.2398 |
| 0.25 | 7.1809 | 8.7443 | 6.2730 | 5.1848 | 5.5996 | 4.6282 | 5.3744 | 4.4421 |
| 0.3 | 4.2000 | 5.1144 | 3.6689 | 3.0325 | 3.2751 | 2.7070 | 3.1434 | 2.5981 |
| 0.35 | 2.7000 | 3.2878 | 2.3586 | 1.9495 | 2.1054 | 1.7402 | 2.0208 | 1.6702 |
| 0.4 | 1.8200 | 2.2162 | 1.5899 | 1.3141 | 1.4192 | 1.1730 | 1.3621 | 1.1259 |
| 0.45 | 1.4500 | 1.7657 | 1.2667 | 1.0469 | 1.1307 | 0.9346 | 1.0852 | 0.8970 |
| 0.5 | 1.1914 | 1.4508 | 1.0408 | 0.8602 | 0.9290 | 0.7679 | 0.8917 | 0.7370 |
| 0.55 | 1.0200 | 1.2421 | 0.8910 | 0.7365 | 0.7954 | 0.6574 | 0.7634 | 0.6310 |
| 0.6 | 0.8500 | 1.0351 | 0.7425 | 0.6137 | 0.6628 | 0.5478 | 0.6362 | 0.5258 |
| 0.65 | 0.7300 | 0.8889 | 0.6377 | 0.5271 | 0.5692 | 0.4705 | 0.5464 | 0.4516 |
| 0.7 | 0.6000 | 0.7306 | 0.5241 | 0.4332 | 0.4679 | 0.3867 | 0.4491 | 0.3712 |
| 0.8 | 0.4600 | 0.5601 | 0.4018 | 0.3321 | 0.3587 | 0.2965 | 0.3443 | 0.2846 |
| 0.91 | 0.3532 | 0.4301 | 0.3086 | 0.2550 | 0.2754 | 0.2277 | 0.2644 | 0.2185 |
| RQI | RRQI | |
|---|---|---|
| Reservoir | 42.35 | 1 |
| Case I | 30.57 | 1.38 |
| Case II | 27.29 | 1.55 |
| Case III | 26.20 | 1.62 |
© 2020 by the authors. Licensee MDPI, Basel, Switzerland. This article is an open access article distributed under the terms and conditions of the Creative Commons Attribution (CC BY) license (http://creativecommons.org/licenses/by/4.0/).
Share and Cite
Nesic, S.; Zolotukhin, A.; Mitrovic, V.; Govedarica, D.; Davarpanah, A. An Analytical Model to Predict the Effects of Suspended Solids in Injected Water on the Oil Displacement Efficiency during Waterflooding. Processes 2020, 8, 659. https://doi.org/10.3390/pr8060659
Nesic S, Zolotukhin A, Mitrovic V, Govedarica D, Davarpanah A. An Analytical Model to Predict the Effects of Suspended Solids in Injected Water on the Oil Displacement Efficiency during Waterflooding. Processes. 2020; 8(6):659. https://doi.org/10.3390/pr8060659
Chicago/Turabian StyleNesic, Slavko, Anatoly Zolotukhin, Vladimir Mitrovic, Dragan Govedarica, and Afshin Davarpanah. 2020. "An Analytical Model to Predict the Effects of Suspended Solids in Injected Water on the Oil Displacement Efficiency during Waterflooding" Processes 8, no. 6: 659. https://doi.org/10.3390/pr8060659