EEG Self-Adjusting Data Analysis Based on Optimized Sampling for Robot Control


1
The Center for SCDM, NIT, Zhejiang University, Ningbo 315100, China
2
Ningbo Research Institute, Zhejiang University, Ningbo 315100, China
3
Depart of Electrical and Electronic Engineering, Xi’an Jiaotong-Liverpool University, Suzhou 215123, China
4
Research Institute of Extenics and Innovation Methods, Guangdong University of Technology, Guangzhou 510006, China
5
School of Software and Electrical Engineering, Swinburne University of Technology, PO Box 218, Hawthorn, Victoria 3122, Australia
*
Author to whom correspondence should be addressed.
Electronics 2020, 9(6), 925; https://doi.org/10.3390/electronics9060925
Submission received: 15 April 2020
/
Revised: 6 May 2020
/
Accepted: 24 May 2020
/
Published: 2 June 2020
(This article belongs to the Special Issue Smart Processing for Systems under Uncertainty or Perturbation)
Abstract
:Research on electroencephalography (EEG) signals and their data analysis have drawn much attention in recent years. Data mining techniques have been extensively applied as efficient solutions for non-invasive brain–computer interface (BCI) research. Previous research has indicated that human brains produce recognizable EEG signals associated with specific activities. This paper proposes an optimized data sampling model to identify the status of the human brain and further discover brain activity patterns. The sampling methods used in the proposed model include the segmented EEG graph using piecewise linear approximation (SEGPA) method, which incorporates optimized data sampling methods; and the EEG-based weighted network for EEG data analysis, which can be used for machinery control. The data sampling and segmentation techniques combine normal distribution approximation (NDA), Poisson distribution approximation (PDA), and related sampling methods. This research also proposes an efficient method for recognizing human thinking and brain signals with entropy-based frequent patterns (FPs). The obtained recognition system provides a foundation that could to be useful in machinery or robot control. The experimental results indicate that the NDA–PDA segments with less than 10% of the original data size can achieve 98% accuracy, as compared with original data sets. The FP method identifies more than 12 common patterns for EEG data analysis based on the optimized sampling methods.
1. Introduction
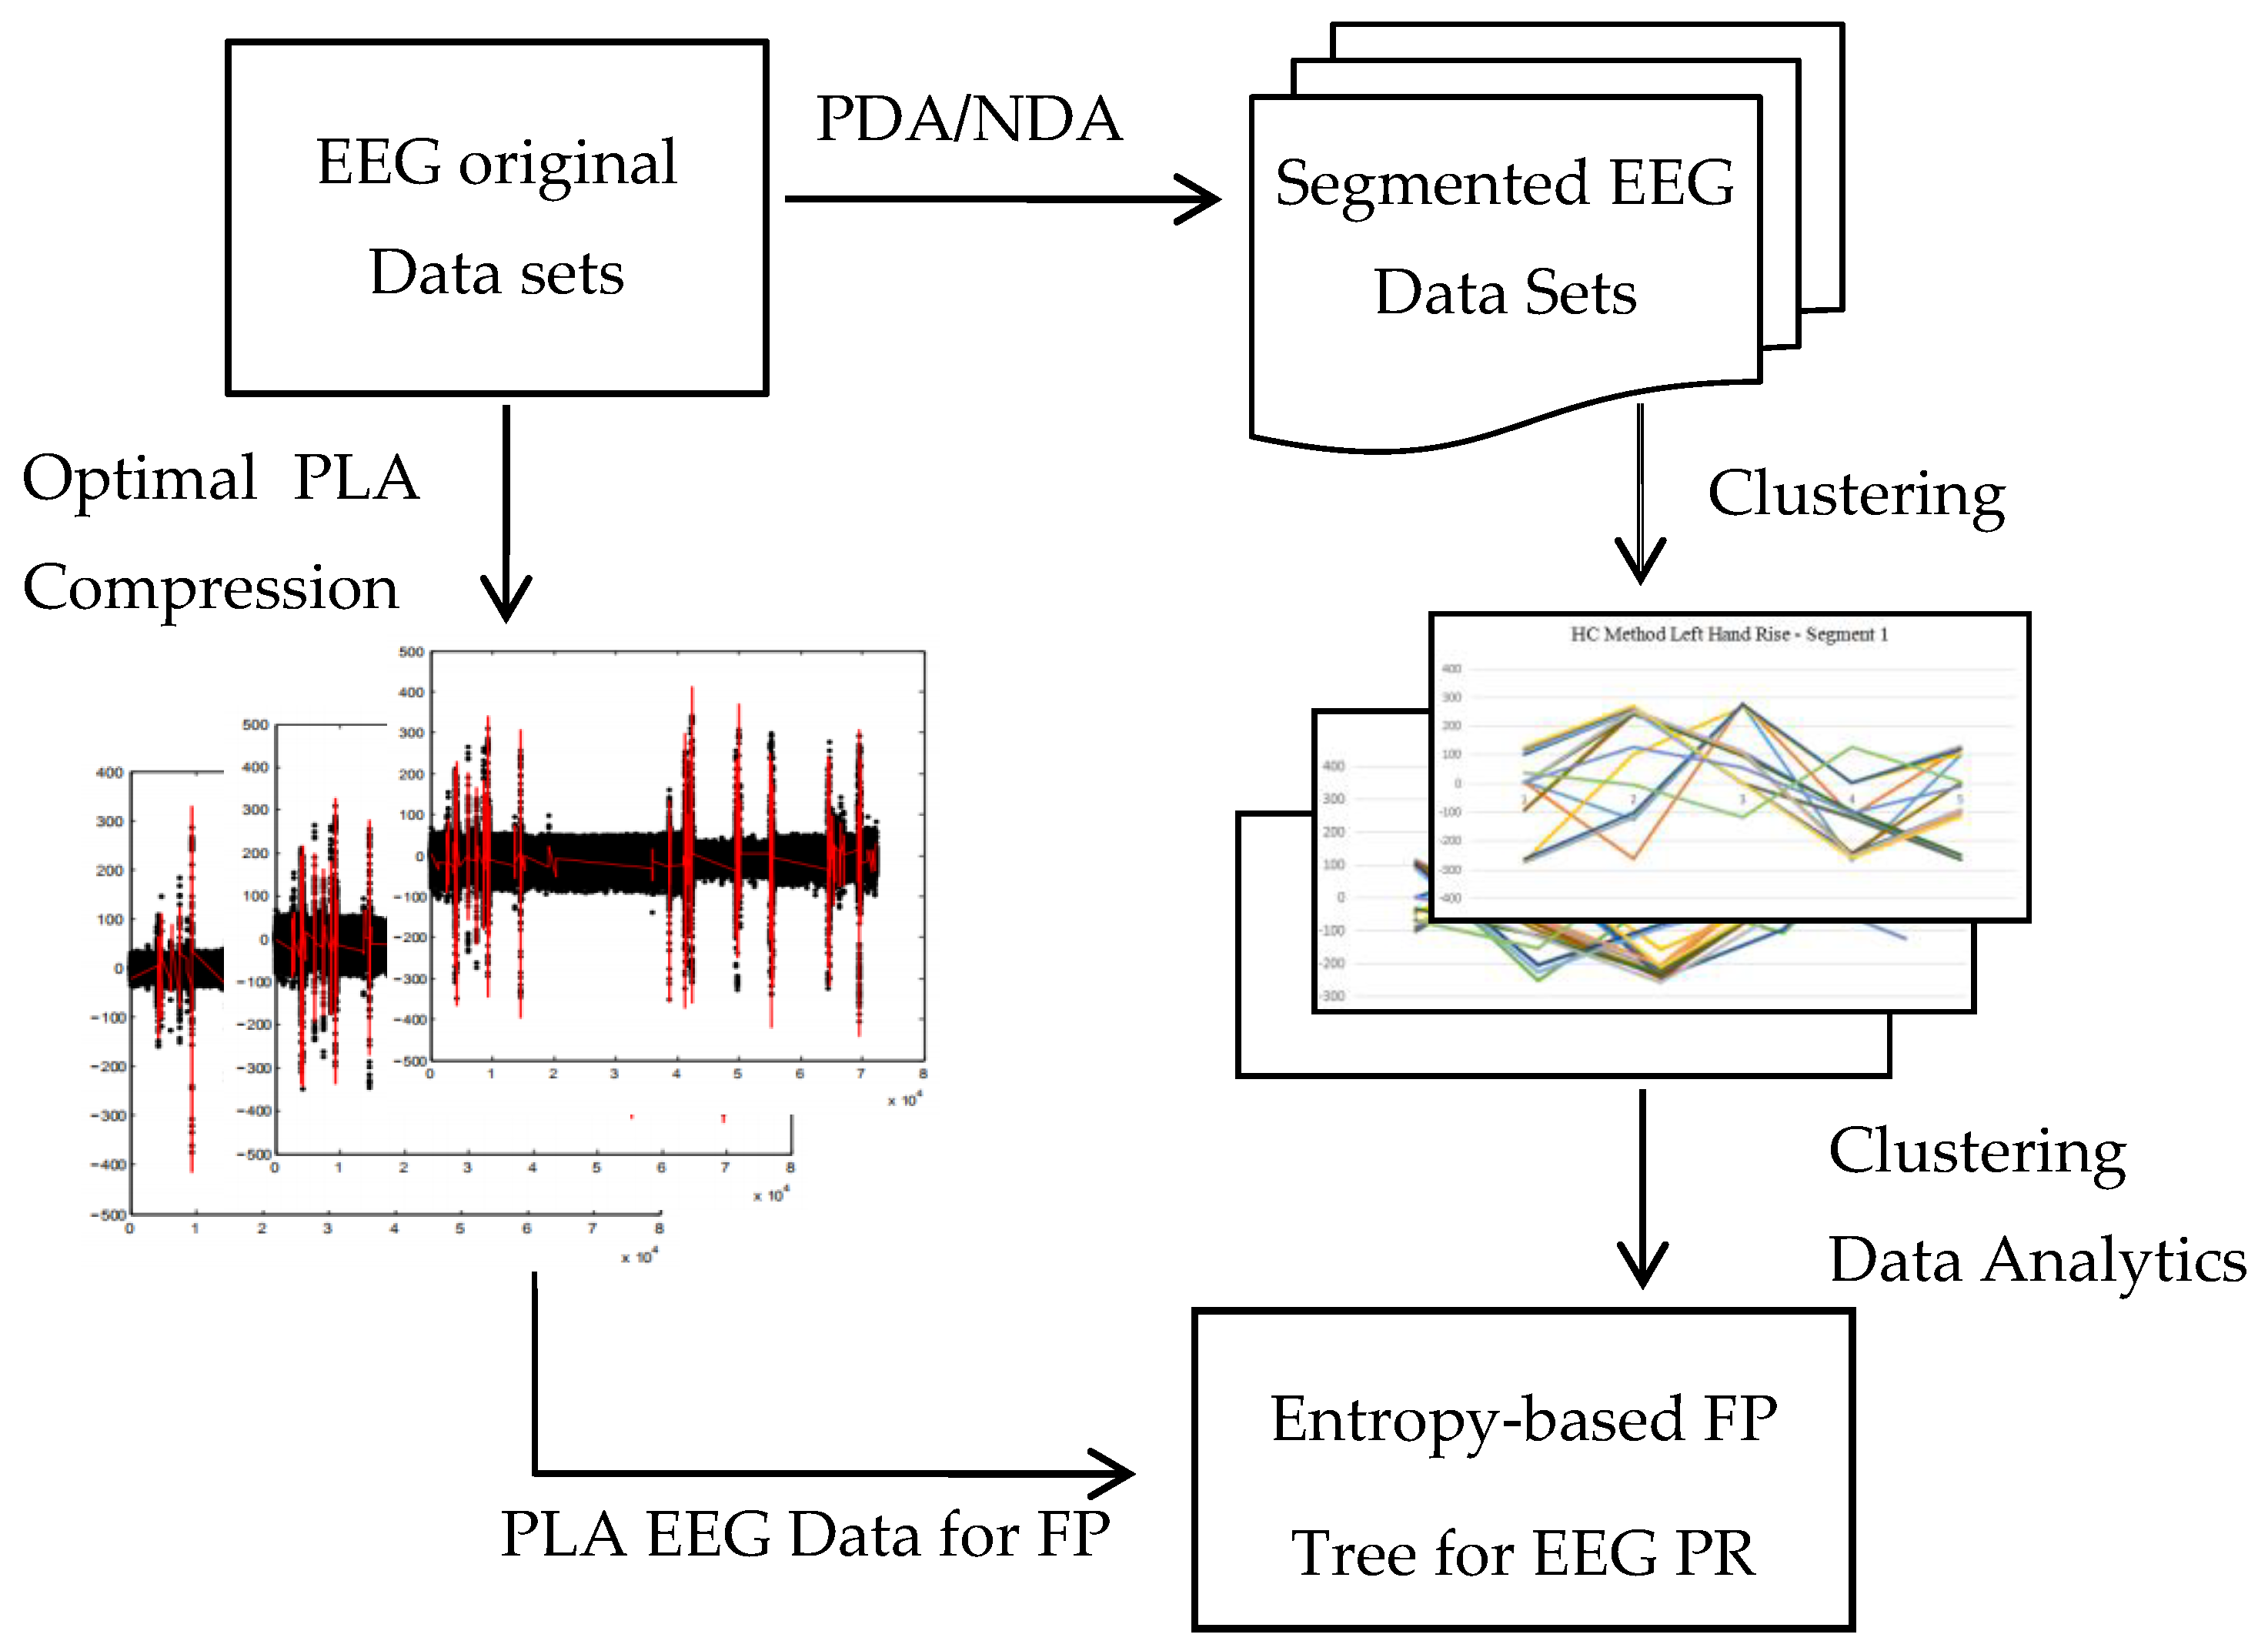
With the emerging requirements for automation and smart factories, research studies on electroencephalography (EEG)-based data analysis have been emphasized, including for the manipulation of robot control. EEG signals produce huge volumes of data from the collection devices for various thinking and meditation patterns. Ongoing research is faced with the challenges of recognizing and analyzing EEG data in real-time environments, particularly when the time response for EEG recognition is very short. Additionally, information recognition in real time is difficult for EEG data, since EEG data sets are relatively complex and have a multichannel structure. Here, optimized data sampling methods are considered to solve the problems of EEG data analysis through analyzing a fraction of an entire data set, which can improve the analytical performance. This research utilizes the optimal sampling methods based on the segmented EEG graph using piecewise linear approximation (SEGPA) model [1], which can be used for brain recognition.
When analyzing huge amounts of EEG data, the processing time would normally increase. Furthermore, it also cause difficulty for the real-time EEG signal applications to manipulators. Most of the current EEG analytical methods focus on obtaining signals with independent electrodes, whereby a lack of efficient correlation analysis can be seen between electrodes. Therefore, simplifying the EEG data sets and extracting sample EEG data from a large EEG data set are some of the effective solutions. In this paper, we introduce an optimal sampling method that incorporates normal distribution approximation (NDA) and Poisson distribution approximation (PDA). The sampling algorithm can effectively reduce the data size without losing important information.
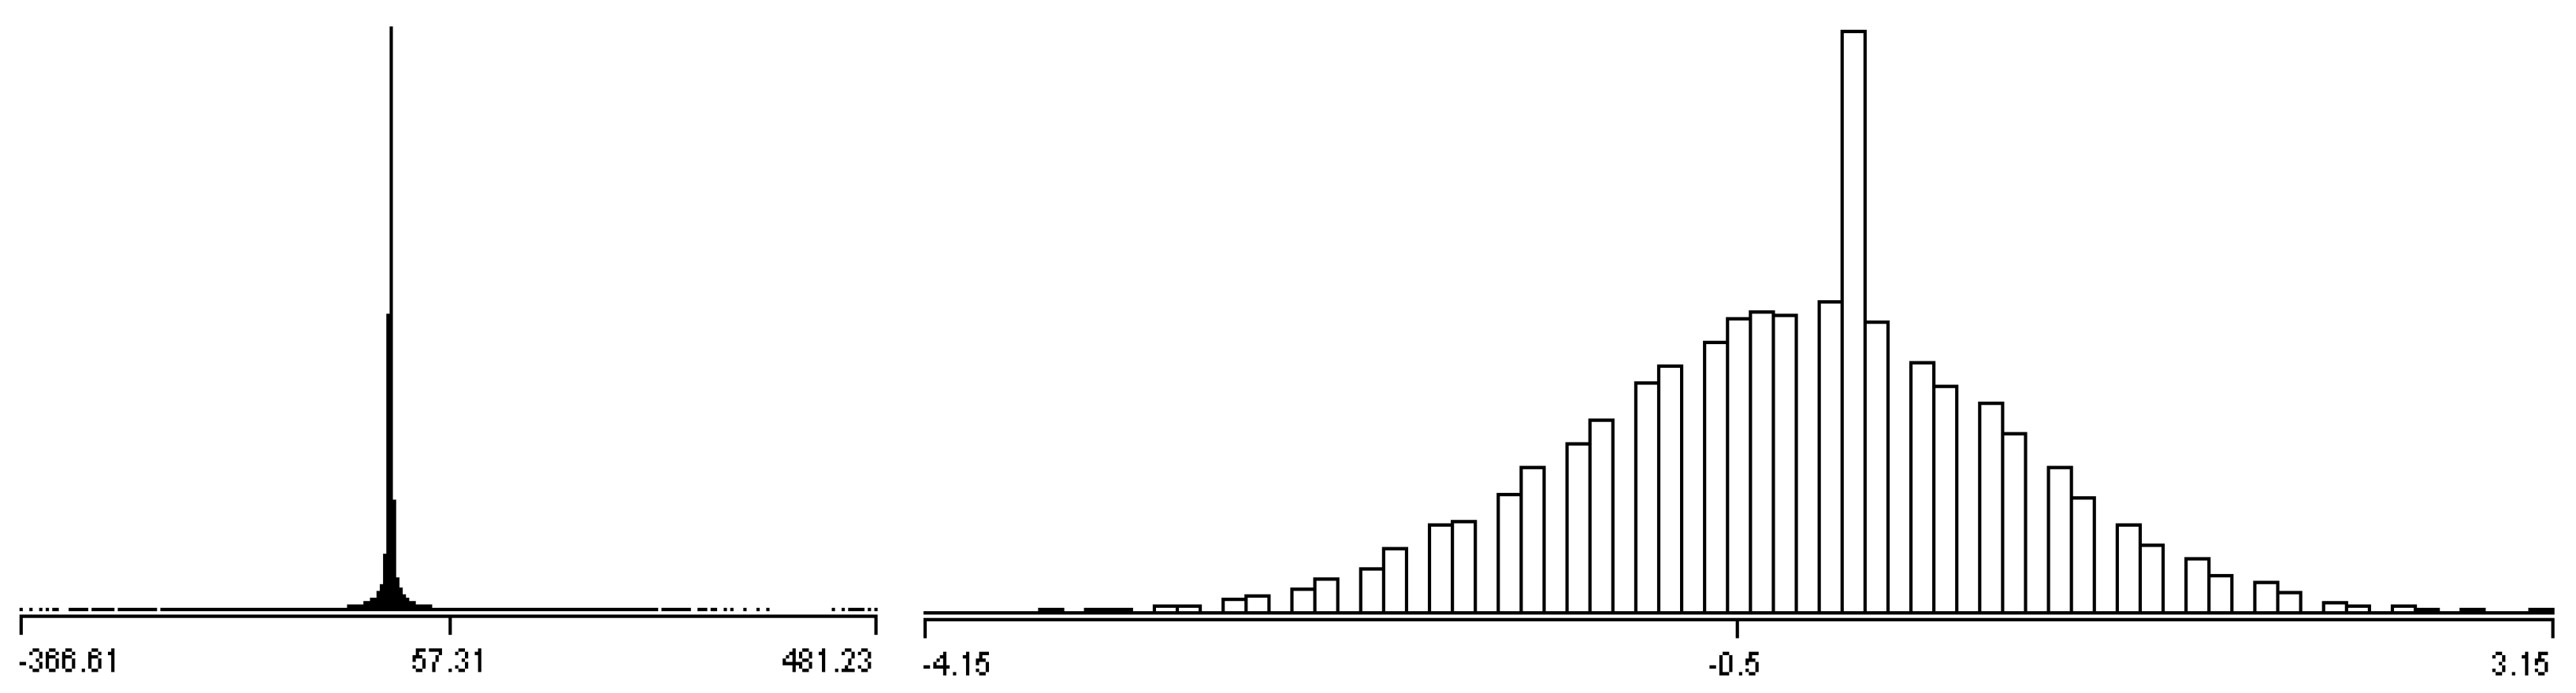
The current procedures for EEG data analysis consist of three major phases, which include EEG data pre-processing, feature extraction, and feature analysis and recognition [2]. The last two phases, EEG feature extraction and data analysis, are the most challenging procedures due to the discrete character and complexity of collected EEG data items. The experimental results obtained from this research, i.e. most of the EEG data satisfies NDA, are shown in Figure 1. Therefore, the NDA algorithm is the primary method used for the sampling processor. Nevertheless, EEG data sets can vary whenever experiment settings are different. In other words, the NDA algorithm may be utilized when experiments generate normal distribution data sets.
In order to carry out pre-processing, the SEGPA model is applied for EEG data analysis due to its superior performance in our previous work [3]. After pre-processing, feature extraction is carried out based on graphs, which are introduced in [1]. Specifically, the line segment generation gradients are used for the optimal piecewise linear approximation (PLA). The gradient of each processed line in an electrode can be categorized into several statuses, which will be used to generate a graph for EEG data analysis. In this paper, the data analysis phase emphasizes statistical comparison between two different EEG signal statuses by combining supervised data mining techniques. The graph-based SEGPA model is employed as a supplementary method.
This paper is organized as follows. The next section reviews the existing work carried out in the EEG signal analysis. Section 3 introduces the optimized sampling method for EEG data analysis, as well as NDA, PDA, and self-adjusting EEG data analyses. Section 4 provides the experimental results and analysis. The entropy-based frequent pattern (FP) tree method for EEG pattern is proposed to discriminate the pattern. Finally, conclusions and future research are included in Section 5.
2. Related Work
Several EEG-based data analysis methods have been introduced in previous work, such as the steady-state visual evoked potential (SSVEP) method and stepwise discriminant analysis [4]. The stepwise discriminant analysis procedure is described for categorical variables that can fulfill the demands for non-continuous data. SSVEP adopts common spatial patterns (CSP) method for noise filtering. CSP computes the normalized co-variance matrix of A derived from Equation (1) [5]:
where T denotes the transpose operator and tr(*) is the trace of a matrix. A∈RN×M represents a single-trial EEG data set, n is the number of channels, and M is the sample number for each channel. The co-variance matrix of each class is calculated as C1 and C2. The SSVEP method utilizes linear discriminant analysis (LDA) for classification.
The neuromuscular model was incorporated with the brain–computer interface; specifically, the following method was used to calculate the motion around the elbow joint [6]:
where Tmj (j = 1, 2) (1: flexor; 2: extensor) is the muscle torque generated by flexor and extensor muscles; Tn is the disturbance torque part; θ is the elbow joint angle; and θ0 is the reference angle of elbow joint stiffness. Here, m, l, and I are the mass, length, and moment of inertia of the musculoskeletal segment, while g is the gravitational acceleration; KB and Ks are the damping constant and joint stiffness constant. In this paper, the focus is placed on EEG data change in different intervals. Therefore, the signal filters are important in the EEG data collection phase but are not the essential analytical method in our proposed model. This section will provide a brief review of the existing EEG signal filters and the selection criteria for filters in the proposed model.
EEG signals are not strong signals, which in many cases can be interfered with during data collection processes. Thus, the filtering process is important for collecting accurate EEG data. Normally, collected EEG signals are linear continuous-time data containing high-frequency components that are affected by the collection process. Therefore, low pass filters such as Butterworth and Chebyshev filters as shown in Figure 2, which are suitable for EEG signal processing. The Butterworth filter has a maximal flat frequency response, while the Chebyshev filter has the best approximation to minimize the error between the idealized and actual filters [7]. The amplitude equation of Butterworth is represented in Equation (3):
Chebyshev filter (type I) is a common type filter. The amplitude response of Type I filter is expressed in Equation (4):
The selection of the filters in our experiments is based on the lab purposes. When the major focus of experiments is on investigating the dynamic relationship between electrodes, then the Butterworth filter is a good choice; in our case, the band pass setting was selected using Butterworth. The settings vary according to the experimental requirements.
One of the difficulties of EEG data analysis is real-time processing due to large volume of EEG data sets are produced within a short time. Therefore, data sampling techniques are deployed in EEG data pre-processing, meaning smaller data sets can be produced in a short period of time. Existing works have focused on reducing the data size for efficient data processing and analysis, such as dimensionality reduction, sampling, and lossless compression [1]. In order to get the characteristics from multi-channel EEG data, UV decomposition is a popular dimensionality reduction method due to its efficiency in reducing matrix-based multidimensional data sets, where U is of size m by k and V is of size n by k. Usually, UV decomposition can be used to decompose large matrices and tables into smaller columns and rows, which can be expressed as: A = UVT [9], where A is a matrix, the dimension of U are m by k, and the dimension of V are n by k. The columns of U and V are not necessarily orthogonal.
The stratified sampling is a method of variance reduction, whereby the Monte Carlo method is used to estimate population statistics from a known population [10]. The stratified sampling method divides the members of a population into homogeneous subgroups before sampling, as follows [11]:
where N denotes the size of the entire population, which should equal to the sum of all stratum sizes; Nh denotes the size of the stratum; nh is the number of observations in stratum h; L is the number of strata; σh is the sample standard deviation of stratum h; and µh denotes the sample mean of stratum h [12]. The advantages of the stratified sampling include: (a) smaller errors in estimation compared with the simple random sampling method when the strata measurements have a lower standard deviation; (b) easier management and more cost-effective compared with traditional random sampling methods; (c) estimated population parameters can ideally be given [10].
A systematic data sampling method was introduced in [13], which generates testing, validation, and training data sets based on the selection of every kth sample from a random starting point. However, this method incurs large time and memory resources, meaning it is usually not feasible for extensive data processing. Several data mining algorithms have been applied to data sampling processes (e.g., self-organizing maps, SOM). Various SOM applications have been used in fixed windows for online data clustering [14]. In [15], the quadratic classifiers are utilized in the presence of epileptiform activity in EEG signals in a reduced two-dimensional space.
The partitioned and sampled data sets extracted using the abovementioned methods cannot provide a simple solution for representation of the original data sets in most cases. Some existing methods are time consuming and others cannot offer integrity, since the characteristics and detailed information embedded in the original data sets are lost during partitioning or sampling.
In order to obtain results from rather short durations based on a large amount EEG data, the SEGPA model aims to largely reduce the quantity of EEG data; therefore, data compression and segmentation methods are introduced. Data compression methods are applied extensively in various areas, such as speech coding, video coding, and bio-informatics. Many existing compression methods have been introduced, including Lempel–Ziv (LZ) compression [16], the Deflate algorithm, discrete cosine transforms [17], fractal compression, and PLA [18].
3. Optimized Sampling Methods for EEG Recognition
The optimized sampling methods proposed in this paper are incorporated with NDA and PDA methods. The pre-processing step is required before the optimized sampling step. It involves data cleaning and probability distribution estimation in the initial step.
3.1. NDA Sampling Method
Normally, the data cleaning process is supervised and regulated manually by users. However, this process can be further extended so as to be unsupervised when data cleaning rules are applied to this process. Nevertheless, this is not the major concern in the proposed model. In the sampling process, an NDA set loosely follows a normal distribution, as shown in Figure 3.
The NDA converts data values by applying the ksdensity function in Matlab to generate a probability distribution. Therefore, an NDA data set needs to satisfy the following characteristics [9]:
- (a)
- The difference between the mean value of an NDA segment and the original mean value is smaller than 2∆, where ∆ is the user-defined acceptable distance between the segmented data set center and this value, which is considered as the identifier;
- (b)
- The NDA data sets follow the Chebyshev inequality rule in a certain way; that is, more than 89% of the data lay within 3σ [4];
- (c)
- A predefined m is assigned to determine the maximum tolerance for the differentiation between the data sets and n (µ,σ2), which lie out of the normal distribution curve and are called disqualified data items.
For instance, m = 0.3 means that the NDA set has 30% differentiation with standard normal distribution. If S [a, b] ⊆A [1, k], if x∈ [a, b] satisfies:
where mr is the adjusting parameter, then S [a, b] is an NDA set. The ND-based method derives the data values using the ksdensity function to generate a probability distribution [1].
3.2. PDA Sampling Method
The PDA sampling method employs two steps in the sampling process. First, large data items are partitioned into m segments. The PDA algorithm calculates the mean (λ) and standard deviation σ of each sample to evaluate the accuracy of PDA factions compared with the original large data set. The small adjusting data items (∆ size) can be merged into a sample fraction when differences of the mean (λ) and σ values between original data sets and extracted sample data sets are greater than the predefined threshold. The probability of events for the Poisson distribution is expressed in Equations (9) and (10).
The PDA model takes one of the calculated σ and λ values as λ × t. Suppose the original data set has σ, then the mean (λ) is the is the event rate. Mean (λ)−λ = ∆, then λ × t lies between mean (λ) and λ. With |y − λ × t| = a, a1/2 + a = ∆ is satisfied.
Next, the gamma function is applied in the PDA model to deal with real and complex numbers, which is expressed by Equation (11):
The ∆ parameter is employed to adjust the sizes of the sample data sets in order to get the closest λ and σ values. The ∆ parameter in PDA has the same function as in the NDA. The PDA model employs a PDA benchmark point selection method. In this algorithm, the additional data items are not merged (or split) as a segment ∆ size. Instead, the PDA benchmark point selection algorithm selects individual data points by comparing their λ and σ values with the original data sets and then determinate the merging or splitting segment, as shown in Algorithm 1.
| Algorithm 1. Poisson distribution approximation (PDA) Benchmark Point Selection |
| Input: D(k); //Original data sets with k data points; ∆; //is the acceptable threshold for upper-bound and lower-bound; Output: D(s) //Sample data sets;
|
3.3. An Optimal PLA
In previous work, the SEGPA model has been applied to the EEG data set compression process. This process utilizes the optimal PLA compression method [1]. PLA has been applied extensively in streaming time series data sets. PLA is one of the most commonly used representations for time series data [18]. The PLA algorithm produces a function g(x) that can represent a nonlinear objective function f(x) through incorporating extra binary or continuous variables to reformulate the original problem. In this paper, we mainly focus on EEG data sampling and pattern discovery.
The proposed optimal PLA algorithms improve the conventional PLA algorithms through generating maximal δ. The optimal PLA is O (n) time complexity for stream fragment S [1, n]. The optimal PLA simplifies the computation of slp [1, k] and slp [1, k] by using the increment and localization strategies in terms of slp [1, k] and slp [1, k], which can be expressed in the previous result in [19]:
3.4. Data Optimization Process in PDA
The data optimization process is an important step in the PDA data processing phase, specifically for EEG signal data to eliminate noise data for performance improvement. In a continuing EEG data stream, aggregating some similar data items whose value difference is limited to a small threshold can greatly improve the data processing efficiency. The optimization process enables the EEG data stream to be aggregated without causing inaccuracies in the EEG data within an interval. This method is able to improve the analytical efficiency without scarifying accuracy. In this paper, we incorporate the modified hierarchical clustering (HC)-based algorithm with the PLA, which generates fuzzy membership values [20] and allows overlapping of boundaries of intervals. Algorithm 2 shows the modified HC process, which smooths the data items within small interval times.
| Algorithm 2. Hierarchical Clustering (HC)-Based Data Optimization Algorithm |
| Input: N[i][j]; //N[i][j], j is the number of items in cluster i; D = 0;//D is the distance between a cluster and another one; AD = ∞//AD is the average variance of all the clusters; List_data(i)//List_data(i) is the segmented original data (fractal); Output: List_data(i); Cluster(N) //Outputting cluster array and number N;
|
3.5. Self-Adjusting EEG Data Analytical Method
The original EEG data sets are segmented using PDA and NDA sampling methods. In our experiments, most of the collected EEG data sets have a Poisson-like distribution shape. Therefore, the PDA sampling method becomes the main technology in the segmentation processing.
In conventional research, the PDA method has been incorporated with an optimized PLA method [3]. In this paper, we combine K-means clustering, the PDA sampling method, and the parallel piecewise linearization method, as K-means is the simplest and most efficient way to cluster EEG data items based on their band differences (distance) in nature, while PLA has been proven to be an efficient way to reduce massive EEG data items. The main goal of K-means clustering is to segment n observations into k (≤ n) clusters. The distance within each cluster is minimized, which can be expressed by Equation (13) [21]. The K-means algorithm begins with initial k centroids, which can be randomly generated or selected from the data set.
where μi is the mean of Si, Si denotes a clustering set, and x is a data item in Si.
The clustering analysis can produce data sets according to centroids, which normally represent the average value of a cluster. We compare the EEG data sets collected from different EEG statuses using the clustering methods to distinguish the differences between different statuses. The clustering analysis is the initial step in EEG pattern analysis. The value distribution for centroids generates electrode-recognizable and value-bound figures. An electrode-recognizable figures means that the recognizable electrode values of independent electrodes change under different activities.
Based on the data analysis results, we discovered that the segmented data sets are sophisticated and cannot efficiently generate comprehensive patterns in non-interactive EEG scenarios. In contrast, the EEG analytical results can be significantly improved in a dynamically interactive environment. The K-means clustering algorithm produces centroid values that indicate the possible status of EEG data sets by taking the interacting status into consideration.
The left side of Figure 4 is the static status of a robotic arm, while the right side shows that the robotic arm moves gradually from T1 to T3. The data analysis and recognition process for the right side interacts with the status of the robotic arm and performs the adjustment during the recognition and analysis. The K-means-generated centroids provide the central movement indication for EEG data analysis, as shown in Table 1.
Based on the collected EEG data sets, we suggested that the analytical and model recognition processes should take the status and environment changes into consideration. Therefore, we introduced the self-adjusting recognition process, which takes different statuses and the data changes into consideration. The first step of the self-adjusting analytical and recognition process is to create a number of brain activity statuses. In this paper, we provide five different brain activity statuses: left-hand rise, right-hand rise, meditation, left-hand rise meditation, and right-hand rise meditation.
The EEG experimental data sets are collected based on these five statuses. The second step in the analytical process is the application of the PDA method to the analytical process to generate segments in a short time frame, which can represent comprehensive data distribution over a relatively long period of time. In the third step, we utilizes the PLA algorithm and HC algorithm to analyze the different statuses and find patterns, in order to take the environmental changes into consideration. Experimental results of the analysis will be carried out in the next section. The following properties are observed from the EEG analysis:
- (1)
- Based on different EEG statuses (e.g., right-hand rise, meditation, and others), cluster centroids are clearly bound in certain ranges;
- (2)
- Several electrodes exhibit significant value changes in different statuses;
- (3)
- The changes of EEG statuses affect the movement of cluster centroids. In other words, the movement of cluster centroids reflects the EEG statuses associated with the corresponding behavior.
The above properties can be used for the recognition or analysis of potential EEG patterns. Hence, the recognition process will take the previous status into consideration. In the current stage, we can manually assign an initial value to EEG data sets, such as hand rising (value R) or starting (value S).
The self-adjusting process compares the current data set with previous data sets to understand the status of EEG activities. For instance, a continuing hand-rising EEG activity will have continuing or consistent R values in the current and previous EEG data segments extracted based on PDA and NDA methods. The self-adjusting process incorporates PDA and NDA segmentation, PLA compression, clustering methods, and time-frequency measurement. Figure 5 shows the EEG self-adjusting analytical process.
The cluster centroid with the highest entropy is selected as the first node and added to the modified entropy-based frequent pattern (FP) tree. The SEGPA model calculates the entropy for each cluster independently. The cluster centroids based on the left-hand rise EEG file are listed in Table 2. The clusters in Table 2 show the total number of EEG data items in a NDA segment. For instance, 170 EEG data items in cluster 0 are clustered into a cluster, where 0–257.3 is the average EEG voltage value of cluster 0.
The entropy-based FP tree of the EEG clusters is calculated based on information theory, which is expressed in Equation (14):
In the SEGPA model, we assume each cluster has an independent probability; therefore, the above equation can be simplified as:
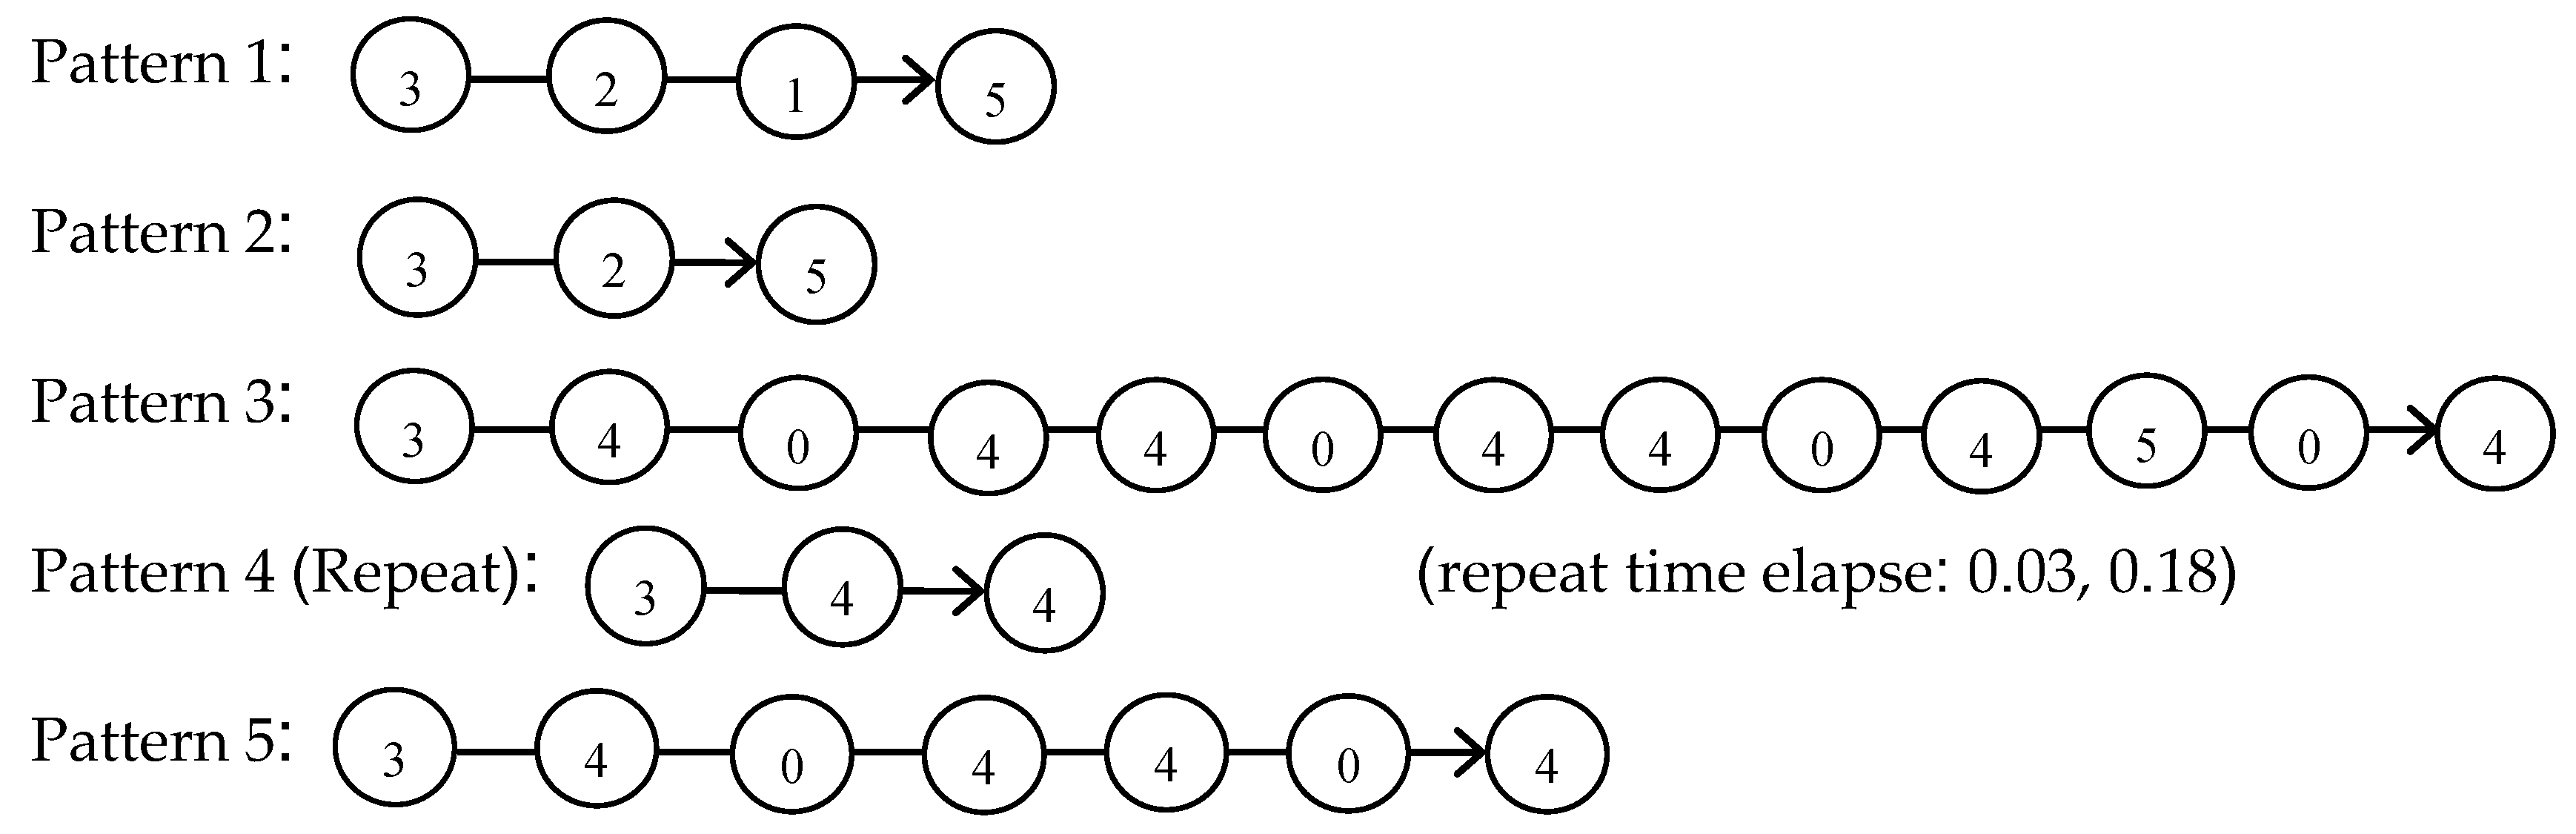
where Xc denotes the information entropy of a cluster, C denotes the number of instances in the Xc cluster, and p denotes the total number of EEG instances. Therefore, the entropy of cluster 3 shown in Table 2 is calculated as 6.6553, which is the highest among all 6 clusters. Therefore, the time series EEG data set can be converted into an entropy-based FP tree in Figure 6.
The preliminary EEG time-series-related cluster association graphs are derived according to the entropy-base FP tree, which can be further utilized for EEG pattern recognition. The derived EEG patterns based on time series clusters are shown in the next section. Figure 6 shows the time elapsed between two identical patterns (state). To analyze and predict the EEG status change, the autoregressive integrated moving average (ARIMA) is adopted, which is expressed as follows:
where p is is the total number of lagged observations necessary to initialize the autoregressive component of the error model, q is the total number of lagged innovations necessary to initialize the moving average component of the model, d is the non-negative integer indicating the non-seasonal integration degree of the error model, and L is the lag operator. Auto Regressive Integrated Moving Average (ARIMA) can be incorporated into the clustering process to correct the EEG pattern identification.
4. Experimental Results and Analysis
In order to verify the efficiency of the proposed method, a set of experiments were carried out. The EEG devices (CONTEC KT88 and EEG caps) were approved by ISO9001, ISO13485 quality management system certification, and ISO14001 environmental management system certification. The experimental procedures follow the basic guidelines released by the Cognition and Language group at the University of Nottingham. The experimental conditions are listed below. The PLA experiments were conducted with an Intel Core i7-5500U 2.4 GHZ, 12G RAM, Windows 8 64-bit OS. The tolerance was 5% for the PLA compression threshold:
- (1)
- The EEG recording time interval was 0.01s and CONTEC KT88 was used in this research. The environment for the operation of CONTEC KT88 was: Windows 8 64-bit OS, Intel N3540 CPU, 4 G RAM. More than 20 participants were involved in the experiments and approximately 3 million EEG data items were processed;
- (2)
- The cluster number parameter settings were: the K-means clustering algorithm was utilized in the experiments and the cluster number was set to 5, since we discovered that five clusters can produce the most explicit distance and clear segments for cluster analysis. Therefore, we selected cluster number to 5;
- (3)
- The PDA segmentation parameter settings were: split numbers = 12, threshold = 5%, max percentage = 10%, K = 10. The threshold value was considered for PDA segmentation. For instance, threshold = 5% means a 5% tolerance is given, so that the μ or σ in the target segment should equal the μ or σ values of the overall data. If the target segment does not satisfy 5% tolerance compared with the original data set, then this target segment should be ignored. A new target segment sequentially following the discarded segment is considered until the 5% tolerance reached.
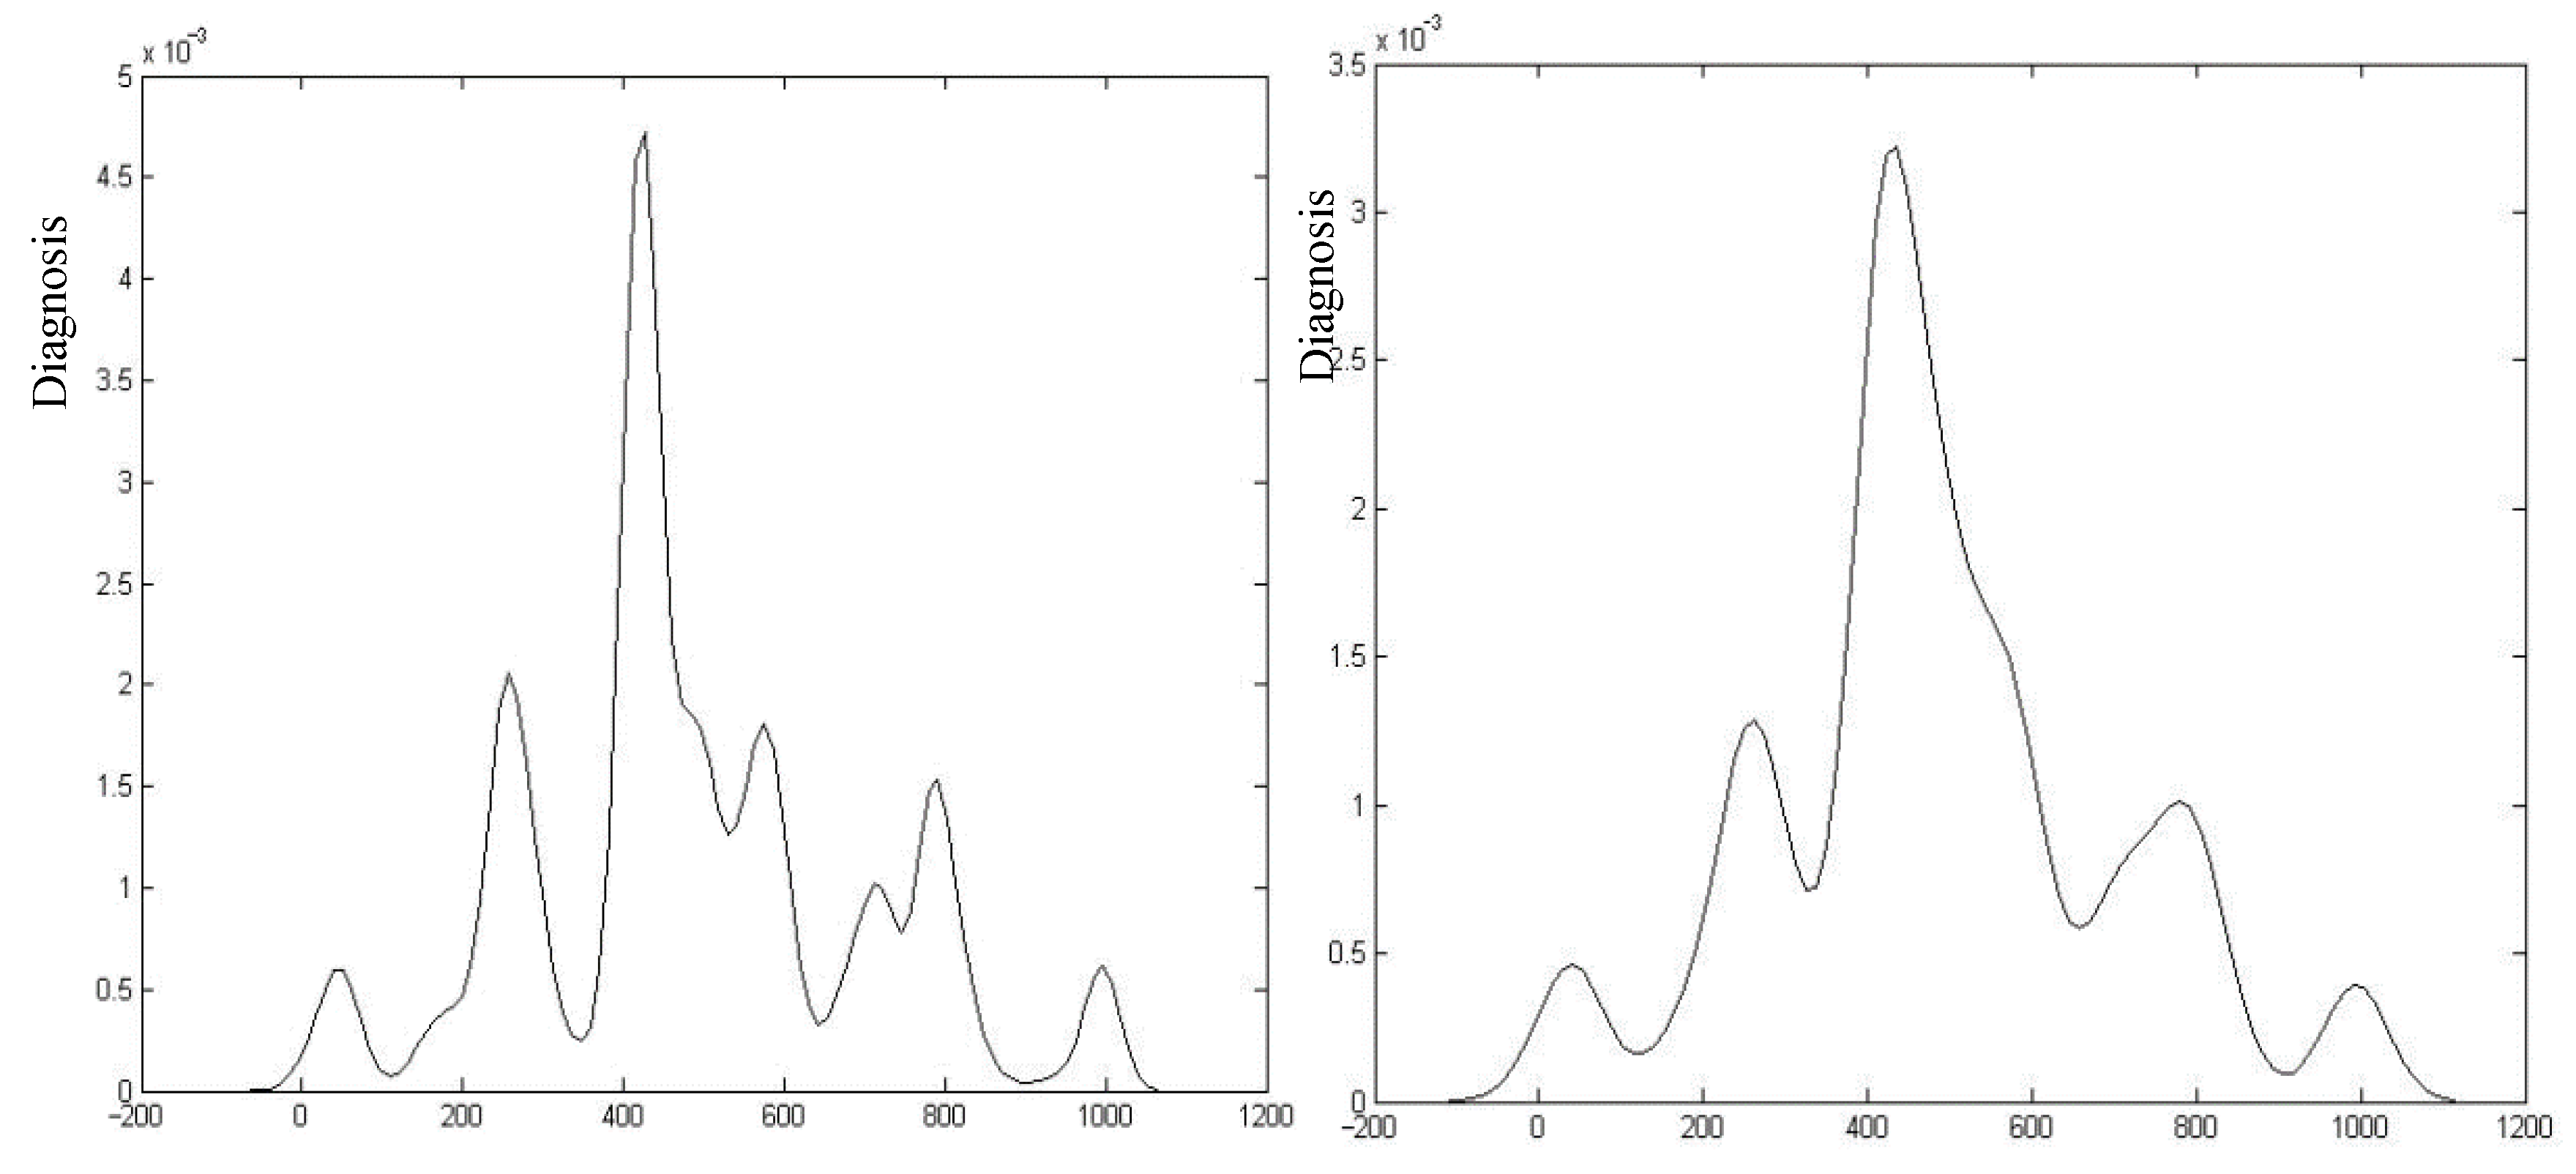
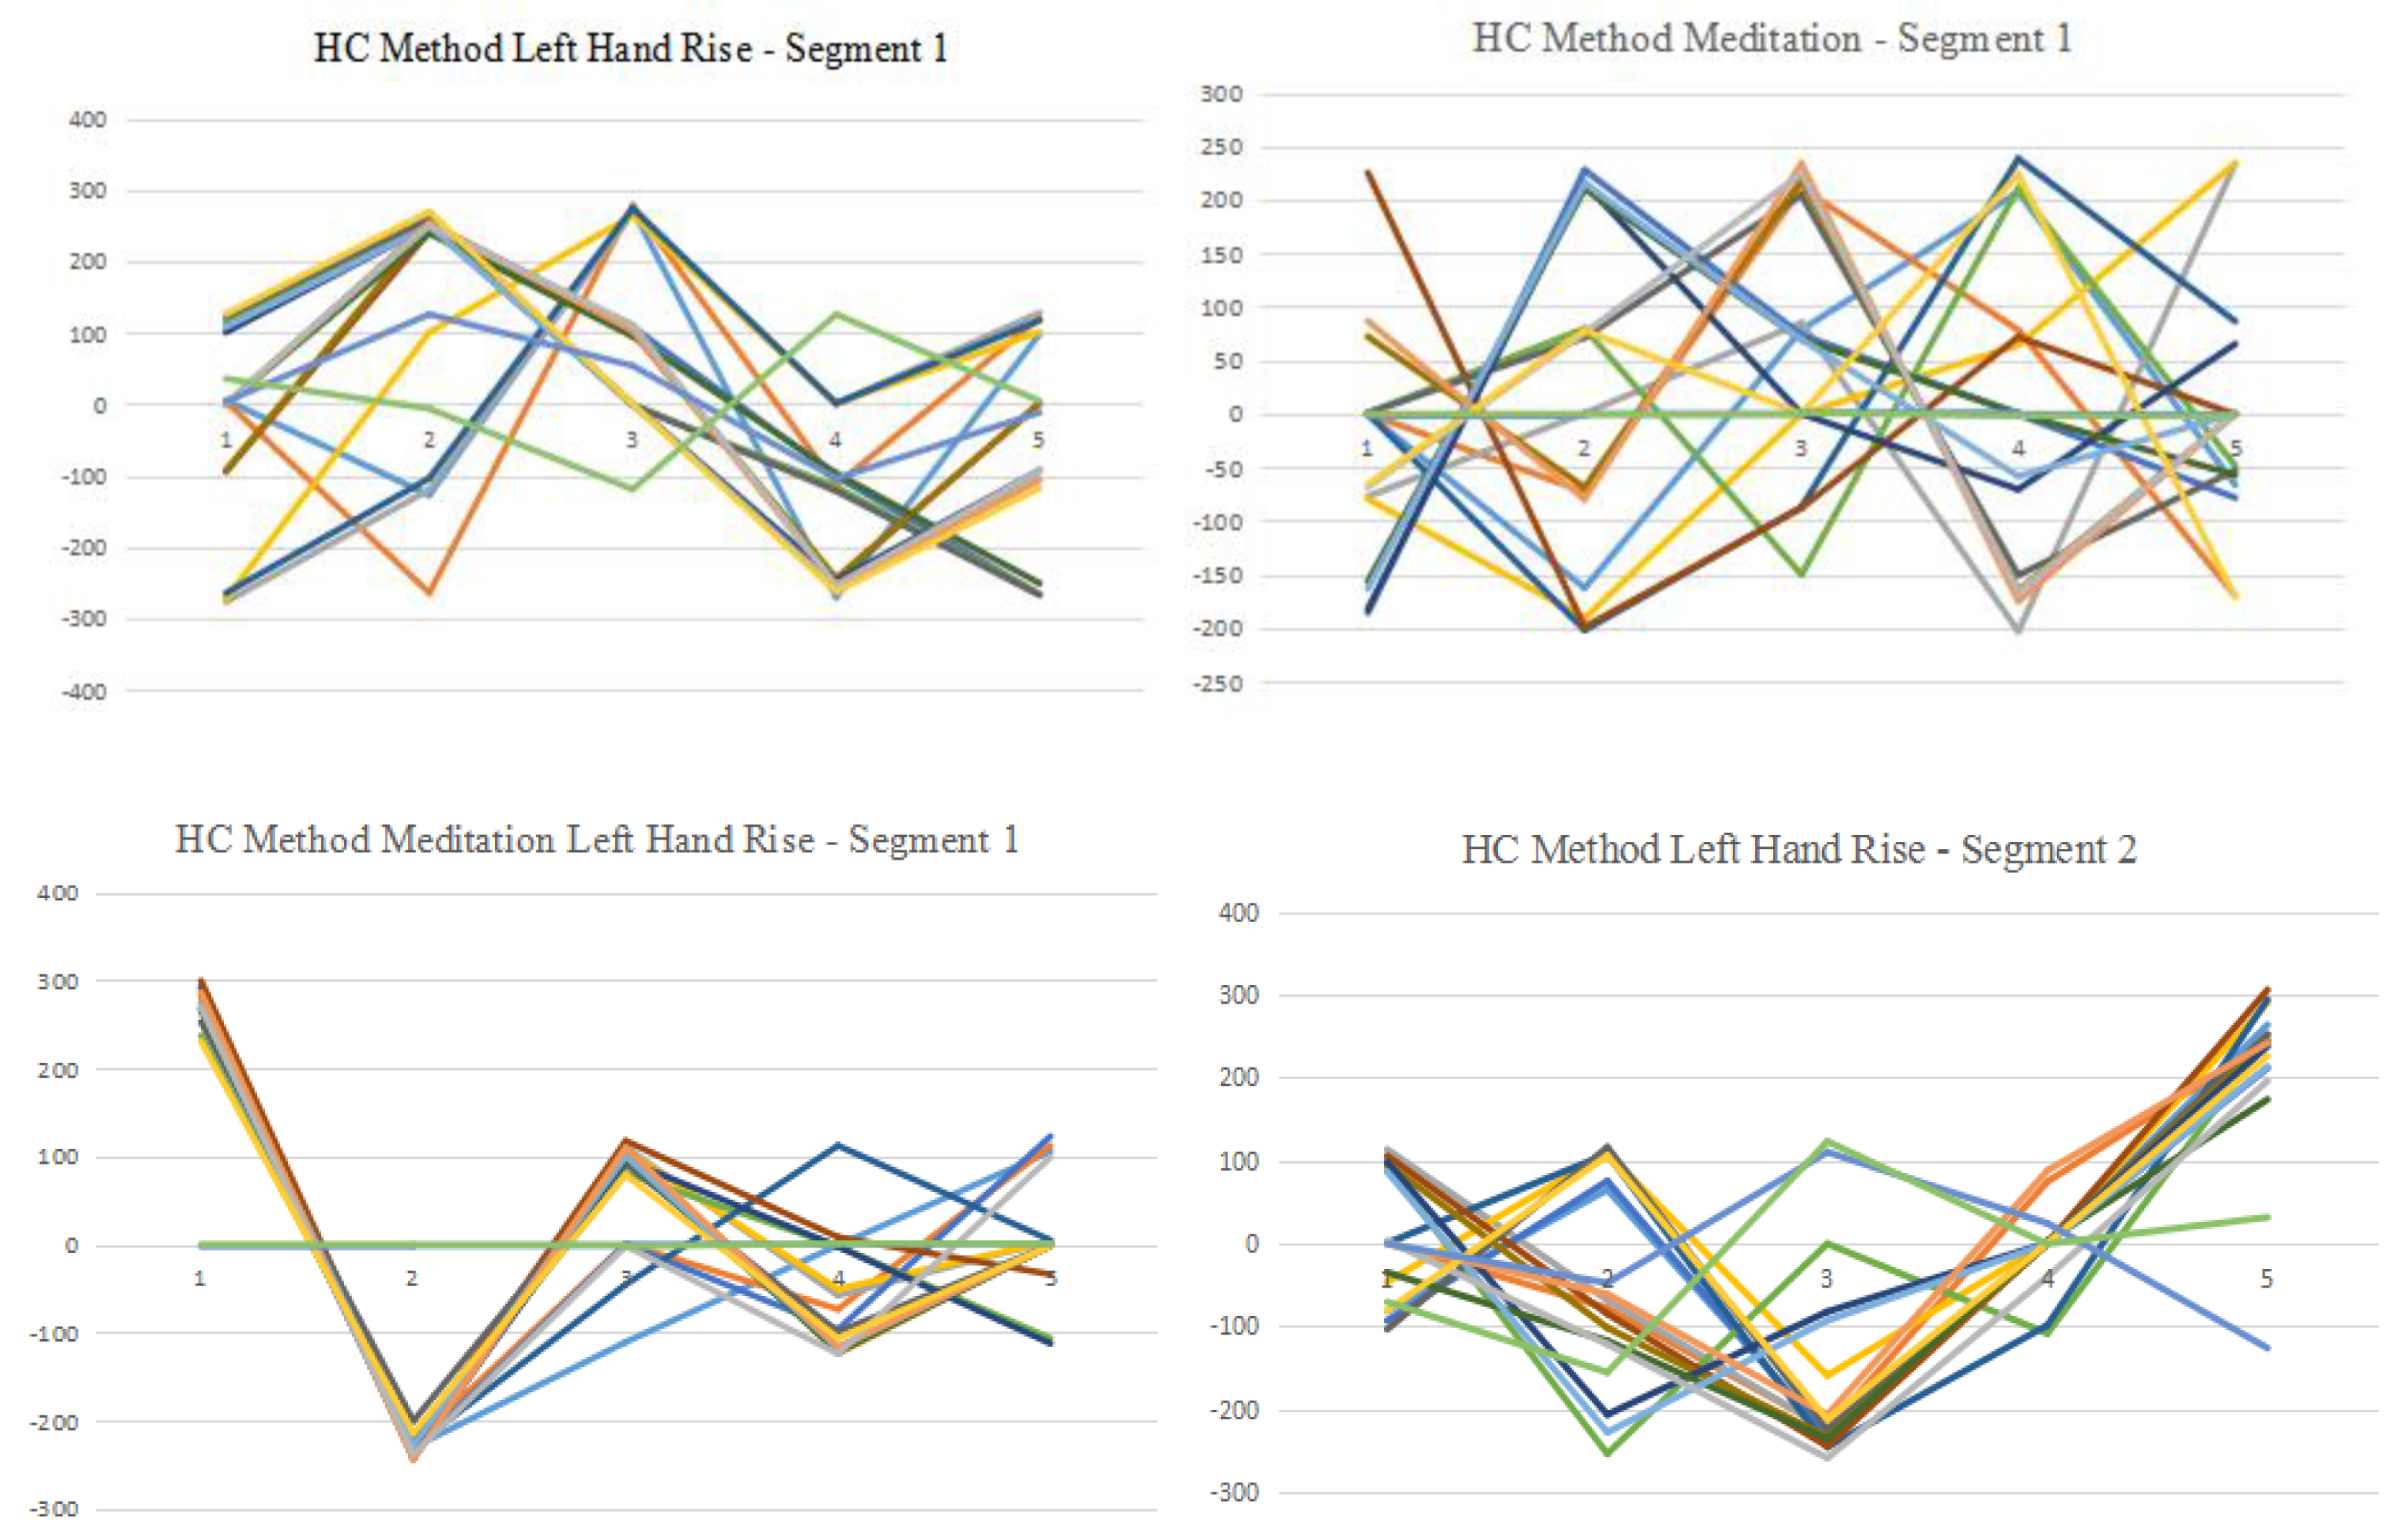
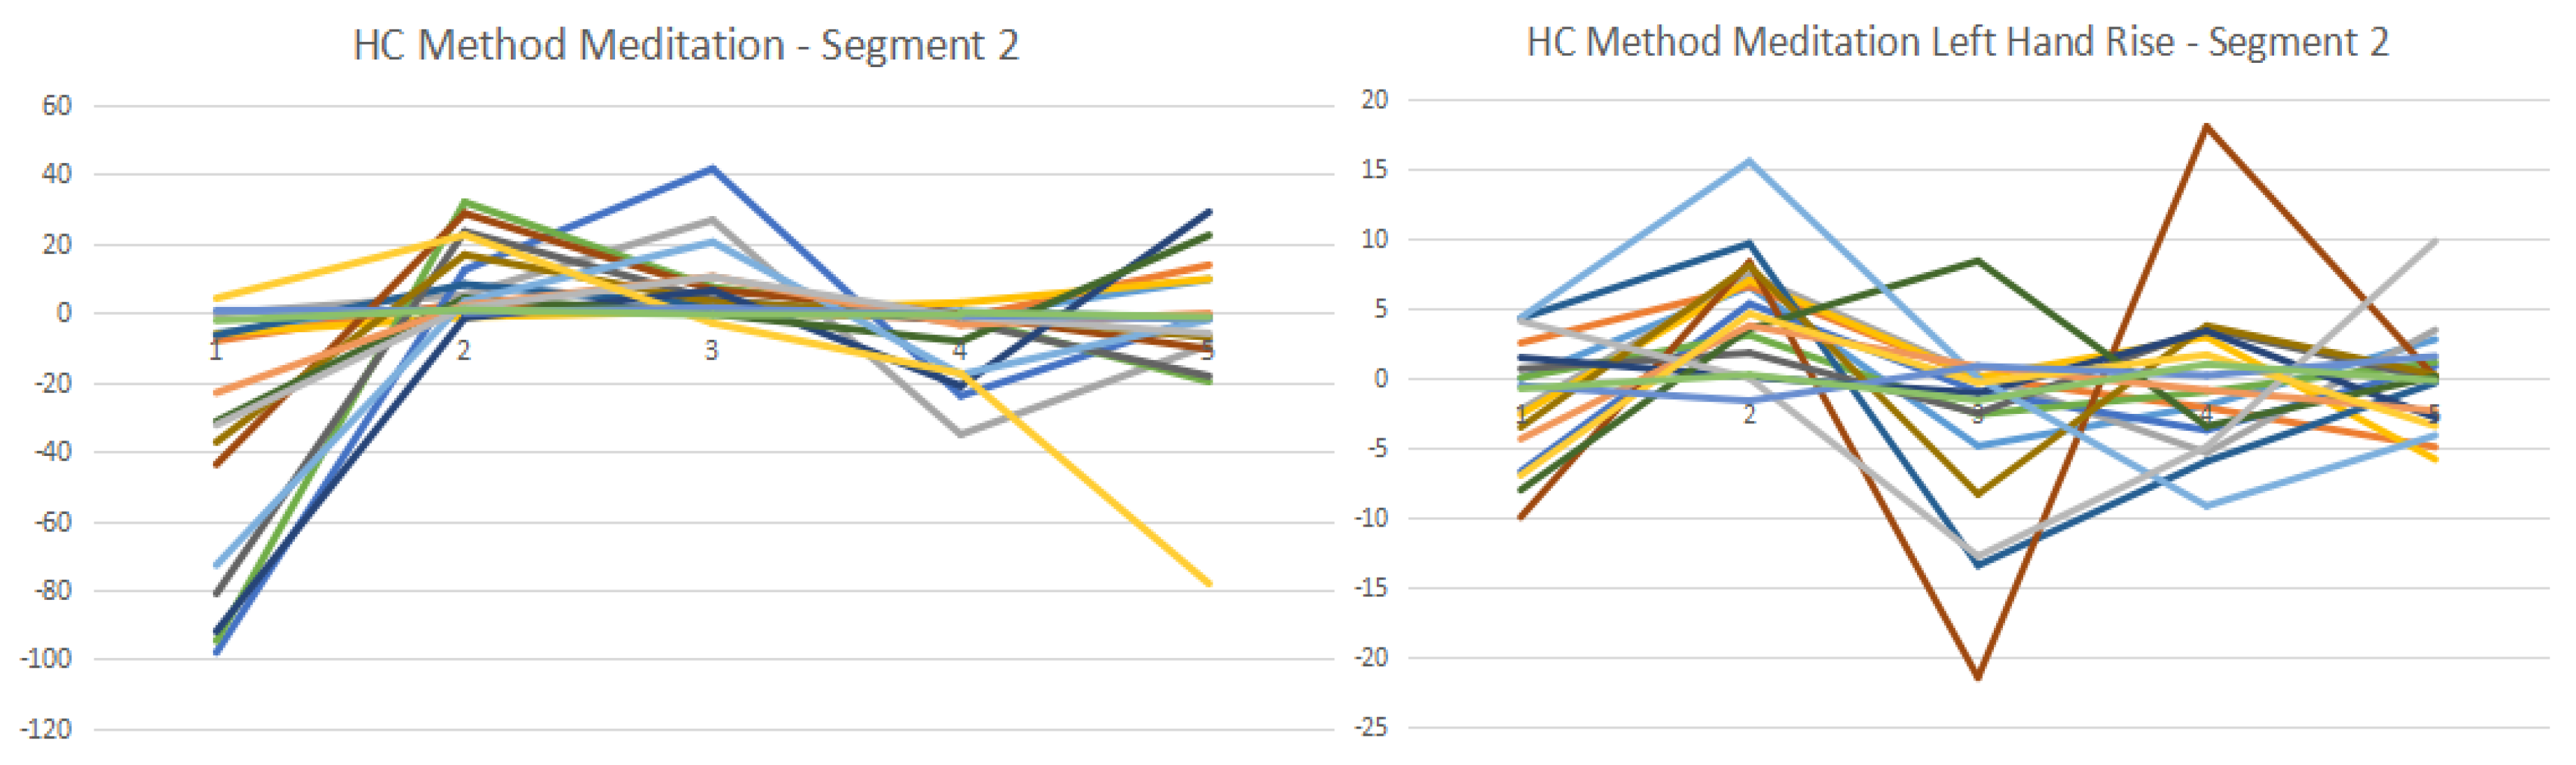
The experimental results are illustrated in Figure 7 and Figure 8. In the EEG data processing stage, the optimal PLA method adopted in this paper generated a number of segmented EEG data sets. These EEG data sets are further clustered using K-means method, which can produce potentially measurable results for downstream pattern recognition processes, such as the entropy-based FP tree generation. Figure 7 and Figure 8 demonstrate the clustering results based on 5 centroids.
In Figure 7, we discovered that EEG data items are more likely to disperse in meditation experiments, as shown in the “HC method meditation segment 1” diagram. In the “meditating hand rising” experiments, the data item distribution was less scattered compared with the meditation only experiments.
The segmentation process of the SEGPA model can efficiently produce segments that have very little variation from the original data set. The experimental results show that the variation of σ is approximately 1.79% of the original data; while the μ variation is around 0.315% of the original data. In other words, the segmented EEG data item can achieve more than 98% accuracy in terms of σ and 99.7% of accuracy in terms of μ based on the NDA method. This reflects the accuracy and efficiency of the proposal model. We further investigate the PDA segmentation method. The experimental results indicate that PDA segmentation can provide equally efficient and accurate outcomes as the NDA method. The results are shown in Table 3 [23]:
The similarity ratios between the original data sets and sample data containing 1250 items were: μ = 99.43%, σ = 99.9%, λ = 99.79%. We further compared the ratios between the original data and sample data containing 1000 items, the results of which were: μ = 99.48%, σ = 99.82%, λ = 99.87%. It was clear that the PDA-based data segments had very high similarity ratios. This reflects the efficiency of the SEGPA model, which incorporates both NDA and PDA segmentation methods.
Based on Figure 7 and Figure 8, we can observe that electron 7 (blue line, in 7th line position from top-left corner of Figure 7) has a significant trend indication for both segments for the left-hand rise status, which could be a major indication of EEG patterns. Electron 16 has a significant trend indication for both segments for the meditation status. Electron 8 has a significant trend indication for both segments in for the left-hand meditation status. According to the clustering results, we generated the entropy-based FP tree, as shown in Figure 9 and Figure 10, which is derived based on the data in Table 4.
In Figure 9 and Figure 10, there are 12 patterns identified based on the left-hand rise experiment for the specific participant. These patterns can be used to identify the statuses of the EEG, which are associated with the corresponding actions within the same time frame. Some of those 12 patterns were repeated several times, which can be identified as basic patterns or important patterns (with more weight). Future work will continue on this issue.
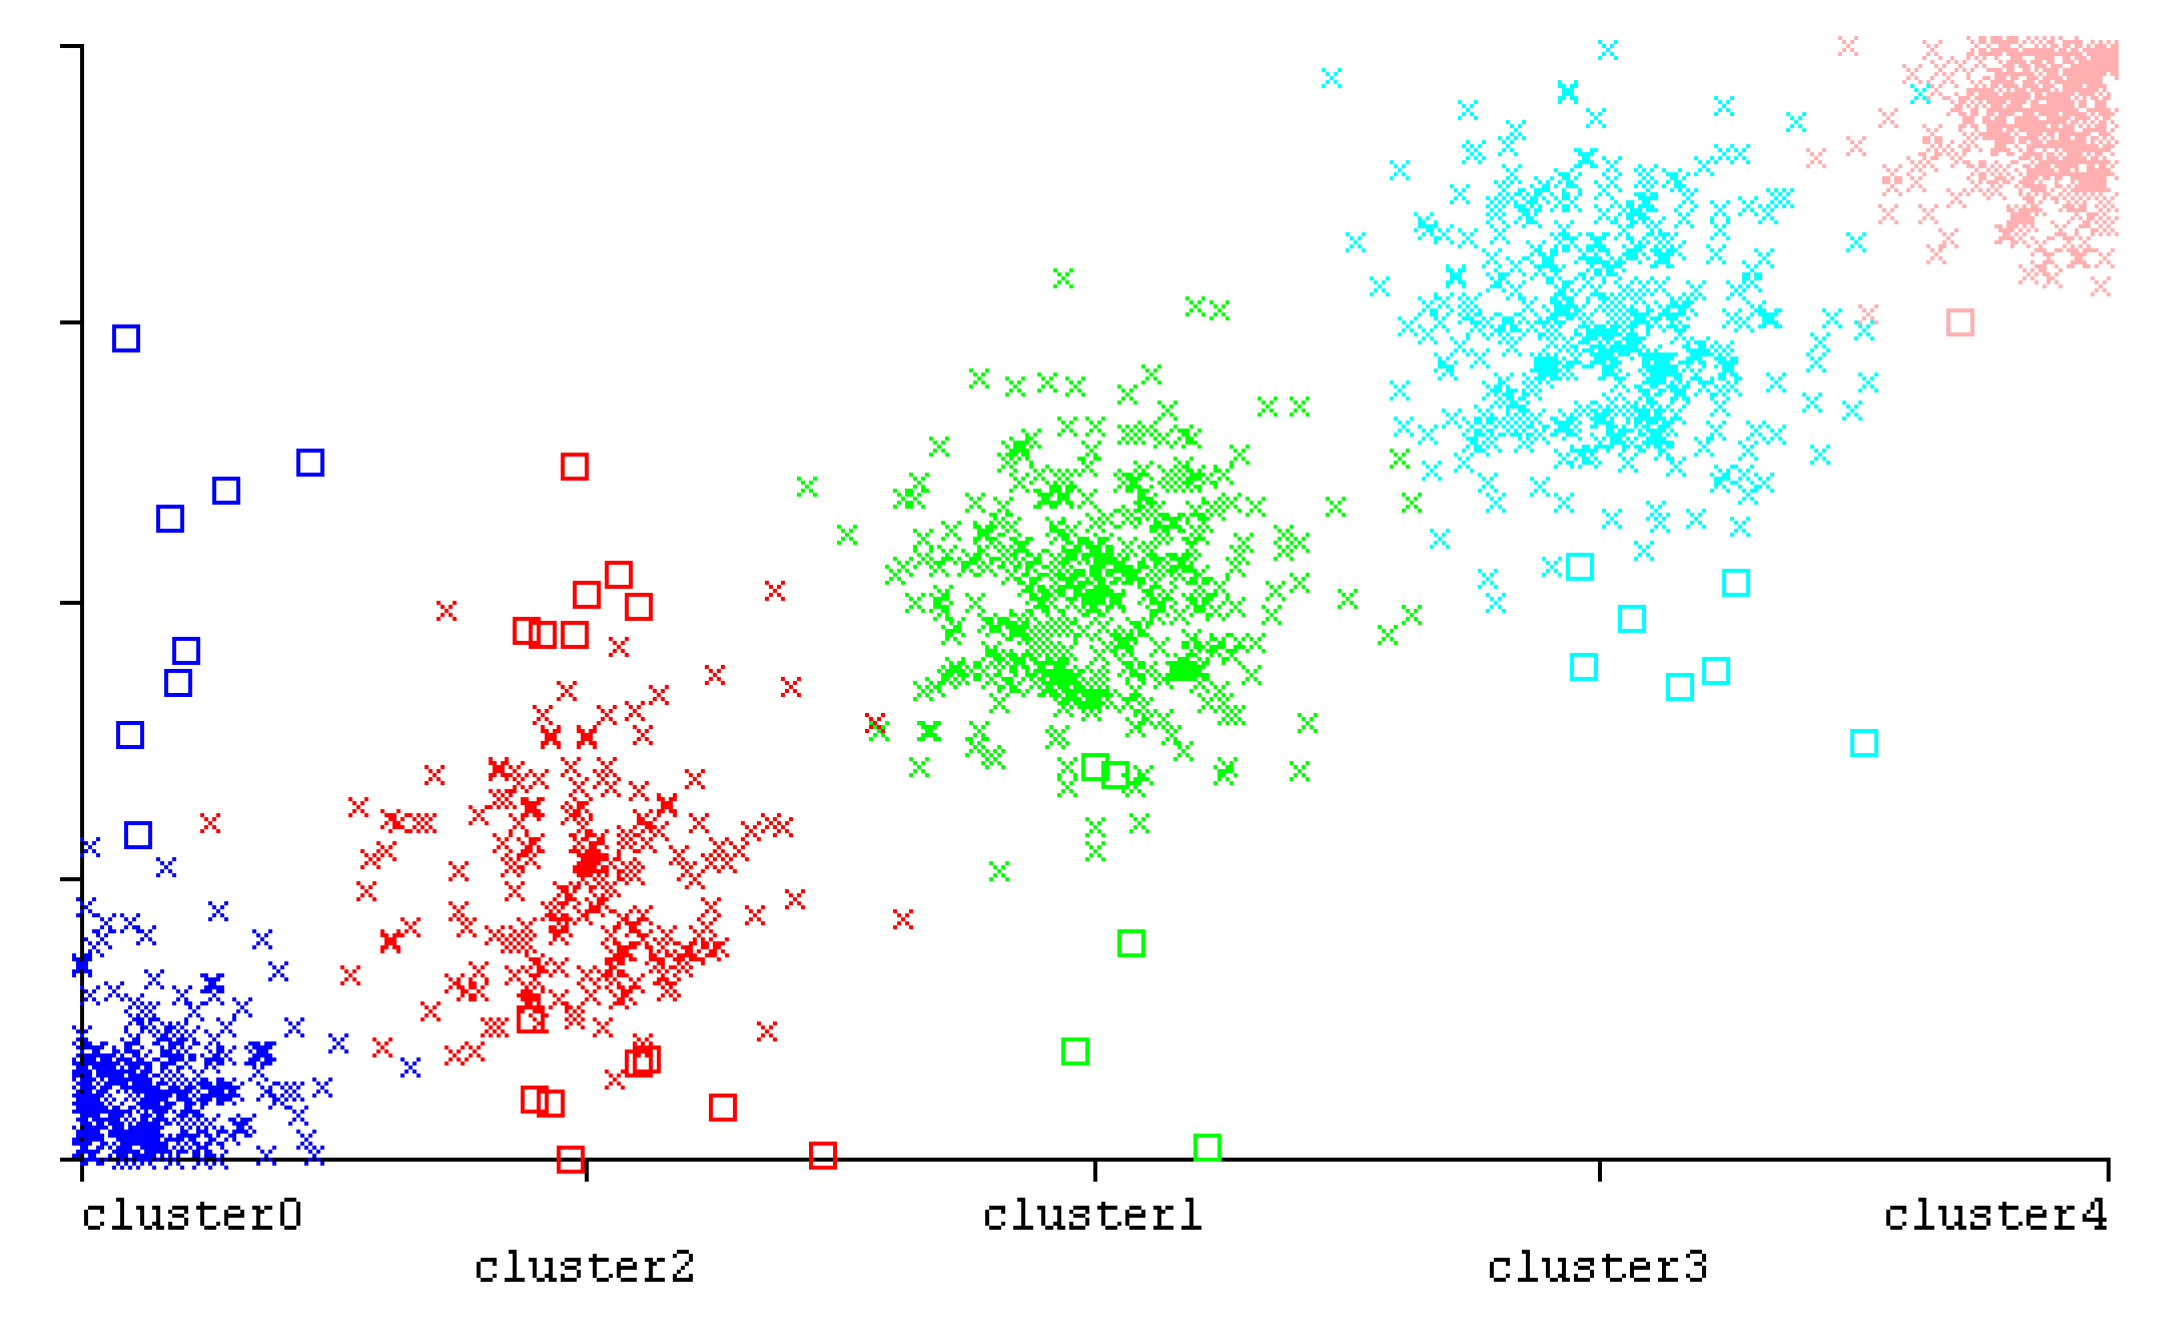
We further investigated the EEG status prediction based on the logistic regression (LR) classifier, as shown in Table 4. The results indicate that the predictions for electrons 1 and 5 based on the EEG instances of electrons 0–4 using the LR classifier achieved 91.9% accuracy. The mean absolute error was 0.0467, while total number of instances was 1334. The classifier using the 10 cross-validation mode achieved 91.9% accuracy; the accuracy could be improved to 92.12% using the training set mode.
Compared with the results for other models, this model can achieve a relatively high accuracy rate in predicting EEG status. Table 5 shows the prediction results generated by other models based on different EEG data sets [24].
The EEG status prediction results for our model demonstrate a relatively high accuracy rate compared with other classifiers in other models [24] (based on different EEG data sources). The average accuracy rate achieved was 97.3% for our model, outperforming the classifiers in other models, as shown in Figure 11.
5. Conclusions and Future Work
This paper introduces a novel method for EEG-based data analysis, which can be used for robotic control. The proposed method combines PDA and NDA data sampling methods, K-means clustering, and piecewise linearization methods. The PDA–NDA sampling method generates smaller data sets, which allows clustering and piecewise linearization analysis to be performed on smaller and less complex data sets without sacrificing information integrity.
The proposed method introduces a novel pattern recognition method that allows clustered EEG data items to be reproduced as frequent pattern growth trees, which can identify the possible brain activity patterns for recognition. The extraction and mining based on the generated FP growth tree can produce an approximate pattern for brain activity recognition. In the current model, we are able to generate preliminary pattern recognition results based on EEG brain activity data items for robotic control.
The experimental results show that EEG data sets can generate different results for meditation, meditating left-hand rise, meditating right-hand rise, left-hand rise, and right- hand rise categories. More than 20 participants were involved in the experiments and approximately 3 million EEG data items were processed during the experimental processes. Based on various results, we discovered some preliminary patterns for analysis. Our future work will focus on improving the accuracy of the recognition and optimizing the SEGPA model. The EEG status prediction results in our model had a high accuracy rate compared with other classifiers in other models.
Furthermore, future work will focus on delivering a more efficient algorithm for EEG pattern generation and on improving the EEG experimental data variety.
Author Contributions
Conceptualization, H.L.Z.; methodology, H.L.Z.; software, H.L.Z.; validation, S.L. and J.H.; resources, S.L. and X.L.; writing—review and editing, H.L.Z. and S.L.; supervision, H.L.Z.; funding acquisition, H.L.Z., X.L., J.H., and S.L. All authors appreciate to the experimenters, who carried out, and agreed to analyze their brain EEG signal from experiments. All authors also clarify that we kept the regulations of each university for human signal storage policy (only access inside of the lab) and control by only authorized staff. The obtained EEG signals are processed anonymously. All authors have read and agreed to the published version of the manuscript.
Funding
This work was partially supported by Zhejiang Provincial Natural Science Fund (LY19 F030010), Zhejiang Provincial Social Science Fund (20NDJC216YB), Ningbo Natural Science Fund (No. 2019A610083), Ningbo Innovation Team (No.2016C11024), National Natural Science Foundation of China Grant (No. 61872321) and Ningbo Covid-19 and Education Special Fund (No.2020YQZX137).
Conflicts of Interest
All authors confirmed that there is no conflict of interest.
References
- Zhang, H.L.; Zhao, H.; Cheung, Y.; He, J. Generating EEG Graphs Based on PLA for Brain Wave Pattern Recognition. In Proceedings of the 2018 IEEE Congress on Evolutionary Computation(CEC), Rio de Janeiro, Brazil, 8–13 July 2018; pp. 1–7. [Google Scholar]
- Gajic, D.; Djurovic, Z.; Gennaro, S.D.; Gustafsson, F. Classification of EEG Signals for Detection of Epileptic Seizures based on Wavelets and Statistical Pattern Recognition. Biomed. Eng. Appl. Basis Commun. 2014, 26, 02. [Google Scholar] [CrossRef] [Green Version]
- Zhang, H.L.; Li, X.; Liu, J.; Cheung, Y. Constructing weighted networks based on EEG data segmentation for brain wave pattern recognition. In Proceedings of the International Conference on Advanced Computational Intelligence (ICACI), Xiamen, China, 29–31 March 2018; pp. 852–855. [Google Scholar]
- Gevins, A. Pattern Recognition of Human Brain Electrical Potentials. IEEE Trans. Pattern Anal. Mach. Intell. 1980, PAMI-2, 383–404. [Google Scholar] [CrossRef]
- Hogg, R.V.; McKean, J.W.; Craig, A.T. Introduction to Mathematical Statistics, 8th ed.; Prentice Hall Press: Upper Saddle River, NJ, USA, 2018. [Google Scholar]
- Zhao, X.; Chu, Y.; Han, J.; Zhang, Z. SSVEP-based Brain-Computer Interface Controlled Functional Electrical Simulation System for Upper Extremity Rehabilitation. IEEE Trans. Syst. Man Cybern. Syst. (SMC-S) 2016, 46, 947–956. [Google Scholar] [CrossRef]
- Deergha Rao, K.; Swamy, M.N.S. Spectral Analysis of Signals. In Digital Signal Processing; Springer: Berlin/Heidelberg, Germany, 2018; pp. 721–751. [Google Scholar]
- Podder, P.; Hasan, M.; Islam, R.; Sayeed, M. Design and implementation of Butterworth, Chebyshev-I and Elliptic filter for speech signal analysis. Int. J. Compt. Appl. 2014, 98, 12–18. [Google Scholar] [CrossRef]
- Zhang, H.L.; Zhao, Y.; Pang, C.; He, J. Splitting Large Medical Data Sets Based on Normal Distribution in Cloud Environment. IEEE Trans. Cloud Comput. (TCC) 2020, in press. [Google Scholar] [CrossRef]
- Botev, Z.; Ridder, A. Variance Reduction. In Wiley StatsRef: Statistics Reference Online; John Wiley & Sons, Ltd.: Hoboken, NJ, USA, 2017; pp. 1–6. [Google Scholar]
- Lyman, O.R.; Longnecker, M.T. An Introduction to Statistical Methods and Data Analysis; Brooks Publication: Baltimore, MD, USA, 2015. [Google Scholar]
- Shahrokh, E.M.; Dougherty, E.R. Effect of separate sampling on classification accuracy. Bioinformatics 2014, 30, 242–250. [Google Scholar] [CrossRef] [PubMed]
- Mostafa, S.; Ahmad, I.A. Recent Developments in Systematic Sampling: A Review. J. Stat. Theory Pract. 2017, 12, 290–310. [Google Scholar] [CrossRef]
- Tasdemir, K.; Merenyi, E. SOM-based topology visualisation for interactive analysis of high-dimensional large datasets. Mach. Learn. Rep. 2012, 1, 13–15. [Google Scholar]
- Gajic, D.; Djurovic, Z.; Gligorijevic, J.; Gennaro, S.D.; Savic-Gajic, I. Detection of epileptiform activity in EEG signals based on time-frequency and non-linear analysis. Front. Comput. Neurosci. 2015, 9, 38. [Google Scholar] [CrossRef] [PubMed] [Green Version]
- Liu, W.; Mei, F.; Wang, C.; O’Neill, M.; Swartzlander, E.E. Data Compression Device Based on Modified LZ4 Algorithm. IEEE Trans. Consum. Electron. 2018, 64, 110–117. [Google Scholar] [CrossRef] [Green Version]
- Ahmadi, H.; Martí, J.R.; Moshref, A. Piecewise linear approximation of generators cost functions using max-affine functions. In Proceedings of the 2013 Power and Energy Society General Meeting (PES), Vancouver, BC, Canada, 21–25 July 2013; pp. 1–5. [Google Scholar]
- Luo, G.; Yi, K.; Cheng, S.; Li, Z.; Fan, W.; He, C.; Mu, Y. Piecewise Linear Approximation of Stream Time Series Data with Max-error Guarantees. In Proceedings of the 2015 IEEE 31st International Conference on Data Engineering, Seoul, Korea, 13–17 April 2015. [Google Scholar]
- Xie, Q.; Chao, P.; Xiao, Z.; Zhang, X.; Deng, K. Maximum error-bounded PLR for online stream approximation. J. VLDB 2014, 2, 915–937. [Google Scholar] [CrossRef]
- Orhan, U. Time series adapted supervised fuzzy discretization: An application to ECG signals. Turk. J. Elec. Eng. Comp. Sci. 2016, 24, 3987–3998. [Google Scholar] [CrossRef]
- Kriegel, H.; Schubert, E.; Zimek, A. The (black) art of runtime evaluation: Are we comparing algorithms or implementations? Knowl. Inf. Syst. 2016, 52, 341–378. [Google Scholar] [CrossRef]
- ABB Co. Getting started, IRC5 and RobotStudio. In ABB-IRC5 Operating Manual; ABB Co.: Zurich, Switzerland, 2018. [Google Scholar]
- Zhang, H.L.; Liu, J.; Li, T.; Xue, Y.; Xu, S.; Chen, J. Extracting sample data based on Poisson distribution. ICMLC 2017, 2, 374–378. [Google Scholar]
- Amin, H.U.; Mumtaz, W.; Subhani, A.R.; Saad, M.N.M.; Malik, A.S. Classification of EEG Signals based on Pattern Recognition Approach. Front. Comput. Neurosci. 2017, 11. [Google Scholar] [CrossRef] [PubMed] [Green Version]
Figure 1.
EEG original data sets obtained from CONTEC KT88 (electrodes 7 and 17).

Figure 2.
The discrete-time gain with Butterworth, Chebyshev, and Elliptic filters [8].
Figure 2.
The discrete-time gain with Butterworth, Chebyshev, and Elliptic filters [8].

Figure 3.
Transformed diabetic data based on probability (ksdensity) [9].
Figure 3.
Transformed diabetic data based on probability (ksdensity) [9].

Figure 4.
Interacting ABB-IRC5 robotic arms in an adjustment environment [22].
Figure 4.
Interacting ABB-IRC5 robotic arms in an adjustment environment [22].

Figure 5.
EEG self-adjusting analytical process - FP (Frequent Pattern), PR (Pattern Recognition), PLA (Piecewise Linear Approximation).
Figure 5.
EEG self-adjusting analytical process - FP (Frequent Pattern), PR (Pattern Recognition), PLA (Piecewise Linear Approximation).

Figure 6.
Entropy-based Frequent Pattern (FP) tree for EEG.

Figure 7.
EEG clustering results based on three statuses (left-hand rise, meditation, left-hand rise mediation; results for 5 clusters, PDA segment 1).
Figure 7.
EEG clustering results based on three statuses (left-hand rise, meditation, left-hand rise mediation; results for 5 clusters, PDA segment 1).

Figure 8.
EEG clustering results based on two statuses (meditation, left-hand rise mediation; results from 5 clusters, PDA segment 2).
Figure 8.
EEG clustering results based on two statuses (meditation, left-hand rise mediation; results from 5 clusters, PDA segment 2).

Figure 9.
EEG patterns derived from entropy-based FP trees-I (Table 3 data source).
Figure 9.
EEG patterns derived from entropy-based FP trees-I (Table 3 data source).

Figure 10.
EEG patterns derived from entropy-based FP trees-II (Table 3 data source).
Figure 10.
EEG patterns derived from entropy-based FP trees-II (Table 3 data source).

Figure 11.
Predictions for EEG electrons based on the logistic regression classifier (electron 1).


Table 1.
K-means clustering based on EEG Poisson distribution approximation (PDA) sampling data (left-hand rise).
Table 1.
K-means clustering based on EEG Poisson distribution approximation (PDA) sampling data (left-hand rise).
| Segment 1 | Full Data | Cluster 1 | Cluster 2 | Cluster 3 | Cluster 4 | Cluster 5 |
|---|---|---|---|---|---|---|
| Eletrode-1 | 2.1415 | 5.6577 | −127.2125 | 271.5147 | −270.0239 | 98.2584 |
| Eletrode-2 | 0.2929 | 3.6421 | −263.9036 | 278.0219 | −113.3705 | 120.69 |
| Eletrode-3 | 0.0964 | −276.6275 | −119.5895 | 268.1048 | 0.443 | 128.126 |
| Eletrode-4 | −0.4023 | −272.713 | 100.4856 | 264.2771 | 0.9547 | 101.1805 |
| Eletrode-5 | −0.0593 | −0.8067 | 252.9328 | 108.061 | −100.7224 | −266.16 |
| Eletrode-6 | −0.2027 | 115.0933 | 258.1466 | −1.202 | −115.7642 | −266.1797 |
| Eletrode-7 | 0.5408 | −264.4383 | −103.5582 | 274.1463 | 1.1718 | 117.1847 |
| Eletrode-8 | 0.0433 | −94.6196 | 241.0967 | 102.2083 | −246.2295 | 1.3606 |
| Eletrode-9 | −0.0745 | 121.9626 | 260.3262 | −0.9898 | −121.4996 | −267.0087 |
| Eletrode-10 | 0.0523 | −92.6278 | 250.7137 | 101.3799 | −243.7228 | 0.7063 |
| Eletrode-11 | −0.0587 | 100.6242 | 250.191 | 0.1628 | −246.9969 | −92.5979 |
| Eletrode-12 | 0.2379 | −0.9033 | 239.1103 | 94.8449 | −96.8593 | −250.7056 |
| Eletrode-13 | 0.0881 | 108.1479 | 249.5879 | 0.0652 | −255.9138 | −104.6888 |
| Eletrode-14 | 0.1329 | −1.4198 | 253.4722 | 102.7924 | −254.0597 | −106.2028 |
| Eletrode-15 | −0.1197 | 1.3792 | 249.7656 | 111.2871 | −252.9311 | −92.5953 |
| Eletrode-16 | −0.1435 | 126.2143 | 269.3761 | −0.0389 | −262.3813 | −117.2546 |
Table 2.
Left-hand rise EEG data clustering centroids.
| Final Cluster Centroids (The Left-Hand Rise Experiment) | Cluster | ||||||
|---|---|---|---|---|---|---|---|
| Attribute | Full Data | 0 | 1 | 2 | 3 | 4 | 5 |
| (12,700.0) | (170.0) | (242.0) | (159.0) | (126.0) | (11479.0) | (524.0) | |
| 1 | 0.2468 | −257.3 | −117.3 | 147 | 286 | −0.65 | 44.5 |
Table 3.
PDA-based EEG data segmentation (original data set contains 10,000 items, sample data set 1 contains 2000 items, sample data set 2 contains 1250 items, sample data set 3 contains 1000 items, and sample data set 4 contains 625 items).
Table 3.
PDA-based EEG data segmentation (original data set contains 10,000 items, sample data set 1 contains 2000 items, sample data set 2 contains 1250 items, sample data set 3 contains 1000 items, and sample data set 4 contains 625 items).
| Source | μ | σ | λ |
|---|---|---|---|
| Original Data | 100.02889 | 99.09559 | 99.44109 |
| Sample Data 1 | 99.47694 | 99.58714 | 99.57711 |
| Sample Data 2 | 99.46015 | 99.18890 | 99.23817 |
| Sample Data 3 | 99.50864 | 99.27633 | 99.31416 |
| Sample Data 4 | 99.41546 | 98.51124 | 98.84111 |
Table 4.
Logistic regression prediction for electron 1 based on segmented EEG.
| Accuracy Rate (%) | Precision (%) | Recall | MCC | Class |
|---|---|---|---|---|
| 96.2% | 94.8% | 0.962 | 0.946 | cluster0 |
| 92.5% | 98.4% | 0.925 | 0.947 | cluster2 |
| 98.5% | 94.1% | 0.985 | 0.950 | cluster1 |
| 97.9% | 99.7% | 0.979 | 0.984 | cluster3 |
| 99.6% | 100% | 0.996 | 0.998 | cluster4 |
| 97.3% | 97.4% | 0.973 | 0.966 | Weighted Avg. |
Table 5.
Classification results based on different classifiers, MLP denotes Multi-layer perceptron [24].
Table 5.
Classification results based on different classifiers, MLP denotes Multi-layer perceptron [24].
| Classifier | Accuracy Rate (%) | Precision (%) | EEG Range |
|---|---|---|---|
| MLP, n = 5 | 91.60 | 95.36 | 3.90–7.81 Hz |
| Naive | 81.07 | 78.57 | 3.90–7.81 Hz |
| MLP, n = 5 | 97.14 | 97.86 | 0–3.90 Hz |
| Naive | 89.63 | 91.07 | 0–3.90 Hz |
© 2020 by the authors. Licensee MDPI, Basel, Switzerland. This article is an open access article distributed under the terms and conditions of the Creative Commons Attribution (CC BY) license (http://creativecommons.org/licenses/by/4.0/).
Share and Cite
MDPI and ACS Style
Zhang, H.L.; Lee, S.; Li, X.; He, J. EEG Self-Adjusting Data Analysis Based on Optimized Sampling for Robot Control. Electronics 2020, 9, 925. https://doi.org/10.3390/electronics9060925
AMA Style
Zhang HL, Lee S, Li X, He J. EEG Self-Adjusting Data Analysis Based on Optimized Sampling for Robot Control. Electronics. 2020; 9(6):925. https://doi.org/10.3390/electronics9060925
Chicago/Turabian StyleZhang, Hao Lan, Sanghyuk Lee, Xingsen Li, and Jing He. 2020. "EEG Self-Adjusting Data Analysis Based on Optimized Sampling for Robot Control" Electronics 9, no. 6: 925. https://doi.org/10.3390/electronics9060925
Note that from the first issue of 2016, this journal uses article numbers instead of page numbers. See further details here.