Highly Saline Water Desalination Using Direct Contact Membrane Distillation (DCMD): Experimental and Simulation Study


1
Membrane Technology Research Unit, Department of Chemical Engineering, University of Technology, Baghdad 10066, Iraq
2
Institute on Membrane Technology, National Research Council (ITM-CNR), 87030 Rende (CS), Italy
*
Author to whom correspondence should be addressed.
Water 2020, 12(6), 1575; https://doi.org/10.3390/w12061575
Submission received: 26 March 2020
/
Revised: 19 May 2020
/
Accepted: 27 May 2020
/
Published: 31 May 2020
(This article belongs to the Special Issue Modelling Approach to Wastewater Membrane Filtration Processes)
Abstract
:The path for water molecules transported across a membrane in real porous membranes has been considered to be a constant factor in the membrane distillation (MD) process (i.e., constant tortuosity); as such, its effect on membrane performance at various operating conditions has been ignored by researchers. Therefore, a simultaneous heat and mass transfer model throughout the direct contact membrane distillation (DCMD) module was developed in this study by taking into account the hypothetical path across the membrane as a variable factor within the operating conditions because it exhibits the changes to the mass transfer resistance across the membrane under the DCMD run. The DCMD process was described by the developed model using a system of nonlinear equations and solved numerically by MATLAB software. The performance of the poly-tetra-fluoroethylene (PTFE) membrane was examined to treat 200 g/L NaCl saline at various operating conditions. The simulation results in the present work showed that the hypothetical proposed path across the membrane has a variable value and was affected by changing the feed temperature and feed concentration. The results estimated by the developed model showed an excellent conformity with the experimental results. The salt rejection remained high (greater than 99.9%) in all cases. The temperature polarization coefficient for the DCMD ranged between 0.88 and 0.967, and the gain output ratio (GOR) was 0.893. The maximum thermal efficiency of the system was 84.5%.
1. Introduction
Water found in lakes, rivers and reservoirs is considered easily accessible and occupies only one percent of the water on the Earth’s surface. The demand for potable water has progressively increased throughout the last two decades due to the rise in population growth [1,2]. For years, the scarcity of drinking water has been a global problem, prompting the research and development of desalination technologies to treat seawater. Desalination can be defined as a process in which saline water is split into two parts: (1) fresh water with a very low concentration of dissolved salts, and (2) brine, with a much higher concentration of dissolved salts [3,4,5,6,7,8]. Commercially, the desalination of saline water is achieved by either membrane or thermal methods. The thermal process typically involves the boiling or evaporation of saline water, after which the resultant distillate is collected. Multi-effect desalination (MED) and multistage flashing (MSF) are examples of the thermal desalination process. Membrane processes produce fresh water from saline water; for instance, reverse osmosis (RO) is considered a common membrane process based on the pressure driving force and it operates at a high pressure. Membrane distillation (MD) conjoins the two processes and can be defined as a thermal membrane process resulting from the simultaneous mass and heat transfer phenomena across a hydrophobic microporous membrane [9]. In this technique, water vapor is separated from liquid saline by passing through the pores of hydrophobic membranes [10]. At each pore entrance, a liquid–vapor interface is created due to the membrane’s hydrophobic nature, which inhibits the liquid from penetrating the pores [11]. The driving force of MD is supplied by the vapor pressure difference generated by the temperature gradient imposed between the liquid–vapor interfaces [12].
The ability of the membrane to operate at low feeding temperatures is considered the main advantage of membrane technology versus traditional distillation methods. However, MD is operated under low pressure in comparison to conventional membrane processes, such as RO [13,14]. MD can be operated with alternative energy sources, such as solar, wave or geothermal energy [15]. Membrane distillation has been applied in water desalination, wastewater treatment, food industries (e.g., milk and juice concentration), chemical and pharmaceutical industries, separation of isotropic mixtures, textile industries, medical applications, the nuclear industry and heavy metals and radioactive removal [16]. Generally, there are four types of MD configurations, classified depending on the method used to withdraw the vapor from the hot side of the membrane [17]: (1) direct contact membrane distillation (DCMD), which uses cold water to condense vapor directly at the permeate side and inside the membrane module [18]; (2) vacuum membrane distillation (VMD), which employs a vacuum pump at the permeate side to pull out the volatile molecules from the feed solution so that the water vapor condenses in the membrane unit or in a separate condenser [19]; (3) air gap membrane distillation (AGMD), which uses a stagnant air layer at the permeate side between the condensation surface and the membrane layer such that the vapor condenses within the membrane module [20]; and (4) sweeping gas membrane distillation (SGMD), which utilizes a chilly, inefficient gas to sweep the vapor molecules from the cold side, so that the condensation occurs in the outer membrane unit [21]. In addition, there are two hybrid configurations: thermostatic sweeping gas membrane distillation (TSGMD) and liquid gap membrane distillation (LGMD). TSGMD is a combination of AGMD and SGMD, created to overcome the problem of increasing temperature along the membrane, in which a cold surface is placed in the permeate side to increase the temperature difference across the membrane sides. In contrast, LGMD is a combination of DCMD and AGMD, which has been found to overcome the heat loss by conduction in DCMD [17,22]. MD has some disadvantages that determine its feasibility as an industrial separation technique because it creates the following barriers for commercial application: (1) low permeate flux in comparison with pressure-based membrane processes; (2) membrane fouling, scaling and pore wetting, which are classified as technical challenges; and (3) trapped air within the membrane pores that leads to a further mass transfer resistance, which limits the MD permeate flux [21,22,23].
Many attempts for the theoretical studies of MD process appeared in the literature. The most important observation of these theoretical studies was based on the basic aspects of heat and mass transport, described in detail by Lawson and Lloyd [24]. The permeate flux prediction was the most important target in these studies and there were several reviews regarding this issue presented in literature [21,22,25]. In general, the theoretical approaches reported in the literature were took into account the fundamental considerations of the heat transfer resistance in all the parts of the MD module. The mass transfer resistance, especially inside the membrane, was also considered in the theoretical studies with various mass transfer mechanisms [22,25]. However, many assumptions had been proposed in the theoretical studies in order to simplify the complex behavior of the MD process. These assumptions were often related to the constant membrane characteristics (pore size, pore size distribution, porosity membrane thickness and tortuosity) during the MD process operation. All these membrane characteristics have a significant effect on the mass transfer resistance [24], but unfortunately due to the complex structure of the membrane, no systematic experimental studies were performed to show the change in the membrane characteristics during the operation. However, it is highly required to perform like these experimental studies. In the theoretical approach, due to the deviations between the theoretical and experimental results in MD process simulation, the tortuosity was often used as a tuning parameter for adjusting the prediction of the mathematical model and enhancing its performance [26]. Theoretically, the tortuosity represents the considerations of mass transfer resistance and its value supposed extra resistance to the mass transfer than that given by membrane thickness and it could be added to adjust the theoretical simulation results with respect to the corresponding experimental results. However, in most theoretical studies to express the changing in membrane characteristics during operation, a constant value of tortuosity was used for all experiments at various operating conditions. This may be present some deviation between the theoretical and experimental results. For example, experimentally [Zhang, et. al., 2011] [27] reported that the compression of the membranes led to change in the membrane characteristics (reduced porosity, pore size and membrane thickness).
In the present work, a simultaneous heat and mass transfer model for a DCMD system was developed using the MATLAB software to consider the extra mass transfer resistance that may not appear clearly during the MD operation which would be represented through the hypothetical path across the membrane , given by , where is the membrane thickness and is the tortuosity as a variable parameter with operating conditions (i.e., temperature and concentration). In fact, this parameter would be used to express on the variation of membrane characteristics during operation. An experimental study was conducted to evaluate the performance of the DCMD process and to compare it with the developed model. A high saline water feed of up to 200 g/L NaCl was used in this study at various operating conditions.
2. Theoretical Model
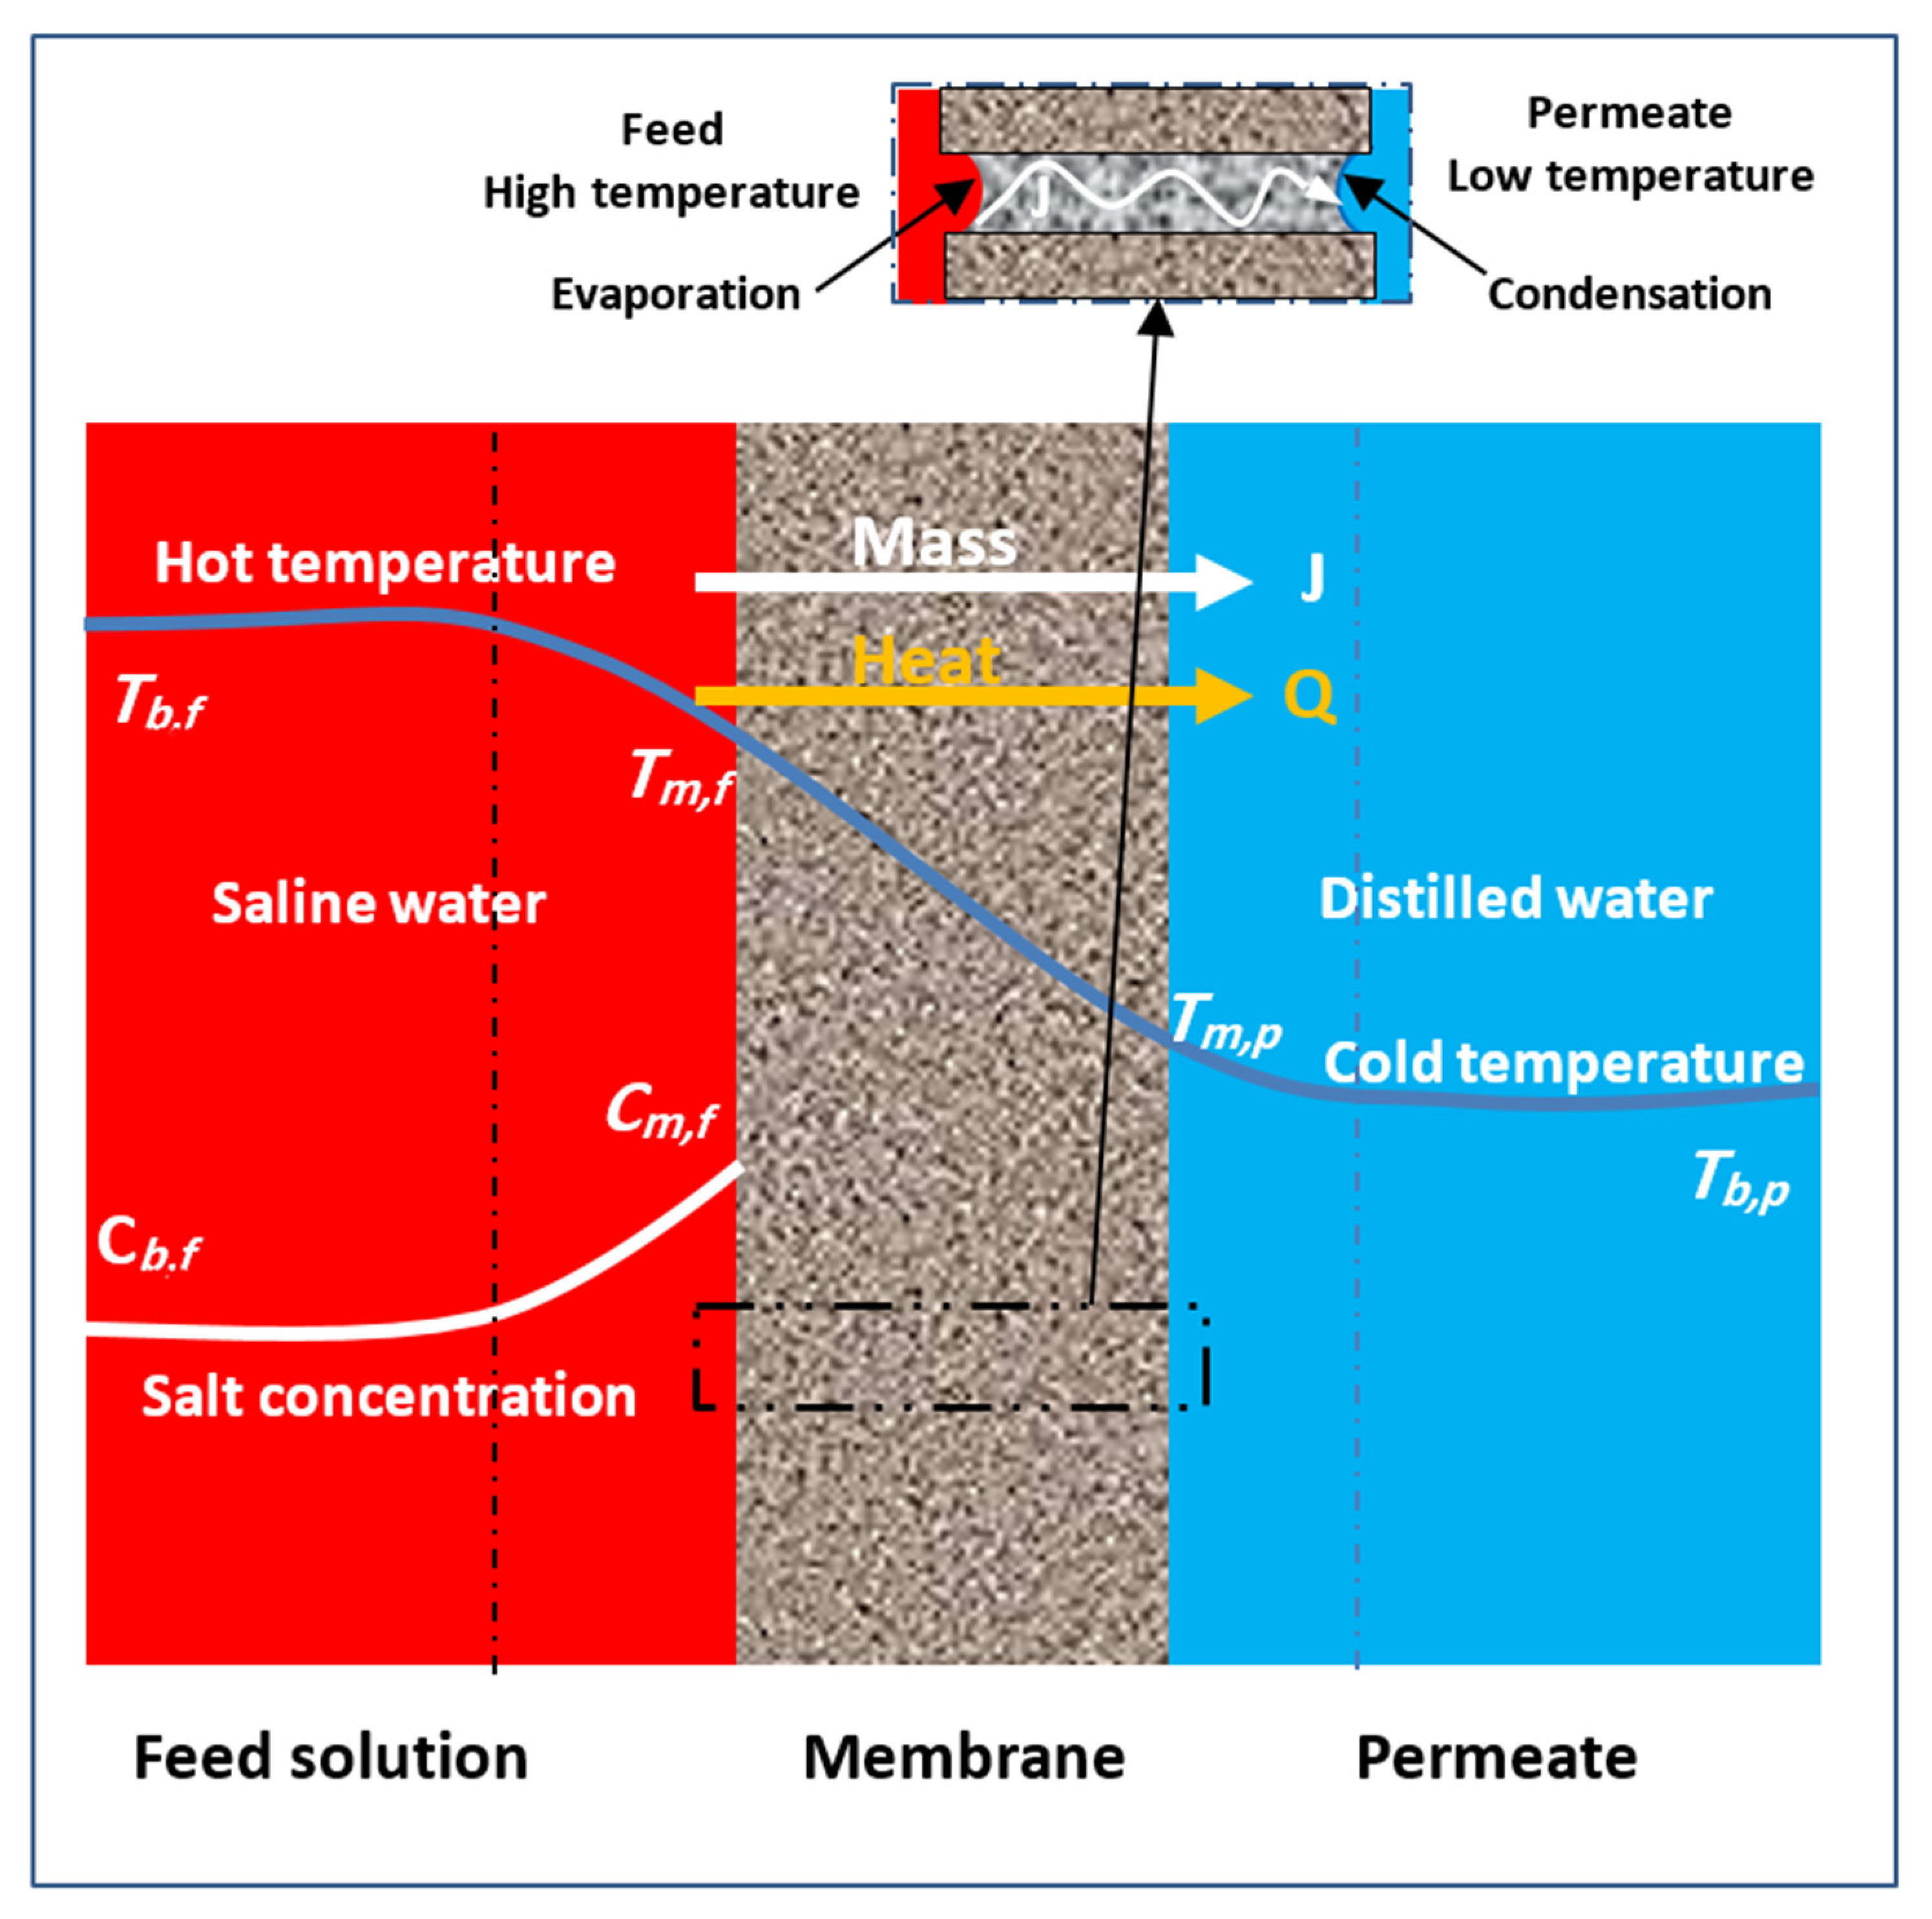
In the MD process, complex transport mechanisms occur simultaneously, which include mass and heat transfer. In this study, a model for the DCMD system was built up using a numerical, iterative technique to solve a series of nonlinear equations obtained from the mass and heat balances. Many assumptions were considered in this model, such as that the system operates under steady-state conditions; the flow rate is laminar and in one direction (x direction) only; the lost heat from the system to the surroundings is neglected; along the water transporting path, the total pressure is assumed to be constant at 1 atm; the nonvolatile components in the feed solution (salt) are fully rejected due to the assumption that no wetting occurs within the membrane layer; the membrane has a uniform pore size (neglecting the pore size distribution); water vapor is transported across a tortuous path; and the air entrapped within the membrane pores is stationary so that water vapor can be diffused through it. Figure 1 shows a schematic diagram of the DCMD’s transport mechanism process.
2.1. Mass Transfer
The mass transfer in the membrane distillation process involves three steps. The first step includes evaporating the volatile molecules from the feed solution at the interface of the hot membrane side, while the second step is represented by transferring the vapor across the membrane pores. Then, the condensation takes place in the last step at the interface of the cold membrane side [26,28].
The mass flux in DCMD is proportional to the vapor pressure gradient through the membrane and can be given by the following equation [25]:
where is the permeate mass flux, De is the equivalent diffusion coefficient, and and are the partial pressures of water at the feed and permeate sides of the membrane, respectively. The partial pressures are evaluated through the assumption of thermodynamic equilibrium at the membrane surfaces [24]. The partial pressure at the feed side is only affected by the salinity of sodium chloride and must be taken into consideration when calculating the pressure [29]:
is the water mole fraction in the feed.
is the NaCl mole fraction in the feed; is the water activity coefficient of the NaCl solution and can be estimated as follows:
and are the vapor pressure of the water evaluated via the Antoine equation at the membrane surface temperatures Tm,f and Tm,p, respectively:
There are three types of mechanisms that explain how gases and vapor are transported through porous media. These are the Knudsen model, molecular diffusion model and Poiseuille flow model. In DCMD, the Knudsen flow and molecular diffusion models are applicable. Inside the membrane module, both the feed and permeate solutions are kept under constant pressure (about 1.0 atm), so no trans-membrane hydrostatic pressure is applied. In this case, the Poiseuille flow is negligible [17]. The combined influence of the molecular and Knudsen diffusions was calculated using the ratio of the Knudsen diffusion to the molecular diffusion. This ratio determines the controlling mechanism in the mass transfer. The value of varies between 0 and 1 [30]:
, , and are the effective, Knudsen, and molecular diffusion coefficients, respectively. and can be expressed as follows [31]:
where is the hypothesis path through the membrane, ε is the membrane porosity, is the universal gas constant, is the mean temperature across the membrane surfaces, is the pore diameter, is the molecular weight of the water molecules, P is the total pressure inside the pore (assumed to be constant and equal to the summation of the partial pressures of air and water), and DWA is the water diffusion coefficient in the air. The value of (Pa m2/s) for water–air is calculated using the following expression, which can be used in the temperature range of 273–373 K [32].
The hypothetical path through the membrane , where is the membrane thickness (often constant) and is the membrane tortuosity (also, often constant), which is often related to the membrane porosity (), such as in the Mackie–Meares equation [21,22]:
In the desalination process, after a particular amount of time, the concentration polarization affects the transfer due to the salt molecules accumulating on the membrane surface. The concentration polarization coefficient () can be defined as the ratio of the solute concentration on the feed membrane surface () to the concentration of the feed bulk ():
The concentration of the solute at the membrane surface is estimated by Martinez-Vazquez’s equation [25]:
where is the density of the feed stream, and is the solute mass transfer coefficient:
where Sh is the Sherwood number, which is given by the Graetz–Leveque equation for laminar flow, and Dh is the hydraulic diameter of the hot channel:
where Re and Sc are the Reynolds and Schmidt numbers, respectively:
L is the channel length; and ρ, u, and μ are the density, velocity, and viscosity of the fluid in the hot channel, respectively.
2.2. Heat Transfer
The heat transfer is carried out in three steps:
2.2.1. Heat Transfer from the Feed Side to the Membrane Surface
The heat transfer through the feed boundary layer occurs by convection and is governed by Newton’s law of cooling [28]:
where is the convective heat flux (W/m2), is the average feed bulk temperature of the inlet and outlet hot feed stream and is the boundary layer heat transfer coefficient at the membrane feed side. The heat transfer coefficient is evaluated by empirical correlations in terms of dimensionless numbers (Nusselt, Reynolds, and Prandtl) [21,33]:
where is the average thermal conductivity of the fluid at the membrane feed side, and Nu is the Nusselt number, which is given by the following expression in a laminar flow case:
where Pr is the Prandtl number:
2.2.2. Heat Transfer through the Membrane Layer
The total heat flux across the membrane () is the result of adding the conducted heat transfer through the membrane () to the evaporative mass flux () through the membrane pores [34]:
where is the effective thermal conductivity of the membrane that consists of the thermal conductivity of gas (air and water vapor) and membrane solid and can be calculated by the following equation:
where is the membrane thickness, and is the enthalpy of water vaporization, which can be estimated using the following:
Thereby, the total heat transfer across the membrane is:
2.2.3. Heat Transfer from the Membrane Surface to the Permeate Stream
The heat transfer across the boundary layer from the membrane surface at the permeate side to the permeate bulk takes place by convection:
where is the average permeate bulk temperature of the inlet and outlet cold permeate stream and hp is the boundary layer heat transfer coefficient at the permeate side, which can be estimated in a similar way to that at the feed side.
The feed membrane interface temperature () and permeate membrane interface temperature () are considered to be unknowns in the MD process; they can be estimated during a steady state. At a steady state, the overall heat transfer through the DCMD system is expressed as shown below:
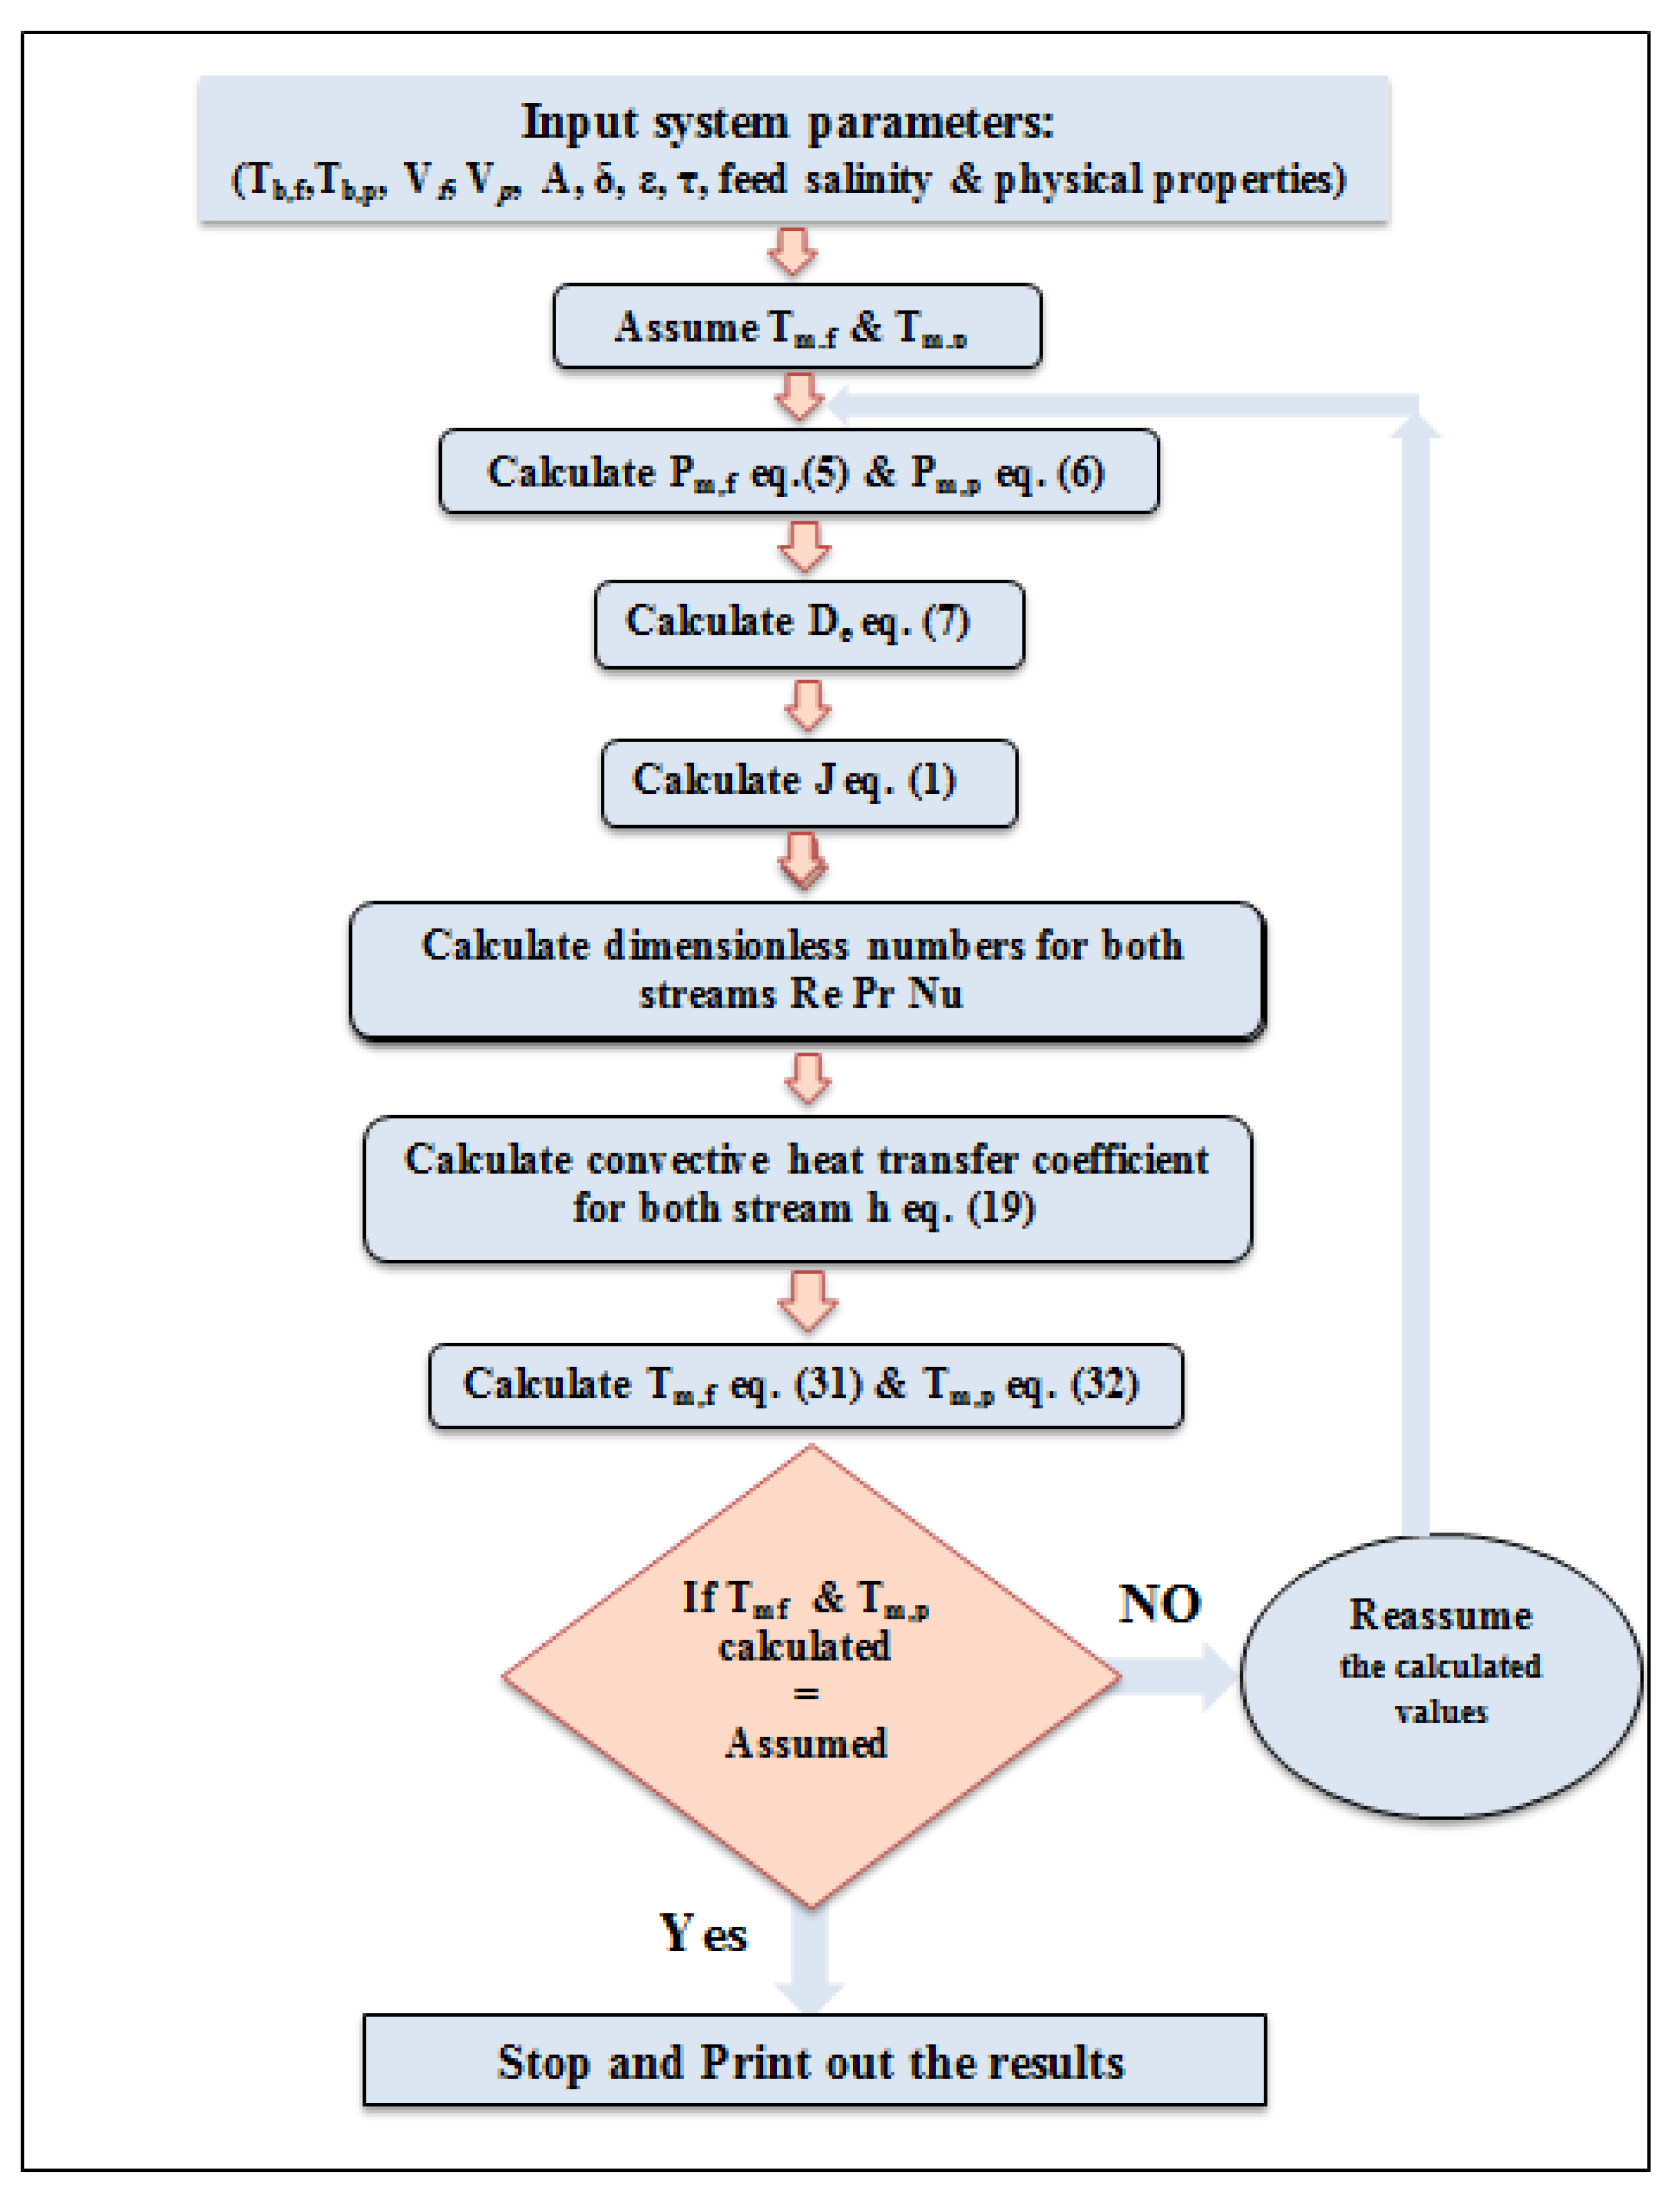
Figure 2 shows the programming steps of the proposed model algorithm using the MATLAB software.
3. Materials and Methods
3.1. Membrane and Membrane Module
A commercial poly-tetra-fluoroethylene (PTFE) flat sheet membrane (Chmlab group 08205 Barcelona, Spain) was used in this study. The membrane had a 96-µm thickness, 0.22-μm average pore size, 78% average porosity, 1.27 nm roughness and a 114° contact angle. The membrane module was designed and constructed in Italy (Delta Company, Cosanza, Rende, Italy) and its effective area was 16 cm2. The module was made of silicon and had good resistance to heat transfer and NaCl solution corrosion. The simulated salt solution was prepared by using NaCl of ≥99% purity by Redi-Dri is a trademark of Sigma-Aldrich (Germany).
3.2. Experimental Setup and Procedure
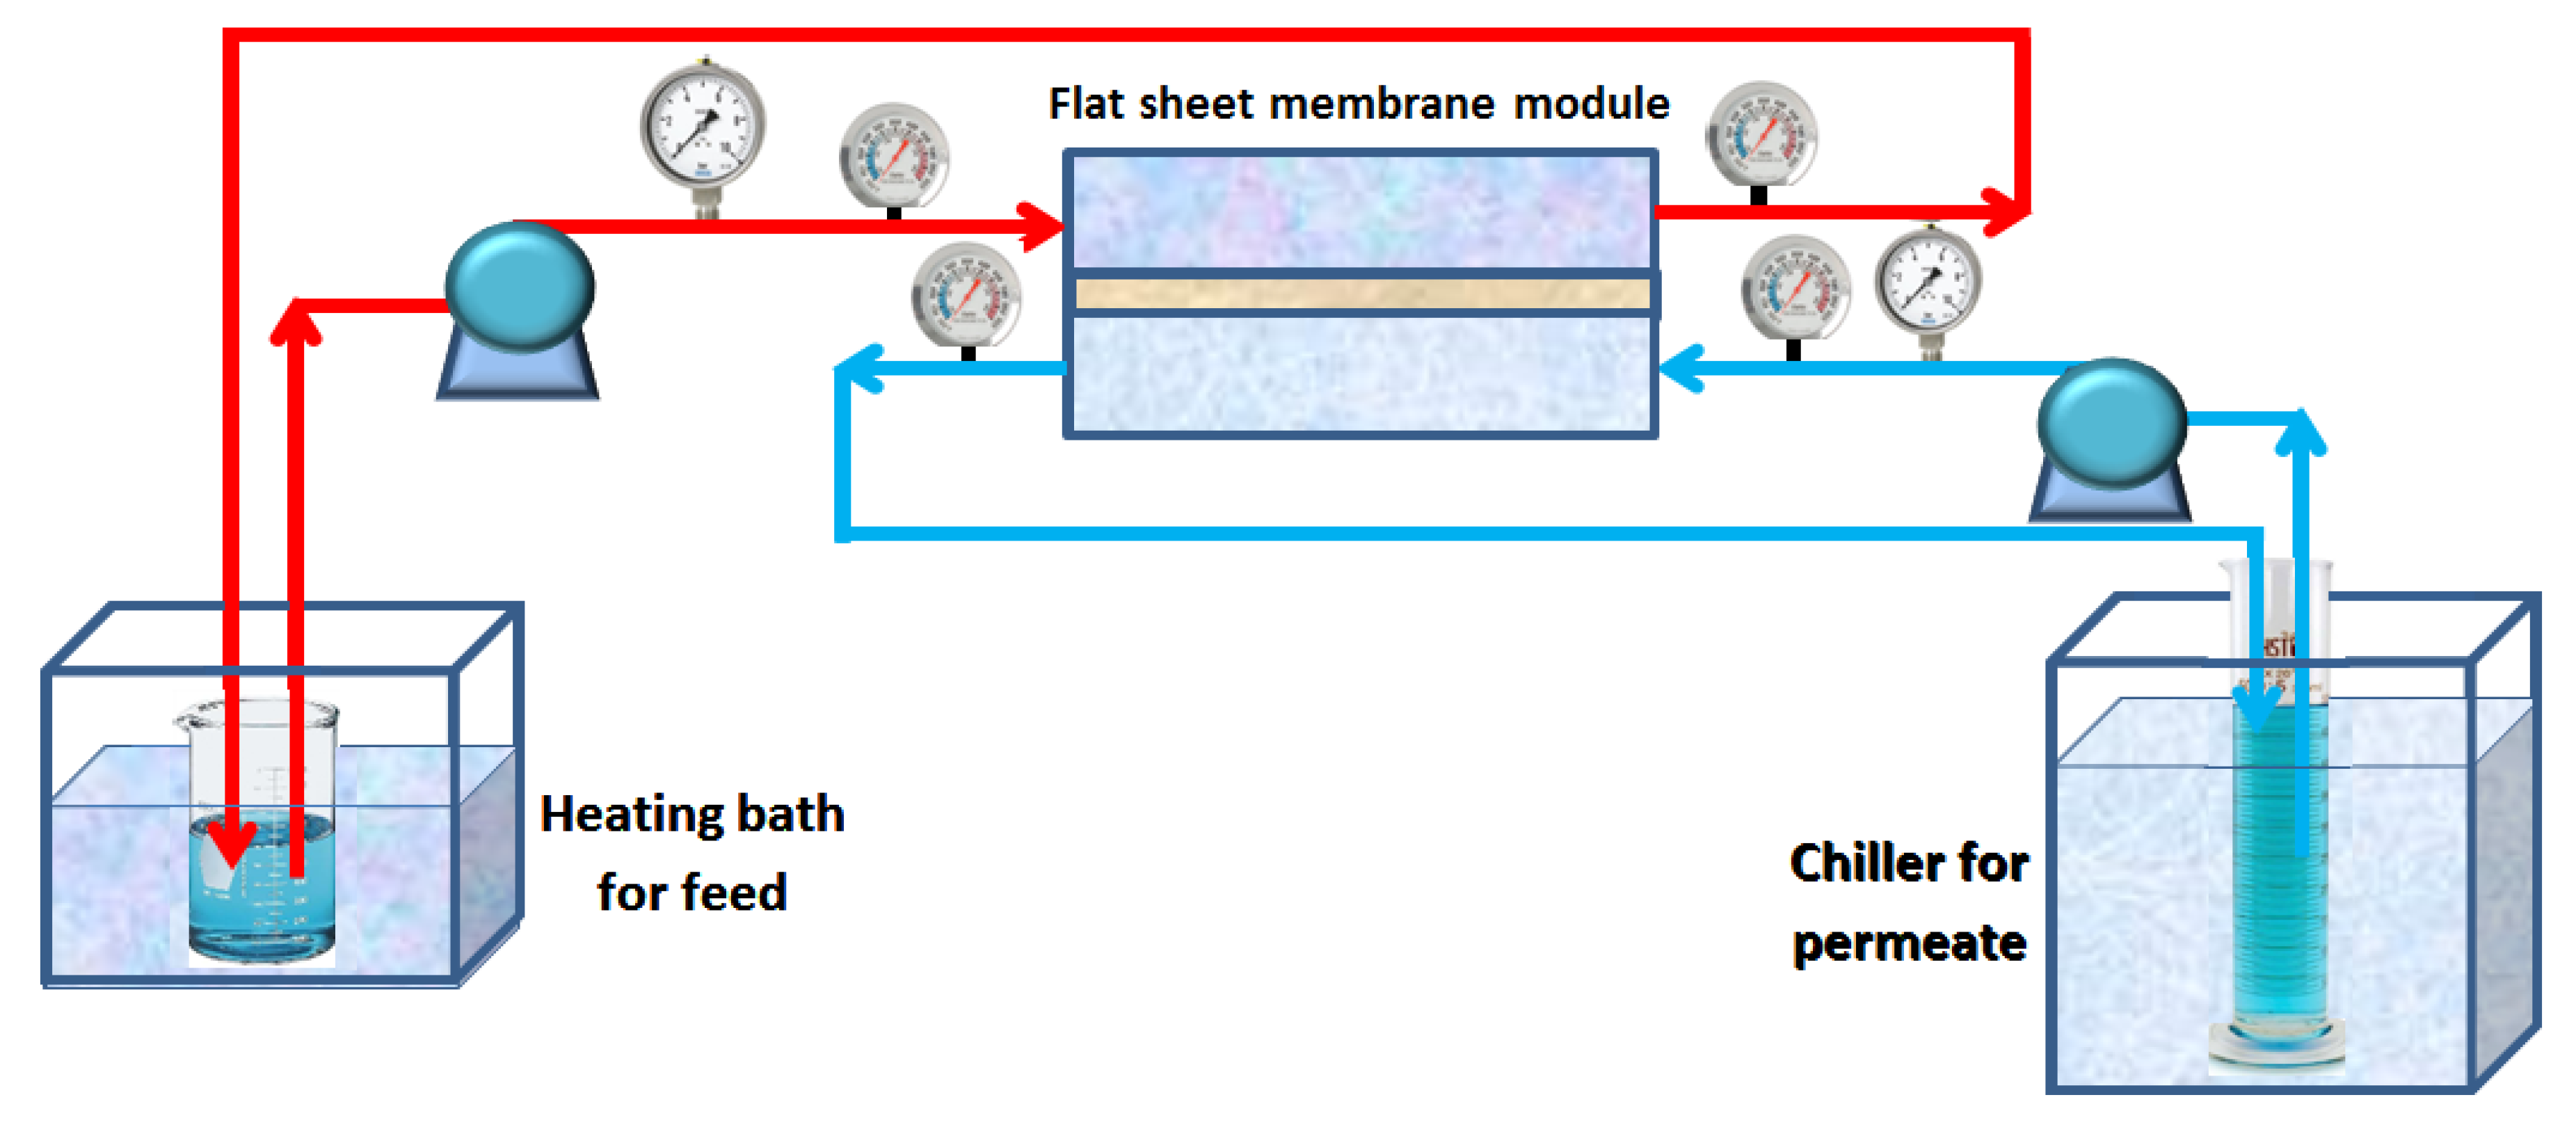
The DCMD system module and its connections were set up and well insulated to minimize the heat loss into the surrounding environment. The temperatures of the four streams were recorded by four thermometers at the membrane module input and output of both the warm and cold channels. The experiments were conducted using a saline solution that was prepared in the laboratory with various NaCl concentrations (i.e., 0, 15, 35, 70, 100 and 200 g/L). The hot feed and coolant for the DCMD were circulated in a countercurrent flow. Experiments were accomplished using different feed temperatures: 45, 50, 55, 60 and 65 °C. The feed flow rate was investigated at various levels from 0.3 to 1.07 L/min, while the permeate flow rate was maintained constant for all the tests. The diagram of the experimental DCMD setup is shown schematically in Figure 3.
The experimental permeate flux was estimated by , where is the mass flux of permeate (kg/m2.h), is the permeate mass (kg), is the effective area of the membrane (m2), is the experiment time of the water permeate volume accumulation (h), is the density of water (kg/L), is the fresh permeate volume (l), and and are the effective membrane width (m) and length (m), respectively.
4. Results and Discussion
The operational conditions had a significant effect on the performance of the DCMD process. Many experiments were conducted to study the effect of the operating parameters on the permeate flux. In this work, three parameters were examined: feed temperature, feed flow rate and feed solution concentration. In contrast, the temperature and flow rate at the permeate side were held constant.
4.1. Effect of Hot Feed Temperature
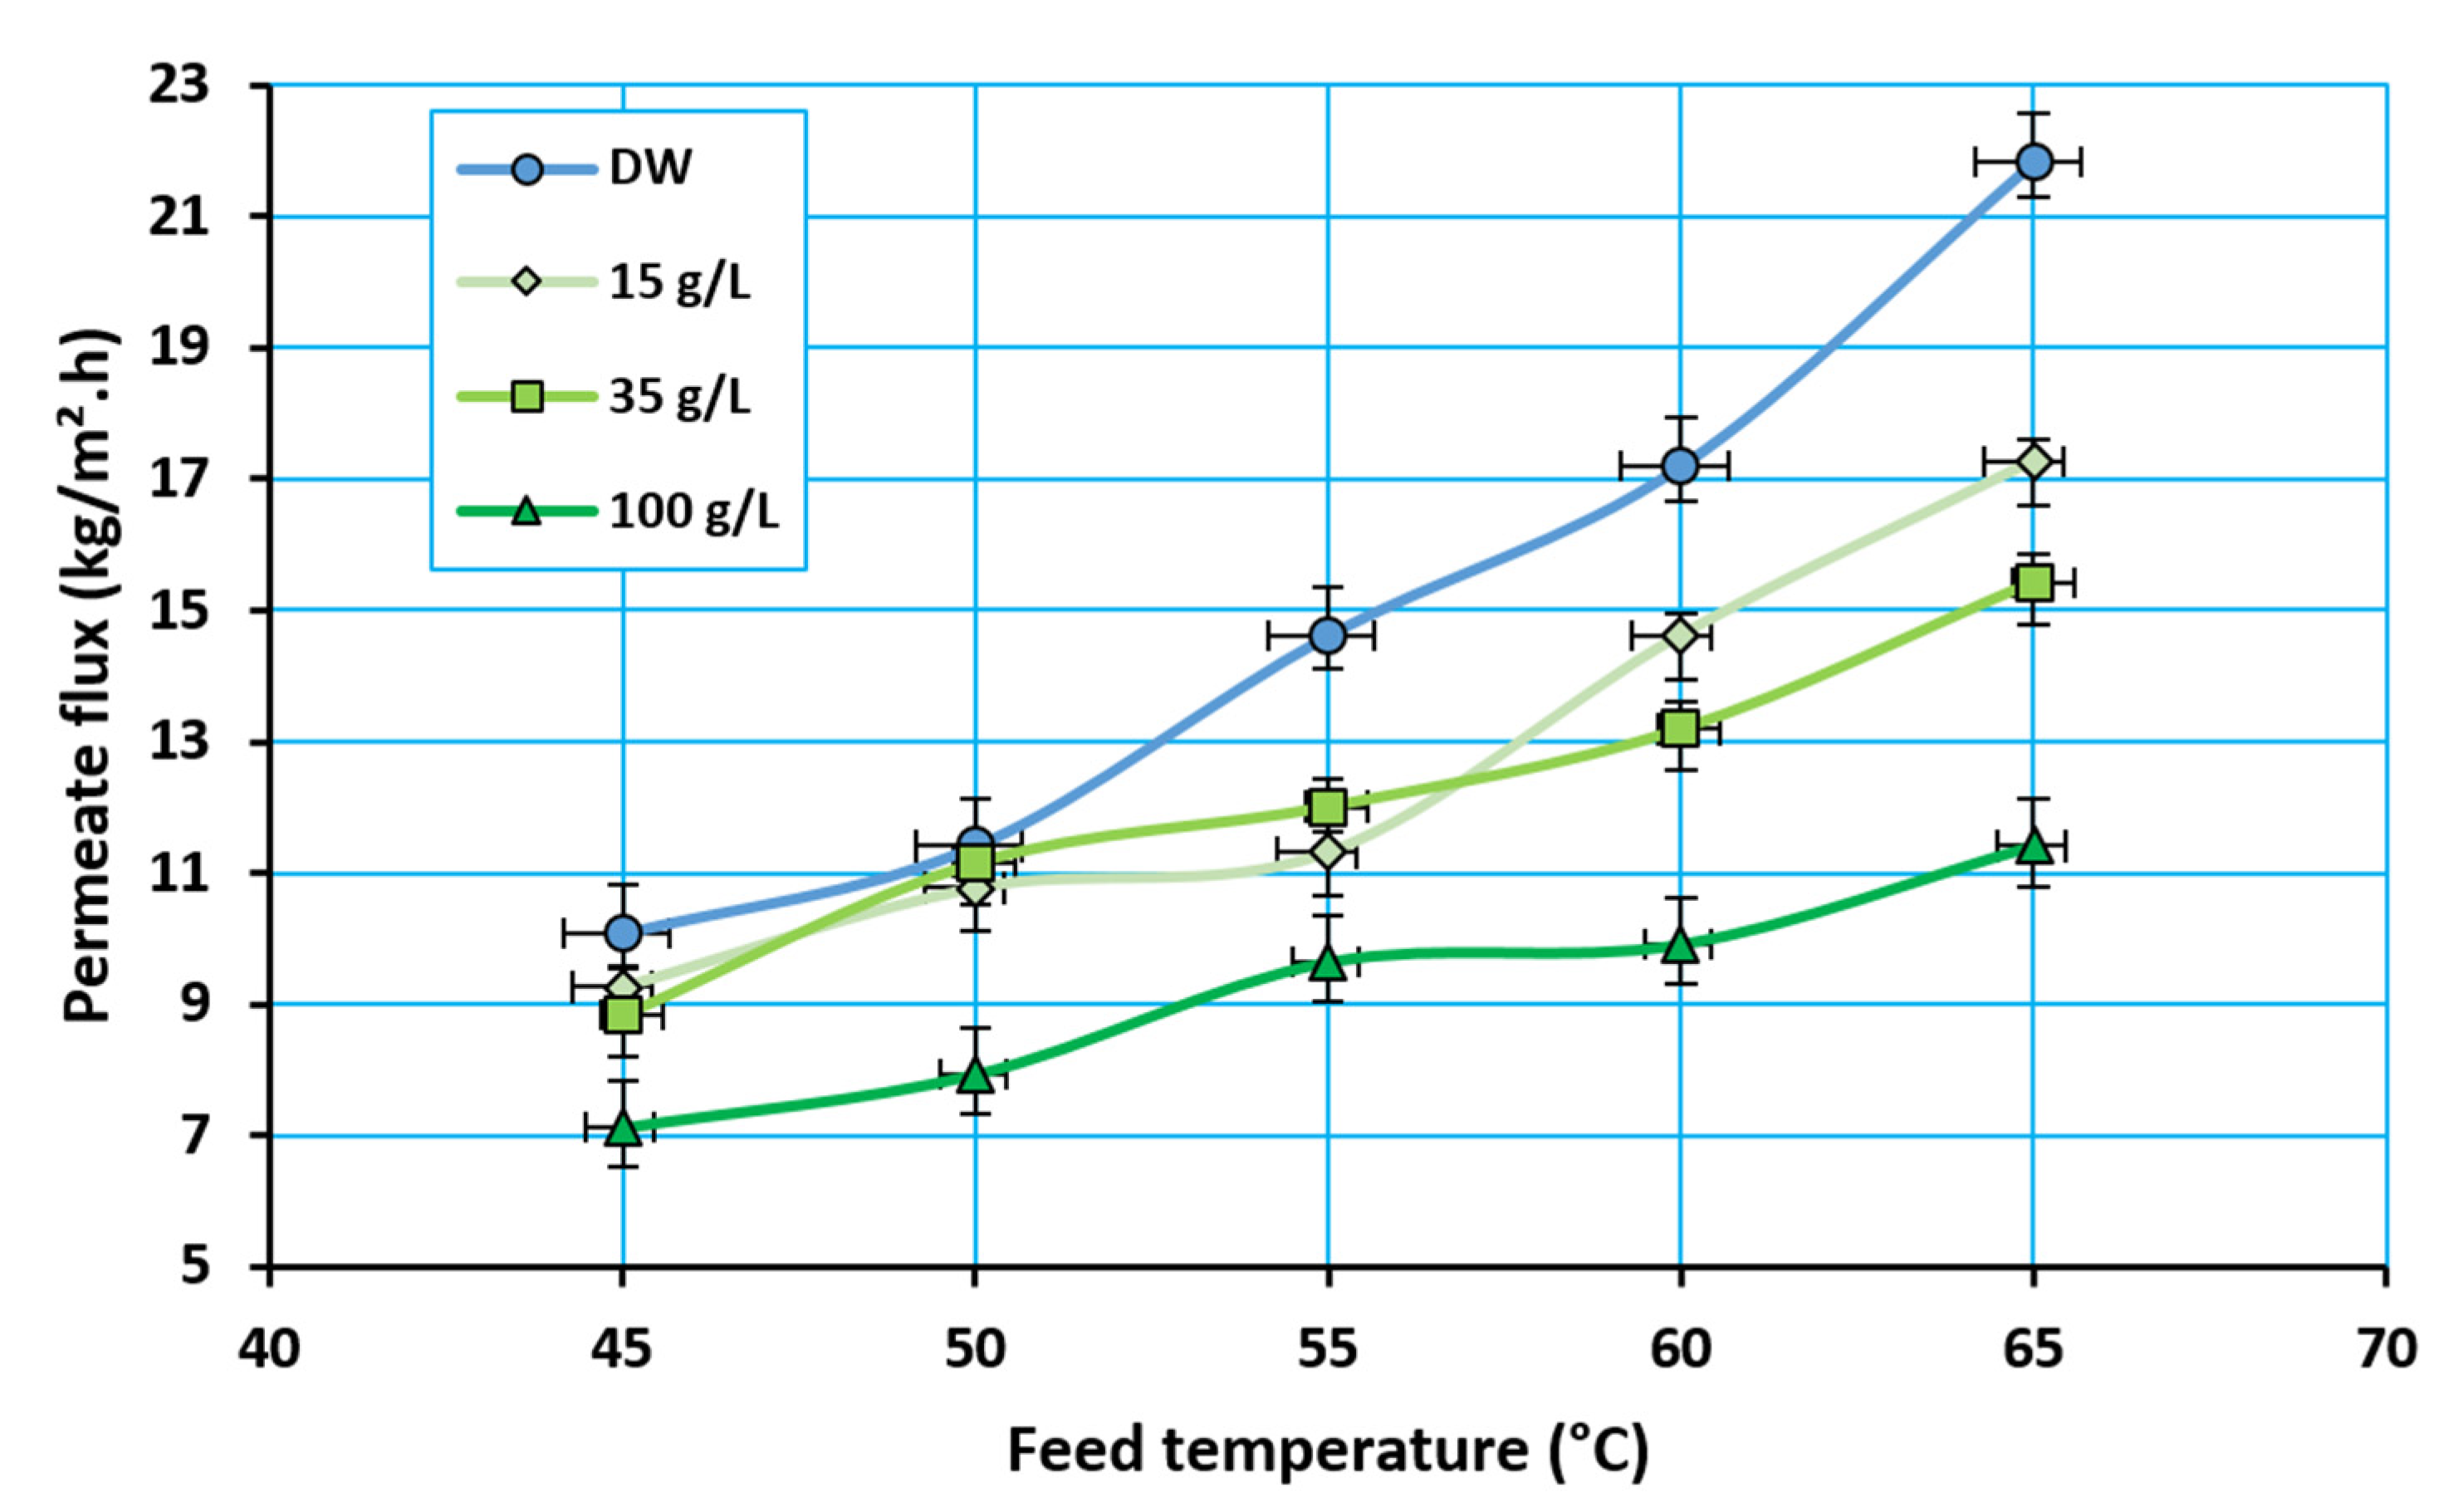
Figure 4 shows the impact of the hot feed temperature on the distillate production at different concentrations. The temperature was investigated in the range of 45–65 °C, at 5 °C intervals, in relation to the feed concentrations of 0, 15, 35 and 100 g/L; whereas, the feed flow rate was fixed at 1.07 L/min. For all the salt concentrations, the permeate flux increased under increasing temperature; this phenomenon can be understood as increasing the driving force (vapor pressure) as a result of the temperature increase. The partial vapor pressure was exponentially related to the temperature, as described by the Antoine equation. In addition, raising the temperature led to an increase in the kinetic energy of the liquid molecules to overcome the liquid phase intermolecular forces, which was followed by evaporation. This kinetic energy was proportional to the temperature of the molecules, so the evaporation was more rapid at higher temperatures.
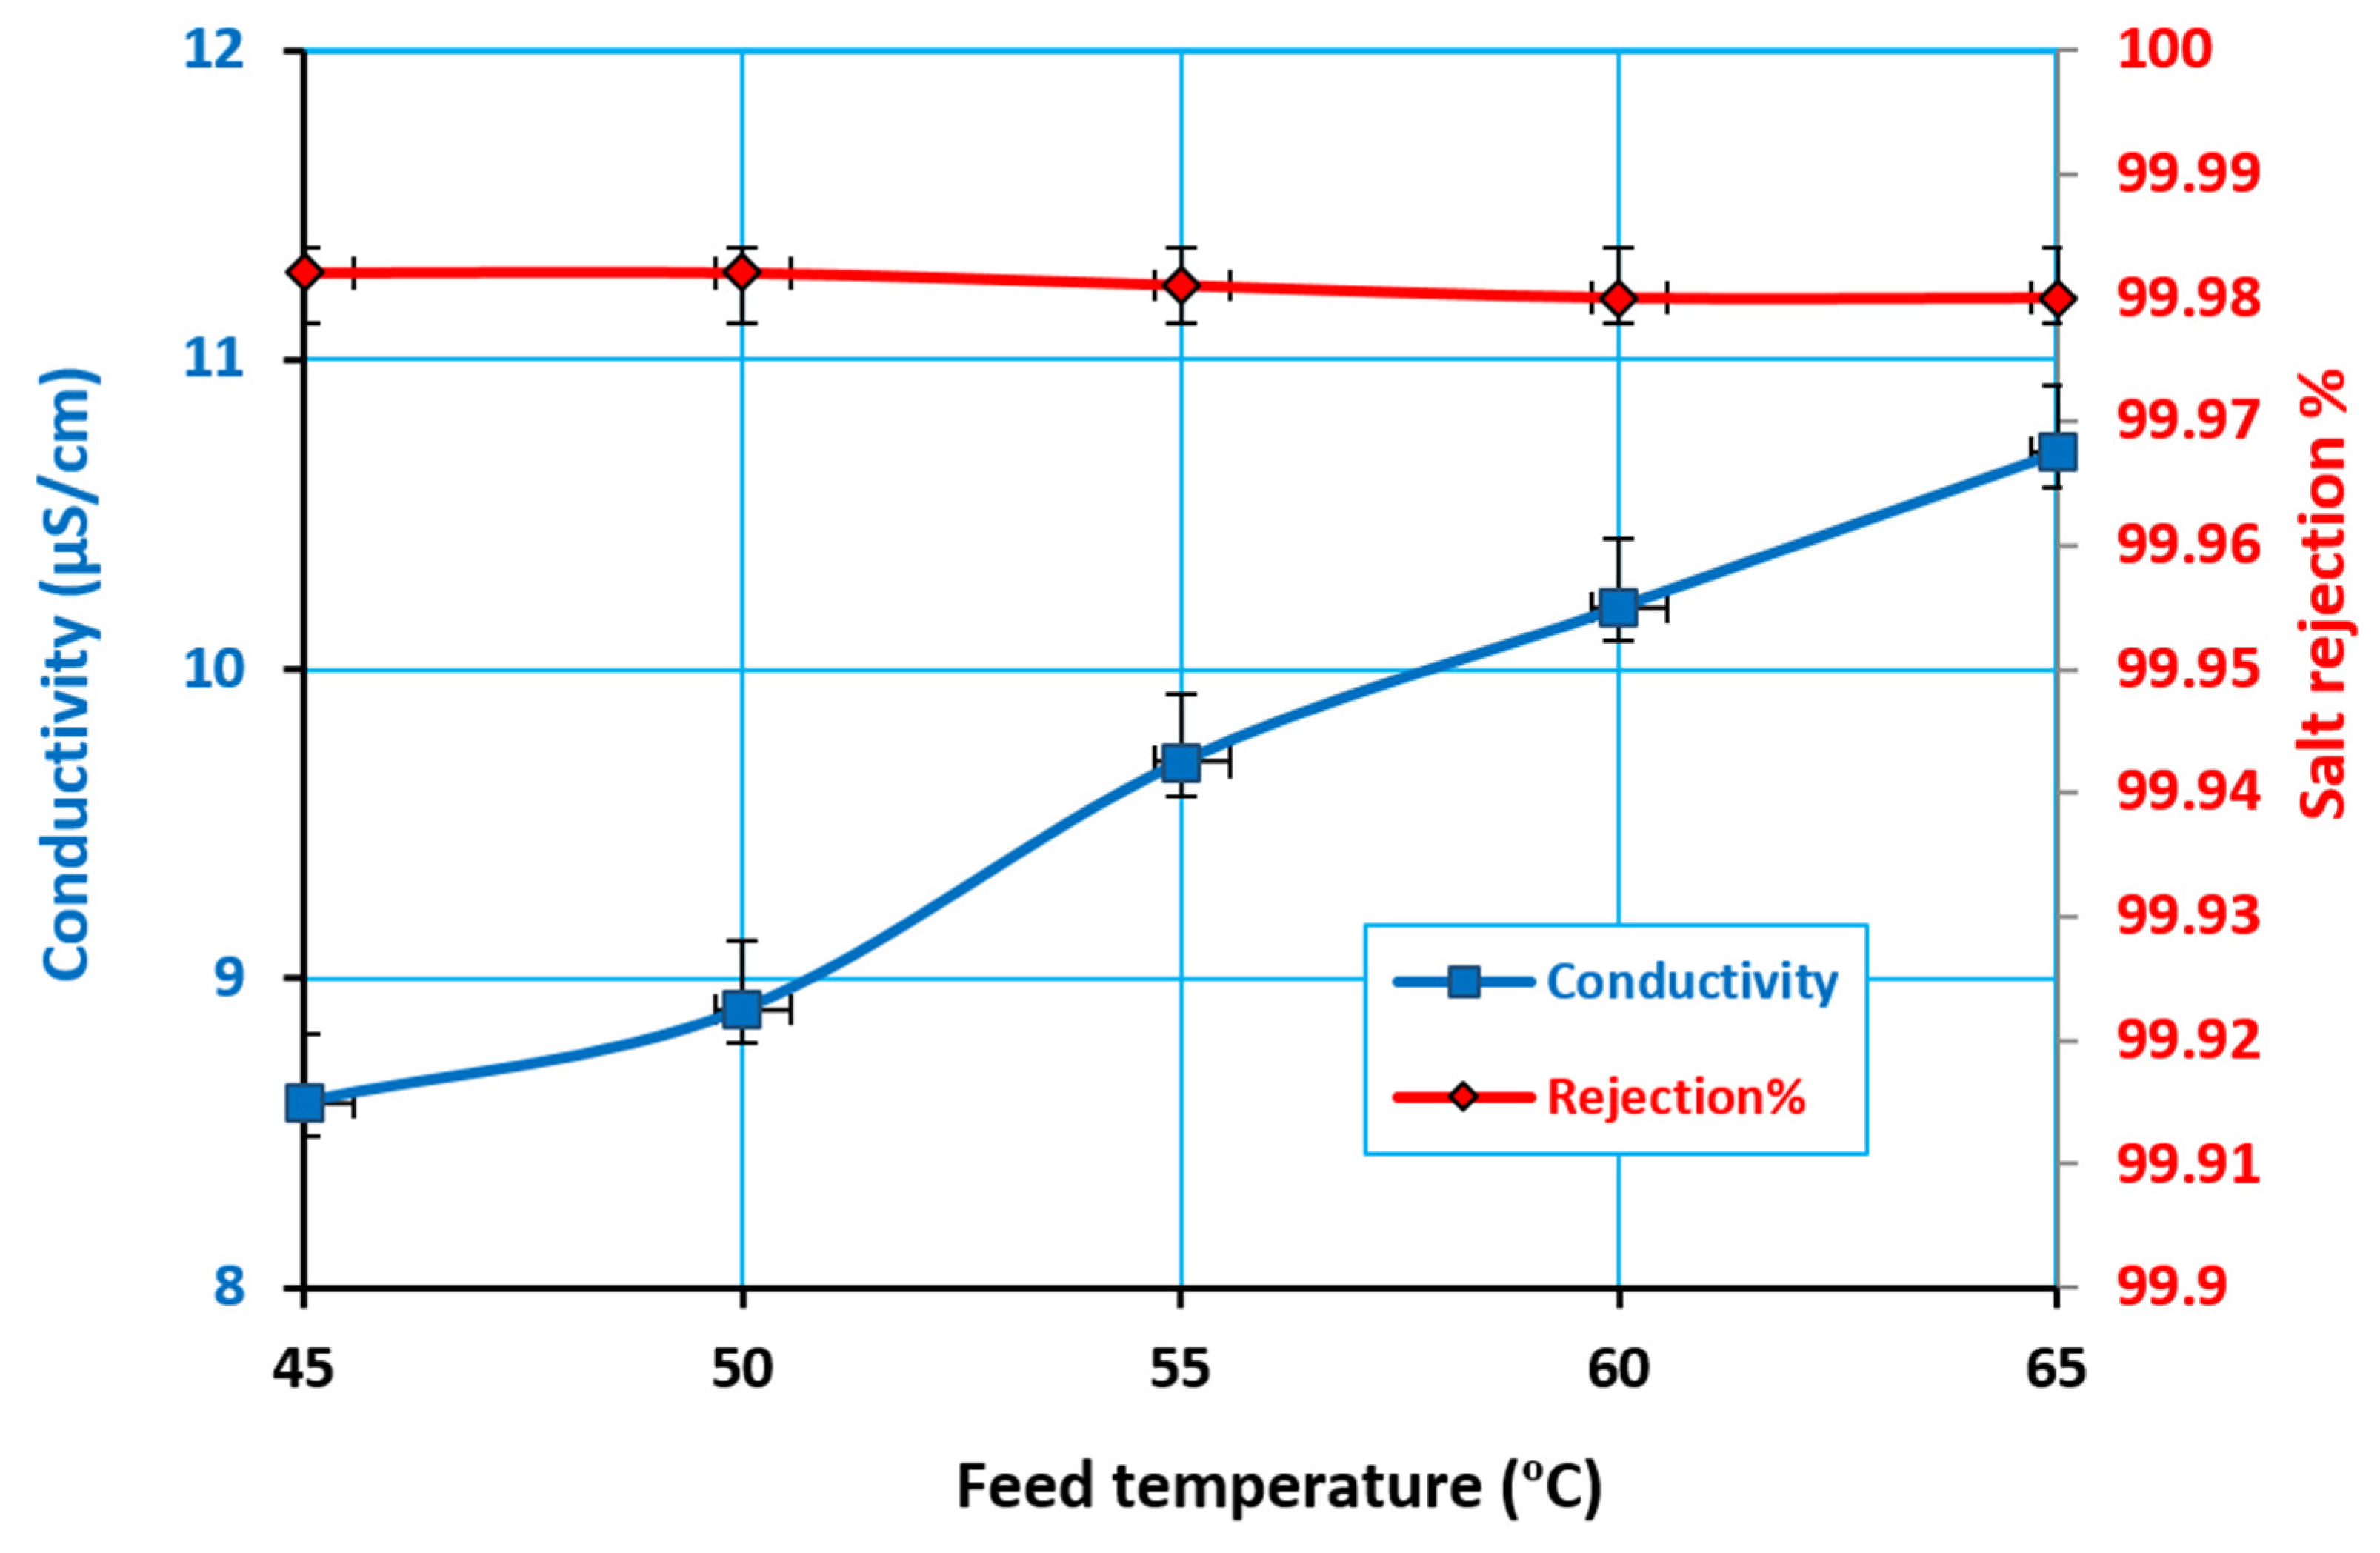
The effect of the feed temperature on the permeate conductivity and salt rejection for the solution of 35 g/L NaCl is shown in Figure 5. The permeate conductivity increased slightly by increasing the feed temperature. This behavior could be explained because the temperature has a minor effect on the membrane pore wetting process. The permeate conductivity ranged from 8–12 μS/cm, with a salt rejection of about 99.98%. The high salt rejection, as shown in Figure 5 for seawater desalination, indicates the high desalination performance of the DCMD system.
4.2. Effect of Feed Concentration
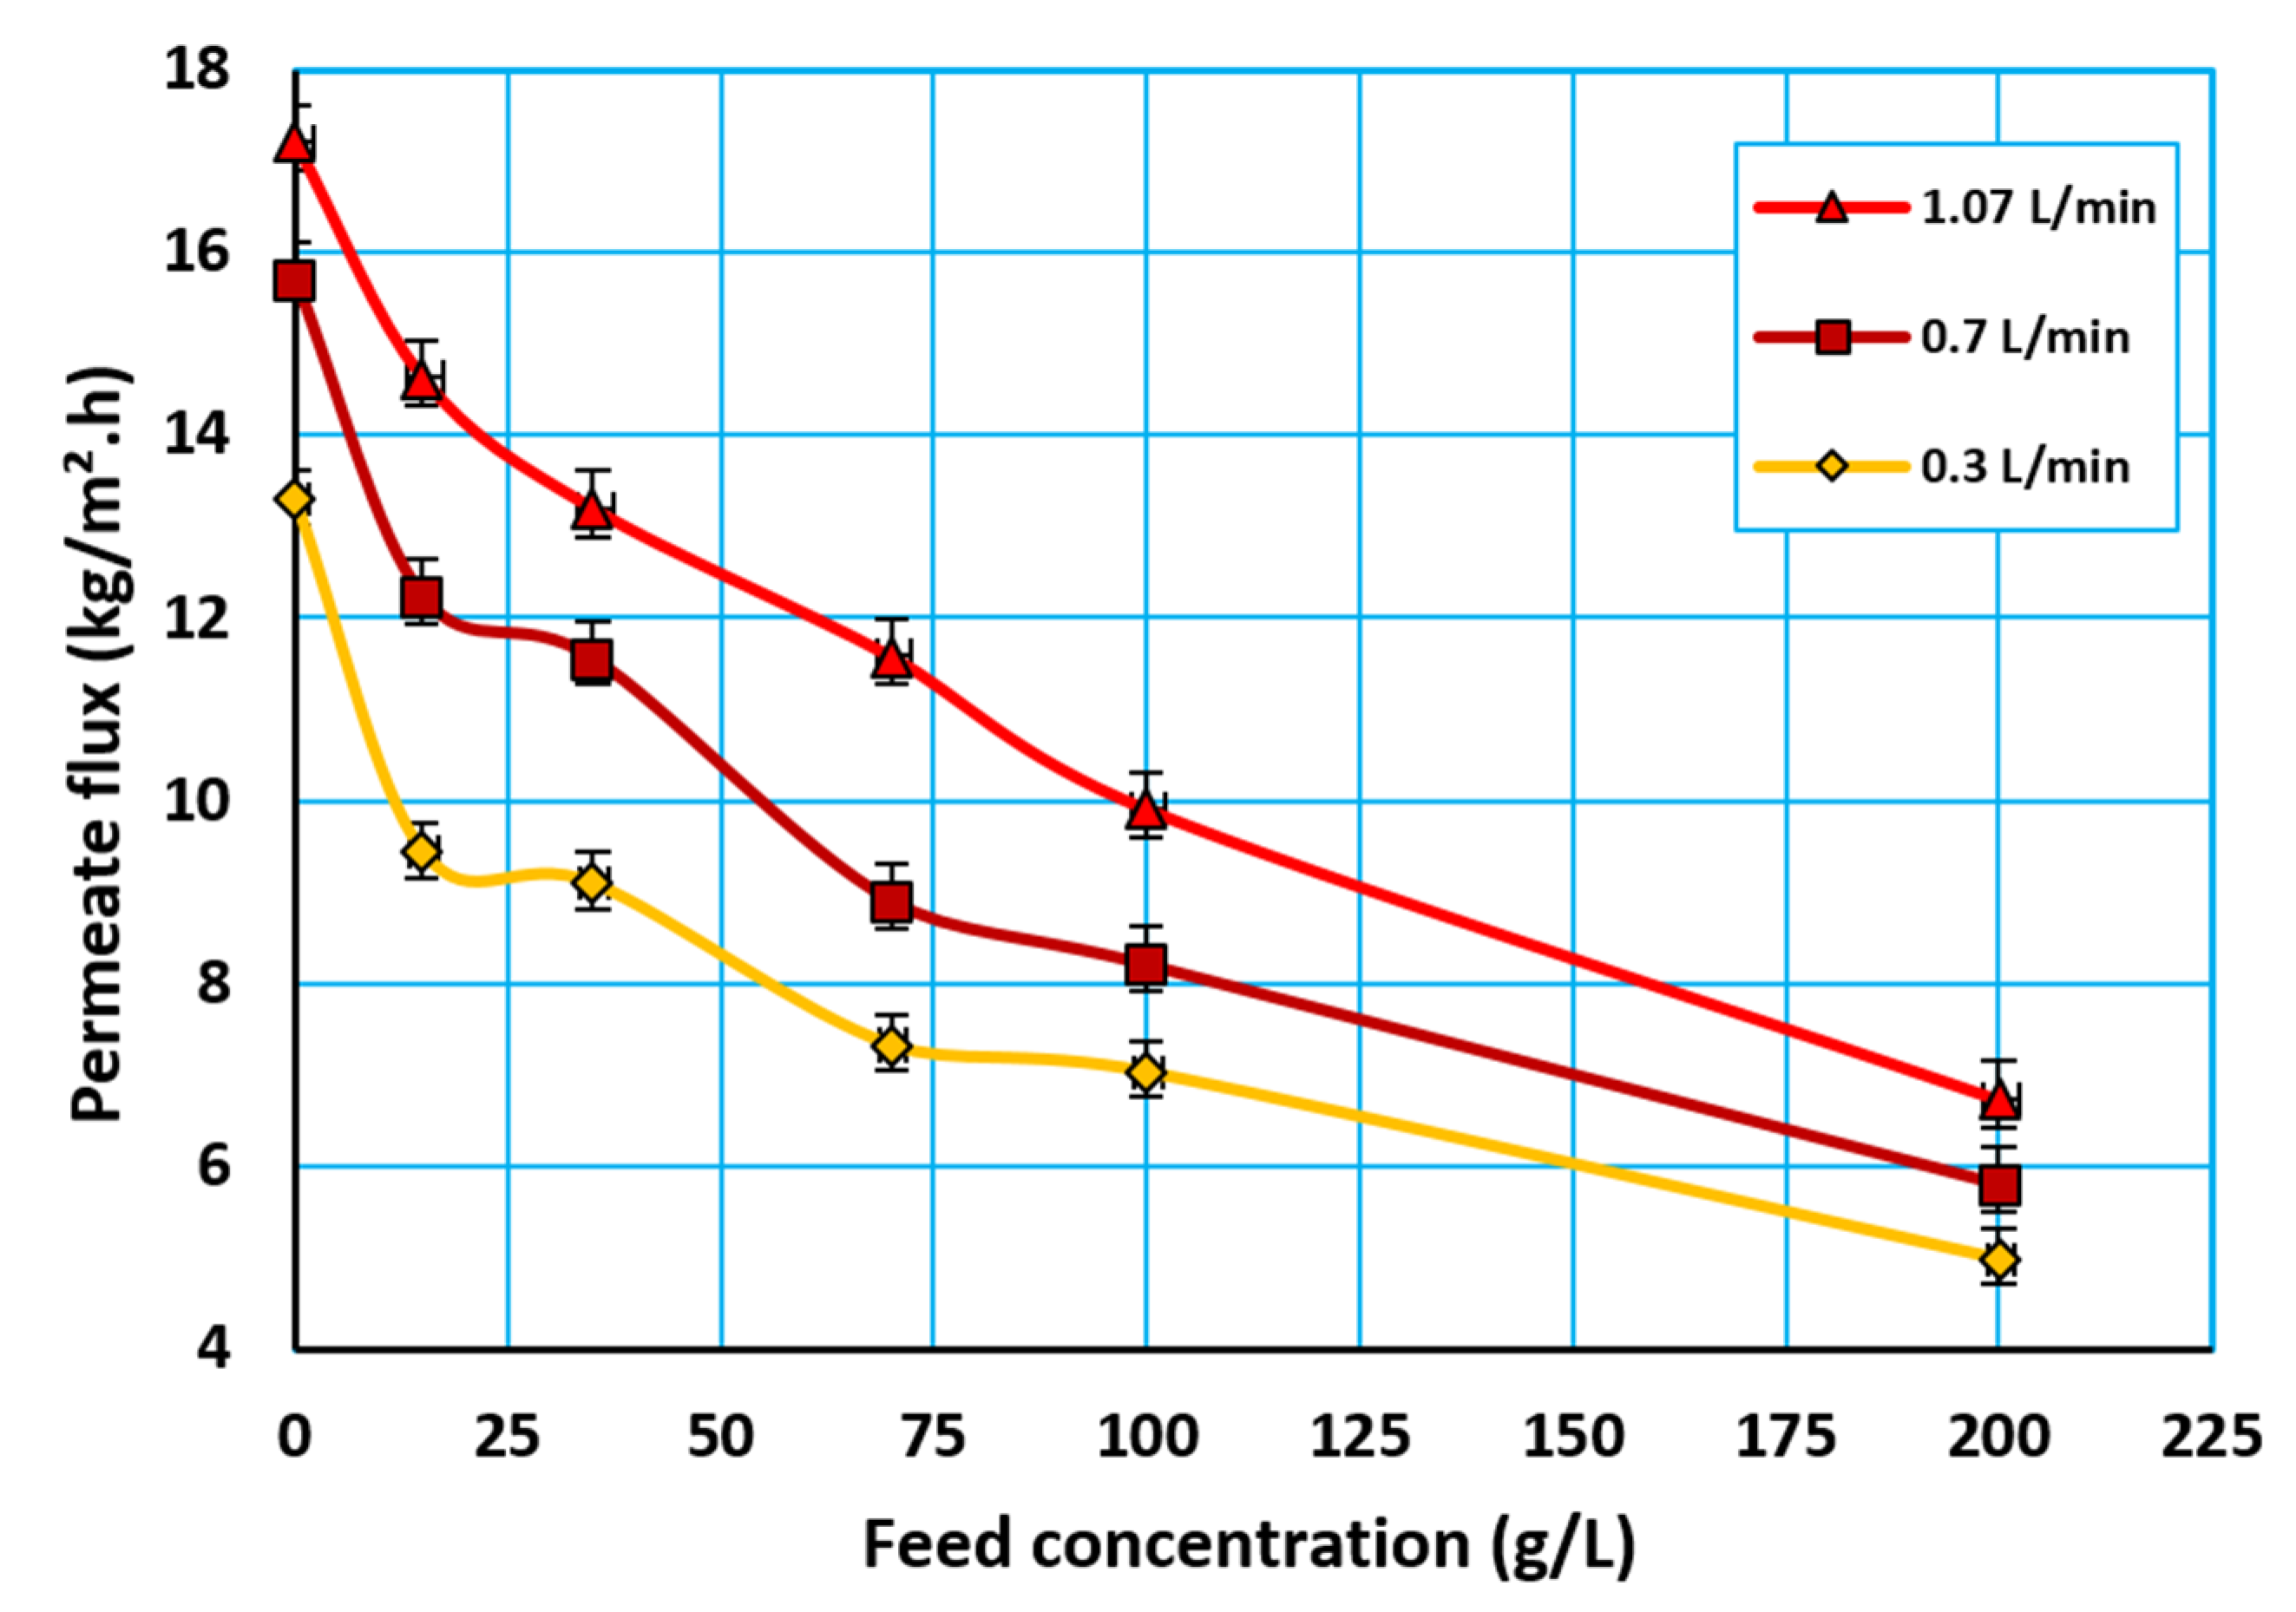
Figure 6 shows the effect of the feed concentration on the permeation flux. The experiments were carried out at various feed concentrations (i.e., 0, 15, 35, 70, 100 and 200 g/L NaCl) and feed flow rates (i.e., 0.3, 0.7 and 1.07 L/min), while the feed temperature remained constant at 60 °C. The results show that the permeate flux decreased by 23.28%, while the feed salt concentration increased from 0 to 35 g/L. Moreover, the permeate flux decreased by about 24.91% and 32% by increasing the salt concentration from 35 to 100 and from 100 to 200 g/L, respectively. The permeate flux decreased with increasing feed concentration. This reduction can be attributed to the effect of concentration polarization, where the accumulated salt molecules on the membrane surface obstructed the vapor motion, resulting in additional resistance against the mass transfer. In addition, the higher concentration of saline enhanced the boiling point because the NaCl molecules formed hydrogen bonds with the water molecules. These molecules required additional kinetic energy to create enough movement to break their hydrogen bonds and convert the water from liquid into vapor.
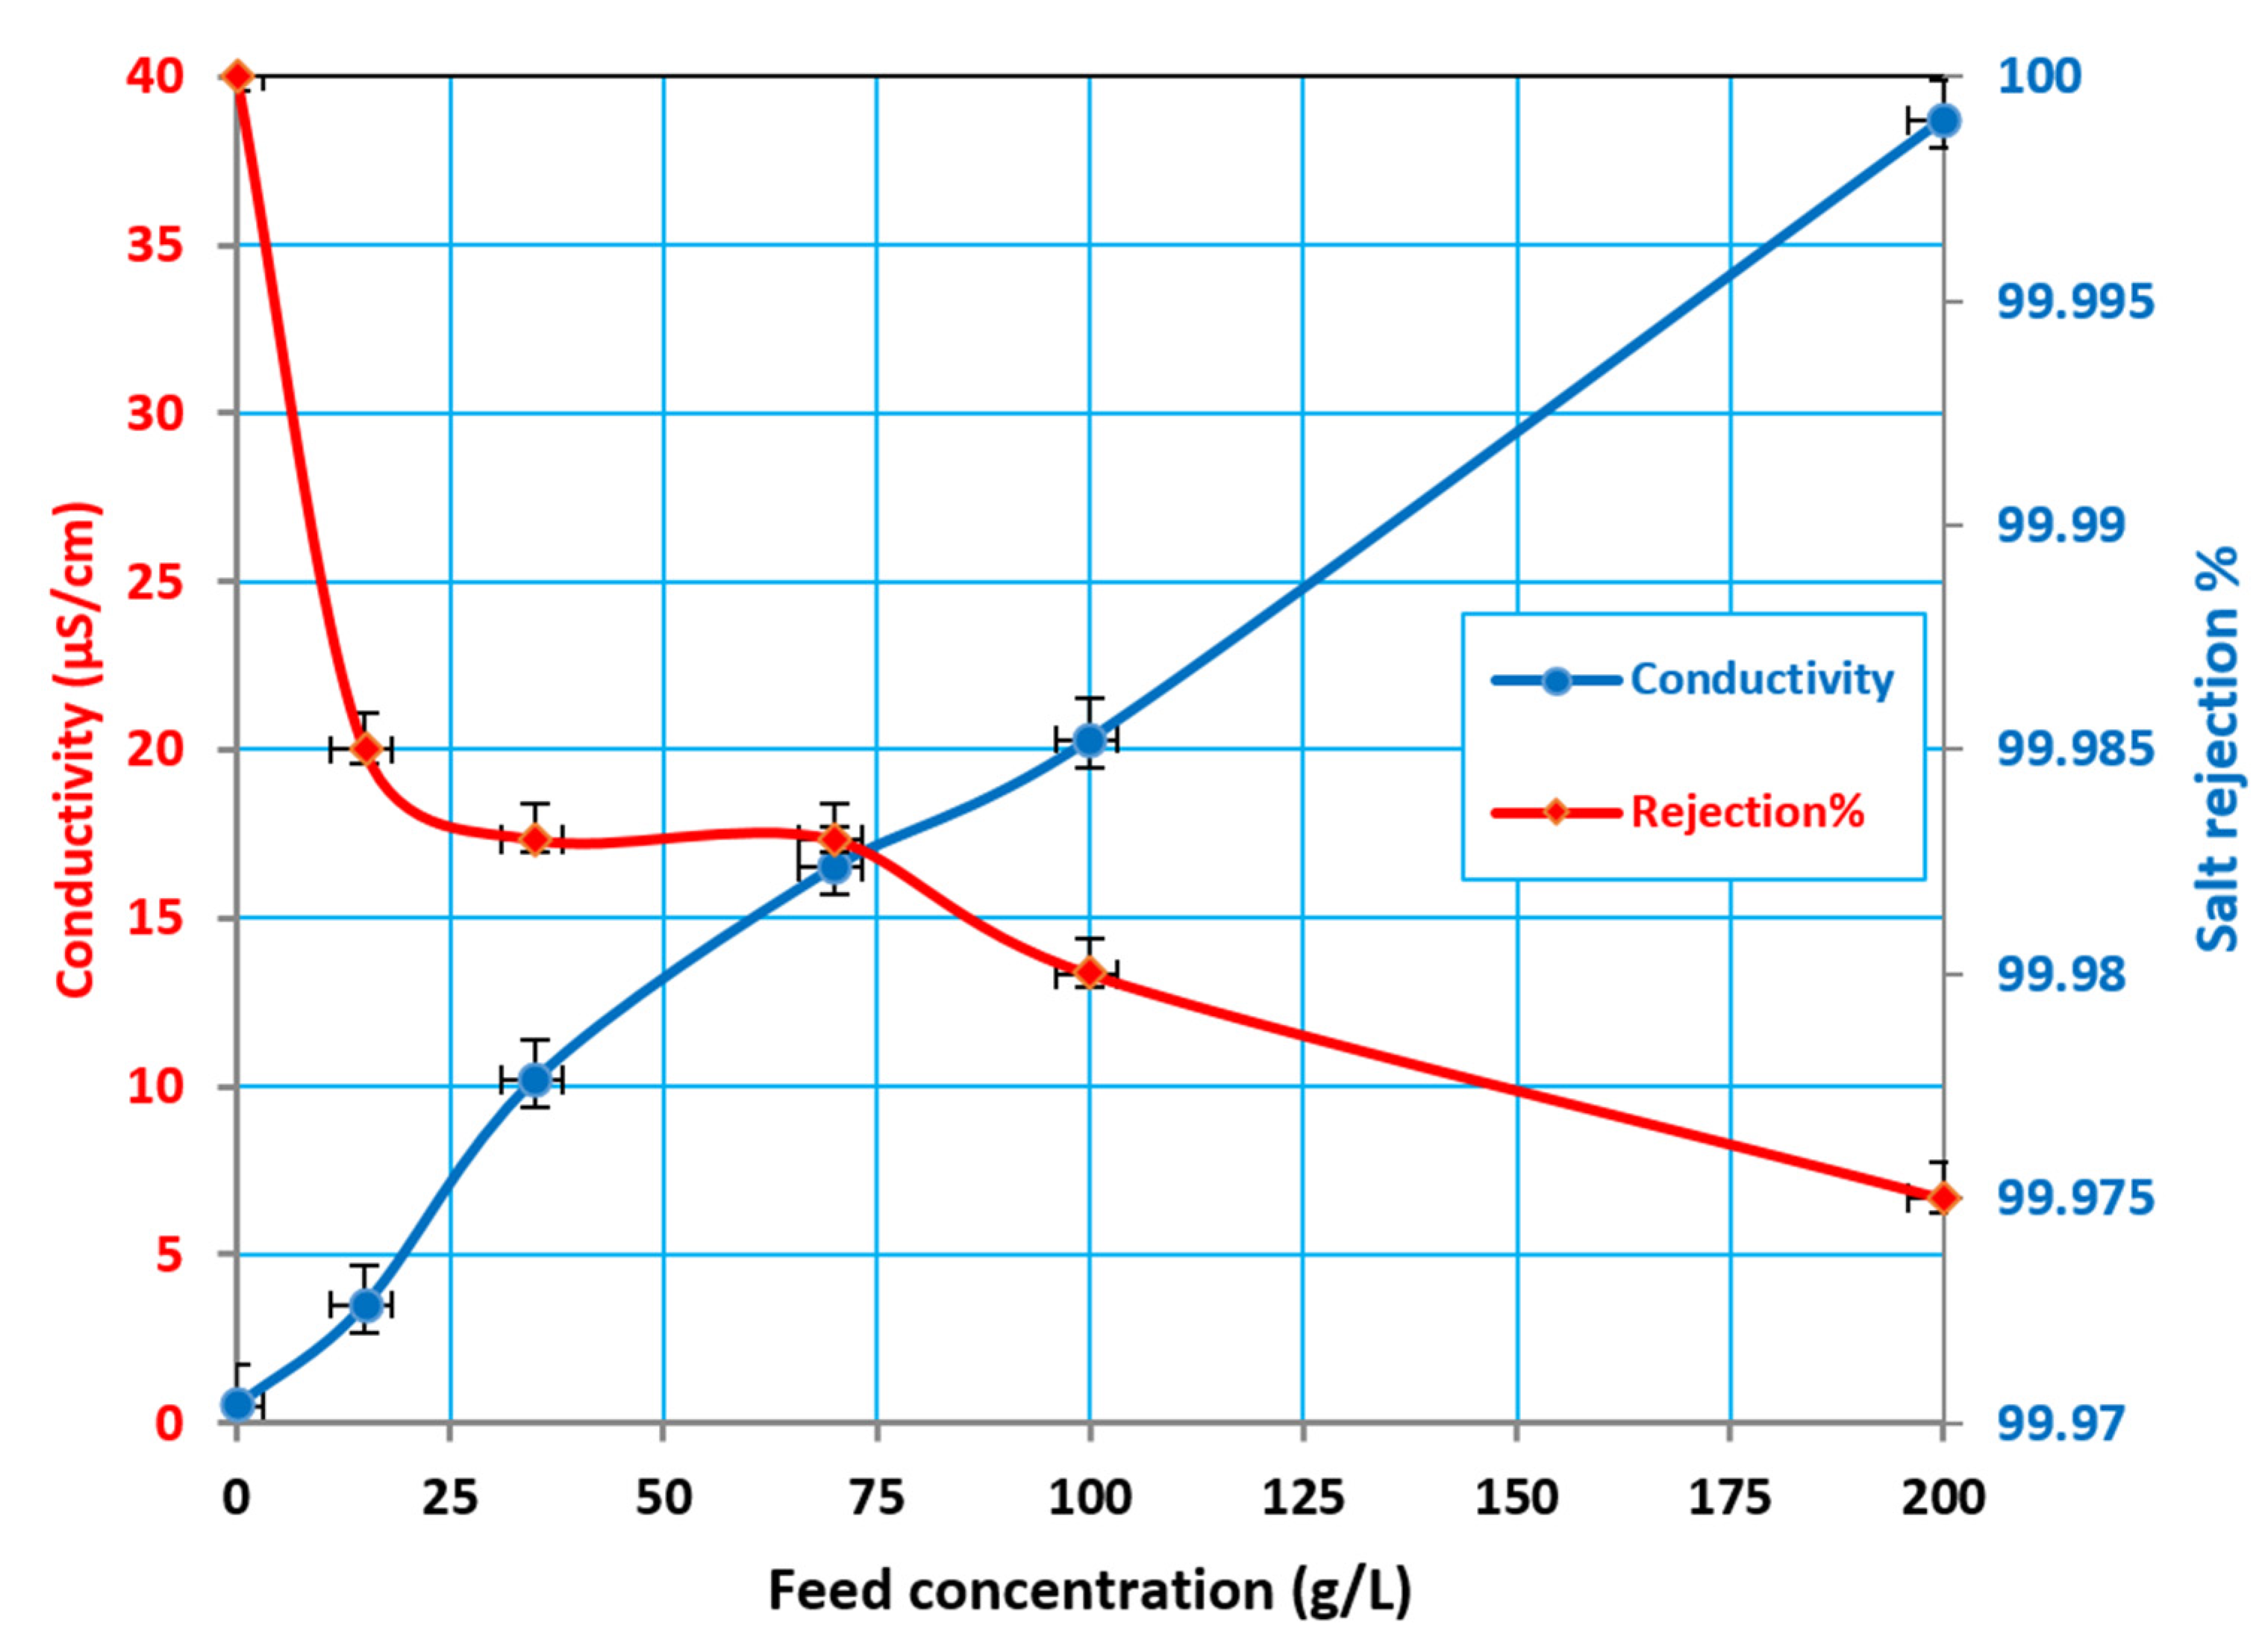
Figure 7 shows the impact of the saline feed concentrations on the salt rejection at a constant hot feed temperature and flow rate. The permeate conductivity increased and the salt rejection slightly decreased when the concentration of the inlet solution increased. The increase in the permeate conductivity can be attributed to a slight decrease in the liquid entry pressure (LEP) in the presence of a high concentration of inorganic salts. This caused a slight decrease in the surface tension of the feed solution, in direct proportion to the value of the LEP, as shown in the following Laplace (Cantor) equation:
where B is a geometric factor, is the surface tension of the solution, is the contact angle between the solution and the membrane surface (which depends on the hydrophobicity of the membrane), and is the largest pore size. However, the percentage of salt rejection remained at 99.97%, even when the highest feed concentration (200 g/L) was used.
4.3. Effect of the Feed Flow Rate
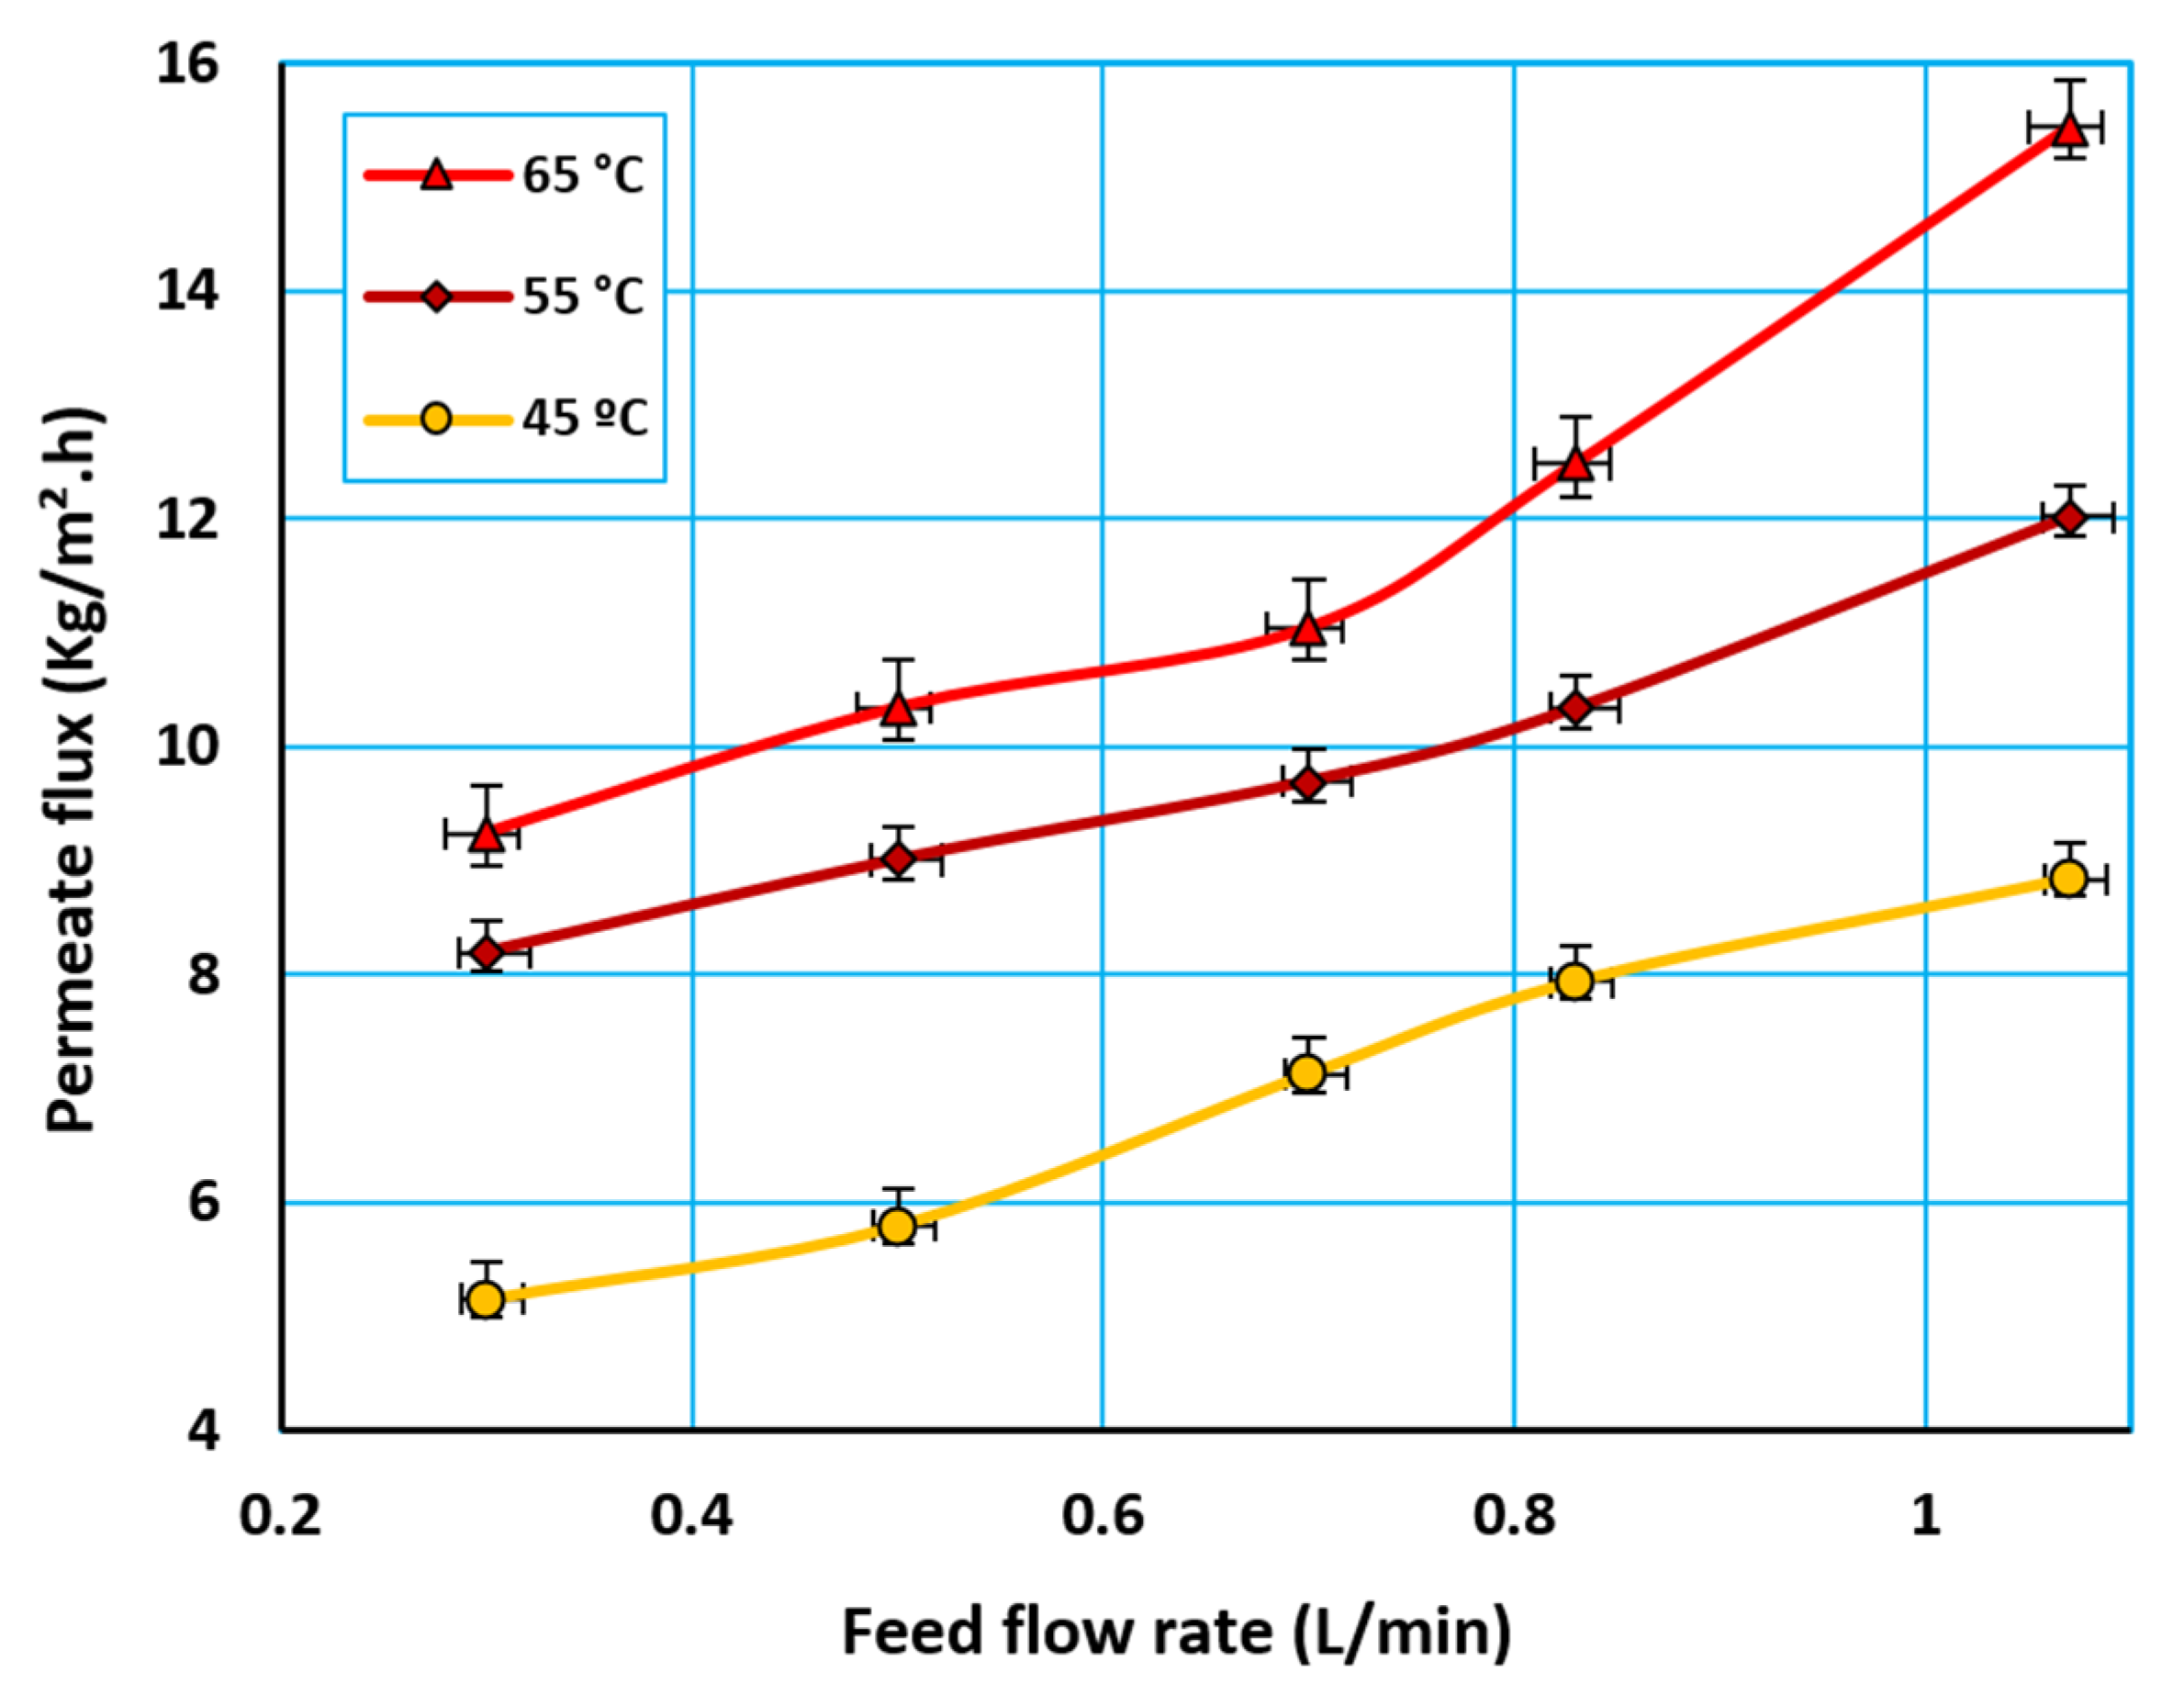
Figure 8 presents the influence of the feed flow rate, ranging from 0.3 to 1.07 L/min, on the permeation flux at various temperatures (i.e., 45, 55 and 65 °C), with a constant salt concentration in the feed. As shown in the figure, the permeate flux increased approximately linearly when increasing the feed flow rate. The increase in the flux became noticeable when both the feed flow rate and temperature were increased simultaneously. When the feed flow rate increased from 0.3 to 1.07 L/min, the flux increased by 46.62% and 67.1% at feed temperatures of 55 °C and 65 °C, respectively. The feed high flow enhanced the fluid mixing and reduced the temperature and the concentration boundary layers. Hence, the membrane surface temperatures converged with those of the bulk streams. Thus, the temperature difference across the membrane sides increased and resulted in an improved permeate flux.
4.4. Theoretical Results
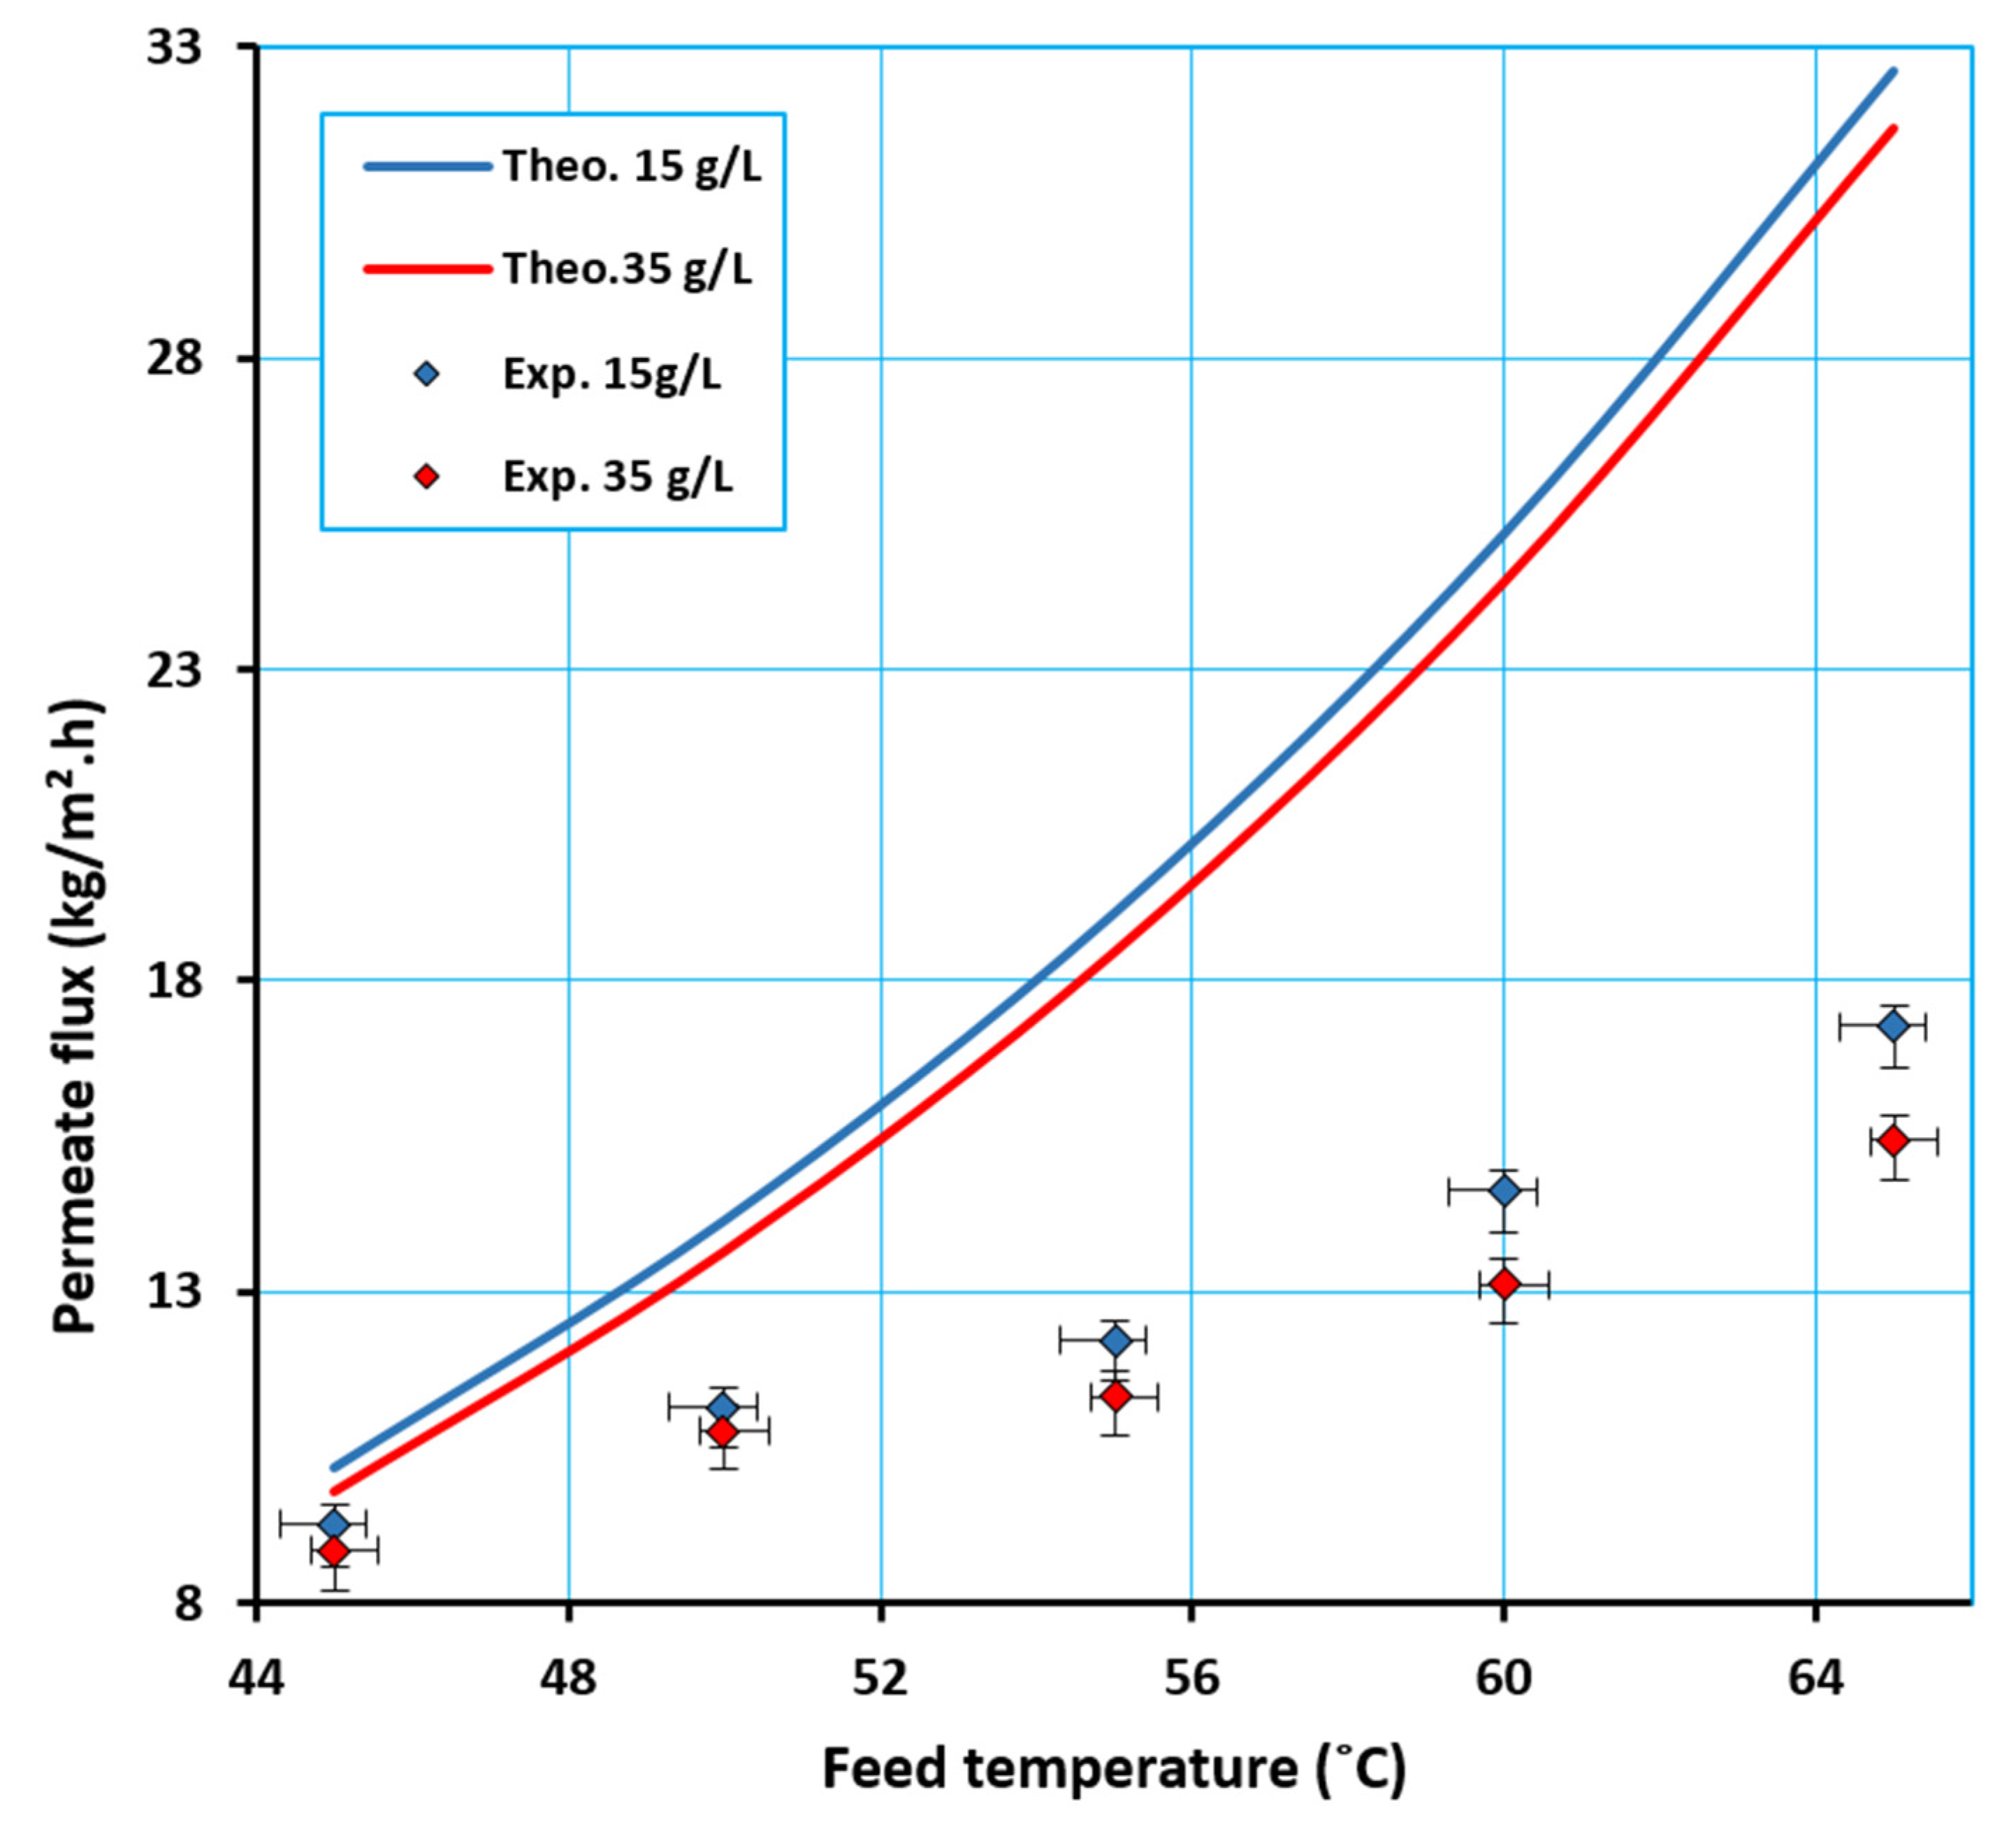
The proposed mathematical model was validated by comparing its simulated results with the experimental data. Figure 9 illustrates the comparison between the predicted model and the experimental data of 15 and 35 g/L NaCl solutions at τ = 1.9082, which was calculated using Equation (11), with a PTFE membrane porosity of 78%. This figure shows that there is a large deviation between the theoretical and experimental results for both feed concentrations. The suggested hypothesis attributed that result to the variation of the membrane characteristics under the run and the hypothetical path () for the water molecules transported across the membrane which expressed to the mass transfer resistance as shown in Equations (1), (6), (7) and (8). This problem had been detected by previous researchers when using the tortuosity factor (τ) and actually the change in mass transfer resistance was the main reason for the present tortuosity in these studies; unfortunately, there was no direct practical way to precisely measure the membrane tortuosity and also other membrane characteristics under the DCMD process run.
In the literature, different ways were found for evaluating tortuosity of which a value of 2 was frequently assumed in order to predict the permeation flux [25,36]. Sometimes it was calculated using various correlations of the tortuosity related with the porosity such as the two well known equations or (Equation (11)) [21,22] to evaluate the value of tortuosity. However, other authors assumed values of tortuosity [24,26,37] in order to make the simulation results be more fitting with the experimental results and were often out of the range of these two well known equations for example Jeong, S. et al., 2014 [37] assumed a tortuosity of 4.2, 6.6 and 10.1 for three different PTFE membranes of 66.8%, 72.6% and 72.8% porosity respectively. While, respectively, the estimated values were 1.497, 1.378 and 1.374 when using the equation and 2.656, 2.236 and 2.223 when using Equation (11) .
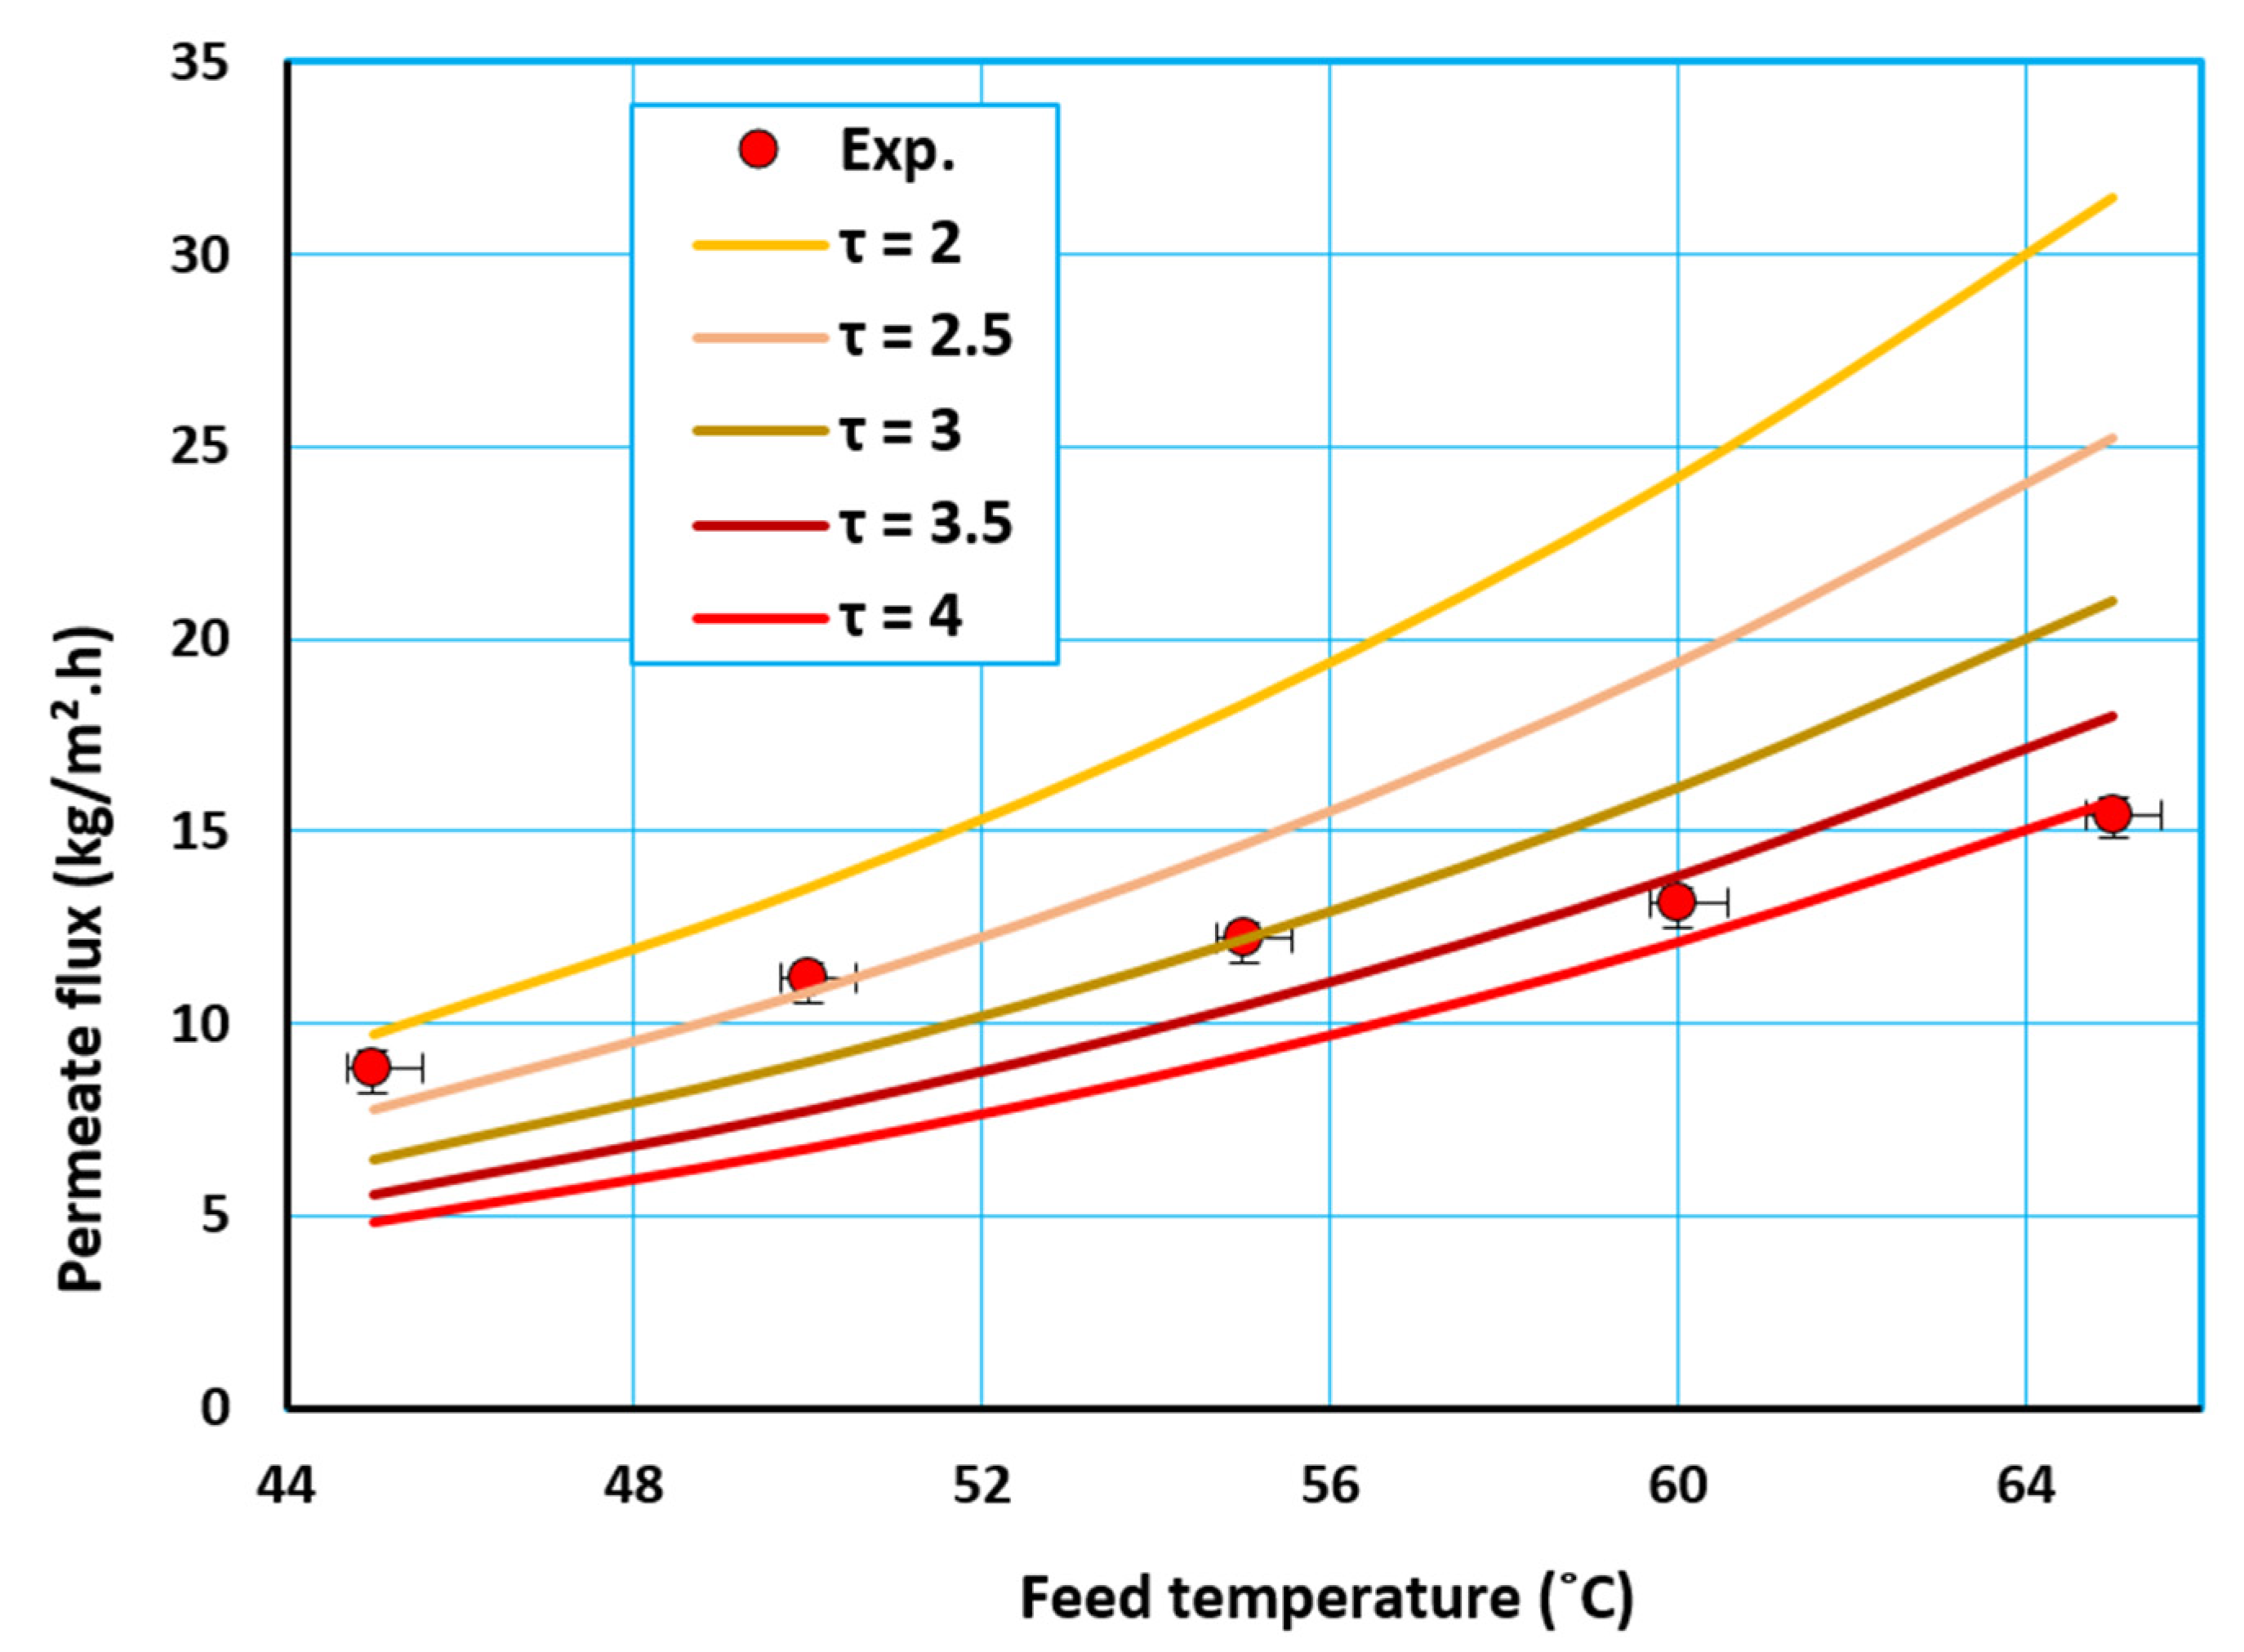
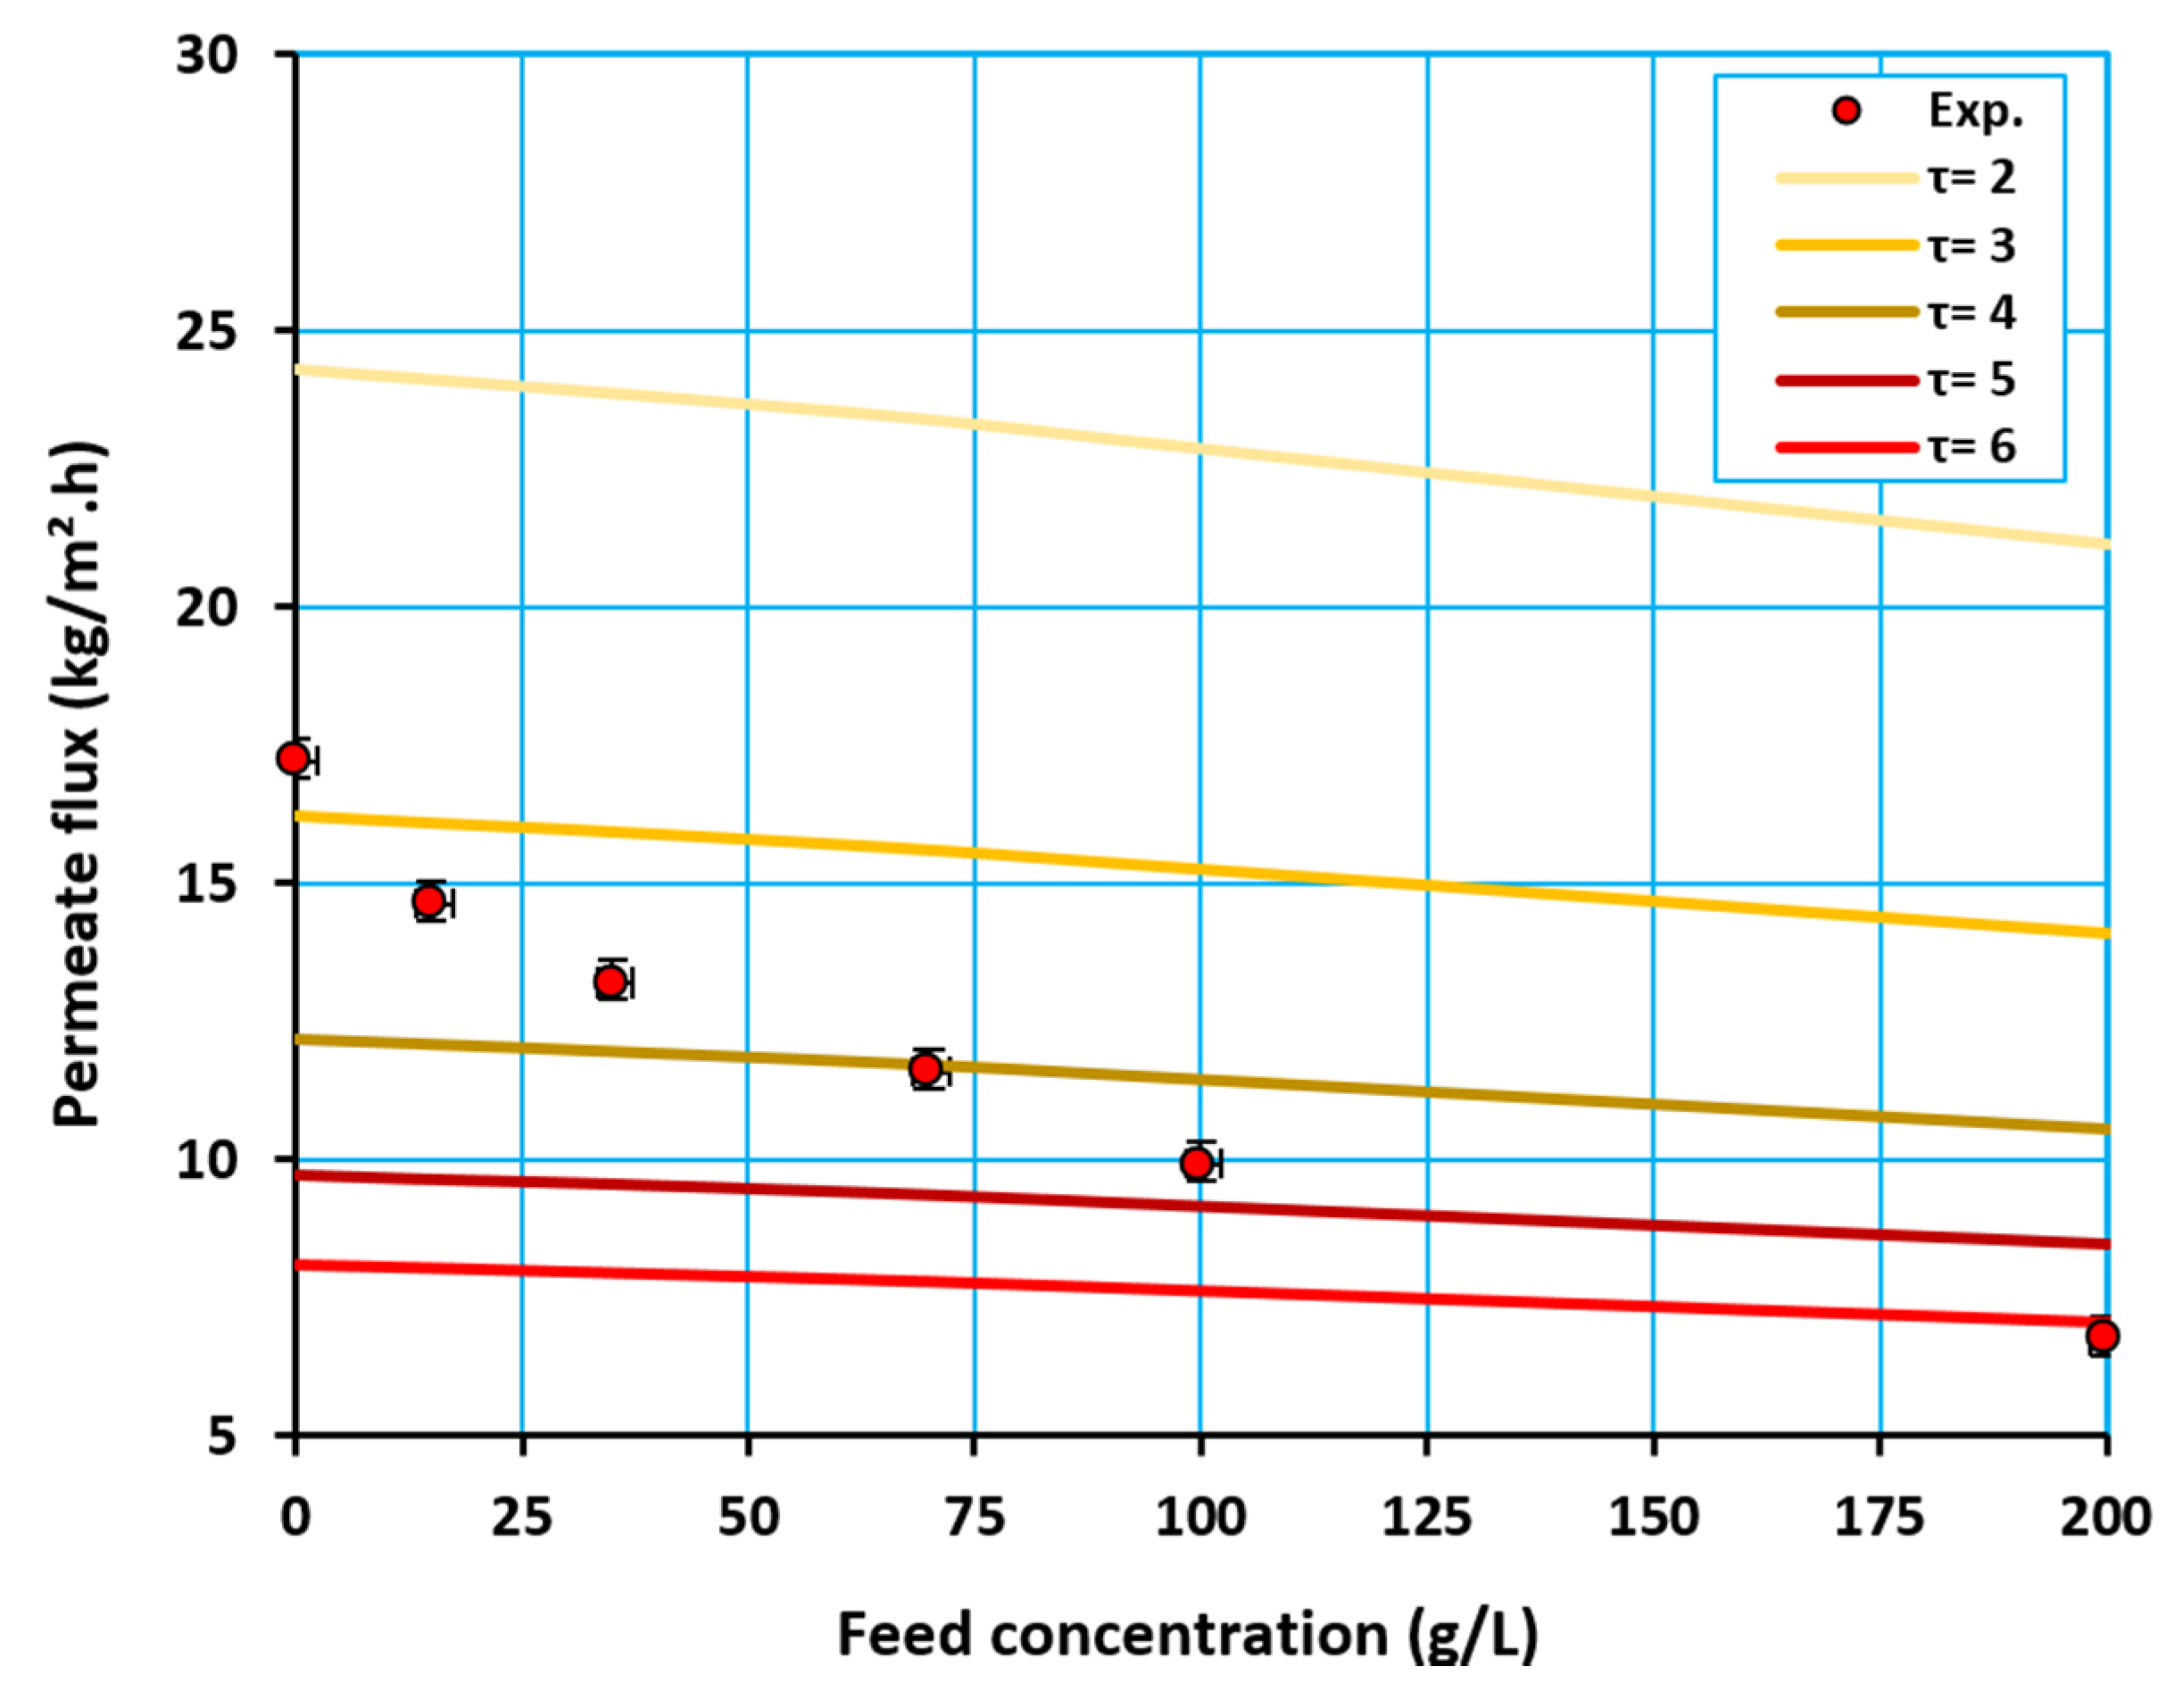
In the current study, it was found that the hypothetical path () depended upon the operating conditions. To confirm our hypothesis, various values of the hypothetical path were used in this work. However, it was found based on the simulated results (shown in Figure 10 and Figure 11), that the hypothetical path had a significant effect on the performance and results of the developed model. It was found that there was a significant enhancement in the model’s simulated results (the predicted permeation flux), with slight changes in the hypothetical path values, depending upon the operating conditions. In the present study, as illustrated in Figure 10 and Figure 11, the mathematical model indicated that the hypothetical path across the membrane varied with the operating conditions (i.e., feed temperature and concentration). The hypothetical path increased with increasing feed temperature and concentration. Moreover, as shown in Figure 10 and Figure 11, no specific value could be used to get a good agreement with the various operating conditions; however, different values could be used depending upon the specific operating conditions so that the simulated results could provide the best agreement with the obtained experimental data. This behavior may be attributed to the expansion in the membrane material with increasing temperature (Figure 10). Additionally, increasing the feed concentration caused a thin layer to form on the membrane surface due to salt molecules accumulated on the membrane surface when the water evaporated, which was responsible for the concentration polarization phenomenon. This adds more resistance to the water transfer across the membrane and tends to cover an effective area of the membrane, which then retards the evaporation process [31]. Thus, the hypothetical path value increased to express the extra mass transfer resistance that attached to the membrane (Figure 11).
In water desalination via DCMD process, the scaling growth due to crystal formation is a common phenomenon, even for low initial feed salt concentrations. During a continuous operation of the DCMD process, there will always be situations where membrane fouling will have a higher potential to occur. However, the knowledge of the mechanism and reasons why fouling occurs on the hydrophobic membrane surface is limited [38]. The permeate flux and salt rejection tended to decrease with increasing initial feed concentration as shown in Figures (Figure 6 and Figure 7) and the scale formation fouling resulted in the growth of crystals on the membrane surface, especially in the case of treated solutions with high salt concentrations [36,38]. Unwanted layers possibly formed on the surface and pores of the membrane increase the risk of the plugging of the pore entrances and pore wetting causing the production and quality decline of DCMD, since it is leading to partial membrane wetting [36,38].
Both the temperature and concentration could affect the membrane characteristics under the MD run. The effect of temperature is in terms of membrane swelling or shrinking, while the effect of concentration is in terms of changing the pore size, pore size distribution and porosity as fouling induces the plugging of many membrane pores and the reduction in the porosity of the membrane surface when faced with feed [36,38]. Therefore, due to the relationship between the tortuosity and porosity (Equation (11)), the hypothetical membrane path () could be altered during operation. Thus, in order to integrate all the changes in membrane characteristics that could occur under the DCMD process run, tortuosity would be used to express all these expected changes.
In the present work, the hypothetical membrane path () based on the tortuosity given by Equation (11) was improved by relating the effect of temperature and concentration proposed here to be used theoretically to express the expected variation of the mass transfer resistance that arises during operations on the DCMD process as follows:
where T is the feed temperature in °C, and C is the feed concentration in g/L.
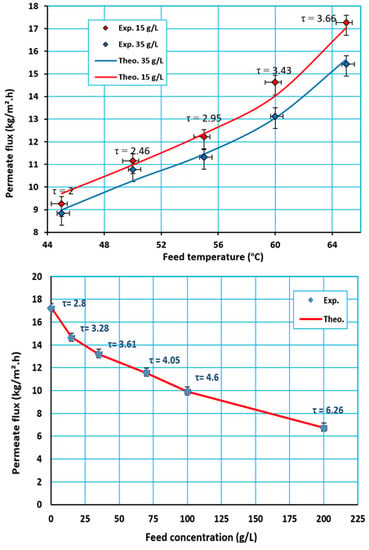
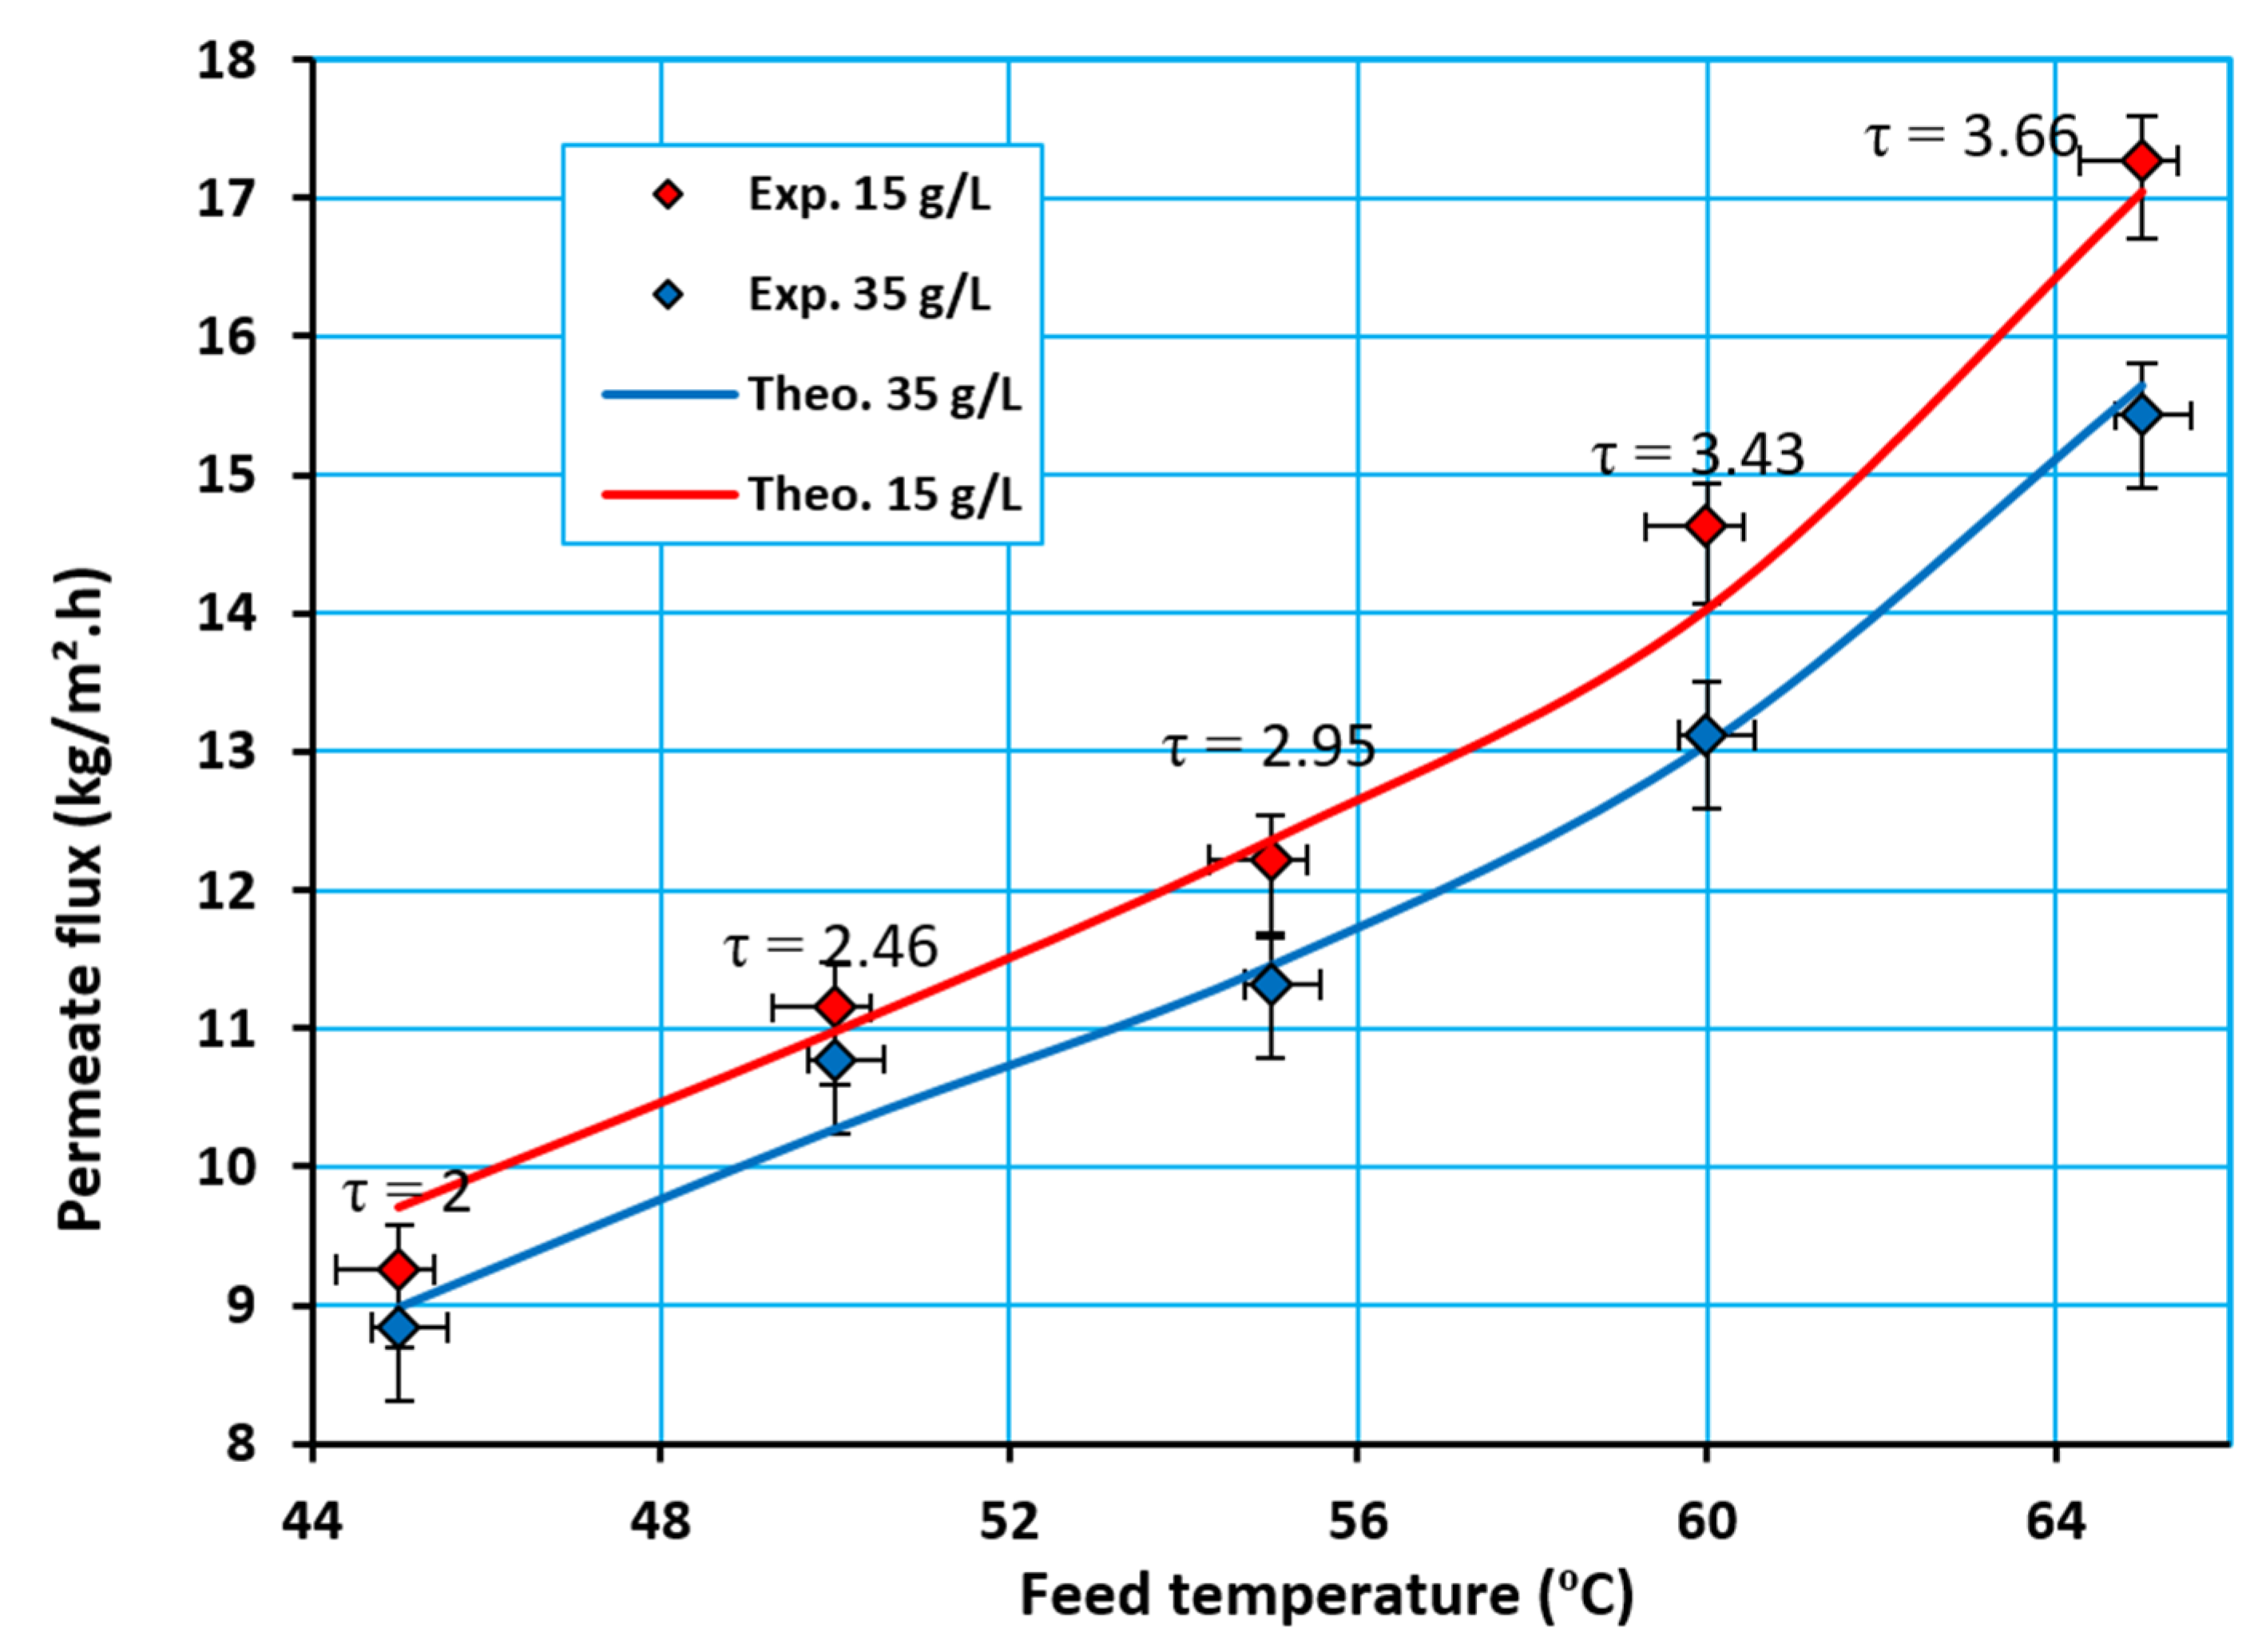
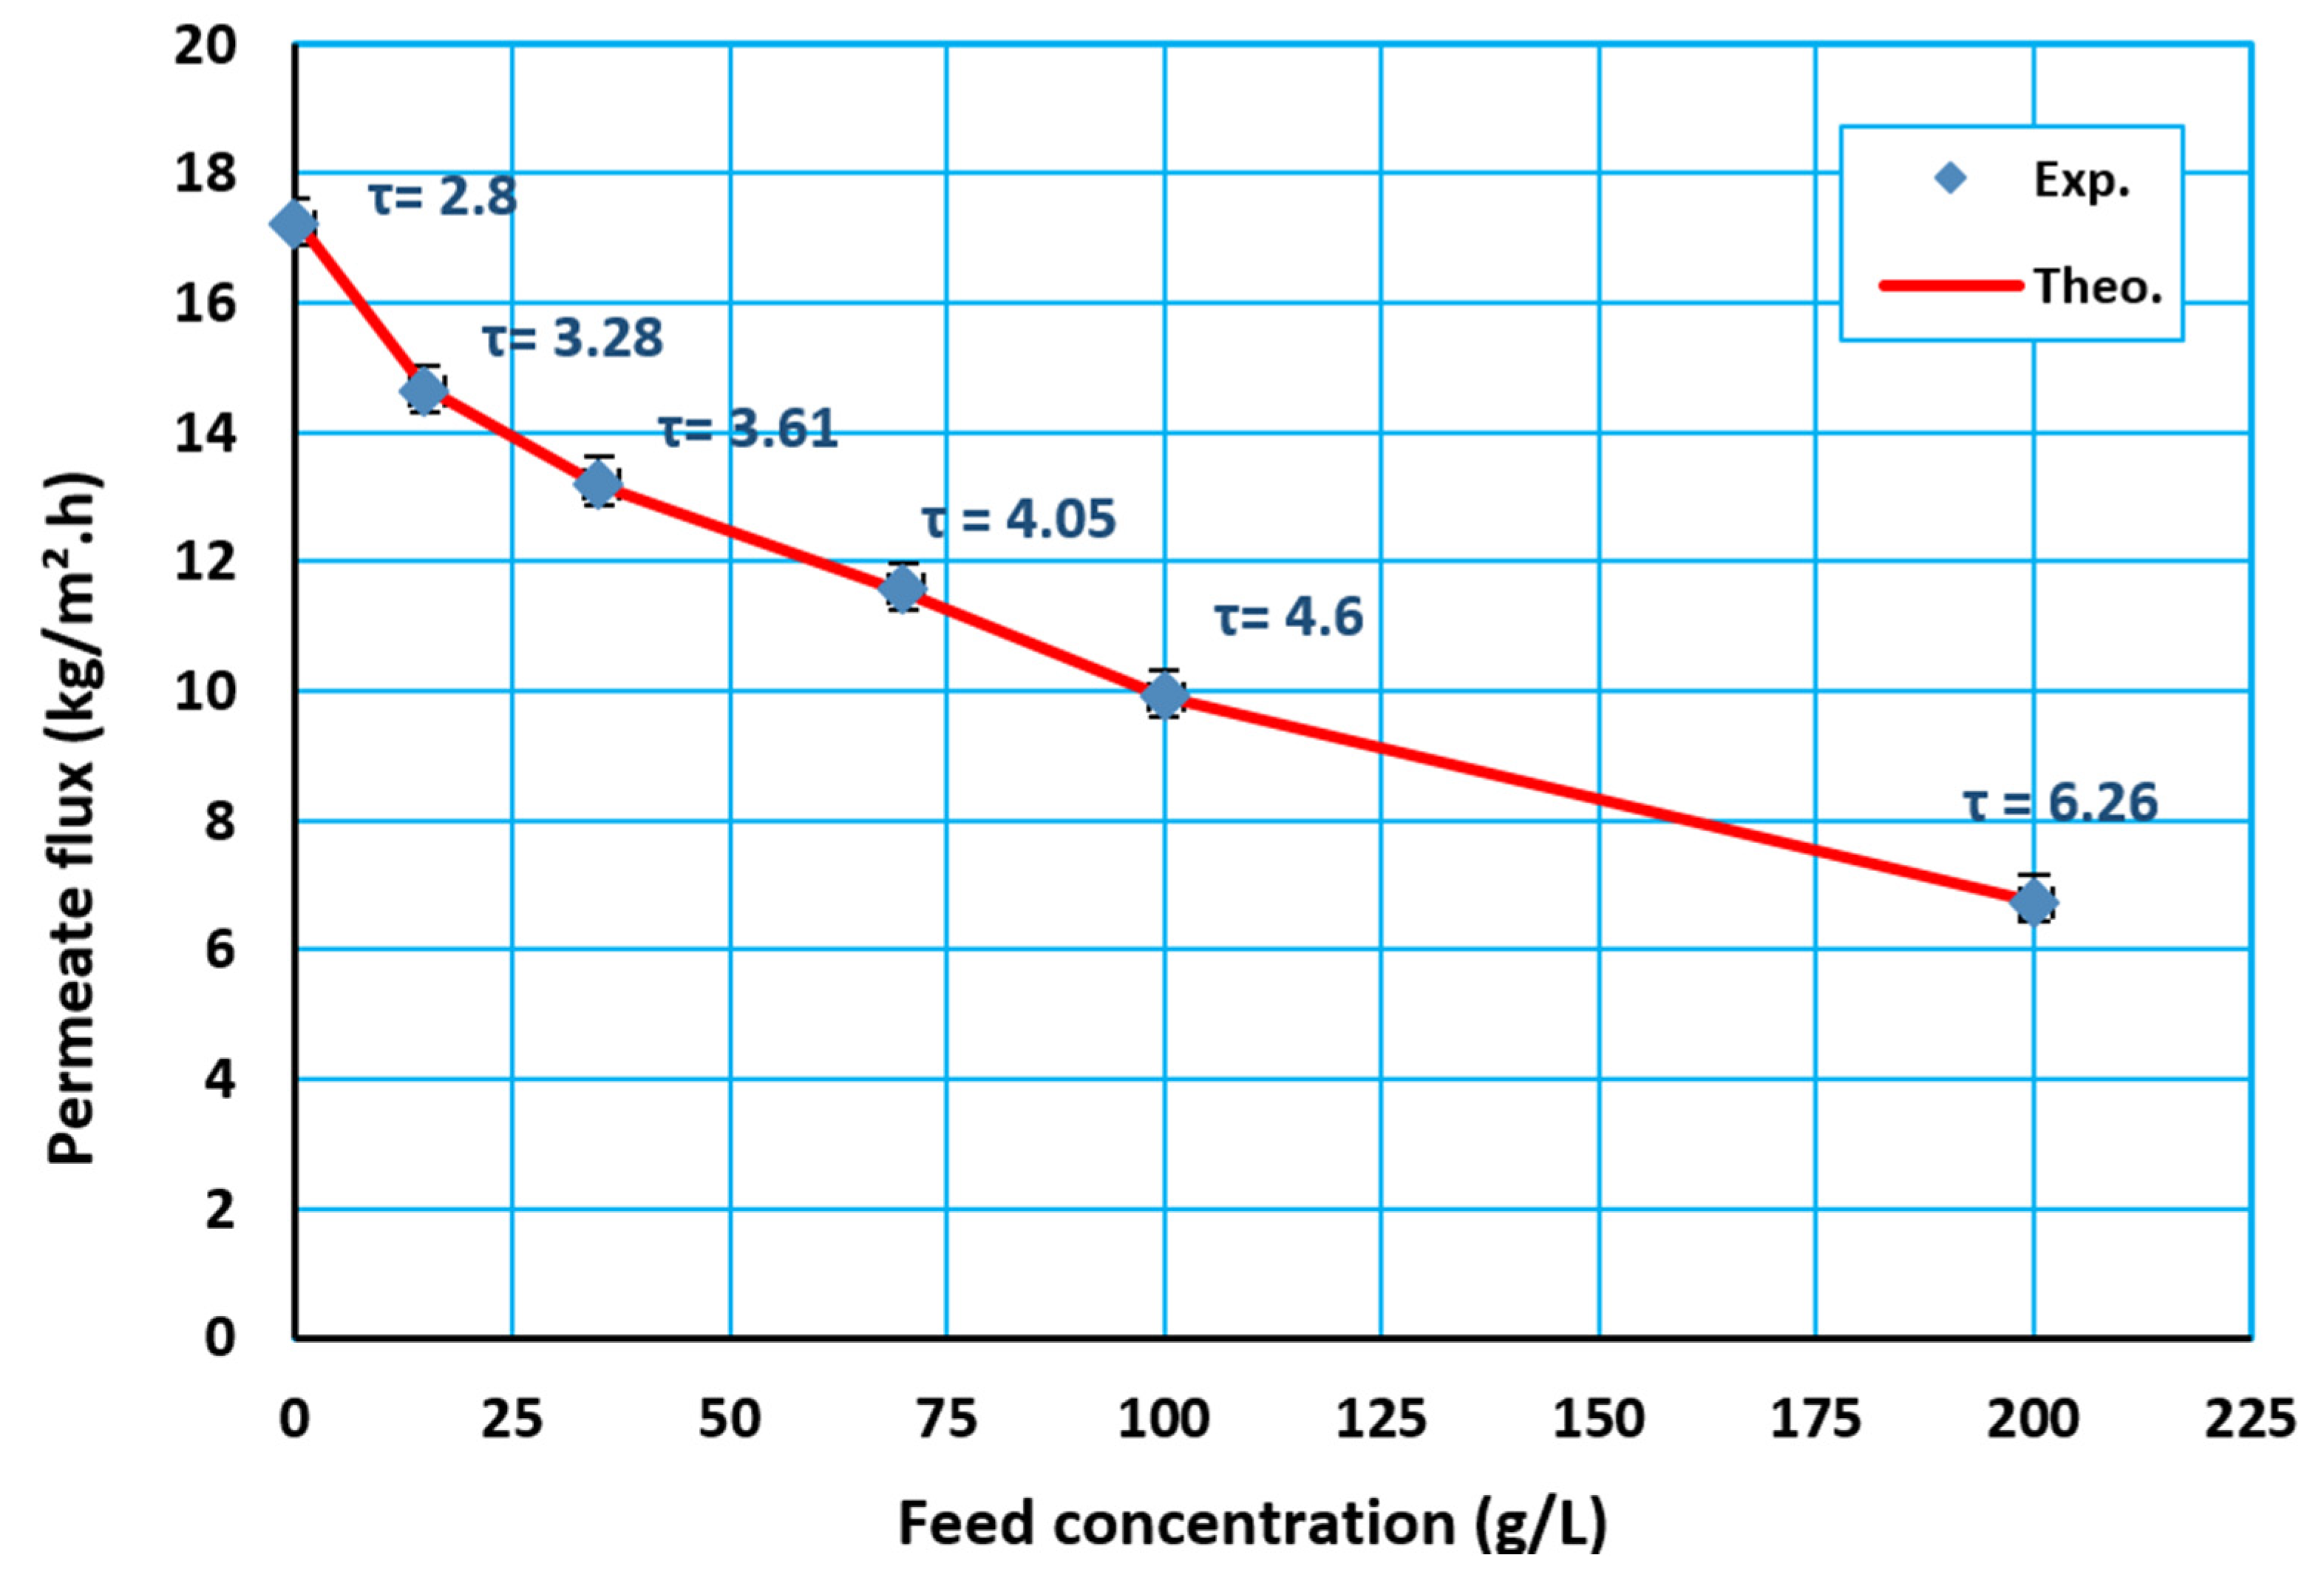
Figure 12 and Figure 13 show the effect of the feed temperature and concentration on the experimental and theoretical fluxes at various membrane hypothetical paths (tortuosity). There was a significant enhancement in the simulated results compared with the experimental data, and a good agreement was obtained, as shown in the aforementioned figures.
4.5. Verification of the Mathematical Model with Previous Works
The predicted results of the mathematical model were compared with the experimental data, considering various membrane specifications and operating conditions from the literature [39,40]. Wen Cheng et al. [39] used a flat sheet PTFE membrane, feed flow rate (0.6–0.9 L/min), feed concentration (0–10 wt.% of NaCl), and feed temperature (40–50 °C); while the permeate side temperature remained constant at 20 °C. Similarly, Seo et al. [40] used a hydrophobic microporous polyvinylidene fluoride (PVDF) flat sheet membrane, feed temperature (40–60 °C), constant flow rate at the feed and permeate sides (0.5 L/min), and feed concentration (32 g/L). Figure 14 shows the effect of the feed temperature on the permeation flux, where a feed solution with 10 wt% NaCl and 0.75 L/min flow rate was used for the Wen Cheng et al. data [39], and 32 g/L feed concentration and 0.5 L/min flow rate for the Seo et al. data [40]. Figure 14 illustrates that there is a good agreement between the simulated and experimental results using different hypothetical paths, depending upon the operating conditions.
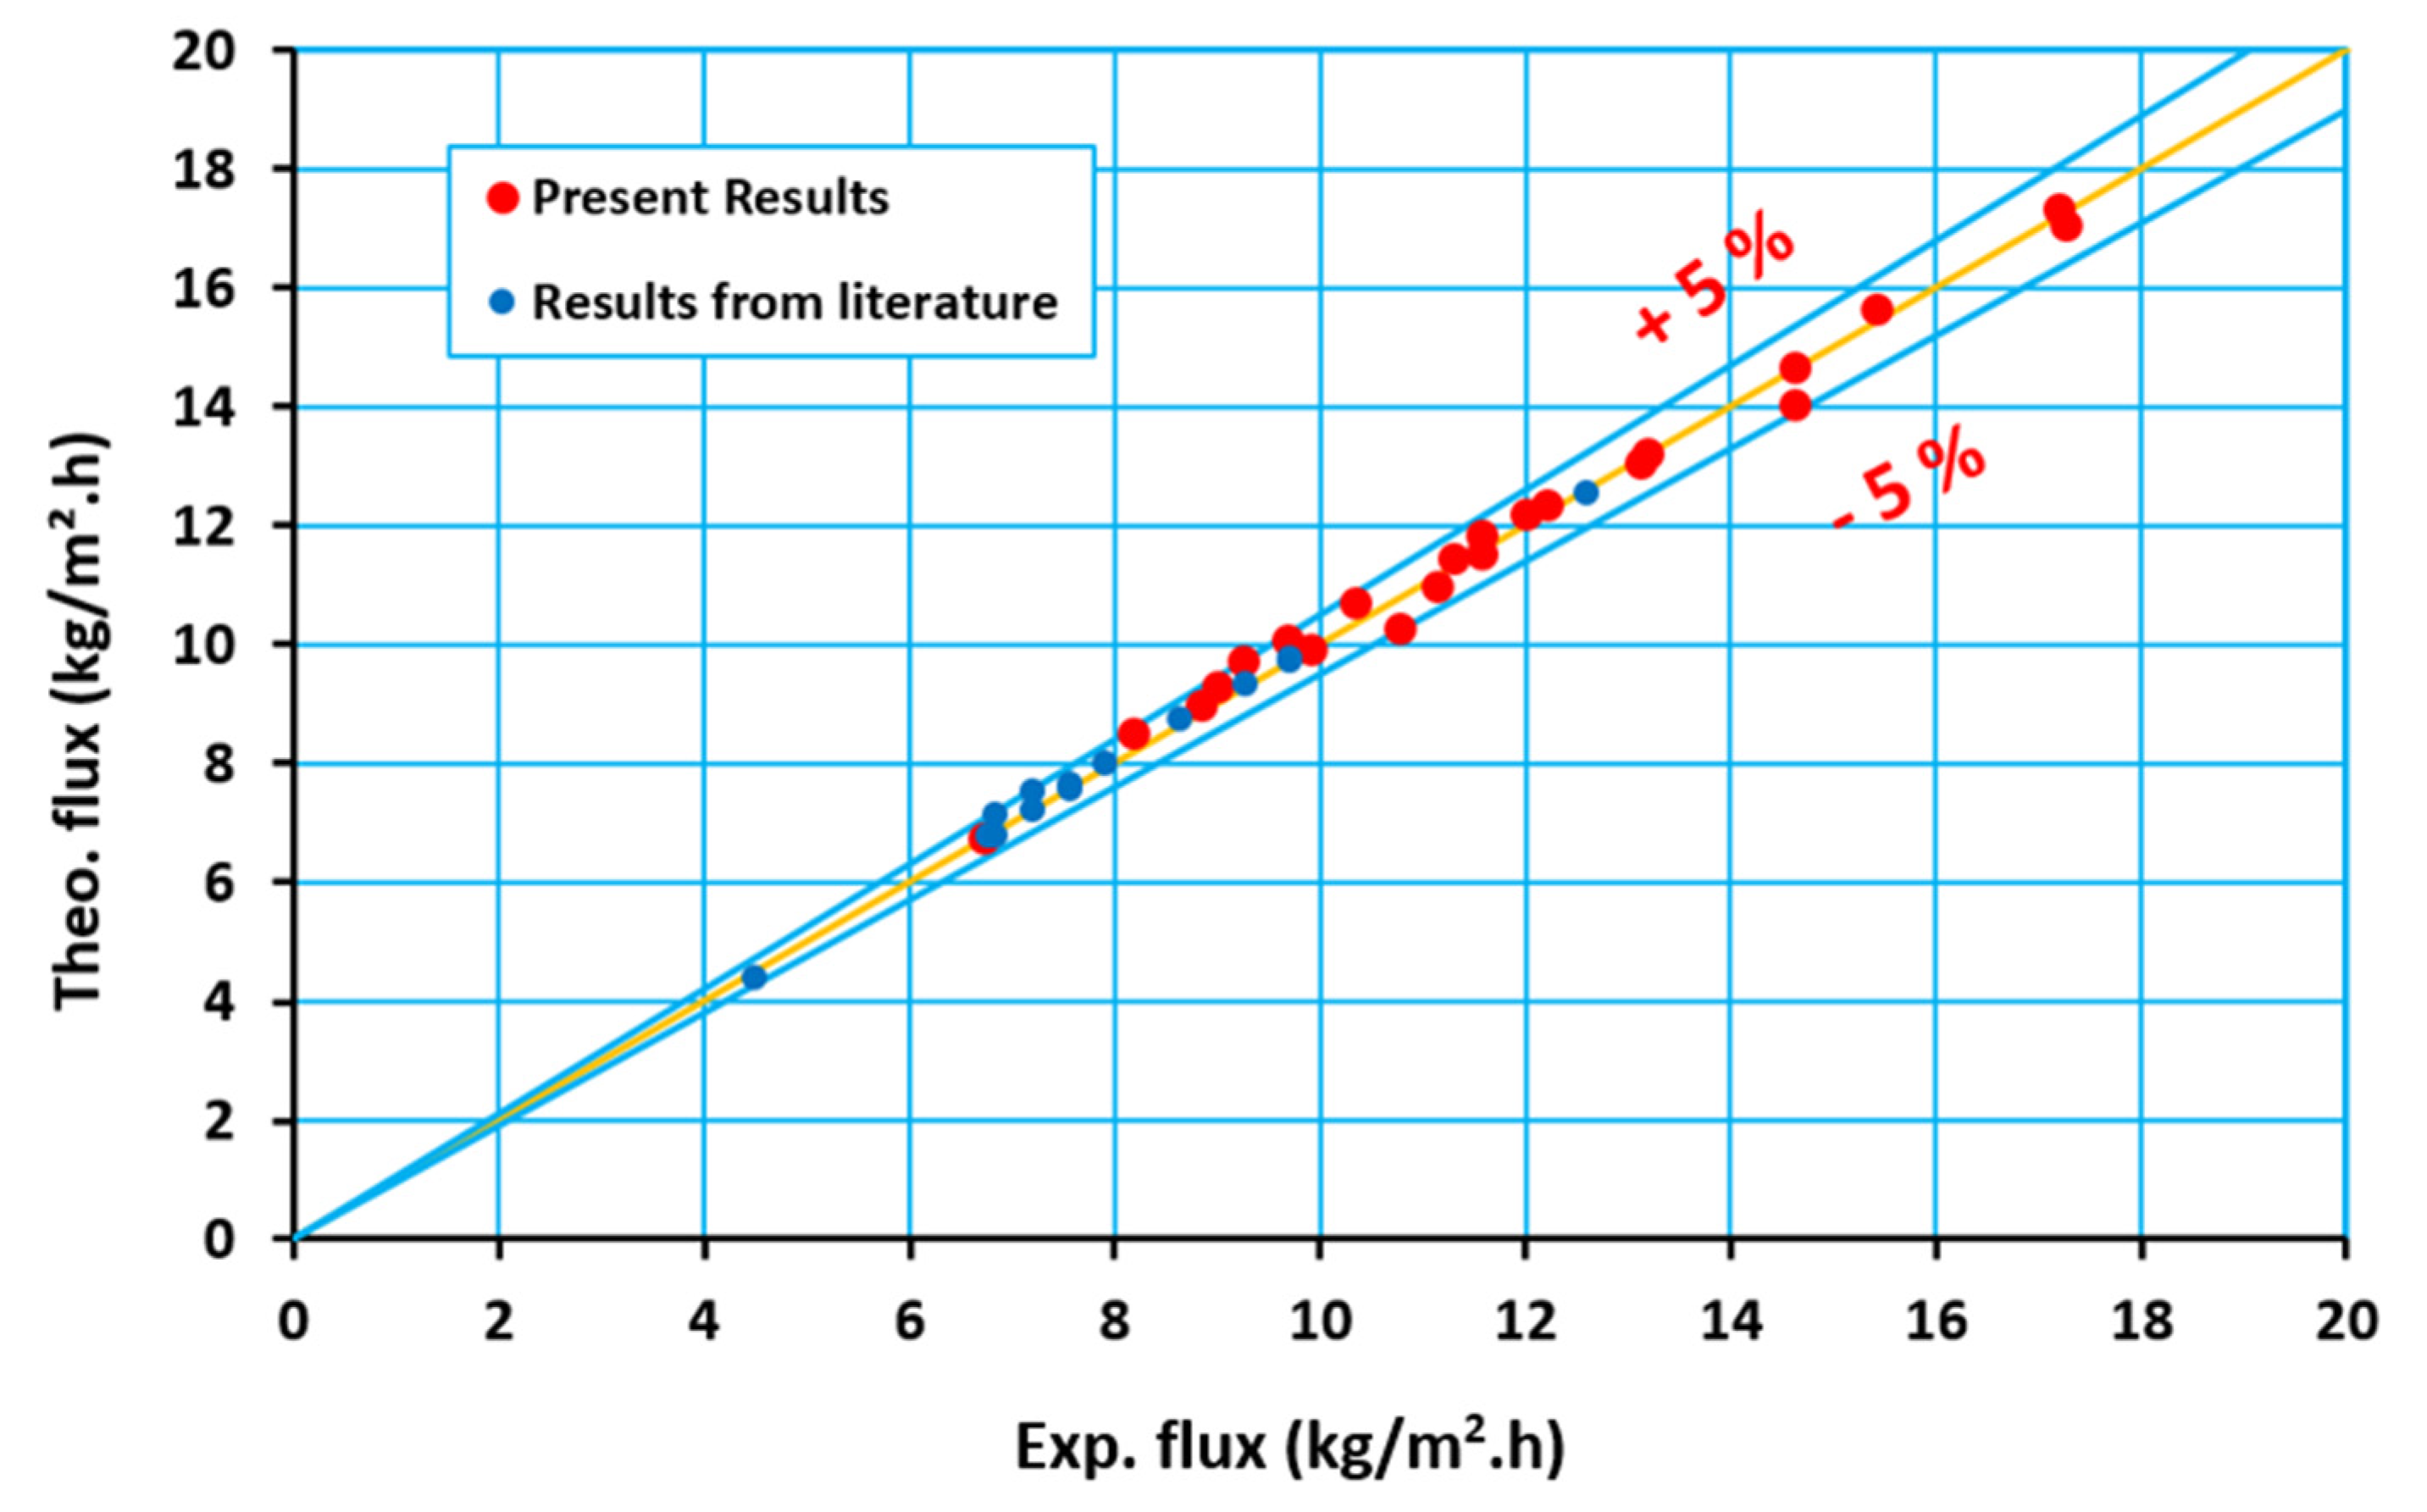
Figure 15 illustrates the performance of the model predictions against all the experimental data (present and previous). This figure demonstrates that the model results were somewhat overestimated and can be attributed to the heat loss in the practical implementation, which reduces both the generated vapor and permeate flux. Generally, as shown in Figure 15, the error of the simulated results was within ±5%, with all the experimental data using the hypothetical path prediction.
4.6. Thermal Efficiency
The thermal efficiency () in the MD process can be described as the ratio of the latent heat of vaporization to the total heat (latent and conduction). Approximately 50–80% of the total heat flux across the membrane was considered to be latent heat, while 20–40% of the heat was lost by conduction [22]. The thermal efficiency can be enhanced by increasing the feed temperature, membrane thickness and feed flow rate. In contrast, the thermal efficiency decreases with the increasing feed concentration [41]. For the DCMD process, the thermal efficiency is given as follows:
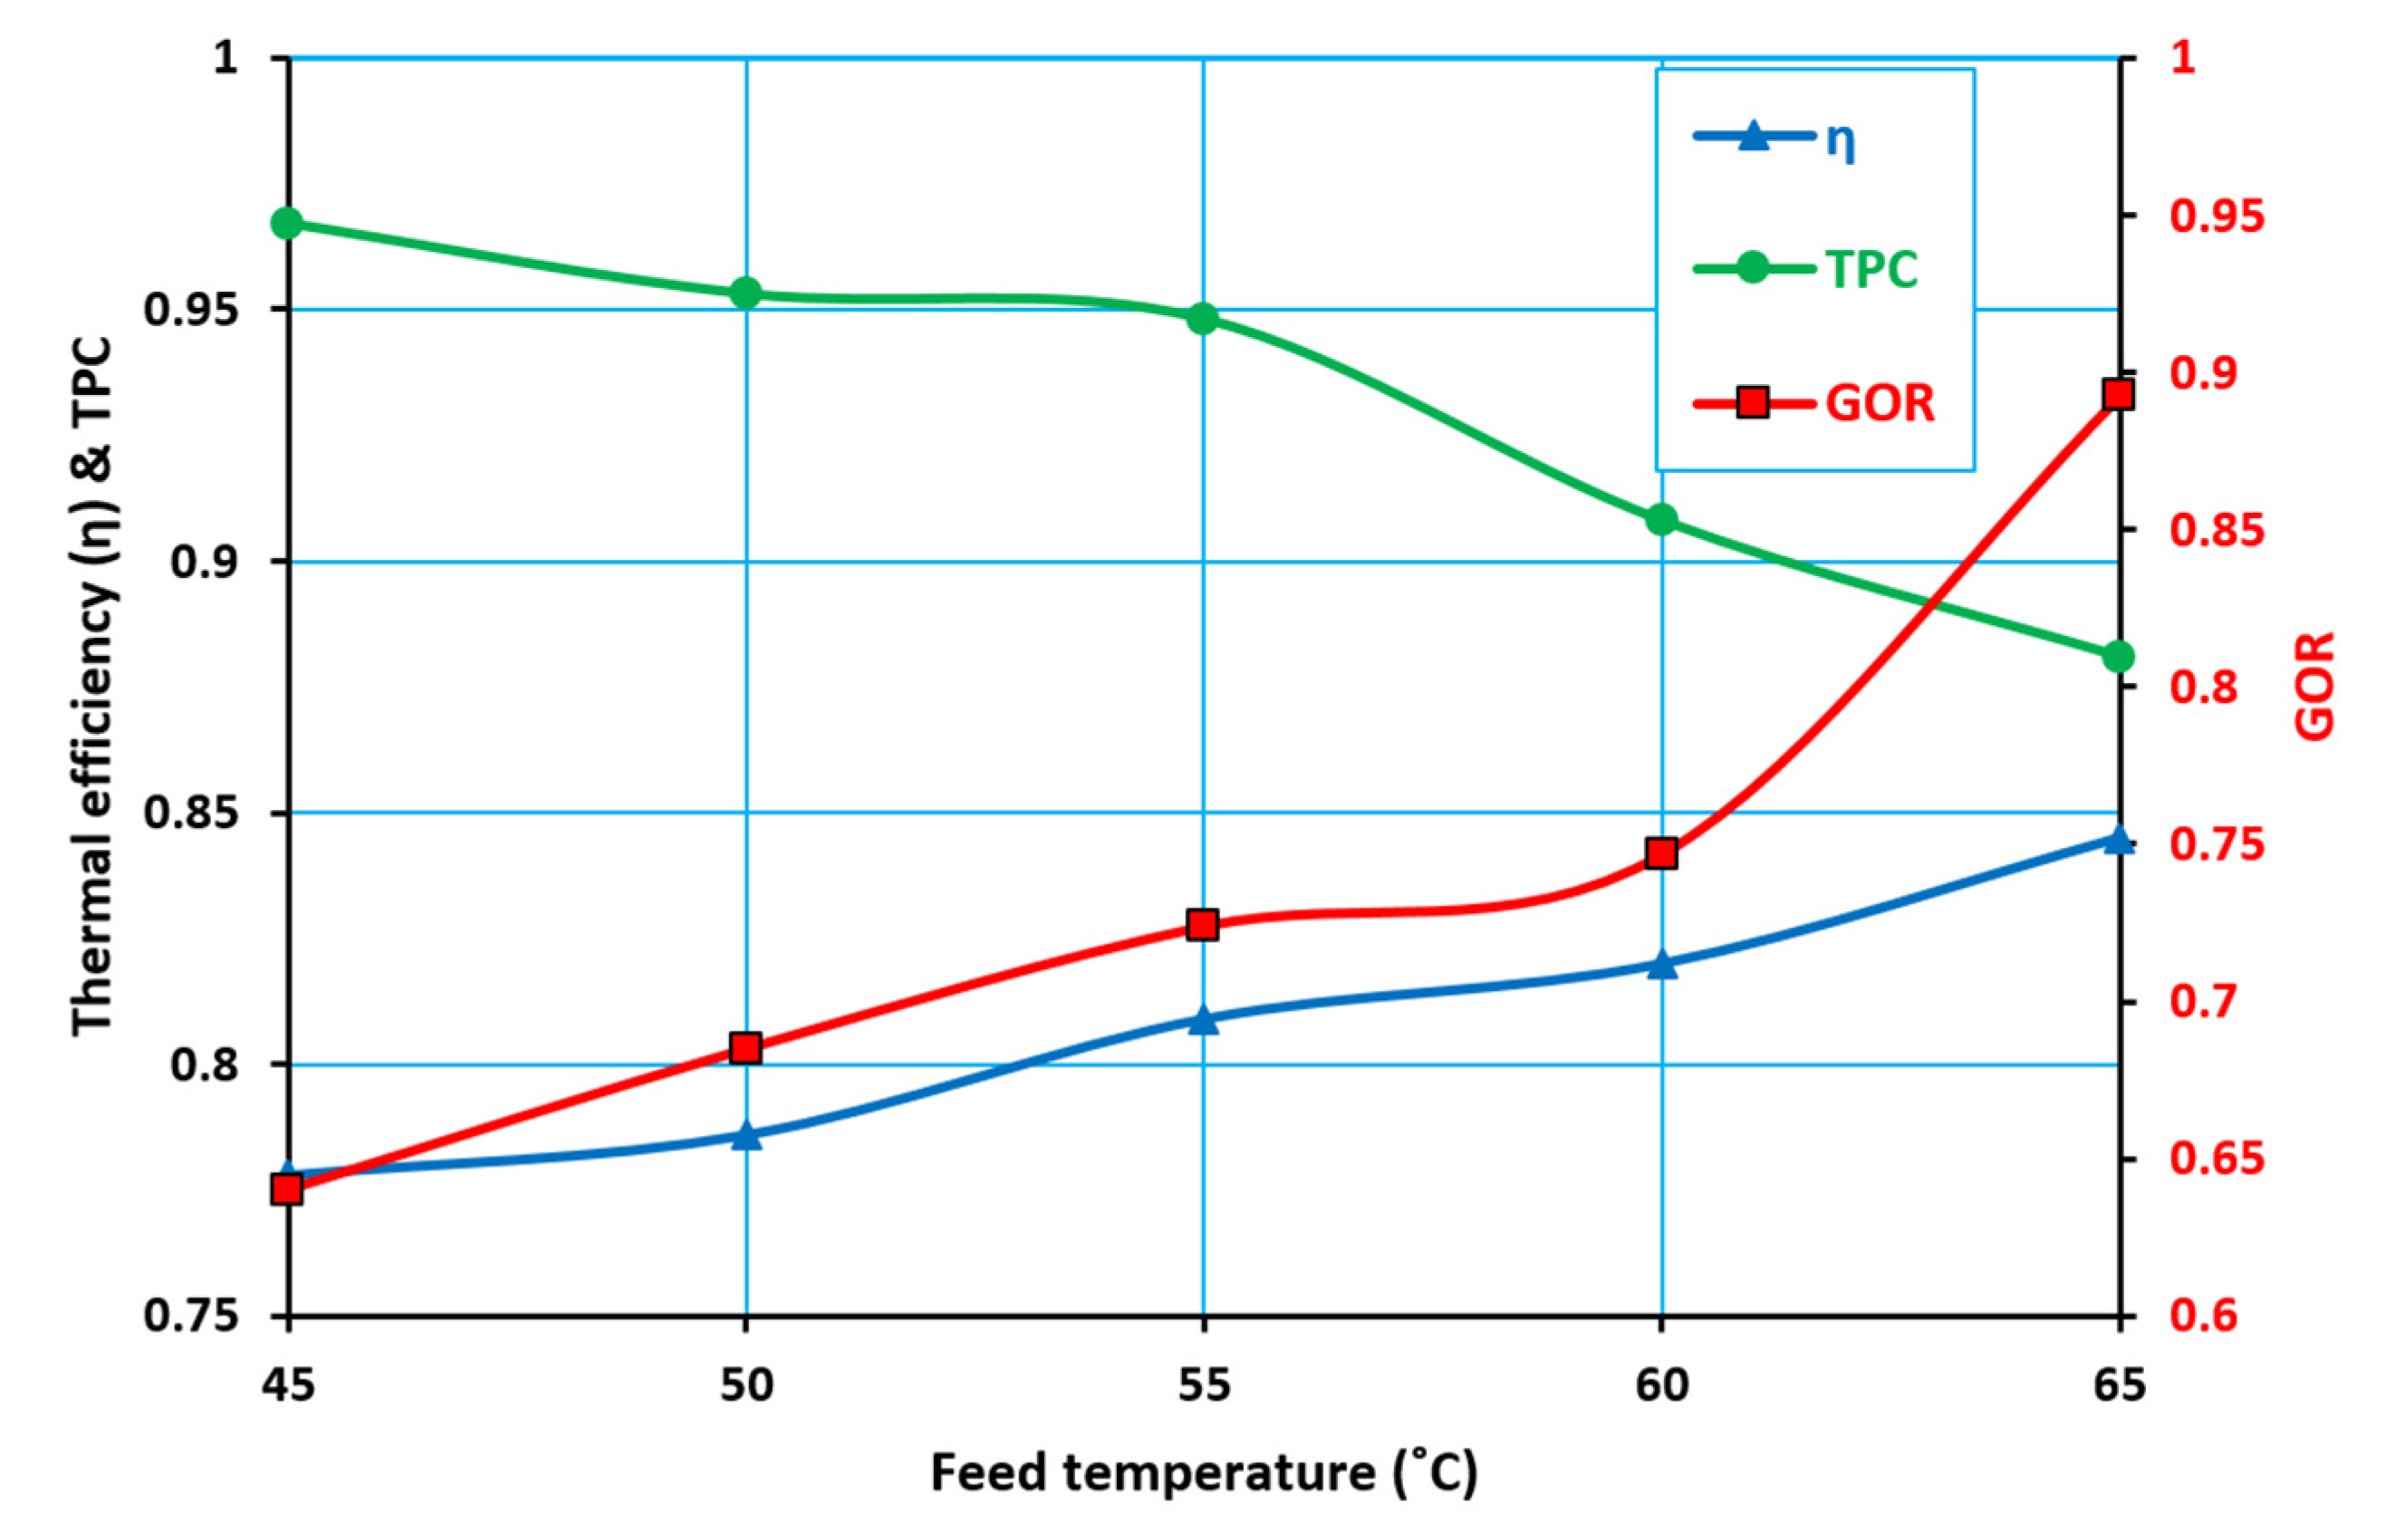
The thermal efficiency of the DCMD process was evaluated by the proposed theoretical model. As shown in Figure 16, the feed temperature had a significant effect on the thermal efficiency, so increasing the feed temperature led to increasing the process thermal efficiency. This can be attributed to the fact that at high temperatures, the amount of heat lost by conduction becomes smaller than the vaporization heat, which is directly proportional to the thermal efficiency. In contrast, heat conduction is inversely proportional to the thermal efficiency, according to Equation (35).
4.7. Gain Output Ratio ()
The gain output ration () is another useful parameter in MD, particularly when involving heat recovery. The can be defined as the ratio of the heat associated with the vapor transfer to the total input heat in the MD process. In fact, is an indicator providing information on how much of the supplied thermal energy is usefully employed to produce the permeate [42,43]. For any MD system, the can be evaluated by the following equation:
where is the effective area of the membrane and is the total heat consumed by the system, which is given by the following equation:
where are the mass flow rate and specific heat capacity of the feed solution, respectively, and and are the inlet and outlet hot feed temperatures, respectively.
Figure 16 shows the relationship between the feed temperature and the gain output ratio. The GOR value increased as the feed temperature increased. This increase in the partial pressure difference led to a higher mass flux, which was directly proportional to the value of the GOR, according to the above equation.
4.8. Temperature Polarization Coefficient ()
The temperature or thermal polarization coefficient () is used to describe the thermal efficiency of a process. It is defined as the ratio of the temperature difference at the membrane surface to the corresponding temperature difference in the bulk [42,43]:
The value of the was between 0 and 1, where the higher the value, the lower the temperature polarization effect. Figure 16 shows the inverse relationship between the feed temperature and the value of the . As a result of the feed temperature increasing, the value of the varied significantly.
Table 1 shows a comparison between the membranes’ performance predicted by the present work with the performance of the selected values of membranes from the literature. The most important operating conditions such as feed temperature, feed concentration and feed flow rate were also given in Table 1. It can be seen that the predicted membranes performance by the presented model has a reasonable permeation flux with good agreement in comparison with most membranes’ permeation flux found in the literature.
5. Conclusions
An experimental and simulation study of a flat sheet configuration DCMD was presented. The developed model of the DCMD process took into account the membrane characteristics, operating conditions and module dimensions. The effect of the feed temperature, flow rate and concentration on the permeate flux were studied experimentally and theoretically by the present model. The validation of the model was obtained by comparing it with the experimental results of this study and other results from the literature, where a good agreement was found. The feed temperature and flow rate had a positive effect on the permeation flux across the membrane, while the feed concentration affected it negatively. The simulation results showed that the value of the hypothetical path of the water molecules transported across the membrane (which expressed the appearance of extra mass transfer resistance) varied based on the feed temperature and concentration, where the value of the hypothetical path increased as the feed temperature and concentration increased. A high salt rejection was attained (about 99.98%) for the PTFE membrane, even when a 200 g/L feed concentration was used. The DCMD thermal efficiency increased as the feed temperature increased, while the temperature polarization coefficient of the DCMD system significantly declined as the feed temperature increased. The gain output ratio for the DCMD system increased significantly with the increasing feed temperatures. The temperature polarization coefficient for the DCMD was between 0.88 and 0.94.
Author Contributions
The authors are grateful for valuable comments from three anonymous reviewers. Conceptualization, S.S.I., Q.F.A. and A.F.; Formal analysis, N.A.M.A., S.S.I., Q.F.A. and A.F.; Investigation, N.A.M.A., S.S.I., Q.F.A. and A.F.; Methodology, S.S.I. and Q.F.A.; Software, S.S.I.; Visualization, S.S.I. and Q.F.A.; Writing—original draft, N.A.M.A.; Writing—review and editing, N.A.M.A., S.S.I., Q.F.A. and A.F. All authors have read and agreed to the published version of the manuscript.
Funding
This research received no external funding
Conflicts of Interest
The authors declare no conflict of interest.
Nomenclatures\Capital Letters
| A | Effective Surface Area (m2) |
| Geometric factor | |
| C | Concentration (g·mol/m3) or (g/L) |
| Specific heat capacity (J/kg·K) | |
| Equivalent diffusion coefficient (kg/Pa·m2·s) | |
| Hydraulic diameter (m) | |
| Knudsen diffusion coefficient (kg/Pa·m2·s) | |
| Molecular diffusion coefficient (kg/Pa·m2·s) | |
| Water–air diffusivity (m2/s) | |
| Gain output ration | |
| Permeate mass flux (kg/m2·s) or (kg/m2·h) | |
| L | Effective membrane length (m) |
| Liquid entrance pressure (Pa) | |
| Permeate mass (kg) | |
| Molecular weight (g/g·mol) | |
| Heat flux (W/m2) | |
| Pressure (Pa) | |
| Vapor pressure (Pa) | |
| Universal gas constant (8.314 J/g·mol·K) | |
| T | Temperature (°C or K) |
| Mean temperature (°C or K) | |
| W | Effective membrane width (m) |
Lower Case Letters
| Pore Size (diameter) (m) | |
| h | Heat transfer coefficient (W/m2 K) |
| k | Thermal conductivity (W/m·K) |
| Solute mass transfer coefficient (m/s) | |
| m | Mass flow rate (kg/s) |
| Partial pressure (Pa) | |
| Maximum pore radius (m) | |
| t | Experiment time |
| u | Velocity (m/s) |
| Mole fraction |
Greek Letters
| ΔH | Latent Heat of Vaporization (kJ/kg) |
| Activity coefficient | |
| Surface tension (N/m) | |
| Membrane thickness (m) | |
| ε | Porosity |
| Thermal efficiency | |
| Contact angle (°) | |
| µ | Viscosity (Pa·s) |
| ρ | density (kg/m3) |
| Hypothesis path through the membrane (m) | |
| Tortuosity | |
| Concentration polarization coefficient |
Subscripts
| b | At the Bulk |
| C | Conducted |
| Feed side | |
| g | Gas |
| K | Knudson diffusion |
| M | Molecular diffusion |
| Membrane | |
| Permeate side | |
| s | Membrane solid |
| sol | Solution |
| v | Evaporative |
| w | Water |
Dimensionless Numbers
| Nusselt No. | |
| Prandtl No. | |
| Reynolds No. | |
| Schmidt No. | |
| Sherwood No. |
References
- Bahar, R. Conversion of Saline Water to Fresh Water Using Air Gap Membrane Distillation (AGMD). Ph.D. Thesis, University of Singapore, Singapore, 2010. [Google Scholar]
- Fadhil, S.; Alsalhy, Q.F.; Makki, H.; Figueroa, R.; Marino, T.; Criscuoli, A.; Macedonio, F.; Giorno, L.; Drioli, E.; Figoli, A. Seawater desalination using PVDF-HFP membrane in DCMD process: Assessment of operating condition by response surface method. Chem. Eng. Commun. 2019, 206, 237–246. [Google Scholar] [CrossRef]
- Alsalhy, Q.F.; Ibrahim, S.; Khaleel, S. Performance of vacuum poly (propylene) membrane distillation (VMD) for saline water desalination. Chem. Eng. Process. Process Intensif. 2017, 120, 68–80. [Google Scholar] [CrossRef]
- Shatat, M.; Worall, M.; Riffat, S. Opportunities for Solar Water Desalination Worldwide: Review. Sustain. Cities Soc. 2013, 9, 67–80. [Google Scholar] [CrossRef]
- Alsalhy, Q.F.; Ibrahim, S.; Hashim, F. Experimental and theoretical investigation of air gap membrane distillation process for water desalination. Chem. Eng. Res. Des. 2018, 130, 95–108. [Google Scholar] [CrossRef]
- Jamed, M.; Alanezi, A.A.; Alsalhy, Q.F. Effects of embedding functionalized multi-walled carbon nanotubes and alumina on the direct contact poly (vinylidene fluoride-cohexafluoropropylene) membrane distillation performance. Chem. Eng. Comun. 2019, 206, 1035–1057. [Google Scholar] [CrossRef]
- Aljumaily, M.M.; Alsaadi, M.A.; Hashim, N.A.; Alsalhy, Q.F.; Mjalli, F.S.; Atieh, M.A. PVDF-co-HFP/superhydrophobic acetylene-based nanocarbon hybrid membrane for seawater desalination via DCMD. Chem. Eng. Res. Des. 2018, 138, 248–259. [Google Scholar] [CrossRef]
- Aljumaily, M.M.; Alsaadi, M.A.; Hashim, N.A.; Alsalhy, Q.F.; Das, R.; Mjalli, F.S. Embedded high-hydrophobic CNMs prepared by CVD technique with PVDF-co-HFP membrane for application in water desalination by DCMD. Desalin. Water Treat. 2019, 142, 37–48. [Google Scholar] [CrossRef]
- Yarlagadda, S.; Gude, V.; Camacho, L.; Pinappu, S.; Deng, S. Potable water recovery from As, U, and F contaminated ground waters by direct contact membrane distillation process. J. Hazard. Mater. 2011, 192, 1388–1394. [Google Scholar] [CrossRef]
- Rashid, K.; Rahman, S.; Alsalhy, Q. Optimum Operating Parameters for Hollow Fiber Membranes in Direct Contact Membrane Distillation. Arab. J. Sci. Eng. 2016, 16, 2647–2658. [Google Scholar] [CrossRef]
- Gryta, M. Influence of polypropylene membrane surface porosity on the performance of membrane distillation process. J. Membr. Sci. 2007, 287, 67–78. [Google Scholar] [CrossRef]
- Boubakri, A.; Hafiane, A.; Al Tahar Bouguecha, S. Application of Response Surface Methodology for Modeling and Optimization of Membrane Distillation Desalination Process. J. Ind. Eng. Chem. 2014, 20, 1–7. [Google Scholar] [CrossRef]
- Yang, C.; Tain, M.; Xie, Y.; Mei, L.X.; Zhao, B.; He, T.; Liu, J. Effective evaporation of CF4 plasma modified PVDF membranes in direct contact membrane distillation. J. Membr. Sci. 2015, 482, 25–32. [Google Scholar] [CrossRef]
- Cheng, D.; Gong, W.; Li, N. Response surface modeling and optimization of direct contact membrane distillation for water desalination. Desalination 2016, 394, 108–122. [Google Scholar] [CrossRef]
- Tomaszewsk, M. Membrane Distillation-Examples of Applications in Technology and Environmental Protection. Pol. J. Environ. Stud. 2000, 9, 27–36. [Google Scholar]
- Winter, D. Membrane Distillation—A Thermodynamic Technological and Economic Analysis. Ph.D. Thesis, University of Kaiserslautern, Kaiserslautern, Germany, 2014. [Google Scholar]
- Sanmartino, J.; Khayet, M.; García-Payo, M. Desalination by Membrane Distillation; University Complutense of Madrid, Emerging Membrane Technology for Sustainable Water Treatment: Madrid, Spain, 2016; pp. 77–109. [Google Scholar]
- Cath, T.; Adams, V.; Childress, A. Experimental study of desalination using direct contact membrane distillation: A new approach to flux enhancement. J. Membr. Sci. 2004, 228, 5–16. [Google Scholar] [CrossRef]
- My, D. Membrane Distillation Application in Purification and Process Intensification. Master’s Thesis, Asian Institute of Technology, School of Environment, Resources and Development, Bangkok, Thailand, 2015. [Google Scholar]
- Phungsai, P. Development of Thermo Philic Anaerobic Membrane Distillation Bioreactor. Master’s Thesis, Asian Institute of Technology School of Environment, Resources and Development, Bangkok, Thailand, 2013. [Google Scholar]
- El-Bourawi, M.; Ding, Z.; Ma, R.; Khayet, M. A Framework for Better Understanding Membrane Distillation Separation Process. J. Membr. Sci. 2006, 285, 4–29. [Google Scholar] [CrossRef]
- Alkhudhiri, A.; Darwish, N.; Hilal, N. Membrane distillation: A comprehensive review. Desalination 2012, 287, 2–18. [Google Scholar] [CrossRef]
- Fard, A.; Rhadfi, T.; Khraisheh, M.; Atieh, M.A.; Khraisheh, M.; Hilal, N. Reducing Flux Decline and Fouling of Direct Contact Membrane Distillation by Utilizing Thermal Brine from MSF Desalination Plant. Desalination 2016, 379, 172–181. [Google Scholar] [CrossRef]
- Lawson, K.; Lioyd, D. Membrane distillation. J. Membr. Sci. 1997, 124, 1–5. [Google Scholar] [CrossRef]
- Khayet, M. Membranes and theoretical modeling of membrane distillation: A review. Adv. Colloid Interface Sci. 2011, 164, 56–88. [Google Scholar] [CrossRef]
- Ibrahim, S.; Alsalhy, Q. Modeling and Simulation for Direct Contact Membrane Distillation in Hollow Fiber Modules. AIChE J. 2013, 59, 589–603. [Google Scholar] [CrossRef]
- Zhang, J.; Li, J.; Gray, S. Effect of applied pressure on performance of PTFE membrane in DCMD. J. Membr. Sci. 2011, 369, 514–525. [Google Scholar] [CrossRef]
- Kullab, A. Desalination Using Membrane Distillation Experimental and Numerical Study. Ph.D. Thesis, Department of Energy Technology, Royal Institute of Technology, Stockholm, Sweden, 2011. [Google Scholar]
- Chen Ching, T.; Ho, C.; Ming Yeh, H. Theoretical Modeling and Experimental Analysis of Direct Contact Membrane Distillation. J. Membr. Sci. 2009, 330, 279–287. [Google Scholar] [CrossRef]
- Essalhi, M.; Khayet, M. Self-sustained webs of polyvinylidene fluoride electrospun nanofibers at different electrospinning times: 2. Theoretical analysis, polarization effects and thermal efficiency. J. Membr. Sci. 2013, 433, 180–191. [Google Scholar] [CrossRef]
- Khalifa, A.; Ahmada, H.; Antar, M.; Laoui, T.; Khayet, M. Experimental and theoretical investigations on water desalination using direct contact membrane distillation. Desalination 2017, 404, 22–34. [Google Scholar] [CrossRef]
- Phattaranawik, J.; Jiraratananon, R.; Fane, A.G. Effect of pore size distribution and air flux on mass transport in direct contact membrane Distillation. J. Membr. Sci. 2003, 215, 75–85. [Google Scholar] [CrossRef]
- Qtaishat, M.; Matsuura, T.; Kruczek, B.; Khayet, M. Heat and mass transfer analysis in direct contact membrane distillation. Desalination 2008, 219, 272–292. [Google Scholar] [CrossRef]
- Janajreh, I.; Suwwan, D.; Hashaikeh, R. Assessment of Direct Contact Membrane Distillation Under Different Configurations, Velocities and Membrane Properties. Appl. Energy 2016, 185, 1–16. [Google Scholar] [CrossRef]
- Lawal, D.; Khalifa, A. Flux Prediction in Direct Contact Membrane Distillation. Int. J. Mater. Mech. Manuf. 2014, 2, 1–4. [Google Scholar] [CrossRef]
- Khayet, M.; Matsuura, T. Membrane Distillation Principles and Applications; Elsevier: Amsterdam, The Netherlands, 2011. [Google Scholar]
- Jeong, S.; Lee, S.; Chonc, H.; Seockheon, L. Structural analysis and modeling of the commercial high performance composite flat sheet membranes for membrane distillation application. Desalination 2014, 349, 115–125. [Google Scholar] [CrossRef]
- Benyahia, F. Membrane-Distillation in Desalination; CRC Press: Boca Raton, FL, USA; Taylor & Francis Group, LLC: New York, NY, USA, 2019. [Google Scholar]
- Wen Cheng, T.; Jung Han, C.; Jen Hwang, K.; Dong Ho, C.; Cooper, W. Influence of Feed Composition on Distillate Flux and Membrane Fouling in Direct Contact Membrane Distillation. Sep. Sci. Technol. 2010, 45, 967–974. [Google Scholar] [CrossRef]
- Seo, J.; Kim, Y.; Kim, J. Spacer optimization strategy for direct contact membrane distillation: Shapes, configurations, diameters, and numbers of spacer filaments. Desalination 2017, 417, 9–18. [Google Scholar] [CrossRef]
- Al-Obaidani, S.; Curcio, E.; Macedonio, F.; Profio, G.D.; Al-Hinai, H.; Drioli, E. Potential of Membrane Distillation in Seawater Desalination: Thermal Efficiency Sensitivity Study and Cost Estimation. J. Membr. Sci. 2008, 323, 85–98. [Google Scholar] [CrossRef]
- Duong, H.C.; Cooper, P.; Nelemans, B.; Cath, T.Y.; Nghiem, L.D. Optimising thermal efficiency of direct contact membrane distillation by brine recycling for small-scale seawater desalination. Desalination 2015, 374, 1–9. [Google Scholar] [CrossRef] [Green Version]
- Criscuoli, A. Improvement of the Membrane Distillation performance through the integration of different configurations. Chem. Eng. Res. Des. 2016, 111, 316–322. [Google Scholar] [CrossRef]
- Ren, L.-F.; Xia, F.; Shao, J.; Zhang, X.; Li, J. Experimental investigation of the effect of electrospinning parameters on properties of superhydrophobic PDMS/PMMA membrane and its application in membrane distillation. Desalination 2017, 404, 155–166. [Google Scholar] [CrossRef]
- Kim, Y.-D.; Thu, K.; Ghaffour, N.; Choon Ng, K. Performance investigation of a solar assisted direct contact membrane distillation system. J. Membr. Sci. 2013, 427, 345–364. [Google Scholar] [CrossRef] [Green Version]
- Meng, S.; Mansouri, J.; Ye, Y.; Chen, V. Effect of templating agents on the properties and membrane distillation performance of TiO2-coated PVDF membranes. J. Membr. Sci. 2014, 450, 48–59. [Google Scholar] [CrossRef]
- Thiel, G.P.; Tow, E.W.; Banchik, L.D.; Chung, H.W.; Lienhard, J.H. Energy consumption in desalinating produced water from shale oil and gas extraction. Desalination 2015, 366, 94–112. [Google Scholar] [CrossRef] [Green Version]
- Bhadra, M.; Roy, S.; Mitra, S. Flux enhancement in direct contact membrane distillation by implementing carbon nanotube immobilized PTFE membrane. Sep. Purif. Technol. 2016, 161, 136–143. [Google Scholar] [CrossRef]
- Swaminathan, J.; Chung, H.W.; Warsinger, D.M.; AlMarzooqi, F.A.; Arafat, H.A.; Lienhard, V.J.H. Energy efficiency of permeate gap and novel conductive gap membrane distillation. J. Membr. Sci. 2016, 502, 171–178. [Google Scholar] [CrossRef] [Green Version]
- Hou, D.; Lin, D.; Ding, C.; Wang, D.; Wang, J. Fabrication and characterization of electrospun superhydrophobic PVDF-HFP/SiNPs hybrid membrane for membrane distillation. Sep. Purif. Technol. 2017, 189, 82–89. [Google Scholar] [CrossRef]
- Boubakri, A.; Hafiane, A.; Bouguecha, S.A.T. Direct contact membrane distillation: Capability to desalt raw water. Arab. J. Chem. 2017, 10, S3475–S3481. [Google Scholar] [CrossRef] [Green Version]
- Adnan, S.; Hoang, M.; Wang, H.; Xie, Z. Commercial PTFE membranes for membrane distillation application: effect of microstructure and support material. Desalination 2012, 284, 297–308. [Google Scholar] [CrossRef]
- Fan, Y.; Chen, S.; Zhao, H.; Liu, Y. Distillation membrane constructed by TiO2 nanofiber followed by fluorination for excellent water desalination performance. Desalination 2017, 405, 51–58. [Google Scholar] [CrossRef]
- Lee, J.-G.; Kim, W.-S.; Choi, J.-S.; Ghaffour, N.; Kim, Y.-D. Dynamic solar-powered multi-stage direct contact membrane distillation system: Concept design, modeling and simulation. Desalination 2018, 435, 278–292. [Google Scholar] [CrossRef]
- Alwatban, A.M.; Alshwairekh, A.M.; Alqsair, U.F.; Alghafis, A.A.; Oztekin, A. Performance improvements by embedded spacer in direct contact membrane distillation–Computational study. Desalination 2019, 470, 114103. [Google Scholar] [CrossRef]
- Floros, I.N.; Kouvelos, E.P.; Pilatos, G.I.; Hadjigeorgiou, E.P.; Gotzias, A.D.; Favvas, E.P.; Sapalidis, A.A. Enhancement of Flux Performance in PTFE Membranes for Direct Contact Membrane Distillation. Polymers 2020, 12, 345. [Google Scholar] [CrossRef] [Green Version]
- Li, J.; Ren, L.-F.; Shao, J.; Tu, Y.; Ma, Z.; Lin, Y.; He, Y. Fabrication of triple layer composite membrane and its application in membrane distillation (MD): Effect of hydrophobic-hydrophilic membrane structure on MD performance. Sep. Purif. Technol. 2020, 234, 116087. [Google Scholar] [CrossRef]
Figure 1.
Schematic diagram of the transport mechanism of the direct contact membrane distillation (DCMD) process.
Figure 1.
Schematic diagram of the transport mechanism of the direct contact membrane distillation (DCMD) process.

Figure 2.
Algorithm of the proposed model.

Figure 3.
Schematic diagram of the experimental rig of the DCMD process.

Figure 4.
Influence of the hot feed temperature on the permeate flux at various concentrations and a feed flow rate of 1.07 L/min.
Figure 4.
Influence of the hot feed temperature on the permeate flux at various concentrations and a feed flow rate of 1.07 L/min.

Figure 5.
Impact of the feed temperature on the permeate conductivity and the salt rejection for the feed solution of 35 g/L and the feed flow rate of 1.07 L/min.
Figure 5.
Impact of the feed temperature on the permeate conductivity and the salt rejection for the feed solution of 35 g/L and the feed flow rate of 1.07 L/min.

Figure 6.
Effect of the feed concentration on the permeation flux at 60 °C feed temperature.

Figure 7.
Impact of the NaCl concentration on the conductivity and salt rejection at 60 °C feed temperature and a feed flow rate of 1.07 L/min.
Figure 7.
Impact of the NaCl concentration on the conductivity and salt rejection at 60 °C feed temperature and a feed flow rate of 1.07 L/min.

Figure 8.
Effect of the feed flow rate on the permeate flux at different feed temperatures and a feed concentration of 35 g/L NaCl.
Figure 8.
Effect of the feed flow rate on the permeate flux at different feed temperatures and a feed concentration of 35 g/L NaCl.

Figure 9.
Influence of the feed temperature on the permeation flux at a feed concentration of 15 and 35 g/L NaCl at a feed flow rate of 1.07 L/min with τ = 1.9082.
Figure 9.
Influence of the feed temperature on the permeation flux at a feed concentration of 15 and 35 g/L NaCl at a feed flow rate of 1.07 L/min with τ = 1.9082.

Figure 10.
Effect of the feed temperature on the permeate flux at various tortuosity levels predicted by the model with the experimental data at a feed concentration of 35 g/L NaCl and a feed flow rate of 1.07 L/min.
Figure 10.
Effect of the feed temperature on the permeate flux at various tortuosity levels predicted by the model with the experimental data at a feed concentration of 35 g/L NaCl and a feed flow rate of 1.07 L/min.

Figure 11.
Effect of the feed concentration on the permeate fluxes at various tortuosity levels predicted by the model with the experimental data at a feed temperature of 60 °C and a feed flow rate of 1.07 L/min.
Figure 11.
Effect of the feed concentration on the permeate fluxes at various tortuosity levels predicted by the model with the experimental data at a feed temperature of 60 °C and a feed flow rate of 1.07 L/min.

Figure 12.
Influence of the feed temperature on the permeation flux at a feed concentration of 15 and 35 g/L NaCl at a feed flow rate of 1.07 L/min.
Figure 12.
Influence of the feed temperature on the permeation flux at a feed concentration of 15 and 35 g/L NaCl at a feed flow rate of 1.07 L/min.

Figure 13.
Effect of the feed concentration on the permeate flux at a feed concentration of 60 °C and a feed flow rate of 1.07 L/min.
Figure 13.
Effect of the feed concentration on the permeate flux at a feed concentration of 60 °C and a feed flow rate of 1.07 L/min.


Figure 15.
Model prediction results against the experimental data of the permeate flux.

Figure 16.
Thermal efficiency, the gain output ration (GOR) and the thermal polarization coefficient (TPC) of the DCMD system at various feed temperatures, 15 g/L NaCl and a feed flow rate of 1.07 L/min.
Figure 16.
Thermal efficiency, the gain output ration (GOR) and the thermal polarization coefficient (TPC) of the DCMD system at various feed temperatures, 15 g/L NaCl and a feed flow rate of 1.07 L/min.


Table 1.
Comparison between the performances of the predicted model in this study with various membranes found in the literature.
Table 1.
Comparison between the performances of the predicted model in this study with various membranes found in the literature.
| Membrane * | Feed Temp. (°C) | Feed Conc. (g/L) | Feed Flow Rate (L/min) | Exp. Flux (kg/m2·h) | Ref. |
|---|---|---|---|---|---|
| PVDF | 50 | 35 | 0.6 | 21 | [32] |
| M4-2(PDMS) | 70 | 35 | 1 | 43 | [44] |
| PTFE | 40–90 | 4.65 | 0.14–100 | 55–72 | [45] |
| PVDF | 80 | 0.45 | 6 | 51.5 | [46] |
| PTFE | 130 | 10 | 0.5 | 195 | [47] |
| PTFE-CNTs | 70 | 34 | - | 69 | [48] |
| PP | 40–60 | - | 0.5–1.7 | 5–25 | [49] |
| PVDF-HFP/SiNPs | 80 | 35 | 1.166 | 48.6 | [50] |
| PP | 85–90 | 10–100 | 25 | 60–79 | [51] |
| PTFE | 60 | Seawater | 4.5 | 45.5 | [52] |
| PTFE + TiO2NF | 50–80 | 0–100 | - | 7–12.2 | [53] |
| PTFE | 38 | Various | 11–22 | 2–5 | [54] |
| PTFE | 70 | 35 | Re = 500–1500 | 47.8–86.8 | [55] |
| PTFE-PP | 60 | 30 | 0.04 | 12.2 | [56] |
| PVDF-PTFE + PET + CS-PEO | 60 | 20 | 0.5 | 19 | [57] |
| PTFE | 45–65 | 0–200 | 0.3–1.07 | Predicted flux 5.1–17.3 | Present work |
* PVDF: polyvinylidene difluoride; PDMS: polydimethylsiloxane; CNTs: carbon Nanotubes; PP: polypropylene; PVDF-HFP/SiNPs: poly(vinylidene fluoride-co-hexafluropropylene)/Silica nanoparticles; F-TNF: Fluorinated Titania; PET: polyethylene support layer; CS-PEO: chitosan-polyethylene oxide.
© 2020 by the authors. Licensee MDPI, Basel, Switzerland. This article is an open access article distributed under the terms and conditions of the Creative Commons Attribution (CC BY) license (http://creativecommons.org/licenses/by/4.0/).
Share and Cite
MDPI and ACS Style
Ameen, N.A.M.; Ibrahim, S.S.; Alsalhy, Q.F.; Figoli, A. Highly Saline Water Desalination Using Direct Contact Membrane Distillation (DCMD): Experimental and Simulation Study. Water 2020, 12, 1575. https://doi.org/10.3390/w12061575
AMA Style
Ameen NAM, Ibrahim SS, Alsalhy QF, Figoli A. Highly Saline Water Desalination Using Direct Contact Membrane Distillation (DCMD): Experimental and Simulation Study. Water. 2020; 12(6):1575. https://doi.org/10.3390/w12061575
Chicago/Turabian StyleAmeen, Noor A. Mohammad, Salah S. Ibrahim, Qusay F. Alsalhy, and Alberto Figoli. 2020. "Highly Saline Water Desalination Using Direct Contact Membrane Distillation (DCMD): Experimental and Simulation Study" Water 12, no. 6: 1575. https://doi.org/10.3390/w12061575
Note that from the first issue of 2016, this journal uses article numbers instead of page numbers. See further details here.