Quality of Dissolved Organic Matter Driven by Autotrophic and Heterotrophic Microbial Processes in a Large River


1
Department of River Ecology, Helmholtz—Centre for Environmental Research—UFZ, Brückstraße 3a, D-39114 Magdeburg, Germany
2
Department of Analytical Chemistry and ProVIS—Centre for Chemical Microscopy, Helmholtz Centre for Environmental Research—UFZ, Permoserstr. 15, 04318 Leipzig, Germany
3
Department of Lake Research, Helmholtz Centre for Environmental Research—UFZ, Brückstraße 3a, 39114 Magdeburg, Germany
*
Author to whom correspondence should be addressed.
Water 2020, 12(6), 1577; https://doi.org/10.3390/w12061577
Submission received: 7 May 2020
/
Revised: 28 May 2020
/
Accepted: 29 May 2020
/
Published: 31 May 2020
(This article belongs to the Special Issue Microbial Processing of Dissolved Organic Matter in Streams and Rivers)
Abstract
:Rivers are regarded as important sites for processing of dissolved organic matter (DOM) from terrestrial sources on its way to the ocean. However, little is known about the longitudinal change of DOM molecular composition in large rivers. Here we performed a Lagrangian sampling in the lower part of the Middle Elbe at low discharge conditions to test how DOM composition changes along the river stretch and how this is related to microbial processes. The concentration of dissolved organic carbon and fluorescence indices showed only subtle longitudinal differences. In contrast, ultra-high-resolution mass spectrometry analysis of riverine DOM detected pronounced changes in molecular composition. Also, chlorophyll a concentration, bacterial abundance, and bacterial production all increased downstream. The three microbial parameters were positively related to intensities of CHO and CHNO molecular formulas with high hydrogen/carbon and low oxygen/carbon ratios but negatively to several CHOS surfactants. To disentangle the role of autotrophic and heterotrophic processes, we developed a new approach and compared slopes from linear regression of DOM compound intensities versus chlorophyll a concentration and bacteria abundance. As a result, most of the positive related DOM compounds were produced by bacteria. In conclusion, longitudinal changes of river DOM seemed to be largely driven by microbial processes.
1. Introduction
Rivers receive considerable amounts of terrestrial organic matter and are important links between terrestrial environments and the ocean [1]. Many transfer processes take place on the way to the river mouth. On the one hand, terrestrial dissolved organic matter is degraded although the processing and the net loss of terrestrial dissolved organic matter (DOM) was described to be low in some systems [2,3]. On the other hand, algal photosynthesis contributes to increasing proportions of autochthonous DOM [4,5], and rivers receive molecules from anthropogenic sources such as agriculture, industry, and waste-water treatment [5,6]. Biological processing of DOM in streams and rivers is mainly performed by heterotrophic bacteria whose growth efficiency depends on DOM source [7]. A part of DOM is degraded to smaller molecules or CO2 while other fractions are buried in the sediments or exported to the sea [8,9,10]. The DOM export from rivers depends on river channel connectivity where DOM heterogeneity increases with fluvial complexity [11], and on hydrological conditions where the intensity of microbial processes is predicted to be high at low discharge when the river acts as an “active pipe” [12].
DOM quality and its changes in streams are commonly assessed using fluorescence spectra [5,6,13]. Several indices relating specific excitation and emission wavelengths have been developed, e.g., an increased freshness index [14] indicates more microbially produced DOM, and a decreased humification index [15] indicates less plant-derived DOM. The very high resolution and mass accuracy of Fourier-transform ion cyclotron resonance mass spectrometry (FT-ICR MS) enables the reliable assignment of thousands of CHO, CHNO, CHOS, and CHNOS (C: carbon, H: hydrogen, N: nitrogen, O: oxygen, S: sulphur) molecular formulas in DOM [16]. In recent years, several mass spectrometry-based studies of riverine DOM were performed at single sites of one or more streams [17,18,19] and also compared the largest world rivers [20,21]. However, data on longitudinal transects of DOM in streams [22,23] and even more so in large rivers are scarce. Thus, we investigated the change of DOM composition in the lower part of a large river by a Lagrangian sampling according to travel time. We tested the hypotheses that: (1) freshness index and low-molecular weight DOM increase along the river course due to planktonic microbial production, and (2) bacterial abundance and activity are increasing as a consequence. Furthermore, we developed a new approach to disentangle the role of autotrophic and heterotrophic processes for DOM composition via comparison of standardized slopes of linear regression.
2. Materials and Methods
2.1. Study Area and Sampling
Investigations using the research vessel Albis were performed in the river Elbe in Central Europe which is 1094 km long and drains a catchment of 148.268 km2. We applied a Lagrangian approach, i.e., a sampling of nearly the same water body along the way downstream according to its travel time, in the lowland part between Magdeburg-Westerhüsen (river km 318 according to German kilometration) and the weir Geesthacht near Hamburg before the tidal zone (km 585). The cruise was performed between 25 and 28 June 2018 at low discharge of 199 m3·s−1, which is slightly less than the mean low discharge at Magdeburg (231 m3·s−1) in summer, as DOM quality is controlled by instream processes during the late growing season (as opposed to transport control during high flow) [20]. Longitudinal sampling was conducted at 13 sites for chlorophyll a and DOM parameters (three to five points along cross sections, 42 samples in total) and at eight sites for bacterial parameters (left and right bank, 16 samples). Samples were taken with a horizontal sampler from 30 cm water depth.
2.2. Chlorophyll a Concentration, Bacterial Abundance, and Biomass Production
For chlorophyll a analysis, samples were filtered onto glass fiber filters (GF-F, Whatman, Buckinghamshire, UK) immediately after sampling on board of the vessel, filters were frozen, and chlorophyll a was measured spectrophotometrically after ethanolic extraction. Abundance of planktonic bacteria from formalin-fixed samples was estimated after staining with acridine orange and counting using an epifluorescence microscope (Axioskop2, Zeiss, Oberkochen, Germany) according to [24]. Production of planktonic bacteria was measured using the leucine technique [25] as described by [24] after storage of samples at 4 °C until the next day. For measurement of planktonic bacterial production (BP), triplicate 5 mL aliquots and one formalin-treated control (3.7%, final concentration) were spiked with 14C-leucine (12.2 MBq µmol−1, Sigma, 50 nM final concentration). Samples were incubated in the laboratory at in situ temperature for 1 h in the dark on a shaker. Incorporation was stopped with formalin, and 0.6 mL 50% trichloracetic acid (TCA) was added. Proteins were extracted for 15 min and filtered onto 0.2 µm Nuclepore membranes. Filters were rinsed twice with 1 mL 5% TCA and once with 80% ethanol. After dissolving the filters in 0.5 mL Soluene (PerkinElmer, Waltham, Massachusetts) and adding 2.5 mL Hionic Fluor (PerkinElmer, Waltham, Massachusetts) to each scintillation vial, radioactivity was measured using a Liquid Scintillation Analyzer (2300 TR, Packard). The external standard ratio method was used for quenching. Carbon production was calculated using the equations of [25].
2.3. Measurement of Dissolved Organic Carbon (DOC) Concentration and Fluorescence
For analysis of DOC, water samples were transferred into acid-rinsed and combusted brown glass bottles, kept at 4 °C for a maximum of 24 h and filtered through glass fiber filters (Whatman GF/F). DOC concentrations were measured by infrared detection of CO2 after high temperature combustion (DIMATOC 2000, Dimatec Analysentechnik GmbH, Essen, Germany). Fluorescence intensity was measured during emission scans (240–600 nm every 3.27 nm; 8 pixel) at set excitation wavelengths in 3 nm increments from 240 nm to 600 nm. A 5 nm bandpass for excitation and emission wavelength and 1 s integration time were used. Fluorescence data were corrected (including blank subtraction) using HORIBA internal software. Afterwards, the excitation–emission matrices (EEMs) were Rayleigh-scattering masked and corrected for inner-filter effects [26] using an Aqualog ® (HORIBA Jobin Yvon GmbH, Bensheim, Germany) internal recorded Ultraviolet-Visible (UV-Vis) absorbance spectrum recorded in the same quartz cell as the fluorescent sample.
Three fluorescence indices were used to describe the general DOM structure: freshness index, humification index (HIX), and fluorescence index (FI). The freshness index (ß/α, where ß represents more recently derived DOM and α represents highly decomposed DOM) [14] was computed as the ratio of the emission intensity at 380 nm divided by the highest detected emission intensity between 420 nm and 435 nm, all obtained for excitation at 310 nm. The ratio of ß/α is an indicator of autochthonous inputs and indicates relative contributions of recent, microbially produced DOM. The HIX was computed by dividing the peak area under the emission spectra between 435–480 nm with the peak area under the emission spectra between 300–345 nm, both at 255 nm excitation wavelength [15]. The humification index is associated with the degree of condensation of fluorescing molecules and lower hydrogen/carbon (H/C) ratios and supposedly indicates extent of humification. The FI is the emission intensity at 470 nm divided with that of 520 nm at 370 nm excitation [27].
2.4. High-Field FTICR Mass Spectrometry of DOM
2.4.1. Solid Phase Extraction (SPE)
Aliquots of 500 mL water were filtered through pre-combusted glass fibre (GF/F; Whatman) and acidified with HCl (Suprapur, Merck, Kenilworth, NJ, USA) to pH 2. Subsamples of 450 mL of the acidified filtrate were passed through 500 mg styrene-divinyl-polymere type (PPL) solid-phase cartridges (Agilent, Waldbronn, Germany) using a SmartPrep® automatic cartridge extractor (Horizon Technology, Salem, MA, USA) to desalt the sample for subsequent direct infusion electrospray ionization mass spectrometry (DI-ESI-MS). The retained DOM was eluted twice with 2 mL methanol (high performance liquid chromatography grade, Baker, Phillipsburg, New Jersey); the extracts (solid phase extractable dissolved organic matter (SPE-DOM) in the following) were diluted with methanol to 5 mL and were stored at −20 °C until analysis [28,29]. The average carbon:sorbens ratio was 209 ± 26 and the average carbon-based recovery (60 ± 11%; n = 42).
2.4.2. FT-ICR MS Measurement
SPE extracts were diluted to 20 ppm, mixed 1:1 (v/v) with ultrapure water and analyzed in random order with an FT-ICR mass spectrometer equipped with a dynamically harmonized analyzer cell (solariX XR, Bruker Daltonics Inc., Billerica, MA, USA) and a 12 T refrigerated actively shielded superconducting magnet (Bruker Biospin, Wissembourg, France) instrument (capillary voltage 4.3 kV) was used at an infusion rate of 10 µL min−1. For each spectrum, 256 scans were co-added in the mass range m/z 150–3000 Da with 10 ms ion accumulation time and 4 MW time domain (resolution @ 400 m/z was ca. 500,000). Mass spectra were internally calibrated with a list of peaks (m/z 200–650 Da, n > 147) commonly present in natural organic matter, the mass accuracy after internal calibration was better than 0.11 ppm (n = 42). Peaks were considered if the signal/noise (S/N) ratio was greater than four. Raw spectra were processed with Compass DataAnalysis 5.0 (Bruker Daltonics Inc., Billerica, MA, USA).
2.4.3. Data Evaluation
Molecular formulas were assigned to peaks in the mass range m/z 150–750 with an error range of ±0.4 ppm according to [30]. Molecular formulas were calculated considering the following elements 12C0–60, 13C0–1, 1H0–122, 16O0–40, 14N0–4, 32S0–1, 34S0–1. Only formulas with 0.3 ≤ H/C ≤ 2.5, 0 ≤ O/C ≤ 1, 0 ≤ N/C ≤ 0.5, 0 ≤ DBE ≤ 20 (double bound equivalent, DBE = 1 + 1/2 (2C-H + N) and −10 ≤ DBE-O ≤ +10 were considered for further data evaluation [31,32]. Isotopologue formulas (13C, 34S) were used for quality control but removed from the final data set as they represent duplicate chemical information. On average 5642 ± 568 molecular formulas were assigned to 15,900 ± 1180 peaks in the considered mass range (n = 42). Relative peak intensities (RI) were calculated based on the summed intensities of all assigned peaks in each sample [33,34]. Only molecular formulas present in all samples (n = 2462) were considered for further analysis. These formulas represent on average 82.5 ± 2% of the total intensity of all assigned peaks.
We applied a linear regression between the relative mass peak intensity as dependent variable and (i) the distance of the sampling sites from the source, (ii) the chlorophyll a (Chl a) concentration, (iii) the bacterial abundance, and (iv) the bacterial production as independent variables. Independent variables were standardized (Table S1). The slope values were used at p < 0.05. The slope of linear regression can thus be regarded as semi-quantitative measure for the change in compound abundance; a positive/negative slope reflects an increase/decrease of the compound abundance along the flow length, with Chl a concentration, etc. The calculation of linear regression was previously used for comparable data sets and proved useful to disentangle microbial–molecular relationships [34]. The standardization allows the comparison of slopes for different parameters. Here we used the slope differences for significant regressions, i.e., |slope (peak intensity vs. Chl a concentration)| − |slope (peak intensity vs. bacterial abundance)| indicating the dominant process determining compound abundance changes (for CHO and CHNO only positive slopes and for CHOS only negative slopes were evaluated for this calculation).
3. Results
3.1. Longitudinal Changes
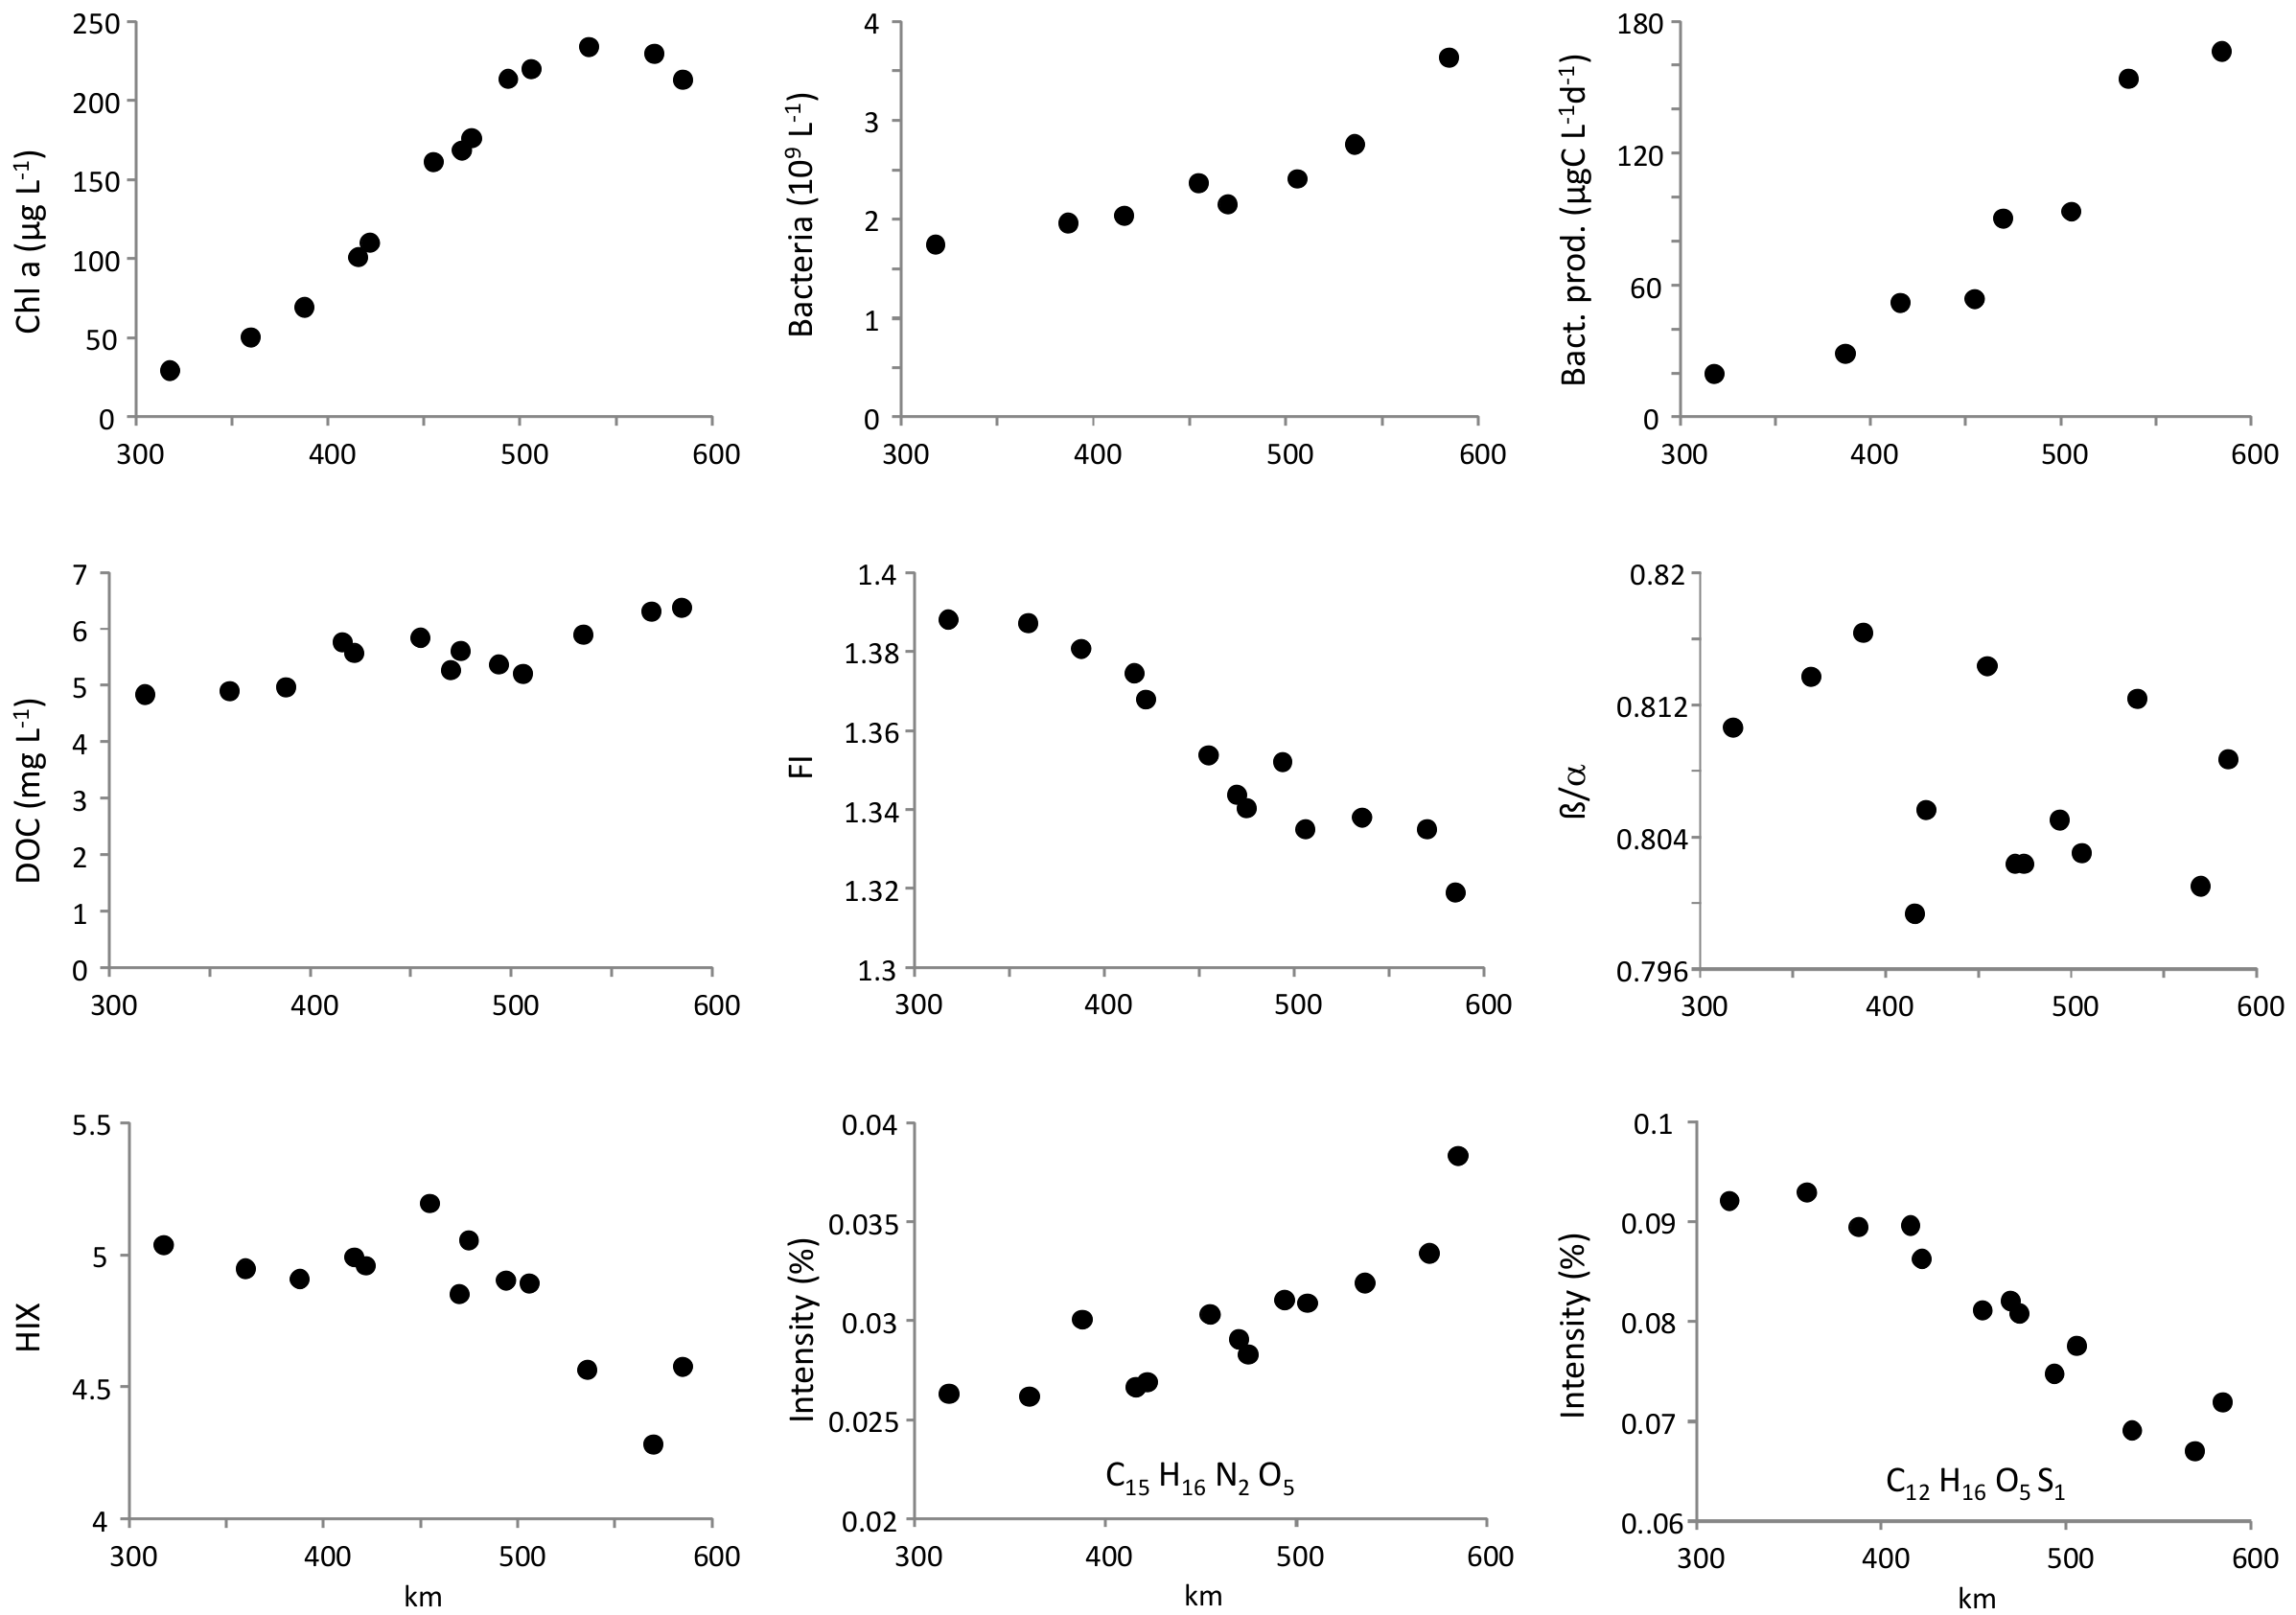
The concentration of chlorophyll a was 29 µg·L−1 in Magdeburg (km 318) and increased to maximum values of 234 µg·L−1 at km 536 (Figure 1). Bacterial abundance increased from 1.7 to 3.6 × 10⁹ L−1 and bacterial production from 20 µg C L−1·d−1 to 160 µg C L−1·d−1. The concentration of DOC increased slightly along the river stretch starting from 5 mg L−1 in Magdeburg and reaching 6 mg·L−1 in Geestacht (km 585). The fluorescence index FI decreased within a narrow range from 1.39 to 1.32. The freshness index β/α did not show a consistent longitudinal pattern whereas the humification index HIX decreased slightly from 5 to 4.5. Relative intensities of SPE-DOM molecular formulas detected by FT-ICR MS either declined or increased along the river stretch (see Figure 1 for two examples) or did not change significantly. The slopes of all SPE-DOM molecular formula intensities against river kilometers showed a longitudinal increase of many CHO and CHON formulas but a longitudinal decrease of several CHOS compounds (Figure S1).
3.2. Relation to Microbial Processes
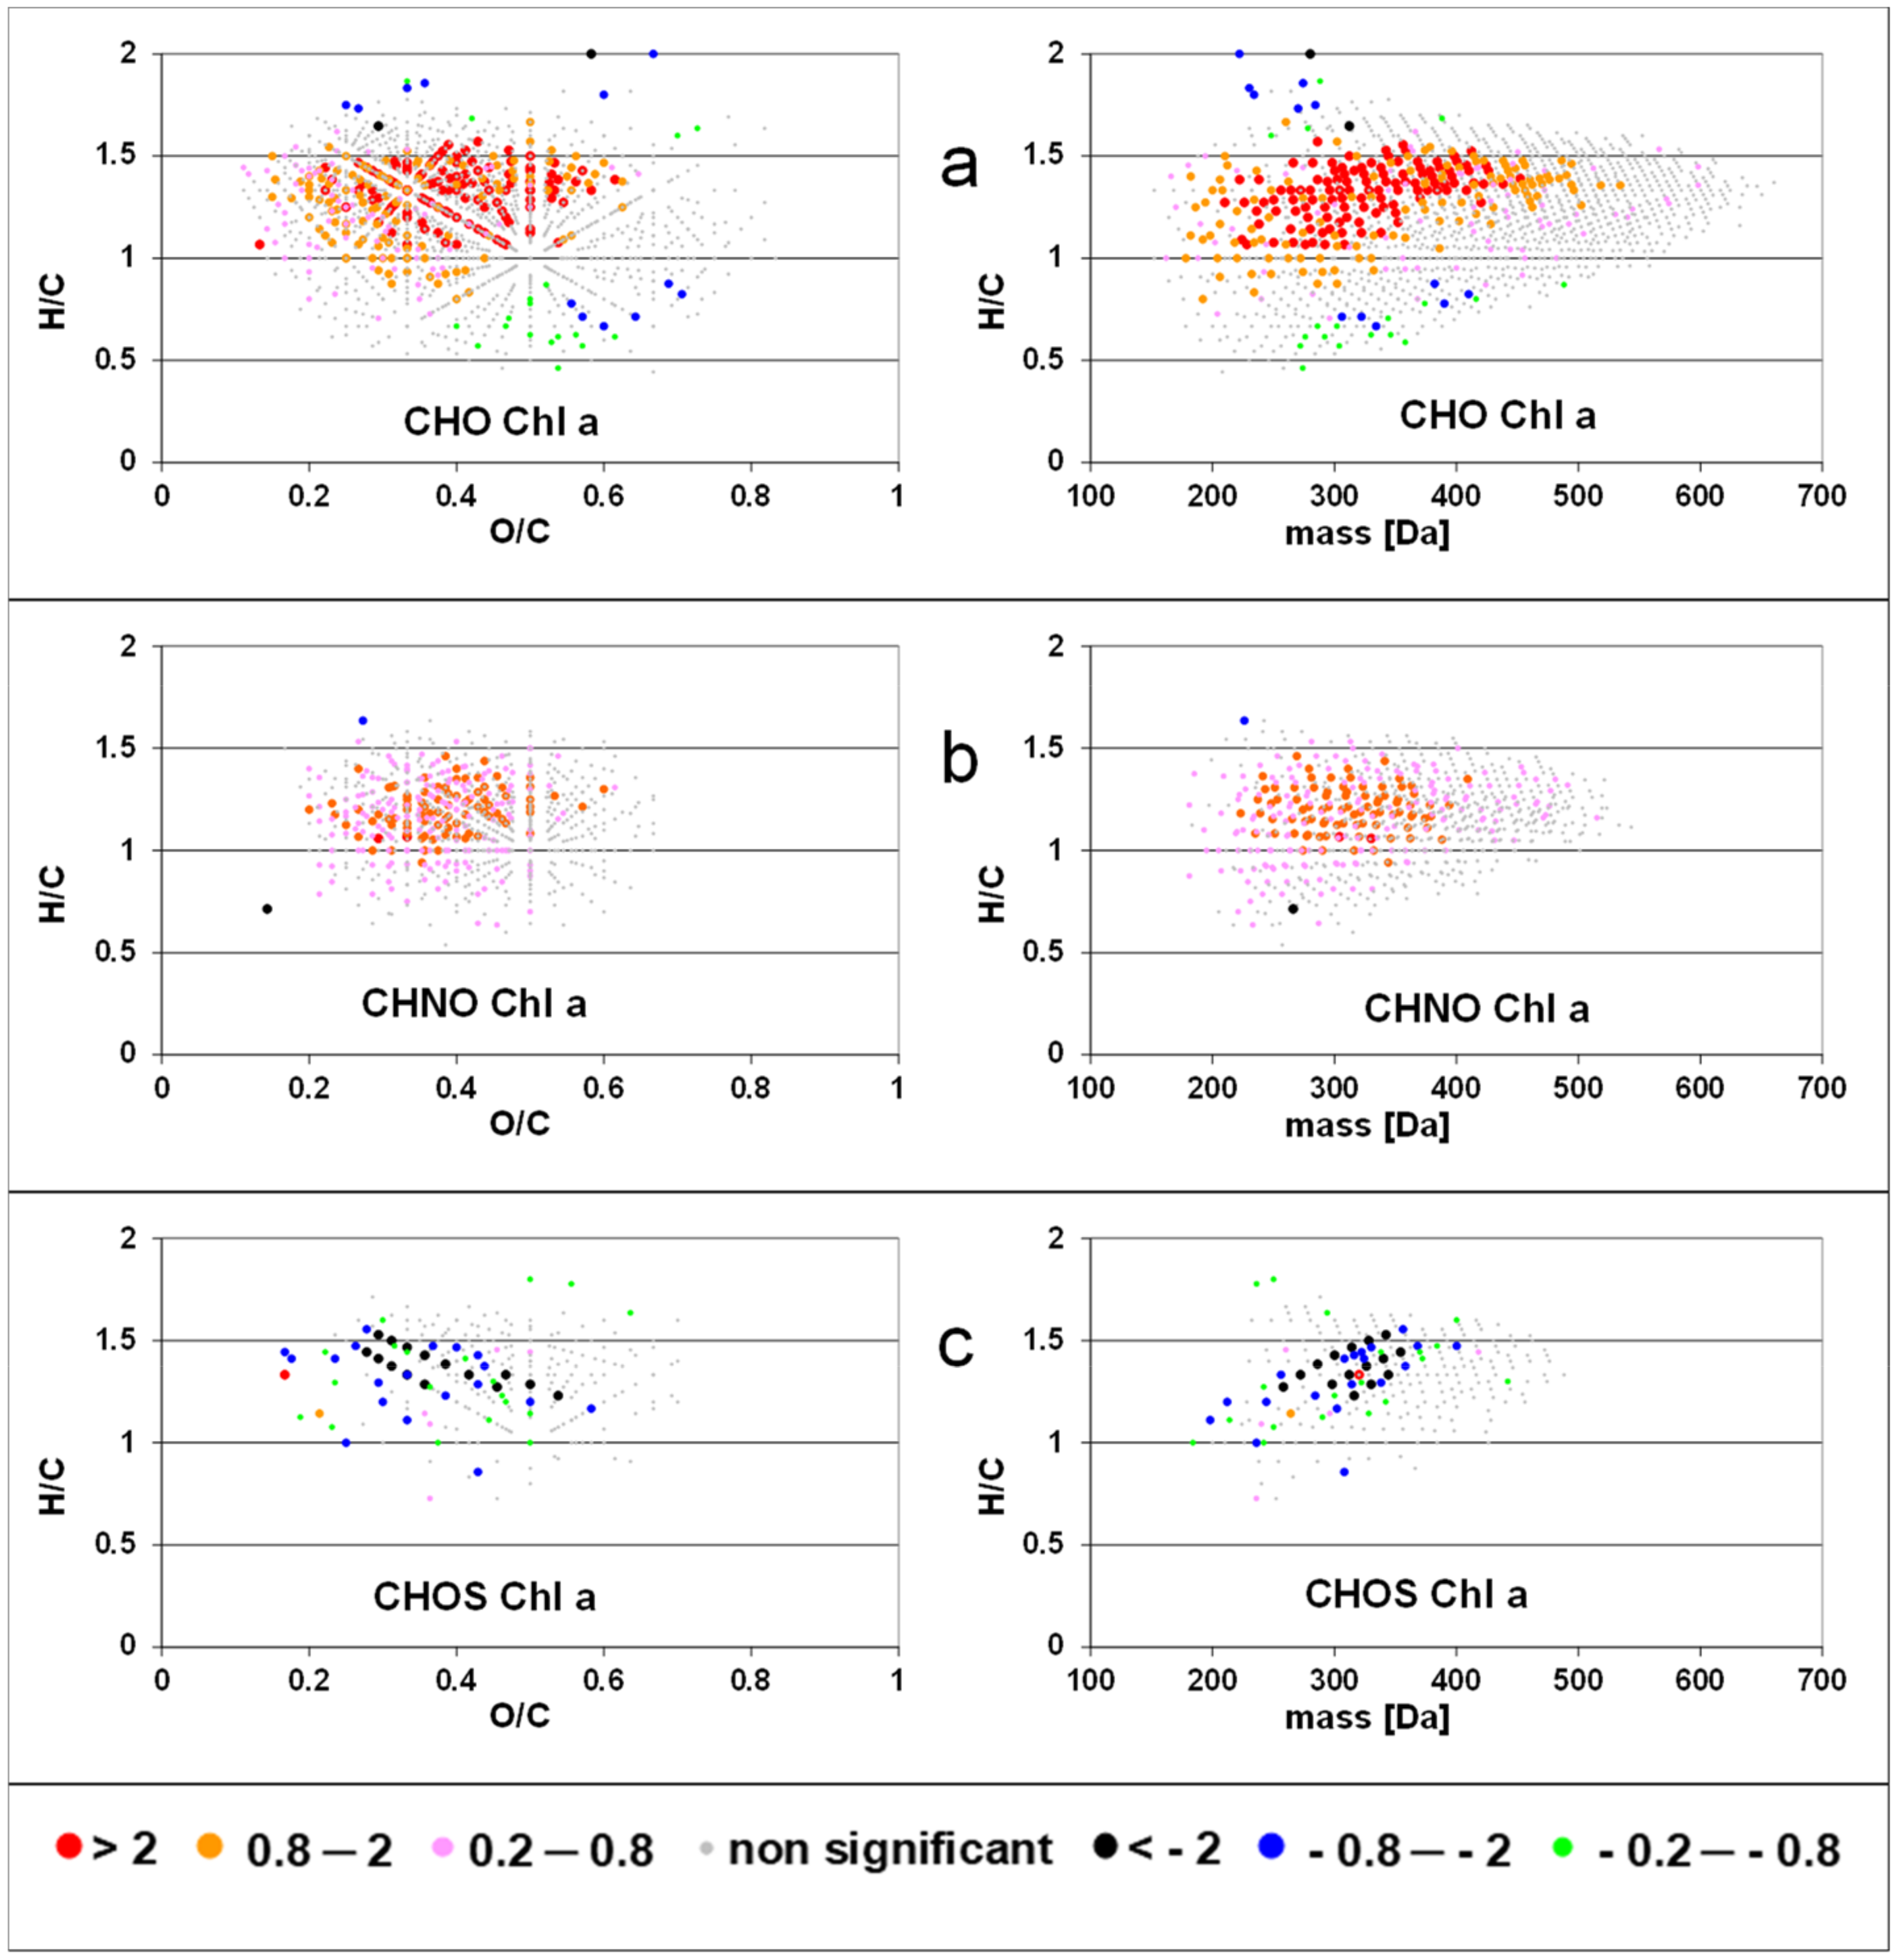
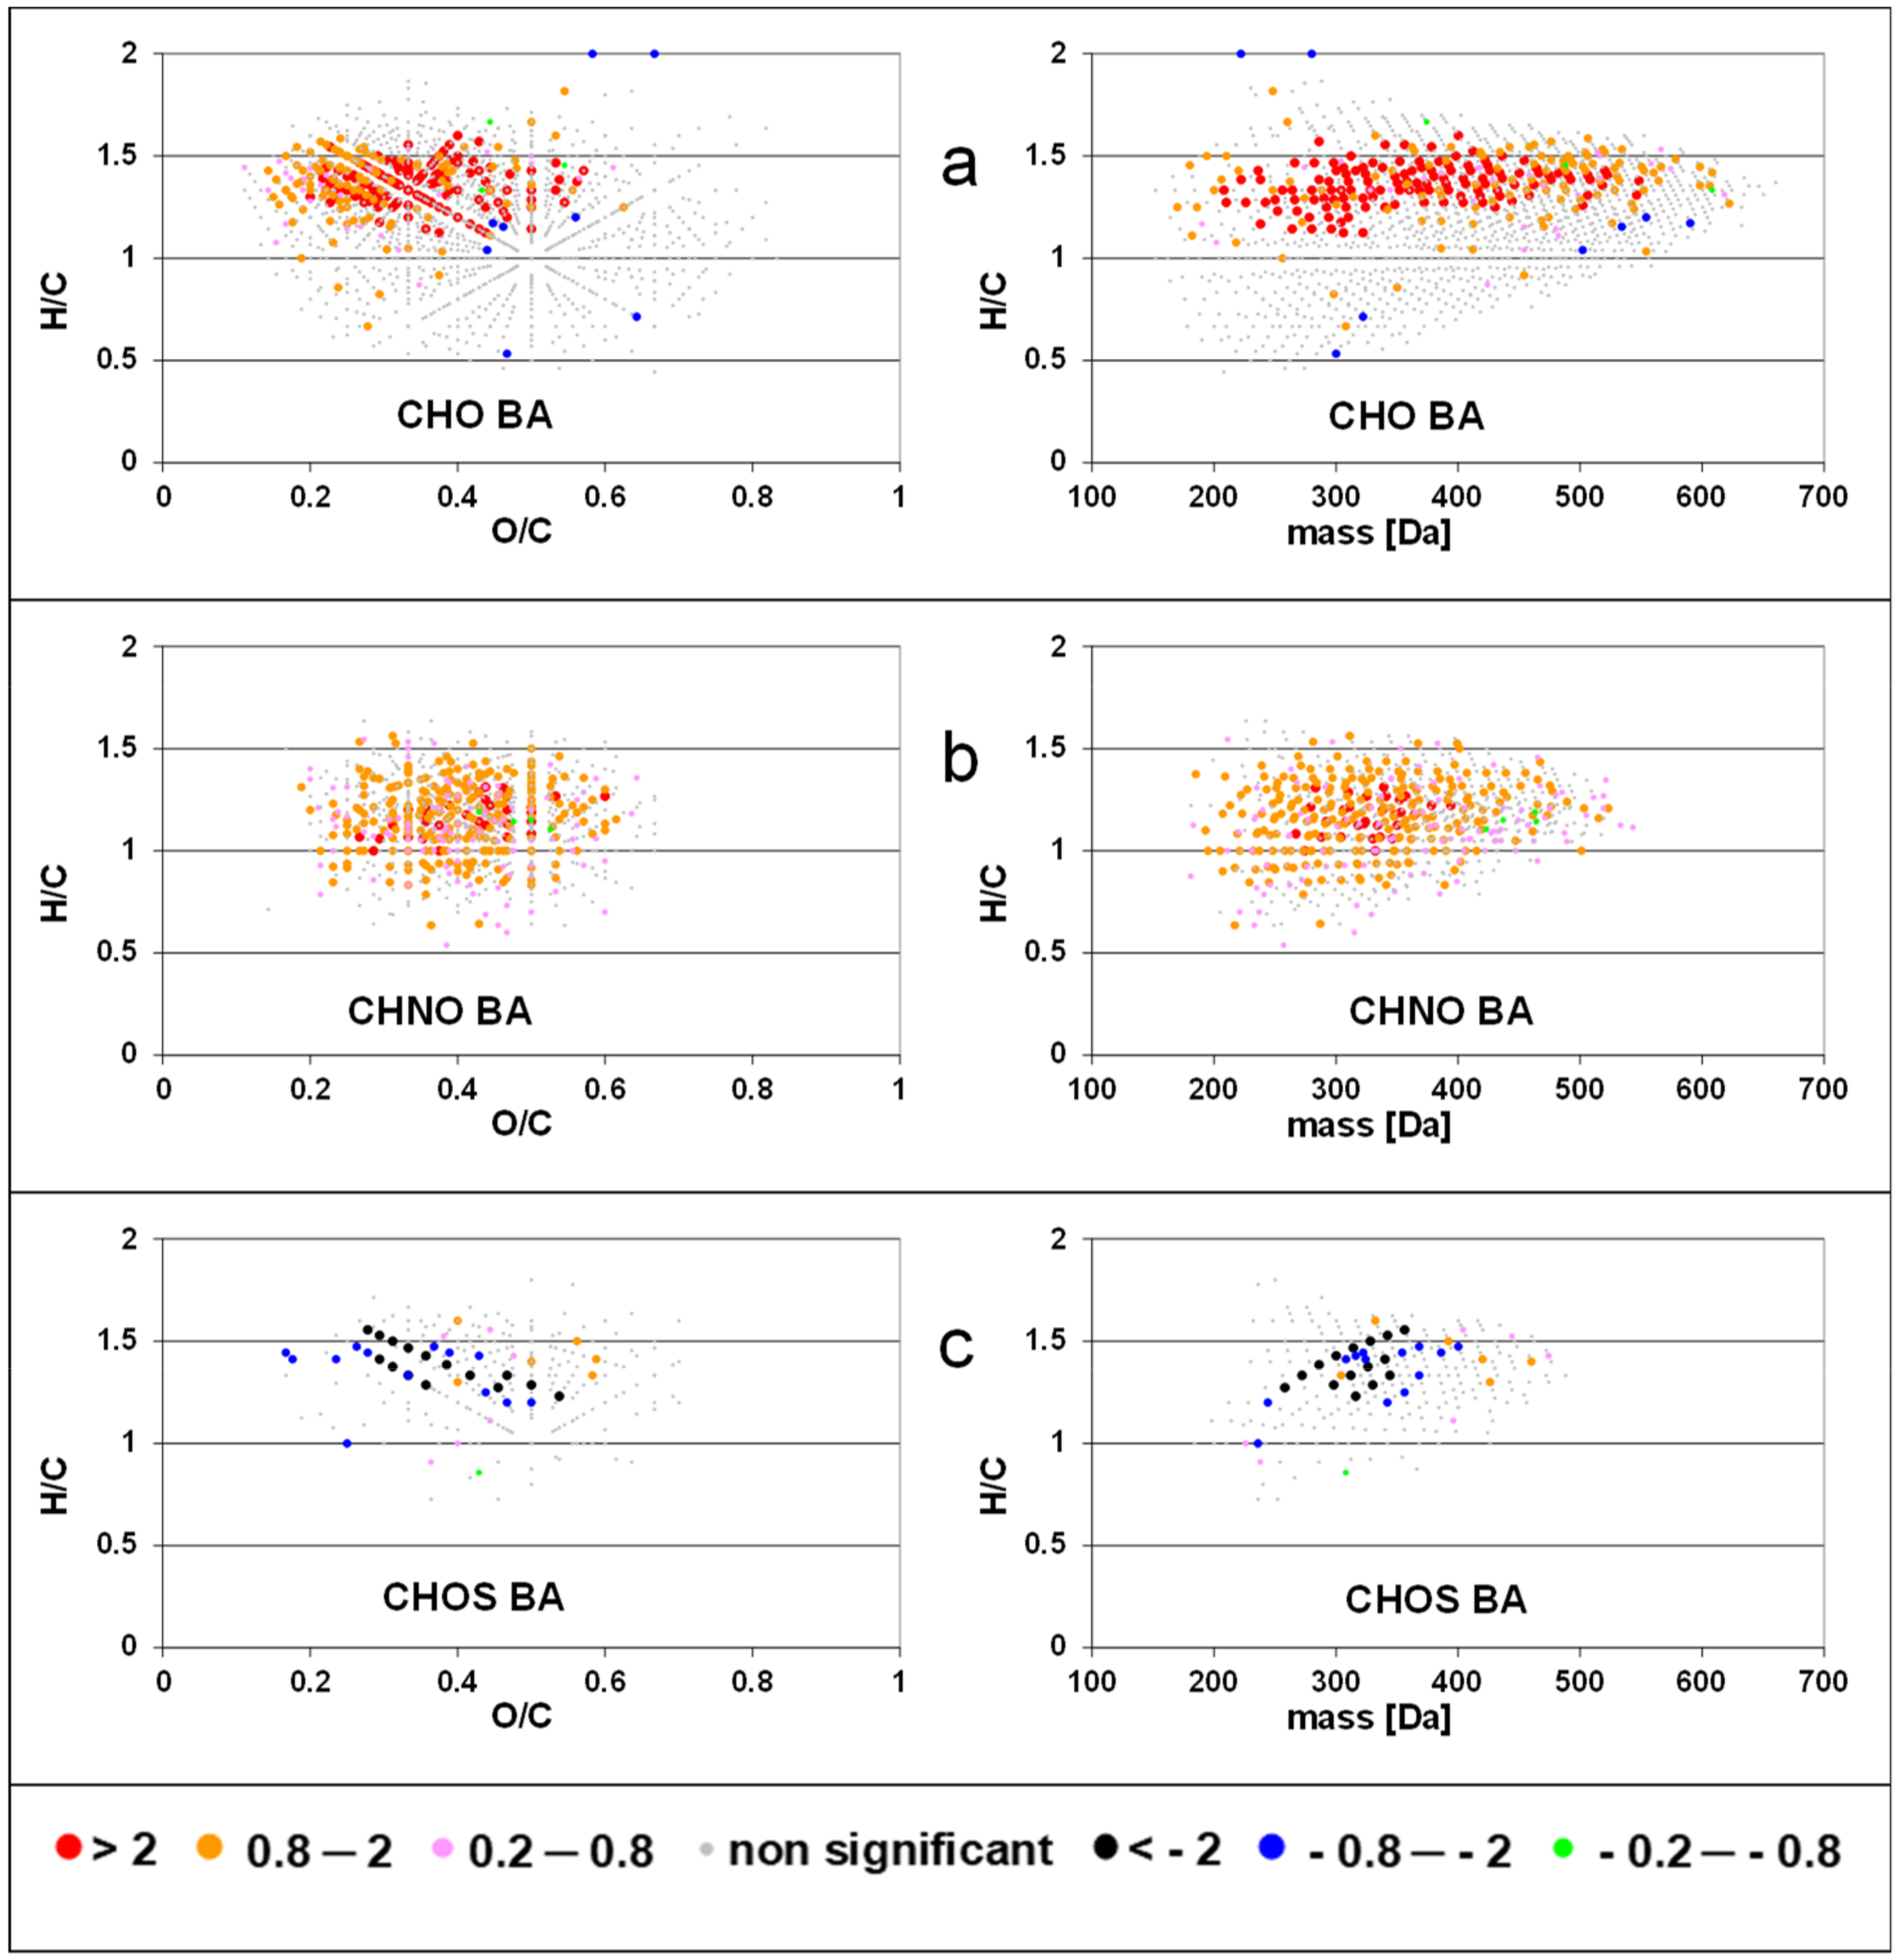
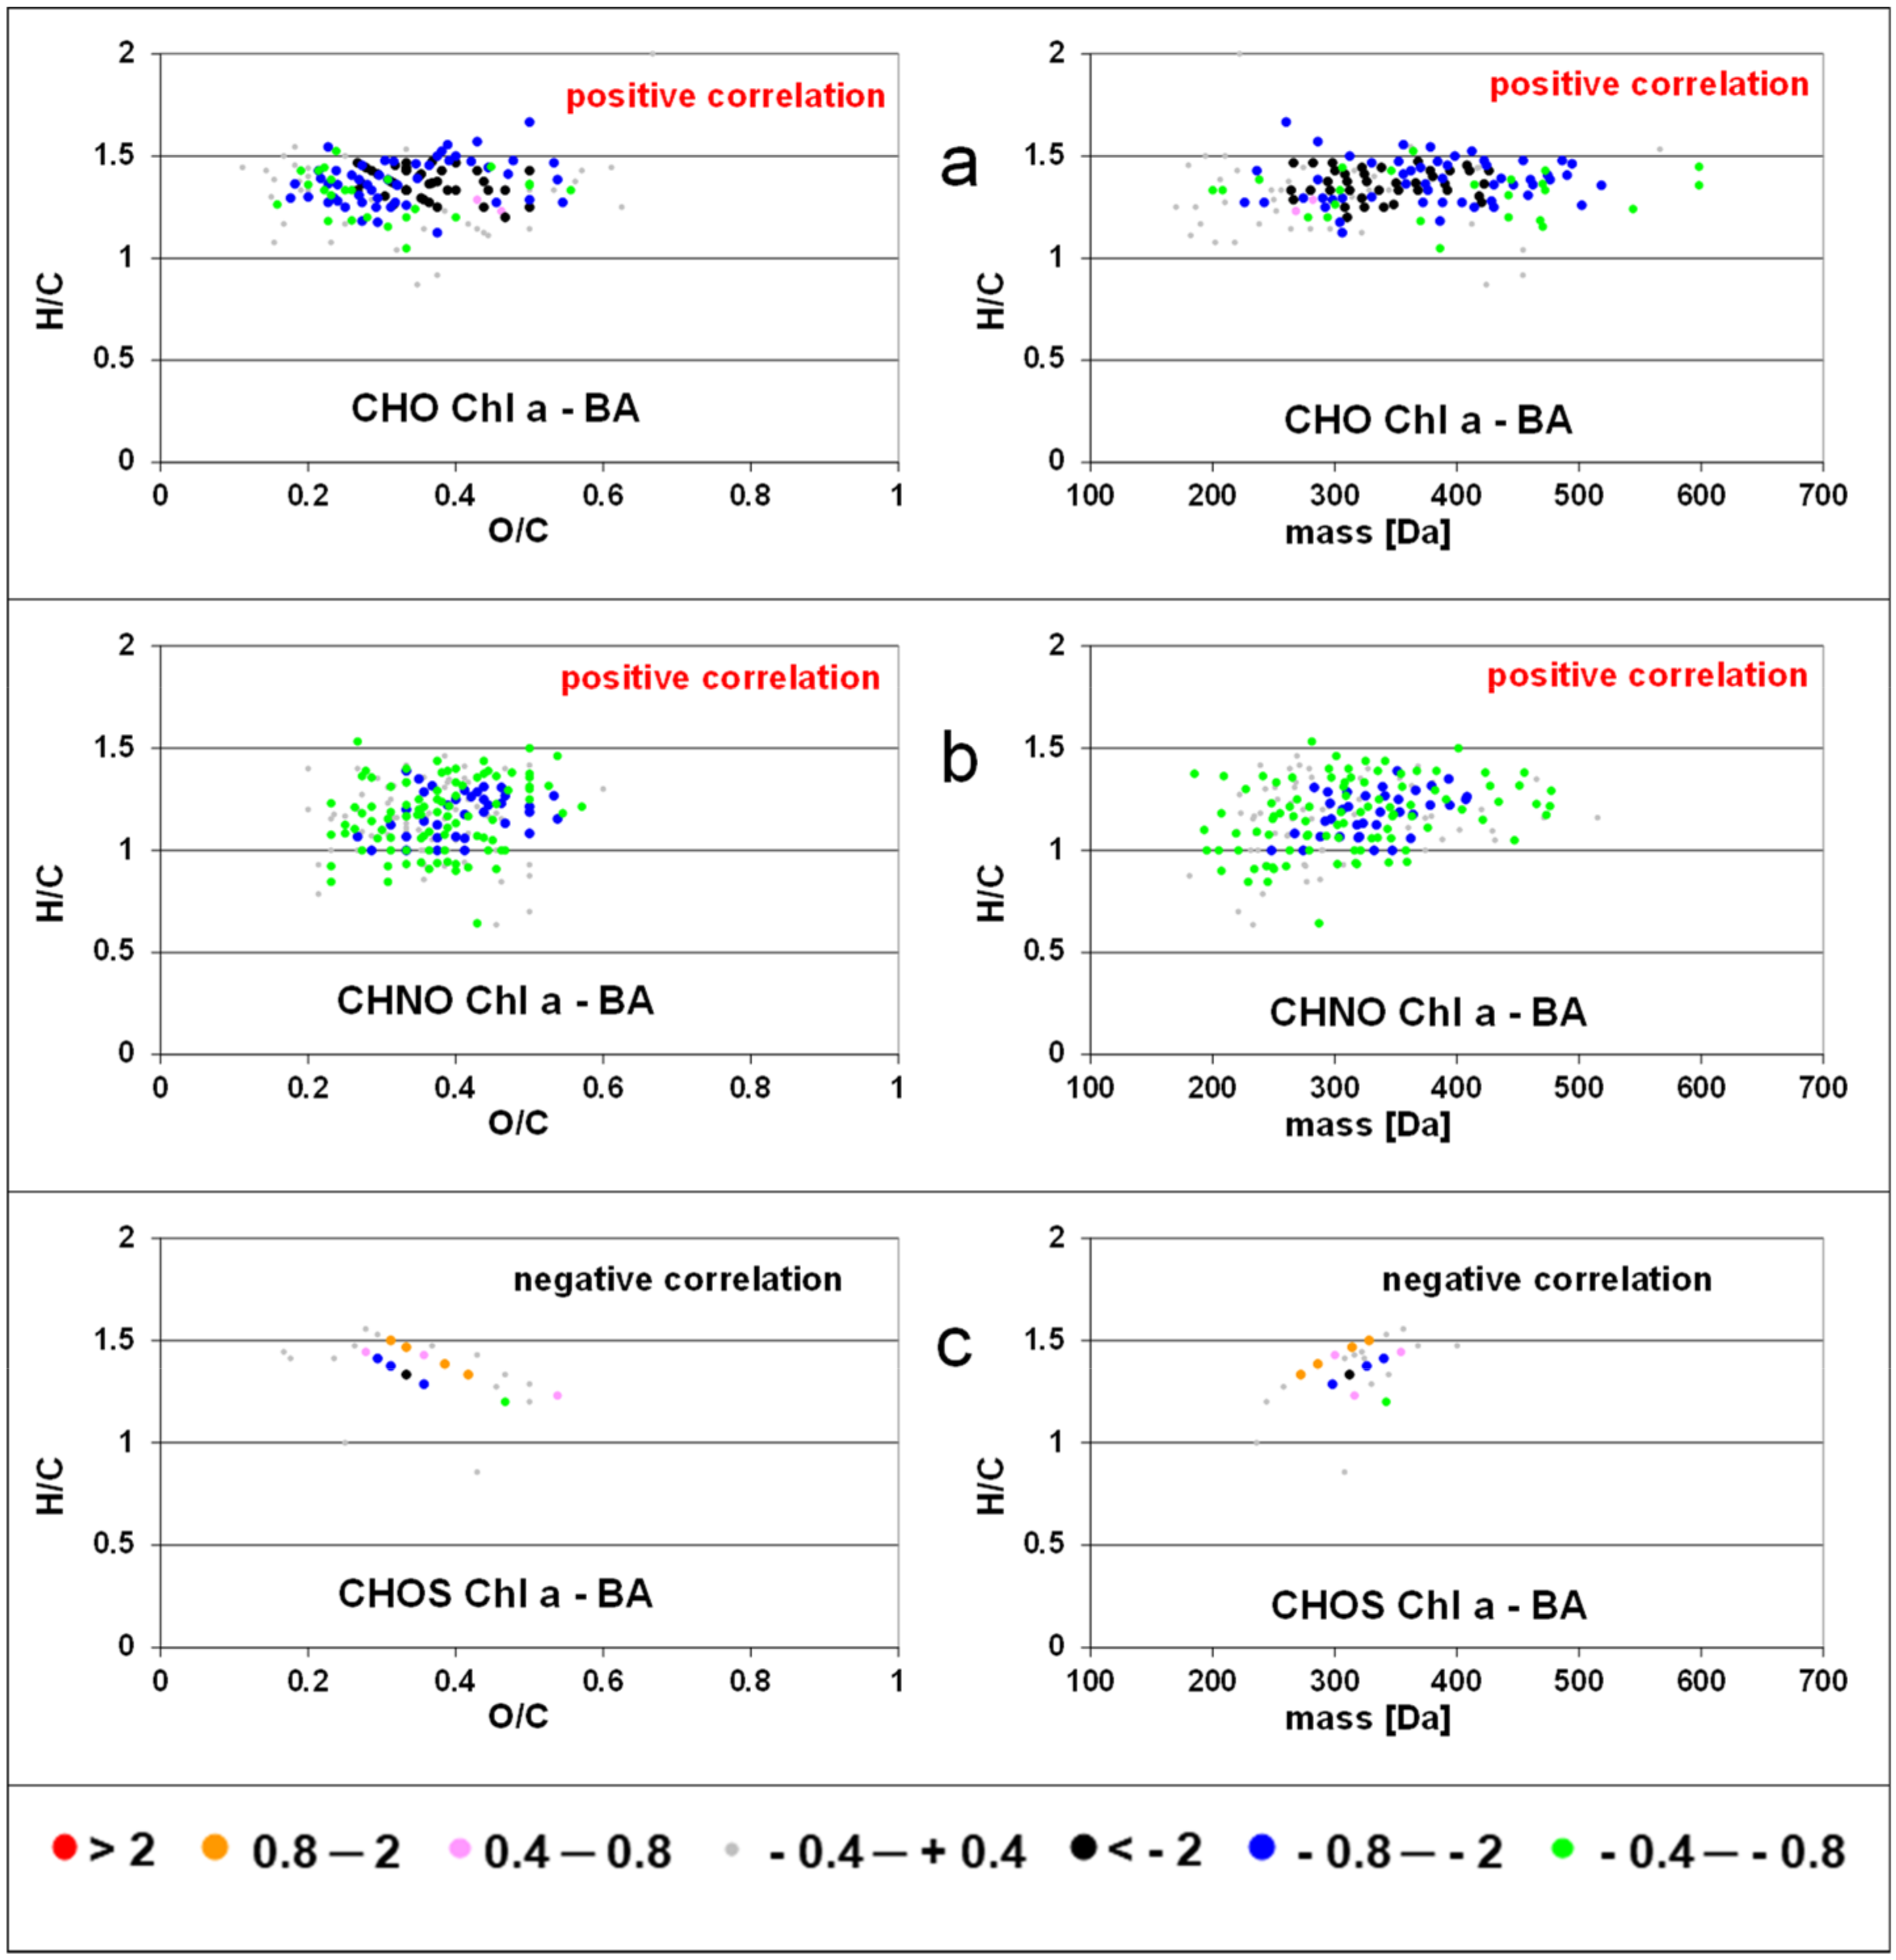
When intensities of FT-ICR MS components were correlated (by linear regression) to standardized chlorophyll a concentration, we detected positive slopes for CHO formulas with H/C ratios between 0.9–1.6 and O/C ratios between 0.1–0.6 and a molecular mass up to 500 Da (Figure 2). Few formulas with negative slopes were observed with H/C ratios >1.6 and <0.9. Formulas of the CHNO compound class showed positive slopes in the same range of O/C and H/C rations as CHO compounds but with lower molecular weight (<400 Da). Almost no negative slopes were calculated for CHNO formulas. In contrast, negative slopes were found for CHOS formulas along two characteristic lines in the van Krevelen space. The regression of peak intensities with bacterial abundance resulted in a similar pattern (Figure 3), where strongly positive slopes for the CHO class extending up to 600 Da and almost no negative slopes. The slopes of the CHNO class were slightly less positive than those of the CHO class. In contrast to the results for chlorophyll a, CHNO formulas with positive slopes from the regression to bacterial abundance covered a larger molecular diversity (0.7 < H/C < 1.6) as compared to the CHO formulas (1.1 < H/C < 1.6). An extended mass range for the CHNO formulas with positive slopes after bacterial abundance regression (up to 500 Da) was found as compared to the chlorophyll a regressions. CHOS formulas related negatively to bacteria showed similar H/C, O/C, and mass ranges as compared to CHOS formulas related to Chl a. The number of molecular formulas with significant regression to bacterial production was slightly lower than those related to bacterial abundance but were located in similar regions in the van Krevelen space (Figure S2).
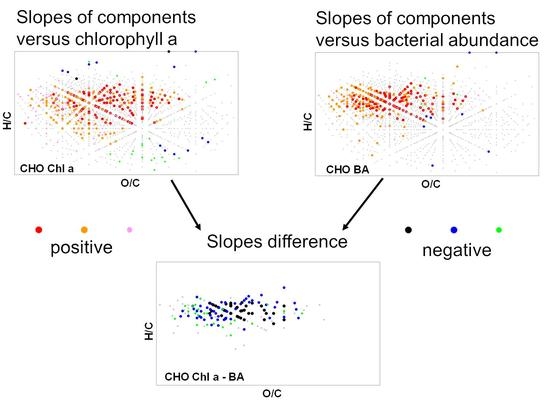
The difference between slopes of SPE-DOM molecular formulas versus chlorophyll and those versus bacterial numbers showed were negative for the CHO compound class (i.e., higher slopes versus bacterial numbers; Figure 4). Slope differences were less pronounced for CHON formulas. Slope differences for CHOS formulas were slightly positive (chlorophyll-dominated) for the C6H4(CH2)nO5S and negative (bacteria-dominated) for the C8H6(CH2)mO5S. A similar pattern as for bacterial numbers was found for bacterial production (Figure S3).
4. Discussion
4.1. Longitudinal Changes
The concentration of chlorophyll a increased along the investigated stretch of the river Elbe of 270 km length. After an eight-fold rise, it reached high maximum values of 230 µg·L−1. This was observed before in the river Elbe [35] and in other rivers [36]. Long travel times at base flow and high light availability on end of June enabled high growth rates of phytoplankton. This pattern was not reflected by DOC concentration and fluorescence of DOM. DOC concentration increased only slightly, FI even decreased, and β/α did not show a longitudinal regression. This was in contrast to findings of longitudinal increases of FI and BIX in other rivers [37,38]. Only the slightly decreasing values of HIX in the river Elbe were in line with reports of declining HIX [37,38]. Obviously, fresh organic carbon potentially produced by growing phytoplankton was immediately taken up by heterotrophic planktonic bacteria. Their production increased by factor eight while their abundance increased by factor two, i.e., the specific bacterial production increased by factor four, probably by higher substrate supply due to algal photosynthesis.
4.2. Molecular Formula Components and Their Relation to Microbial Processes
In contrast to fluorescence indices and bulk DOC concentration, results of single FT-ICR MS derived molecular formulas showed significant and specific pattern of DOM changes along the river transect. Many CHO and CHNO formulas with high H/C and low O/C ratios increased along the river stretch and with increasing chlorophyll concentration. A relative enrichment of aliphatic compounds by instream processes was detected also in other rivers [39,40] and may be attributed to microbial production of fresh DOM [32,41,42]. In contrast, we did not detect a substantial decline or removal of oxygen-rich, unsaturated compounds in our study, as observed in a smaller stream [23] and in other rivers [39,40]. This is in accordance with the observation from HIX values. The HIX is positively related to the abundance of oxygen-rich and relatively unsaturated compounds [43]. Strongly decreasing intensities of such compounds would results in decreasing HIX values which was not the case in this study.
Obviously, terrestrial DOM was already processed in the lower part of the river Elbe confirming the conservative behavior of aromatic DOM [44]. Instead, we detected a decline of specific CHOS formula abundances. These compounds are potentially metabolites of surfactants as described by [45] for effluent organic matter and previously found in anthropogenically influenced surface waters [23,46]. For example, C6H4(CH2)nO5S and C8H6(CH2)mO5S series were also detected after the inflow of a waste-water treatment plant (WWTP) effluent to a small river, and decreased subsequently [23]. In the river Elbe, these components were evidently further degraded along the river stretch.
Our new approach enables to us disentangle the role of autotrophic and heterotrophic processes for DOM composition along a river. The absolute value of slopes was higher for bacteria (responsible for heterotrophic processes) than for Chl a (autotrophic processes) for nearly all significant related SPE-DOM formulas. Using slope differences, we conclude that predominantly bacterial activity (compared to algal production) was responsible for the observed increase of relatively aliphatic molecules. This indicates that evidently the major part of algae derived DOM was rapidly processed by bacteria. Observed increases in molecular formula intensities point to a pool of relatively stable microbial metabolites, which do not undergo fast mineralization and are transported to the coastal ocean, a mechanism that may play a role in long term stabilization of organic carbon in marine systems [42].
5. Conclusions
We detected a longitudinal change of DOM molecular composition in a large river concurrent with increasing chlorophyll concentration. While DOC concentration and DOM fluorescence did not vary considerably, aliphatic CHO and CHON compounds measured by FT-ICR MS increased while CHOS surfactants decreased in their abundances. Therefore our first hypothesis was partly confirmed. Chlorophyll concentration, bacterial abundance and bacterial production were correlated to specific SPE-DOM molecular formulas, confirming the second hypothesis. Our difference approach enabled the separation between few dominant autotrophically and a majority of dominant heterotrophically produced DOM compounds. Further experiments are needed to show the clear effect of photosynthetic production in approaches with and without light and the effect of bacterial degradation in approaches with and without high bacterial biomass. Nevertheless, our study indicates that longitudinal changes of DOM composition in rivers are due to microbial processes.
Supplementary Materials
The following are available online at https://www.mdpi.com/2073-4441/12/6/1577/s1, Figure S1: Slopes of regressions between intensities of solid phase extractable dissolved organic (SPE-DOM) molecular formulas and standardized river kilometer, Figure S2: Slopes of regressions between intensities of solid phase extractable dissolved organic (SPE-DOM) molecular formulas and standardized bacterial production, Figure S3: Differences of slopes between solid phase extractable dissolved organic (SPE-DOM) molecular formulas versus chlorophyll a concentration (Figure 2) minus those versus bacterial production (Figure S2).
Author Contributions
Conceptualization, N.K.; methodology, N.K., O.J.L., and P.H.; software, O.J.L.; validation, N.K., O.J.L., and P.H.; writing—original draft preparation, N.K.; writing—review and editing, N.K., O.J.L. and P.H.; visualization, N.K. and P.H. All authors have read and agreed to the published version of the manuscript.
Funding
This research was supported by funding from the Helmholtz Association in the framework of Modular Observation Solutions for Earth Systems (MOSES).
Acknowledgments
We thank the captain and crew of RV Albis, S. Bauth, H. Goreczka, U. Link, and J. Zill as well as H.-J. Dahlke and F. Zander for support in the field. A. Hoff, K. Lerche, I. Locker, I. Siebert, M. Tibke, and W. von Tümpling contributed to the subsequent analyses in the laboratory. We further thank J. Kaesler for FT-ICR MS measurements, K. Franze for software development and M. Wu for statistical support. The authors are grateful for using the analytical facilities of the Centre for Chemical Microscopy (ProVIS) at the Helmholtz Centre for Environmental Research, Leipzig which is supported by the European Regional Development Funds (EFRE-Europe funds Saxony) and the Helmholtz Association.
Conflicts of Interest
The authors declare no conflict of interest. The funders had no role in the design of the study; in the collection, analyses, or interpretation of data; in the writing of the manuscript, or in the decision to publish the results.
References
- Aufdenkampe, A.K.; Mayorga, E.; Raymond, P.A.; Melack, J.M.; Doney, S.C.; Alin, S.R.; Aalto, R.E.; Yoo, K. Riverine coupling of biogeochemical cycles between land, oceans, and atmosphere. Front. Ecol. Environ. 2011, 9, 53–60. [Google Scholar] [CrossRef] [Green Version]
- Del Giorgio, P.A.; Pace, M.L. Relative independence of dissolved organic carbon transport and processing in a large temperate river: The Hudson River as both pipe and reactor. Limnol. Oceanogr. 2008, 53, 185–197. [Google Scholar] [CrossRef]
- Wollheim, W.M.; Stewart, R.J.; Aiken, G.R.; Butler, K.D.; Morse, N.B.; Salisbury, J. Removal of terrestrial DOC in aquatic ecosystems of a temperate river network. Geophys. Res. Lett. 2015, 42, 6671–6679. [Google Scholar] [CrossRef] [Green Version]
- Jaffe, R.; Yamashita, Y.; Maie, N.; Cooper, W.T.; Dittmar, T.; Dodds, W.K.; Jones, J.B.; Myoshi, T.; Ortiz-Zayas, J.R.; Podgorski, D.C.; et al. Dissolved organic matter in headwater streams: Compositional variability across climatic regions of North America. Geochim. Cosmochim. Acta 2012, 94, 95–108. [Google Scholar] [CrossRef]
- Parr, T.B.; Cronan, C.S.; Ohno, T.; Findlay, S.E.G.; Smith, S.M.C.; Simon, K.S. Urbanization changes the composition and bioavailability of dissolved organic matter in headwater streams. Limnol. Oceanogr. 2015, 60, 885–900. [Google Scholar] [CrossRef] [Green Version]
- Hosen, J.D.; McDonough, O.T.; Febria, C.M.; Palmer, M.A. Dissolved organic matter quality and bioavailability changes across an urbanization gradient in headwater streams. Environ. Sci. Technol. 2014, 48, 7817–7824. [Google Scholar] [CrossRef]
- Berggren, M.; Del Giorgio, P.A. Distinct patterns of microbial metabolism associated to riverine dissolved organic carbon of different source and quality. J. Geophys. Res. Biogeosci. 2015, 120, 989–999. [Google Scholar] [CrossRef] [Green Version]
- Cole, J.J.; Prairie, Y.T.; Caraco, N.F.; McDowell, W.H.; Tranvik, L.; Striegl, R.G.; Duarte, C.M.; Kortelainen, P.; Downing, J.A.; Middelburg, J.J.; et al. Plumbing the global carbon cycle: Integrating inland waters into the terrestrial carbon budget. Ecosystems 2007, 10, 171–184. [Google Scholar] [CrossRef] [Green Version]
- Battin, T.J.; Kaplan, L.A.; Findlay, S.; Hopkinson, C.S.; Marti, E.; Packman, A.I.; Newbold, J.D.; Sabater, F. Biophysical controls on organic carbon fluxes in fluvial networks. Nat. Geosci. 2008, 1, 95–100. [Google Scholar] [CrossRef]
- Hale, R.L.; Godsey, S.E. Dynamic stream intermittence explains emergent dissolved organic carbon chemostasis in headwaters. Hydrol. Process. 2019. [Google Scholar] [CrossRef]
- Lynch, L.M.; Sutfin, N.A.; Fegel, S.T.; Boot, C.M.; Covino, T.P.; Wallenstein, M.D. River channel connectivity shifts metabolite composition and dissolved organic matter chemistry. Nat. Comm. 2019, 10, 1–11. [Google Scholar] [CrossRef] [PubMed]
- Raymond, P.A.; Saiers, J.E.; Sobczak, W.V. Hydrological and biogeochemical controls on watershed dissolved organic matter transport: Pulse-shunt concept. Ecology 2016, 97, 5–16. [Google Scholar] [CrossRef] [PubMed]
- Cory, R.M.; Kaplan, L.A. Biological lability of streamwater fluorescent dissolved organic matter. Limnol. Oceanogr. 2012, 57, 57–1347. [Google Scholar] [CrossRef]
- Fellman, J.B.; Hood, E.; Spencer, R.G.M. Fluorescence spectroscopy opens new windows into dissolved organic matter dynamics in freshwater ecosystems: A review. Limnol. Oceanogr. 2010, 55, 2452–2462. [Google Scholar] [CrossRef]
- Zsolnay, A. Dissolved organic matter: Artefacts, definitions, and functions. Geoderma 2003, 113, 187–209. [Google Scholar] [CrossRef]
- Hertkorn, N.; Frommberger, M.; Witt, M.; Koch, B.P.; Schmitt-Kopplin, P.; Perdue, E.M. Natural organic matter and the event horizon of mass spectrometry. Anal. Chem. 2008, 80, 8908–8919. [Google Scholar] [CrossRef]
- Kim, S.; Kaplan, L.A.; Hatcher, P.G. Biodegradable dissolved organic matter in a temperate and a tropical stream determined from ultra-high resolution mass spectrometry. Limnol. Oceanogr. 2006, 51, 1054–1063. [Google Scholar] [CrossRef] [Green Version]
- Stubbins, A.; Spencer, R.G.M.; Chen, H.; Hatcher, P.G.; Mopper, K.; Hernes, P.J.; Mwamba, V.L.; Mangangu, A.M.; Wabakanghanzi, J.N.; Six, J. Illuminated darkness: Molecular signatures of Congo River dissolved organic matter and its photochemical alteration as revealed by ultrahigh precision mass spectrometry. Limnol. Oceanogr. 2010, 55, 1467–1477. [Google Scholar] [CrossRef]
- Sleighter, R.L.; Cory, R.M.; Kaplan, L.A.; Abdulla, H.A.N.; Hatcher, P.G. A coupled geochemical and biogeochemical approach to characterize the bioreactivity of dissolved organic matter from a headwater stream. J. Geophys. Res. Biogeosci. 2014, 119, 1520–1537. [Google Scholar] [CrossRef] [Green Version]
- Wagner, S.; Riedel, T.; Niggemann, J.; Vähätalo, A.V.; Dittmar, T.; Jaffe, R. Linking molecular signature of heteroatomic dissolved organic matter to watershed characteristics in world rivers. Environ. Sci. Technol. 2015, 49, 13798–13806. [Google Scholar] [CrossRef]
- Riedel, T.; Zark, M.; Vähätalo, A.V.; Niggemann, J.; Spencer, R.G.M.; Hernes, P.J.; Dittmar, T. Molecular signatures of biogeochemical transformationsin dissolved organic matter from ten world rivers. Front. Earth Sci. 2016, 4, 85. [Google Scholar] [CrossRef] [Green Version]
- Mosher, J.J.; Kaplan, L.A.; Podgorski, D.C.; McKenna, A.M.; Marshall, A.G. Longitudinal shifts in dissolved organic matter chemogeography and chemodiversity within headwater streams: A river continuum reprise. Biogeochemistry 2015, 124, 371–385. [Google Scholar] [CrossRef]
- Kamjunke, N.; Hertkorn, N.; Harir, M.; Schmitt-Kopplin, P.; Griebler, C.; Brauns, M.; von Tümpling, W.; Weitere, M.; Herzsprung, P. Molecular change of dissolved organic matter and patterns of bacterial activity in a stream along a land-use gradient. Water Res. 2019, 164, 114919. [Google Scholar] [CrossRef] [PubMed]
- Kamjunke, N.; Herzsprung, P.; Neu, T.R. Quality of dissolved organic matter affects planktonic but not biofilm bacterial production in streams. Sci. Total Environ. 2015, 506, 353–360. [Google Scholar] [CrossRef] [PubMed]
- Simon, M.; Azam, F. Protein content and protein synthesis rates of planktonic bacteria. Mar. Ecol. Prog. Ser. 1989, 51, 201–213. [Google Scholar] [CrossRef]
- Kothawala, D.N.; Murphy, K.R.; Stedmon, C.; Weyhenmeyer, G.A.; Tranvik, L.J. Inner filter correction of dissolved organic matter fluorescence. Limnol. Oceanogr. Meth. 2013, 11, 616–630. [Google Scholar] [CrossRef]
- Cory, R.M.; McKnight, D.M. Fluorescence spectroscopy reveals ubiquitous presence of oxidized and reduced quinones in dissolved organic matter. Environ. Sci. Technol. 2005, 39, 8142–8149. [Google Scholar] [CrossRef]
- Dittmar, T.; Koch, B.; Hertkorn, N.; Kattner, G. A simple and efficient method for the solid-phase extraction of dissolved organic matter (SPE-DOM) from seawater. Limnol. Oceanogr. Meth. 2008, 6, 230–235. [Google Scholar] [CrossRef]
- Raeke, J.; Lechtenfeld, O.J.; Wagner, M.; Herzsprung, P.; Reemtsma, T. Selectivity of solid phase extraction of freshwater dissolved organic matter and its effect on ultrahigh resolution mass spectra. Environ. Sci. Process. Impacts 2016, 18, 918–927. [Google Scholar] [CrossRef]
- Lechtenfeld, O.J.; Kattner, G.; Flerus, R.; McCallister, S.L.; Schmitt-Kopplin, P.; Koch, B.P. Molecular transformation and degradation of refractory dissolved organic matter in the Atlantic and Southern Ocean. Geochim. Cosmochim. Acta 2014, 126, 321–337. [Google Scholar] [CrossRef] [Green Version]
- Herzsprung, P.; Hertkorn, N.; von Tümpling, W.; Harir, M.; Friese, K.; Schmitt-Kopplin, P. Molecular formula assignment for dissolved organic matter (DOM) using high-field FT-ICR-MS: Chemical perspective and validation of sulphur-rich organic components (CHOS) in pit lake samples. Anal. Bioanal. Chem. 2016, 408, 2461–2469. [Google Scholar] [CrossRef] [PubMed]
- Koch, B.P.; Kattner, G.; Passow, U. Molecular insights into the microbial formation of marine dissolved organic matter: Recalcitrant or labile? Biogeosciences 2014, 11, 4173–4190. [Google Scholar] [CrossRef] [Green Version]
- Osterholz, H.; Kirchman, D.L.; Niggemann, J.; Dittmar, T. Environmental drivers of dissolved organic matter molecular composition in the Delaware Estuary. Front. Earth Sci. 2016, 4, 95. [Google Scholar] [CrossRef] [Green Version]
- Kamjunke, N.; von Tümpling, W.; Hertkorn, N.; Harir, M.; Schmitt-Kopplin, P.; Norf, H.; Weitere, M.; Herzsprung, P. A new approach for evaluating transformations of dissolved organic matter (DOM) via high-resolution mass spectrometry and relating it to bacterial activity. Water Res. 2017, 123, 513–523. [Google Scholar] [CrossRef] [PubMed]
- Hardenbicker, P.; Weitere, M.; Ritz, S.; Schöll, F.; Fischer, H. Longitudinal plankton dynamics in the rivers Rhine and Elbe. River Res. Appl. 2016, 32, 1264–1278. [Google Scholar] [CrossRef]
- Bowes, M.J.; Gozzard, E.; Johnson, A.C.; Scarlett, P.M.; Roberts, C.; Read, D.S.; Armstrong, L.K.; Harman, S.A.; Wickham, H.D. Spatial and temporal changes in chlorophyll—A concentration in the River Thames basin, UK: Are phosphorus concentrations beginning to limit phytoplankton biomass? Sci. Total Environ. 2012, 426, 45–55. [Google Scholar] [CrossRef] [Green Version]
- Begum, M.S.; Jin, H.; Jang, I.; Lee, J.-M.; Oh, H.B.; Park, J.-H. Optical und molecular-level characterization of fluvial organic matter biodegradation in a highly urbanized river system. Biogeosci. Disc. 2017. [Google Scholar] [CrossRef] [Green Version]
- Begum, M.S.; Jang, I.; Lee, J.-M.; Oh, H.B.; Jin, H.; Park, J.-H. Synergistic effects of urban tributary mixing and dissolved organic matter biodegradation in an impounded river system. Sci. Total Environ. 2019, 676, 105–119. [Google Scholar] [CrossRef]
- Creed, I.F.; McKnight, D.M.; Pellerin, B.A.; Green, M.B.; Bergamaschi, B.A.; Aiken, G.R.; Burns, D.A.; Findlay, S.E.G.; Shanley, J.B.; Striegl, R.G.; et al. The river as a chemostat: Fresh perspectives on dissolved organic matter flowing down the river continuum. Can. J. Fish. Aquat. Sci. 2015, 72, 1272–1285. [Google Scholar] [CrossRef] [Green Version]
- Ward, N.D.; Bianchi, T.S.; Medeiros, P.M.; Seidel, M.; Richey, J.E.; Keil, R.; Sawakuchi, H.O. Where carbon goes when water flows: Carbon cycling across the aquatic continuum. Front. Mar. Sci. 2017, 4, 7. [Google Scholar] [CrossRef] [Green Version]
- Kujawinski, E.B.; Del Vecchio, R.; Blough, N.V.; Klein, G.C.; Marshall, A.G. Probing molecular-level transformations of dissolved organic matter: Insights on photochemical degradation and protozoan modification of DOM from electrospray ionization Fourier transform ion cyclotron resonance mass spectrometry. Mar. Chem. 2004, 92, 23–37. [Google Scholar] [CrossRef]
- Lechtenfeld, O.J.; Hertkorn, N.; Shen, Y.; Witt, M.; Benner, R. Marine sequestration of carbon in bacterial metabolites. Nat. Commun. 2015, 6, 1–8. [Google Scholar] [CrossRef] [PubMed] [Green Version]
- Herzsprung, P.; Osterloh, K.; von Tümpling, W.; Harir, M.; Hertkorn, N.; Schmitt-Kopplin, P.; Meissner, R.; Bernsdorf, S.; Friese, K. Differences in DOM of rewetted and natural peatlands—results from high-field FT-ICR-MS and bulk optical parameters. Sci. Total Environ. 2017, 586, 770–781. [Google Scholar] [CrossRef] [PubMed]
- Simon, C.; Osterholz, H.; Koschinsky, A.; Dittmar, T. Riverine mixing at the molecular scale—An ultrahigh-resolution mass spectrometry study on dissolved organic matter and selected metals in the Amazon confluence zone (Manaus, Brazil). Org. Geochem. 2019, 129, 45–62. [Google Scholar] [CrossRef] [Green Version]
- Gonsior, M.; Zwartjes, M.; Cooper, W.J.; Song, W.; Ishida, K.P.; Tseng, L.Y.; Jeung, M.K.; Rosso, D.; Hertkorn, N.; Schmitt-Kopplin, P. Molecular characterization of effluent organic matter identified by ultrahigh resolution mass spectrometry. Water Res. 2011, 45, 2943–2953. [Google Scholar] [CrossRef]
- Lechtenfeld, O.J.; Koch, B.P.; Gasparovic, B.; Frka, S.; Witt, M.; Kattner, G. The influence of salinity on the molecular and optical properties of surface microlayers in a karstic estuary. Mar. Chem. 2013, 150, 25–38. [Google Scholar] [CrossRef]
Figure 1.
Lateral averages of averages of chlorophyll a, bacterial abundance bacterial production, concentration of dissolved organic carbon (DOC), fluorescence index (FI), freshness index (β/α),humification index (HIX), and two examples for molecular formulas with decreasing and increasing relative intensities along the river Elbe between river kilometers 318–585.

Figure 2.
Slopes of regressions between intensities of solid phase extractable dissolved organic matter (SPE-DOM) molecular formulas and standardized chlorophyll a concentration for CHO (a); CHNO (b); and CHOS components (c). See also the data base in the Supplementary Materials.
Figure 2.
Slopes of regressions between intensities of solid phase extractable dissolved organic matter (SPE-DOM) molecular formulas and standardized chlorophyll a concentration for CHO (a); CHNO (b); and CHOS components (c). See also the data base in the Supplementary Materials.

Figure 3.
Slopes of regressions between intensities of solid phase extractable dissolved organic matter (SPE-DOM) molecular formulas and standardized bacterial abundance for CHO (a); CHNO (b); and CHOS components (c). See also the data base in the Supplementary Materials.
Figure 3.
Slopes of regressions between intensities of solid phase extractable dissolved organic matter (SPE-DOM) molecular formulas and standardized bacterial abundance for CHO (a); CHNO (b); and CHOS components (c). See also the data base in the Supplementary Materials.


© 2020 by the authors. Licensee MDPI, Basel, Switzerland. This article is an open access article distributed under the terms and conditions of the Creative Commons Attribution (CC BY) license (http://creativecommons.org/licenses/by/4.0/).
Share and Cite
MDPI and ACS Style
Kamjunke, N.; Lechtenfeld, O.J.; Herzsprung, P. Quality of Dissolved Organic Matter Driven by Autotrophic and Heterotrophic Microbial Processes in a Large River. Water 2020, 12, 1577. https://doi.org/10.3390/w12061577
AMA Style
Kamjunke N, Lechtenfeld OJ, Herzsprung P. Quality of Dissolved Organic Matter Driven by Autotrophic and Heterotrophic Microbial Processes in a Large River. Water. 2020; 12(6):1577. https://doi.org/10.3390/w12061577
Chicago/Turabian StyleKamjunke, Norbert, Oliver J. Lechtenfeld, and Peter Herzsprung. 2020. "Quality of Dissolved Organic Matter Driven by Autotrophic and Heterotrophic Microbial Processes in a Large River" Water 12, no. 6: 1577. https://doi.org/10.3390/w12061577
Note that from the first issue of 2016, this journal uses article numbers instead of page numbers. See further details here.