Article

The Chemical State and Occupancy of Radiogenic Pb, and Crystallinity of RW-1 Monazite Revealed by XPS and TEM

1
Key Laboratory of Earth and Planetary Physics, Institute of Geology and Geophysics, Chinese Academy of Sciences, Beijing 100029, China
2
Electron Microscope Laboratory, Institute of Geology and Geophysics, Chinese Academy of Sciences, Beijing 100029, China
3
Innovation Academy for Earth Science, Chinese Academy of Sciences, Beijing 100029, China
4
State Key Laboratory of Lithospheric Evolution, Institute of Geology and Geophysics, Chinese Academy of Sciences, Beijing 100029, China
5
College of Earth and Planetary Sciences, University of Chinese Academy of Sciences, Beijing 100049, China
6
Analytical and Testing Center of Chongqing University, Chongqing University, Chongqing 401331, China
7
State Key Lab of ASIC and system, School of Microelectronics, Fudan University, Shanghai 200433, China
*
Author to whom correspondence should be addressed.
Minerals 2020, 10(6), 504; https://doi.org/10.3390/min10060504
Submission received: 30 April 2020 / Revised: 21 May 2020 / Accepted: 31 May 2020 / Published: 31 May 2020
(This article belongs to the Special Issue Crystallography and Mineralogy of Phosphates)

Abstract

:
Monazite ((Ce, La, Nd, Th)PO4) is one of the widely used minerals for U–Th–Pb dating in geochronology. To better understand the possible effects of radiogenic Pb on the in situ dating method, a natural monazite U–Th–Pb standard sample (RW-1) was chemically and structurally characterized down to atomic scales by using the combination of Raman spectrum (RM), X-ray photoelectron spectroscopy (XPS), and transmission electron microscopy (TEM). The experimental results revealed that radiogenic Pb exists as Pb2+ and substitutes for the Ce site in the monazite crystal lattice. Moreover, TEM imaging demonstrated that monazite is well crystalline revealed by an atomic structure in most areas except for a few tiny defects, which are likely attributed to alpha self-healing from an electronic energy loss of α particles. The characterization of the chemical state and occupancy of radiogenic Pb, and the distribution of Pb and Th in monazite at the nanoscale and atomic scale could provide insight for us to understand the mechanisms of the nanogeochronology.

Graphical Abstract

1. Introduction

Monazite ((Ce, La, Nd, Th)PO4), a light rare earth element (LREE)-phosphate mineral, is one of the widely used minerals for U–Th–Pb dating in geochronology [1,2,3]. It is also used as nuclear waste disposal material in material science due to the strong bonds between P and O and mineral structure [4,5,6]. Monazite does not easily become metamict despite its high Th–U contents and thus high radioactivity over time, and it often keeps an original U–(Th)–Pb system [7,8]. However, discordant U–(Th)–Pb ages determined from monazite, excluding those reversely discordant caused by excess 206Pb resulted from high Th content during crystallization [2], have also been reported [9,10,11,12]. Hence, the age quality determined from the in situ dating method is heavily dependent on the distribution and migration of radiogenic Pb in monazite [8,13].
It has been found that radiogenic Pb can occur as a nanometer-sized domain (approximately 50 nm) and lead to the inconsistent chemical ages in monazite [14]. Recent studies by atom probe microscopy (APM) have demonstrated that radiogenic Pb could be coupled with nanoclusters (approximately 10 nm) exsolved from monazite matrix and may have detrimental effects on radiometric dating [15,16]. This indicates that the effect of heterogeneous distribution of radiogenic Pb could not be negligible especially when in situ U–Th–Pb SIMS micro- and APM nanogeochronology in monazite is used [16]. Therefore, the study of structural and chemical features of radiogenic Pb in monazite down to the nanometer and atomic scale can provide important constrains on the interpretation of U–Th–Pb ages of geological samples. The proportion of common Pb could be an important issue for U–Th–Pb dating [17]; but fortunately, it is normally low in monazite [1,2,3].
Moreover, the oxidation state of radiogenic Pb is also closely related to the diffusion and distribution of Pb in the lattice of minerals. Kramers and co-workers proposed that tetravalent Pb (Pb4+) was maintained through geological time in the strongly oxidizing environment created by the radioactive decays in zircon, and its diffusivity is lower than divalent Pb (Pb2+) [18]. In contrast, X-ray absorption near edge spectrometry (XANES) results from Sri Lanka zircon grains with the highest radiation dose showed that the oxidation state of radiogenic Pb is divalent, while those from the zircon grains with lower radiation doses indicated that a part of Pb may be tetravalent [19]. Dubrail et al. examined the natural monazite (LaPO4) and zircon, and they showed that radiogenic Pb is in the Pb2+ oxidation state in all the samples they investigated [20]. Dubrail et al. and Podor et al. even thought that Pb does not occur in the tetravalent state in natural monazite [20,21]. For xenotime, some studies surmised that the divalent Pb ion (Pb2+) is confined by the space available in the heavy REE–O8 polyhedra and does not fit easily into the xenotime structure (such as YPO4 and ScPO4), but there is a lack of experimental evidence [22,23]. Obviously, the chemical state of radiogenic Pb in minerals presented a controversial argument in the current literature. In fact, monazite also experienced radiation damage and accumulated large amounts of alpha-dose, which is similar to zircon samples [20]. The different observation could be related to the crystal structure of minerals, but it is also probably related to the different geological conditions of mineral. This issue needs further investigation.
In this study, we systematically carried out mineralogical, structural, and chemical studies on a natural monazite-Ce ((Ce, Nd, Th, La)PO4) sample by using the combination of Raman microscopy (RM), X-ray photoelectron spectroscopy (XPS), and transmission electron microscopy (TEM). Based on a comprehensive analysis down to atomic scales, the crystallinity of monazite, the chemical state and occupancy of radiogenic Pb in monazite lattice were determined.

2. Materials and Methods

2.1. Sample Description

The studied monazite (–Ce), named RW-1, was a natural yellowish-brown crystal with a weight of approximately 44 g. This sample was collected from a pegmatite dike located in the Landsverk 1 quarry situated in the Evje-Iveland district, Norway [24,25]. Previous study showed that the RW-1 monazite is chemically homogeneous by X-Ray electron probe microanalyzer (EPMA), with the contents of P2O5 ~ 27.72 ± 0.23 wt %, Ce2O3 ~ 25.22 ± 0.21 wt %, Nd2O3 ~ 14.47 ± 0.15 wt %, and ThO2 up to 13.5 ± 0.28 wt % [25]. The lower concentration of elements contain La2O3 of 7.85 ± 0.16 wt %, Pr2O3 of 3.84 ± 0.10 wt %, Sm2O3 of 3.29 ± 0.24 wt %, Y2O3 of 2.44 ± 0.08 wt %, SiO2 of 1.64 ± 0.07 wt %, CaO of 0.70 ± 0.03 wt % and UO2 of 0.30 ± 0.04 wt % (1 SD) and Gd2O3 of 1.65 ± 0.3 wt % (2 SD) [25,26]. The Pb concentration measured using secondary ion mass spectrometry (SIMS) is up to 5000 ppm, while the proportion of common Pb in total Pb is very low (f206 approximately 0.2%, f208 approximately 0.03%) in this monazite [25]. The U–Th–Pb analyses were performed by the isotopic dilution–thermal ionization mass spectrometry (ID-TIMS) method for the RW-1 monazite and yielded a weighted mean 207Pb/235U age of 904.15 ± 0.26 Ma [25]. The SIMS data suggested that the age and composition are homogeneous at ranges of several tens of micrometers for individual fragments, and the monazite remained as a closed system within the spatial microns scale [25].

2.2. Analytical Methods

X-ray photoelectron spectroscopy (XPS) has been widely used as one of surface analysis methods to investigate the chemical states of elements within solid materials and orthophosphate minerals [27,28,29,30]. For XPS surface analysis, two monazite chips (with the length of 1000 µm and width of ~500–800 µm) were selected randomly in a large number of monazite fragments and polished by silica gel polishing fluid. The chemical state of radiogenic Pb was measured using a Thermo Scientific ESCALAB 250Xi XPS with spot size of 500 μm, which was equipped with a monochromatic Al Kα X-ray source and a multichannel detector at Beijing University of Technology. The collected XPS spectra were processed using the CasaXPS software (2.3.17, Casa Software Ltd., Teignmouth, UK). RM analysis was carried out on a confocal Raman microscope (WITec alpha 300 R, WITec GmbH, Ulm, Germany) with the laser wavelength of 488 nm.
For electron microscopy analysis, another two monazite chips were selected randomly from a mount with 24 fragments and coated with carbon with thickness of 8 nm after polishing. The cathodoluminescence (CL) images were performed on a FEI Nova NanoSEM 450 (FEI Inc., Hillsboro, OR, USA) at an accelerating voltage of 10 kV and working distance of 13.5 mm. Scanning electron microscopy- energy dispersive X-ray spectrometers (SEM-EDS) observations were performed on the FEI Nova NanoSEM 450 (FEI Inc.) at the accelerating voltage of approximately 20 kV with spot size of around 1 μm. For TEM analysis, the region of interest on the polished sample was selected to in situ cut with a Zeiss Auriga Compact, focused ion beam (FIB) system equipped with an Omniprobe AutoProbe 200 micromanipulator at the Institute of geology and geophysics, Chinese Academy of Sciences (IGGCAS). FIB experiments were carried out at 5–30 kV high voltage with beam currents from 2 nA to 50 pA to obtain FIB foils (two foils) with an approximate length of 10 μm, width of 3 μm, and thickness of 100 nm. Conventional TEM observations (bright-field (BF) imaging, selected area electron diffraction (SAED), and high-resolution transmission electron microscopy (HRTEM) imaging) were performed on a JEOL JEM-2100 TEM (JEOL Ltd., Tokyo, Japan) operated at 200 kV electron beam generated from a LaB6 gun at IGGCAS. This TEM was equipped with an Oxford X-MAX energy dispersive X-ray spectrometer (EDS, Oxford Instruments plc, Abingdon, UK) for chemical microanalysis. Atomic resolution TEM experiments were carried out on an FEI Titan Cubed Themis G2 300 Cs-TEM at Tianjin University of Technology and Peking University. This TEM is equipped with field emission gun (FEG) operated at 300 kV and integrated four Super-EDX detectors (FEI Inc.), which allows a structural imaging down to atomic scales and chemical analysis with high sensitivity at both scanning TEM (STEM) and high-angle annular dark field (HAADF) modes.

3. Results

3.1. XPS Results

The chemical state of radiogenic Pb was determined by XPS instrument (Thermo Scientific, Inc., Waltham, MA, USA) in two RW-1 monazite chips. Figure 1a shows the full XPS spectra (survey) of monazite and labeled with elements. The peak of Pb 4f was detected and roughly located in the range of 136–148 eV. The XPS spectrum of Pb 4f in this monazite was further intensively tested and shown in Figure 1b (yellow spectrogram). It was fitted with Gauss–Lorentz function after subtracting Tougaard background and calibrating with C 1s for C–C at 284.8 eV. The fitted red line shape (overlapped with green line, synthetic data envelope) represents Pb 4f7/2 peak, and the blue line shape corresponds to Pb 4f5/2 peak. Another fitted peak alongside Pb 4f5/2 is identified to be Gd 4d5/2 with the binding energy of 143.63 eV and is shown in magenta line. The exact position of binding energy for Pb 4f7/2, Pb 4f5/2 obtained were 138.16 eV and 143.02 eV for chip1, 138.0 eV, and 142.9 eV for chip2, respectively (listed in Table 1). Three binding energy data of Pb 4f in PbO, Pb3O4, and PbO2 in the literature, which were listed in Table 1, were used as reference for determining the oxidation state of radiogenic Pb in the monazite chips [31,32,33]. As shown in Table 1, the binding energy of the Pb 4f7/2 peak and Pb 4f5/2 peak in this monazite are in agreement with values reported in PbO, which are 138.0 eV and 142.9 eV, respectively [31]. Analysis of the Pb 4f XPS spectra reveals that the chemical state of radiogenic Pb exist as +2 in this monazite.

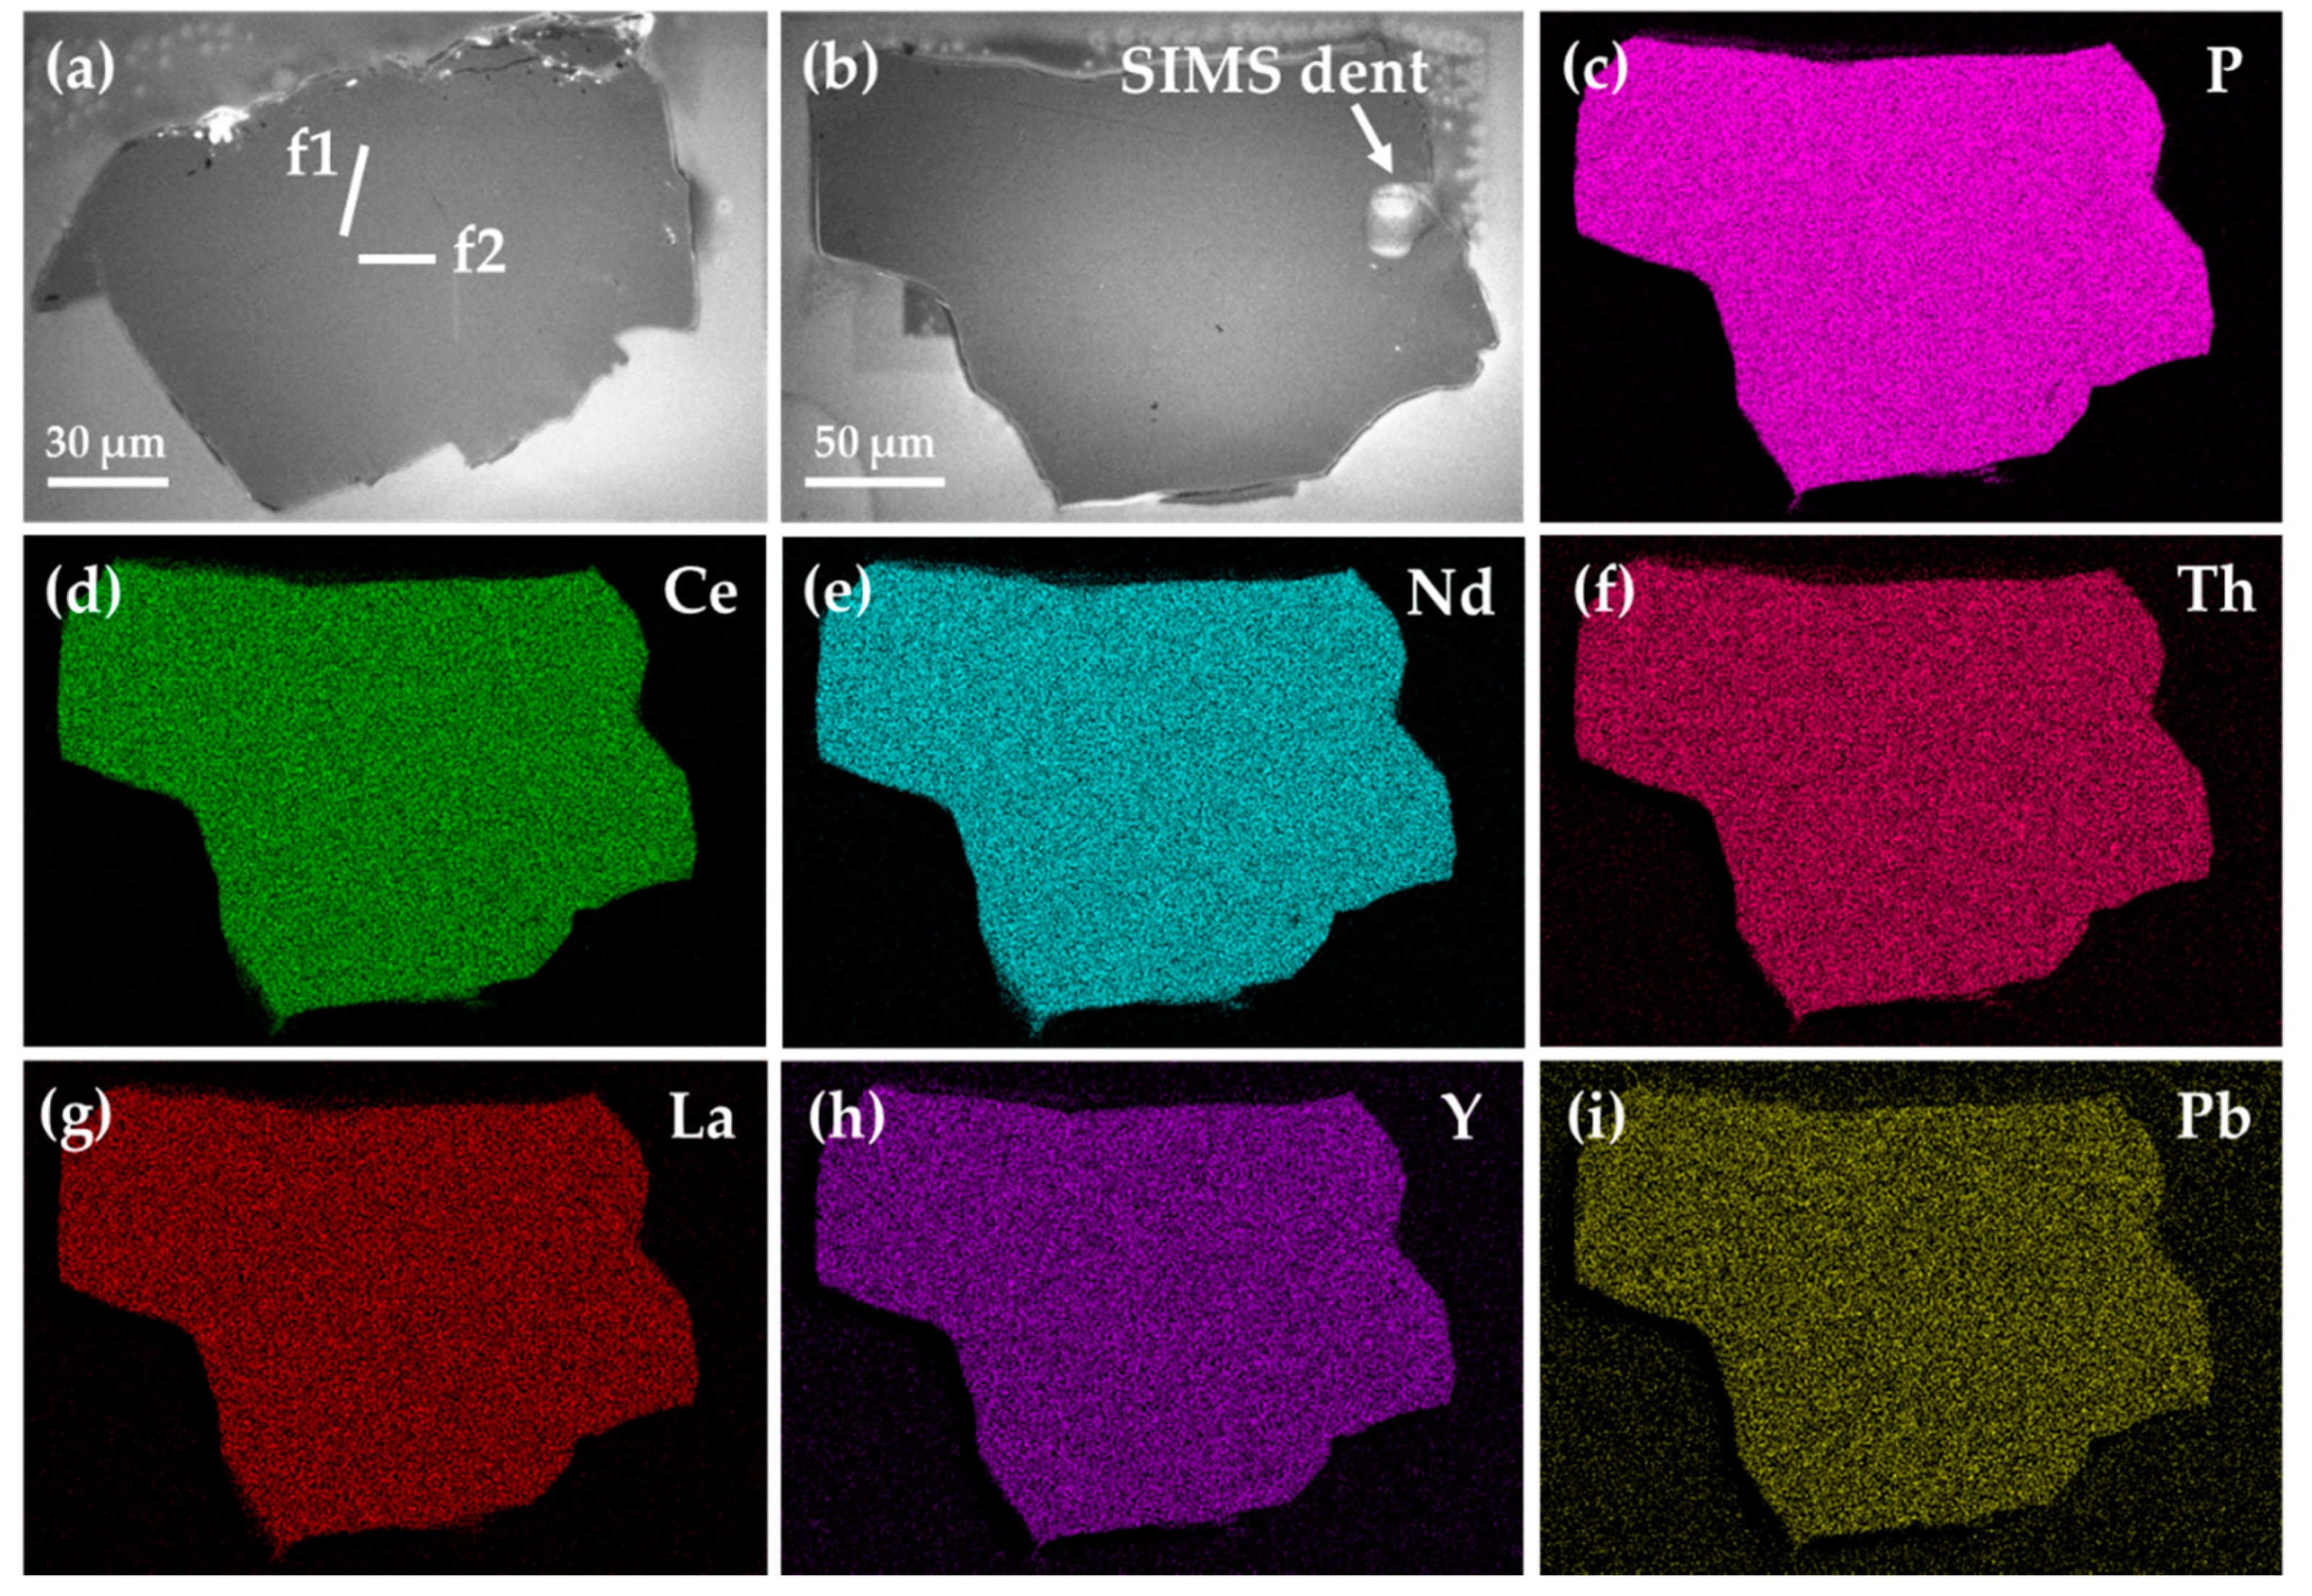
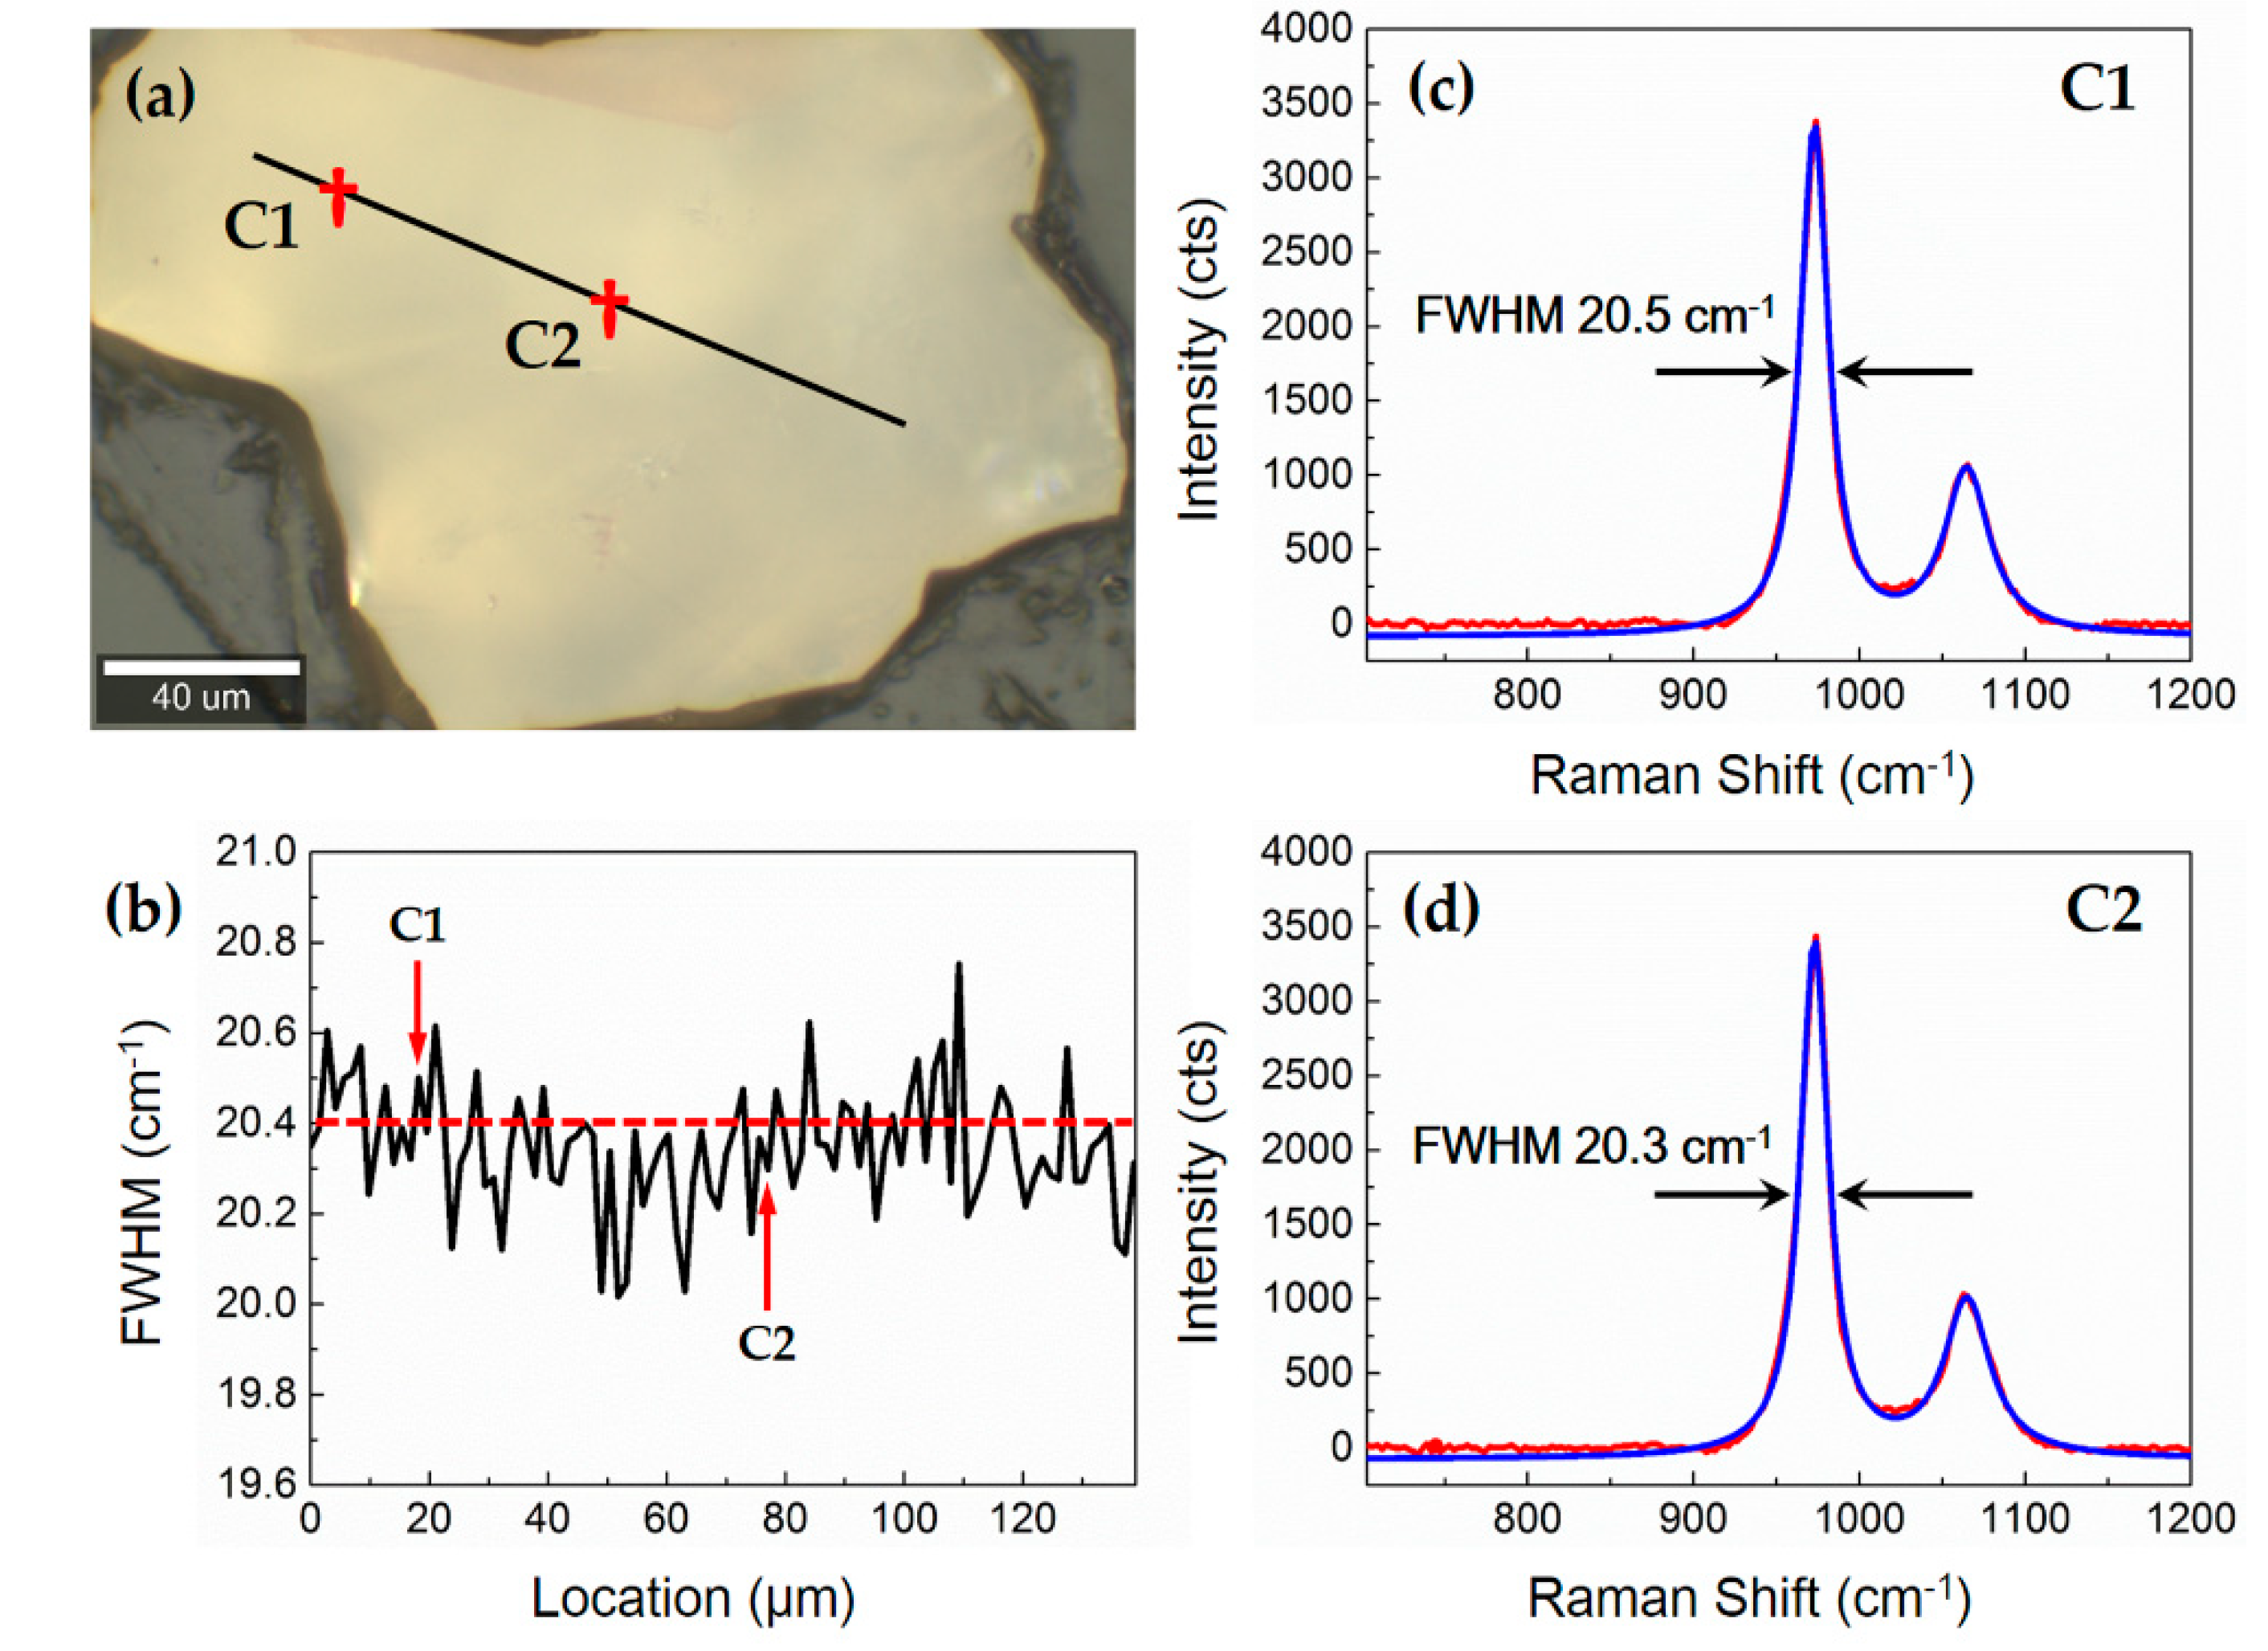
3.2. Chemical and Mineralogical Features of Monazite-Ce (SEM and RM)

The cathodoluminescence (CL) images show that dark–bright contrast is uniform and there is no oscillatory zoning observed in two monazite chips (Figure 2a,b). Since oscillatory zoning reflects the internal structural features of monazite and represents heterogeneous distribution of REEs and trace elements in monazite [34,35,36], the elements in the monazite that we studied are homogeneously distributed at the micrometer scale. The EDS maps (Figure 2c–h) of the monazite chip (Figure 2b) show a homogeneous distribution for major elements in this monazite at micrometer scale as well. This homogeneousness at the micrometer scale is also reflected in the homogeneous age of monazite from SIMS data [25].
One of monazite chips (corresponds to the monazite in Figure 2b) on the mount was chosen for RM analysis. Figure 3 shows the Raman spectra (red spectrogram) of the monazite chip acquired by line scanning along the black line, which was subtracted from a linear background. The Raman band was fitted with a Lorentz function in order to measure the full width at half-maximum (FWHM), as shown for the blue spectrogram in Figure 3c,d. The Raman spectrum shows distinct vibrational bands at 972 and 1063 cm−1, which are vested in the internal PO4 stretching vibrations. The FWHMs of the Raman band at different sites along the black line (Figure 3a) were around 20.4 cm−1 at 972 cm−1 and show a smaller variation (Figure 3b), indicating a homogeneous structure of the monazite we studied. The FWHM of the Raman band acquired in the C1 and C2 cross-site were approximately 20.5 and 20.3 cm−1 at 972 cm−1 in this monazite respectively (Figure 3c,d), close to the FWHM of 19.6–22.7 cm−1 in un-annealed natural monazite [37], but well above the average (approximately 7.2 cm−1) of those experienced experimentally annealed monazites without radiation damage reported [37,38].

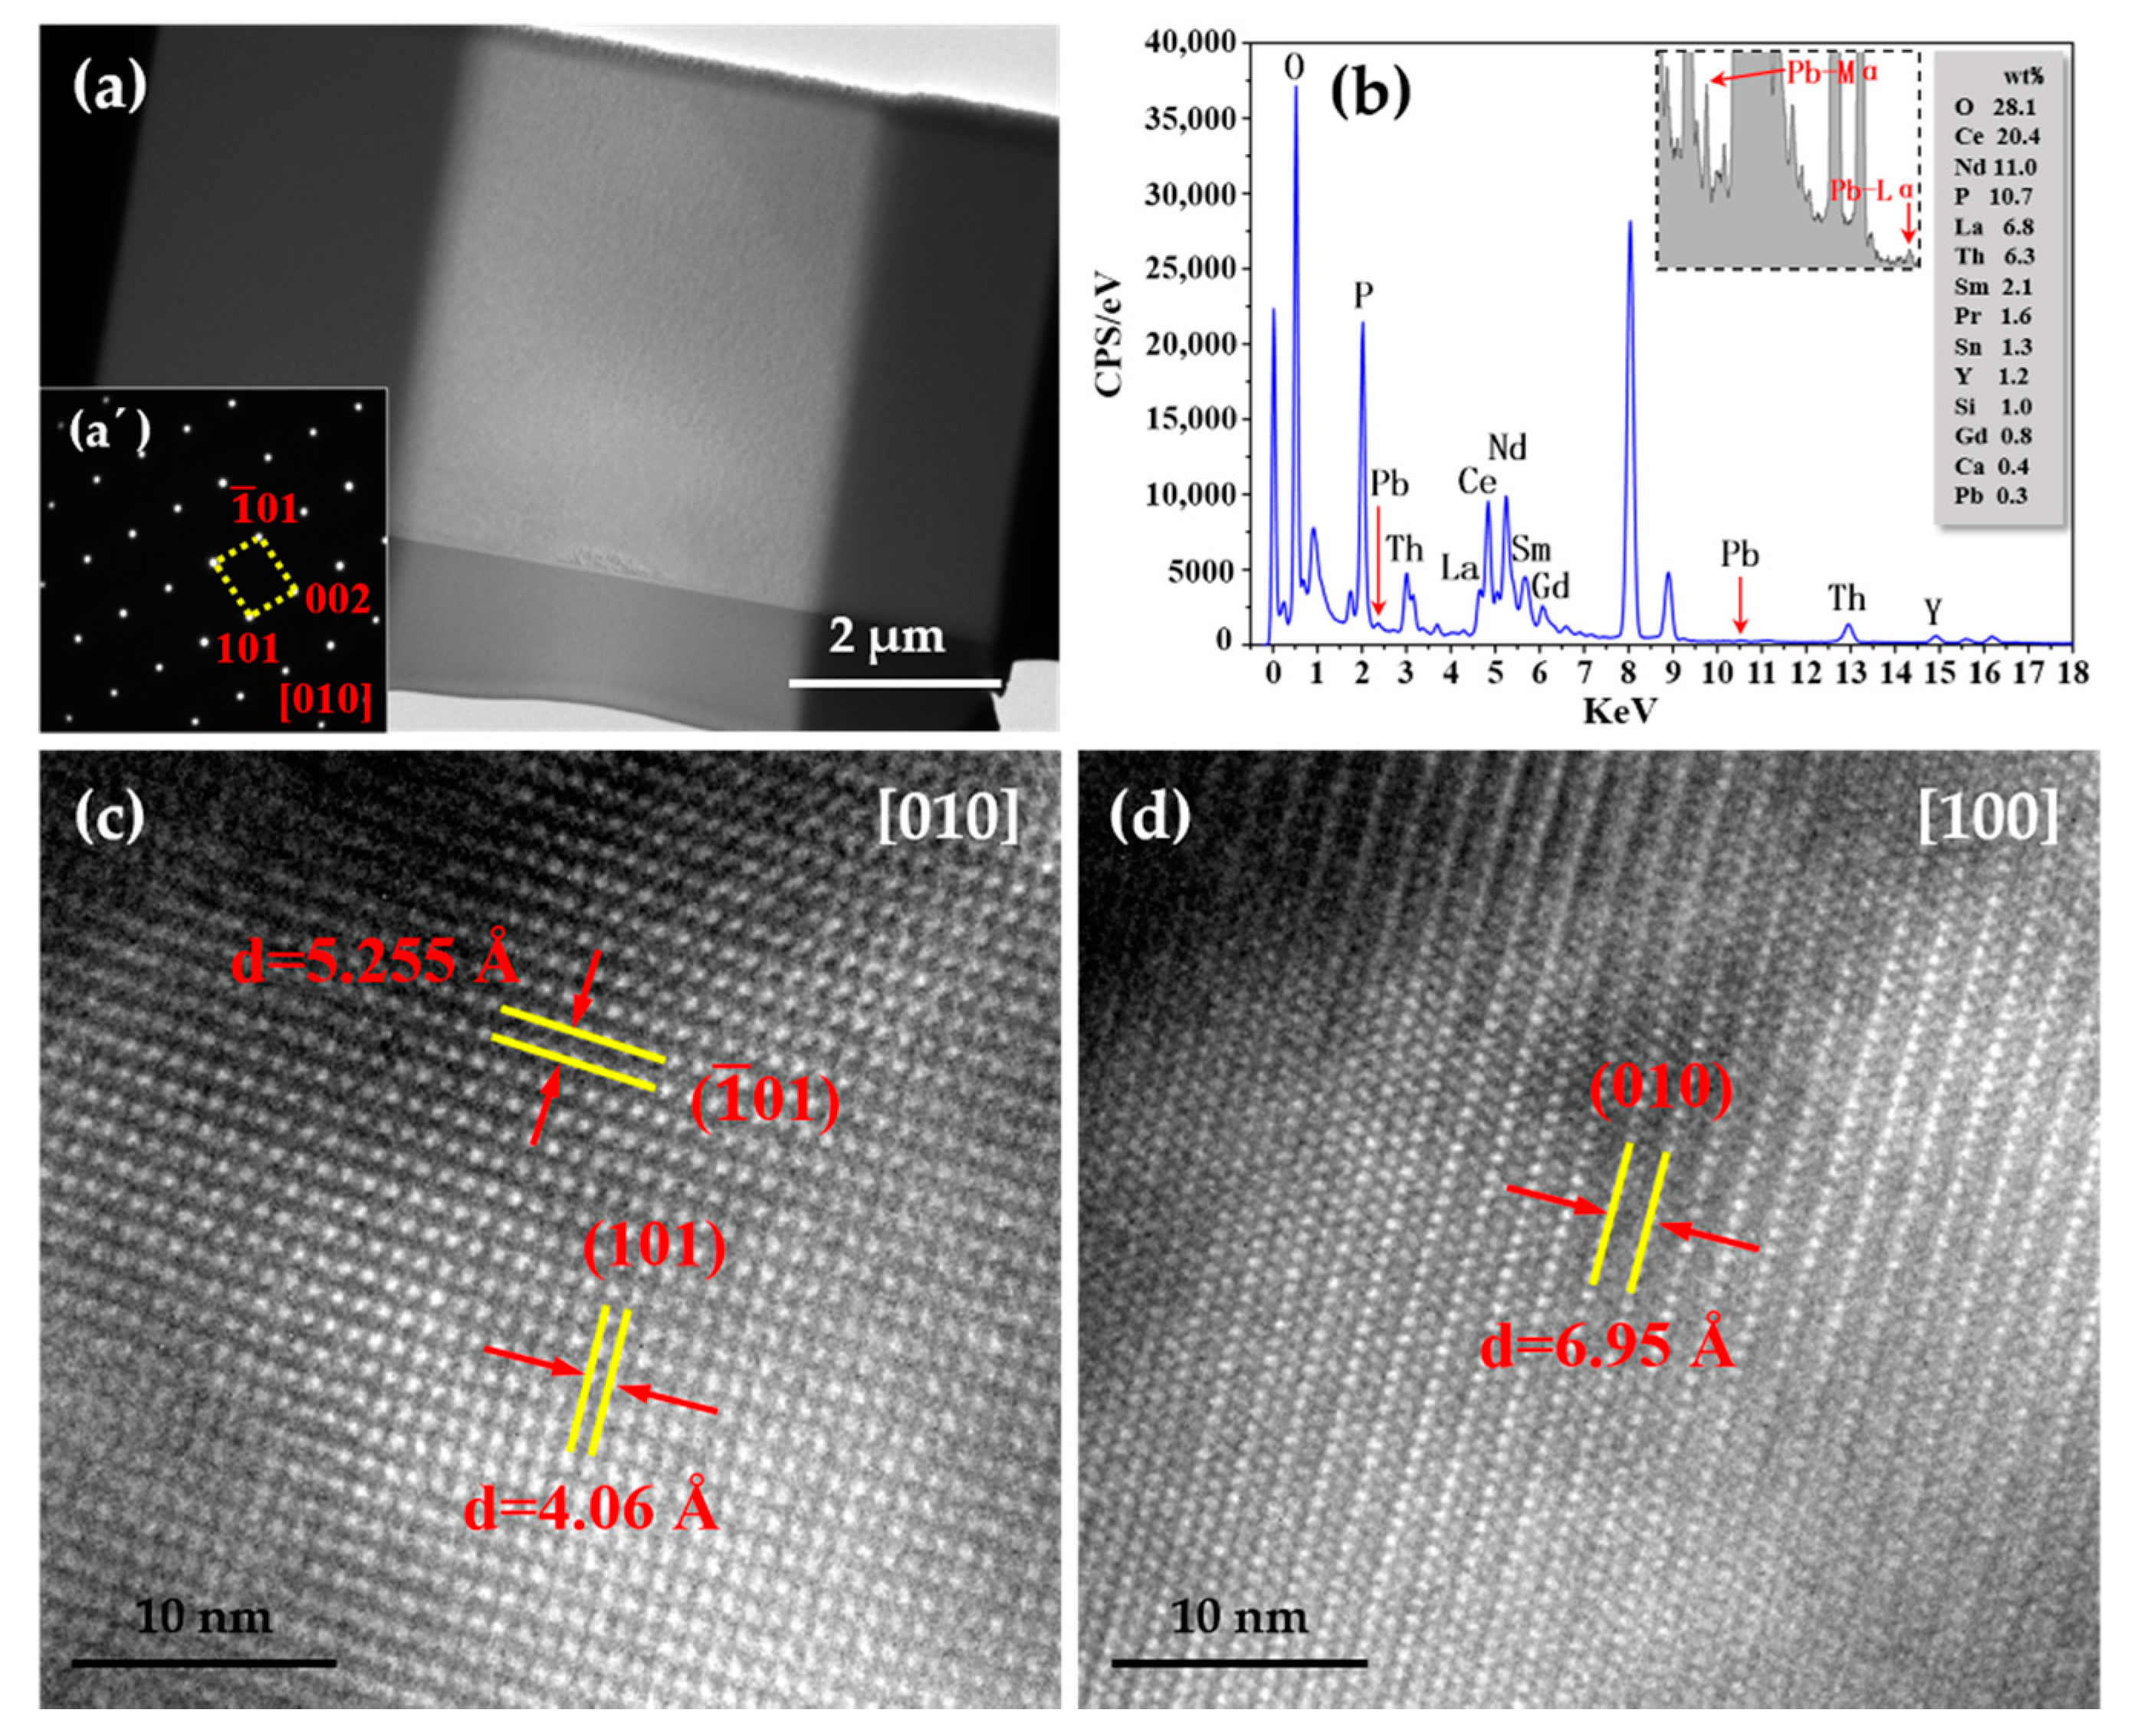
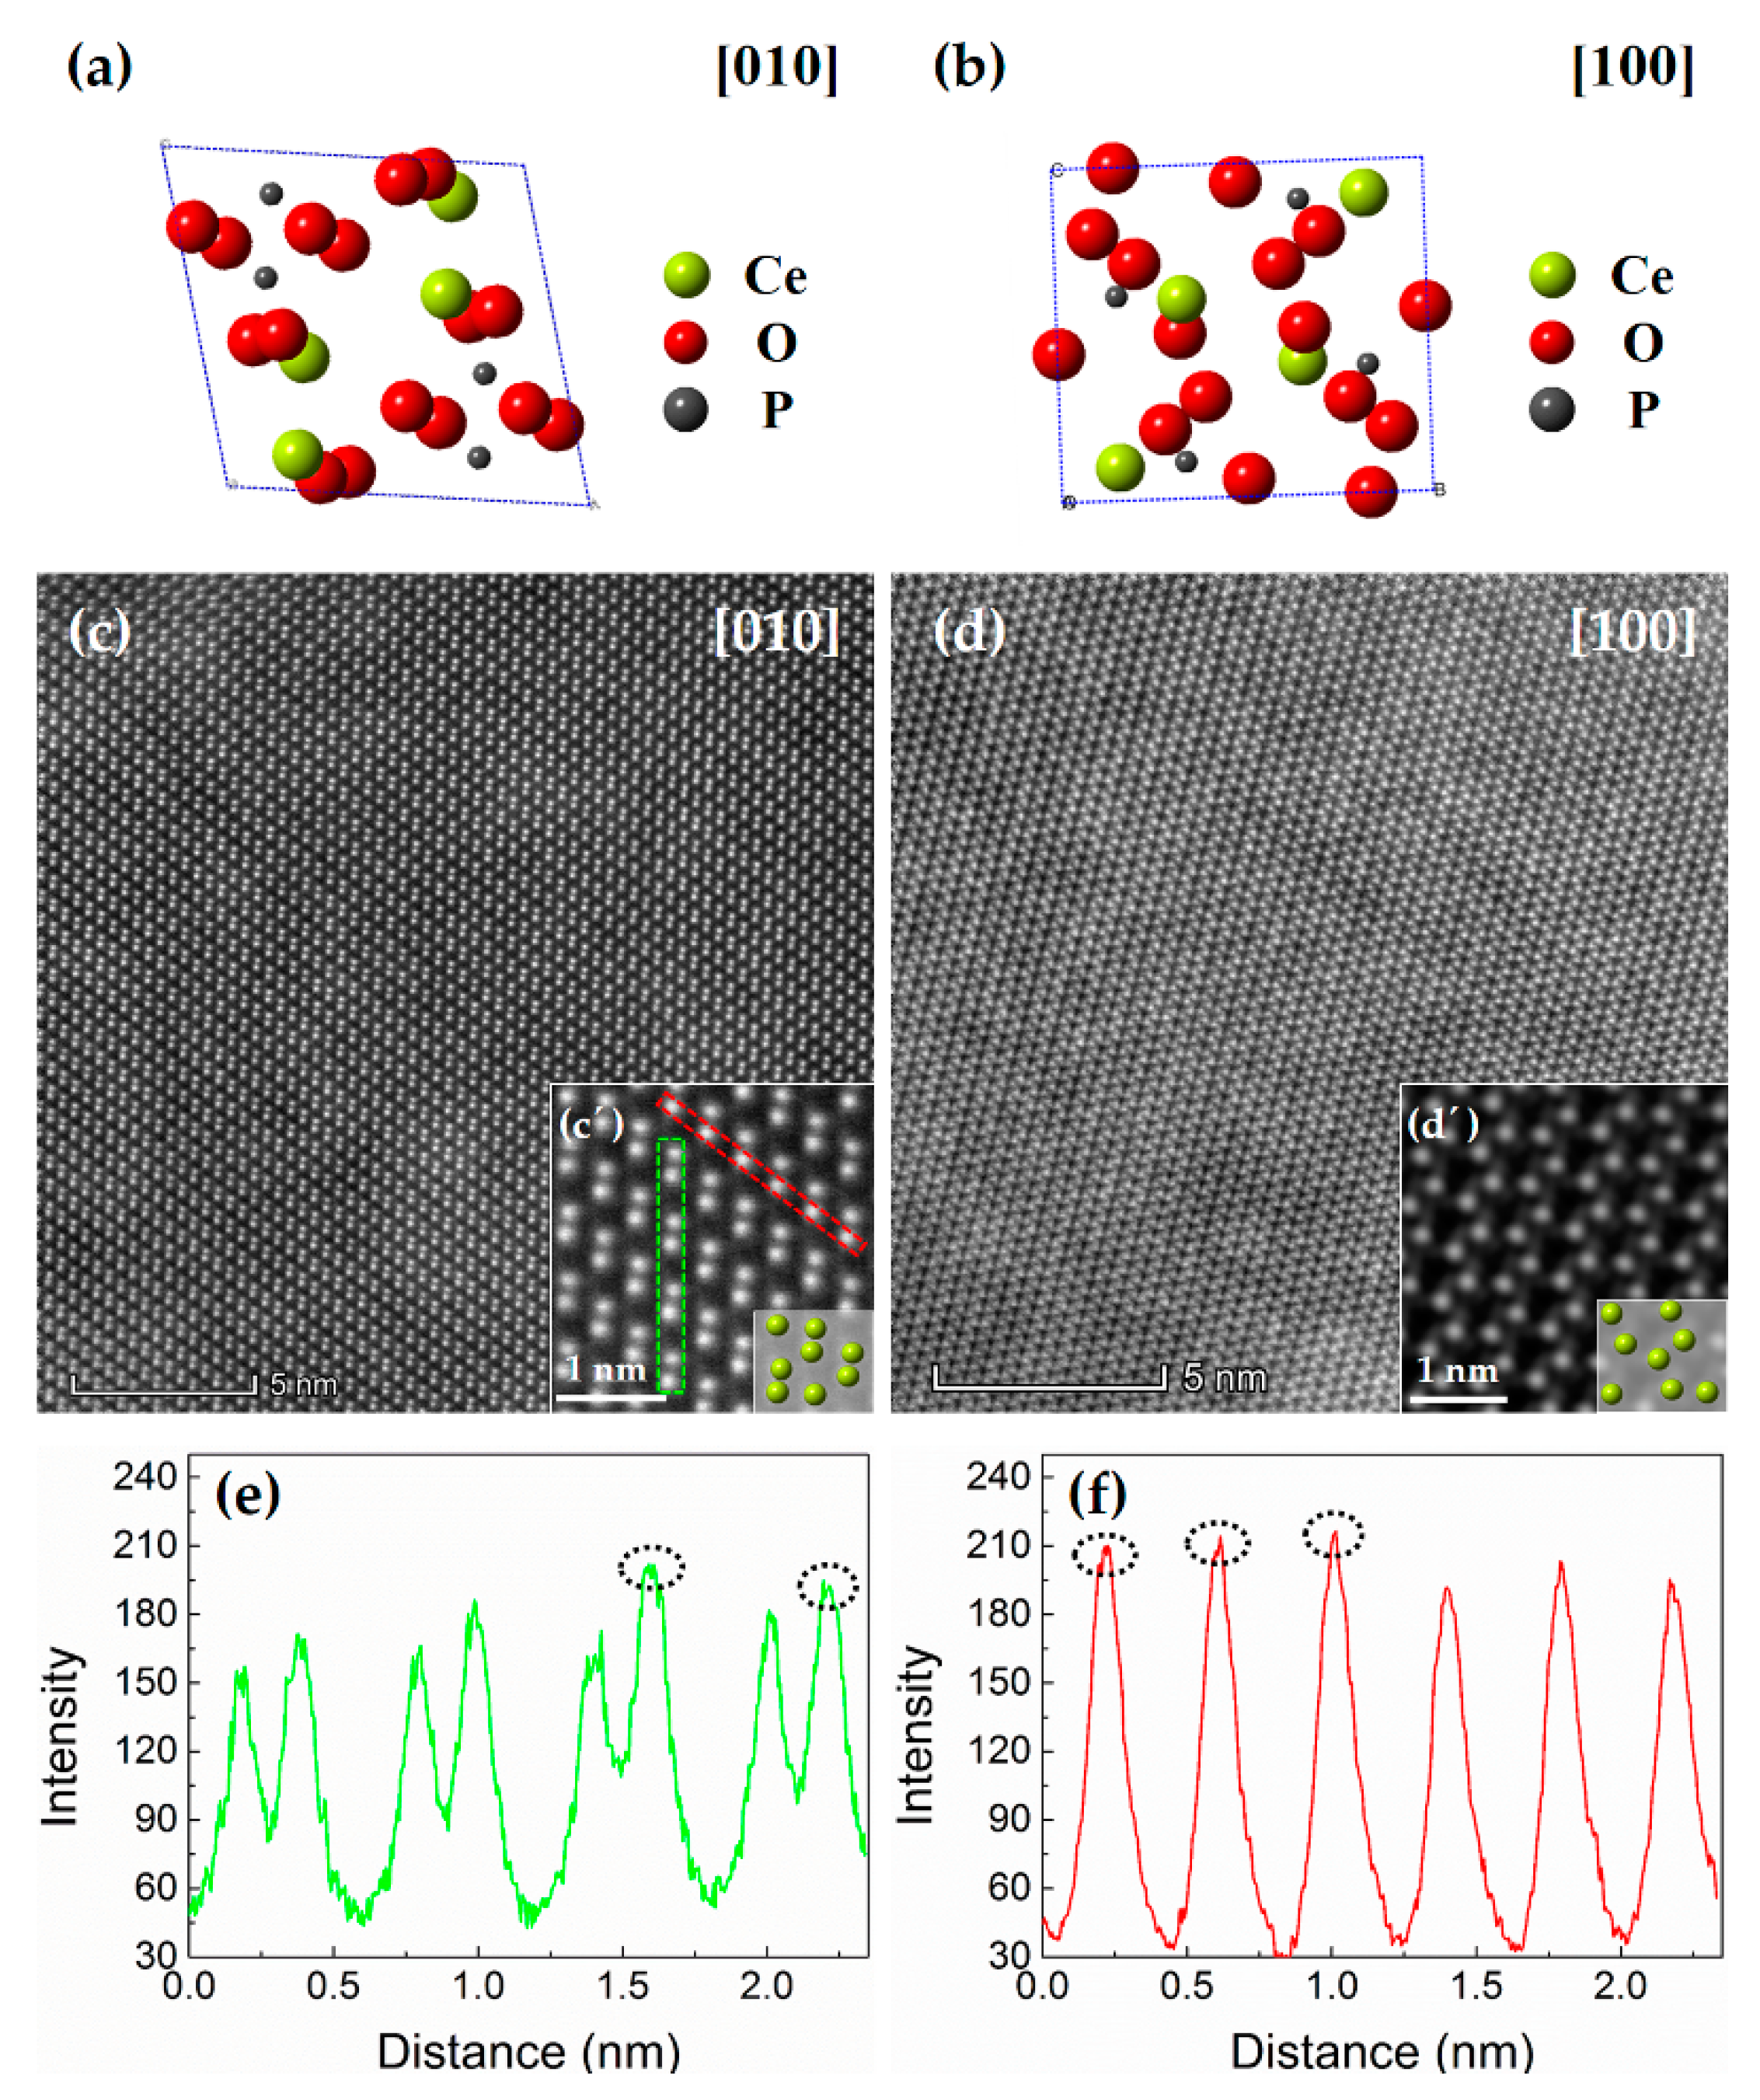
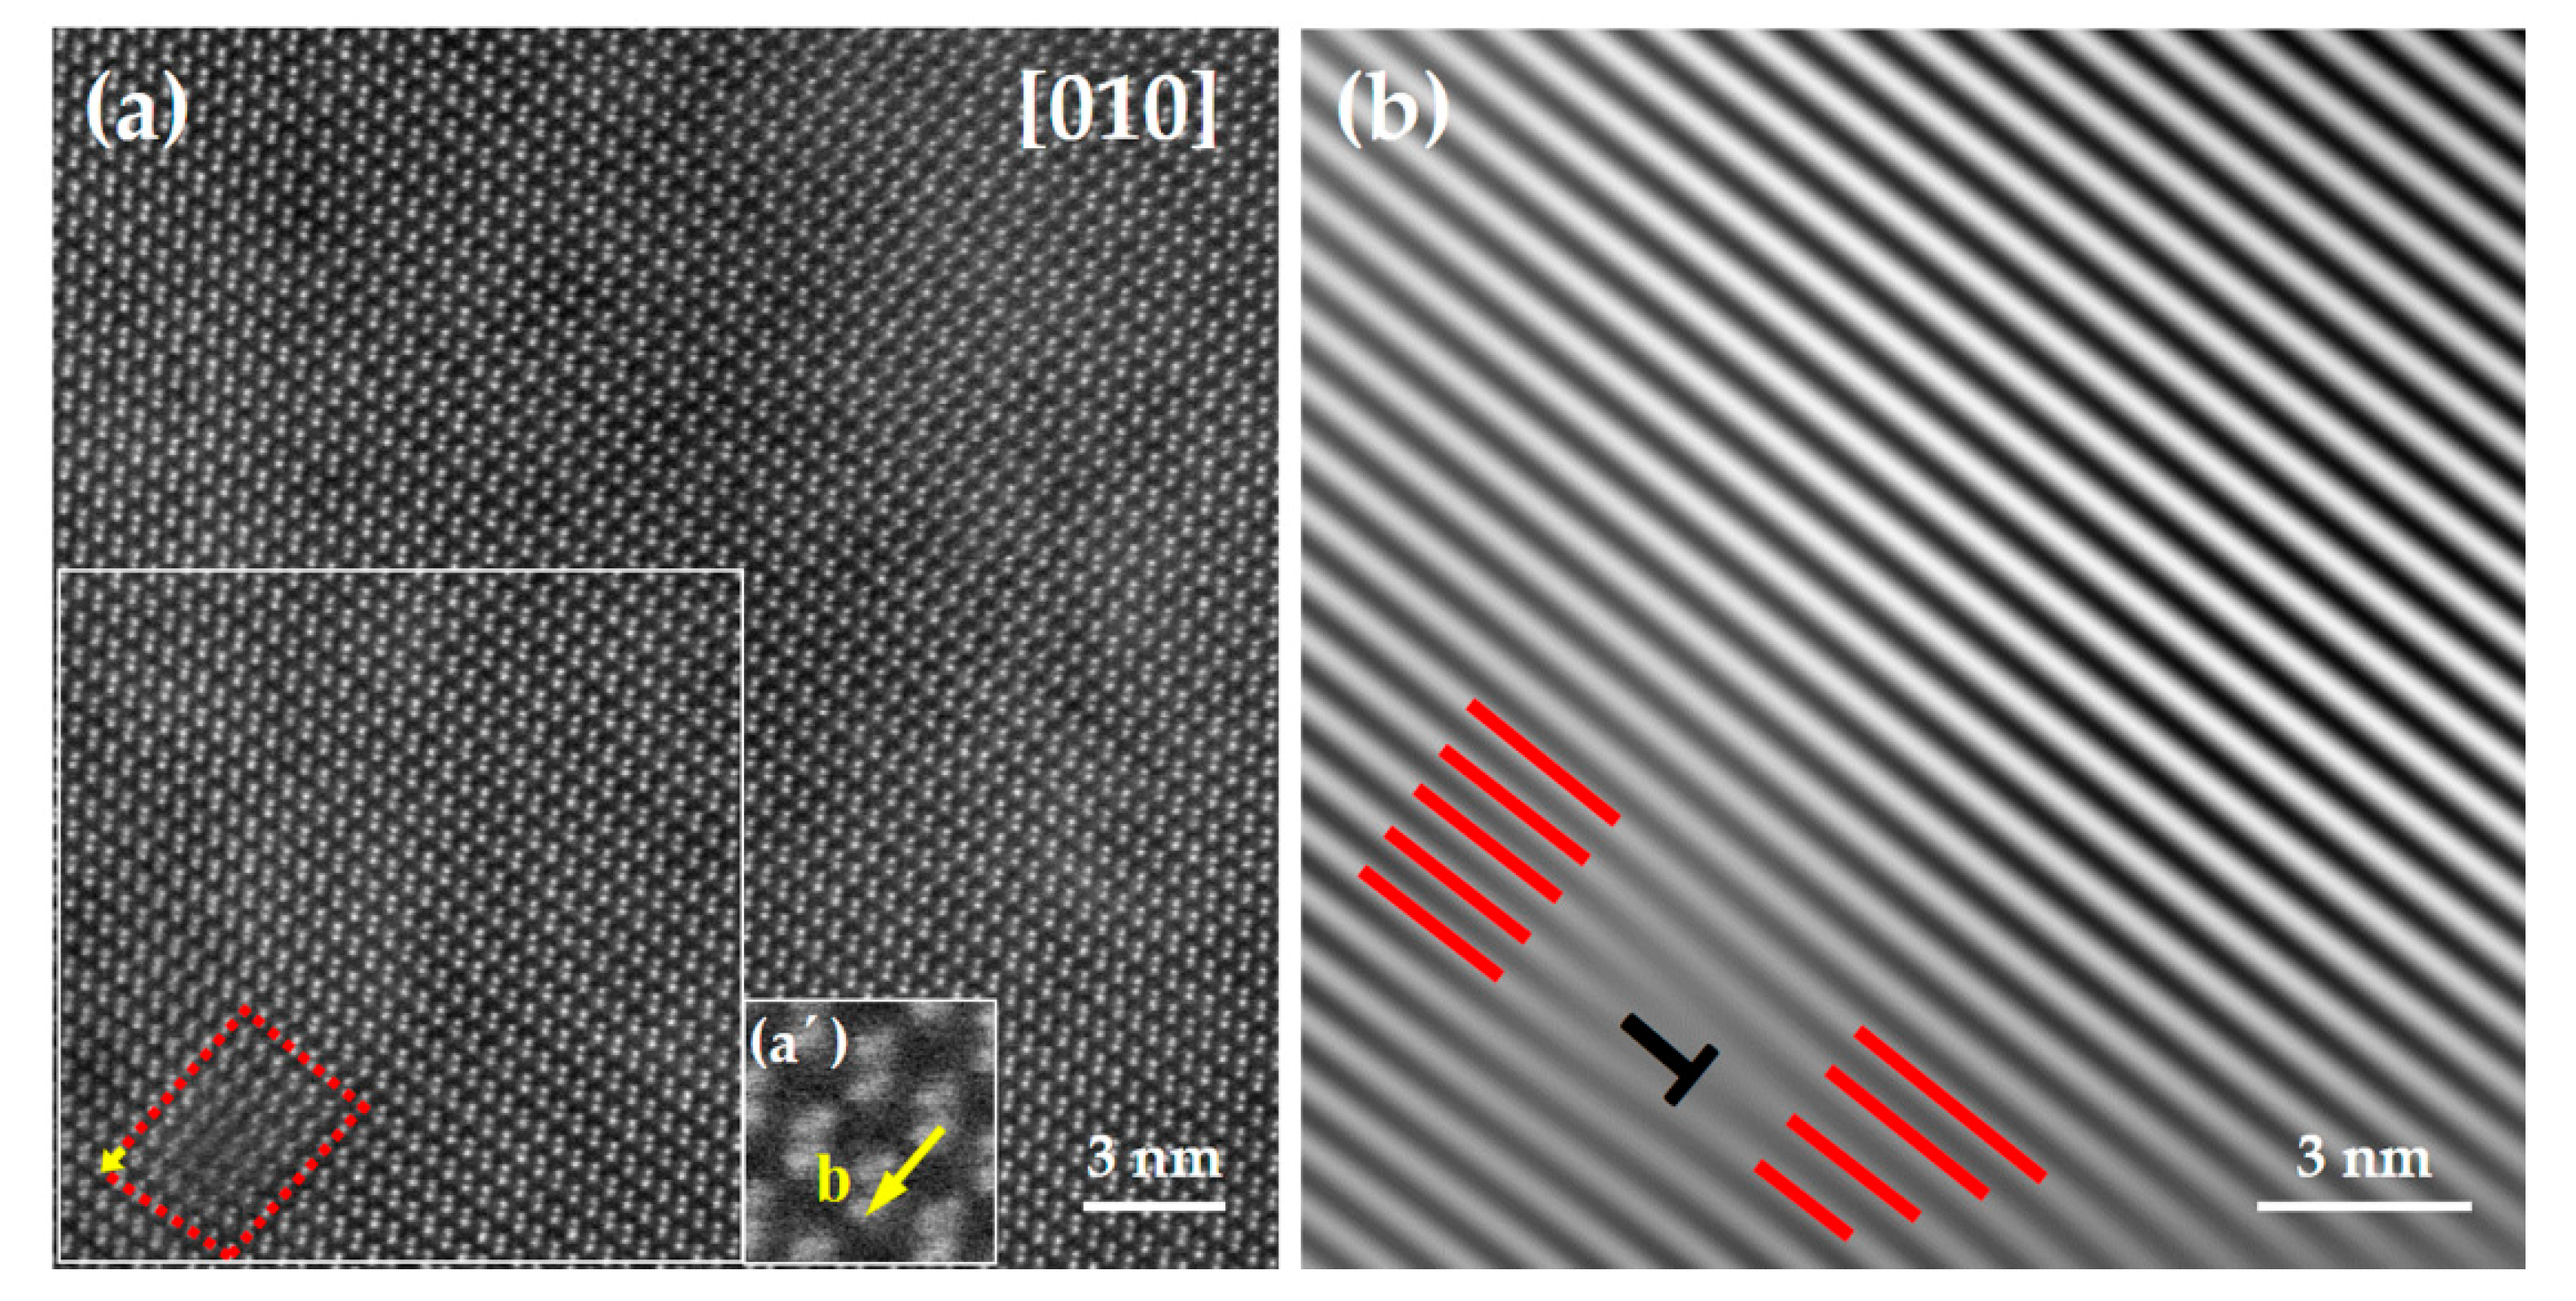
3.3. Atomic Structure of Radiogenic Pb in Monazite (TEM)

Figure 4 shows the TEM results on two FIB foils of monazite which were viewed along [010] and [100] zone axis, respectively. The selected area electron diffraction (SAED) image demonstrated that the monazite was well crystalline (Figure 4a’). The structure of monazite crystal was obtained in several hundreds of nanometers area due to the diameter of the secondary aperture we used for electron diffraction being about 600 nm. The HRTEM images showed that monazite foils have a perfect crystal lattice (Figure 4c,d). TEM-EDS microanalysis reveals the major elements and trace elements (Figure 4b), and the peaks of Pb are indicated by red arrow in the EDS spectrum (include the inset in Figure 4b). The semi-quantitative content of Pb given by the EDS data is approximately 0.3 wt %, which is close to Pb concentration determined by SIMS [25]. Since the proportion of common Pb in total Pb is extremely low (f206 approximately 0.2%, f208 approximately 0.03%) in this monazite, the detected Pb by TEM are nearly considered as radiogenic Pb.
Atomic resolution STEM-HAADF images show the actual positions of atoms, in the form of projections of atomic arrangements along different directions. The brightness in the HAADF image is approximately proportional to the square of the atomic number (Z2), i.e., the heavier the atoms, the brighter the contrast of atomic column [39]. The STEM-HAADF images of monazite structure taken along the [010] and [100] directions display that the atomic columns are arranged perfectly in the observed areas (Figure 5c,d). The insets (as shown in Figure 5c´,d´) show the enlarged HAADF images and the models of atomic arrangements of Ce (for CePO4) along the [010] and [100] direction (the atomic models of CePO4 are shown in Figure 5a,b). Since the HAADF image shows a strong atomic-number (Z) contrast with a minimum dependence on microscope defocus [39,40], the bright spots indicate the relatively heavier elements, Ce, Pb, Th, and other REEs, while the dark contrast correspond to the light elements, such as O, P, Si, and Ca. By comparing the arrangement of bright atomic columns in HAADF images with the atomic arrangements of CePO4 (see Figure 5a,b), a one-to-one correspondence was found between the bright atomic column and Ce site, suggesting that the heavier species substitute the Ce site qualitatively in the monazite structure. Similar investigation in the STEM-HAADF images of an archean zircon indicated that Pb atoms directly substitute for Zr in the zircon structure [41]. Since the atomic number of Pb (82) and Th (90) is strikingly higher than REEs, the atomic columns incorporated with Pb and Th present brighter contrast than those of REEs (such as Ce, Nd, La, Pr, Sm, et al.). As is shown in Figure 5e,f, the intensity profile of each atomic clomun in the green rectangular box and red rectangular box are different. The intensity of peaks marked with an ellipse display more remarkable levels than the other peaks, indicating that more Pb and Th were incroprated into these columns.
In spite of the perfect arrangement of atomic sites in most areas, some distorted lattices (encircled by the Burgers circuit) were observed in the STEM-HAADF image from the FIB foil of monazite (Figure 6a), indicating that there are crystal defects or decay damage in this monazite structure investigated. A Burgers vector was marked with a yellow arrow in a Burgers circuit, and the enlarged Burgers vector was illustrated in the inset (a´). Figure 6b is the inverse fast Fourier transform (IFFT) image of the area given by the box in Figure 6a. An edge dislocation was indicated by the black sign in Figure 6b. By Burgers circuit closure and crystallography analyses, the Burgers vectors b of the edge dislocation was determined to be [10-1], and the edge dislocation in the dipoles glide on the (111) planes. A similar case about distorted domains were also reported in DIG19 monazite by Seydoux-Guillaume et al. [5].

4. Discussion

4.1. The Crystallinity of RW-1 Monazite-Ce

For RW-1 monazite-Ce, the accumulated alpha dose is as high as 9.5 × 10¹⁹ α/g. This is normally considered as sufficient heavy to make a mineral amorphous. It is well established that zircon is readily subjected to radiation damage induced by α particles recoil events and become metamict [4,42,43]. However, things could be different and more complicated for monazite. In contrast to zircon, monazite is not susceptible to amorphization; meanwhile, metamict monazite is rarely observed in nature [4,44]. Some probable reasons are commonly considered to explain the absence of metamict in natural monazite, such as the strong bonds for P–O and the low symmetry monazite structure [45,46,47], recrystallization of thermal annealing at low temperatures over geologic time [4,48], and alpha-self-healing due to the electronic energy loss of α particles [49,50,51].
Raman spectroscopy was introduced as a method to estimate the degree of metamictization due to the accumulated radiation damage [37,52]. The Raman spectra show a broadened Raman band with FWHM around 20.4 cm−1, which is much wider than those (7.2 cm−1) of annealed monazite and implicating that the sample experienced radiation damage. The HRTEM images and HAADF images suggest that the monazite is well crystalline in most areas; however, some distorted lattices do exist, such as edge dislocations (Figure 6). There is no metamict observed in this monazite. The edge dislocation is probably related to the radiation damage induced by alpha decay. The evidence of radiation damage in natural monazite is limited to nanometer-sized domains with distorted lattice within monazite structure [38,53]. Although the dislocation areas are almost negligible compared to the total volume, they result in an obvious reflection in Raman analysis. Anyhow, TEM and STEM-HAADF images show a well crystalline on the dominated area of this monazite. Meantime, this monazite kept an original U–Th–Pb system, indicating no later recrystallization. It implies that alpha-self-healing due to the electronic energy loss of α particles may play a significant role in explaining the well crystallinity of RW-1 monazite-Ce with a high alpha-decay dose [49,50,51].

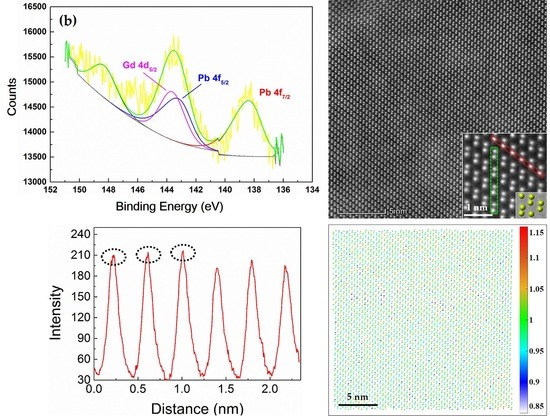
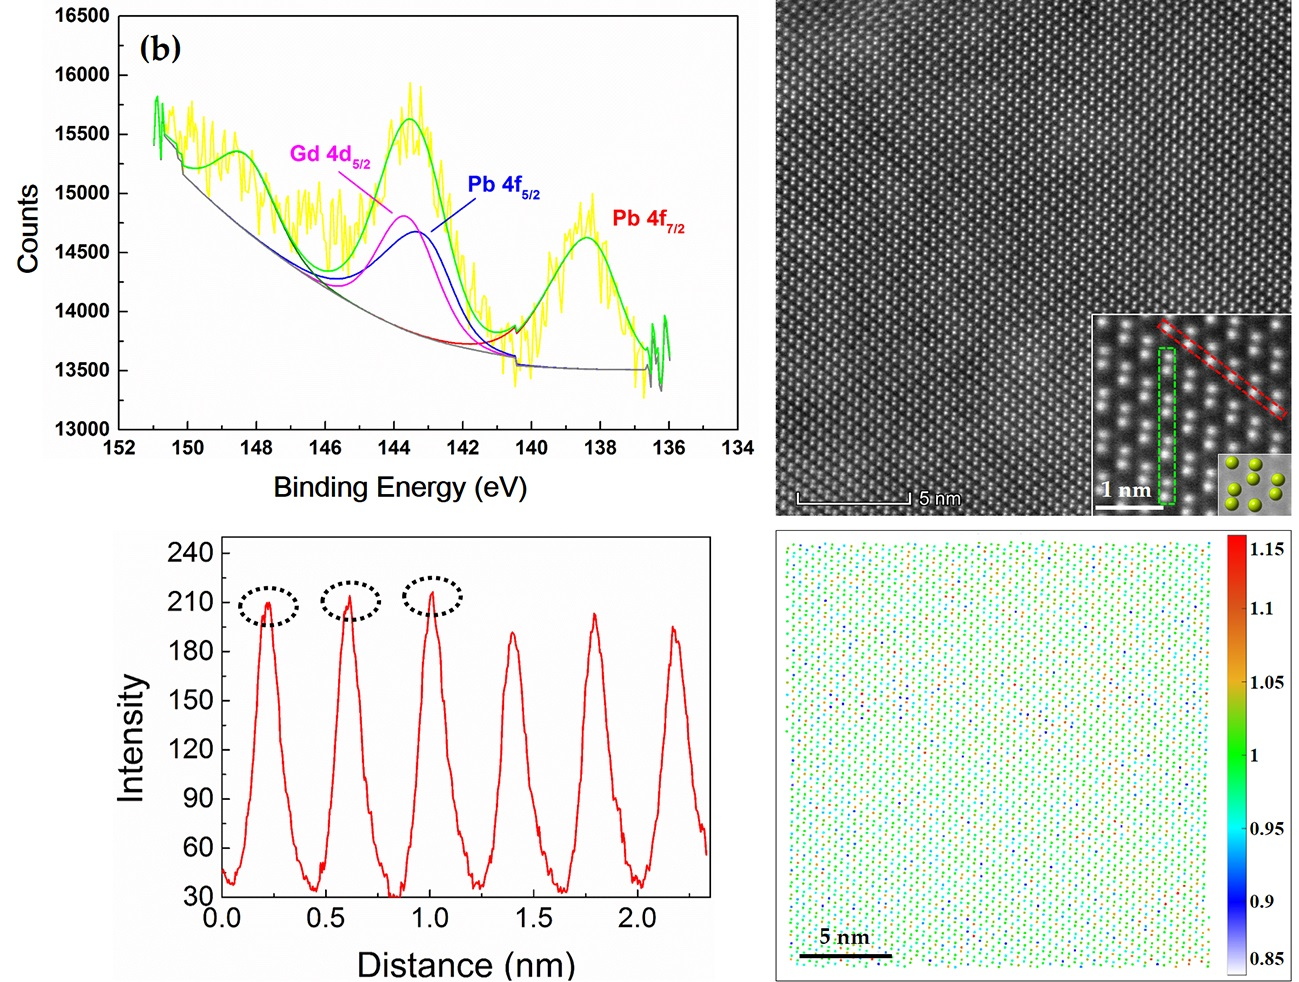
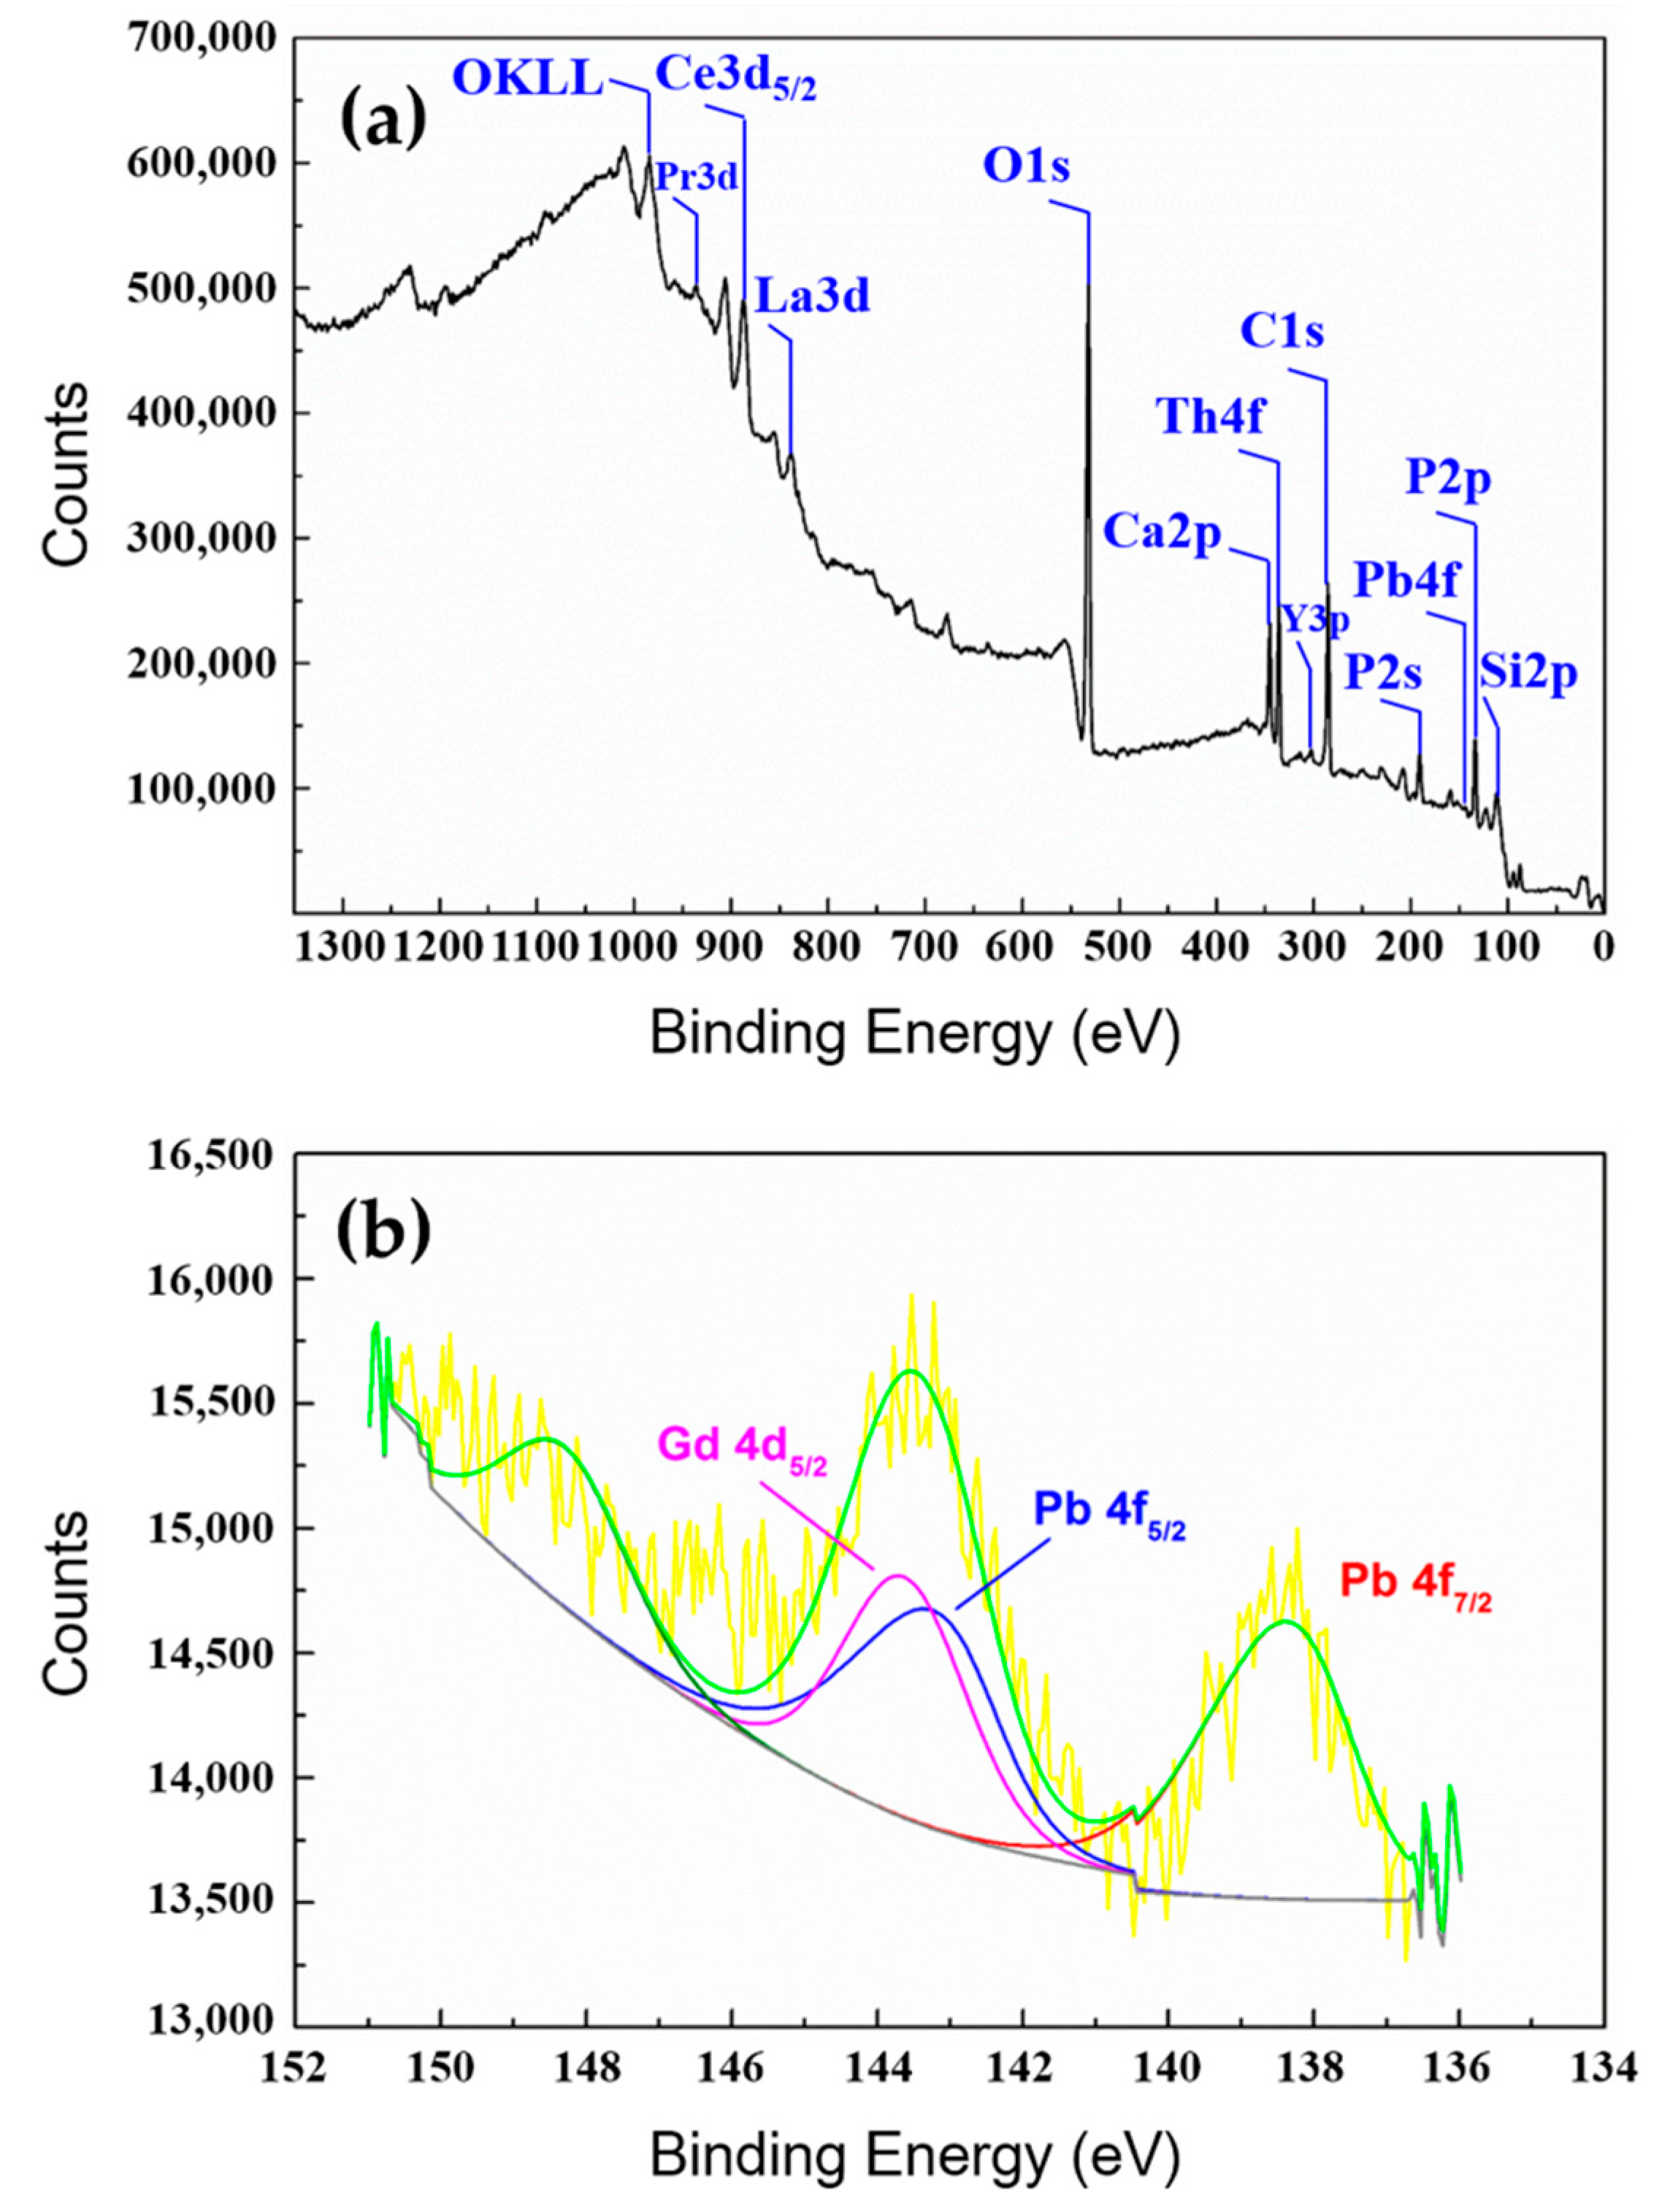
4.2. The Chemical State of Radiogenic Pb

Previous studies by X-ray absorption near-edge structure (XANES) for some nature zircon and monazite (LaPO4) have concluded that radiogenic Pb is stored as a divalent cation [19,20]. There are also some viewpoints that argue that the tetravalent state in radiogenic Pb could be maintained in a highly oxidizing environment created by by β-decays [18], or Pb4+ may be exist in the zircon with lower radiation doses, as suggested by the pre-edge features of XANES [19]. In this study, via analyzing the XPS spectra from RW-1 monazite-Ce, we confirmed that the chemical state of radiogenic Pb is in the form of Pb2+ in this monazite (Figure 1b). Recent studies further revealed that radiogenic Pb is divalent in uraninite, coffinite, brannerite, zircon, and titanite [54]. Furthermore, Syverson et al. (2019) pointed out that radiogenic Pb should be still indicative of Pb2+ in the zircon exposed to lower doses by examination of the pre-edge [54].
In addition, the coordination number of Ce is nine in the monoclinic monazite structure; that is to say, Ce3+ is coordinated with nine oxygen ions in monazite [46,55,56]. The ionic radius of Ce3+ is 1.196 Å in nine-fold (IX)-coordination, and the average Ce–O distance is 2.552 Å in the monazite (CePO4) [56,57]. In the case of Pb2+, it has an ionic radius of 1.29 Å in eight-fold (VIII) coordination and the ionic radius of 1.35 Å in IX coordination [57]. Although the ionic radius of Pb2+ is slightly higher than that of Ce3+, it is reasonable in keeping stabilization in the monazite lattice due to the Pb substitutes the Ce site, as proven by the experiments in this study. The oxidation state and the occupancy of radiogenic Pb could also satisfy with the following coupled substitution: 2 REE3+ = Pb2+ + [U, Th]4+ [21]. It is contributed to maintain the charge balance of cation in monazite.

4.3. The Nanoscale Distribution of Pb and Th

Considering that Pb and Th (the atomic number is 82 and 90, respectively) are much heavier than REEs, such as Ce (58), Nd (60), La (57), Sm (62), Pr (59), Sn (50), Y (39), and Gd (64), in this monazite, the columns incorporated with more Pb and Th will reflect brighter contrast than those incorporated with REEs. A method based on image processing (the details are shown in Figure S3 in SI from Zhang, et al., 2016) was introduced to quantitatively evaluate the distribution of Pb and Th [58]. Zhang et al. have confirmed the distribution of Ge/Sb/Vacancy sites according to a normalized intensity mapping acquired by the image processing method [58,59]. To obtain the normalized intensity of Pb sites, the brightness of Ce atoms is set as reference and background because it is the main element. Figure 7 shows the normalized intensity mapping of STEM-HAADF images (which is shown in Figure 5c,d) of RW-1 monazite along the [010] and [100] directions, respectively. The normalized intensity mapping (Figure 7a,b) with different colors reflects the relative concentration of Pb and Th in each column in the HAADF image. The average value of brightness is set to be 1.0 (green). Blue-to-white with a value of 0.85 represents the distribution of REEs where Pb and Th are poor. Red-yellow with a value of 1.15 represents the distribution of Pb-rich and Th-rich in the column.
In Figure 7a, the red-yellow dots present a random distribution in the column, indicating the random distribution of Pb and Th, while the Pb and Th presented a segregated distribution to some extent in Figure 7b (above dash line). The segregation of the heavier elements in the upper left corner in Figure 7b is approximately 10 nanometers. With the development and application of the APM dating technique, this case about the occupancy and distribution of radiogenic Pb and Th at nanoscale and atomic scale could provide a meaningful insight and interpretation for the study of Th–Pb nanogeochronology in monazite [16], although the SIMS data and CL images showed that trace elements are homogeneous at the micrometer scale [25].

5. Conclusions

In this study, multiple techniques were conducted to determinate the crystallinity, the chemical state, and occupancy of radiogenic Pb in the natural RW-1 monazite (-Ce) with high Pb concentration. The main conclusions can be drawn as follows:
(1)
The TEM and STEM-HAADF data demonstrated that the studied natural monazite is well crystalline in most areas. Meanwhile, some distorted lattices induced from self-radiation were also observed, which resulted in a broadening band of RM analysis.
(2)
The radiogenic Pb exists as Pb2+ in a current state.
(3)
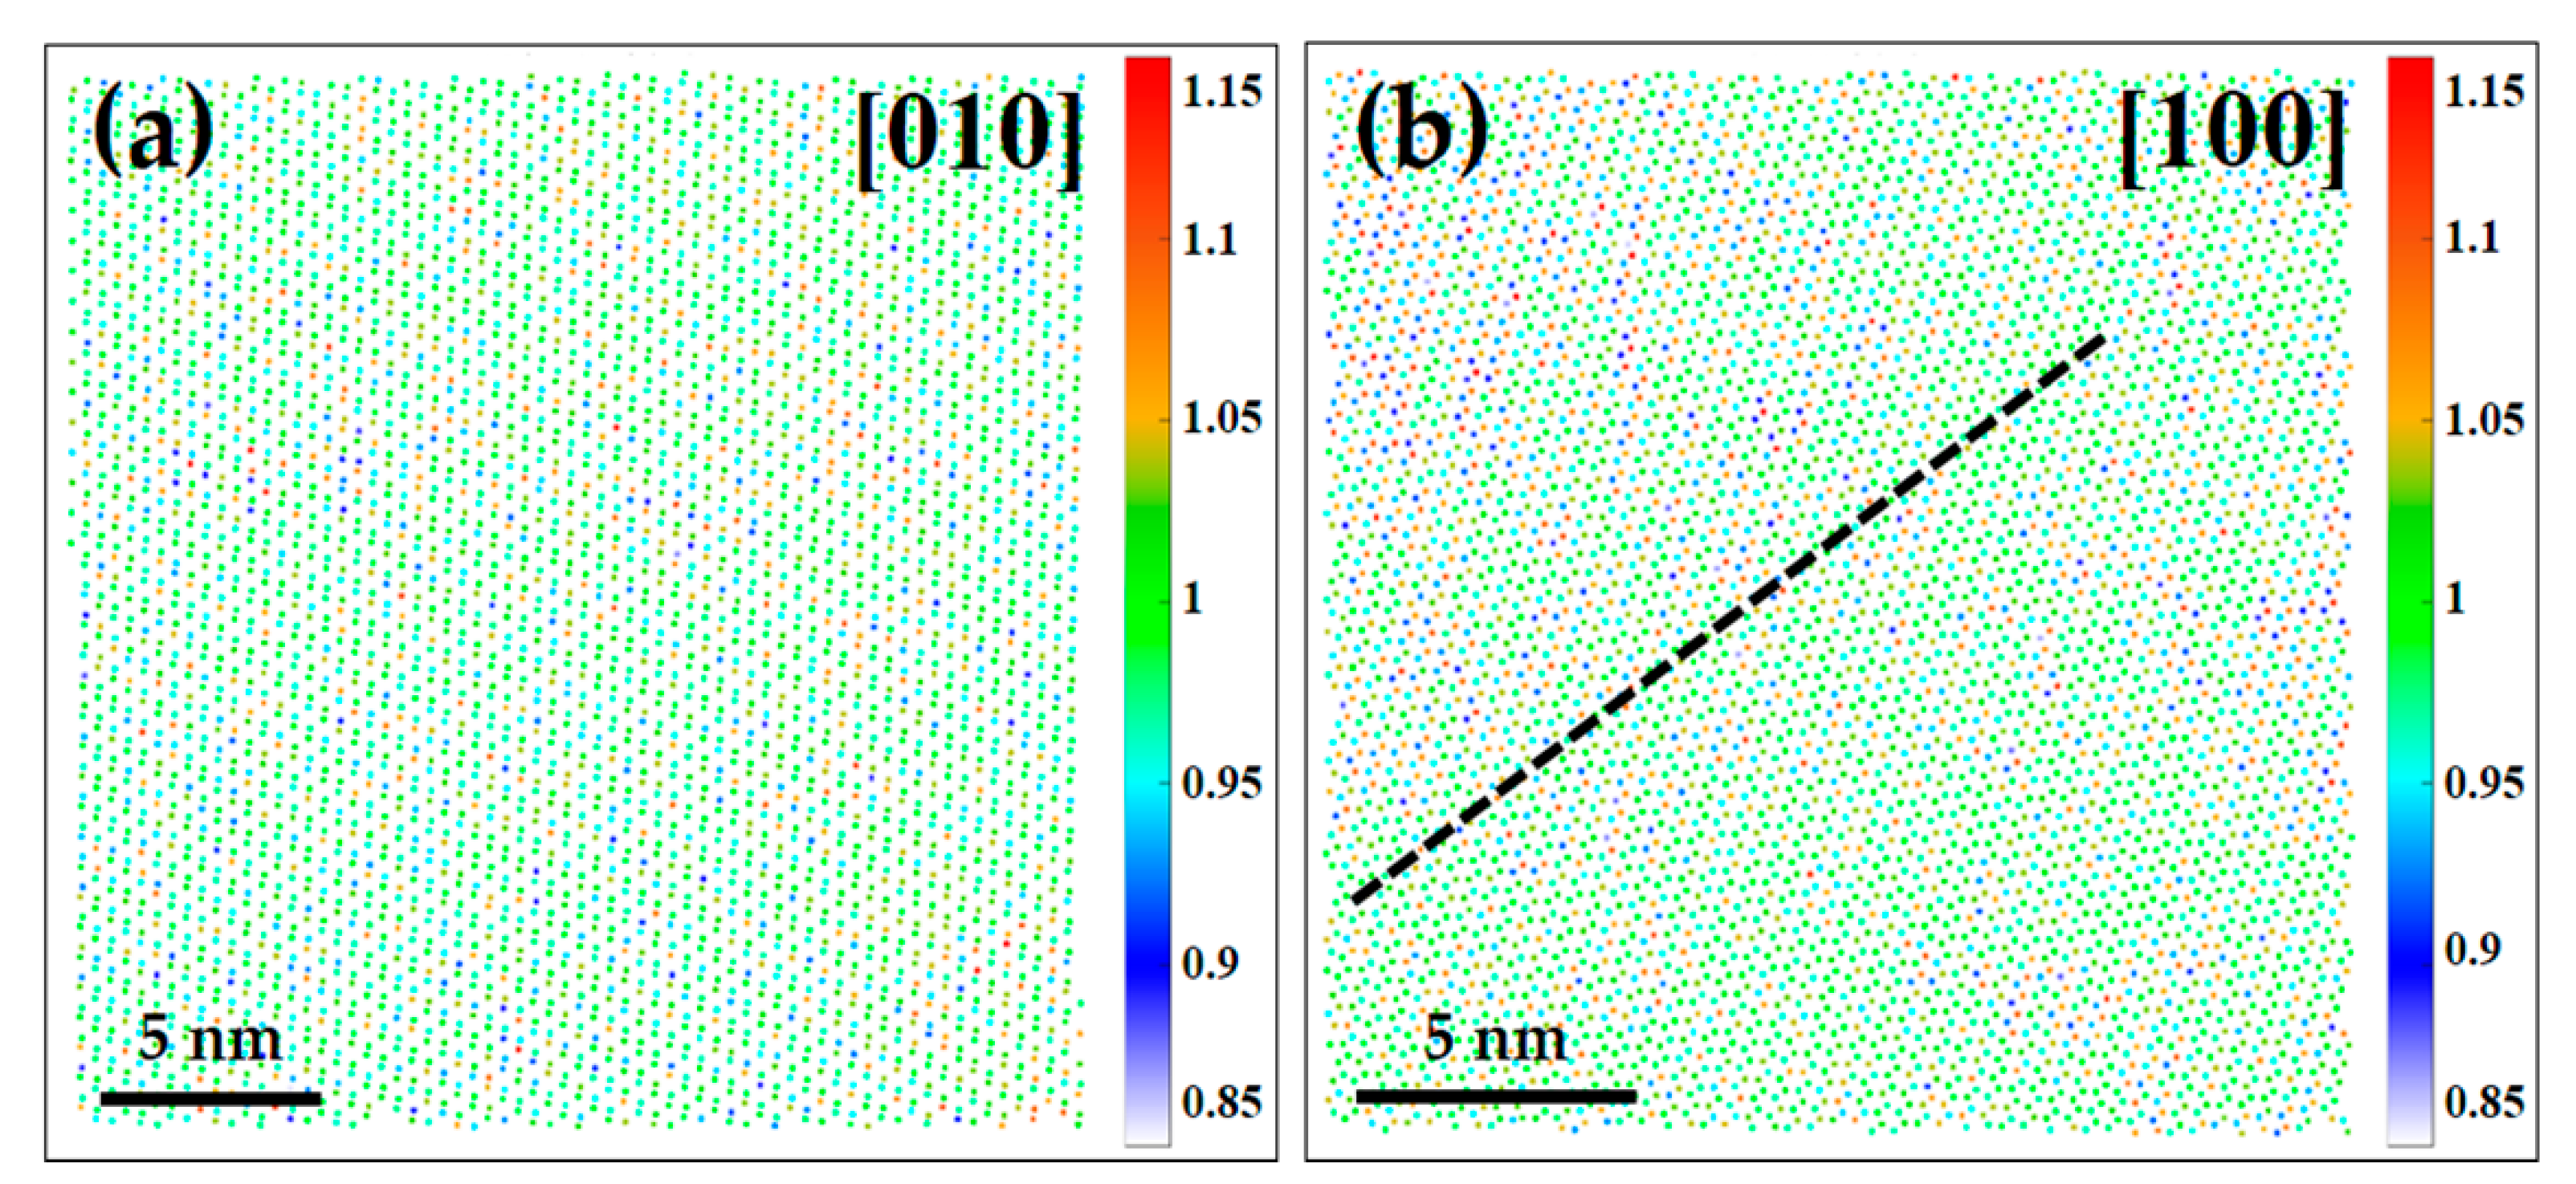
The STEM-HAADF data revealed that Pb atom substitute for the Ce atoms within the monazite crystal lattice. A normalized intensity mapping was developed for the STEM-HAADF images to better visualize the distribution of Pb and Th.

Author Contributions

Conceptualization, Q.-L.L. and X.T.; Methodology, X.T., B.Z., P.W., and L.-X.G.; Validation, Q.-L.L., X.T., and J.-H.L.; Formal analysis, X.T.; Investigation, X.T.; Resources, Q.-L.L. and X.-X.L.; Data Curation, X.T. and C.-H.F.; Writing—original draft preparation, X.T.; Writing—review and editing, Q.-L.L. and J.-H.L.; Supervision, Q.-L.L.; Project Administration, Q.-L.L.; Funding Acquisition, Q.-L.L. and X.T. All authors have read and agreed to the published version of the manuscript.

Funding

This research was funded by the National Key Research and Development Program of China (2016YFE0203000) and the Instrument Function Developing Project of the Chinese Academy of Sciences (IGG201902).

Acknowledgments

We thank Lai-Lai Li, Jian-Can Yang and Tou-Nan Jin from the College of Materials Science and Engineering, Beijing University of Technology, for their help in the XPS experiment. The authors also appreciate Wen Su at the Institute of Geology and Geophysics, Chinese Academy of Sciences for her help in the Raman spectroscopy experiments and Jing-Min Zhang at the Electron Microscopy Laboratory, Peking University for his efforts to maintain operation in TEM experiments.

Conflicts of Interest

The authors declare no conflict of interest.

References

  1. Parrish, R.R.; Tirrul, R. U-Pb age of the Baltoro granite, northwest Himalaya, and implications for monazite U-Pb systematics. Geology 1989, 17, 1076–1079. [Google Scholar] [CrossRef]
  2. Harrison, T.M.; Catlos, E.J.; Montel, J.M. U-Th-Pb Dating of Phosphate Minerals. Rev. Mineral. Geochem. 2002, 48, 524–558. [Google Scholar] [CrossRef] [Green Version]
  3. Li, Q.L.; Li, X.H.; Lan, Z.W.; Guo, C.L. Monazite and xenotime U–Th–Pb geochronology by ion microprobe dating highly fractionated granites at Xihuashan tungsten mine, SE China. Contrib. Mineral. Petr. 2013, 166, 65–80. [Google Scholar] [CrossRef]
  4. Meldrum, A.; Boatner, L.A.; Weber, W.J.; Ewing, R.C. Radiation damage in zircon and monazite. Geochim. Cosmochim. Acta 1998, 62, 2509–2520. [Google Scholar] [CrossRef]
  5. Seydoux-Guillaume, A.M.; Wirth, R.; Deutsch, A.; Schärer, U. Microstructure of 24-1928 Ma concordant monazites; implications for geochronology and nuclear waste deposits. Geochim. Cosmochim. Acta 2004, 68, 2517–2527. [Google Scholar] [CrossRef]
  6. Vance, E.R.; Zhang, Y.; McLeod, T.; Davis, J. Actinide valences in xenotime and monazite. J. Nucl. Mater. 2011, 409, 221–224. [Google Scholar] [CrossRef]
  7. Schärer, U.; Xu, R.H.; Allègre, C.J. U-(Th)-Pb systematics and ages of Himalayan leucogranites, South Tibet. Earth. Plan. Sci. Lett. 1986, 77, 35–48. [Google Scholar] [CrossRef]
  8. Smith, H.A.; Barreiro, B. Monazite U-Pb dating of staurolite grade metamorphism in pelitic schists. Contrib. Mineral. Petr. 1990, 105, 602–615. [Google Scholar] [CrossRef]
  9. Cocherie, A.; Legendre, O.; Peucat, J.J.; Kouamelan, A.N. Geochronology of polygenetic monazites constrained by in situ electron microprobe Th-U-total lead determination implications for lead behaviour in monazite. Geochim. Cosmochim. Ac. 1998, 62, 2475–2497. [Google Scholar] [CrossRef]
  10. Bingen, B.; Breemen, O.V. U-Pb monazite ages in amphibolite-to granulite-facies orthogneiss reflect hydrous mineral breakdown reactions: Sveconorwegian Province of SW Norway. Contrib. Mineral. Petr. 1998, 132, 336–353. [Google Scholar] [CrossRef]
  11. Asami, M.; Suzuki, K.; Grew, E.S. Monazite and Zircon Dating by the Chemical Th-U-Total Pb Isochron Method (CHIME) from Alasheyev Bight to the Sør Rondane Mountains, East Antarctica: A Reconnaissance Study of the Mozambique Suture in East Queen Maud Land. J. Geol. 2005, 113, 59–82. [Google Scholar] [CrossRef]
  12. Goncalves, P.; Christian, N.; Montel, J.M. Petrology and in situ U-Th-Pb Monazite Geochronology of Ultrahigh-Temperature Metamorphism from the Andriamena Mafic Unit, North-Central Madagascar. Significance of a Petrographical P-T Path in a Polymetamorphic Context. J. Petrol. 2004, 45, 1923–1957. [Google Scholar] [CrossRef] [Green Version]
  13. Hawkins, D.P.; Bowring, S.A. U-Pb systematics of monazite and xenotime case: Studies from the Paleoproterozoic of the Grand Canyon, Arizona. Contrib. Mineral. Petr. 1997, 127, 87–103. [Google Scholar] [CrossRef]
  14. Seydoux-Guillaume, A.M.; Goncalves, P.; Wirth, R.; Deutsch, A. Transmission electron microscope study of polyphase and discordant monazites: Site-specific specimen preparation using the focused ion beam technique. Geology 2003, 3, 973–976. [Google Scholar] [CrossRef]
  15. Fougerouse, D.; Reddy, S.M.; Saxey, D.W.; Erickson, T.M.; Kirkland, C.L.; Rickard, W.D.A.; Seydoux-Guillaume, A.M.; Clark, C.; Buick, I.S. Nanoscale distribution of Pb in monazite revealed by atom probe microscopy. Chem. Geol. 2018, 479, 251–258. [Google Scholar] [CrossRef] [Green Version]
  16. Seydoux-Guillaume, A.M.; Fougerouse, D.; Laurent, A.T.; Gardés, E.; Reddy, S.M.; Saxey, D.W. Nanoscale resetting of the Th/Pb system in an isotopically-closed monazite grain: A combined atom probe and transmission electron microscopy study. Geosci. Front. 2019, 10, 65–76. [Google Scholar] [CrossRef]
  17. Catlos, E.J.; Miller, N.R. Ion microprobe 208Th-208Pb ages from high common Pb monazite, Morefield Mine, Amelia County, Virginia: Implications for Alleghanian tectonics. Am. J. Sci. 2016, 316, 470–503. [Google Scholar] [CrossRef]
  18. Kramers, J.; Frei, R.; Newville, M.; Kober, B.; Villa, I. On the valency state of radiogenic lead in zircon and its consequences. Chem. Geol. 2009, 261, 4–11. [Google Scholar] [CrossRef]
  19. Tanaka, K.; Takahashi, Y.; Horie, K.; Shimizu, H.; Murakami, T. Determination of the oxidation state of radiogenic Pb in natural zircon using X-ray absorption near-edge structure. Phys. Chem. Miner. 2010, 37, 249–254. [Google Scholar] [CrossRef]
  20. Dubrail, J.; Farges, F.; Gautron, L.; Harfouche, M.; Borca, C.; Grolimund, D. Pb in naturally irradiated monazites and zircons. J. Phys.: Conf. Ser. 2009, 190. [Google Scholar] [CrossRef] [Green Version]
  21. Podor, R.; Cuney, M. Experimental study of Th-bearing LaPO4 (780 °C, 200 MPa): Implications for monazite and actinide orthophosphate stability. Am. Mineral. 1997, 82, 765–771. [Google Scholar] [CrossRef]
  22. Ni, Y.X.; Hughes, J.M.; Mariano, A.N. Crystal chemistry of the monazite and xenotime structures. Am. Mineral. 1995, 80, 21–26. [Google Scholar] [CrossRef]
  23. Donovan, J.J.; Hanchar, J.M.; Picolli, P.M.; Schrier, M.D.; Boatner, L.A.; Jarosewich, E. A re-examination of the rare-earth-element orthophosphate standards in use for electron-microprobe analysis. Can. Mineral. 2003, 41, 221–232. [Google Scholar] [CrossRef]
  24. Taylor, B.E.; Friedrichsen, H. Oxygen and hydrogen isotope disequilibria in the Landsverk I pegmatite, Evje, southem Norway: Evidence for anomalous hydrothermal fluids. Nor. Geogr. Tidsskr. 1983, 63, 199–209. [Google Scholar]
  25. Ling, X.X.; Huyskens, M.H.; Li, Q.L.; Yin, Q.Z.; Werner, R.; Liu, Y.; Tang, G.Q.; Yang, Y.N.; Li, X.H. Monazite RW-1: A homogenous natural reference material for SIMS U–Pb and Th–Pb isotopic analysis. Miner. Petrol. 2016, 111, 163–172. [Google Scholar] [CrossRef]
  26. Wu, L.G.; Li, X.H.; Ling, X.X.; Yang, Y.H.; Li, C.F.; Li, Y.L.; Mao, Q.; Li, Q.L.; Putlitz, B. Further Characterization of the RW-1 Monazite: A New Working Reference Material for Oxygen and Neodymium Isotopic Microanalysis. Minerals 2019, 9, 583. [Google Scholar] [CrossRef] [Green Version]
  27. Ivanova, O.P.; Vasilyev, L.A.; Naumkin, A.V.; Kantsel, V.V. XPS studies of natural monazite and relative compounds under ion bombardment. Appl. Surf. Sci. 1993, 72, 307–312. [Google Scholar] [CrossRef]
  28. Glorieux, B.; Berjoan, R.; Matecki, M.; Kammouni, A.; Perarnau, D. XPS analyses of lanthanides phosphates. Appl. Surf. Sci. 2007, 253, 3349–3359. [Google Scholar] [CrossRef]
  29. Apostol, N.G.; Stoflea, L.E.; Lungu, G.A.; Tache, C.A.; Popescu, D.G.; Pintilie, L.; Teodorescu, C.M. Band bending at free Pb(Zr,Ti)O3 surfaces analyzed by X-ray photoelectron spectroscopy. Mater. Sci. Eng. B 2013, 178, 1317–1322. [Google Scholar] [CrossRef]
  30. Rafiuddin, M.R.; Mueller, E.; Grosvenor, A.P. X-ray Spectroscopic Study of the Electronic Structure of Monazite- and Xenotime-Type Rare-Earth Phosphates. J. Phys. Chem. C 2014, 118, 18000–18009. [Google Scholar] [CrossRef]
  31. Rondon, S.; Sherwood, P.M.A. Core Level and Valence Band Spectra of PbO by XPS. Surf. Sci. Spectra 1998, 5, 97–103. [Google Scholar] [CrossRef]
  32. Rondon, S.; Sherwood, P.M.A. Core Level and Valence Band Spectra of Pb3O4 by XPS. Surf. Sci. Spectra 1998, 5, 90–96. [Google Scholar] [CrossRef]
  33. Rondon, S.; Sherwood, P.M.A. Core Level and Valence Band Spectra of PbO2 by XPS. Surf. Sci. Spectra 1998, 5, 104–110. [Google Scholar] [CrossRef]
  34. Richter, D.K.; Görgen, P.; Götte, T. Monazite cathodoluminescence—A new tool for heavy mineral analysis of siliciclastic sedimentary rocks. Sediment. Geol. 2008, 209, 36–41. [Google Scholar] [CrossRef]
  35. Vaggelli, G.; Cossio, R.; Petrelli, M.; Rossetti, P. Combined cathodoluminescence spectroscopy, electron microprobe and laser ablation ICP mass spectrometry analysis: An attempt to correlate luminescence and chemical composition of monazite. Microchim. Acta 2008, 161, 313–321. [Google Scholar] [CrossRef]
  36. Li, X.H.; Chen, Y.; Tchouankoue, J.P.; Liu, C.Z.; Li, J.; Ling, X.X.; Tang, G.Q.; Liu, Y. Improving geochronological framework of the Pan-African orogeny in Cameroon: New SIMS zircon and monazite U-Pb age constraints. Precambrian Res. 2017, 294, 307–321. [Google Scholar] [CrossRef]
  37. Ruschel, K.; Nasdala, L.; Kronz, A.; Hanchar, J.M.; Többens, D.M.; Škoda, R.; Finger, F.; Möller, A. A Raman spectroscopic study on the structural disorder of monazite-(Ce). Miner. Petrol. 2012, 105, 41–55. [Google Scholar] [CrossRef]
  38. Seydoux-Guillaume, A.M.; Wirth, R.; Nasdala, L.; Gottschalk, M.; Montel, J.M.; Heinrich, W. An XRD, TEM and Raman study of experimentally annealed natural monazite. Phys. Chem. Miner. 2002, 29, 240–253. [Google Scholar] [CrossRef]
  39. Pennycook, S.J.; Jesson, D.E. Atomic resolution Z-contrast imaging of interfaces. Acta metall. Mater. 1992, 40, S149–S159. [Google Scholar] [CrossRef]
  40. Pennycook, S.J.; Boatner, L.A. Chemically Sensitive Structure-Imaging with a Scanning Transmission Electron Microscope. Nature 1988, 336, 565–567. [Google Scholar] [CrossRef]
  41. Utsunomiya, S.; Palenik, C.S.; Valley, J.W.; Cavosie, A.J.; Wilde, S.A.; Ewing, R.C. Nanoscale occurrence of Pb in an Archean zircon. Geochim. Cosmochim. Ac. 2004, 68, 4679–4686. [Google Scholar] [CrossRef]
  42. Weber, W.J. Radiation-induced defects and amorphization in zircon. J. Mater. Res. 1990, 5. [Google Scholar] [CrossRef]
  43. Murakami, T.; Chakoumakos, B.C.; Ewing, R.C.; Lumpkin, G.R.; Weber, W.J. Alpha-decay event damage in zircon. Am. Mineral. 1991, 76. [Google Scholar] [CrossRef]
  44. Omel’yanenko, B.I.; Livshits, T.S.; Yudintsev, S.V.; Nikonov, B.S. Natural and artificial minerals as matrices for immobilization of actinides. Geol. Ore Depos. 2007, 49, 173–193. [Google Scholar] [CrossRef]
  45. Cherniak, D.J.; Watson, E.B.; Grove, M.; Harrison, T.M. Pb diffusion in monazite: A combined RBS/SIMS study. Geochim. Cosmochim. Ac. 2004, 68, 829–840. [Google Scholar] [CrossRef]
  46. Clavier, N.; Podor, R.; Dacheux, N. Crystal chemistry of the monazite structure. J. Eur. Ceram. Soc. 2011, 31, 941–976. [Google Scholar] [CrossRef]
  47. Catlos, E.J. Versatile Monazite: Resolving geological records and solving challenges in materials science: Generalizations about monazite: Implications for geochronologic studies. Am. Mineral. 2013, 98, 819–832. [Google Scholar] [CrossRef]
  48. Boatner, L.A.; Sales, B.C. Radioactive Waste Forms for the Future: Monazite; Elsevier Science Publishers: Amsterdam, The Netherlanders, 1988; pp. 495–564. [Google Scholar]
  49. Meldrum, A.; Boatner, L.A.; Ewing, R.C. Electron-irradiation-induced nucleation and growth in amorphous LaPO4, ScPO4, and zircon. J. Mater. Res. 1997, 12, 1816–1827. [Google Scholar] [CrossRef]
  50. Deschanels, X.; Seydoux-Guillaume, A.M.; Magnin, V.; Mesbah, A.; Tribet, M.; Moloney, M.P.; Serruys, Y.; Peuget, S. Swelling induced by alpha decay in monazite and zirconolite ceramics: A XRD and TEM comparative study. J. Nucl. Mater. 2014, 448, 184–194. [Google Scholar] [CrossRef]
  51. Seydoux-Guillaume, A.M.; Deschanels, X.; Baumier, C.; Neumeier, S.; Weber, W.J.; Peuget, S. Why natural monazite never becomes amorphous: Experimental evidence for alpha self-healing. Am. Mineral. 2018, 103, 824–827. [Google Scholar] [CrossRef]
  52. Nasdala, L.; GrÖtzschel, R.; Probst, S.; Bleisteiner, B. Irradiation damage in monazite-(Ce): An example to establish the limits of Raman confocality and depth resolution. Can. Mineral. 2010, 48, 351–359. [Google Scholar] [CrossRef]
  53. Black, L.P.; Fitzgerald, J.D.; Harley, S.L. Pb isotopic composition color and microstructure of monazites from a polymetamorphic rock in Antarctica. Contrib. Mineral. Petr. 1984, 85, 141–148. [Google Scholar] [CrossRef]
  54. Syverson, D.D.; Etschmann, B.; Liu, W.; Ram, R.; Mei, Y.; Lanzirotti, T.; Mercadier, J.; Brugger, J. Oxidation state and coordination environment of Pb in U-bearing minerals. Geochim. Cosmochim. Ac. 2019, 265, 109–131. [Google Scholar] [CrossRef]
  55. Mi, J.X.; Shen, J.C.; Liang, J.; Pan, B.M. The Crystal Strueture Refinement of Monazite-(Ce) and Xenotime-(Y). Acta Petrol. Mineral. 1996, 15, 53–59. [Google Scholar]
  56. Boatner, L.A. Synthesis, Structure, and Properties of Monazite, Pretulite, and Xenotime. Rev. Mineral. Geochem. 2002, 48, 87–121. [Google Scholar] [CrossRef]
  57. Shannon, R.D. Revised Effective Ionic Radii and Systematic Study of Inter Atomic Distances in Halides and Chalcogenides. Acta Cryst. 1976, A32, 751–767. [Google Scholar] [CrossRef]
  58. Zhang, B.; Wang, X.P.; Shen, Z.J.; Li, X.B.; Wang, C.S.; Chen, Y.J.; Li, J.X.; Zhang, J.X.; Zhang, Z.; Zhang, S.B.; et al. Vacancy Structures and Melting Behavior in Rock-Salt GeSbTe. Sci. Rep. 2016, 6. [Google Scholar] [CrossRef] [Green Version]
  59. Zhang, B.; Zhang, W.; Shen, Z.J.; Chen, Y.J.; Li, J.X.; Zhang, S.B.; Zhang, Z.; Wuttig, M.; Mazzarello, R.; Ma, E.; et al. Element-resolved atomic structure imaging of rocksalt Ge2Sb2Te5 phase-change material. Appl. Phys. Lett. 2016, 108, 191902. [Google Scholar] [CrossRef] [Green Version]
Figure 1. (a) The full XPS spectra (survey) of monazite. (b) Pb 4f XPS spectra and fitted peak for the natural monazite chip1.
Minerals 10 00504 g001
Figure 2. (a,b) are the cathodoluminescence images of two monazite chips. Two white bars in (a) show the sites of two focused ion beam (FIB) foils (f1, f2). (ci) The corresponding energy-dispersive X-ray spectrometer (EDS) maps of the monazite chip in (b) after the secondary ion mass spectrometry (SIMS) dent was polished.
Minerals 10 00504 g002
Figure 3. (a) The image of monazite chip (shown in Figure 2b) with black line and red crosses marked. (b) The variation of FWHM of a Raman band at 972 cm−1 along the black line in (a). The FWHMs of a Raman band at different sites were around 20.4 cm−1,which is indicated by the red dash line. (c,d) Two Raman spectra (red spectrogram) from the cross-site (C1, C2) acquired by line scanning along the black line and fitted Raman spectra (blue spectrogram) with Lorentz function.
Minerals 10 00504 g003
Figure 4. (a) The TEM bright-field (BF) image and selected area electron diffraction (SAED) (() viewed along the [010] direction) of the monazite grain. (b) The EDS spectrum of the monazite grain in (a). The inset in Figure 4b is enlarged EDS spectrum with red arrows point to the peaks of Pb-Mα and Pb-Lα. (c,d) The high-resolution transmission electron microscopy (HRTEM) images of two monazite foils viewed along the [010] and [100] direction, respectively. The monazite we studied is well crystalline.
Minerals 10 00504 g004
Figure 5. (a,b) Atomic models of CePO4 along [010] and [100] crystallographic orientations. (c,d) The scanning TEM (STEM) and high-angle annular dark field (HAADF) images of the monazite foils viewed along the [010] and [100] direction, respectively. The insets (Figure 5,) are enlarged HAADF images of this monazite and the models of atomic arrangements of Ce (for CePO4) along the [010] and [100] direction, respectively. The kelly green spheres correspond to Ce atoms. (e,f) The intensity profiles of atomic clomuns from the green rectangular box and red rectangular box, which are shown in ().
Minerals 10 00504 g005
Figure 6. (a) The STEM-HAADF image of the monazite (the same FIB foil with that in Figure 5c) with some distrored lattices existed. The lattice distortions were encircled by Burgers circuit (red dashed line). The inset () illustrated the enlarged Burgers vector that was marked with a yellow arrow in the Burgers circuit (the ruler in was overlooked). (b) Inverse fast Fourier transform image of the area given by the box. The edge dislocations marked with the black ⊥ sign are clearly visible.
Minerals 10 00504 g006
Figure 7. The normalized intensity mapping of STEM-HAADF images (as shown in Figure 5c,d) along the [010] (a) and [100] (b) directions, respectively. The normalized intensity mapping with different colors reflects the relative concentration of radiogenic Pb and Th in each column. The average value of brightness is set to be 1.0 (green, as shown in the mapping and color bar). Blue-to-white with a value of 0.85 represents the distribution of rare earth elements (REEs) where Pb and Th is poor. Red-yellow with a value of 1.15 represents the distribution of Pb-rich and Th-rich in the column.
Minerals 10 00504 g007
Table 1. Binding energies (eV) of Pb 4f for RW-1 monazite, PbO, Pb3O4, and PbO2.
B.E. (eV) 1Chip1Chip2PbOPb3O4PbO2
Pb 4f7/2138.16138.04138.0137.4137.3
Pb 4f5/2143.02142.9142.9142.2142.1
1 B.E. = Binding energy. The Binding energies of Pb 4f in PbO, Pb3O4, and PbO2 were from references.

