Article

Liberation Characteristics of Ta–Sn Ores from Penouta, NW Spain

1
Departament d’Enginyeria Minera, Industrial i TIC, Universitat Politècnica de Catalunya Barcelona Tech, Av. Bases de Manresa 61-63, 08242 Manresa, Spain
2
Petroleum Department, Duhok Polytechnic University, 61 Zakho Road, Mazi Qr 1006, Duhok 42001, Iraq
3
Departament de Mineralogia, Petrologia i Geologia Aplicada, Universitat de Barcelona, Carrer Martí i Franquès, s/n, 08028 Barcelona, Spain
4
Department of Geology, University of Salamanca, Plaza de los Caídos s/n, 37008 Salamanca, Spain
5
Strategic Minerals Spain, S.L., P Recoletos, 37, 28004 Madrid, Spain
*
Author to whom correspondence should be addressed.
Minerals 2020, 10(6), 509; https://doi.org/10.3390/min10060509
Submission received: 8 May 2020 / Revised: 25 May 2020 / Accepted: 27 May 2020 / Published: 31 May 2020
(This article belongs to the Special Issue Mineral Liberation)

Abstract

:
The strategic importance of tantalum and its scarcity in Europe makes its recovery from low grade deposits and tailings interesting. In Penouta, the contents of Ta and Sn in old tailings from an Sn mine are of economic interest. Due to the relatively low grade of Ta of around 100 ppm, a detailed study of the mineralogy and liberation conditions is necessary. In this study, the mineralogy and the liberation characteristics of Sn and Ta ores of the Penouta tailings were investigated and compared with the current leucogranite outcropping ores. The characterization was conducted through X-ray diffraction, scanning electron microscopy, and electron microprobe. In addition, automated mineralogy techniques were used to determine the mineral associations and liberation characteristics of ore minerals. The grade of the leucogranite outcropping was found to be about 80 ppm for Ta and 400 ppm for Sn, and in the tailings used for the liberation study, the concentrations of Ta and Sn were about 100 ppm Ta and 500 ppm Sn, respectively. In both, the leucogranite outcropping and tailings, the major minerals found were quartz, albite, K-feldspar, and white mica. Ore minerals identified were columbite-group minerals (CGM), microlite, and cassiterite. The majority of CGM examined were associated with cassiterite, quartz, and muscovite particle compositions and cassiterite was mainly associated with CGM, quartz, and muscovite. The liberation size was 180 µm for CGM.

1. Introduction

The modern economy is highly dependent on specific raw materials, and this dependency is expected to increase in the near future. Tantalum and niobium have become essential metals for today’s society due to their high-tech applications, high supply risk, and limited substitutability. Tantalum has a high resistance to corrosion, a refractory character, a high density, a high dielectric strength, and a high level of hardness, melting point, chemical stability, and biocompatibility [1]. These properties make this metal suitable for use in multiple high-technology applications as well as in other areas such capacitors, chemical equipment, hard-metal tooling, and alloys [2]. The main use of tantalum is to make capacitors, but it is also increasingly being used in automotive electronics, mobile phones, personal computers and wireless devices, cutting tools, and in surgery [3,4].
Niobium shares many mechanical and chemical properties with tantalum [5] and can replace tantalum in most of its applications, but, in general, it has lower benefits [6,7]. Ceramics, aluminium, and niobium also can replace tantalum in capacitors [8,9]. In the case of niobium, as it has a lower dielectric capacity, the capacitor will have larger dimensions.
While the supply of crude oil and gas has raised great concerns for a long time, in the last decade, access to metals and minerals has received attention from the European Union (EU), where about 30 million jobs are directly reliant on access to raw materials [10]. The need for raw materials is huge and crucial for the sake of European industries and their associated jobs and economy, as well as for the rest of the world [9,11].
In the EU, the raw materials selected as critical are those with a higher supply risk and level of economic importance. The fact that many of these materials are currently only extracted in a few countries, with China being the leading supplier as well as consumer of several important raw materials, increases the risks of supply shortages and supply vulnerability along the value chain.
In addition, supply restrictions are not only due to factors in the source countries; all members of the supply chain have an influence on the supply conditions and price volatility. Moreover, mine production of minerals and metals relies on large scale investment projects, which can take many years to be implemented, and, therefore, cannot react quickly to short term changes in demand, or are vulnerable to market manipulations by established suppliers trying to hamper emergent mining operations [12]. The demand for Nb and Ta is higher than that of the supply [5]. Nb has been declared a critical metal for the European Union due to its economic importance along with its limited supply, because a single country, Brazil, produces more than 90% of the world total supply [13,14]. Tantalum was not included in the list of critical raw materials in 2014, [14] but it was incorporated in 2017.
Other countries, such as the United States of America, Australia, and Russia also have a raw materials classification based on similar parameters [15,16]. The USA uses supply risk, production growth and market dynamics [17]. Although the list of minerals included varies based on the country’s characteristics, similarly to the EU list, tantalum is included in the critical materials lists.
The Strategic Implementation Plan of the EU developed several projects to improve the primary and secondary supply, substitution, and material efficiency in the framework of the research and innovation programme Horizon 2020 for 2014 to 2020 [18]. A project on optimization technologies for the crushing and separation of tungsten and tantalum minerals (OptimOre) was one of them. The main goal of this project was to optimize the processing of tantalum and tungsten to favour the exploitation of low-grade deposits from the EU.
Tantalum and niobium occur together in nature. Most of the tantalum comes from the exploitation of pegmatites and rare metal granites [19]. However, the shortage of primary Ta deposits makes it necessary to look for other sources of this metal, such as the tailings of some old tin mines, which may have a high potential for Ta. The reprocessing of tailings represents an alternative collection method for many of the scarce metals associated with a supply risk [20]. This is the case for Penouta, where the ancient tailings are being exploited for tin and tantalum. In these cases, there is the advantage that the material has already been extracted from the mine and that its particle size has already been partially reduced, which represents significant savings in the comminution process. However, in most cases, these sources contain low-grade materials, so that in order to be economically profitable it is necessary to optimize their processing.
Tantalum occurs in a variety of oxide minerals, usually as solid solution with niobium linked with other elements distributed in complex textures, which necessitate a detailed mineralogical characterization of the ores to achieve optimal design of the mineral processing operations. The mineral composition, textures, mineral liberation, and associations must be determined to maximize the grade and the ore recovery. The mineral liberation size is a key parameter in determining the comminution operations.
These represent the main cost of the processing, due to the energy consumption [21] and in low-grade ores, accurate determination selection of this can make the operation economically viable [22]. In addition, the liberation characteristics are essential for selecting the mineral processing method [23].
The automated mineralogy techniques are invaluable in achieving these goals, allowing the quantification of the composition, texture, and the liberation degree of ores [24,25,26,27,28,29]. These techniques should be used together with other complementary techniques to obtain the correct mineralogical data [30]. The use of electron microprobe data may be necessary for minerals with complex distributions of elements [31], such as Nb and Ta-bearing oxide minerals.
The aim of this work is to determine the liberation characteristics of Penouta tailings and compare the results with those from outcroppings of the leucogranite low-grade tantalum ore. These results can be used to optimize the mineral processing operations. Liberation modelling is used to predict the distribution of valuable minerals in particles and to determine the optimal output size for a comminution unit.
Some of the ore liberation characteristics from the Penouta leucogranite have been reported previously using quantitative mineralogy TESCAN [32,33] as well as less expensive techniques, such as scanning electron microscopy (SEM) and X-ray powder diffraction (XRD) [34]. Gravity separation studies focussed in a particular sector of the Penouta tailings have been reported [35], as well as studies on metallurgical treatments [36]. These studies, along with the previous studies on crushing [37] and milling [32,38], provide a broad understanding of the Penouta ore processing. However, in this study, the mineralogical characteristics of ore materials, tailings, and leucogranite outcropping are characterized. Moreover, although tin is the main ore derived from Penouta, in previous liberation and comminution studies, only tantalum ore was studied; in the present study, the liberation characteristics of cassiterite are also provided. The liberation of these ores is analysed in detail, and a comparison between tailings and the outcropping rock is presented. With this characterization, the variability of this material is reported, which should be taken into account for processing issues.

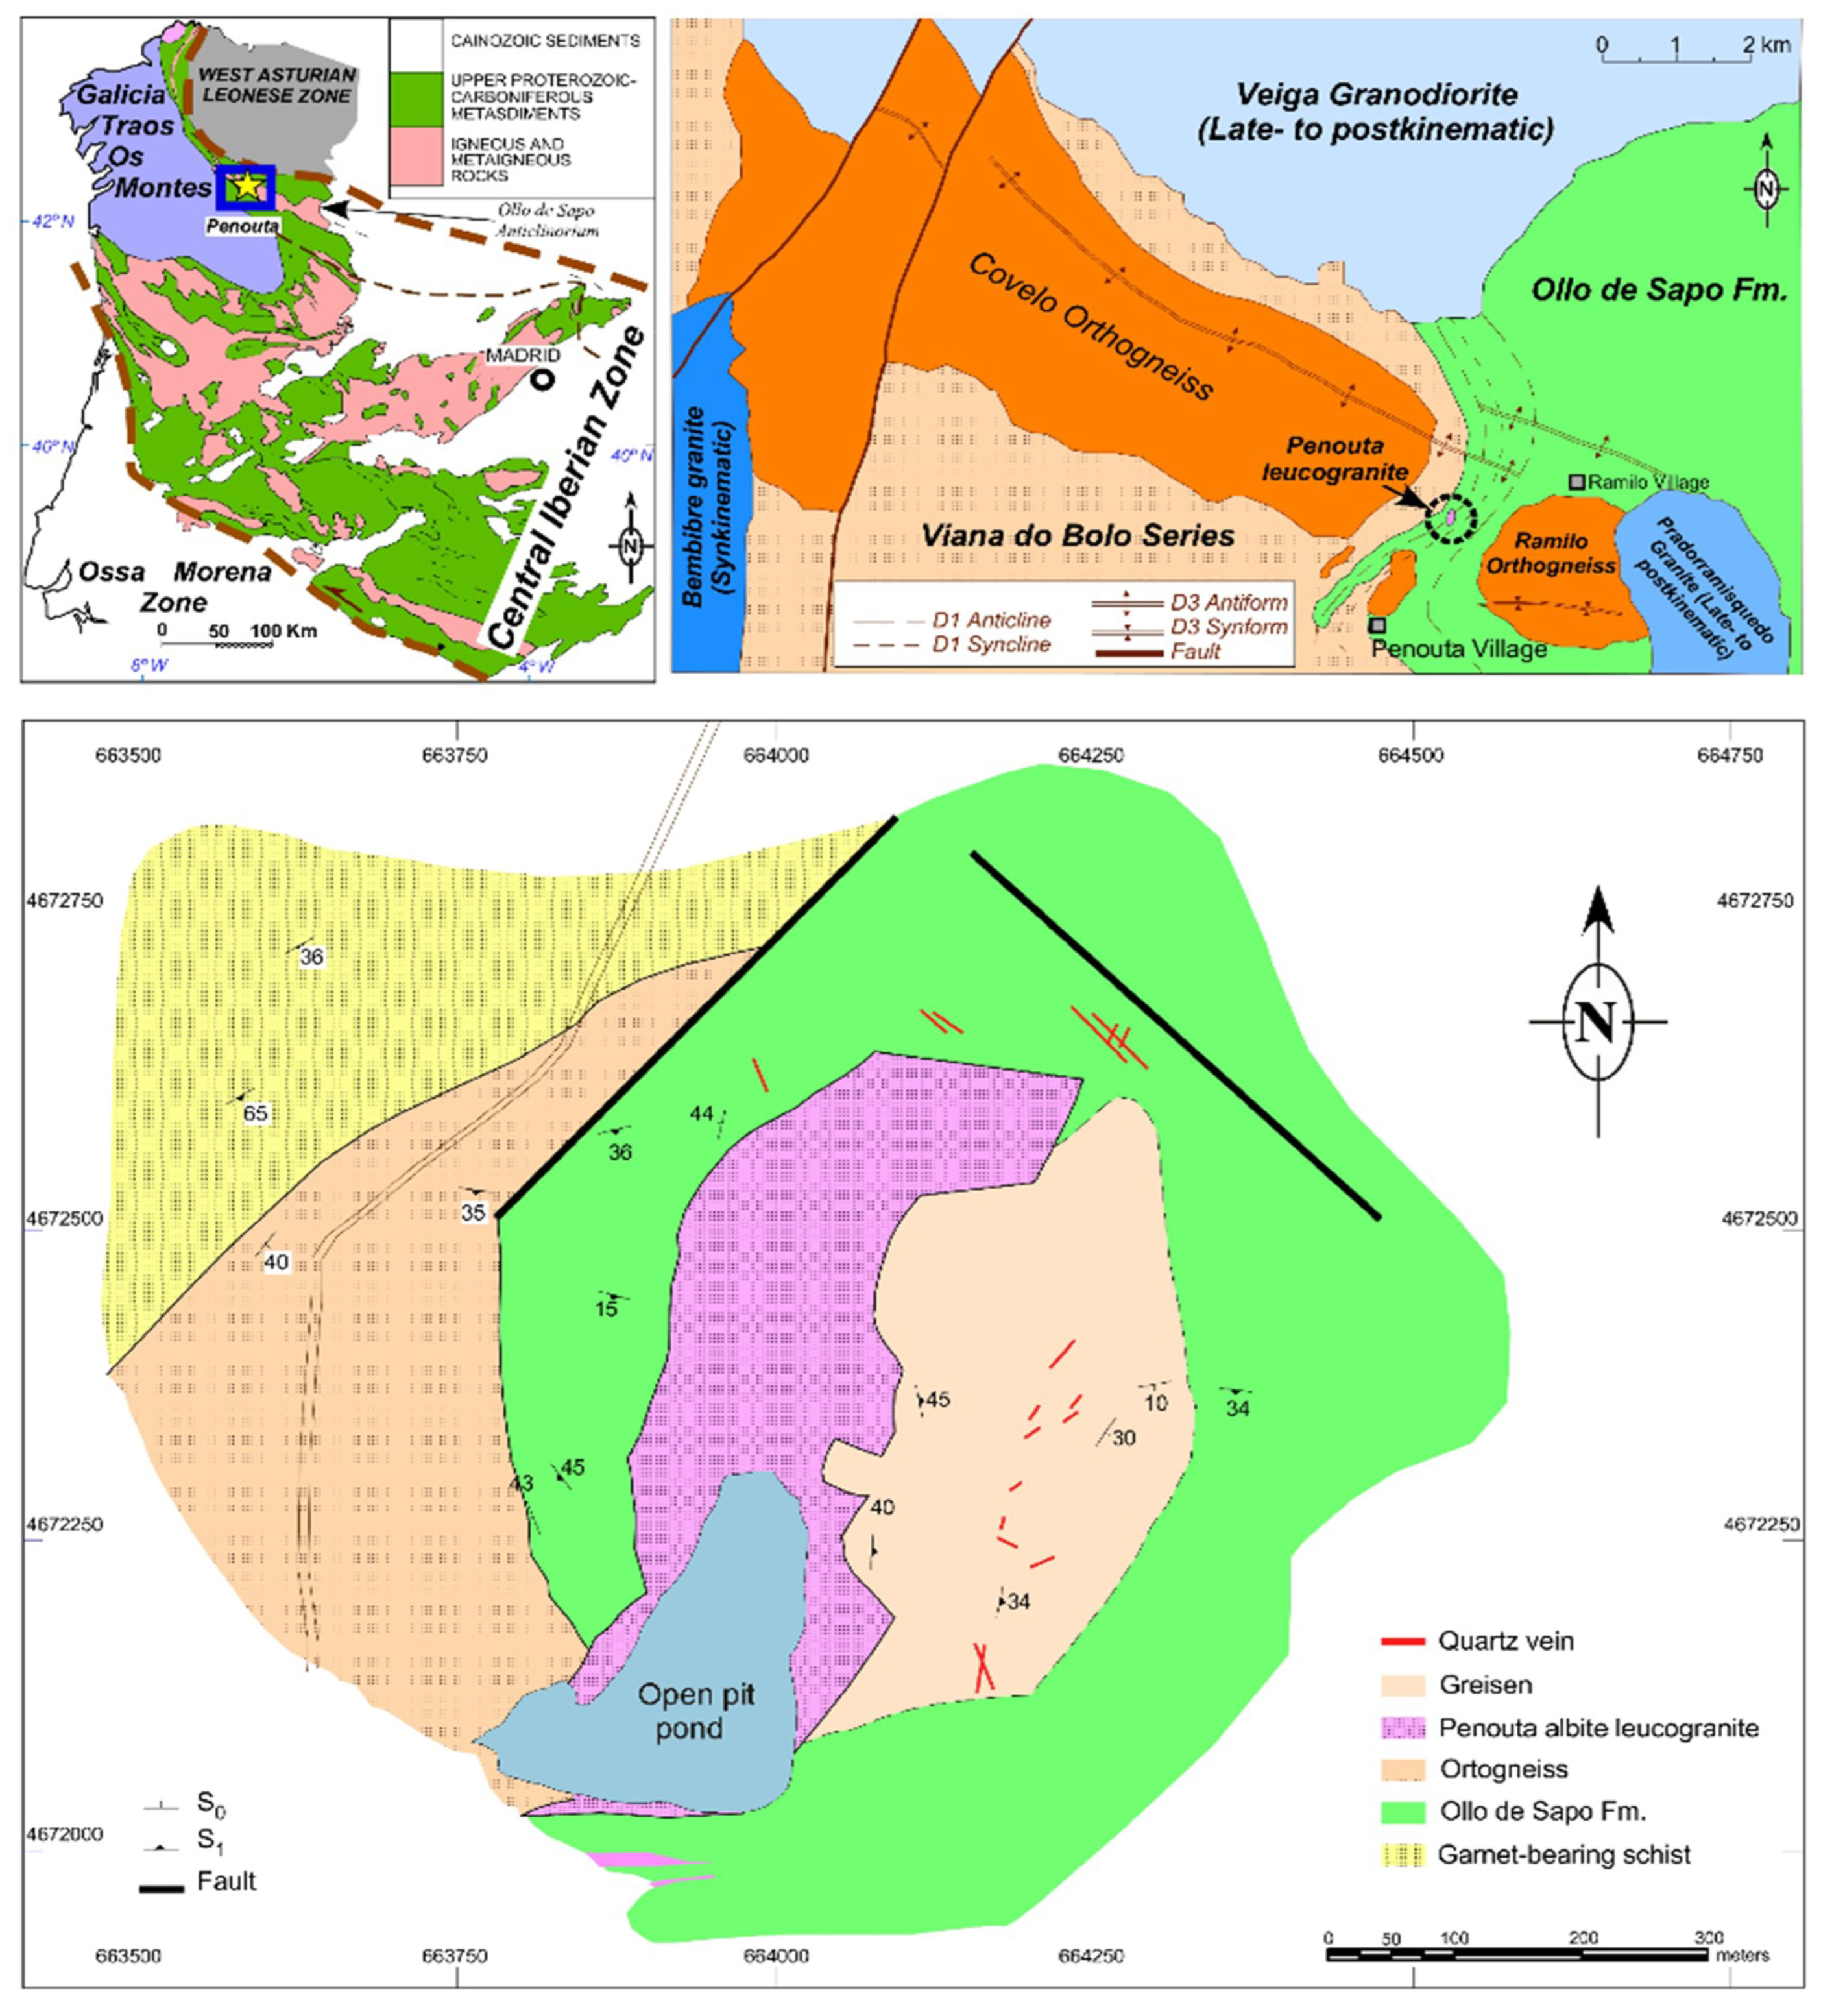
2. Geological Setting and Mining History

The Penouta ore deposit is located in Penouta village, a municipality of Viana do Bolo, Ourense, Galicia in the northeast of Spain. The Penouta deposit mainly consists of a peraluminous, highly evolved rare-metal leucogranite with disseminated mineralization of cassiterite and columbite-tantalite. These ores are especially abundant in the apical zone, where pervasive kaolinitization of the granite and the presence of flat-lying sheets of aplo-pegmatite are not uncommon [39]. These centimetric- to metric-thick structures are nearly horizontal tabular bodies composed of different proportions of the main constituents (e.g., quartz-mica layers, albite layers, and quartz layers) sandwiched rhythmically. A poorly developed Sn-rich greisen occurs in the granite-metamorphic boundary, and quartz veins with locally developed greisen selvages are mostly hosted in metamorphic rocks (Figure 1). Quartz veins form dyke swarms composed of sigmoidal, lenticular and tabular in shape, hyaline to milky quartz with cassiterite mineralization. The veins are mainly composed of quartz, although barite, sphalerite, galena, chalcopyrite, pyrite, and bismuthinite occur in minor amounts.
The Penouta leucogranite is below the metamorphic pile consisting of gneisses of the Ollo de Sapo Formation and mica-schists corresponding to the Viana do Bolo series (Figure 1). In Penouta, an Sn–Ta greisen-type ore deposit, mineralization mainly occurs in the leucogranite body. The shape and size of this granite body have been constrained due to a drilling program carried out in 2013, revealing a sub horizontal lens-like body with the bottom of the granite at depth of 250 m. The granite body is elongated in the north–south direction (Figure 1), with a maximum length of 1100 m and maximum width of 700 m. A similar shape has been reported in other rare-metal leucogranites of central-western of Spain, exemplified by the Sn–Ta–Nb albite granites from Golpejas and Fuentes de Oñoro [40,41]. Fluxing elements present in these melts seems to be the clue to explain the shape of these granite bodies, as these elements reduce the viscosity of the melt, favouring the lateral extension [42]. The Penouta leucogranite was emplaced in the hinge of a D1 Variscan antiform (Figure 1), an ideal scenario where the uprising magma has sufficient room where it can be emplaced, avoiding the “room problem”. The study of outcrops and drill core sections supports the notion that the granite intruded following planar anisotropies, namely the regional foliation observed in the country rock [42].
Differences in colour in hand specimens occur from the top to the bottom of the granite. The greenish colour becomes more intense at the bottom. Granites of the apical zone are always leucocratic (whitish) and fine-grained in hand specimens. This is the part of the granite where albite and kaolinite are more abundant, providing a whitish colour to different extents, depending on its abundance. In more detail, when the albite and kaolinite contents decrease or disappear, the granite displays a pale green colour, mainly due to the colour of the white mica, which changes to a darker green at the deepest levels, where the white mica also exhibits a darker green colour. No relevant changes in grain size occur throughout the whole granite body, but the finest-grained granite occurs at the apical zone, specifically in places where it contacts the country rock, which can be interpreted as chilled margins. Gradational margins or contacts with different magma pulses were not observed. The granite margin is the only place with a significant orientation of plagioclase laths (concordant with the country rock), although without deformation, suggesting that a flow of low viscosity magma occurs adjacent to the wall of country rock. The lack of orientation in the rest of the granite is interpreted as being the result of rapid magma emplacement followed by crystallization after magma flow, as has also been reported in flood basalts (e.g., [43]).
The disseminated mineralization of cassiterite and columbite-tantalite in the Penouta granite suggests a passive crystallisation of the magma, in contrast with the B-bearing magmas that provides evidence of explosive processes such as the formation of breccia pipes and stockworks [44]. The columbite-tantalite and cassiterite occur from the bottom to the top of the granite body with the highest abundances in the apical zone, although cassiterite is also occasionally enriched in medium levels. Upwards Ta and Ta/Nb enrichment is explained by fractional crystallization processes, with a crucial role played by muscovite as the mineral phase that is able to fractionate Nb relative to Ta [42]. The strong Sn enrichment of the central part of granite has been related to the occurrence of fluid saturation/degassing in the lower margin as a consequence of cooling and crystallization of mostly anhydrous minerals (i.e., second boiling). The affinity of Sn for fluids could have yielded a Sn-rich fluid/vapour that migrated up to the central part of the granite sheet (hotter melt), where it was probably reabsorbed, enriching the melt in tin and explaining the magmatic signature of cassiterite [42]. It seems probable that there is a second fluid-saturated zone in the upper margin of the granite body, resulting in the formation of pegmo-aplites and greisen [42]. This exsolved fluid has also been recently attributed as the cause of the formation of sponge-like textures and strong depletions in Nb in the columbite-group minerals (CGM) [45].
There are no ages available for the Penouta granite, and only a relative time frame can be inferred from structural and contact relationships. The lack of foliation and significant internal deformation in this body are typical features of a late- to post-Variscan character. Similar structural features have also been reported in other granitic rocks in the area, such as Veiga and Pradorramisquedo plutons, which have been related to a strike-slip shear zone [46], this stage being similar in age (c. 308 Ma, [47] to other Sn-bearing granites recently dated in the Central Iberian Zone (e.g., Logrosán Sn–(W) ore deposit, 308 ± 1 Ma, [48]).
The Penouta leucogranite was exploited extensively during the 1970s to obtain mainly cassiterite and columbite-tantalite as by-products, although mining and processing methods were not efficient so great amounts of these minerals were progressively accumulated in the tailing ponds with similar grades as those of the original leucogranite [49,50].
As a consequence, nowadays, Strategic Minerals Spain is exploiting these old tailing ponds and dumps (12 Mt, average grades of 428 ppm for Sn and 35 ppm for Ta), mainly focusing on the Balsa Grande tailing, which contains about 4.8 Mt of residue with 387 ppm of Sn and 48 ppm of Ta, and the Balsa Pequeña (also called Balsa de la Abeja) tailing, with around 0.22 Mt of residue with 421 ppm of Sn and 42 ppm of Ta [51]. It is also investigating the re-opening of the original deposit whose measured and indicated resources are reported to be 95.5 Mt, with an average grade of 77 ppm of Ta and 443 ppm Sn [39].

3. Materials and Methods
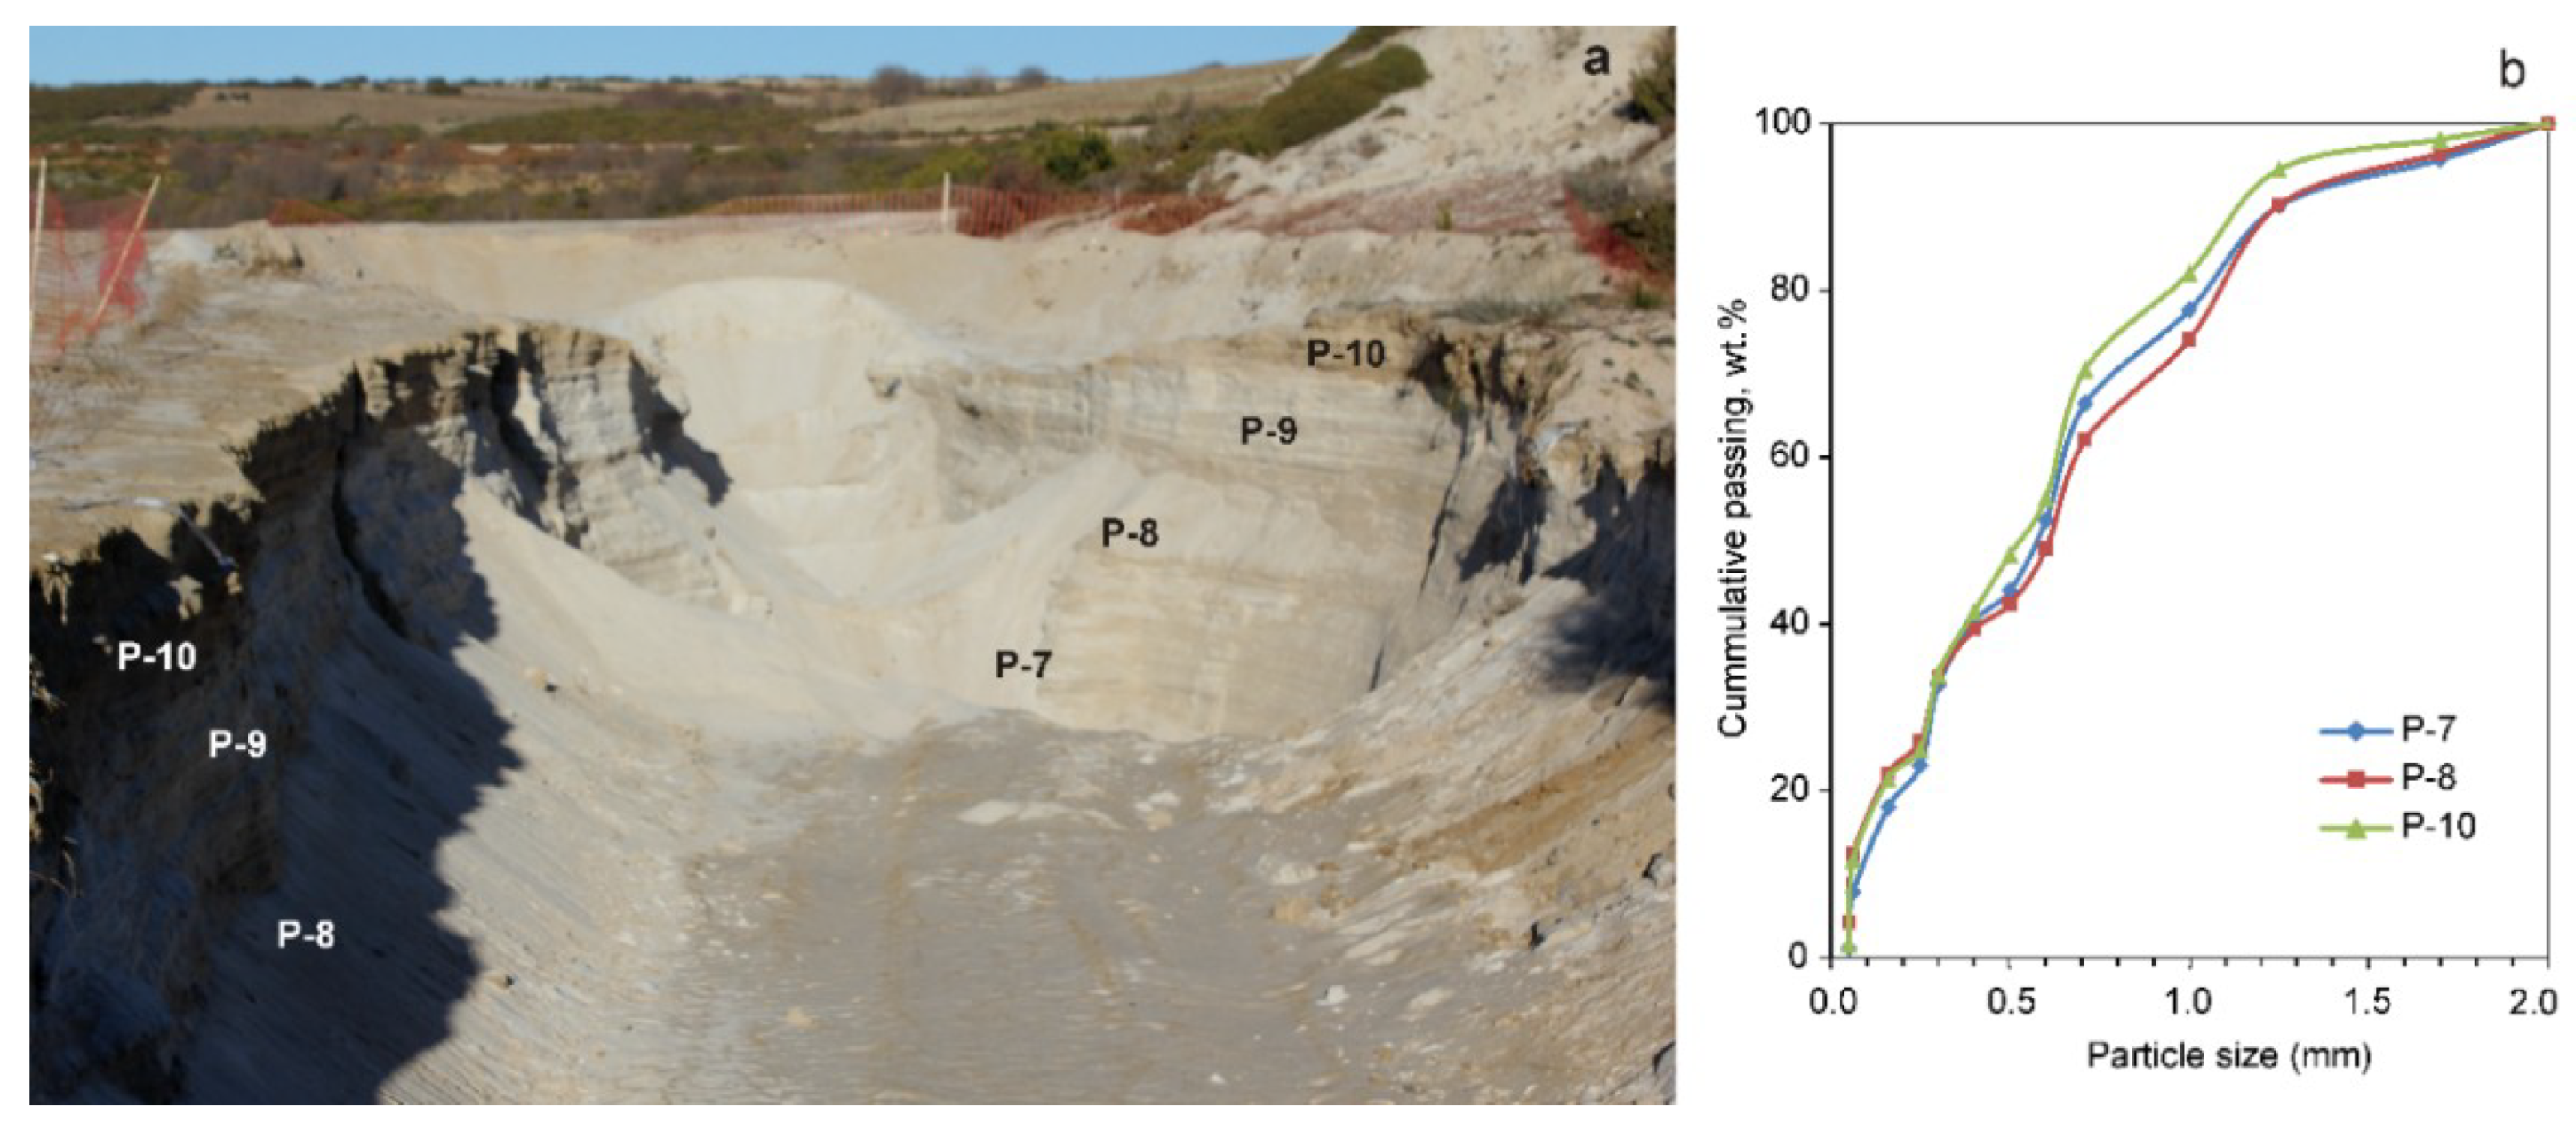
3.1. Materials

Several samples were obtained from the Balsa Grande and Balsa Pequeña tailings and from the leucogranite outcropping ore of Penouta (Figure 2).
Due to the low Ta concentration in the Penouta deposit, it had to be concentrated in order to obtain a rich flow with a high number of ore particles to be studied. Fourteen kilograms of each sample were used. First, the sample was ground into particles less than 1 mm in size. Then, it was sieved and, thereafter, fed into a laboratory scale model Wilfley–Holman shaking table, with a feed rate of 75 kg/h and a stoke rate of 280 rpm. The screened samples under 212 µm were used throughout the separation in two stages. The sample with sizes between 212 and 106 µm and the sample under 106 µm were treated separately in the shaking table. Finally, to observe the liberation characteristics of a highly concentrated material, the Penouta leucogranite sample was reprocessed several times in the shaking table. The chemical composition and mineralogy were determined by XRD in all samples. Two representative samples of the Penouta ore were used for the mineral liberation analysis (MLA), one composite sample from the ancient open pit and other from the Balsa Grande tailing (Figure 3).

3.2. Analytical Methods

Whole rock samples were analysed at Activation Laboratories (ACTLABS). Major elements were analysed by X-ray fluorescence (XRF), and minor elements were measured using ICP-MS from the acid digestion of fused glass beads. Fusion was obtained using lithium or sodium borate. The range was 0.1–2500 ppm for Ta and 0.2–2500 ppm for Nb.
Mineralogical characterisation was carried out by X-ray powder diffraction (XRD), optical microscopy, and scanning electron microscopy. The XRD spectra were measured from powdered samples in a Bragg-Brentano PANAnalytical X’Pert Diffractometer (graphite monochromator, automatic gap, Kα-radiation of Cu at λ = 1.54061 Å, powered at 45 kV–40 mA, and a scanning range of 4°–100° with a 0.017°2θ step scan and a measuring time of 50 s). Identification and Rietveld semiquantitative evaluation of phases was conducted with PANanalytical X’Pert HighScore software (PANalytical, Almelo, The Netherlands).
Scanning electron microscopy with energy-dispersive spectral analysis (SEM–EDS) was used in back-scattered electron mode (BSE). A JEOL JXA-8230 (JEOL, Tokio, Japan) Electron microprobe was used to determine the chemistry of minerals. Details on the analytical conditions are provided in [32,45].
The structural formula of CGM was calculated on the basis of 24 oxygens and 12 cations per unit cell (apfu). The number of cations was fixed by a method of charge balance by conversion of a portion of Fe2+ to Fe3+. The structural formulas of tapiolite and cassiterite were calculated on the basis of 6 and 4 oxygens, respectively. The structural formula of microlite was calculated on the basis of a fully occupied B site (Nb + Ta + W + Ti = 2 apfu) and the concentration of OH was calculated by charge-balancing to the anion total of 7 [52].
Automated mineral liberation analysis (MLA) was used to study particle liberation. It was carried out at the University of Tasmania using a FEI MLA650 (FEI, Hillsboro, OR, USA) environmental scanning electron microscope equipped with a Bruker Quantax Esprit 1.9 EDS system with two XFlash 5030 SDD detectors (Bruker, Berlin, Germany). MLA measurements were performed at 20 kV with a 1.5 micron pixel resolution using the XBSE method, which collects a range of BSE images at a specified resolution, segments the images into different mineral grains based on BSE contrast and textural features, and collects a single ED spectrum in the centre of each identified mineral grain. A Mineral Liberation Analysis (MLA) software package v3.1 was used.
The MLA of leucogranite outcropping was carried out at the Helmholtz Institute Freiberg for Resource Technology, Freiberg, Germany, using a FEI Quanta 650F (FEI, Brno, Czech Republic) equipped with two Bruker Quanta X-Flash 5030 EDX detectors and ThermoFisher/FEI’s MLA Suite 3.1.4 (ThermoFisher, Walthan, MA, USA) for automated data acquisition, and using 25 kV and a beam current of 10 nA.

4. Results and Discussion

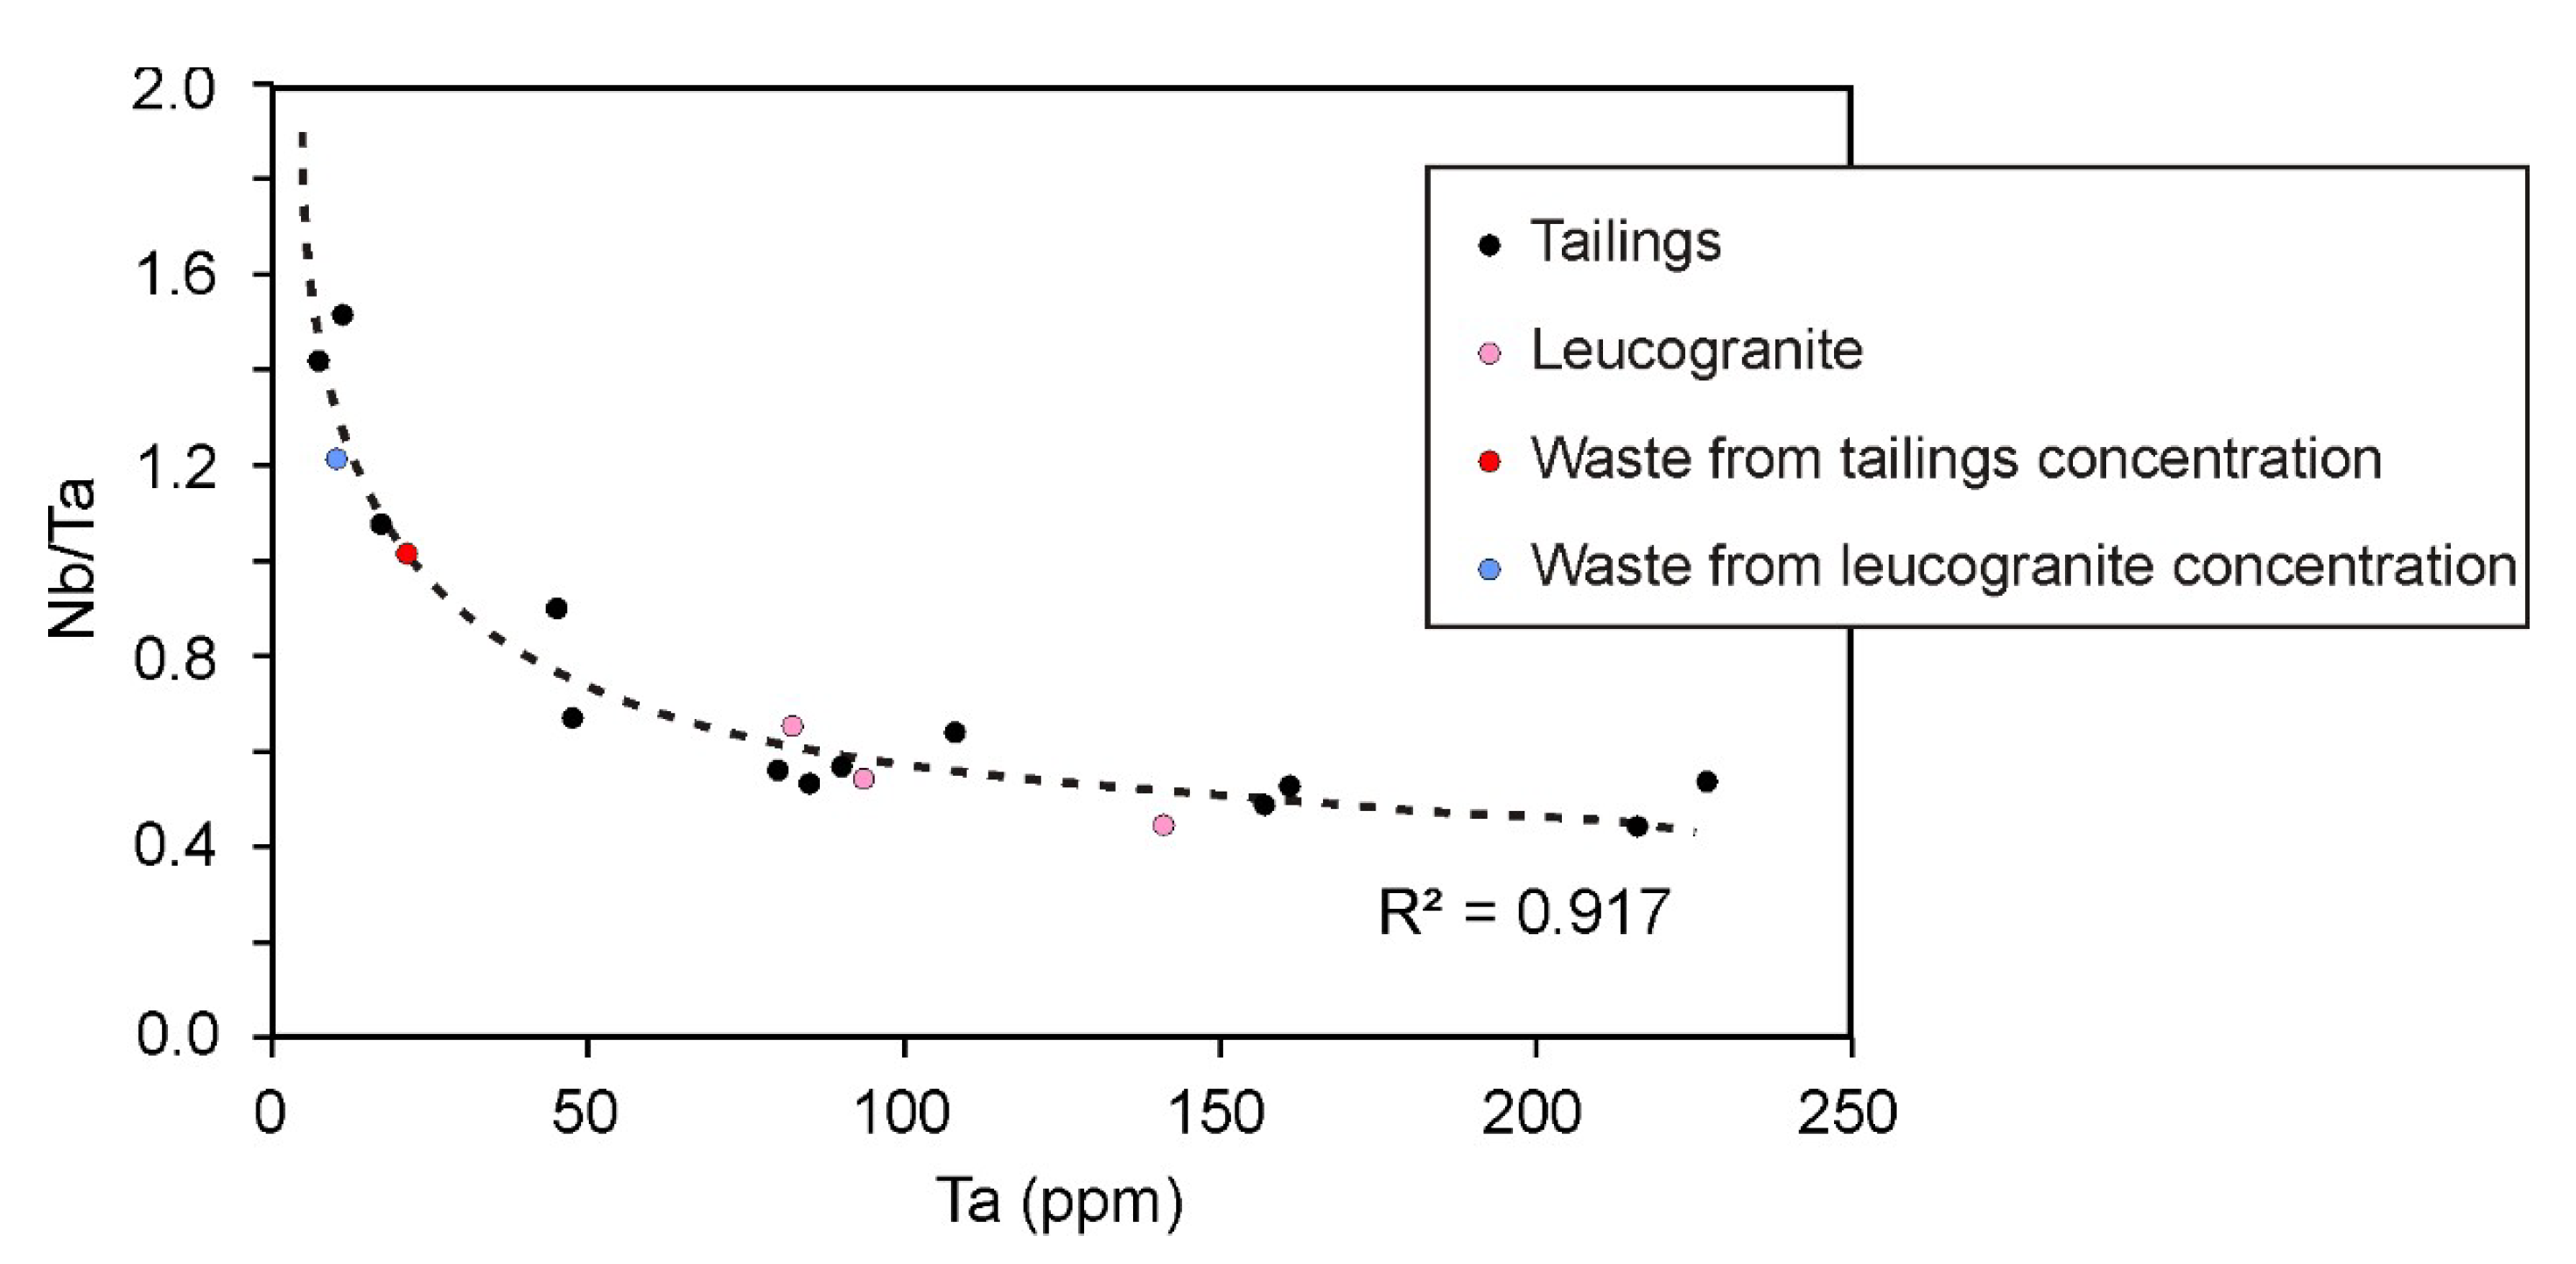
4.1. Chemical Composition

Despite the fact that the tailings came from the processing of the previously exploited Penouta leucogranite, the chemical composition of the Penouta tailings has some differences with respect to the remaining leucogranite ore. Thus, the tailings show considerable variability in their Si and Al contents, as well as higher Fe and Ti contents. Regarding the metals of economic interest, high Sn, Nb, and Ta contents stand out in the tailings, as they are unevenly distributed. Likewise, the contents of U and Th are clearly higher in the tailings than in the leucogranite outcropping (Table 1).
Leucogranite samples from different points along the open pit area show a range from 81 to 140 ppm of Ta and from 50 to 64 ppm of Nb [45]. In the tailings Ta content varies from 40 to 226 ppm, the Nb content varies from 40 to 123 ppm, and the Sn content varies from 186 to 1110 ppm.
The Ta content varies with the particle size as demonstrated in the analyses of the different size fractions. The Nb and Sn contents follow the same trend (Figure 4). The U and Th contents are low in the whole sample but the fine size fractions are highly enriched; thus, they can be concentrated in the Ta concentrate.
The chemical composition of the materials used in the ore concentration and the obtained waste show the efficiency of the concentration process. This was higher in the case of leucogranite outcropping with only 7 ppm of Ta remaining in the final waste. The concentration of Nb did not decrease in the same proportion. In both concentration processes, the wastes contained a quantity of Nb that was even slightly higher than that of Ta (Table 2); however, samples with a greater quantity of Ta than Nb were used. The Nb/Ta ratio varied according to the richness of these oxides: the higher the content of Ta, the lower this ratio will be. This was observed not only for the concentration wastes, but also for the tailing materials and in the original leucogranites (Figure 5).
Regarding the concentration, this is justified by the higher density of Ta-rich minerals compared to Nb-rich materials, which are easier to concentrate by gravimetric methods. Similar results were achieved for the gravity concentration of fine tailings in previous studies [35], in which the higher recovery of tantalum was attributed to larger tantalite particles; however, in this case, no evidence of this size difference was shown.

4.2. Mineralogy Mineral Chemistry

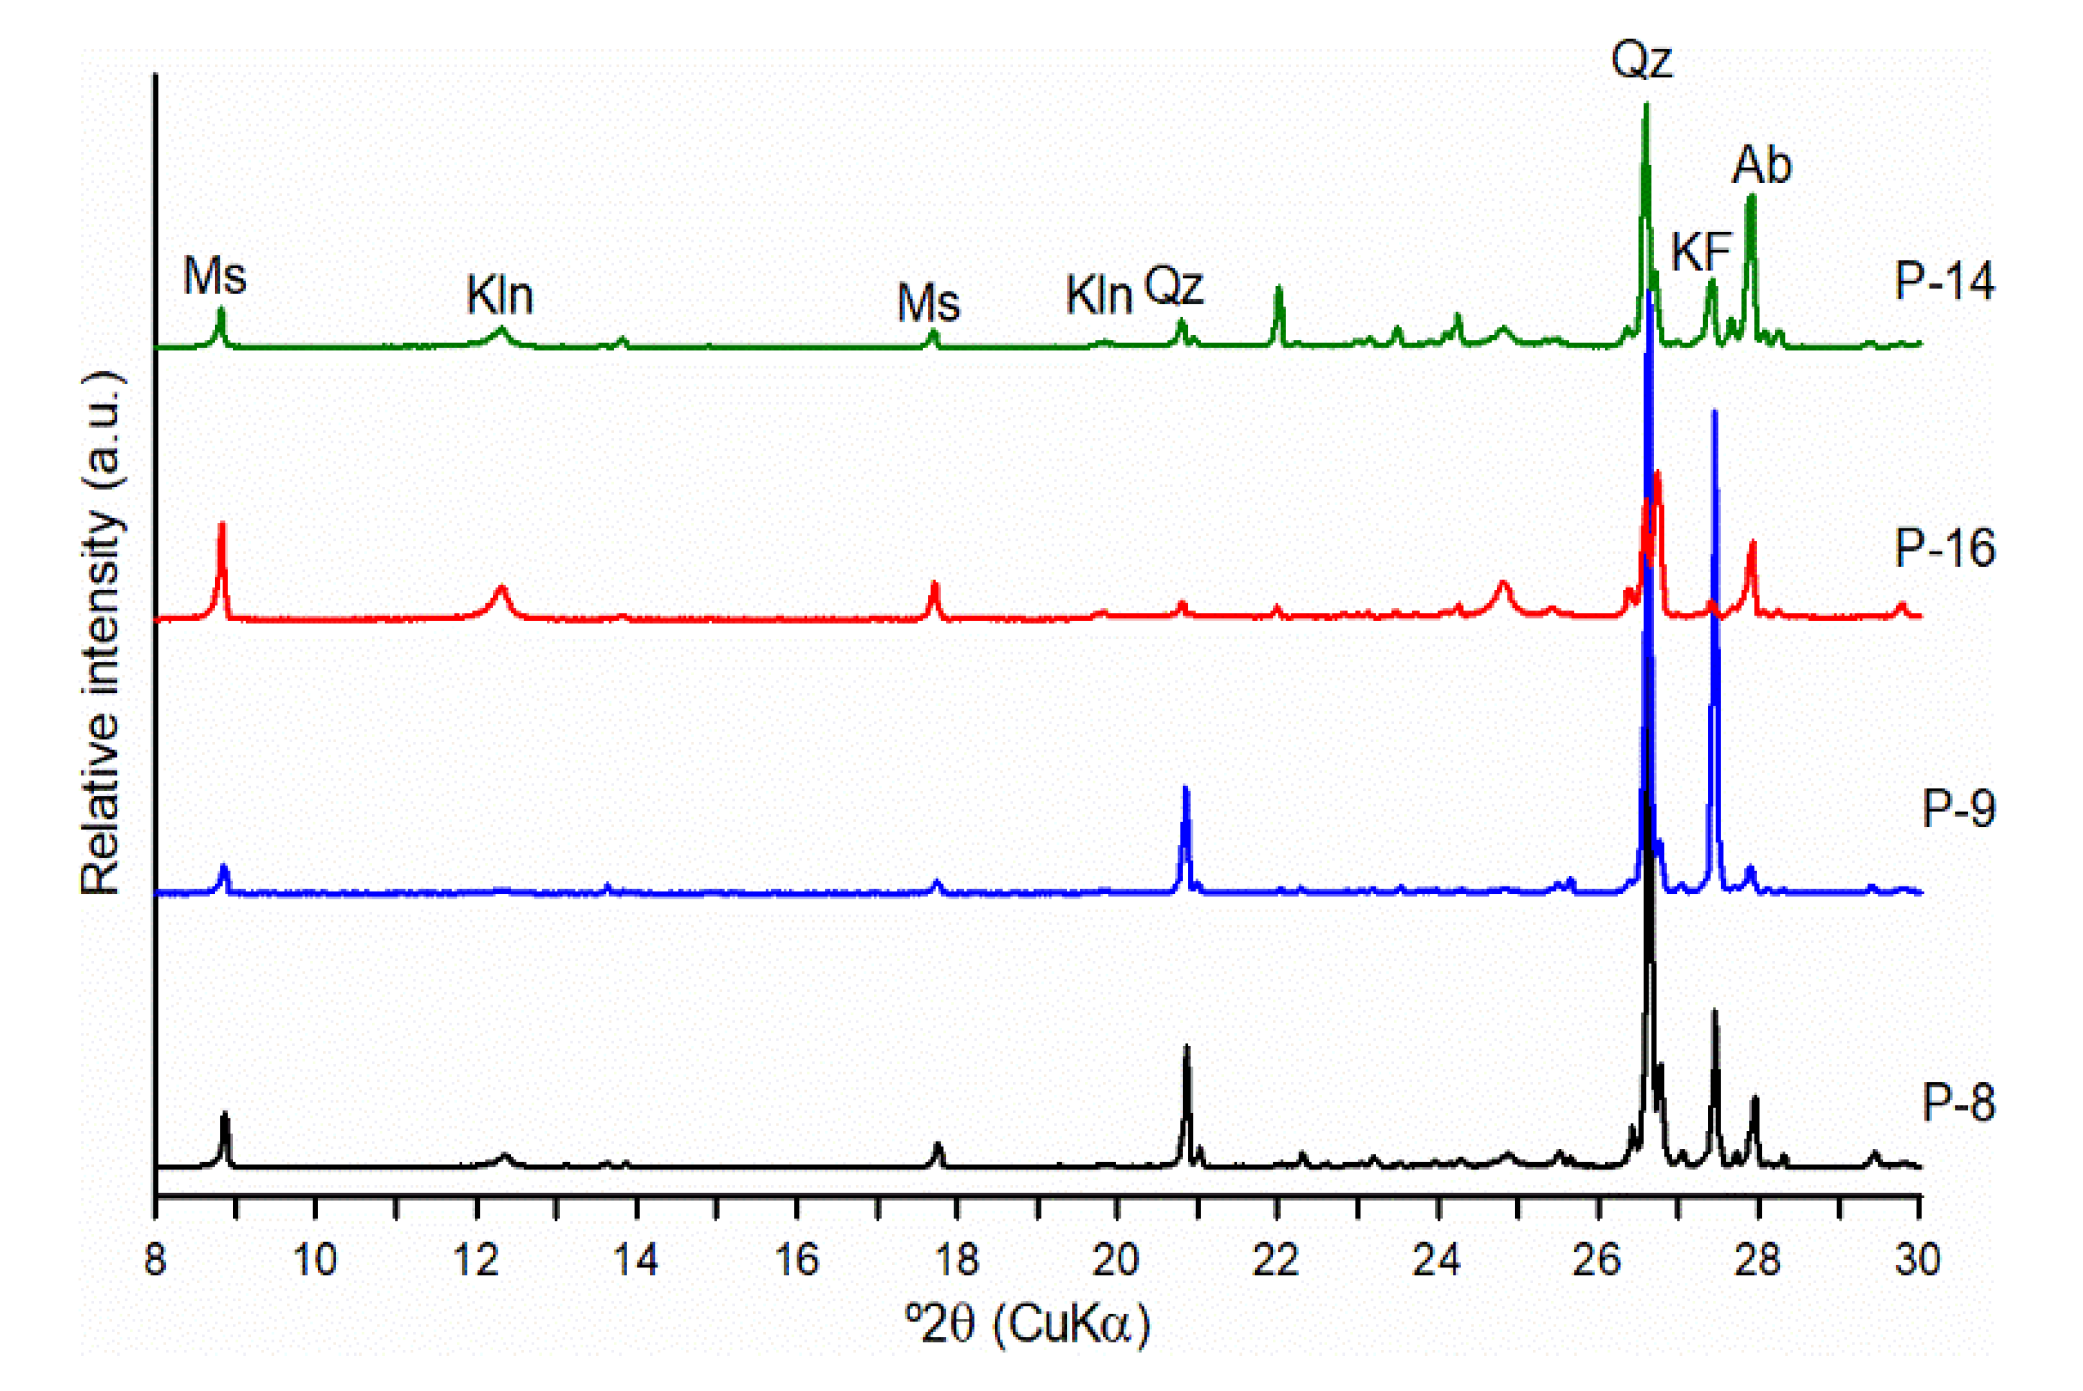
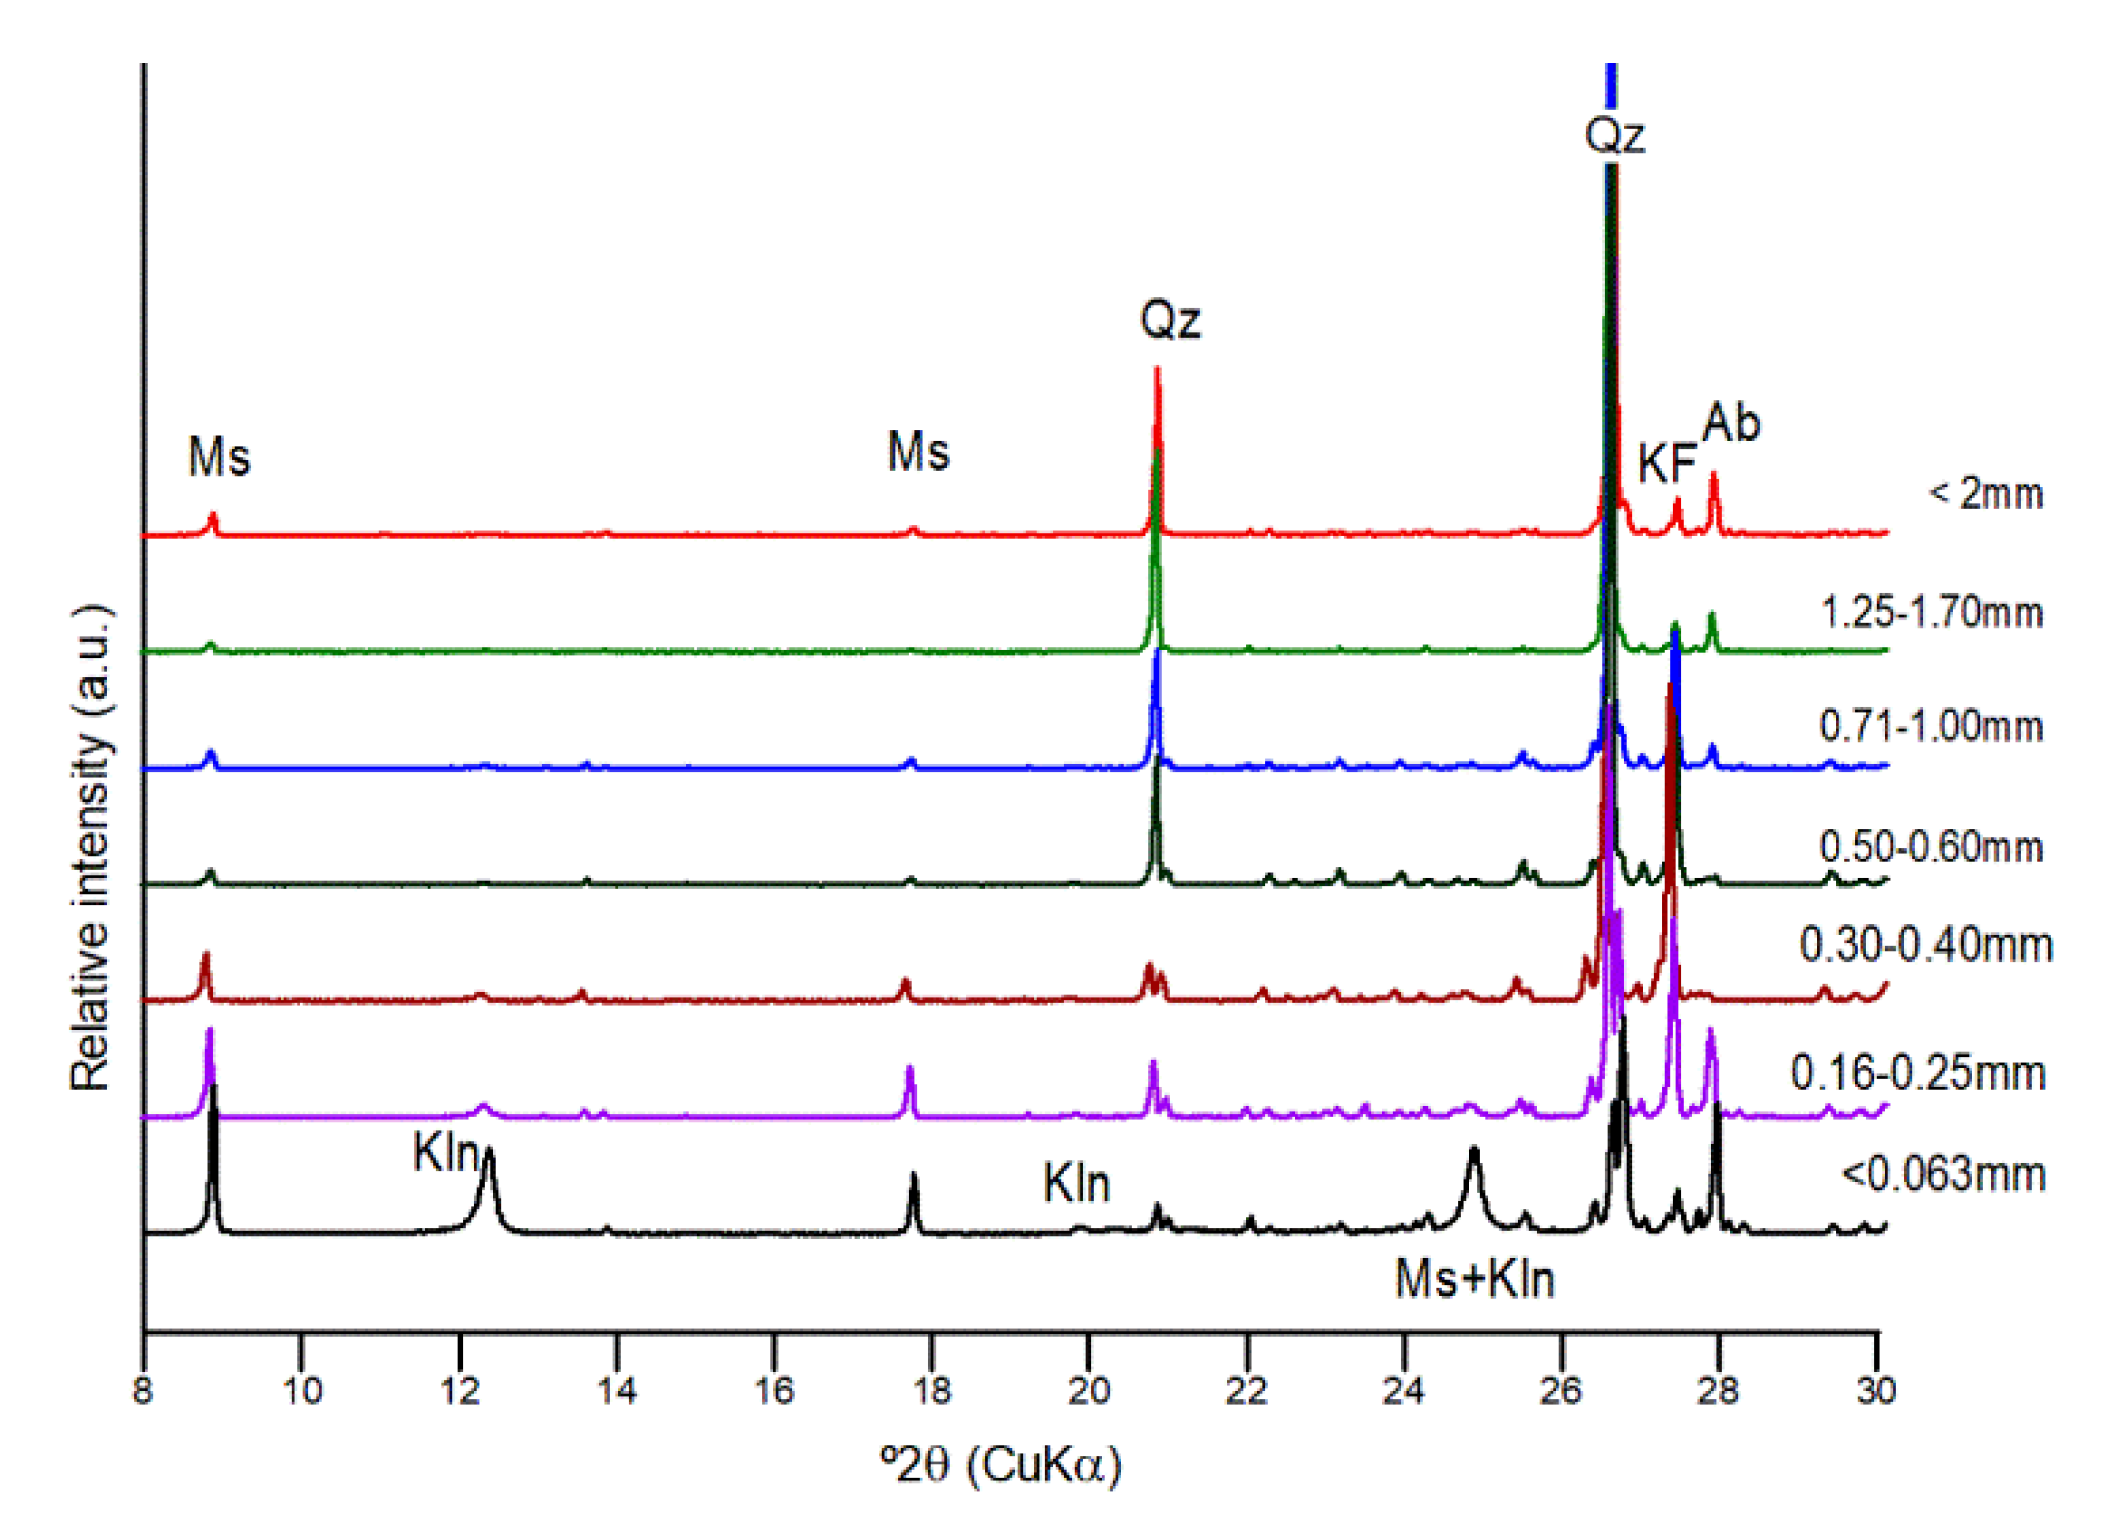
4.2.1. Bulk Mineralogy
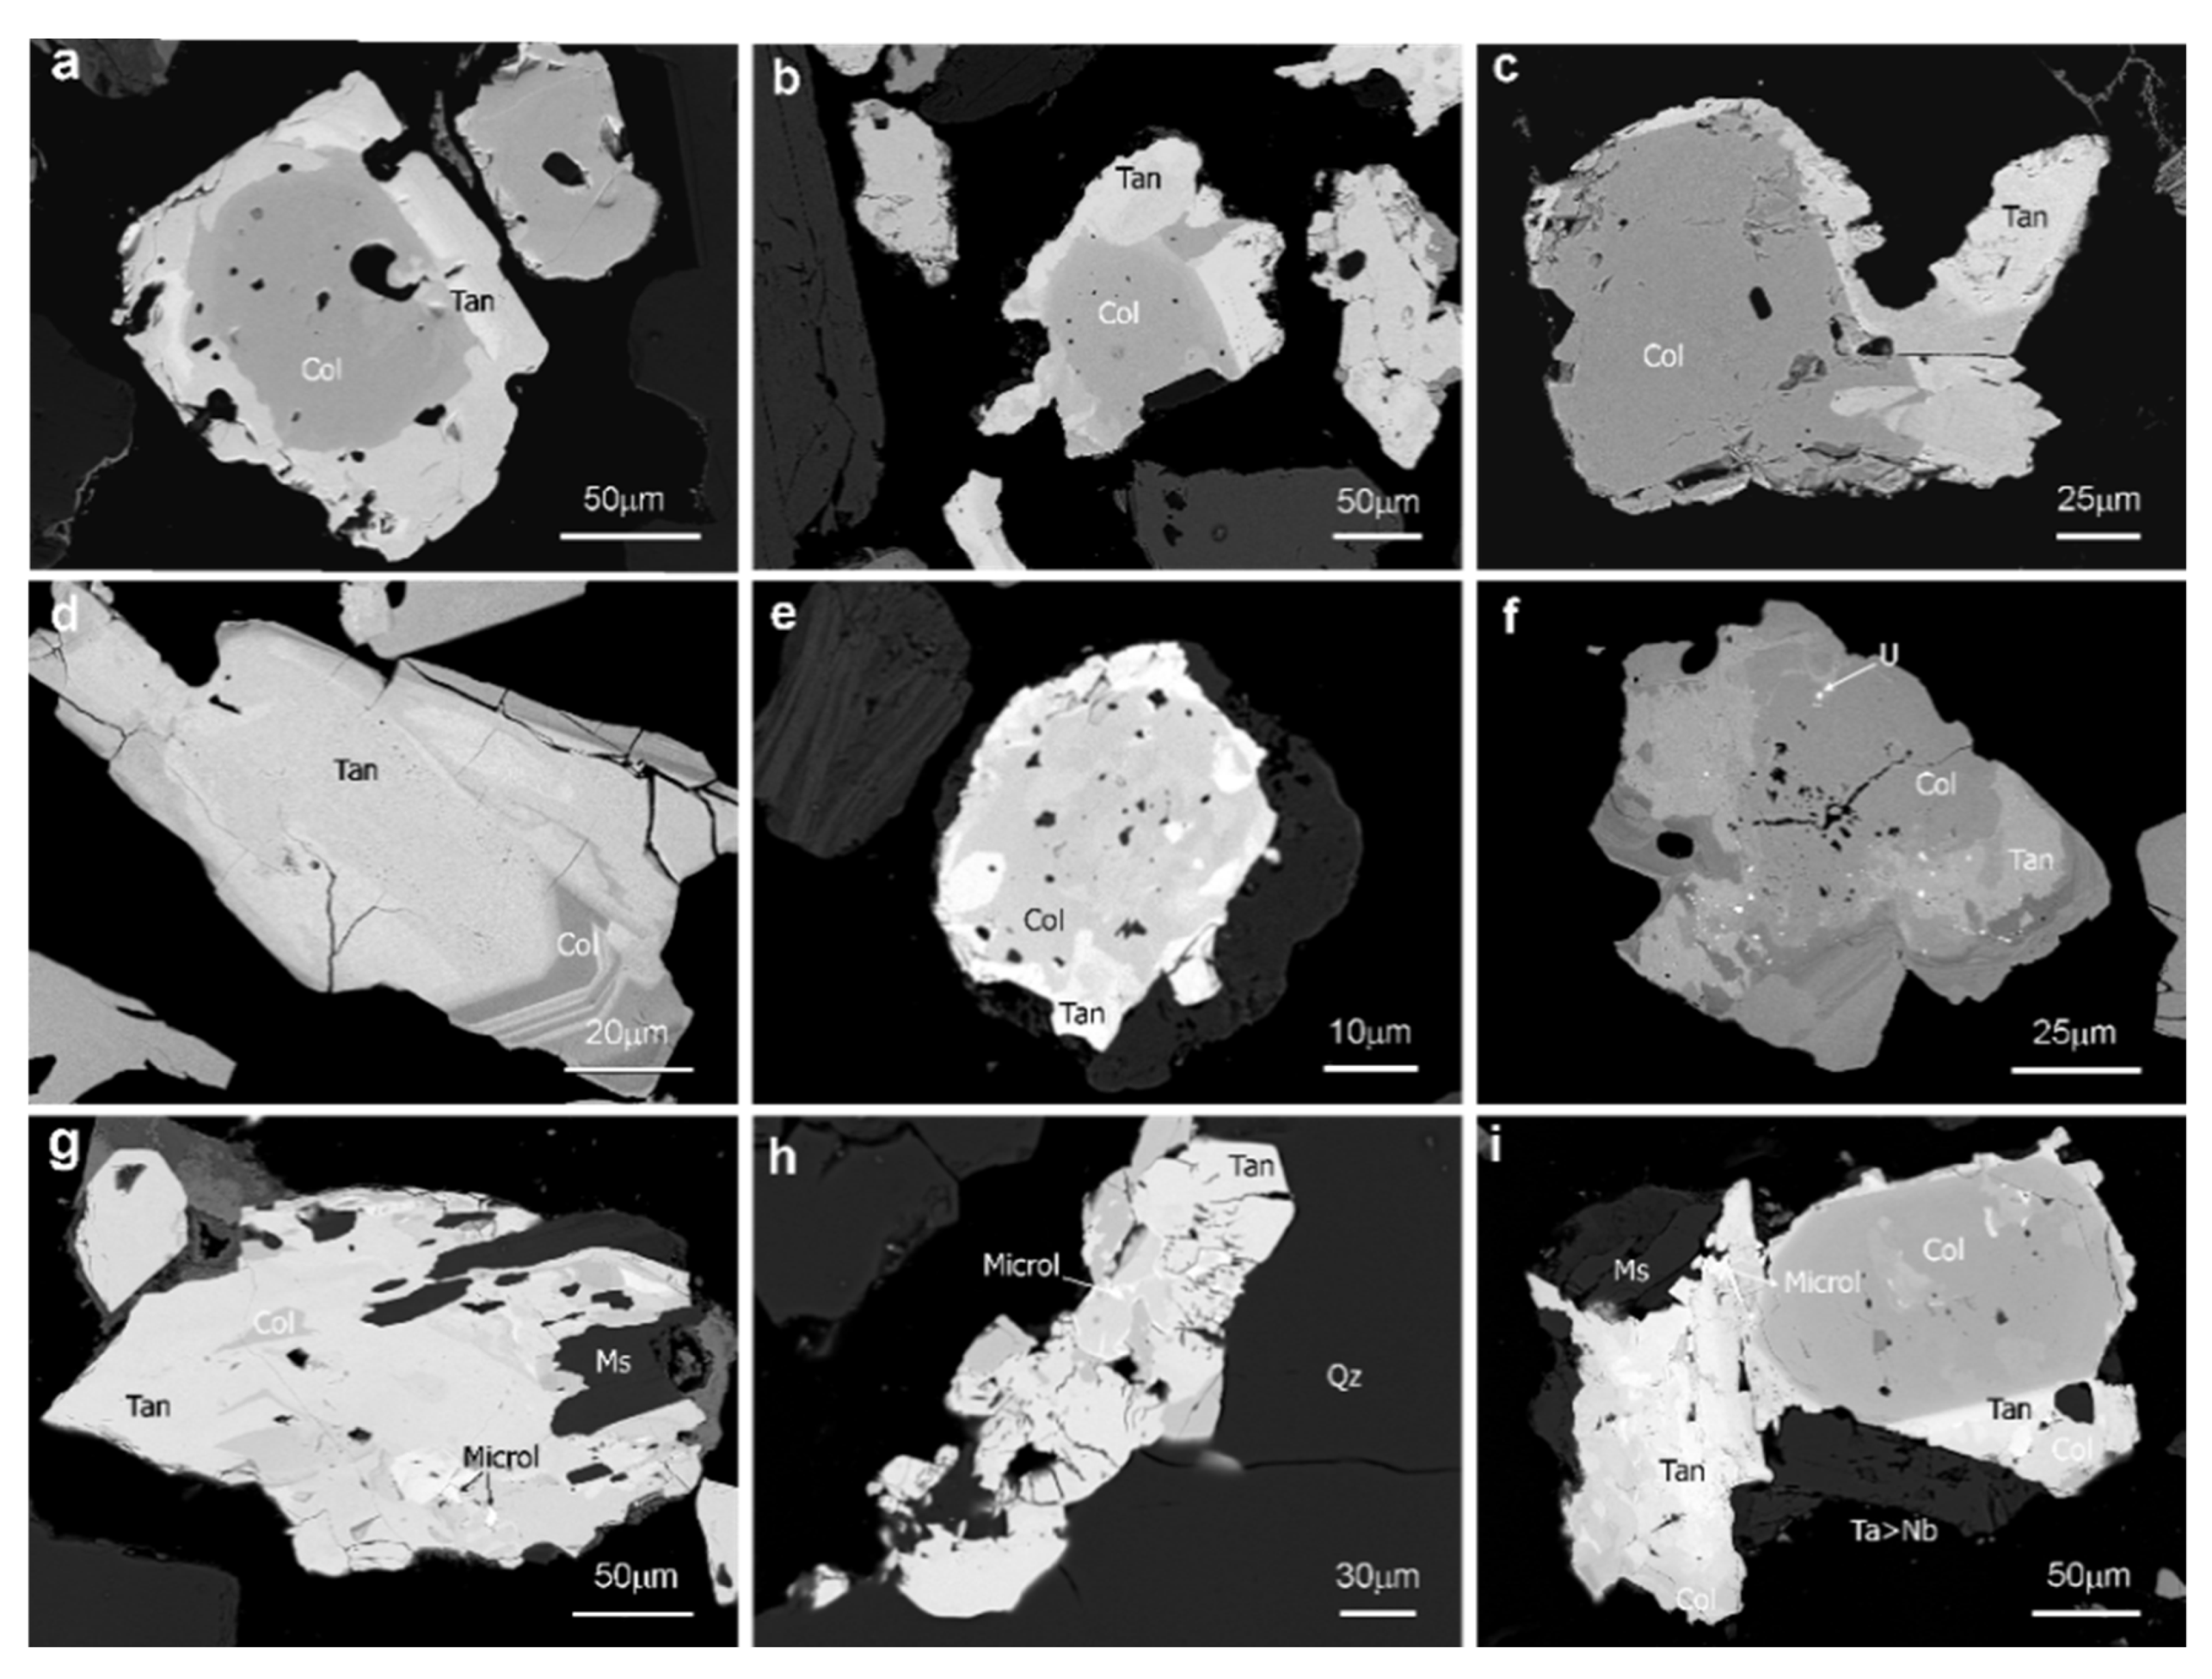
The Ta–Sn ores from Penouta occur as oxides hosted in leucogranite. The leucogranite ore has an inequigranular snowball texture with large grains of quartz, about 1 mm in size, included in a matrix of other grains lower than 0.5 mm in size including quartz, K-feldspar (microcline), albite, and white mica. Locally, kaolinite can be present in large amounts. Minor concentrations of spessartine, tourmaline, zircon, monazite, beryl, cassiterite, CGM, zircon, and uraninite are accessory minerals and were almost ubiquitous. Ta-rich ore minerals occur as crystals, usually smaller than 300 µm in size, free or associated mainly with quartz and muscovite [45]. Other rare accessory minerals are fluorite, microlite, wodginite, tapiolite, and occasionally, sulphide minerals, either in nodules or, more frequently, related to small veins. Sphalerite, galena, arsenopyrite, pyrite, bismuthinite, chalcopyrite, and stannite are the most common sulphides.
Tailings come from previously exploited leucogranite, so, the mineralogy should be similar in both cases. The XRD results show that although the composition was similar in both cases, with quartz, albite, microcline, and muscovite as the major minerals in the leucogranite outcropping; the contents of these minerals hardly vary from one point to another, whereas in the tailings, the oscillations are greater, even at nearby points (Figure 6).
Leucogranite from the tailings showed a distribution of minerals that was largely dependent on the particle size fractions, as observed by the XRD diagrams (Figure 7). Quartz is most abundant in coarse particle fractions, K-feldspar is more abundant in the medium-sized fractions, whereas albite and kaolinite are concentrated in the smallest fractions. The mineral distribution depends on the hardness of the minerals, and the original texture. Quartz has the highest hardness of the major minerals and a significant amount occurs in grains of 1–2 mm. However, albite and kaolinite are composed of thin crystals.

4.2.2. Ore Minerals

A detailed characterization of Nb–Ta oxide minerals from the Penouta leucogranite ore was reported previously [39,45]. In the tailings, the characteristics of the tantalum-bearing minerals are similar to those of the leucogranite outcropping. Additionally, here, the CGM prevails. These present similar textures, with those with a columbite-rich core and a tantalite-rich rim being more abundant (Figure 8a–c), but other textures such as oscillatory and patchy (Figure 8d,e) also occur. Occasionally, small uraninite inclusions appear in these crystals (Figure 8f). A frequent association of CGM with microlite was observed, which usually occurs within or in contact with CGM (Figure 8g–i).
The chemical composition of CGM follows a similar pattern in leucogranite outcropping and tailings, with the most abundant compositions being those that belong to columbite-(Mn) and tantalite-(Mn) (Figure 9). This trend is typical of CGM from granites [53,54,55]. These similarities also occur in the composition of microlite (Figure 9), which is highly variable. Although Ca is the most abundant cation of its site, in some cases, U and Pb can be relatively abundant, especially in the rims of microlite crystals. Wodginite is also present in a minor amount.
Although the tailings have been exploited for cassiterite, this is the most abundant ore mineral that is still contained, occurring as a homogeneous subhedral to anhedral grains, up to a few mm in size. The chemical composition of cassiterite shows a high Ta content, up to 9 wt% of Ta2O5 and a lower content of Nb2O5 [39,45].

4.3. Mineral Liberation Analysis

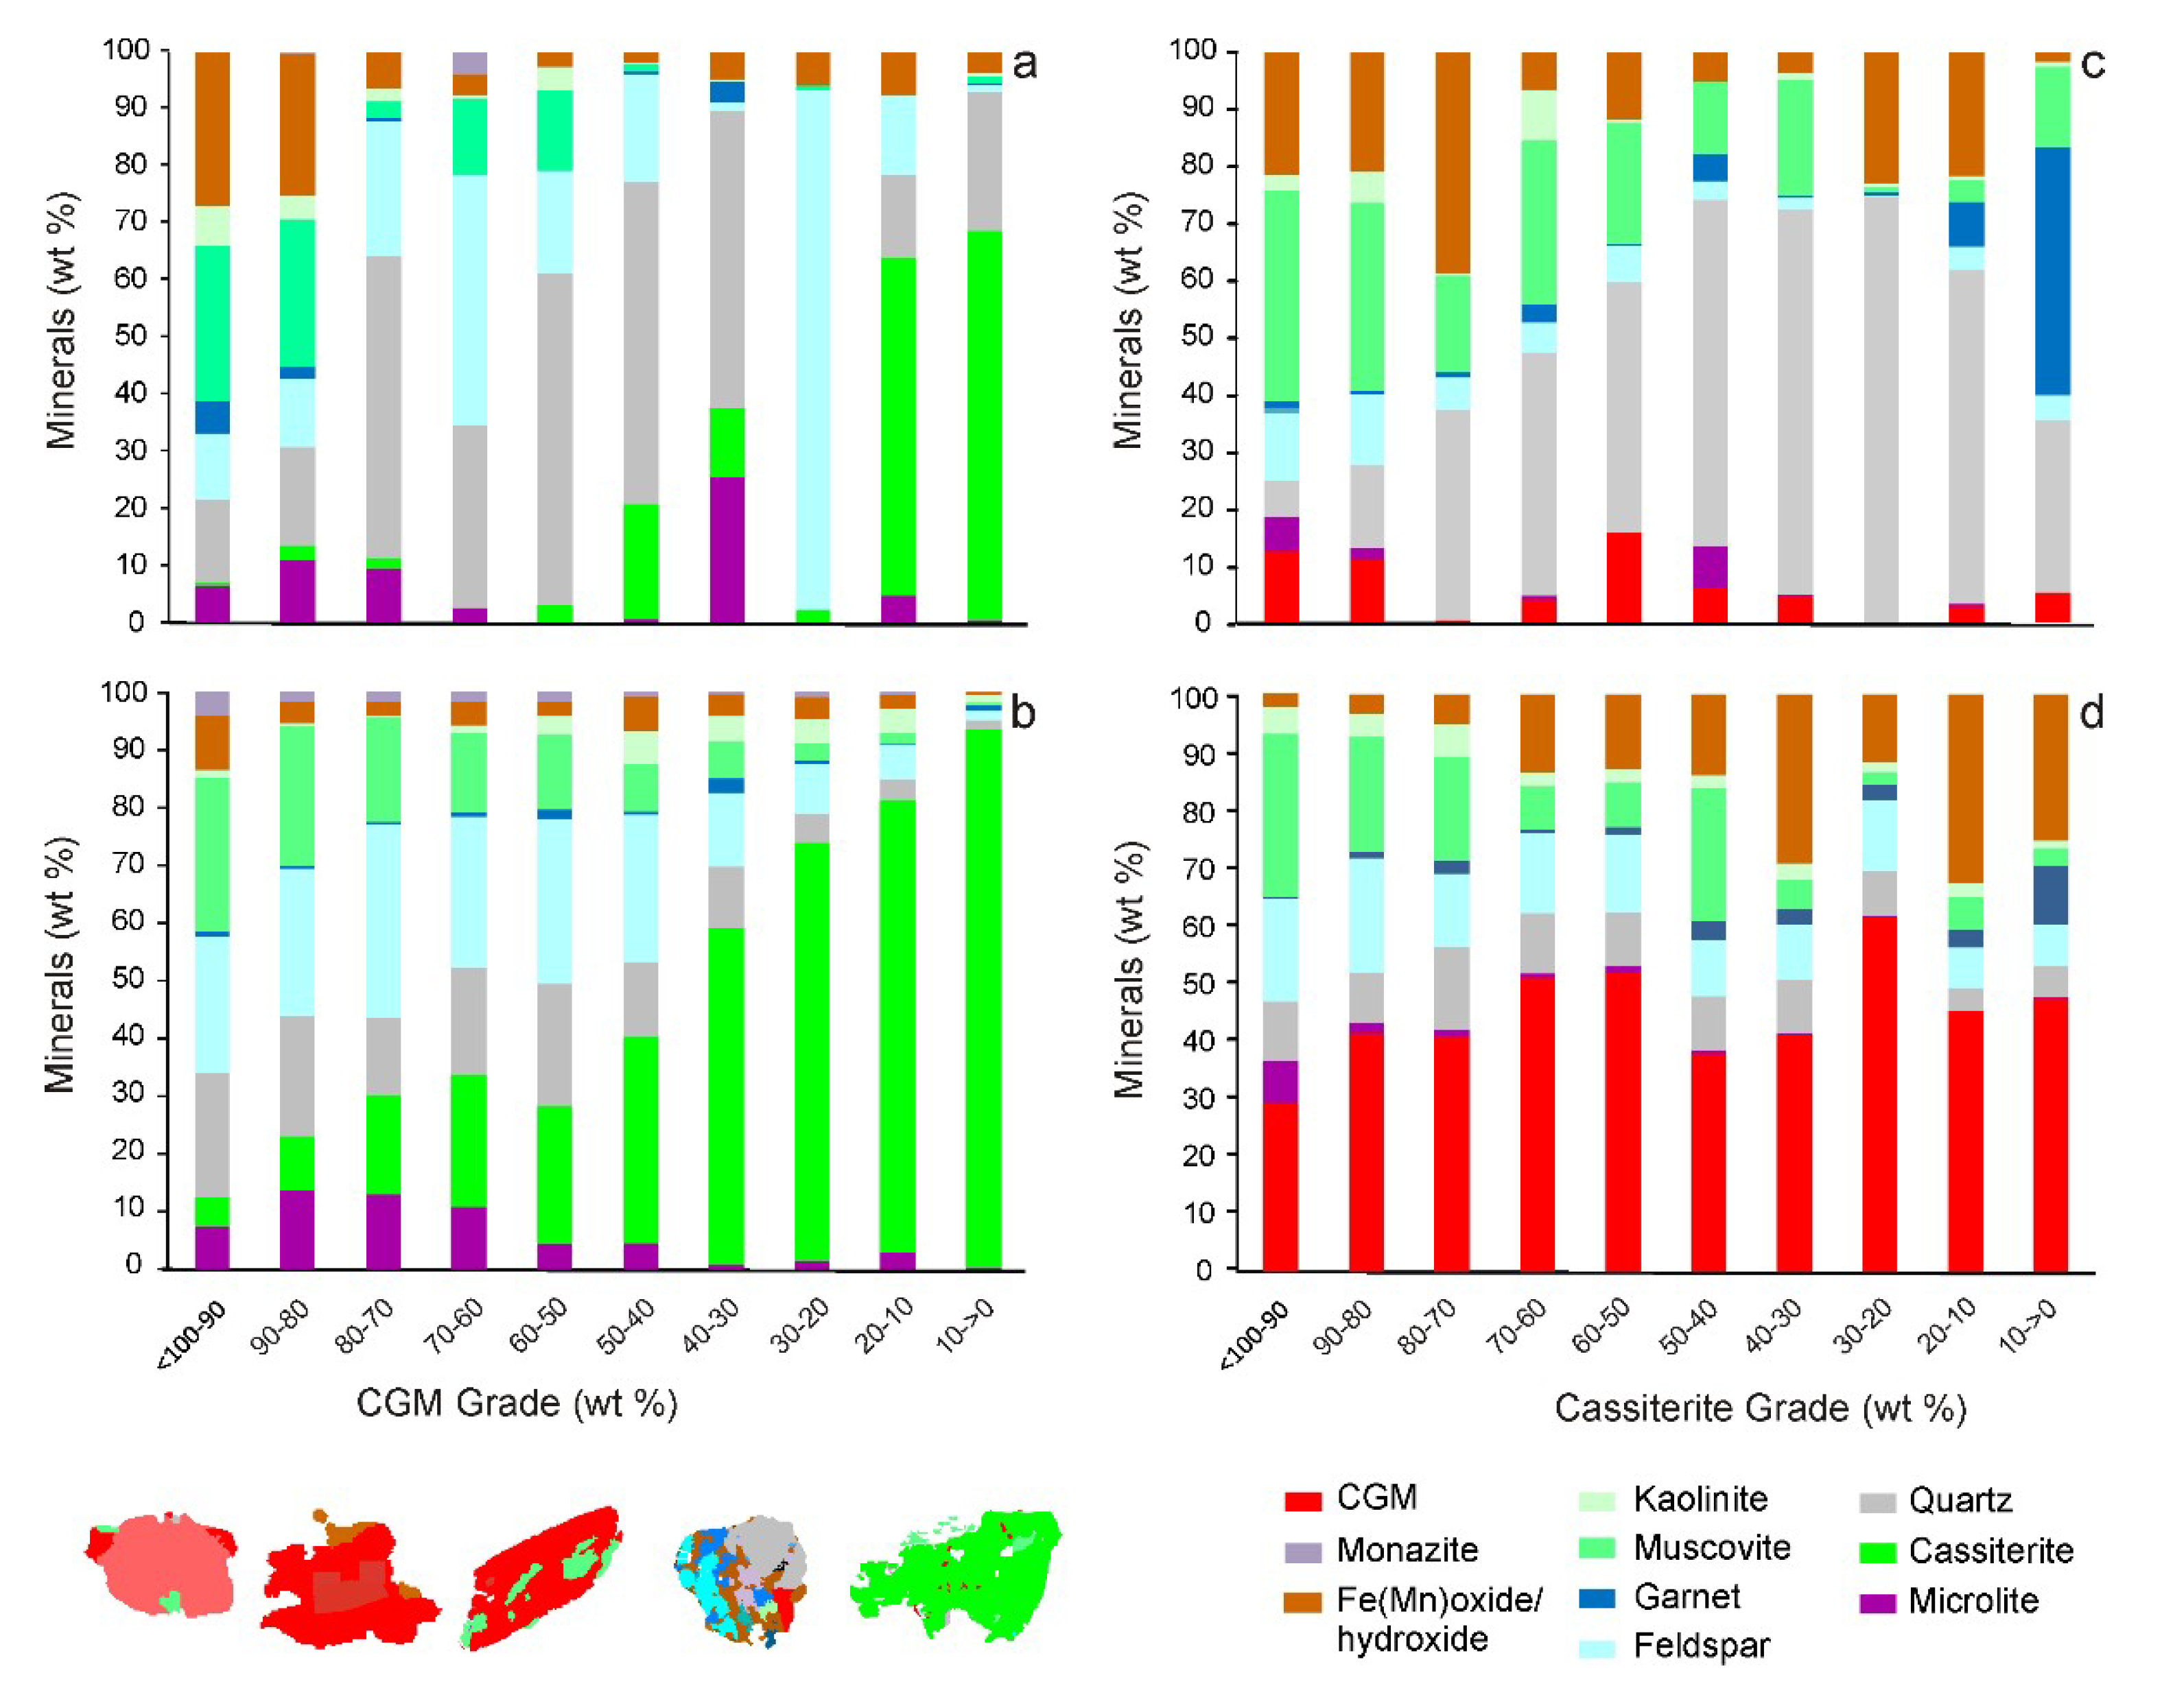
4.3.1. Modal Mineralogy

The MLA provided the characterization of 69,262 particles from the leucogranite outcropping ore concentrate and 23,753 from the tailings concentrate of Penouta. The mineral distribution (Table 3) was mapped for visual appreciation and observation of shapes and texture (Figure 10). Although in the sample of the leucogranite outcropping, the concentration of ores was higher, as evidenced by the higher quartz content in tailings, the comparison between the results of the mineralogy of concentrate material from the open pit and tailings showed that, in both cases, the CGM had a similar morphology, in which columbite partially surrounded by a rim of tantalite predominated.
In the leucogranite, the concentration process was effective and, consequently, the most abundant particles were those of CGM and cassiterite; feldspars were also abundant. However, in the tailings, the concentration process was less effective, and the most abundant particles were quartz, followed by CGM and cassiterite. In this case, Fe oxides were frequently observed. These, are often round particles and can be slags of the previous metallurgical treatment of the Penouta concentrates (Figure 10b,c). Some fragments of pyrite partly altered to Fe oxides were also observed (Figure 10d,e).
In the concentrates the most abundant ore mineral was cassiterite, with 53.6 wt% in the leucogranite and 10.1 wt% in the tailing, followed by tantalite (20.1 and 2.0 wt%, respectively), columbite (6.5 and 1.4 wt%, respectively), and microlite (0.1 and 0.3 wt%, respectively). Although wodginite was determined by EMPA, it was not detected with MLA. This could be because this mineral is too similar to columbite-tantalite in terms of BSE contrast and the energy dispersive spectrum. Minor amounts of sulphide minerals were determined; the most abundant was pyrite, with 0.7 wt% and 0.2 wt%, respectively. Other silicate minerals determined by MLA were garnets, mainly spessartine.

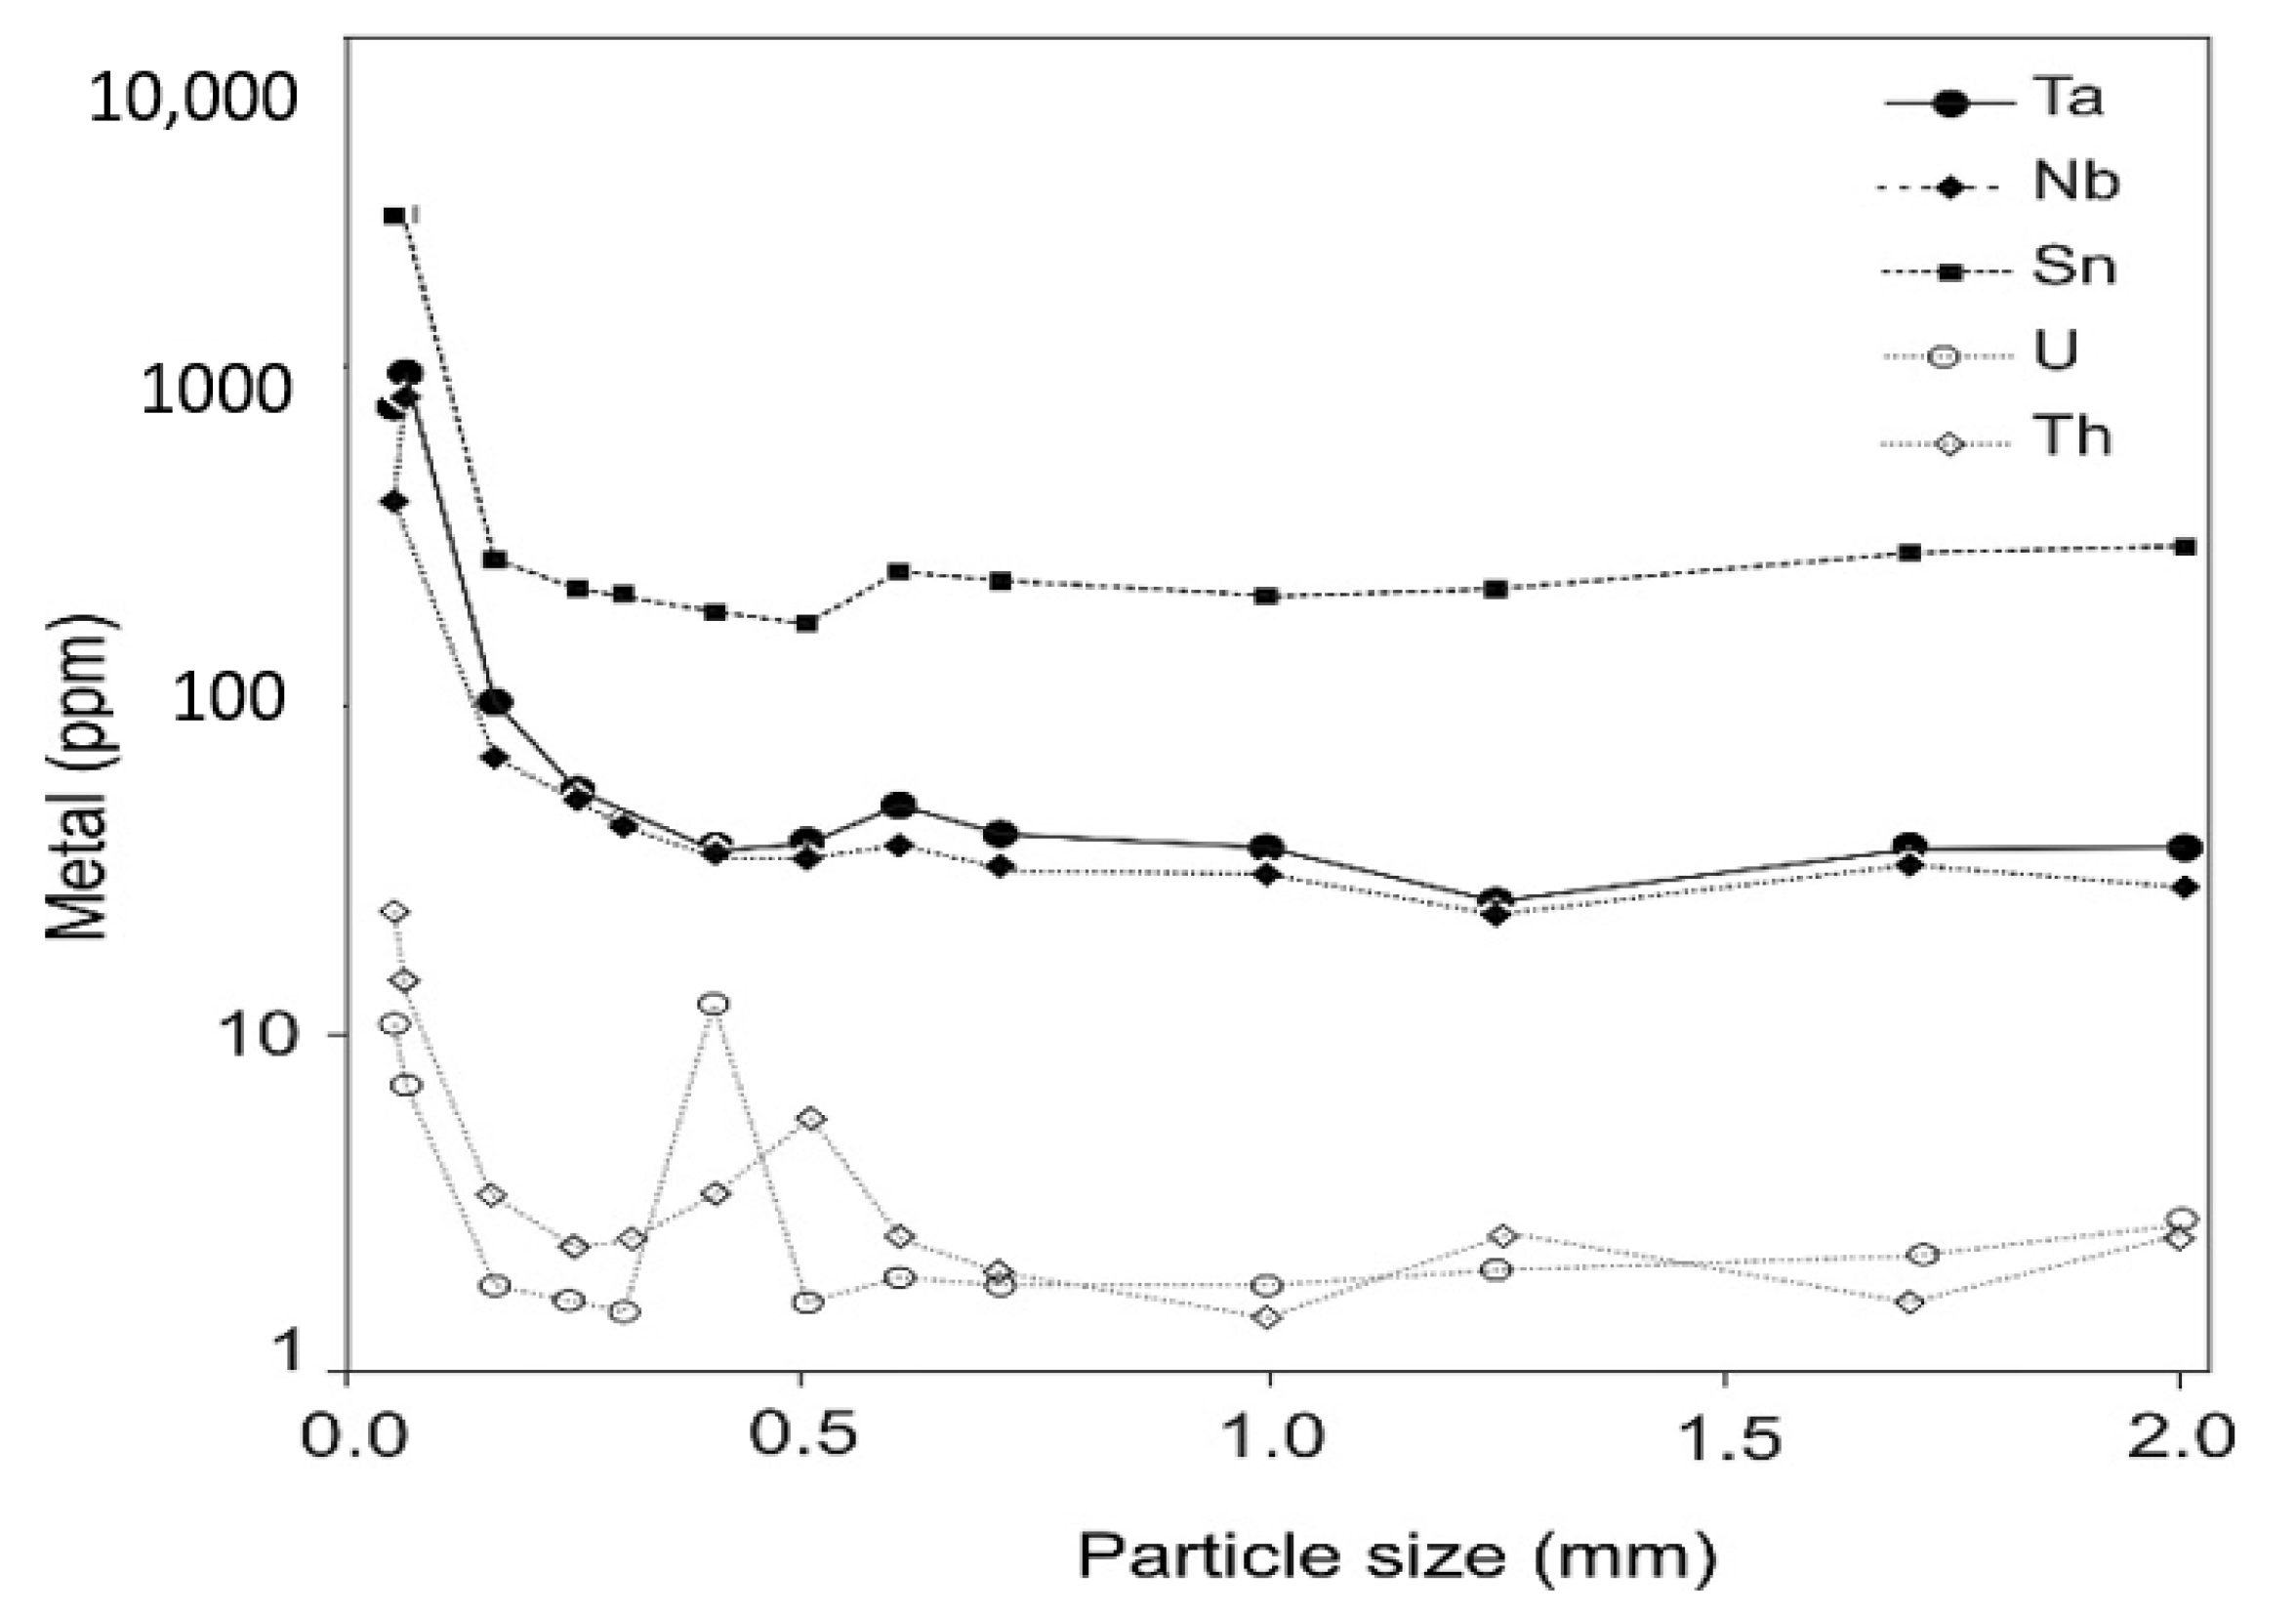
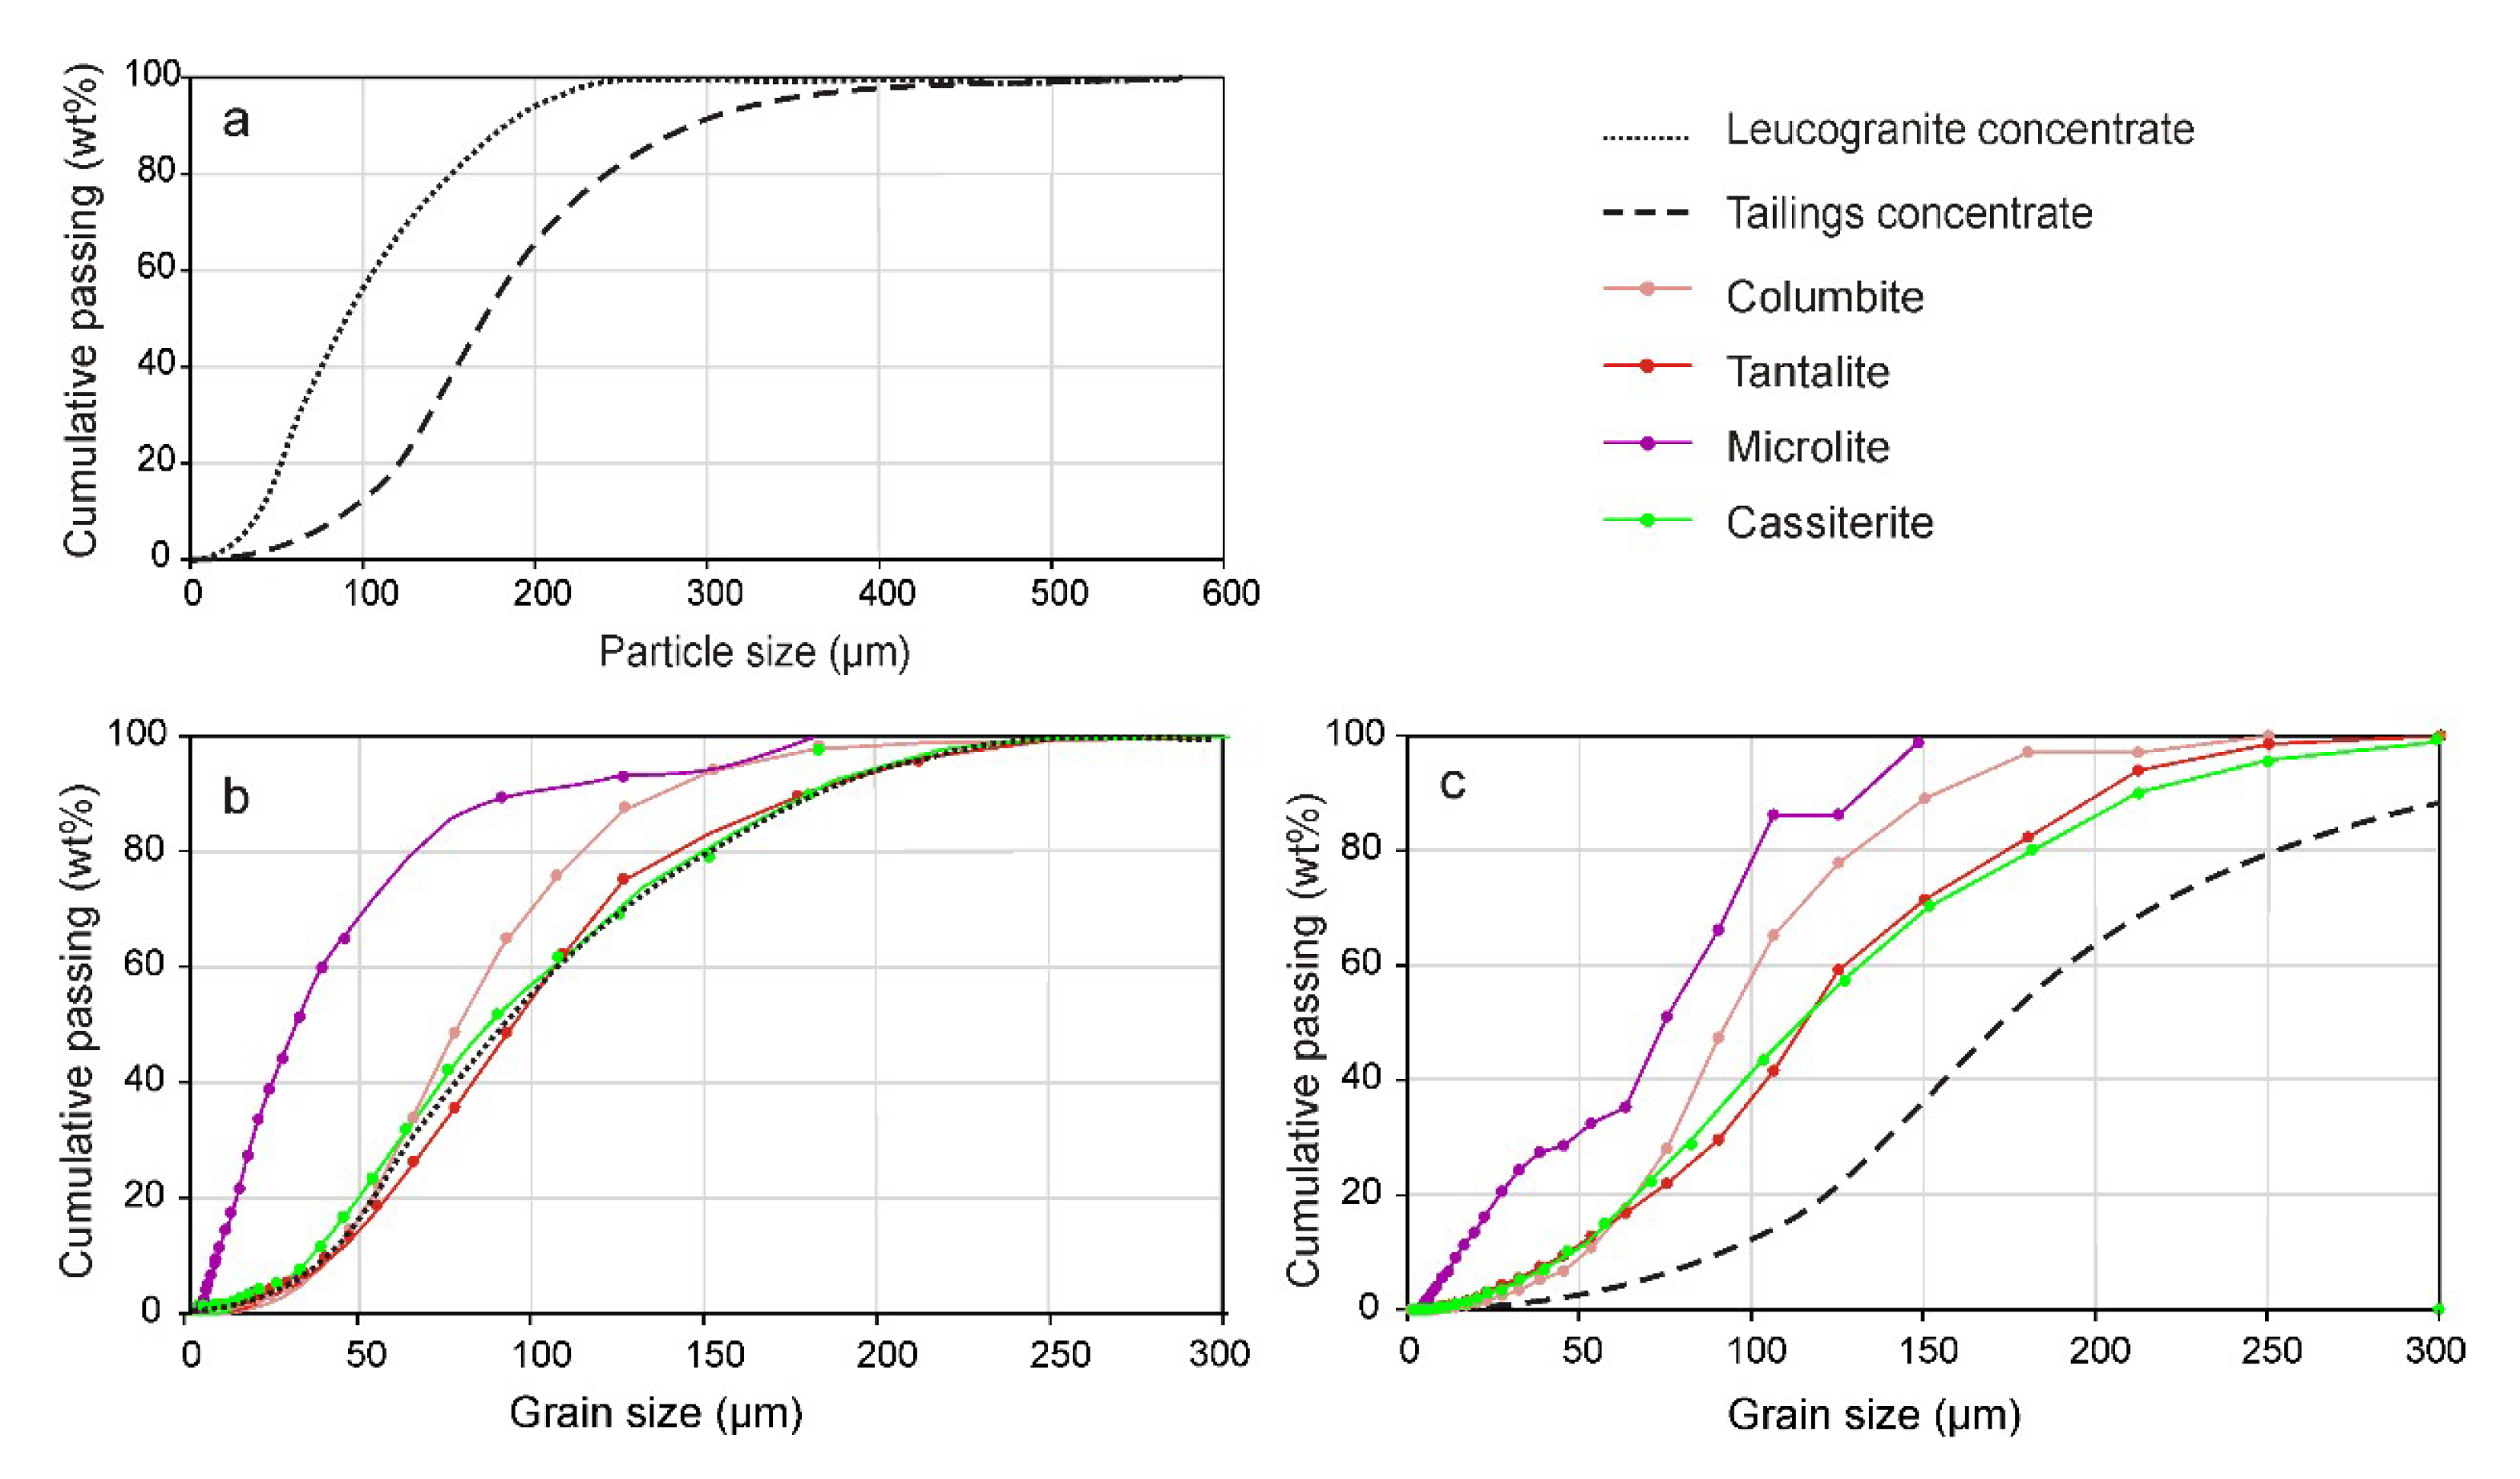
4.3.2. Particle Size

The MLA also provided the particle size distribution (PSD) of the concentrates (Figure 11a) and the grain size distribution (GSD) of the ore minerals (Figure 11b,c). The PSD results show that the mean size of the particles of leucogranite concentrate are more than 50 µm coarser that those of the tailings concentrate. In Figure 11 it can be seen that while in leucogranite the GSDs of the CGM and cassiterite are similar to the PSD, in the tailings, they are much lower, that is, the average grain size is greater than that of the ore liberation. In both cases, the grains of tantalite show a somewhat larger size than those of columbite. This, is because tantalite often surrounds columbite; therefore, the size of the CGM to consider is the one shown by tantalite. Cassiterite has similar values, while microlite is much smaller, especially in the case of leucogranite.

4.3.3. Mineral Association

For the mineral association of binary CGM-bearing particles with other minerals, as shown in Table 4, the two end-members of this group, columbite and tantalite, appeared separately. We observed that while the main mineral associated with columbite is tantalite (59–60 wt%), in the case of tantalite, columbite is the main associated mineral, but only in concentrations of 16.5 wt% and 32.9 wt% from the leucogranite outcropping and tailings, respectively. This is because in the texture of CGM, as it has been shown (Figure 8), tantalite frequently surrounds columbite, making it less exposed to contact with other minerals. The association with microlite is higher in the case of tantalite because both minerals are genetically associated [13], and often, microlite is located within or close to the Ta-richest CGM.
Tantalite is mainly associated with quartz, kaolinite, albite, and muscovite. The high degree of association of tantalite with kaolinite and the difference in this between leucogranite and tailings are highlighted.
The mineral association with CGM depends on the particle grade. In particles with low grades, the CGM are mainly associated with cassiterite in the tailings, whereas in leucogranite, the association with silicates, mainly with quartz and with Fe oxides, is also important (Figure 12). In contrast, in particles with high grades of CGM, the distribution is relatively similar but with a higher proportion of association with Fe oxides.
In the low-grade CGM particles, the associations in the concentrates obtained by gravimetric processing are highly dependent on the final density of the particles, which will depend on the degree of concentration achieved. So, in the case of achieving a high level of separation, particles with a dominant content of light minerals moved toward the waste fraction. Therefore, most of the quartz particles with a low percentage of CGM will go to waste, or the light fraction, in the case of the processed leucogranite; on the other hand, by making a less effective separation with the tailings material, this still can contain a significant fraction of light minerals. For particles with a high proportion of CGM, the influence of the degree of efficiency is not significant, since the composition of the grains associated with the CGM particles will have little effect on their total density.
The associations of kaolinite with CGM and with cassiterite, is most common in the leucogranite outcropping concentrate. Kaolinite and Nb–Ta rich minerals are frequently naturally associated [53,56]. The lower content in the tailings can be explained by the removal of kaolinite, which occurs as particles of a few microns in size, from the tailings e.g., by the action of rainwater.
In the case of Fe oxides, they present a high density, so a less intense concentration process, such as that carried out on tailings, should result in fewer Fe oxides associated with CGM grains; however, in the tailings of Penouta the opposite situation was observed. This could be explained by the slightly different mineralogical composition of the initially exploited leucogranite compared to that which still remains in the outcrops, or it could be due to the inclusion of some materials from the veining greisen area located in the uppermost part of the deposit. This initial leucogranite would be richer in Fe oxides, probably in pyrite and also in microlite.
Cassiterite is liberated in most of the particles (73–81 wt%). In the other cases, it is mainly associated with CGM in the leucogranite concentrate, while in the less pure concentrates, such as those from tailings, cassiterite is mainly associated with quartz, especially when the cassiterite grade is not too high. In both cases, this is followed by the association with muscovite, which is greater in ore-rich particles. Regarding the association with Fe oxides (Mn, Al), these are more commonly associated with cassiterite than with CGM and, in both cases, they predominate more in tailings than in leucogranite concentrates.
When analysing the data contained in these MLAs, it should be considered that, despite the fact that this method allows the observation of a high number of particles, which is important for statistical results [57], the data represent a considerably low proportion of the overall population and, therefore, the generated error can be high. The total counts of particles measures during the MLA from the leucogranite concentrate was 69,262 with 136,042 grains and in the tailing concentrate 21,344 particles with 62,547 grains were measured. The number of particles for each size fraction is variable (Table 5). This number is large for the extreme classes but smaller for the intermediate grades, corresponding to the “U” shape distribution of the liberated particle sizes, as predicted by liberation models [58].
The representativeness of these classes is limited; thus, the measurement error is a function of the number of particles measured and the variability of particle composition in the sample [59]. This is evidenced in the mineral associations with 20–30 wt% of CGM in the tailings (Figure 10a), where only ten particles were measured, and in all of them, quartz was absent and feldspar was as the main associated mineral. Thus, more sections should be analysed to increase the representativeness of the results.

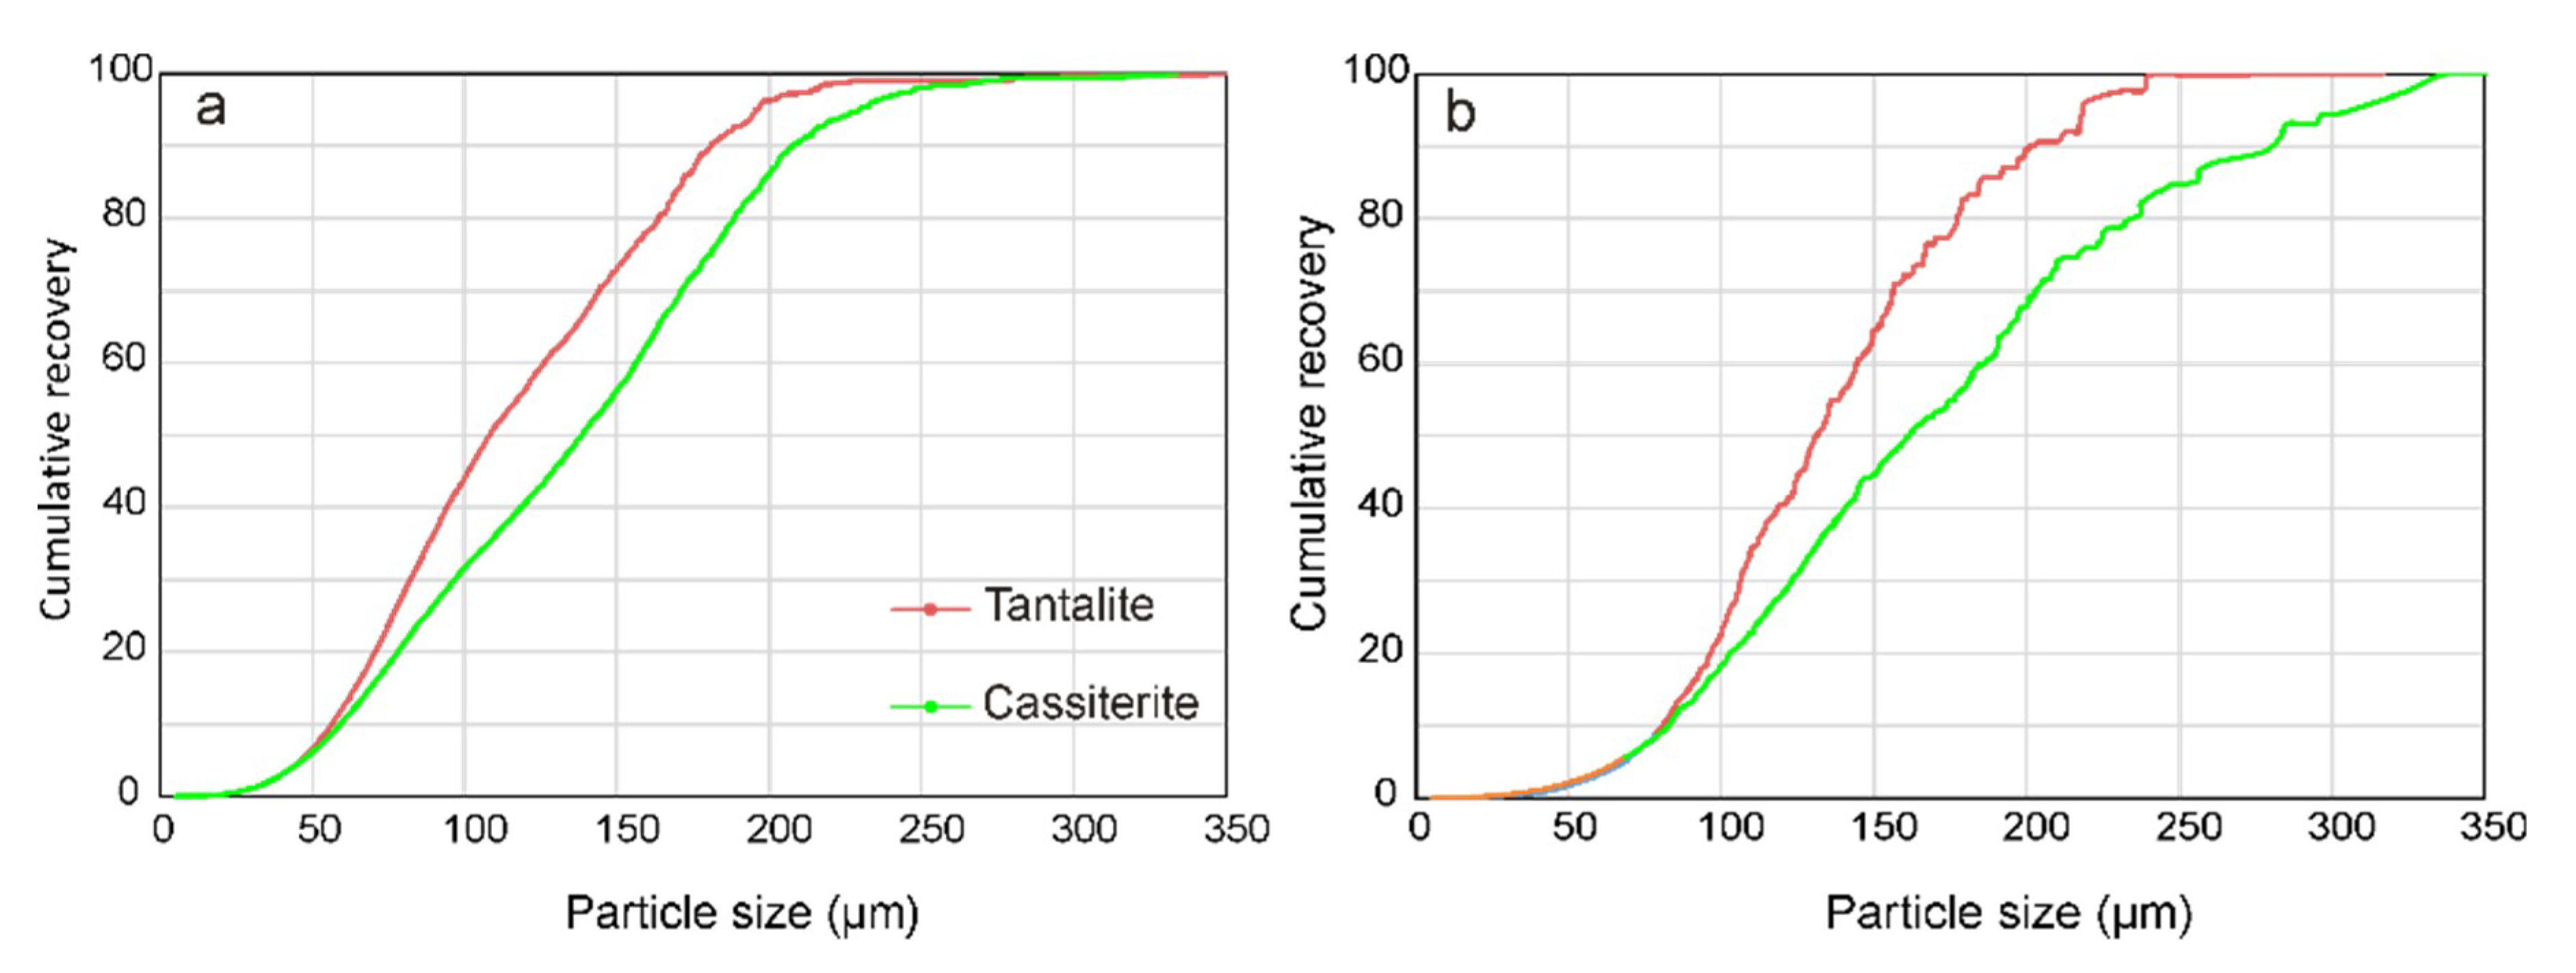
4.3.4. Liberation Analysis

Particles constituted by a single mineral are described as free, and a mineral is considered to be liberated when more than 90 wt% of it is free (e.g., [60]). In this case, columbite and tantalite were considered single minerals, because they could not be separated each other by physical methods.
The characteristics of the liberation of CGM and cassiterite ores from Penouta are summarised in Table 6. As expected from the concentration results, the number of ore-bearing particles and the total amount of ore were considerably higher in the leucogranite outcropping concentrate than in the tailings concentrate. However the distribution of ores in the liberation classes was similar in concentrates from leucogranite and tailings. In both cases, most of the ore-bearing particles were non-liberated. For example, in the leucogranite concentrate, 29.6% (30 wt%) of the particles were found to contain CGM; of these, 18.1% (9.2 wt%) were free and 21.7% (22.5 wt%) were liberated. This, means that some liberated particles contained a small amount of impurities. A concentration of 30 wt% of CGM were found to be free and 71.5 wt% were liberated. Cassiterite displayed similar behaviour but with higher values.
Although the tailings concentrate was found to have a considerably lower CGM grade than the leucogranite concentrate, the distribution of CGM among the different particle fractions and grade classes showed a similar pattern in both concentrates. In the two cases, most of the particles bearing CGM were liberated or present at a low grade. As Figure 12 shows, in most CGM particles with less than 10 wt% CGM, the predominant mineral was cassiterite. Textural observations indicate that these are cassiterite-rich particles that contain small inclusions of CGM [45].
A predictive liberation model was developed for the leucogranite outcropping and tailing concentrates. Particles of −200 µm contain 96 wt% of CGM in the leucogranite concentrate and 89.5 wt% in the tailings concentrate. Particles of −200 μm contain 86.1 wt% and 70 wt% of the total cassiterite, respectively (Figure 13); these lower concentrations are because of the larger size of cassiterite. The size of particles is very important to the efficiency of the processing method. Froth flotation has a low level of efficiency with particles smaller than 20 μm [61], and abundant problems are produced when the method is used with fine particles [62], and loss efficiency in concentrate particles under 50 μm in size [35,61,63]. In the Penouta leucogranite and tailing concentrates only 0.28 wt% and 0.17 wt% of cassiterite, respectively, are present in particles of less than 20 μm in size, and its content of cassiterite in particles under 50 μm is also small enough that the exclusive use of gravity methods may be feasible.
The liberation size for CGM is –180 μm; thus, this range represents 80 wt% of the liberated particles in leucogranite and tailing concentrates. However, to recover 80 wt% of cassiterite in the leucogranite and tailing concentrates, it would be necessary to include particles with sizes up to 189 µm and 236 µm, respectively (Figure 13). Using the MLA data, the differential mass of all samples was determined at different grade classes and size fractions. The calculation of the distribution density and modelling of liberation is shown in Figure 14 for CGM and in Figure 15 for cassiterite.
It is important to keep in mind that although the MLA data used here were obtained from a concentrate, in the waste material from our re-processing of tailings, only 20 ppm of the Ta and 94 ppm of the cassiterite remained (Table 2), which represents less than 20 wt% of the total. So, the distribution of the CGM particles should be similar to the original tailings material.
Similar to CGM, most cassiterite was found in the high-grade classes with between 90% and 100% cassiterite. A comparison of Figure 14 and Figure 15 shows that while the CGM are found abundantly in particles in small proportions, that is to say, with low-grade CGM, in the case of cassiterite, this is much less frequent, although the grade class of >0% to 10% is also more abundant than classes with intermediate grades.

5. Conclusions

Using the MLA, the characteristics of mineral liberation were quantified for CGM and cassiterite from Penouta leucogranite and ancient tailings. The mineral association and relationships among the ore content, size of particles, and grade class were determined. These data are necessary to select the particle size that must be reached according to the recovery to be obtained.
In Penouta, CGM are mainly associated with cassiterite, quartz, and muscovite and, to a lesser extent, with feldspars, kaolinite, and Fe oxides or hydroxides. The association is similar in the leucogranite outcropping and tailing concentrates, although tailings are richer in quartz and Fe (Mn), Al oxides or hydroxides and poorer in kaolinite.
Cassiterite from the leucogranite concentrate is mainly associated with CGM, whereas in the tailings concentrate this mainly occurs with quartz.
Most of the Penouta ores in concentrates are liberated, showing similar ratios in the leucogranite (highly concentrated) and tailings (moderately concentrated). The liberated CGM are 71.5 wt% of all CGM from leucogranite concentrate and 77.8 wt% from tailings concentrate. The liberated cassiterite is 87.6 wt% and 81.6 wt% of this mineral from leucogranite and tailings concentrates, respectively.
The liberation size for CGM is 180 μm. Particles smaller than 200 µm include 96 wt% of the CGM in the leucogranite concentrate and 89.5 wt% of the CGM in the tailings concentrate, but they account for only 86.1 wt% and 70 wt% of the total cassiterite. To obtain a high recovery, the size of tailings should be reduced to about 200 µm.

Author Contributions

Conceptualization, P.A. and S.A.H.; methodology, P.A.; software, S.A.H., M.G.-V., and P.A.; validation, S.A.H. and H.A.; formal analysis, P.A., M.G.-V., and D.C.; investigation, P.A., S.A.H., J.O., H.A., and O.T.; resources, J.O. and F.G.P.; data curation, P.A. and S.A.H.; writing—original draft preparation, P.A., S.A.H., and F.J.L.-M.; writing—review and editing, P.A., M.B., and T.L.; visualization, P.A.; supervision, P.A., S.A.H., and F.G.P.; and project administration and funding acquisition, J.O. All authors have read and agreed to the published version of the manuscript.

Funding

This work is part of the OptimOre project. This project has received funding from the European Union’s Horizon 2020 research and innovation programme under grant agreement No 642201. The research is supported by the SGR-198 and SGR-707 of the Generalitat de Catalunya.

Acknowledgments

The Strategic Minerals enterprise helped with the sampling of Penouta. We thank R. Martin and N. Kupka from the Helmholtz Institute Freiberg for Resource Technology, Freiberg, for the performance of the MLA. X. Llovet assisted with the EMPA analyses.

Conflicts of Interest

The authors declare no conflict of interest.

References

  1. Sungail, C.; Abid, A.D. Additive manufacturing of tantalum—A study of chemical and physical properties of printed tantalum. Met. Powder Rep. 2020, 75, 28–33. [Google Scholar] [CrossRef]
  2. Köck, W.; Paschen, P.J.O.M. Tantalum—Processing, properties and applications. JOM 1989, 41, 33–39. [Google Scholar] [CrossRef]
  3. Mackay, D.A.R.; Simandl, G.J. Geology, market and supply chain of niobium and tantalum—A review. Miner. Depos. 2014, 49, 1025–1047. [Google Scholar] [CrossRef]
  4. Nassar, N.T. Shifts and trends in the global anthropogenic stocks and flows of tantalum. Resour. Conserv. Recycl. 2017, 125, 233–250. [Google Scholar] [CrossRef]
  5. Sverdrup, H.U.; Olafsdottir, A.H. A system dynamics model assessment of the supply of niobium and tantalum using the WORLD6 model. Biophys. Econ. Resour. Qual. 2018, 3, 5. [Google Scholar] [CrossRef]
  6. Cunningham, L.D. Columbium (Niobium) and Tantalum; USGS: Reston, VA, USA, 2003.
  7. Kobayashi, Y.; Hata, H.; Salama, M.; Mallouk, T.E. Scrolled sheet precursor route to niobium and tantalum oxide nanotubes. Nano Lett. 2007, 7, 2142–2145. [Google Scholar] [CrossRef]
  8. Simandl, G.J. Tantalum market and resources: An overview. Brittish Columbia Geological Survey. Geol. Fieldwork 2001, 2002, 313–318. [Google Scholar]
  9. Mancheri, N.A.; Sprecher, B.; Deetman, S.; Young, S.B.; Bleischwitz, R.; Dong, L.; Klenijn, R.; Tukker, A. Resilience in the tantalum supply chain. Resour. Conserv. Recycl. 2018, 129, 56–69. [Google Scholar] [CrossRef]
  10. Hennebel, T.; Boon, N.; Maes, S.; Lenz, M. Biotechnologies for critical raw material recovery from primary and secondary sources: R&D priorities and future perspectives. New Biotechnol. 2015, 32, 121–127. [Google Scholar]
  11. Grandell, L.; Lehtilä, A.; Kivinen, M.; Koljonen, T.; Kihlman, S.; Lauri, L.S. Role of critical metals in the future markets of clean energy technologies. Renew. Energy 2016, 95, 53–62. [Google Scholar] [CrossRef]
  12. European Comission. Methodology for Establishing the EU list of Critical Raw Materials; European Commission: Brussels, Belgium, 2017; p. 30. [Google Scholar] [CrossRef]
  13. Nikishina, E.E.; Drobot, D.V.; Lebedeva, E.N. Niobium and Tantalum: State of the World Market, application fields, and sources of raw materials. Part 2. Russ. J. Nonferrous Met. 2014, 55, 130–140. [Google Scholar] [CrossRef]
  14. European Comission. Report on Critical Raw materials for the EU. In Report of the Ad hoc Working Group on Defining Critical Raw Materials; European Commission: Brussels, Belgium, 2014. [Google Scholar]
  15. Chakhmouradian, A.R.; Smith, M.P.; Kynicky, J. From “strategic” tungsten to “green” neodymium: A century of critical metals at a glance. Ore Geol. Rev. 2015, 64, 455–458. [Google Scholar] [CrossRef]
  16. Fortier, S.M.; Thomas, C.L.; McCullough, E.A.; Tolcin, A.C. Global Trends in Mineral Commodities for Advanced Technologies. Nat. Resour. Res. 2018, 27, 191–200. [Google Scholar] [CrossRef]
  17. McCullough, E.; Nassar, N.T. Assessment of critical minerals: Updated application of an early-warning screening methodology. Miner. Econ. 2017, 30, 257–272. [Google Scholar] [CrossRef] [Green Version]
  18. Løvik, A.N.; Hagelüken, C.; Wäger, P. Improving supply security of critical metals: Current developments and research in the EU. Sustain. Mater. Technol. 2018, 15, 9–18. [Google Scholar] [CrossRef]
  19. Simandl, G.J.; Burr, R.O.; Trueman, D.L.; Paradis, S. Economic geology models 2. Tantalum and niobium: Deposits, resources, exploration methods and market—A primer for geoscientists. Geosci. Can. 2018, 45, 85–96. [Google Scholar] [CrossRef] [Green Version]
  20. Figueiredo, J.; Vila, M.C.; Fiúza, A.; Góis, J.; Futuro, A.; Dinis, M.L.; Martins, D. A Holistic Approach in Re-Mining Old Tailings Deposits for The Supply of Critical Metals: A Portuguese Case. Minerals 2019, 9, 638. [Google Scholar] [CrossRef] [Green Version]
  21. Wikedzi, A.; Arinanda, M.A.; Leißner, T.; Peuker, U.A.; Mütze, T. Breakage and liberation characteristics of low grade sulphide gold ore blends. Miner. Eng. 2018, 115, 33–40. [Google Scholar] [CrossRef]
  22. Johmson, C.; Pownceby, M.I.; Wilson, N.C. The application of automated electron beam mapping techniques to the characterisation of low grade, fine-grained mineralisation; potential problems and recommendations. Miner. Eng. 2015, 79, 68–83. [Google Scholar] [CrossRef]
  23. Zhang, J.; Subasinghe, N. Prediction of mineral liberation characteristics of comminuted particles of high grade ores. Miner. Eng. 2013, 49, 68–76. [Google Scholar] [CrossRef]
  24. Gu, Y. Automated Scanning Electron Microscope Based Mineral Liberation Analysis an Introduction to JKMRC/FEI Mineral Liberation Analyser. J. Miner. Mater. Charact. Eng. 2003, 2, 33–41. [Google Scholar] [CrossRef]
  25. Fandrich, R.; Gu, Y.; Burrows, D.; Moeller, K. Modern SEM-based mineral liberation analysis. Int. J. Miner. Process. 2007, 84, 310–320. [Google Scholar] [CrossRef]
  26. Lastra, R. Seven practical application cases of liberation analysis. Int. J. Miner. Process. 2007, 84, 337–347. [Google Scholar] [CrossRef]
  27. Quinteros, J.; Wightman, E.; Johnson, N.W.; Bradshaw, D. Evaluation of the response of valuable and gangue minerals on a recovery, size and liberation basis for a low-grade silver ore. Miner. Eng. 2015, 74, 150–155. [Google Scholar] [CrossRef]
  28. Klass, P.; van der Wielen, K.P.; Rollinson, G. Texture-based analysis of liberation behaviour using Voronoi tessellations. Miner. Eng. 2016, 89, 93–107. [Google Scholar]
  29. Sousa, R.; Simons, B.; Bru, K.; de Sousa, A.B.; Rollinson, G.; Andersen, J.; Martin, M.; Leite, M.M. Use of mineral liberation quantitative data to assess separation efficiency in mineral processing—Some case studies. Miner. Eng. 2018, 127, 134–142. [Google Scholar] [CrossRef]
  30. Lotter, N.O. Modern Process Mineralogy: An integrated multi-disciplined approach to flowsheeting. Miner. Eng. 2011, 24, 1229–1237. [Google Scholar] [CrossRef]
  31. Kern, M.; Möckel, R.; Rrause, J.; Teichmann, J.; Gutzmer, J. Calculating the deportment of a fine-grained and compositionally complex Sn skarn with a modified approach for automated mineralogy. Miner. Eng. 2018, 116, 213–225. [Google Scholar] [CrossRef]
  32. Hamid, S.A.; Alfonso, P.; Anticoi, H.; Guasch, E.; Oliva, J.; Dosbaba, M.; Garcia-Valles, M.; Chugunova, M. Quantitative mineralogical comparison between HPGR and ball mill products of a Sn-Ta ore. Minerals 2018, 8, 151. [Google Scholar] [CrossRef] [Green Version]
  33. Anticoi, H.; Guasch, E.; Hamid, S.A.; Oliva, J.; Alfonso, P.; Garcia-Valles, M.; Bascompta, M.; Sanmiquel, L.; Escobet, T.; Argelaguet, R.; et al. Breakage function for HPGR: Mineral and mechanical characterization of tantalum and tungsten ores. Minerals 2018, 8, 170. [Google Scholar] [CrossRef] [Green Version]
  34. Guldris Leon, L.; Hogmalm, K.J.; Bengtsson, M. Understanding Mineral Liberation during Crushing Using Grade-by-Size Analysis—A Case Study of the Penuota Sn-Ta Mineralization, Spain. Minerals 2020, 10, 164. [Google Scholar] [CrossRef] [Green Version]
  35. Ghorbani, Y.; Fitzpatrick, R.; Kinchington, M.; Rollinson, G.; Hegarty, P. A process mineralogy approach to gravity concentration of Tantalum bearing minerals. Minerals 2017, 7, 194. [Google Scholar] [CrossRef] [Green Version]
  36. López, F.A.; García-Díaz, I.; Rodríguez Largo, O.; Polonio, F.G.; Llorens, T. Recovery and purification of tin from tailings from the Penouta Sn–Ta–Nb deposit. Minerals 2018, 8, 20. [Google Scholar] [CrossRef] [Green Version]
  37. Guldris Leon, L.; Bengtsson, M.; Evertsoon, M. Analysis of the concentration in rare metal ores during compression crushing. Miner. Eng. 2018, 120, 7–18. [Google Scholar] [CrossRef]
  38. Anticoi, H.; Guasch, E.; Hamid, S.A.; Oliva, J.; Alfonso, P.; Bascompta, M.; Sanmiquel, L.; Escobet, T.; Escobet, A.; Parcerisa, D.; et al. An improved high-pressure roll crusher model for tungsten and tantalum ores. Minerals 2018, 8, 483. [Google Scholar] [CrossRef] [Green Version]
  39. Llorens González, T.; García Polonio, F.; López Moro, F.J.; Fernández-Fernández, A.; Sans Contreras, J.L.; Moro Benito, M.C. Tin-tantalum-niobium mineralization in the Penouta deposit (NW Spain): Textural features and mineral chemistry to unravel the genesis and evolution of cassiterite and columbite group minerals in a peraluminous system. Ore Geol. Rev. 2017, 81, 79–95. [Google Scholar] [CrossRef]
  40. Arribas, A.; Gonzalo, F.; Iglesias, M. Génesis de una mineralización asociada a una cúpula granítica: El yacimiento de estaño de Golpeas (Salamanca). Lab. Xeol. Laxe 1982, 3, 563–592. [Google Scholar]
  41. Gonzalo, F.J.; Gracia, A.S. Yacimientos de estaño del oeste de España: Ensayo de caracterización y clasificación económicas. Cuad. Lab. Xeolóx. Laxe 1985, 9, 265–303. [Google Scholar]
  42. López Moro, F.J.; García Polonio, F.; Llorens González, T.; Sanz Contreras, J.L.; Fernández-Fernández, A.; Moro Benito, M.C. Ta and Sn concentration by muscovite fractionation and degassing in a lens-like granite body: The case study of the Penouta rare-metal albite granite (NW Spain). Ore Geol. Rev. 2017, 82, 10–30. [Google Scholar] [CrossRef]
  43. Philpotts, A.; Ague, J. Principles of Igneous and Metamorphic Petrology; Cambridge University Press: New York, NY, USA, 2009. [Google Scholar]
  44. Pollard, P.J.; Pichavant, M.; Charoy, B. Contrasting evolution of fluorine- and boron-rich systems. Miner. Depos. 1987, 22, 315–321. [Google Scholar] [CrossRef]
  45. Alfonso, P.; Hamid, S.A.; Garcia-Valles, M.; Llorens, T.; Tomasa, O.; Calvo, D.; Guasch, E.; Anticoi, H.; Oliva, J.; López Moro, J.; et al. Textural and mineral-chemistry constraints on columbite-group minerals in the Penouta deposit: Evidence from magmatic and fluid-related processes. Mineral. Mag. 2018, 82, S199–S222. [Google Scholar] [CrossRef] [Green Version]
  46. Vegas, N.; Aranguren, A.; Cuevas, J.; Tubía, J.M. Variaciones en los mecanismos de emplazamiento de los granitos del eje Sanabria-Viana do Bolo (Macizo Ibérico, España). Bol. Geol. Min. 2001, 112, 79–88. [Google Scholar]
  47. Gutiérrez-Alonso, G.; Collins, A.S.; Fernández-Suárez, J.; Pastor-Galán, D.; González-Clavijo, E.; Jourdan, F.; Weil, A.B.; Johnston, S.T. Dating of lithospheric buckling: 40Ar/39Ar ages of syn-orocline strike–slip shear zones in northwestern Iberia. Tectonophysics 2015, 643, 44–54. [Google Scholar] [CrossRef]
  48. Chicharro, E.; Martín-Crespo, T.; Gómez-Ortiz, D.; López-García, J.A.; Oyarzun, R.; Villaseca, C. Geology and gravity modeling of the Logrosán Sn–(W) ore deposits (Central Iberian Zone, Spain). Ore Geol. Rev. 2015, 65, 294–307. [Google Scholar] [CrossRef]
  49. ADARO. Proyecto de Investigación de la Mina de Penouta. Cálculo de reservas para leyes de corte de 800 y 600 g/t. Internal unpublished report, Madrid, Spain. 1982. [Google Scholar]
  50. ADARO. Investigación Minera del Yacimiento de Penouta. 9 volumes. Internal Unpublished report, Madrid, Spain. 1985. [Google Scholar]
  51. García Polonio, F. El Interés Económico y Estratégico del Aprovechamiento de Metales Raros y Minerales Industriales Asociados, en el Marco Actual de la Minería Sostenible: La Mina de Penouta (Orense, España). Ph.D. Thesis, Universidad Politécnica de Madrid, Madrid, Spain, 2016. [Google Scholar]
  52. Černý, P.; Chapman, R.; Ferreira, K.; Smeds, S.A. Geochemistry of oxide minerals of Nb, Ta, Sn, and Sb in the Varuträsk granitic pegmatite, Sweden: The case of an “anomalous” columbite-tantalite trend. Am. Mineral. 2004, 89, 505–518. [Google Scholar] [CrossRef]
  53. Yin, L.; Pollard, P.J.; Shouxi, H.; Taylor, R.G. Geologic and geochemical characteristics of the Yichun Ta–Nb–Li deposit, Jiangxi Province, South China. Econ. Geol. 1995, 90, 577–585. [Google Scholar] [CrossRef]
  54. Belkasmi, M.; Cuney, M.; Polard, P.J.; Bastoul, A. Chemistry of the Ta-Nb-Sn-W oxide minerals from the Yichun rare metal granite (SE China): Genetic implications and comparison with Maroccan and French Hercynian examples. Miner. Mag. 2000, 64, 507–533. [Google Scholar] [CrossRef]
  55. Huang, X.L.; Wang, R.C.; Chen, X.M.; Hu, H.; Liu, C.S. Vertical variations in the mineralogy of the Yichun topaz–lepidolite granite, Jiangxi Province, southern China. Can. Mineral. 2002, 40, 1047–1068. [Google Scholar] [CrossRef]
  56. Dehaine, Q.; Filippov, L.O. Rare earth (La, Ce, Nd) and rare metals (Sn, Nb, W) as by-product of kaolin production, Cornwall: Part1: Selection and characterisation of the valuable stream. Miner. Eng. 2015, 76, 141–153. [Google Scholar] [CrossRef]
  57. Goodall, W.R.; Scales, P.J. An overview of the advantages and disadvantages of the determination of gold mineralogy by automated mineralogy. Miner. Eng. 2007, 20, 506–517. [Google Scholar] [CrossRef]
  58. Stamboliadis, E.T. The evolution of a mineral liberation model by the repetition of a simple random breakage pattern. Miner. Eng. 2008, 21, 213–223. [Google Scholar] [CrossRef]
  59. Mariano, R.A.; Evans, C.L. Error analysis in ore particle composition distribution measurements. Miner. Eng. 2015, 82, 36–44. [Google Scholar] [CrossRef]
  60. Anderson, K.F.; Wall, F.; Rollinson, G.K.; Moon, C.J. Quantitative mineralogical and chemical assessment of the Nkout iron ore deposit, Southern Cameroon. Ore Geol. Rev. 2014, 62, 25–39. [Google Scholar] [CrossRef]
  61. Leistner, T.; Embrechts, M.; Leißner, T.; Chelgani, S.C.; Osbahr, I.; Möckel, R.; Peuker, U.A.; Rudolph, M. A study of the reprocessing of fine and ultrafine cassiterite from gravity tailing residues by using various flotation techniques. Miner. Eng. 2016, 96, 94–98. [Google Scholar] [CrossRef]
  62. Miettinen, T.; Ralston, J.; Fornasiero, D. The limits of fine particle flotation. Miner. Eng. 2010, 23, 420–437. [Google Scholar] [CrossRef]
  63. Dehaine, Q.; Filippov, L.O.; Royer, J.J. Comparing univariate and multivariate approaches for process variograms: A case study. Chemom. Intell. Lab. Syst. 2016, 152, 107–117. [Google Scholar] [CrossRef]
Figure 1. Location of the Penouta deposit. Upper left: geological map of the Central Iberian Zone with the location of the Penouta deposit. Upper right: geological sketch of the Ollo de Sapo Anticlinorium with the location of the Penouta leucogranite. Lower part: detailed geological map of the Penouta deposit (modified from [42]).
Minerals 10 00509 g001
Figure 2. Satellite image with the location of the Penouta tailings.
Minerals 10 00509 g002
Figure 3. (a) Trench from Balsa Grande showing the distribution of samples 7–10. (b) Particle size distribution of samples.
Minerals 10 00509 g003
Figure 4. Variations in Ta, Nb, Sn, U, and Th with the particle size of the tailings from Penouta.
Minerals 10 00509 g004
Figure 5. Nb/Ta ratio vs. the Ta content from Penouta materials.
Minerals 10 00509 g005
Figure 6. X-ray powder diffraction (XRD) diagrams showing the mineralogical composition of samples from the leucogranite (Pen-14) and from the Balsa Grande (Pen-8, Pen-9) and Balsa Pequeña tailings (Pen-16). Qz, quartz; Ab, albite, KF, K-feldspar; Ms, muscovite; and Kln, kaolinite.
Minerals 10 00509 g006
Figure 7. XRD diagrams showing the mineralogical composition of different particle sizes from the Balsa Grande tailing. Qz, quartz; Ab, albite, KF, K-feldspar; Ms, muscovite; and Kln, kaolinite.
Minerals 10 00509 g007
Figure 8. Columbite group minerals from the Penouta tailings showing different textures and associations: (ac), concentric zoning; (d) oscillatory zoning; (e) patchy zoning; (f) presence of oscillatory zoning including uraninite microcrystals; and (gi) association with microlite. Col, columbite; Tan, tantalite; Microl, microlite; Qz, quartz, Ms, muscovite; and U, uranium.
Minerals 10 00509 g008
Figure 9. Chemical composition of columbite-group minerals (CGM) and microlite from the Penouta leucogranite outcropping ore [45] and from tailings in the columbite quadrilateral.
Minerals 10 00509 g009
Figure 10. Representative pseudo-colour particle maps from the mineral liberation analysis of the ore concentrate from (a) the leucogranite outcropping, (be) the tailings.
Minerals 10 00509 g010
Figure 11. Size distribution determined by mineral liberation analysis (MLA). (a) Particle size distribution of ores from concentrates of leucogranite and tailings; (b) grain sizes of ore minerals from the Penouta leucogranite; and (c) grain sizes of ore minerals from the Penouta tailings.
Minerals 10 00509 g011
Figure 12. False colour images showing the mineral associations of ores in Penouta concentrates. (a) columbite-group minerals (CGM) from Balsa Grande tailings; (b) CGM from leucogranite; and (c) cassiterite from Balsa Grande tailings; and (d) cassiterite from leucogranite.
Minerals 10 00509 g012
Figure 13. Cumulative recovery of CGM and cassiterite according to the particle size distribution determined by MLA in Penouta concentrates; (a) from leucogranite; and (b) from tailings.
Minerals 10 00509 g013
Figure 14. Distribution of CGM in the concentrated materials according to particle size and CGM grade classes. (a) Leucogranite, taking all of the particles into account; (b) detail where the zero grade particles were not considered; (c) tailings taking all the particles into account; and (d) detail where the zero grade particles were not considered.
Minerals 10 00509 g014
Figure 15. Distribution of cassiterite in the concentrated materials according to particle size and cassiterite grade classes. (a) Leucogranite taking all of the particles into account; (b) detail where the zero grade particles were not considered; (c) tailings taking all of the particles into account; and (d) detail where the zero grade particles were not considered.
Minerals 10 00509 g015
Table 1. Comparison of the chemical composition of samples from the Penouta tailings (Balsa Grande, P-7-10 to P-16; Balsa Pequeña, P-17 to P-21) and the leucogranite outcropping ore (Penouta tailings (Pen T), [45]). N.a.: not analysed.
Oxides (wt%)P-7-10P-11P-12P-16P-17P-18P-19P-20P-21Pen T
SiO277.3458.1962.4756.4878.5179.1667.1872.3171.0374.9
TiO20.060.280.470.330.100.100.120.150.230.00
Al2O310.0625.8922.4826.6411.9011.3211.1710.8516.5315.3
FeO0.842.413.422.681.121.171.201.331.830.67
MnO0.140.080.070.110.070.110.100.100.120.05
CaO0.060.040.140.100.040.060.040.080.340.15
MgO0.120.480.780.610.220.220.250.320.460.04
Na2On.a.n.a.n.a.n.a.n.a.n.a.n.a.n.a.n.a.5.40
K2O4.864.654.515.364.093.953.953.805.213.18
P2O50.020.070.080.070.020.020.030.020.030.03
Traces (ppm)
Nb79.726.017.631.645.677.697.545.151.581.0
Ta134.236.416.746.584.0156.0215.079.089.1103.0
Sn541.7295.0112.0366.0716.010401340591.0437.0383.0
W314.554.5155.029.6142.0227.0179.0352.0108.035.0
U2.95.06.44.42.22.42.92.53.32.5
Th3.507.310.98.33.53.64.25.06.42.4
Pb11.618.454.614.67.98.08.17.013.06.8
Rb121710206391550100010009909241270966
Cs52.260.342.088.150.952.352.752.768.964.0
Table 2. Chemical composition of the Penouta tailings and the leucogranite outcropping ore including the Nb, Ta, and Sn concentrations and the Nb/Ta ratio used in the experiments in this work.
Weight %NbTaSnNb/Ta
Penouta tailings791345420.59
Penouta waste from tailings concentration2120941.05
Penouta leucogranite811023850.79
Penouta waste from the leucogranite concentration97531.23
Table 3. Modal mineralogy of the leucogranite from Penouta and concentrates from tailings and leucogranite.
Mineral (wt%)Original LeucograniteLeucogranite
Concentrate
Tailings
Concentrate
Columbite-6.51.4
Tantalite-20.12.0
Microlite-0.30.1
Cassiterite-53.610.1
Quartz20.22.042.1
Albite55.42.62.6
K-Feldspar10.90.92.4
Almandine-0.50.7
Spessartine0.15.14.4
Muscovite6.71.77. 5
Kaolinite5.41.51.9
Fe (Mn) oxide/hydroxide0.62.610.4
Zircon0.031.300.64
Monazite0.020.210.38
Xenotime-0.120.15
Pyrite 0.010.240.66
Other0.640.7320.07
-: contents <0.01
Table 4. Mineral associations (normalized wt%) of columbite, tantalite, and cassiterite in binary particles from Penouta outcropping leucogranite (LG) and tailings (T), as determined by mineral liberation analysis.
ColumbiteTantaliteColumbiteTantaliteCassiteriteCassiterite
Weight% Locked inLGLGTTLGT
Columbite 16.49 32.940.170.19
Tantalite59.29 59.86 2.980.78
Microlite0.001.150.021.050.280.52
Cassiterite0.722.810.111.15
Quartz0.494.811.453.932.524.42
Albite0.352.620.000.341.911.00
K-Feldspar0.071.320.351.271.662.09
Spessartine0.120.060.000.120.080.07
Muscovite0.403.750.204.244.528.36
Kaolinite0.275.340.000.730.750.58
Fe (Mn) oxides/hydroxides0.120.231.062.430.072.88
Zircon0.190.430.530.000.110.00
Phosphates0.110.260.010.010.060.00
Pyrite0.090.010.000.000.010.00
Table 5. Number of particles measured in the MLA according to the ore grade.
Ore grade (wt%)CGM(LG)CGM (T)Cst (LG)Cst(T)
Free (100)12,51355323,1821932
Liberated (<100 to 90)25272283555519
90–80115061968132
80–707112549060
70–604432733233
60–503671225431
50–403041921024
40–302961420326
30–203211024527
20–104161626033
10 to >01442150607121
048,77220,22838,95618,406
Total69,26221,34462,26221,344
Table 6. Classification of ore-bearing particles from concentrates of Penouta outcropping leucogranite (LG) and tailings (T) determined by MLA. Cst, cassiterite.
MaterialLG, CGMT, CGMLG, CstT, Cst
Total ore (wt%)26.63.453.610.1
Number of particles (%)
Ore-bearing29.65.243.913.8
Free18.12.633.69.1
Liberated21.73.738.711.5
Mass of particles (wt%)
Ore-bearing 30.03.751.911.4
Free9.20.619.22.1
Liberated 22.52.246.86.0
Mass of ore (wt%) in particles
Free 30.022.535.529.4
Liberated 71.577.887.681.6

