Article

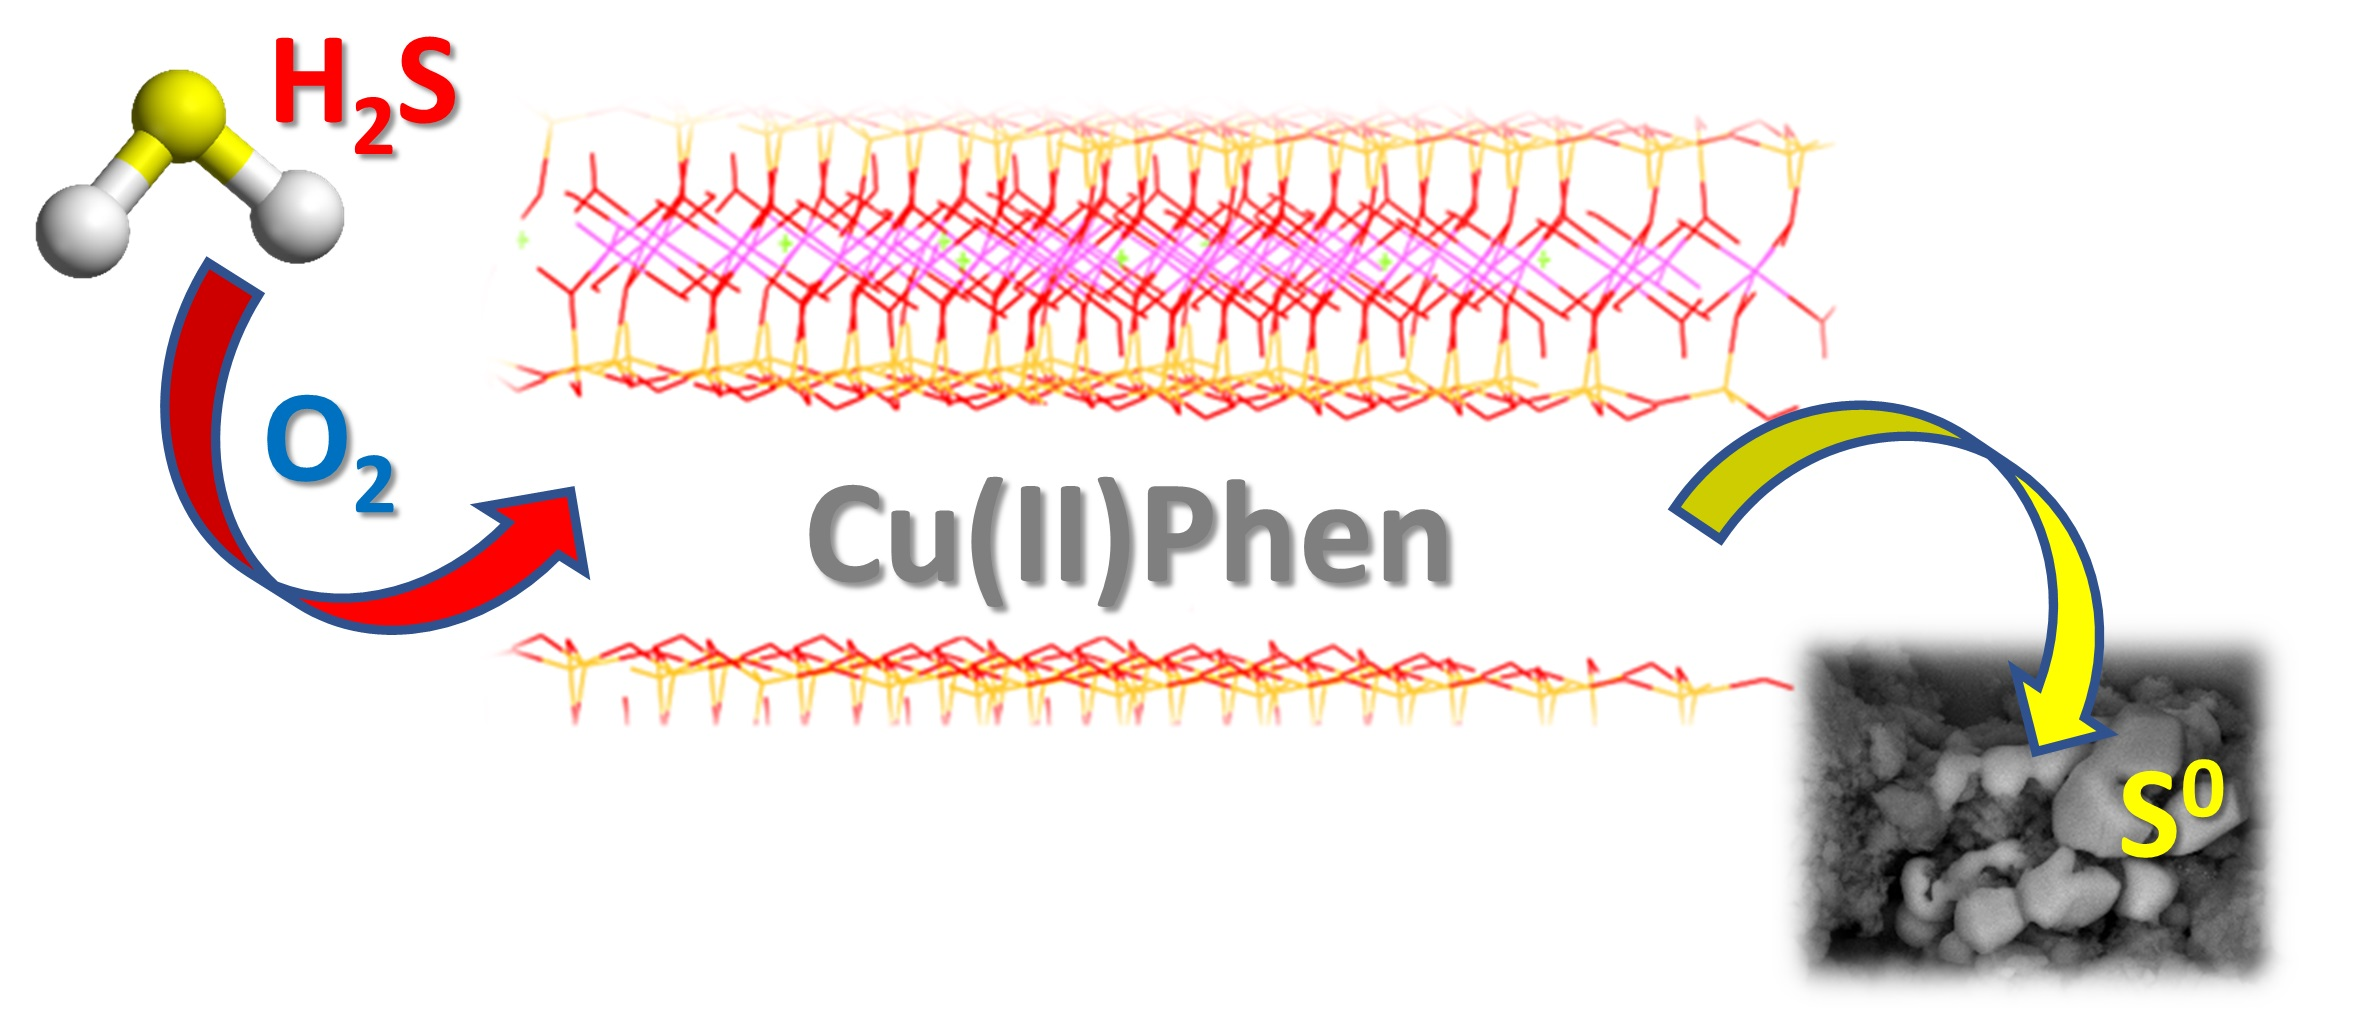
Interlayer-Confined Cu(II) Complex as an Efficient and Long-Lasting Catalyst for Oxidation of H2S on Montmorillonite

by
Elena Castellini
1,*,
Fabrizio Bernini
1,
Lorenzo Sebastianelli
1,
Claro Ignacio Sainz-Díaz
2,
Aida Serrano
3,4,
German R. Castro
3,5,
Daniele Malferrari
1,
Maria Franca Brigatti
1 and
Marco Borsari
1
1
Department of Chemical and Geological Sciences, University of Modena and Reggio Emilia, Via Campi 103, I-41125 Modena, Italy
2
Instituto Andaluz de Ciencias de la Tierra (CSIC-UGR), Av. de las Palmeras, 4, 18100 Armilla, Granada, Spain
3
SpLine, Spanish CRG BM25 Beamline at The European Synchrotron (The ESRF), 71 Avenue des Martyrs, F-38000 Grenoble, France
4
Instituto de Cerámica y Vidrio (ICV), Consejo Superior de Investigaciones Científicas (CSIC), Kelsen 5, E-28049 Madrid, Spain
5
Instituto de Ciencia de Materiales de Madrid (ICMM), Consejo Superior de Investigaciones Científicas (CSIC), Sor Juana Inés de la Cruz 3, E-28049 Madrid, Spain
*
Author to whom correspondence should be addressed.
Minerals 2020, 10(6), 510; https://doi.org/10.3390/min10060510
Submission received: 24 April 2020 / Revised: 26 May 2020 / Accepted: 27 May 2020 / Published: 31 May 2020
(This article belongs to the Special Issue Synthesis, Properties, and Applications of Expandable Layer Silicates)

Abstract

:
Removal of highly toxic H2S for pollution control and operational safety is a pressing need. For this purpose, a montmorillonite intercalated with Cu(II)-phenanthroline complex [Cu[(Phen)(H2O)2]2+ (Mt-CuPhen) was prepared to capture gaseous H2S under mild conditions. This hybrid material was simple to obtain and demonstrated an outstanding ability to entrap H2S at room temperature, retaining high efficiency for a very long time (up to 36.8 g of S/100 g Mt-CuPhen after 3 months of exposure). Sorbent and H2S uptake were investigated by elemental analysis, X-ray powder diffraction measurements, diffuse reflectance (DR) UV–Vis and infrared spectroscopy, thermal analysis and evolved gas mass spectrometry, scanning electron microscopy equipped with energy-dispersive X-ray spectrometer, and X-ray absorption spectroscopy. The H2S capture was studied over time and a mechanism of action was proposed. The entrapping involves a catalytic mechanism in which [Cu[(Phen)(H2O)2]2+ acts as catalyst for H2S oxidation to S0 by atmospheric oxygen. The low cost and the long-lasting performance for H2S removal render Mt-CuPhen an extremely appealing trap for H2S removal and a promising material for many technological applications.

Graphical Abstract

1. Introduction

Expandable layered aluminosilicate minerals, due to properties such as surface acidity, particle size and shape, high surface area, ion exchange, hydration, swelling, plasticity, rheological behavior, and reactivity towards organic and inorganic compounds, are widely used for many industrial applications as sorbents, catalysts, ion-exchangers, additives [1,2]. Among the various layered aluminosilicates, montmorillonite (Mt,), which is a 2:1 dioctahedral smectite [1], received great attention because of its surface properties, swelling, and ion exchange features that can be further enhanced by exchanging natural inorganic cations in the interlayer space (mostly Ca2+ and Na+) with other organic or inorganic species [3,4,5]. Because of their unique structure, low cost, natural abundance, and environment friendliness, both natural and exchanged Mt were proposed as adsorbent materials for removing multiple contaminants from aquatic systems [6], and more recently, also to capture airborne pollutants such as CO2, SO2, NOx, H2S, and volatile organic compounds (VOCs) [7,8,9,10,11,12].
Hydrogen sulfide, a common waste product of industrial processes, is a highly toxic, colorless, and smelly pollutant that occurs in several hydrocarbon sources such as natural gas, biogas, and crude oil. H2S is harmful to animals and human beings, and is also dangerous to industrial facilities in the gaseous form or in solution. Combustion of fuels containing H2S releases toxic sulfur oxides into the atmosphere that yield acid rain by reaction with water molecules. Therefore, removal of industrially derived H2S for pollution control and operational safety is a pressing need. To remove H2S effectively, several approaches were developed, such as adsorption, scrubbing, hydrodesulfurization, biological treatment, and catalytic oxidation [13].
Recently, porous materials (e.g., activated carbon, porous metal oxides, mesoporous silica, metal-organic and zeolite-like frameworks) with high sulfur removal capacity and selectivity, thermal durability, and good reproducibility attracted great attention for use in H2S adsorptive removal processes, particularly at low temperature, as they grant cost-effective approaches with deep H2S removal [13]. Usually the surface of these porous materials is functionalized with organic or inorganic functional groups to enhance and/or modify physical and chemical surface properties and reactivity. Amine grafting, heteroatom (nitrogen) doping, alkaline impregnation, and metal oxide incorporation are the most widely applied approaches for the surface functionalization of these porous structures [13].
Layered aluminosilicate microporous structures, such as pillared clays doped with metallic cations (usually Fe3+, Zn2+, and Cu2+) and/or clays intercalated with metal–organic functional groups were also tested for selective catalytic oxidation of H2S [13]. Recent studies dealing with the removal of sulfur gaseous compounds by means of different types of metal–organic functionalized Mt demonstrated that this mineral intercalated with Fe(III)-phenanthroline complex is one of the best performing materials [9,14]. The H2S trapping process involves a redox reaction between Fe3+ and a first S2− ion, followed by the binding of a second S2− ion to the metal center. It occurs at room temperature, is reversible, and does not require pretreatment [14].
Based on these premises, these materials deserve further investigation to explore new possible applications and developments. In this work, we studied the adsorption mechanism of H2S by montmorillonite intercalated with a Cu(II)-phenanthroline complex (Cu(II)Phen). Cu oxides are commonly used to catalytically oxidize adsorbed H2S gas, thus suggesting that H2S trapping efficiency of Mt intercalated with cation-phenanthroline complexes can be improved by employing copper instead of iron.

2. Materials and Methods

2.1. Preparation of H2S Sorbent Material

Montmorillonite STx-1b from Gonzales County (Monthalia, TX, USA) (Mt, for all other abbreviations see Appendix A) was obtained from the Source Clay Repository of the Clay Minerals Society. Mt was already fully characterized elsewhere [15]. Its main characteristics are briefly summarized: mineralogical composition, obtained from quantitative X-ray powder diffraction results (QXRDP), montmorillonite 73%, cristobalite 12.8%, tridymite 11.6%, quartz 0.12%, amorphous 2%; chemical formula, obtained by combining chemical data and QXRDP results, (Si7.753Al0.247) (Al3.281Mg0.558Fe0.136Ti0.024Mn0.002) (Ca0.341Na0.039K0.061)O20(OH)4; cation exchange capacity (CEC) 66.1 ± 2.1 meq/100 g. It was used as received, without further purification.
The H2S-sorbent material was obtained by exchanging Mt with a solution of a Cu(II)-phenanthroline complex, [Cu[(Phen)(H2O)2]2+ (hereafter Cu(II)Phen).
The same chemicals and procedures described by the authors in a previous study were used [11]. Specifically, CuSO4·5H2O was dissolved at room temperature in a well-stirred phenanthroline (Phen) solution in order to obtain a 6 mM solution of Cu(II)Phen; Mt (50 mg) was dispersed in 10 mL of this solution, shaken for 1 h at 250 rpm at room temperature, and then separated from the liquid phase via centrifugation at 14,000× g for 1 min. The final powder was washed several times with distilled water and then dried at 30 °C overnight. The resulting material, Mt-CuPhen, contains large amounts of Cu ions in the interlayer, 0.651 Cu2+ moles/kg. An extensive characterization of Mt-CuPhen material was described in detail elsewhere [11].

2.2. Exposure of Mt-CuPhen to H2S Gas Stream

The reaction tests were carried out in a continuous flow reactor made with a glass box covered by layer of aluminum foil, hosting an inner and outer gas hose. One hundred mg of Mt-CuPhen were dispersed on the bottom of the glass box. A mixture of H2S/air (samples exposed in aerobic conditions) and H2S/Ar (samples exposed in anaerobic conditions) was fluxed into the box at a constant H2S partial pressure of 250 Pa, controlled by calibrated mass flow controllers (Alltech Digital Flow Check-HR) and gas mixing valves. H2S adsorption tests were completed at different times (up to 3 months). The S content of Mt-CuPhen samples exposed to H2S (Mt-CuPhen-exp H2S) was determined by elemental analysis; measurements were repeated three times to obtain mean values with a statistical significance.

2.3. Characterization of Mt-CuPhen Exposed to H2S Gas Stream

The elemental analyses (C, N, and S) were performed using a Carlo Erba 1106 Elemental Analyzer. UV–Vis and diffuse–reflectance (DR) UV–Vis analyses were carried out by the Jasco V-570 Instrument equipped with an integrating sphere attachment (JASCO model ISN-470) to analyze the powder samples. BaSO4 was used as reference. X-ray powder diffraction (XRPD) measurements were performed by an analytical X’Pert PRO powder diffractometer equipped with an X’Celerator detector on standard glass slides in the 2–50° 2θ range. Analytical conditions were: incident beam, Cu Kα radiation (λ = 1.54184 Å) at 40 kV and 40 mA (nickel filtered); Soller slits, 0.04 rad; antiscatter mask, 20 mm; antiscatter slit, 1/4°; divergence slit, 1/4°. Diffracted beam: antiscatter mask, 5.0 mm; Soller slits, 0.04 rad; integration time, 30 s in continuous scanning (PSD length of 2.12° 2θ corresponding to a step size of 0.0170° 2θ per s). Quartz was used as calibration standard.
IR spectra (4000–400 cm−1) were recorded by a JASCO FT/IR 4700 spectrophotometer (resolution: 0.4 cm−1) with KBr used as the dispersing medium.
The morphology and elemental composition of samples were characterized by scanning electron microscopy (SEM) by using an FEI Quanta 200 ESEM and an energy-dispersive X-ray spectrometer attached to the Quanta 200 ESEM (X-EDS Oxford INCA-350 system EDX).
A Seiko SSC 5200 thermal analyzer equipped with a quadrupole mass spectrometer (ESS, GeneSysQuadstar 422) was employed in the thermal studies. The powdered samples (10 mg) were heated from 25 to 1050 °C in helium flowing. Gas analyses were carried out in multiple ion detection mode (MID) and different m/z ratios were considered (17 and 18 for H2O; 28 and 44 for CO2; 30 for NO and NO2; 33 and 34 for H2S; 46 for NO2; 48, 64, and 66 for SO2). Experimental conditions were: heating rate = 10°/min; heating range = 25–1050 °C; data measurement = every 0.5 s; purging gas = ultrapure helium, flow rate = 100 µL/min. Before starting measurements, samples were equilibrated for 15 min using a 100 μL/min flow of ultrapure helium [14].
X-ray absorption spectroscopy (XAS) spectra were measured at the Spanish CRG beamline BM25-Spline at the European Synchrotron Radiation Facility (ESRF), Grenoble (France). XAS spectra were collected at the Cu K-edge (8979 eV) in both transmission and fluorescence mode at room temperature on pellets prepared by mixing uniformly the powered samples and cellulose. The fluorescence signal was collected using a nitrogen cooled 13-element Si (Li) solid state detector (e2v Scientific Instruments) located at 90° with respect to the incoming X-ray beam, while the transmitted photons were measured with an ionization chamber gas-filled with 50% N2 and 50% Ar. The incident beam intensity was also monitored by using an ionization chamber with 100% N2. For all spectra, a metallic Cu foil was employed to provide an energy calibration for the monochromator. As reference materials, pure Cu2O, CuO, CuS, CuSO4·5H2O, and Cu3(CO3)2(OH)2 compounds were used. The XAS spectra were recorded over a wide energy range across the Cu K-absorption edge with 0.25 eV energy step in the X-ray absorption near-edge structure (XANES) region and 0.04 Å−1 in the extended X-ray absorption fine structure (EXAFS) region up to 15 Å−1. The X-ray absorption data were analyzed with a standard procedure using ATHENA software [16].

3. Results and Discussion

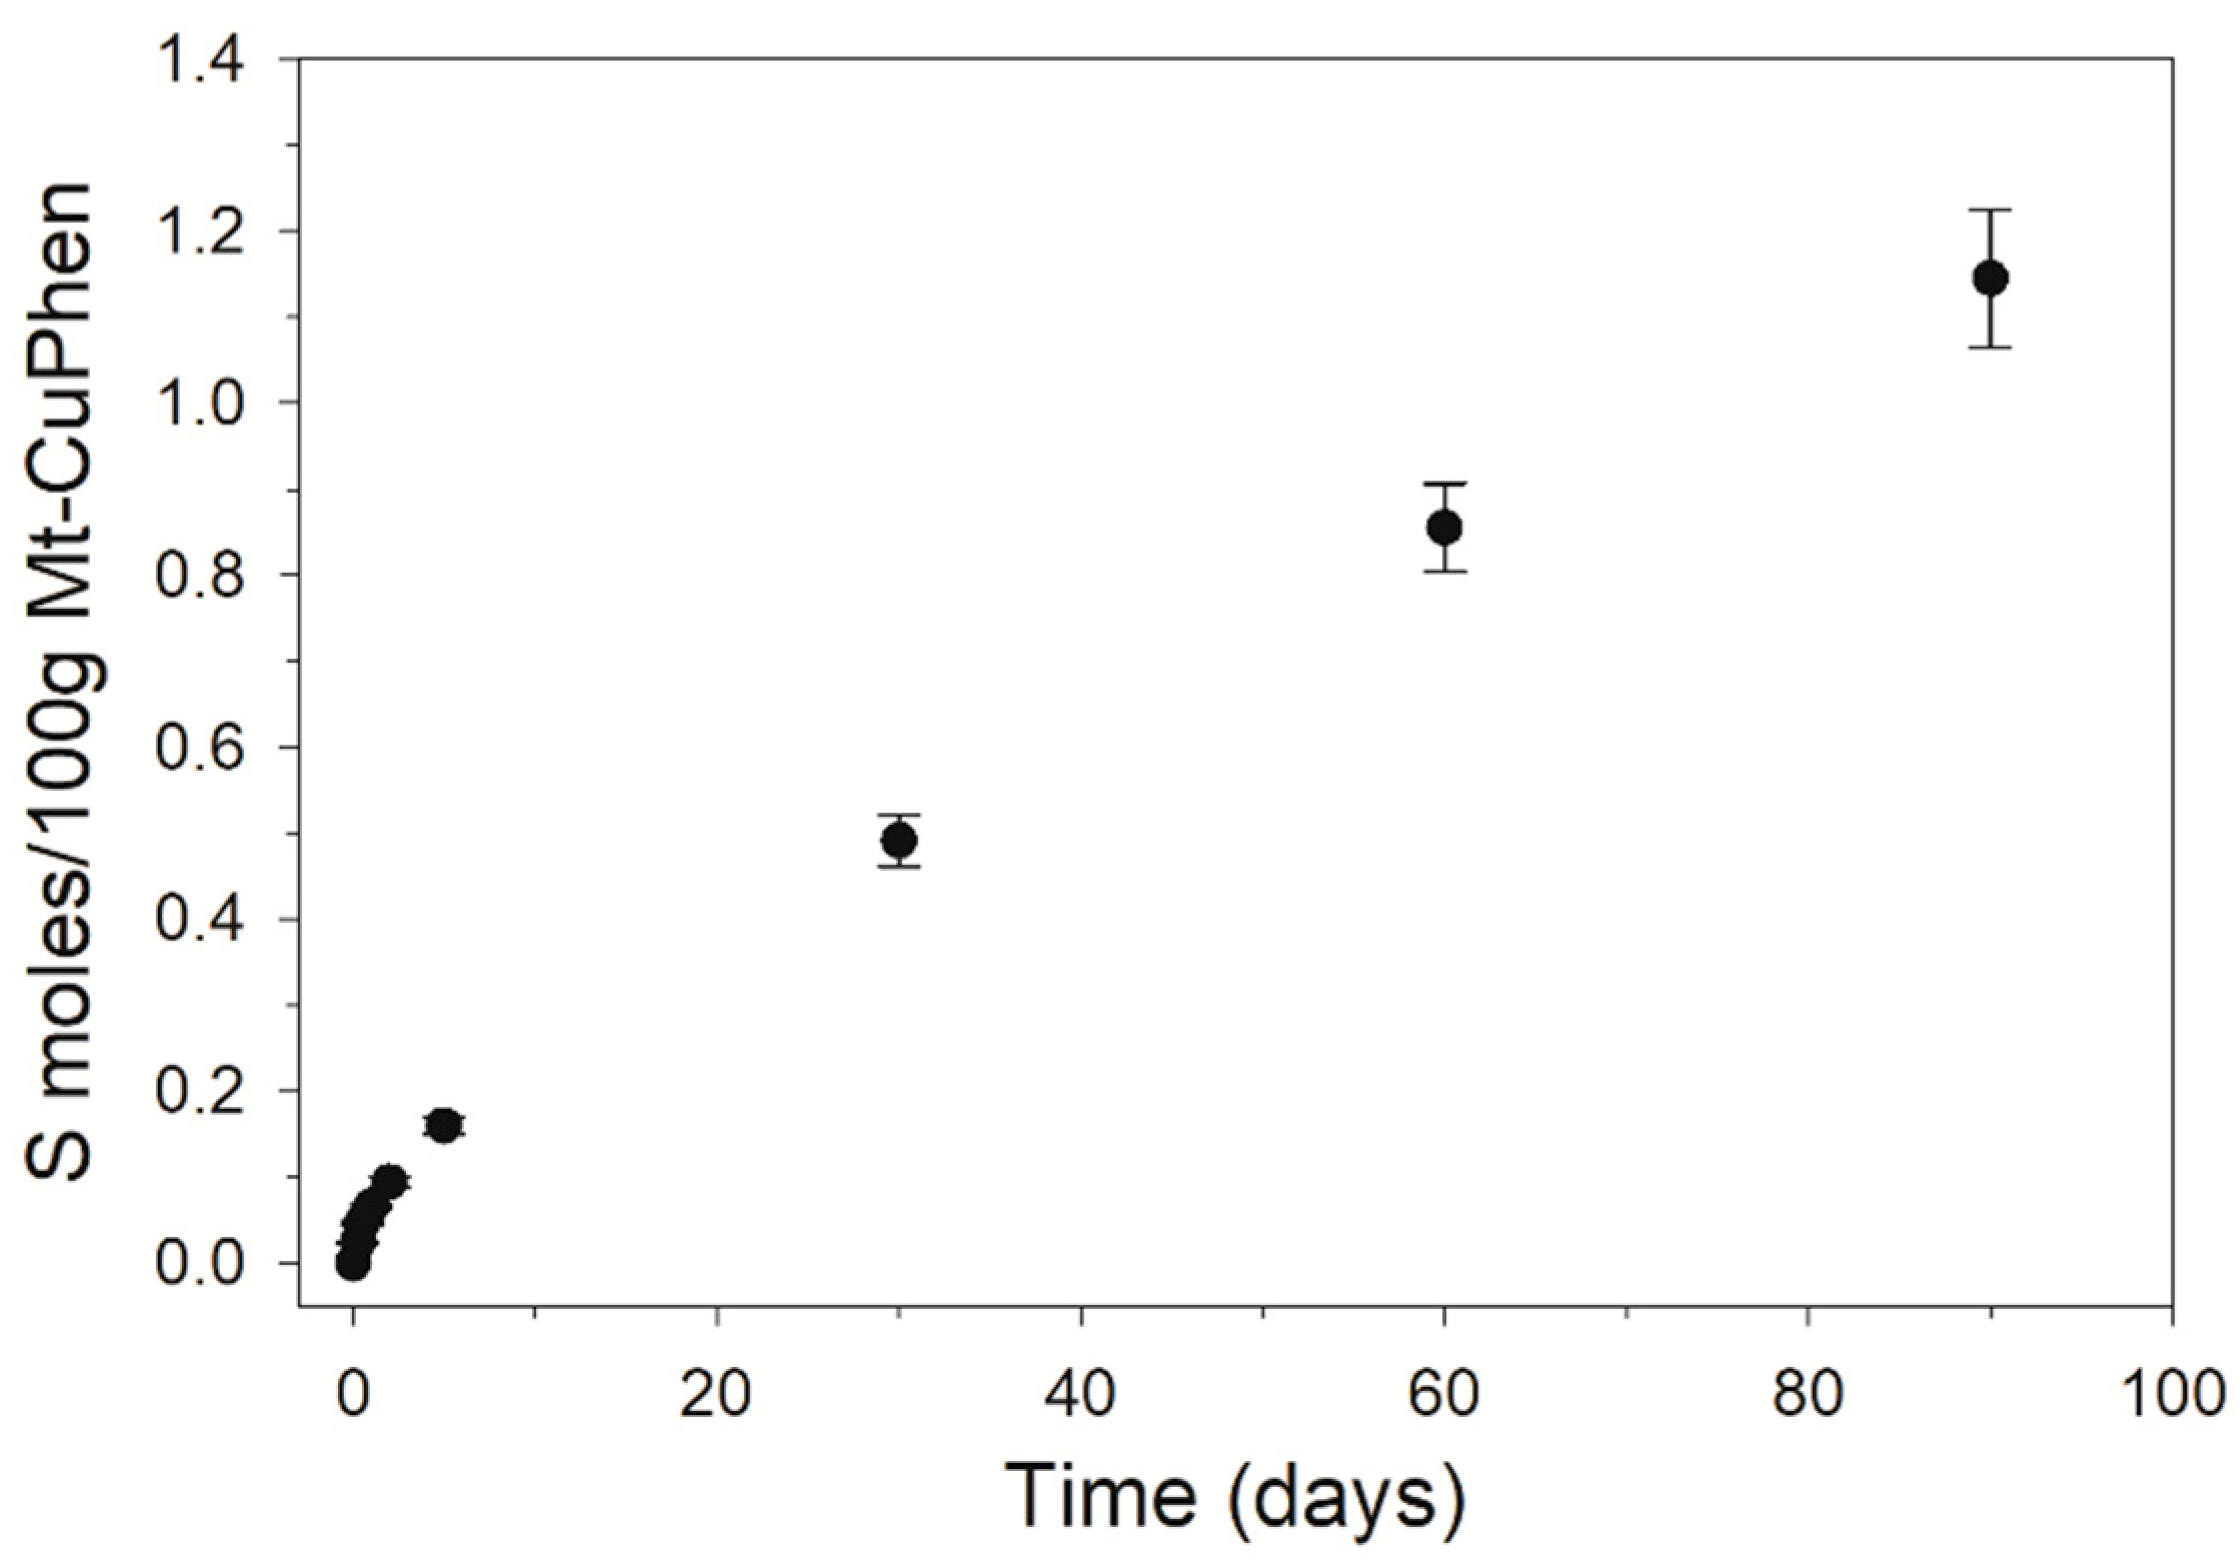
3.1. H2S Capture by Mt-CuPhen

The S amounts measured by elemental analysis on Mt-CuPhen exposed to H2S vapors for different times are plotted in Figure 1. Mt-CuPhen captures a great amount of sulfur (up to 1.15 S moles/100 g Mt-CuPhen after 3 months of exposure) and its immobilization ability lasts for a very long time.
The H2S capture proceeds without reaching completion, following a pathway that differs from that reported for Mt intercalated with the µ-oxo binuclear Fe(III)-phenanthroline 1:1 complex ([(H2O)3PhenFe-O-FePhen(H2O)3]4+, FePhen hereafter) [14]. For the latter, the H2S removal process occurs into two distinct steps: the former, lasting for about 20 h, is fast in the first 4 h and then slows down, while the latter is completed within about 110 h. Overall, the process lasts 110 h; eventually the exhaust material must be regenerated by a thermal treatment at 295 °C for reuse.
The larger maximum amount of S captured by Mt-CuPhen compared to Mt-FePhen (up to 1.15 moles (36.8 g) of S/100 g vs. 0.12 moles (3.8 g) of S/100 g, respectively) and the longer uptime of the material indicate a radical change in the entrapping mechanism [14].

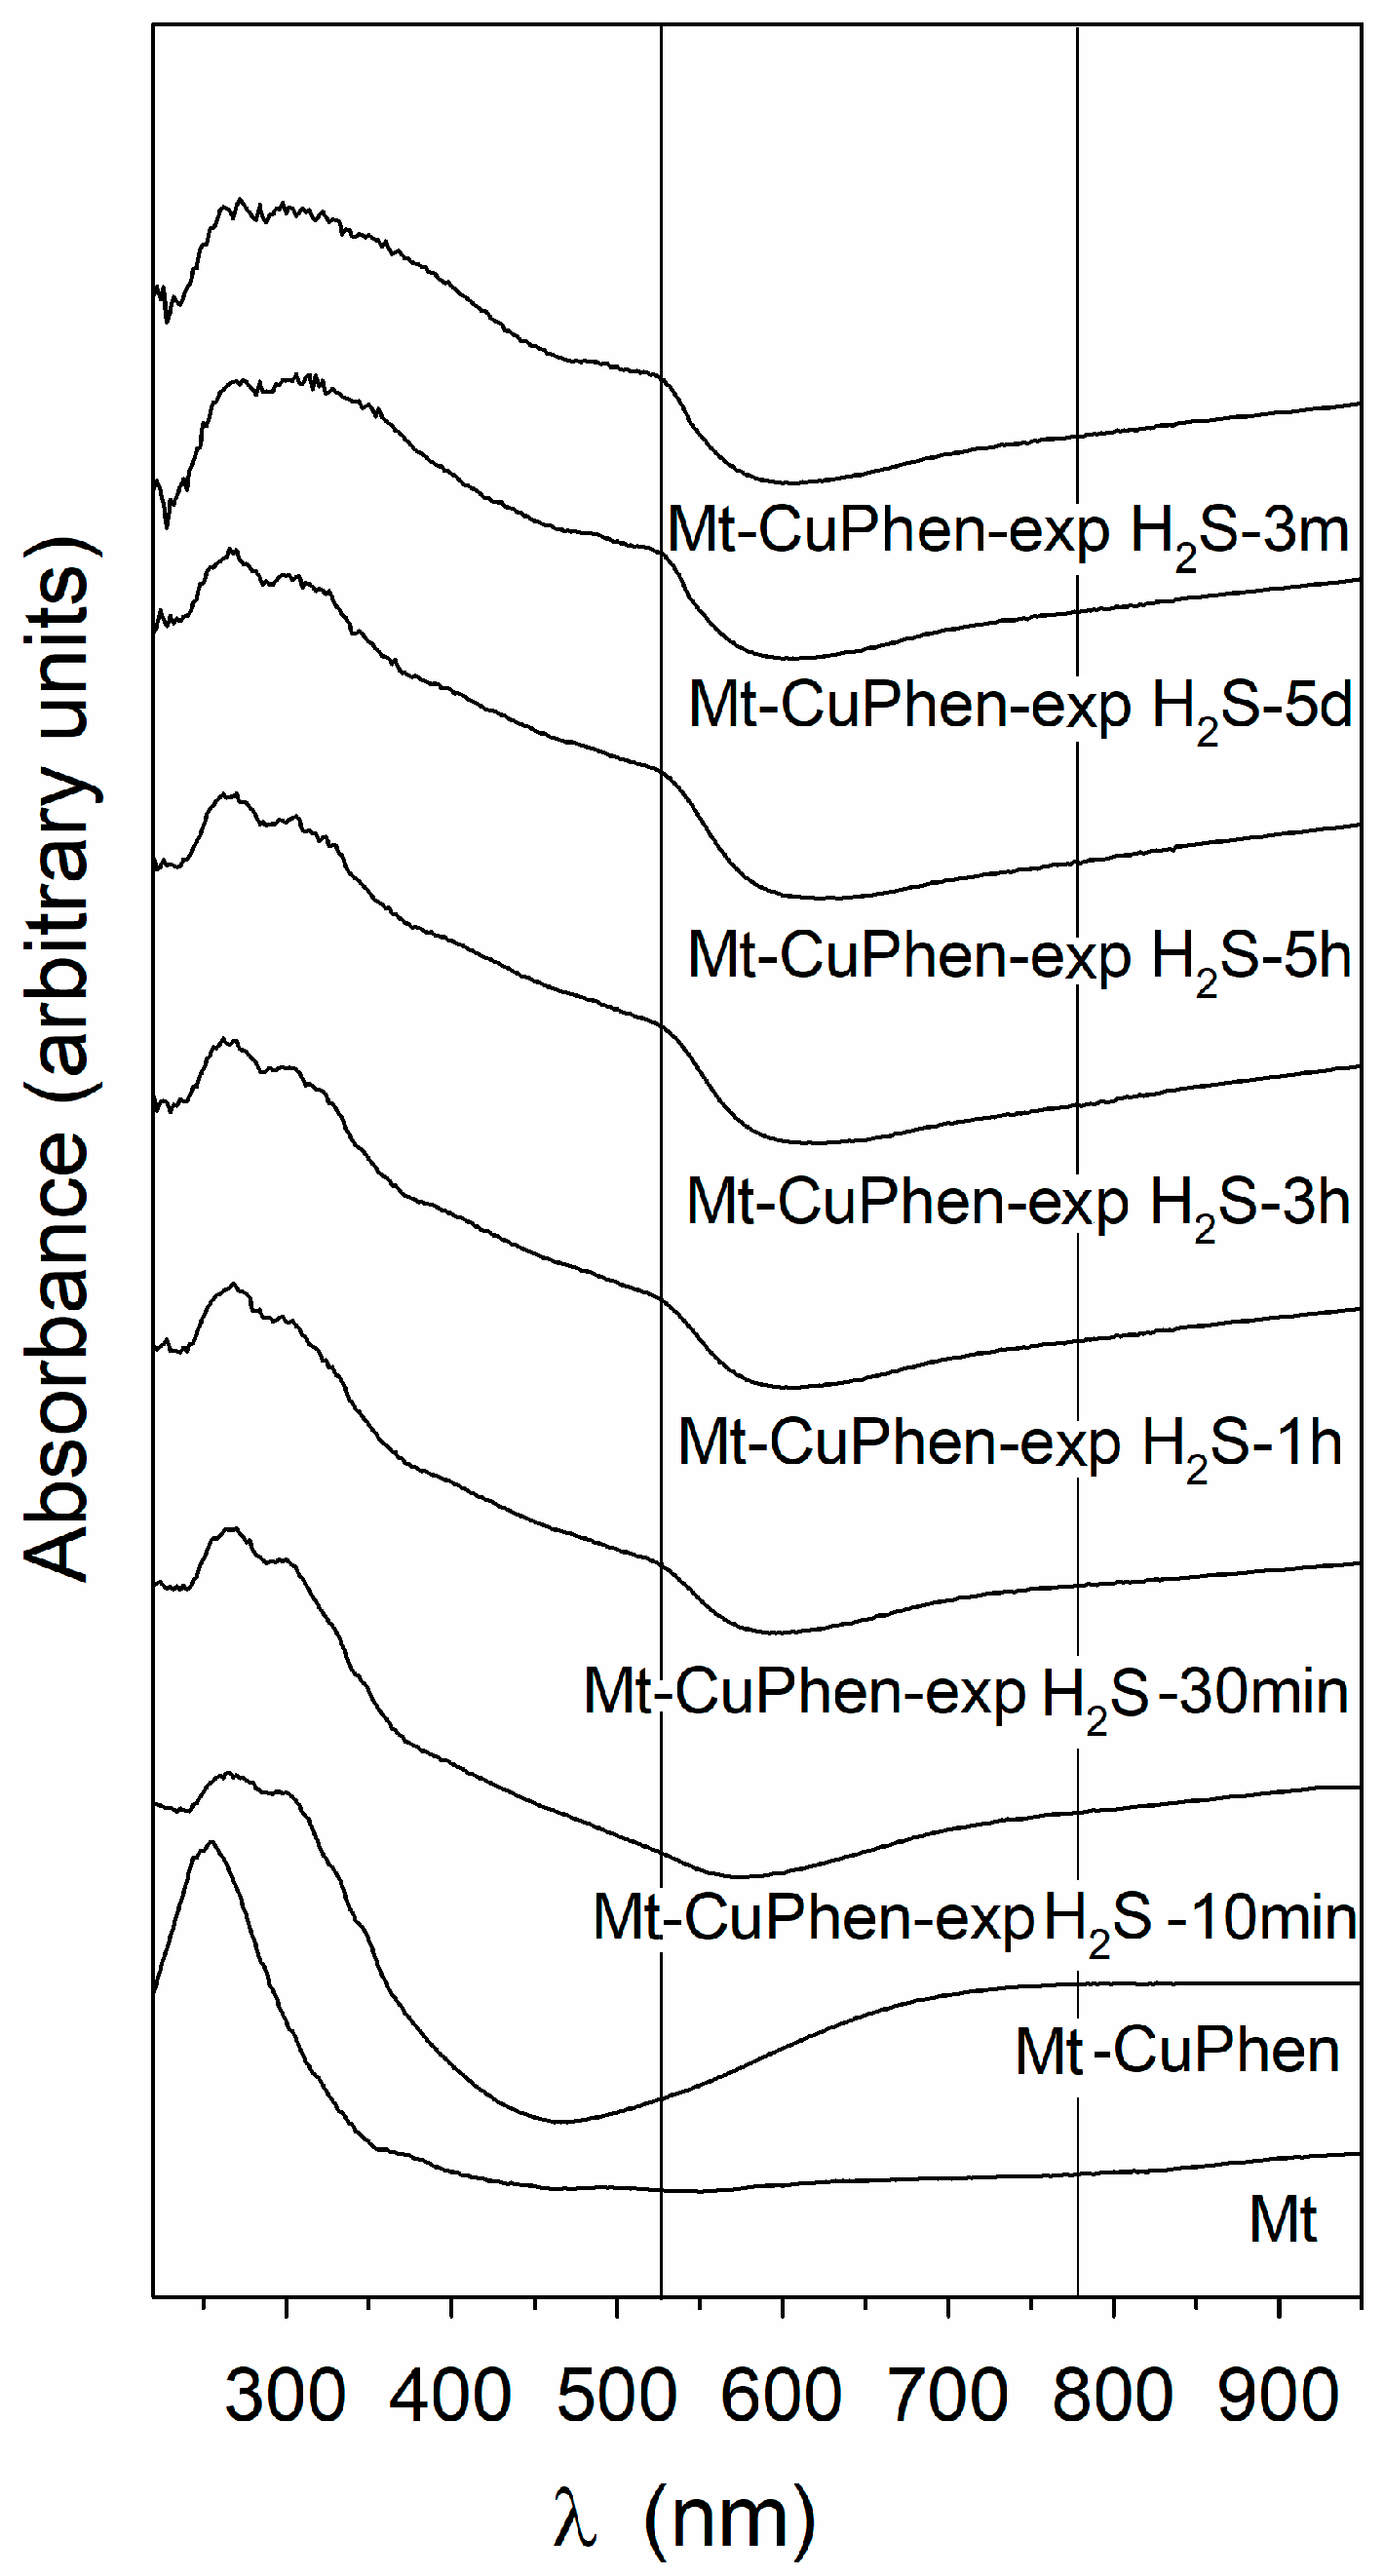
3.2. DR UV–Vis Spectra

The diffuse–reflectance (DR) UV–Vis spectra of Mt-CuPhen in the range 200 ≤ λ ≤ 1000 nm before and after exposure to H2S are shown in Figure 2. As described previously [11], when compared to Mt, Mt-CuPhen shows: (i) the appearance of a signal at λ = 270 nm corresponding to the overlap of Mt (λ = 256 nm) and Cu(II)Phen (λ = 272 nm) signals; (ii) a band at λ = 300 nm (π → π* transition of phenanthroline bond to Cu2+); (iii) three shoulders at λ = 316, 332, and 350 nm (related to phenanthroline transitions); (iv) a large band at about λ = 780 nm, due to Cu2+ d → d transition); and (v) a band at λ = 920 nm, most likely associated to H2O molecules (overtone) related to Cu2+, due to the adsorbed Cu(II)Phen.
When Mt-CuPhen is exposed to H2S, its spectrum changes dramatically (Figure 2). A well-defined shoulder at about λ = 520 nm appears, while the absorption band at λ = 780 nm drops down. Both bands, however, coexist in the spectra recorded at different exposure times (from 10 min to three months), although a change in the absorbance ratio occurs. The new band at λ = 520 nm can be confidently attributed to Cu(I)Phen complexes, suggesting that the capture of H2S involves a Cu(II) reduction step. The spectra are very similar to those for Cu(II)Phen intercalated in Mt reduced with ascorbic acid and then exposed to heptanethiol vapors. In addition, for this case, an absorption band related to Cu(I)Phen-thiolate complex appears at about 530 nm [17,18]. Likewise, the profiles of the DR UV–Vis spectra previously obtained for Mt-FePhen exposed to H2S gaseous streams show an intensity decrease for the band at λ = 374 nm, attributed O2−(bridge) → Fe(III) charge-transfer transition, typical of the μ-oxo ferric complexes, together with a concomitant increase in the band at λ = 520 nm, due to a d → π* metal-to-ligand charge transfer of [Fe(II)Phen]2+ type complex, suggesting a Fe(III) to Fe(II) reduction [14].

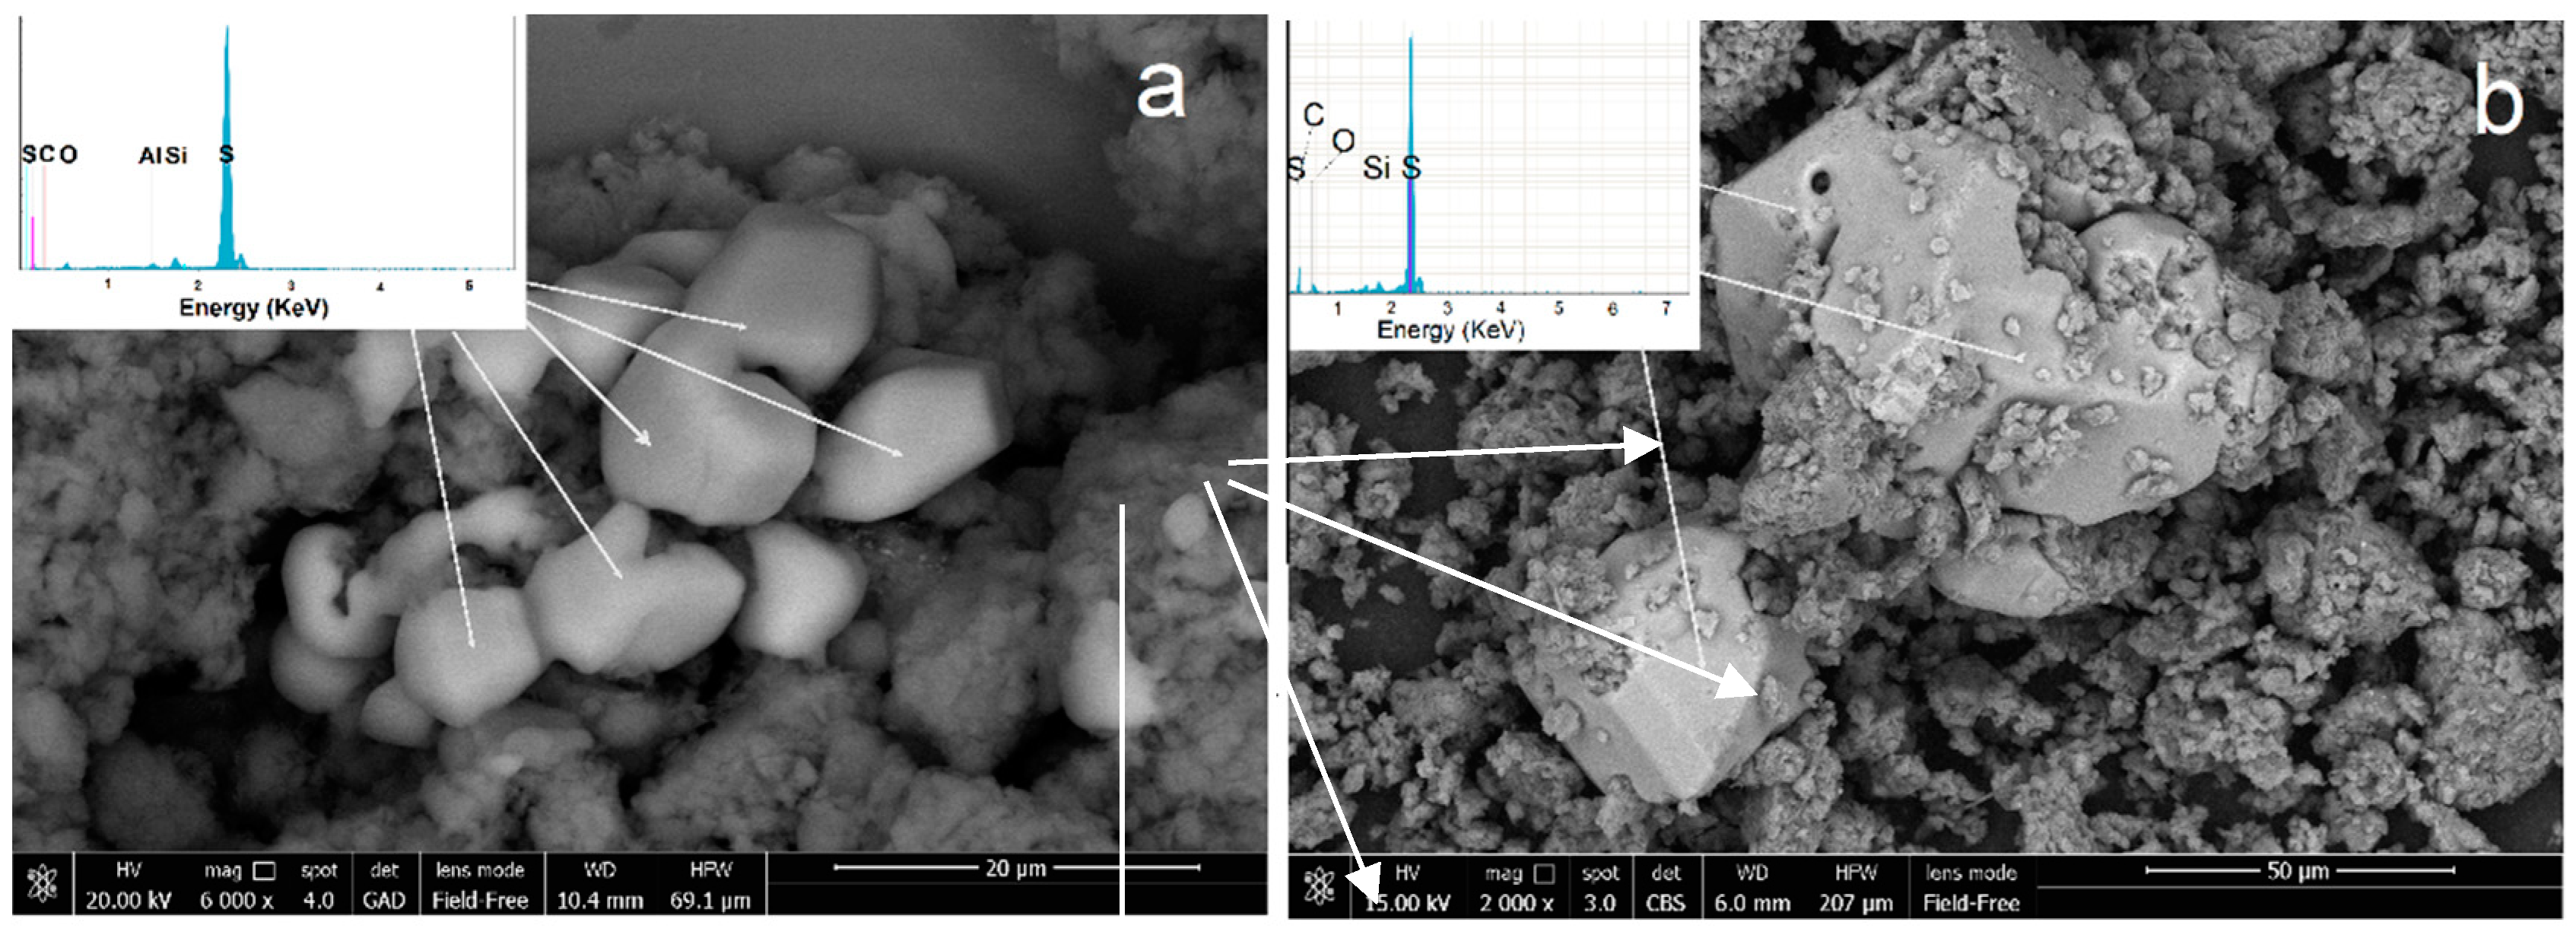
3.3. Scanning Electron Microscopy (SEM) and Energy Dispersive X-ray Spectrometry (EDX)

SEM images (Figure 3) show the formation on the Mt surface of crystals with a size of about 5–10 µm (Figure 3a) and about 10–50 µm (Figure 3b) for Mt-CuPhen exposed to H2S for 3 days and 3 months, respectively. The polyhedral shape of the crystals becomes well defined and the size increases with increasing the exposure time. As shown by EDX, these crystals are mainly constituted by elemental S; minor signals related to Al and Si are probably due to the Mt substrate. Therefore, the final product of the interaction of Mt-CuPhen with H2S is well-crystallized sulfur.

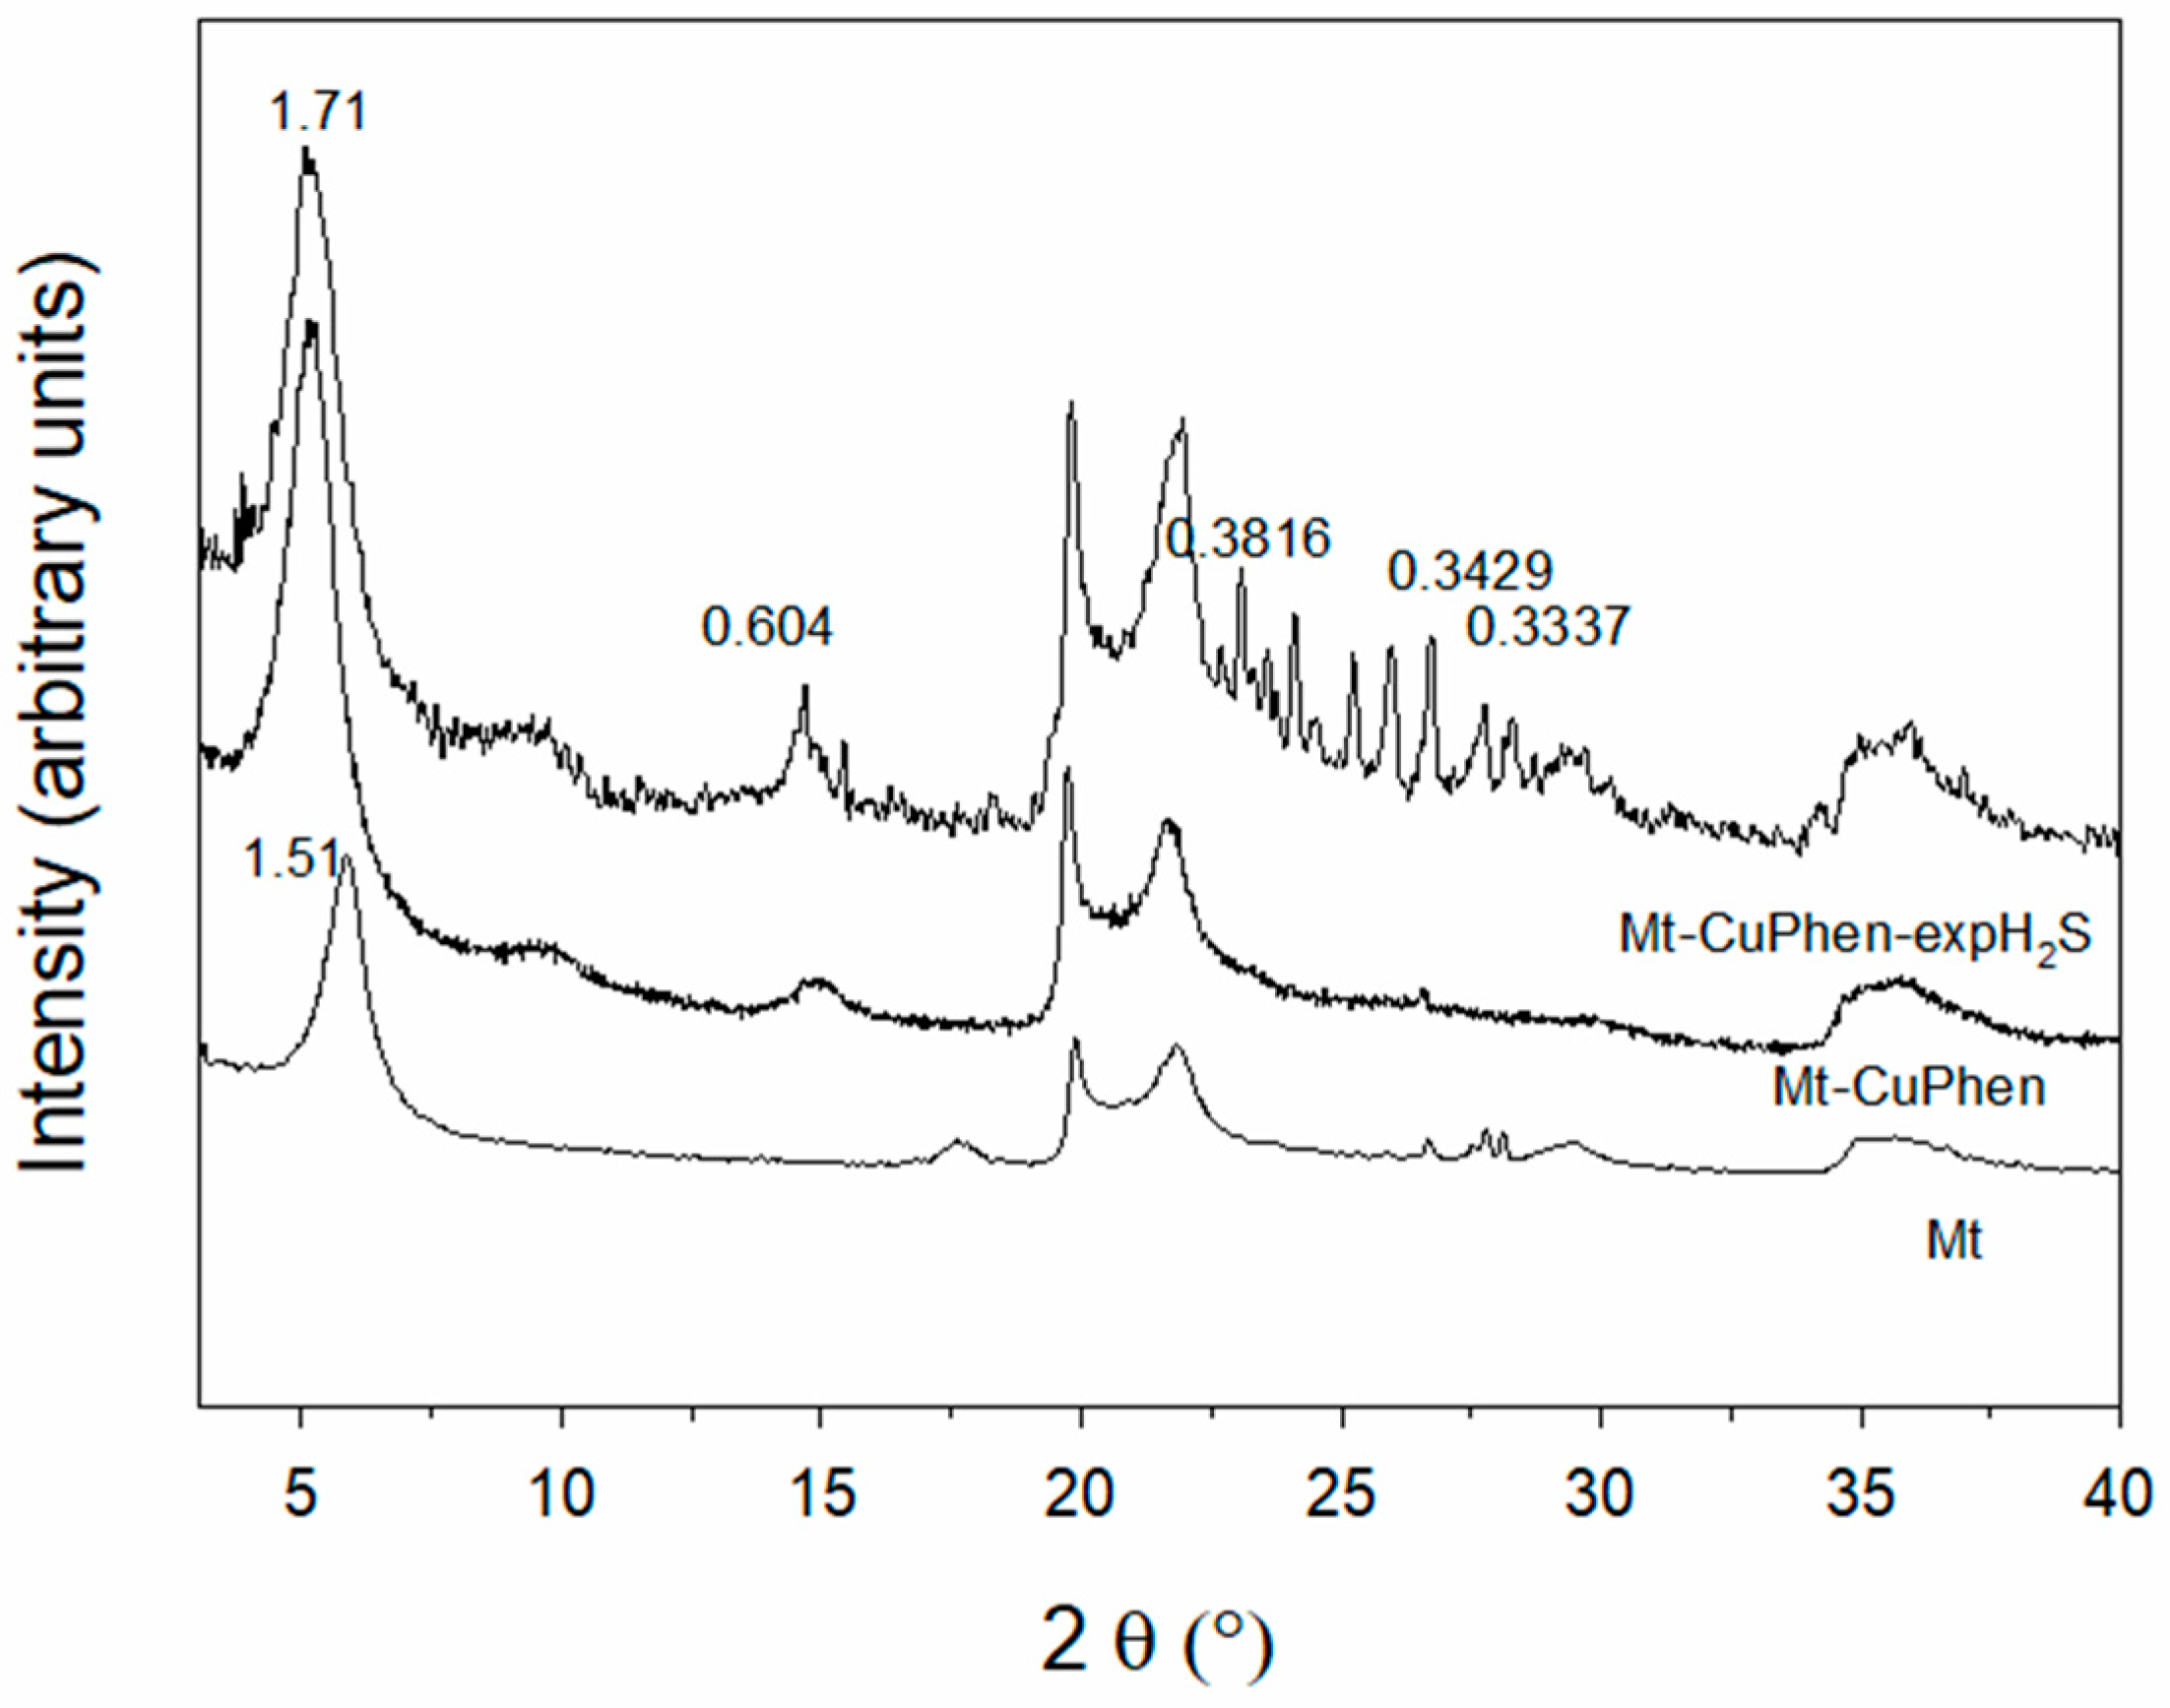
3.4. X-ray Diffraction (XRPD)
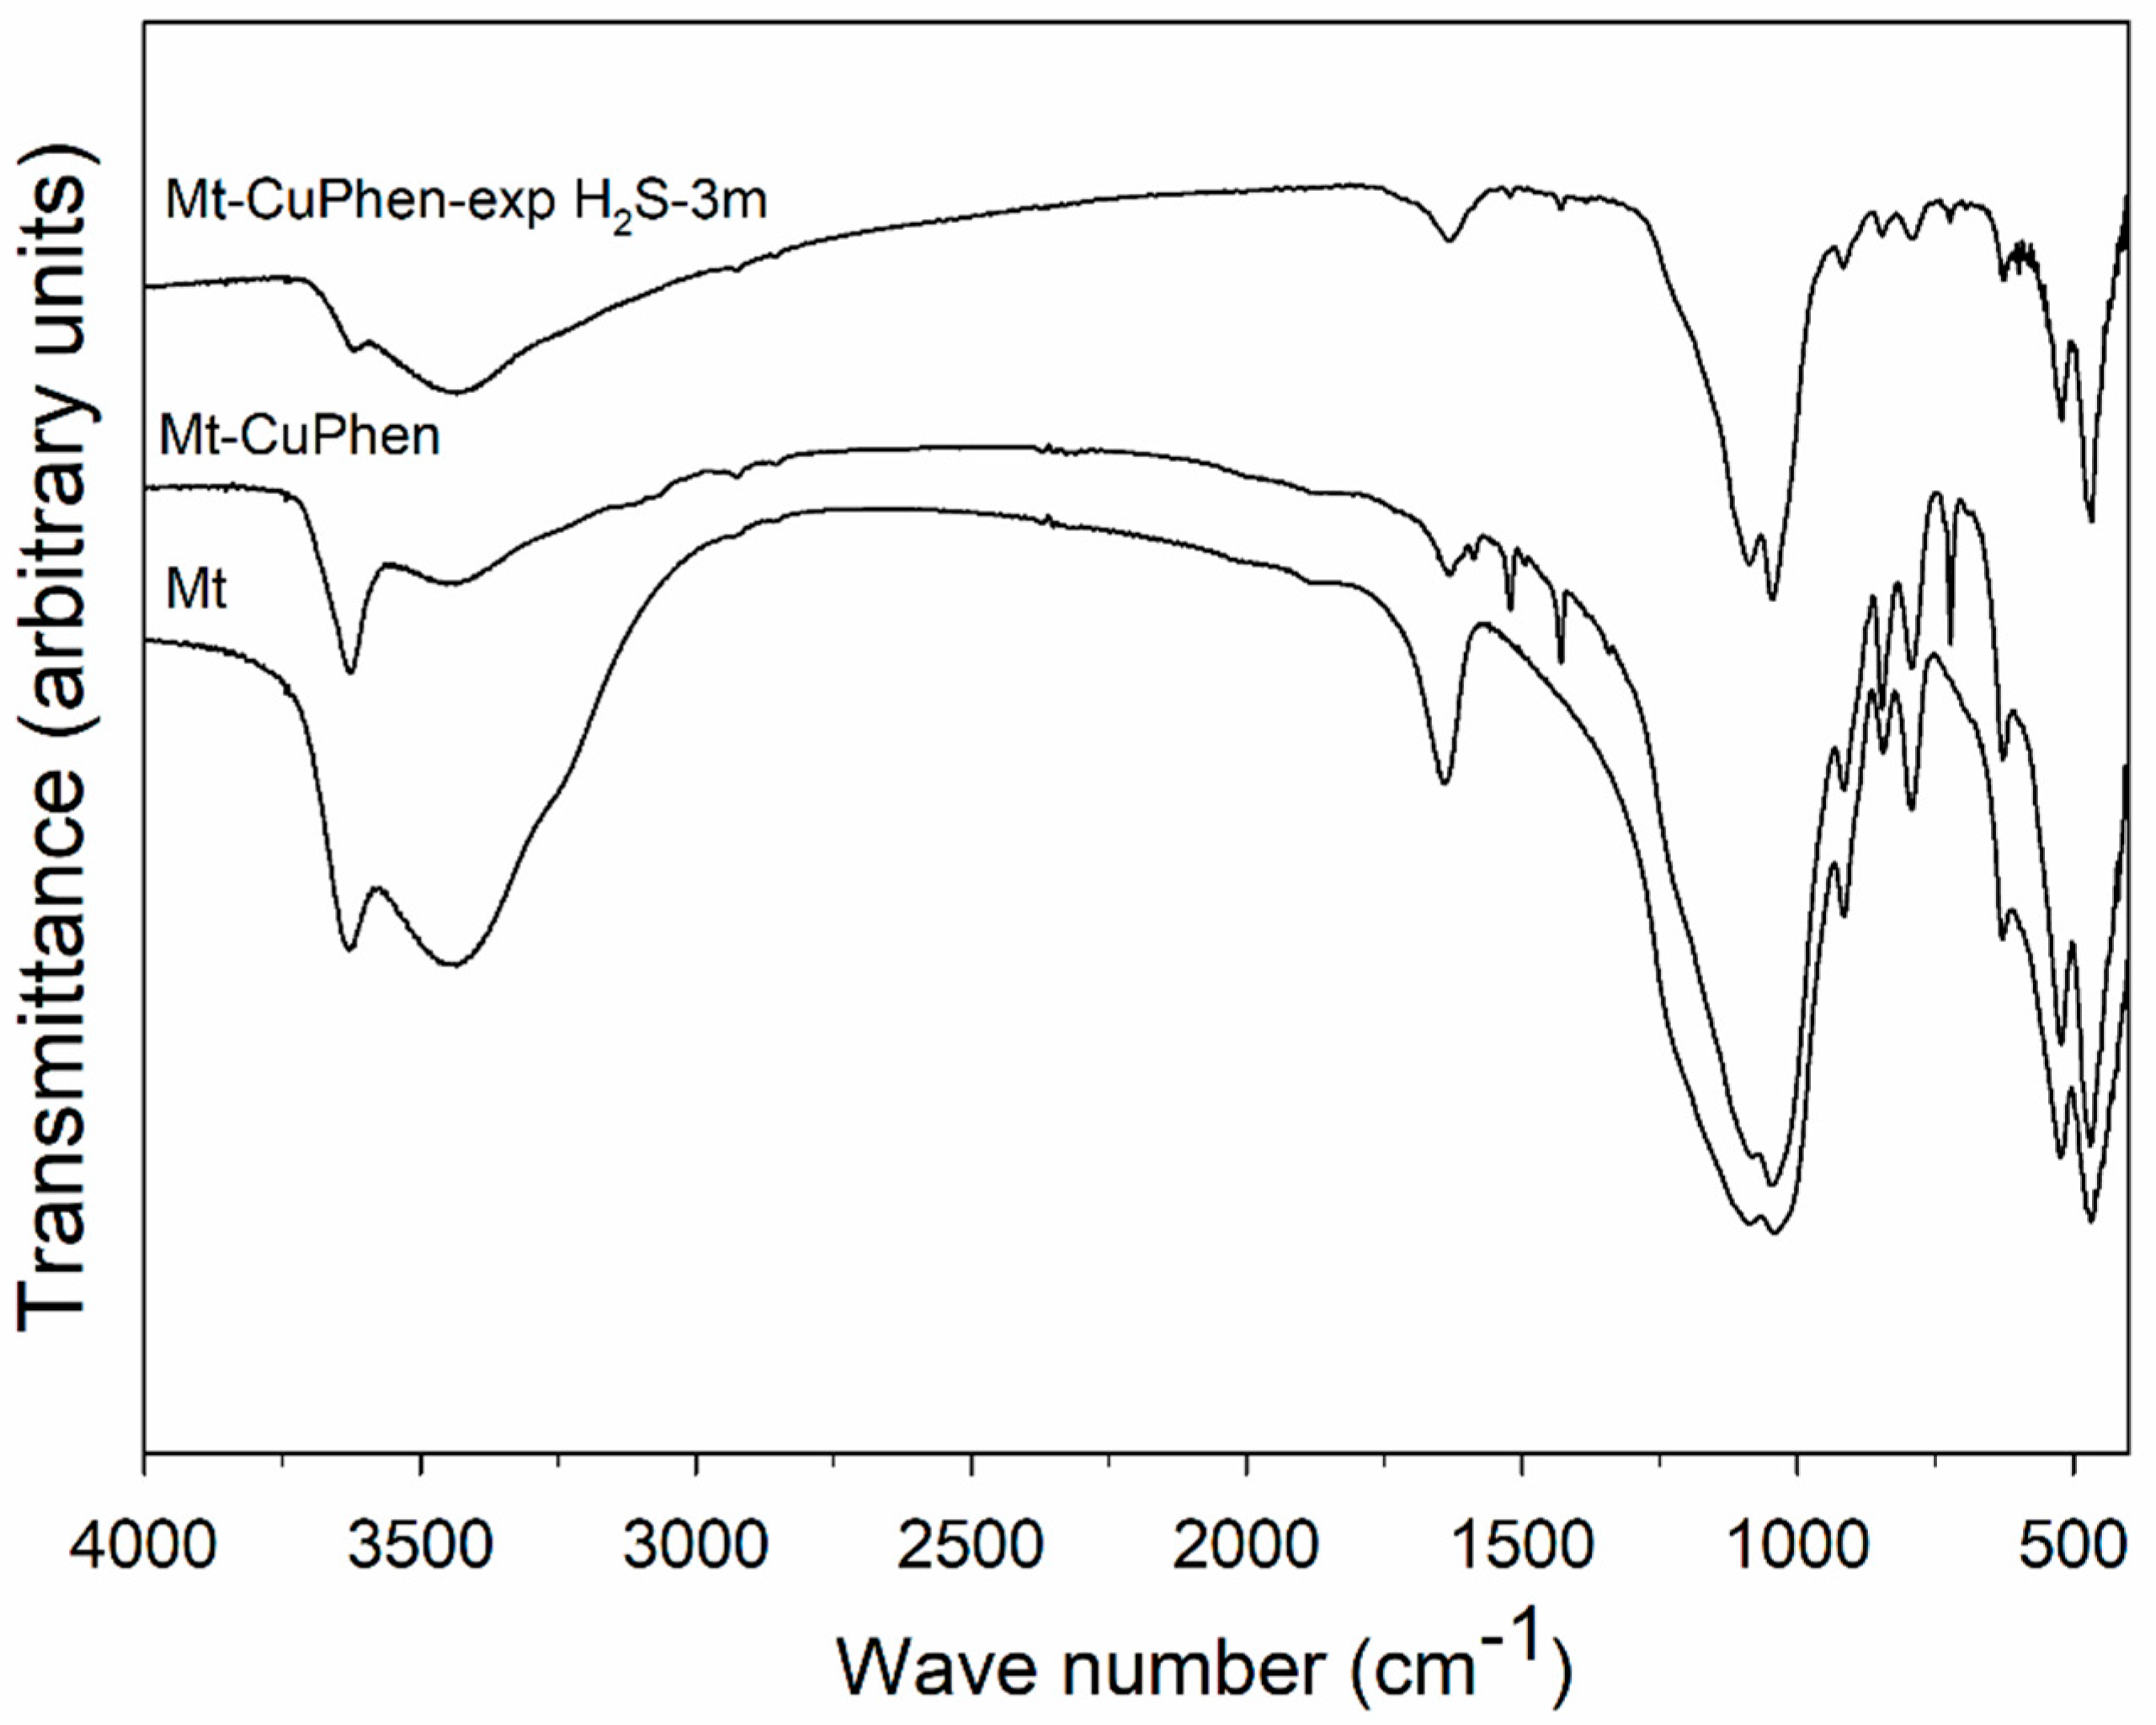
XRPD analysis was carried out on Mt-CuPhen samples before and after a three-month exposure to H2S in order to better recognize the sulfur phase.
The XRPD patterns (3 ≤ 2θ(°) ≤ 40) of Mt-CuPhen before and after exposure are shown in Figure 4. As discussed previously [11,15], the diffraction peaks of Mt-CuPhen with respect to Mt show: (i) a shift towards higher d values of d001 reflection (d001 Mt = 1.51 nm; d001 Mt-CuPhen = 1.71 nm), suggesting that CuPhen species coordinated by sulfate groups, which are about 0.71 nm thick, that occupy the interlayer positions; (ii) higher order XRD reflections, which are approximate multiples of the 2θ angle of the 001 reflection [19], suggesting the presence of more ordered domains.
The exposure of Mt-CuPhen to H2S does not affect the Mt-CuPhen d001-spacing. The d001 peak position is always at 1.71 nm. However, some additional peaks (e.g., at 0.6040, 0.3816, 0.3429, 0.3337 nm) were recognized, which can all be related to rosickyite (i.e., monoclinic sulfur), as evaluated by means of the PANalytical X’Pert HighScore software and the ICDD PDF-2 database. These results agree with the outcome of the SEM/EDX analysis, namely that the final reaction product of the interaction between Mt-CuPhen and H2S gas is crystalline sulfur.

3.5. FTIR Spectra

To expand the depth of our analysis of the mechanism of hydrogen sulfide immobilization, FTIR spectra for Mt-CuPhen before and after exposure to H2S were recorded (Figure 5). The two samples showed the typical spectrum of montmorillonite-based material, namely an absorption band centered at 3626 cm−1 for Mt-CuPhen and 3620 cm−1 for Mt-CuPhen-exp H2S-3m due to the stretching vibration of octahedral OH, a broad band centered at about 3435 cm−1, due to νOH modes of H2O, a band at 1630 cm−1 (δH2O for water bending vibration), at 1086 and 1042 cm−1 (Si(Al)-O bonds stretching), and between 700 and 950 cm−1 (structural OH-bending mode) [15].
Additional bands typical of Cu(II)Phen between 3000 and 3200 cm−1 (aromatic ring C-H stretching), at 1588, 1522, 1495, and 1429 cm−1 (C–C and C–N stretching of the Phen ring) and at 722 cm−1 (C–H out-of-plane bending of heterocyclic ring) are also evident [14].
The comparison of Mt-CuPhen spectra before and after exposure to H2S shows very few differences. In particular, no S–H stretching vibration characteristic of H2S is observed between 2500 and 2625 cm−1 in the Mt-CuPhen-exp H2S-3m spectrum, indicating the absence of any physisorbed H2S (Figure 5) [20]. Of note, elemental sulfur cannot be detected with FTIR because of the absence of a distinct signature. In addition, the bands at around 1415 and 1380 cm−1, indicative of sulfate ions, are not evidenced in the Mt-CuPhen-exp H2S-3m spectrum [14,21,22].
In both samples, changes in the bands related to ν(OH) and δH2O of water molecules, clearly visible in Mt, are observed. In particular, an intensity decrease occurs in the sample not exposed to H2S.

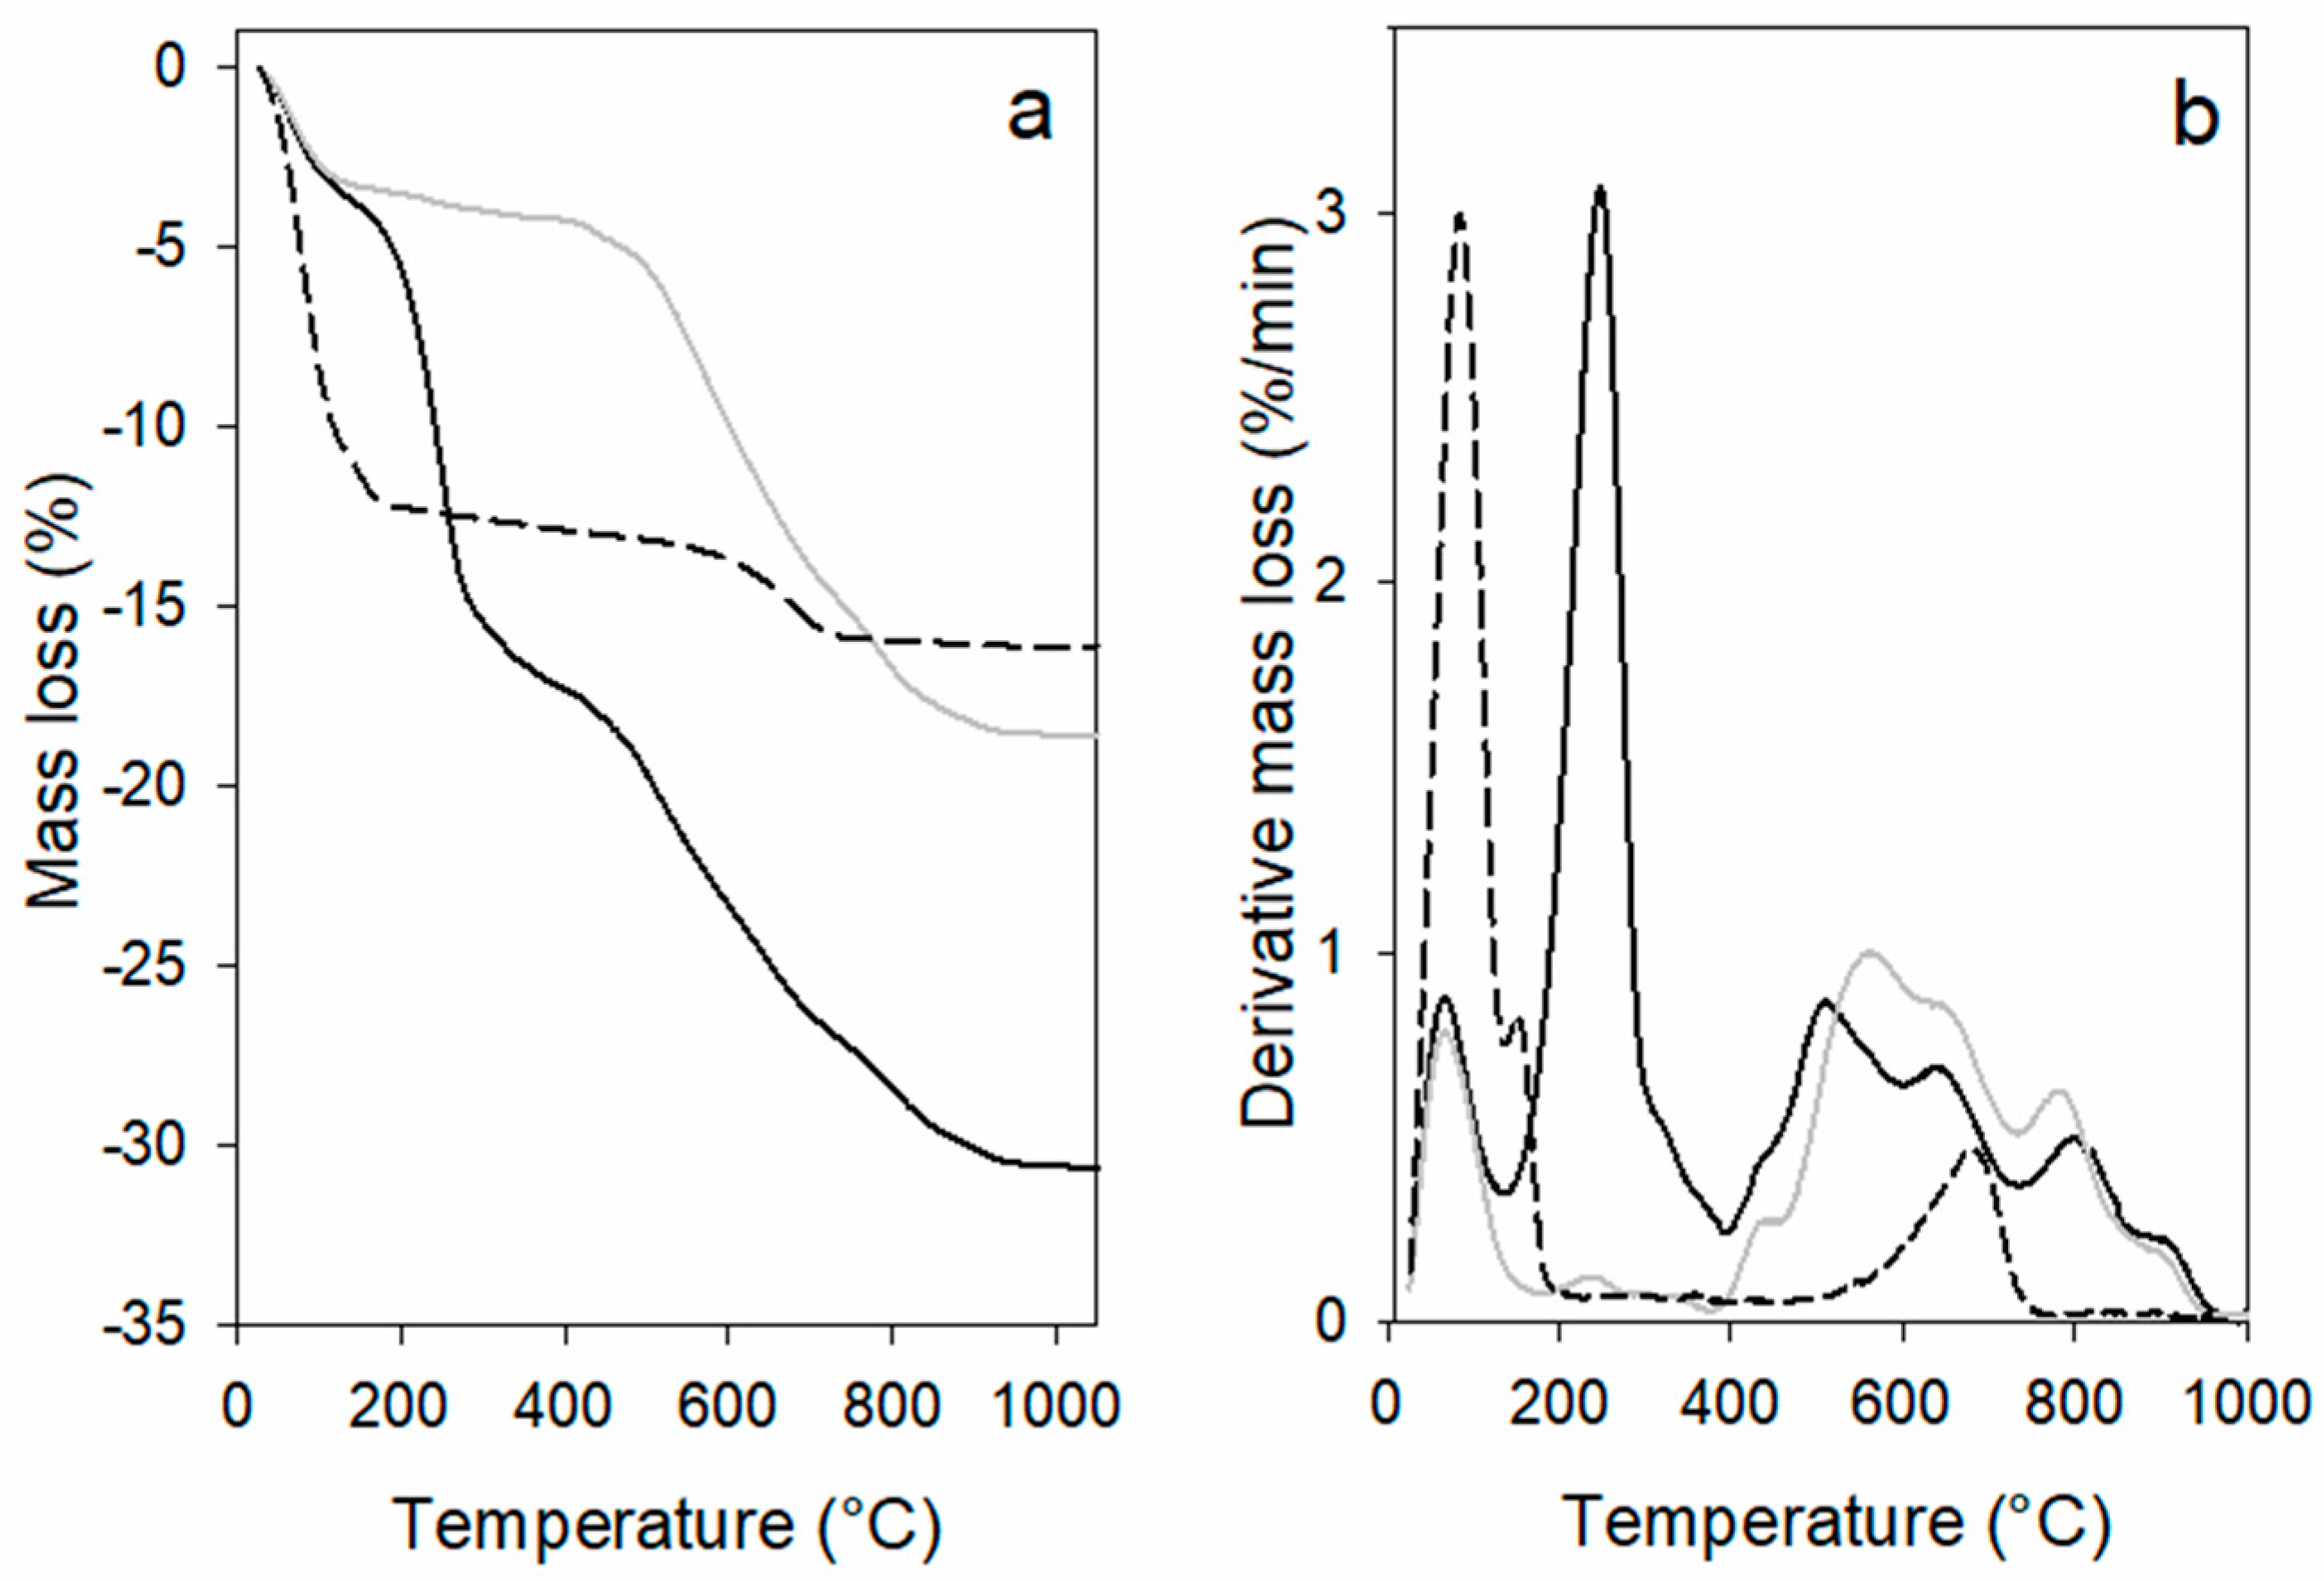
3.6. Thermal Analysis of Mt-CuPhen before and after Exposure to H2S

Thermogravimetric analyses (TGA), their first derivative signals (DTGA), and mass spectrometry curves of gases evolved during heating (m/z = 18 and m/z = 64) of Mt-CuPhen and Mt-CuPhen-exp H2S-25d are plotted in Figure 6 and Figure 7.
Attention was focused on the reactions occurring in the temperature range 25 °C ≤ T ≤ 400 °C as most of the effects related to this study occurs in this range. At higher temperature, thermal tracings of Mt-CuPhen-exp H2S-25d are similar to those obtained for Mt-CuPhen discussed previously [11,18].
TGA curves of Mt-CuPhen, before and after H2S exposure, show a mass loss (Δm%) associated with a broad peak in DTGA tracing at about 80 °C (Δm% Mt-CuPhen = 3.32; Δm% Mt-CuPhen-exp H2S-25d = 3.63; Figure 6). For both samples the mass loss related to this effect, linked to the loss of outer-sphere H2O (m/z = 18, Figure 7), is lower compared to Mt (Δm% in pristine Mt = 10.6) [15]. The thermal effect at about 150 °C, that in untreated Mt is associated to the loss of inner-sphere H2O, completely disappears. The amount of water in the sample exposed to H2S is slightly larger than that prior to exposure (Figure 7), in agreement with the FTIR data.
A second large mass loss (Δm% = 13.10) is observed for Mt-CuPhen-exp H2S-25d sample between 160 and 360 °C and is associated to a strong effect centered at 235° in DTG tracing. This mass loss can be confidently attributed to the oxidation of elemental sulfur also observed by SEM/EDX and XRPD analyses. Accordingly, an associated release of SO2 was detected by mass analysis (Figure 7, m/z = 64). Pure H2S is not significantly adsorbed by Mt-CuPhen, since its release should be observed at temperatures lower than 120 °C [20,21].

3.7. XAS Analysis of Mt-CuPhen before and after H2S Exposure

The XANES study at the Cu K-edge of Mt-CuPhen before and after H2S exposure under different conditions was carried out to gain information on the Cu oxidation state, coordination symmetry, and electronic structure. XANES spectra of Mt-CuPhen and reference compounds are reported in Figure S1 and strictly resemble those already reported and discussed elsewhere [18].
In Figure S1a, Cu reference compounds with formal 2+ oxidation state display different position, intensity, and shape of the absorption edge, which can be attributed to the different nature of the ligand and to Cu local geometry [23,24,25,26,27]. Changes also occur for the Cu(II)Phen crystals and Mt-CuPhen material (Figure S1b). The reference compounds CuO and CuSO4·5H2O, both containing Cu(II), show differences in the XANES region that can be attributed to the different Cu coordination (i.e., square planar geometry for CuO and octahedral geometry for CuSO4·5H2O) [26]. The XANES profile of Cu(II)Phen crystals (Figure S1b) is closer to that of CuSO4·5H2O; however, it shows a pre-edge of low intensity, an absorption edge moved to higher energy with respect to CuSO4·5H2O, and a whiteline of high intensity. These features indicate that a certain distortion of the octahedral coordination of Cu(II) center occurs [11,18]. The XANES signal of Mt-CuPhen is still similar to that for Cu(II)Phen crystals, but show clear intermediate characteristics between CuO and Cu(II)Phen, probably due to an even more pronounced distortion of the octahedral coordination of Cu(II) or even a decrease in its coordination number (possibly from six to five, thus assuming a square pyramidal geometry) [26]. Figure S2 shows the evolution of Mt-CuPhen XANES spectrum at different H2S exposure times. After 12 h exposure to H2S vapors (Mt-CuPhen-exp H2S-12h), a shift of the absorption edge towards lower energies occurs, consistent with a reduction of Cu(II) to Cu(I) and a decrease of both peak intensity at the absorption edge (around 8982 eV) and of the whiteline (around 8997 eV). These features are also evident in XANES spectrum obtained on the sample exposed for 5 days to H2S (Mt-CuPhen-exp H2S-5d), afterwards the modifications of the XANES signal are slight and within the measurement resolution. The XANES signals of Mt-CuPhen samples exposed to H2S under anaerobic conditions (samples Mt-CuPhen-exp H2S ac-12h and Mt-CuPhen-exp H2S ac-1m) are closer to those of the Cu2O reference, displaying a larger shift of the absorption edge towards lower energies and a decrease in the intensity of peaks around 8982 and 8997 eV with respect to what observed in aerobic conditions, thus suggesting a large reduction of the average Cu oxidation state (Figure S2b).
Mt-CuPhen exposed to H2S for 1 month in anaerobic conditions and then exposed to air for 2 weeks (sample Mt-CuPhen-exp H2S ac-1m-air) shows XANES features close to that of Mt-CuPhen exposed to H2S for 12 h in both anaerobic and nonanaerobic conditions. The position of absorption edge falls at higher energy compared to Mt-CuPhen-exp H2S ac-1m indicating the reoxidation of copper ion after the exposure to air.
As observed for the K edge of transition metals, the absorption edge position of XANES spectra shifts with the average copper oxidation state. Thus, in order to evaluate semiquantitatively the coexistence of Cu(II) and Cu(I) atoms when Mt-CuPhen is exposed to H2S gas, the correlation known as Kunzl’s law was applied [28,29]. The linear relationship:
Ee = 8978 (3) +3 (1) OS
correlating the position of the absorption edge (Ee) with the mean oxidation state (OS) was evaluated from the peak position of reference compounds. The results confirm that the Cu(II)Phen crystals and Mt-CuPhen contain Cu(II) ion (calculated oxidation state: 2.3 ± 0.3, Figure S3a). After 12 h exposure to H2S gas, the average oxidation state of Cu in Mt-CuPhen decreases to 1.3 ± 0.3, indicating partial Cu(II) reduction to Cu(I). For larger exposure times, the average oxidation state of Cu increases (1.5 ± 0.3 for 5 days and 2.0 ± 0.3 for exposure times higher than 1 month).
The average oxidation state of samples exposed to H2S under anaerobic conditions was also calculated (Figure S3b). The sample exposed for 12 h shows an average oxidation state (1.3 ± 0.3) similar to that of the material exposed under aerobic conditions (1.3 ± 0.3), but upon increasing exposure times Cu is found almost entirely in the reduced state (after 1 month the average oxidation state is 1.1 ± 0.3 and 2.0 ± 0.3 under anaerobic and aerobic conditions, respectively). The reversibility of the reduction process is confirmed by the sharp change of the oxidation state of the sample exposed anaerobically to H2S by simple eventual exposure to air (after two weeks the average oxidation state varies from 1.1 to 1.8).

3.8. Catalytic Mechanism Responsible for Oxidation of H2S to S0

H2S capture by Mt-CuPhen reasonably occurs with a multistep process. Spectroscopic data (DR UV–Vis and XANES spectra) indicate that Cu(II)Phen intercalated in Mt undergoes reduction to Cu(I)Phen when exposed to H2S. This reaction is coupled to the oxidation of S2– to S0, as shown by the presence of sulfur crystals (XRPD and SEM measurements). S0 is produced in a molar amount much larger than that of Cu(II) present in Mt-CuPhen (after 3 months S/Cu molar ratio = 17.7). Moreover, Cu(II) and Cu(I) always coexist during the formation of S° even at very long exposure times. This indicates a catalytic process for oxidation of sulfide involving atmospheric oxygen. Based on the above results, a tentative reaction mechanism can be proposed:
2 [Cu(II)Phen]2+ + 2 H2S → S0 + [PhenCu(I)-S-Cu(I)Phen] + 4H+
[PhenCu(I)-S-Cu(I)Phen] + 4H+ + O2 → 2 [Cu(II)Phen]2+ + S0 + 2 H2O
In such a way, [Cu(II)Phen]2+ acts as a catalyst and makes the reaction proceed cyclically leading to the formation of elemental sulfur from H2S, the overall reaction being:
2 H2S + O2 → 2 S0 + 2 H2O
This mechanism accounts for the remarkable difference observed in the immobilization efficiency of Mt-CuPhen with respect to Mt-FePhen. In fact, the oxidation of H2S by O2 catalyzed by Mt-CuPhen allows immobilization of larger amounts of sulfur than those obtained with Mt-FePhen, whose entrapping process is based on the direct oxidation of H2S by Fe(III)Phen without the involvement of any catalytic steps and thus depending only on Fe(III) amount intercalated in Mt.
Mt-CuPhen works for a long time, but at the end of the process it cannot be easily regenerated since the resulting elemental sulfur is largely dispersed and settled on the material.

4. Conclusions

Our study reveals the high efficiency in H2S trapping of montmorillonite intercalated with Cu-phenanthroline complex. The replacement of FePhen with CuPhen allows for achieving the capture of H2S through a catalytic mechanism that substantially changes both the quantity of this gas that can be immobilized and the duration of the uptake process. Mt-CuPhen offers a promising performance towards gaseous H2S removal because its immobilization ability is very high, displays a long-time duration (36.8 g of S/100 g Mt-CuPhen after 3 months of exposure) and works at low (room) temperature conditions. Thus, this material provides a long-term stability and complies with the request to lower the operational costs in industrial applications.
Although the formation of sulfur crystals as final product compromises the thermal regeneration of Mt-CuPhen, the low cost of the starting material and the long-lasting adsorption performances (more than 3 months), make the process cost effective and promising for technological applications. Therefore, it is a sound alternative to montmorillonite treated with Fe(III)-phenanthroline complex. In fact, the latter, while being renewable by thermal treatment, is less effective in H2S trapping and needs to be replaced or renewed much more often.

Supplementary Materials

The following are available online at https://www.mdpi.com/2075-163X/10/6/510/s1, Figure S1: (a) XANES spectra of Cu(II)Phen crystals and Mt-CuPhen compared with the spectra of several reference compounds: Cu2O, CuO, CuS, CuSO4·5H2O, and Cu3(CO3)2(OH)2. (b) XANES spectra of Cu(II)Phen crystals and Mt-CuPhen compared with the CuO and CuSO4·5H2O references showing more clearly the XANES features of compounds. (c) Smoothed first derivative of absorption signal of Cu(II)Phen crystals, Mt-CuPhen and reference compounds; Figure S2: XANES spectra of Mt-CuPhen exposed to H2S gas under different conditions. (a) Mt-CuPhen exposed to H2S for different times, i.e., 12 h, 5 days, 1 month, 2 months, and (b) Mt-CuPhen exposed 12 h and 1 month to H2S in aerobic and anaerobic conditions and Mt-CuPhen first exposed to H2S for 1 month in anaerobic conditions and then exposed to air for 2 weeks; Figure S3: Linear relationship between position at Cu K-absorption edge and the oxidation state for reference compounds, Cu(II)Phen crystals, Mt-CuPhen material and this last one exposed to H2S gas under different conditions: (a) Mt-CuPhen exposed to H2S for 12 h (Mt-CuPhen-exp H2S-12h), 5 days (Mt-CuPhen-exp H2S-5d), 1 month (Mt-CuPhen-exp H2S-1m), 2 months (Mt-CuPhen-exp H2S-2m) in aerobic conditions, (b) Mt-CuPhen exposed to H2S in anaerobic conditions for 12 h (Mt-CuPhen-exp H2S ac-12h), 1 month (Mt-CuPhen-exp H2S ac-1m), and for 1 month and re-exposed to air (Mt-CuPhen-exp H2S ac-1m-air).

Author Contributions

Conceptualization, E.C. and M.F.B.; methodology, C.I.S.-D., G.R.C., D.M., and M.B.; validation, C.I.S.-D., G.R.C., and D.M.; formal analysis, F.B., L.S., A.S.; investigation, F.B., L.S., and A.S.; data curation, L.S. and A.S.; writing—original draft preparation, E.C. and M.F.B.; writing—review and editing, E.C. and M.F.B.; supervision, M.B.; project administration, E.C. and M.B.; funding acquisition, D.M. and A.S. All authors have read and agreed to the published version of the manuscript.

Funding

This research is under the contribution of Ministero dell’Università e della Ricerca (MIUR), PRIN2017 project “Mineral Reactivity, a Key to Understand Large-Scale Processes: from Rock Forming Environments to Solid Waste Recovering/Lithification”—Project Code 2017L83S77. A.S. acknowledges financial support from the Ministerio Español de Ciencia, Innovación y Universidades (MCIU) through the project RTI2018-095303-A-C52 and the Comunidad de Madrid for an “Atracción de Talento Investigador” contract (No. 2017-t2/IND5395).

Acknowledgments

The European Synchrotron (ESRF), MCIU and Consejo Superior de Investigaciones Cientificas (CSIC) are acknowledged for the provision of synchrotron radiation facilities. We also thank the BM25-SpLine staff and CIGS (University of Modena and Reggio Emilia) for the technical support.

Conflicts of Interest

The authors declare no conflict of interest.

Appendix A

Table A1. The list of abbreviations.
Phen1,10-phenanthroline
Cu(II)Phen[Cu[(Phen)(H2O)2]2+
Mt-CuPhensolid hybrid material obtained by Mt treated with Cu(II)Phen complex
Mt-CuPhen-exp H2S-10minMt-CuPhen exposed to H2S vapor for 10 minutes
Mt-CuPhen-exp H2S-30minMt-CuPhen exposed to H2S vapor for 30 minutes
Mt-CuPhen-exp H2S-12hMt-CuPhen exposed to H2S vapor for 12 h
Mt-CuPhen-exp H2S-5dMt-CuPhen exposed to H2S vapor for 5 days
Mt-CuPhen-exp H2S-25dMt-CuPhen exposed to H2S vapor for 25 days
Mt-CuPhen-exp H2S-1mMt-CuPhen exposed to H2S vapor for 1 month
Mt-CuPhen-exp H2S-2mMt-CuPhen exposed to H2S vapor for 2 months
Mt-CuPhen-exp H2S-3mMt-CuPhen exposed to H2S vapor for 3 months
Mt-CuPhen-exp H2S ac-12hMt-CuPhen exposed to H2S vapor for 12 h in anaerobic conditions
Mt-CuPhen-exp H2S ac-1mMt-CuPhen exposed to H2S vapor for 1 month in anaerobic conditions
Mt-CuPhen-exp H2S ac-1m-airMt-CuPhen exposed to H2S vapor for 1 month in anaerobic conditions and then exposed to air for 2 weeks
Mt-FePhensolid hybrid material obtained by Mt treated with a µ-oxo 1:1 Fe(III)-phenanthroline complex

References

  1. Brigatti, M.F.; Malferrari, D.; Laurora, A.; Elmi, C. Structure and mineralogy of layer silicates: Recent perspectives and new trends. In Layered Mineral Structures and Their Application in Advanced Technologies; Brigatti, M.F., Mottana, A., Eds.; European Mineralogical Union and the Mineralogical Society of Great Britain & Ireland, EMU Notes in Mineralogy: London, UK, 2011; Volume 11, pp. 1–71. [Google Scholar] [CrossRef]
  2. Christidis, G.E. Industrial Clays. In Advances in the Characterization of Industrial Minerals; Christidis, G.E., Ed.; European Mineralogical Union and the Mineralogical Society of Great Britain & Ireland, EMU Notes in Mineralogy: London, UK, 2009; Volume 9, pp. 341–414. [Google Scholar] [CrossRef]
  3. Bernini, F.; Castellini, E.; Malferrari, D.; Borsari, M.; Brigatti, M.F. Stepwise structuring of the adsorbed layer modulates the physic-chemical properties of hybrid materials from phyllosilicates interacting with the µ-oxo Fe+3 phenanthroline complex. Microporous Mesoporous Mater. 2015, 211, 19–29. [Google Scholar] [CrossRef]
  4. Baloyi, J.; Ntho, T.; Moma, J. Synthesis and application of pillared clay heterogeneous catalysts for wastewater treatment: A review. RCS Adv. 2018, 8, 5197–5220. [Google Scholar] [CrossRef] [Green Version]
  5. Castellini, E.; Berthold, C.; Malferrari, D.; Bernini, F. Sodium hexametaphosphate interaction with 2:1 clay minerals illite and montmorillonite. Appl. Clay Sci. 2013, 83–84, 162–170. [Google Scholar] [CrossRef]
  6. Gu, S.; Kang, X.; Wang, L.; Lichtfouse, E.; Wang, C. Clay mineral adsorbents for heavy metal removal from wastewater: A review. Environ. Chem. Lett. 2019, 17, 629–654. [Google Scholar] [CrossRef]
  7. Lee, M.S.; McGrail, B.P.; Glezakou, V.A. Microstructural response of variably hydrated Ca-rich montmorillonite to supercritical CO2. Environ. Sci. Technol. 2014, 48, 8612–8619. [Google Scholar] [CrossRef]
  8. Cavalcanti, L.P.; Kalantzopoulos, G.N.; Eckert, J.; Knudsen, K.D.; Fossum, J.O. A nano-silicate material with exceptional capacity for CO2 capture and storage at room temperature. Sci. Rep. 2018, 8, 11827–11832. [Google Scholar] [CrossRef]
  9. Bernini, F.; Castellini, E.; Malferrari, D.; Castro, G.R.; Sainz Diaz, C.I.; Brigatti, M.F.; Borsari, M. Effective and Selective Trapping of Volatile Organic Sulfur Derivatives by Montmorillonite Intercalated with a μ-oxo Fe(III)−Phenanthroline Complex. Appl. Mater. Interfaces 2017, 9, 1045–1056. [Google Scholar] [CrossRef]
  10. Castellini, E.; Malferrari, D.; Bernini, F.; Sainz Diaz, C.I.; Mucci, A.; Sola, M.; Brigatti, M.F.; Borsari, M. Trapping at the solid-gas interface: Selective adsorption of naphthalene by montmorillonite intercalated with a Fe(III)-phenanthroline complex. ACS Omega 2019, 4, 7785–7794. [Google Scholar] [CrossRef]
  11. Castellini, E.; Malferrari, D.; Bernini, F.; Bighi, B.; Mucci, A.; Sainz Diaz, C.I.; Serrano, A.; Castro, G.R.; Brigatti, M.F.; Borsari, M. A new material based on montmorillonite and Cu(II)-phenanthroline complex for effective capture of ammonia from gas phase. Appl. Clay Sci. 2019, 184, 105386. [Google Scholar] [CrossRef] [Green Version]
  12. Sainz-Díaz, C.I.; Francisco-Márquez, M.; Vivier-Bunge, A. Adsorption of polyaromatic heterocycles on pyrophyllite surface by means of different theoretical approaches. Environ. Chem. 2011, 8, 429–440. [Google Scholar] [CrossRef] [Green Version]
  13. Khabazipour, M.; Anbia, M. Removal of Hydrogen Sulfide from Gas Streams Using Porous Materials: A Review. Ind. Eng. Chem. Res. 2019, 58, 22133–22164. [Google Scholar] [CrossRef]
  14. Malferrari, D.; Castellini, E.; Bernini, F.; Serrano Rubio, A.; Castro, G.R.; Sainz Diaz, C.I.; Caleffi, M.; Brigatti, M.F.; Borsari, M. Chemical trapping of gaseous H2S at high and low partial pressures by an iron complex immobilized inside the montmorillonite interlayer. Microporous Mesoporous Mater. 2018, 265, 8–17. [Google Scholar] [CrossRef]
  15. Castellini, E.; Bernini, F.; Borsari, M.; Brigatti, M.F.; Castro, G.R.; Malferrari, D.; Medici, L.; Mucci, A. Baseline studies of the Clay Minerals Society Source Clay montmorillonite STx-1b. Clays Clay Miner. 2017, 65, 220–233. [Google Scholar] [CrossRef]
  16. Ravel, B.; Newville, M. ATHENA, ARTEMIS, HEPHAESTUS: Data analysis for X-ray absorption spectroscopy using IFEFFIT. J. Synchrotron Radiat. 2005, 12, 537–541. [Google Scholar] [CrossRef] [PubMed] [Green Version]
  17. Kuo, C.H.; Chen, C.H.; Huang, M.H. Seed-Mediated Synthesis of Monodispersed Cu2O Nanocubes with Five Different Size Ranges from 40 to 420 nm. Adv. Funct. Mater. 2007, 17, 3773–3780. [Google Scholar] [CrossRef]
  18. Castellini, E.; Malferrari, D.; Bernini, F.; Bighi, B.; Mucci, A.; Sainz Diaz, C.I.; Serrano, A.; Castro, G.R.; Brigatti, M.F.; Borsari, M. Tuning of halobenzenes uptake in montmorillonite from gas phase through a functionalization process involving Cu(II)-phenanthroline and heptanethiol. Appl. Clay Sci. 2020, 192, 105642. [Google Scholar] [CrossRef]
  19. Moore, D.; Reynolds, R.C., Jr. X-ray Diffraction and the Identification and Analysis of Clay Minerals, 2nd ed.; Oxford University Press: New York, NY, USA, 1997; ISBN 9780195087130. [Google Scholar]
  20. Sigot, L.; Ducom, G.; Germain, P. Adsorption of hydrogen sulfide (H2S) on zeolite (Z): Retention mechanism. Chem. Eng. 2016, 287, 47–53. [Google Scholar] [CrossRef]
  21. Zahid, W.M.; Othman, M.A.; Abasaeed, A.E. Enhanced sulfur removal by a tuned composite structure of Cu, Zn, Fe, and Al elements. J. Hazard. Mater. 2017, 331, 273–279. [Google Scholar] [CrossRef]
  22. Frost, R.L.; Reddy, B.J.; Keeffe, E.C. Structure of selected basic copper (II) sulphate minerals based upon spectroscopy: Implications for hydrogen bonding. J. Mol. Struct. 2010, 977, 90–99. [Google Scholar] [CrossRef] [Green Version]
  23. Gaur, A.; Shrivastava, B.D. A comparative study of the methods of speciation using X-ray absorption fine structure. Acta Phys. Pol. Ser. A 2011, 121, 647–652. [Google Scholar] [CrossRef]
  24. Kim, W.B.; Lee, J.S. Quantitative XANES Analysis of Cuprous Dibromide Complex Formed in the Oxidative Carbonylation of Phenols. J. Phys. Chem. B 2003, 107, 9195–9202. [Google Scholar] [CrossRef]
  25. Shimizu, K.; Maeshima, H.; Yoshida, H.; Satsuma, A.; Hattori, T. Ligand field effect on the chemical shift in XANES spectra of Cu(II) compounds. Phys. Chem. Chem. Phys. 2001, 3, 862–866. [Google Scholar] [CrossRef]
  26. Gaur, A.; Klysubun, W.; Nitin Nair, N.; Shrivastava, B.D.; Prasad, J.; Srivastava, K. XAFS study of copper(II) complexes with square planar and square pyramidal coordination geometries. J. Mol. Struct. 2016, 1118, 212–219. [Google Scholar] [CrossRef]
  27. Giorgetti, M.; Guagagnini, L.; Fiddy, S.G.; Santini, C.; Pellei, M. Cu K-edge EXAFS on copper(I) complexes containing dihydridobis(3-nitro-1,2,4-triazol-1-yl)borate and bis(1,2,4-triazol-1-yl)acetate ligand: Evidence for the Cu–O interaction. Polyhedron 2009, 28, 3600–3606. [Google Scholar] [CrossRef]
  28. Kunzl, V. A linear dependence of energy levels on the valence of elements. Collect. Trav. Chim. Tchecoslov. 1932, 4, 213. [Google Scholar]
  29. Abuin, M.; Serrano, A.; Chaboy, J.; García, M.A.; Carmona, N. XAS study of Mn, Fe and Cu as indicators of historical glass decay. J. Anal. At. Spectrom. 2013, 28, 1118–1124. [Google Scholar] [CrossRef] [Green Version]
Figure 1. Plot of S content from H2S (the S content due to sulfate anions in the starting Mt-CuPhen was subtracted) in Mt-CuPhen as a function of the time of exposure to H2S. Error bars indicate the variability of each measure.
Minerals 10 00510 g001
Figure 2. Diffuse–reflectance (DR) UV–Vis spectra of Mt-CuPhen and of Mt-CuPhen exposed to H2S for different times. Curves were shifted on the y-axis for sake of clarity. Lines at λ = 520 nm and λ = 780 nm mark features discussed in the text.
Minerals 10 00510 g002
Figure 3. Scanning electron microscopy (SEM) images of Mt-CuPhen exposed to H2S for different times: (a) 3 days; (b) 3 months. The energy dispersive X-ray spectrometry (EDX) spectra reported refer to crystals indicated by arrows.
Minerals 10 00510 g003
Figure 4. X-ray diffraction patterns of Mt and Mt-CuPhen before and after exposure to H2S. Numbers on peaks indicate the dhkl values (nm).
Minerals 10 00510 g004
Figure 5. FTIR spectra for Mt-CuPhen before and after exposure to H2S for 3 months (Mt-CuPhen-exp H2S-3m). The Mt spectrum was also introduced as reported by Castellini et al. [15].
Minerals 10 00510 g005
Figure 6. Thermal analyses of Mt (black dashed lines), Mt-CuPhen (solid gray line) and Mt-CuPhen-exp H2S-25d (black solid lines). (a) Thermogravimetric analysis tracings (TGA), (b) corresponding derivative signals of thermogravimetric curves (DTGA).
Minerals 10 00510 g006
Figure 7. Tracings of gas evolved during heating for Mt-CuPhen before and after H2S exposure (25 d) for H2O (a) (m/z = 18) and SO2 (b) (m/z = 64).
Minerals 10 00510 g007

