Lead Isotopes in Exploration for Basement-Hosted Structurally Controlled Unconformity-Related Uranium Deposits: Kiggavik Project (Nunavut, Canada)


1
Department of Geological Sciences, University of Manitoba, Winnipeg, MB R3T 2N2, Canada
2
Département de Sciences de la Terre, Université Paris-Sud (Paris-Saclay), 91405 Orsay, France
*
Author to whom correspondence should be addressed.
†
Formerly with Orano Canada Inc., Saskatoon, SK S7L 5X2, Canada.
Minerals 2020, 10(6), 512; https://doi.org/10.3390/min10060512
Submission received: 30 April 2020
/
Revised: 25 May 2020
/
Accepted: 27 May 2020
/
Published: 31 May 2020
(This article belongs to the Special Issue Geochemical and Mineralogical Characterization of Uranium and Thorium Deposits
)
Abstract
:Pb-isotopes have been proposed as pathfinders for sandstone-hosted unconformity-related U deposits, with isotope ratios providing information on mineralization timing and element remobilization and migration. Pb-isotopes proximal to mineralization display radiogenic signatures, often with ‘excess Pb’ suggestive of derivation from greater U concentrations than are currently present. The U deposits in the Kiggavik project area (west of Baker Lake, NU, Canada) are basement-hosted, contain several generations of pitchblende mineralization, display a strong structural control, and are located in fault-related fracture systems and foliation-parallel veinlets. Drill core samples were analysed by Inductively-Coupled Plasma-Mass Spectrometer (ICP-MS) for Pb isotopes following multi-acid total-digestion, reverse Aqua Regia partial-digestion, and weak-acid-leach attacks, to evaluate the utility of the respective dissolution methods in Pb-isotope pathfinder geochemistry. Partial-digestion results are similar to weak-acid-leach results, indicating that interpretation of Pb-isotope signatures can be carried out from partial-digestion data if weak-acid-leach data are unavailable. Application of this pathfinder method at Kiggavik shows that Pb-isotope ratios display systematic trends useful for exploration vectoring. Uranium-content-adjusted 206Pb/204Pb ratios and 206Pb/204Pb ‘excess-lead’ data highlight anomalous isotopic values. 207Pb/206Pb ratios display downhole trends complementary to location of mineralization. Three-dimensional (3D) distributions of Pb-isotope data at the Contact U prospect show systematic trends and form halos around the mineralization. Isotopic footprints are limited to <50 m from the mineralization outline, reflecting host-rock and structural control, but indicate areas with elevated potential for U mineralization and provide vectoring information within basement lithologies.
1. Introduction
The goal of this study is to evaluate the utility of Pb-isotope dispersion, specifically Pb-isotope pathfinder geochemistry, in exploration for basement-hosted unconformity-related U deposits [1,2,3]. This geochemical method is based on the fact that Pb is the natural end product of the decay of U, the target element of the exploration, and that several radiogenic Pb-isotopes can be used to identify the presence of nearby U mineralization as a result of dispersion of radiogenic Pb into the environment around the mineralization [4,5]. The study has two objectives, the first concerning analytical methodology related to rock digestion and leach methods, and the second concerning method application for basement-hosted unconformity-related U mineralization.
Unconformity-related U deposits are U-rich and relatively Pb-poor, so the effect of U decay leads over time to the accumulation of significant amounts of radiogenic Pb in the mineralization [6]. Uranium as a radioactive parent element decays, through both alpha and beta decay modes, to radiogenic daughter product Pb through two decay chains: (1) 235U decays to 207Pb; and (2) 238U decays to 206Pb [7]. 204Pb is non-radiogenic common lead. Large quantities of U produce enrichments in 206Pb and 207Pb, through radiogenic decay, relative to common lead 204Pb. As a consequence, uranium mineralization characteristically contains very high 206Pb/204Pb and 207Pb/204Pb ratios, and U mineralization, such as in Mesoproterozoic unconformity-related deposits, will display low 207Pb/206Pb ratios, due to the original ratio of the two parent isotopes in the mineralization (235U/238U = 0.720%/99.274% = 0.0073) and the shorter half-life of 235U relative to 238U (235U: 7.04 × 10⁸ years; 238U: 4.468 × 10⁹ years), while background rock will produce non-radiogenic low 206Pb/204Pb ratio values and high 207Pb/204Pb ratio values. Thus, there are large differences in ratio values between background material and the targeted U mineralization [8]. The Pb-isotope ratios provide information on the timing of mineralization and element remobilization, as well as on the presence and timing of U and Pb migration [7,9,10]. During interaction with later fluids, U mineralization typically experiences significant post-mineralization alteration and variable Pb loss [11]. The migration and dispersion, and subsequent precipitation or adsorption, of radiogenic Pb from U mineralization into the host rocks surrounding the mineralization forms the basis for using Pb-isotopes in the exploration for U deposits. The Pb-isotopes have been used as guides, vectors, or pathfinders for sandstone-hosted unconformity-related U deposits [4,9,10], particularly 204Pb, 206Pb, and 207Pb, and related ratios 206Pb/204Pb and 207Pb/206Pb. Samples located proximal to U mineralization display dominantly radiogenic Pb-isotope ratios due to the presence of radiogenic Pb that cannot be explained through radiogenic decay of the amount of parent U that has decayed to the present abundance of U in the rock sample, i.e., ‘excess Pb’ that is unsupported by the amount of U present.
Application of the Pb-isotope pathfinder method in the sandstone environment has been enhanced through the use of a weak acid leach (WAL) method to partially leach crushed rock material to extract adsorbed ions [10,12]. However, the WAL analyses are time-consuming and very expensive relative to the quick-turn-around and inexpensive Inductively-Coupled Plasma-Mass Spectrometer (ICP-MS) lithogeochemical analyses, following 3- or 4-acid total digestion (TAD) and/or 2-acid partial digestion (PAD), routinely requested by mineral exploration companies. To date, there is no public information available that compares WAL Pb-isotope data to the abundant ICP-MS Pb-isotope geochemical data, particularly the PAD data. Because of this information gap, the first objective of this study concerns analytical methodology and comprises an analytical program that followed up on the work of [10] by comparing and evaluating the Pb-isotopic data resulting from various rock digestion and leach methods that are typically available to the mineral exploration industry.
The second objective of this study concerns method application and comprises an evaluation of Pb-isotope pathfinder dispersion geochemistry as a mineralization vector for basement-hosted unconformity-related U mineralization. Within the context of unconformity-related U deposits [13,14,15], previous work using Pb isotopes in exploration for these deposits has only applied this technique to sandstone-hosted deposits and to dispersion haloes in sandstone, in particular those in the well-studied Athabasca Basin. However, the Mesoproterozoic Kiggavik U deposits of the NE (north-east) Thelon region (ca. 80 km west of Baker Lake, NU, Canada; Figure 1) are not sandstone-hosted; rather, they are all basement-hosted. Here, the Bong and End deposits hosted by Archean paragneiss and the Contact U prospect hosted by Archean orthogneiss were studied, all occurring within a completely different lithological host environment: Neoarchean crystalline metamorphic and igneous rocks, with the mineralization displaying a strong structural control [16,17].
2. Geological Setting and Uranium Mineralization
The presently dormant 18,484 ha Kiggavik Project area, operated by Orano Canada Inc. (formerly AREVA Resources Canada Inc.), contains the Mesoproterozoic End, Bong, Andrew Lake, and Kiggavik unconformity-related U deposits, and the undated Contact U prospect, with total estimated resources of 54,000 t U at an average grade of 0.32% U. It is located approximately 80 km west of Baker Lake, Nunavut, Canada (Figure 1) and is located within the Western Churchill Province, Rae Subprovince, along the northeastern portion of the intracratonic Paleoproterozoic Thelon Basin (ca. 1700–1540 Ma [18,19,20,21]. The Thelon Basin is geologically similar to the Athabasca Basin of northern Saskatchewan and Alberta [22,23], in which a number of world-class, sandstone- and basement-hosted, high-grade Mesoproterozoic unconformity-related U deposits have been discovered near the sub-Athabasca unconformity [13,14,15,22,24,25,26]. In the Kiggavik area, all instances of uranium mineralization are entirely hosted by the basement lithologies and are located just outside (south) of the present-day edge of the Thelon Basin [17].
The Thelon Basin sedimentary fill forms the uppermost lithologies in the northeast Thelon Basin region (Figure 1). The Barrensland Group, the uppermost Group of the Paleo- to Mesoproterozoic Dubawnt Supergroup, makes up the dominantly fluvial fill of the Thelon Basin. It contains the dominant, greater than 1000 m thick, mostly orthoquartzitic Thelon Formation sandstone and the overlying minor and locally present Kuungmi Formation basalt and Lookout Point Formation limestone [27]. An age of ca. 1667 Ma has been obtained for diagenetic fluorapatite in the basal Thelon Formation [20], and the Kuungmi basalt has been dated at ca. 1540 Ma [21]. Locally in the Kiggavik area, thin outliers of older Wharton Group Amarook Formation sandstone lie beneath the unconformity at the base of the Thelon Formation sandstone.
The crystalline metamorphic basement that lies unconformably beneath the basin fill of the northeast Thelon Basin is composed of Archean granitic gneisses (ca. 2870 Ma [28]) and late Archean supracrustal rocks of the Woodburn Lake group (2730–2680 Ma [29]), as well as the felsic volcanic and related epiclastic rocks of the late Archean Snow Island Group (2620–2580 Ma [30,31,32,33]), and the Paleoproterozoic Ketyet River Group siliciclastic rocks (2300–2150 Ma [34]). These basement rocks form three major unconformity-bounded sequences [33], with the basal package being the ca. 2710 Ma metagreywacke of the Pipedream assemblage of the Woodburn Lake group. The Pipedream assemblage metagreywacke is succeeded by ca. 2600 Ma meta-rhyolite and associated epiclastic rocks of the Pukiq Lake Formation of the Snow Island Suite, which is overlain by Ketyet River group metaquartzite. These units are strongly deformed, form a gently NE-dipping sequence that is truncated by the Thelon fault, and display early tight to isoclinal recumbent/sheath-style folding, with inferred repeated thrusting and translation of the younger rocks over the older, more rigid Pipedream assemblage metagreywacke [33] (Figure 2A).
These rocks were intruded by late syn-orogenic ca. 1830 Ma Hudson Suite granites and ultrapotassic minette/bostonite and lamprophyre dikes, and by ca. 1750 Ma Kivalliq Igneous Suite rapakivi granite (Nueltin granite). These intrusive suites make up the Schultz Lake Intrusive Complex in the Kiggavik area [36]). All the rocks in the Thelon Basin region are cut by ca. 1267 Ma Mackenzie swarm diabase dikes [37,38].
The Mesoproterozoic unconformity-related U deposits of the Athabasca region, Canada, are found above, along, and/or below the unconformable contact between an Archean to Paleoproterozoic crystalline metamorphic basement, locally containing highly-reducing lithologic units, and Paleo- to Mesoproterozoic oxidized siliciclastic sedimentary basin fill [13,14,15,22,24,25]. The deposits formed at high-grade diagenetic temperatures, ca. 200 °C, through fluid-fluid and/or fluid rock interactions between basinal and basement brines or basinal brines and basement host rock, respectively. One style of unconformity-related mineralization is basement-hosted and resulted from ingress of oxidized basinal brines into brittle fault and fracture zones and subsequent fluid-rock interaction with reduced lithologies to form disseminated and vein uraninite/pitchblende mineralization in fractures and as breccia matrix.
The dominant host for the basement U mineralization in the Kiggavik camp is the metagreywacke of the Pipedream assemblage of the Woodburn Lake group, along with Snow Island Suite epiclastic material (End, Bong, Andrew Lake, and Kiggavik deposits [33,39,40], and less commonly Archean orthogneiss (Contact prospect [8]; Figure 2). The U deposits are distributed along the NE-trending Andrew Lake fault and along the ENE-trending Judge Sissons and Kiggavik faults that host a series of gravity and resistivity lows related to brittle structure and clay mineral alteration [8,16,17,33].
In the context of unconformity-related U metallogenesis [22,24,25,41], it is hypothesized that oxidized Thelon basinal fluids scavenged U from Hudson and Kivalliq granites, and Snow Island Suite felsic volcanic/epiclastic rocks, infiltrated along steeply-dipping faults, breccias, and fracture systems during-post Hudsonian structural reactivation, and precipitated primary uranium mineralization as thin veins in sulphide-bearing redox traps [33]. The main uranium-bearing minerals present in the Kiggavik deposits are uraninite and coffinite. Sulfide minerals (pyrite, chalcopyrite, covellite, and galena) are locally associated with mineralization and have been assigned to pre-, syn-, and post-mineralization stages. Multiple phases of uranium mineralization and/or remobilization have been inferred from the U-Pb ages of uraninite that range from ca. 1500 Ma to ca. 500 Ma [39,40,42].
Similar to the Athabasca Basin unconformity-related U deposits [13,14,15,22,24,25,26], the Kiggavik U mineralization is associated with clay mineral host-rock alteration comprising illite ± sudoite ± hematite ± aluminum phosphates sulfates (APS), as well as quartz veining [17]. Uranium mineralization and related alteration are centered on faults [8,17] and the mineralization is typically surrounded by a hematitization zone extending over tens of meters, although disseminated mineralization can also be found in relatively weakly argillized or hematitized rocks (e.g., [8,39,42]).
In the Contact U prospect (Figure 2A), the U mineralization is associated with the Andrew Lake fault, which was multiply reactivated and mineralized [8] and with a low-gravity anomaly (Figure 2B) related to host-rock alteration. The main stage of uranium mineralization occurred coeval with transtensional reactivation of the fault and with circulation of oxidizing basinal brines within reduced lithologies in the fault zone [8]. This mineralization is monometallic pitchblende, with associated illite and sudoite host-rock alteration. Later reactivation of the fracture network led to strong illitization and bleaching of the host rock.
3. Materials and Methods
Routine mineral exploration work at the Kiggavik Project included taking whole-core samples of diamond drill core, approximately 10 cm in length and 36.5 mm or 47.6 mm in diameter, at 5 to 10 m intervals down-hole. The samples were used for petrographic examination, lithogeochemical analysis, and short-wave infrared reflectance spectral mineralogical analysis. In this study, 2815 samples from 75 diamond drill holes that intersected Pipedream assemblage metagreywacke and/or Snow Island Suite epiclastic material and/or Archean orthogneiss were used to compare the results obtained from several commonly used sample digestion/leach methods (TAD, PAD, and two varieties of WAL) and to evaluate their use in Pb-isotope pathfinder geochemistry.
Of the 2815 samples analyzed in this study, 2208 were used in a comparison of the TAD Pb-isotope results versus the PAD results. The samples were from drill holes spotted in a variety of areas on the Kiggavik Project, but were mostly from the End U deposit area (823 samples from 23 drill holes), the Bong U deposit area (802 samples from 14 drill holes), the Andrew Lake U deposit area (181 samples from 5 drill holes), and the Sleek Lake exploration area (149 samples from 3 drill holes). The remaining 607 samples were from the Contact U prospect area (22 drill holes) and were used in the comparisons between the PAD results and results of the two WAL attacks.
Prior to geochemical analysis, the samples were crushed to −1/4” (−6 mm) using a steel jaw crusher and then further crushed to −2 mm. For the digestion/leach evaluations, this sample material was riffle-split into two parts. One part, destined for the acid digestions, was then agate-ground to −0.106 mm. The other part, destined for the WAL testing, was crushed to −1.40 mm using a ceramic jaw crusher and the crushed material was then separated into two size fractions: 0.50–1.40 mm and 0.35–0.50 mm, with the leaches being carried out on the 0.35–0.50 mm size-fraction.
Two sample digestions were carried out on ground rock pulp using acid attack, and crushed rock was attacked by two weak acid leaches:
- TAD: Saskatchewan Research Council Geoanalytical Laboratory (SRC-GA; Saskatoon, SK, Canada) 3-acid total digestion of rock pulp using a mixture of ultrapure concentrated hydrofluoric (HCl), nitric (HNO3), and hydrochloric (HF) acids with the pulp being digested to dryness in a hot-block digestion tube system, followed by dissolution of the residue in deionized water prior to analysis. Pb-isotope analyses were carried out using a Perkin Elmer Elan DRC II ICP-MS instrument (PerkinElmer Corporation, Waltham, MA, USA) that was calibrated using certified commercial materials.
- PAD: SRC-GA 2-acid reverse Aqua Regia partial digestion (leaching) of rock pulp using HCl + HNO3 (volume ratio 1:3) in a hot water bath, followed by dilution with deionized water. Pb-isotope analyses were also carried out using a Perkin Elmer Elan DRC II ICP-MS instrument.
- WAL-S: SRC-GA weak acid leach using 5% nitric acid. A total of 0.5 g of sample and 5 mL HNO3 were loaded into a polyurethane tube that was placed into an ultrasonic bath for 2 h and then centrifuged. One gram of the liquid was diluted with 50 g of acid reagent and the Pb isotopic ratios were measured using a Perkin Elmer high-resolution ICP-MS (PerkinElmer Corporation, Waltham, MA, USA).
- WAL-Q: Queen’s Facility for Isotope Research (QFIR; Queen’s University, Kingston, ON, Canada) weak acid leach using 2% nitric acid [10]. A total of 0.5 g of sample and 5 mL HNO3 were loaded into a polyurethane tube that was placed into an ultrasonic bath for 2 h and then centrifuged. One gram of the liquid was diluted with 50 g of acid reagent and the Pb isotopic ratios were measured using a Thermo Scientific Element II high-resolution ICP-MS (Thermo Fisher Scientific, Waltham, MA, USA).
Minimum detection limits for all Pb-isotope analyses were 0.001 ppm. The Pb-isotope ratios (206Pb/204Pb, 207Pb/204Pb, 208Pb/204Pb, and 207Pb/206Pb) were calculated directly from the Pb-isotope concentrations (204Pb, 206Pb, 207Pb, and 208Pb) obtained from the ICP-MS analyses.
The resulting Pb-isotope concentration data were examined statistically to determine the population distribution types using quantile analysis, produce univariate statistics based on the distribution type, perform linear regression to quantify the relationships between the populations, and perform paired two-sample Student’s t-Test of means to determine whether the observed results are likely to have come from distributions with equal population means. These examinations were carried out using Microsoft Excel (Microsoft Office 2013, version 15.0.5223.1001, 2020) and SYSTAT (version 13.0, SPSS Inc., Chicago, IL, USA, 2005).
‘Excess Pb’ in the context of the 206Pb/204Pb ratio means the amount of 206Pb that cannot be explained through radiogenic decay of the amount of parent U that has decayed to the present abundance of U in the rock sample, i.e., the amount of radiogenic Pb that is unsupported by the amount of U currently in the sample. For samples returning a 238U*/206Pb ratio less than 2.459 (with 238U* being a proxy for 238U and equals U-partial × 0.99275; the 0.99275 value representing the abundance of 238U relative to the sum of all U isotopes), a calculated 206Pb/204Pb ratio R2 = 15 + (R1 × 15) × (EXP(1.55125 × 10⁻¹⁰ × t) − 1) where R1 = 1/((1/R0) − 1 × (EXP(1.55125 × 10⁻¹⁰ × t) − 1)), R0 = 238U*/206Pb ratio, and t = elapsed time in years (here 2200 Ma). If the analysed 206Pb/204Pb ratio exceeds R2, then ‘excess Pb’ is considered to be present.
4. Results
The Pb-isotope analytical results from several commonly used sample digestion and leaching methods for use in Pb-isotope pathfinder geochemistry in mineral exploration for uranium were compared and evaluated. The utility of Pb-isotope pathfinder geochemistry in exploration for basement-hosted unconformity-related uranium mineralization (i.e., Pb-isotopes as a mineralization vector) was then examined through use of Pb-isotope ratio analysis using PAD and WAL-S data from the Archean paragneiss-hosted Bong and End U deposits and the Archean orthogneiss-hosted Contact U prospect.
4.1. Comparison of Results of the Various Rock Digestions and Leaches
The lithogeochemical analyses used by the exploration industry typically follow TAD or PAD. However, an analytical program designed specifically for Pb-isotope pathfinder geochemistry makes use of one form or another of a WAL (e.g., [10]). Thus, an analytical program designed to compare the Pb-isotopic results from the different rock digestions and leaches was carried out. Univariate statistical data summarizing the analytical results are presented in Table 1.
4.1.1. TAD versus PAD
Pb-isotopic results from the 3-acid TAD of rock pulp were compared to those obtained from the 2-acid PAD leaching of rock pulp. On Quantile-Quantile plots, the TAD and PAD data both show distributions that are close to log-normal (Figure 3F and Figure 4F). The TAD results in liberation of noticeably greater quantities of all of the isotopes than does the PAD (Figure 3A–C). The geometric means for the TAD data versus the PAD data are 0.122 ppm versus 0.040 ppm, 4.434 ppm versus 1.661 ppm, and 2.185 ppm versus 0.762 ppm for 204Pb, 206Pb, and 207Pb, respectively (Table 1). The TAD results are similar to those from the PAD at high content levels for 204Pb, 206Pb, and 207Pb (e.g., >~40 ppm for 207Pb), but the TAD values are much greater than the PAD values at lower levels (e.g., <~25 ppm for 207Pb), showing a much poorer correlation (Figure 3C). From the paired two-sample Student’s t-Test of means (Figure 3F), it is shown that the mean values for the TAD and PAD data are significantly different, both at the 98% significance level (207Pb shown) and the 95% level, with the t-critical value being much less than the t-statistic value. Overall, the 204Pb TAD and PAD data values are more poorly correlated than those for 206Pb and 207Pb, with coefficients of correlation (r2) of 0.8972 versus 0.9796 and 0.9148, respectively, indicating more data scatter in the 204Pb results.
4.1.2. PAD versus WAL
Pb-isotopic results from the 2-acid reverse Aqua Regia partial digestion (leaching) of rock pulp (PAD) were compared to those obtained from the QFIR WAL (WAL-Q) of crushed rock material. On Quantile–Quantile plots, the PAD data shows a distribution that is close to log-normal (Figure 4F), while the WAL data sets are both log-normally distributed (Figure 5F). The WAL-Q analyses provide less Pb extraction than does the PAD analyses (Figure 4A–C). The geometric means for the PAD data versus the WAL-Q data are 0.040 ppm versus 0.009 ppm, 1.661 ppm versus 0.306 ppm, and 0.762 ppm versus 0.147 ppm for 204Pb, 206Pb, and 207Pb, respectively (Table 1). These data means are closer in value to each other than the equivalent TAD versus PAD comparison. From the paired two-sample Student’s t-Test of means (Figure 4F), it is shown that the mean values for the PAD and WAL-Q data are significantly different, both at the 98% significance level (207Pb shown) and the 95% level, with the t-critical value being much less than the absolute value of the t-statistic value. The 204Pb PAD and WAL-Q data values are also more poorly correlated than those for 206Pb and 207Pb, with coefficients of correlation (r2) of 0.6178 versus 0.8024 and 0.7548, respectively, indicating more data scatter in the 204Pb results.
4.1.3. Comparison of WAL Variants
Pb-isotopic results from the SRC WAL (WAL-S) were compared to those obtained from the QFIR WAL (WAL-Q), both being carried out on crushed rock material. On Quantile-Quantile plots, both data sets show log-normal distributions (Figure 5F). As shown by the statistical data in Table 1, the WAL-S and WAL-Q analyses provide very similar amounts of Pb-isotope extraction (Figure 5A–C), both providing less Pb extraction than the PAD, with the geometric means for the WAL-S data versus the WAL-Q data being 0.010 ppm versus 0.009 ppm, 0.335 ppm versus 0.306 ppm, and 0.162 ppm versus 0.147 ppm for 204Pb, 206Pb, and 207Pb, respectively. From the paired two-sample Student’s t-Test of means (Figure 5F), it is shown that the mean values for the WAL-S and WAL-Q data are not significantly different, at the 98% significance level (204Pb shown), with the t-critical value being greater than the t-statistic value.
Unlike in the TAD versus PAD and PAD versus WAL-Q comparisons, the 204Pb WAL-S and WAL-Q data values are nearly as well correlated as those for 206Pb and 207Pb, with coefficients of correlation (r2) of 0.9008 versus 0.9424 and 0.9466, respectively. The 204Pb results show only slightly more data scatter than observed in the 206Pb and 207Pb results.
Both isotope ratios (206Pb/204Pb, 207Pb/206Pb) show similar data scatter (Figure 5D,E). However, the data distribution for the 206Pb/204Pb ratio is concentrated at lower end of the scale (<ca. 100), while the data distribution for the 207Pb/206Pb ratio is more homogeneous throughout the scale.
4.2. Pb-Isotope Pathfinder PAD and WAL Geochemistry: Bong and End U Deposits
Systematic trends in 206Pb/204Pb, 207Pb/204Pb, and 207Pb/206Pb ratios are observed in the data from the samples taken from various locations on the Kiggavik property, representing U deposits, U prospects, and non-mineralized material. The most used categorization and down-hole diagrams make use of the 206Pb/204Pb and 207Pb/206Pb ratio data [4].
Defined ranges on the 206Pb/204Pb ratio diagrams (Figure 6 and Figure 7) are ‘barren/background’, ‘anomalous’, and ‘highly anomalous/mineralized’ with ranges of <30, 30 to 100, and >100, respectively [4]. The ‘barren/background’ range encompasses the global range of background values, with the 18.7 ratio value representing the average of typical crustal material [43], such as oceanic basalt. The other ranges are arbitrarily defined. Similarly, defined ranges on the 207Pb/206Pb ratio diagrams (Figures 9–11) are ‘barren’, ‘weakly anomalous’, ‘moderately anomalous’, ‘strongly anomalous’, and ‘highly anomalous/mineralized’ with ranges of >0.75, 0.75 to 0.6, 0.6 to 0.4, 0.4 to 0.2, and <0.2, respectively [4]. The ‘barren’ range reflects non-radiogenic ratio values typically encountered in U exploration, while the other ranges reflect primary and secondary dispersion of radiogenic Pb (e.g., [5]).
206Pb/204Pb ratio multi-hole plots (Figure 6) illustrate the presence of ‘anomalous’ and ‘highly anomalous’ ratios in individual drill holes within a given area. Non-mineralized samples from many drill-holes from the Bong U deposit (Figure 6A) and the End U deposit (Figure 6B) display ‘strongly anomalous’ and ‘highly anomalous’ 206Pb/204Pb ratio values (e.g., Bong-36, Bong-38, End-09-08A, End-09-11, among others), very similar to the mineralized samples from drill-hole Bong-42. Several drill holes show only ‘barren/background’ ratio values and are indeed barren of U mineralization (e.g., Bong-46 and Bong-49, End-10-02A; Figure 6A,B, respectively), however, several other barren drill-holes show some promising ‘strongly anomalous’ ratio values (Bong-50, Figure 6A). The WAL-S data from the Contact U prospect (Figure 6D) show the same features as the PAD data (Figure 6C).
Downhole 206Pb/204 Pb-ratio ‘excess Pb’ diagrams (Figure 7) are down-hole plots depicting 206Pb/204 ratio values on the drill-hole trace. The U contents of the samples are also plotted for reference purposes. The raw 206Pb/204Pb downhole plots illustrate the variations in the original Pb isotope data with depth down the drill hole. However, they do not provide information on any ‘excess Pb’ content, i.e., Pb that is unsupported by the amount of U present in the rock sample (see Section 3). The ‘adjusted’ 206Pb/204 downhole plots in Figure 7 highlight those isotopic values that also contain ‘excess Pb’ content. Bong-49 is a barren background drill hole, located well away (~500 m) from the main Bong mineralization (Figure 7A), from which all samples returned background 206Pb/204Pb ratio values (i.e., <30). Bong-42 is a well-mineralized drill hole that is typical of the Bong U deposit, containing a 108 m thick U mineralized zone that includes an intersection of 0.80% U3O8 over 42 m (Figure 7B). Anomalous 206Pb/204Pb values are present in Bong-42 samples with background U contents, both above and below the mineralized zone, with values over 4000 being obtained. Present within this 200 m-thick region of elevated 206Pb/204Pb ratio values, but outside of the mineralized zone, are also samples containing ‘excess Pb’. End-09-08A is a well-mineralized drill hole (Figure 7C) that is typical of the End U deposit. Similar to Bong-42, this drill-hole contains a U mineralized zone over 52 m in width. Anomalous 206Pb/204Pb values are present in these samples with background U contents, both above and below the mineralized zone, with values over 4000 again being obtained. Present within this 200 m-thick region of elevated 206Pb/204Pb ratio values are also samples containing ‘excess Pb’, mostly occurring below the mineralized zone.
The 206Pb/204Pb versus 238U/206Pb excess Pb diagram (Figure 8) was introduced by [10]. In this study, 238U was not determined, so U × 0.99275 was used as a proxy for 238U (see Section 3). The PAD data points from the deposit areas (Bong, End, and Contact in Figure 8A–C, respectively) dominantly follow a path that is broadly between the ~50 Ma radiogenic Pb growth curve and the 250 Ma growth curve. Abundant data points from the End deposit area (Figure 8B) display ‘excess Pb’, unsupported by the U contents in the samples. The data from the Bong deposit area (Figure 8A) and the Contact area (Figure 8C,D) show a much weaker ‘excess Pb’ trend, and the WAL data from Contact show the same features as the PAD data.
The 207Pb/206Pb ratio multi-hole plots (Figure 9) illustrate the presence of low ratio values in samples from individual drill holes within a given area. Non-mineralized samples from many drill-holes from the Bong U deposit (Figure 9A) and the End U deposit (Figure 9B) display ‘strongly anomalous’ and ‘highly anomalous’ 207Pb/206Pb ratio values (e.g., Bong-36, Bong-38, End-09-08A, End-09-11, among others), very similar to the mineralized samples from drill-hole Bong-42. The WAL-S data from Contact (Figure 9D) show the same features as the PAD data (Figure 9C).
In the U versus 207Pb/206Pb diagrams (Figure 10) for the Kiggavik project area, ‘strongly anomalous’ and ‘highly anomalous’ 207Pb/206Pb ratio values (0.4 to 0.2, 0.2 to 0, respectively) typically correspond to elevated U values in both the TAD data and the PAD data (Figure 10A,B, respectively). However, many low-U-content samples also display low ratio values (<0.4; ‘strongly anomalous’ and ‘highly anomalous’; black rectangles in Figure 10B–D), suggestive of a radiogenic signature related to U mineralization nearby. There is the expected abundance of data points from the mineralized areas (e.g., in both the PAD and WAL data for the Contact U prospect area, Figure 10C,D) that display ‘strongly anomalous’ and ‘highly anomalous’ 207Pb/206Pb ratios. The WAL data show the same features as the PAD data. Importantly, there are abundant samples that contain only low amounts of U that return ‘strongly anomalous’ and ‘highly anomalous’ ratio values (Figure 10A,B). Unlike the U mineralized areas, other exploration areas that have so far been found to be barren display at best only a few ‘strongly anomalous’ values highly subordinate to abundant background values (‘barren’, ‘weakly anomalous’) and lesser ‘moderately anomalous’ values.
U versus 207Pb/206Pb ratio down-hole plots (Figure 11) combine the same downhole 207Pb/206Pb ratio data as presented in Figure 9 with down-hole U data (PAD-only). The 207Pb/206Pb ratios presented by the barren drill-hole Bong-49 (Figure 11A) are nearly all ‘barren’, with only a few ‘weakly anomalous’ values scattered near the top of the drill-hole. In contrast, the ratios from samples from mineralized drill-hole Bong-42 show abundant ‘moderately anomalous’ and ‘strongly anomalous’ values for nearly 200 m above the wide mineralized intersection (Figure 11B). Nearly all mineralized samples return ‘highly anomalous/mineralized’ ratio values, usually <0.1, and some non-mineralized samples containing elevated U contents return ‘strongly anomalous’ ratio values, particularly just above the mineralized intersection. The data patterns produced by the PAD data for the Contact prospect (mineralized drill-hole CONT-06) are similar to those observed in Bong-42, and they are nearly identical to those obtained from the WAL-S data (Figure 11C,D, respectively).
4.3. Pb-Isotope Pathfinder Geochemistry: Contact U Prospect
An evaluation of Pb-isotope pathfinder dispersion geochemistry as a mineralization vector for basement-hosted unconformity-related U mineralization was carried out on drill-hole samples from the area around the Contact U prospect using Pb-isotope data from both PAD and WAL sample digestion/leaching. The Contact prospect mineralization is hosted by Archean orthogneiss and is structurally underlain by a silicified quartz breccia unit. The mineralization envelope extends along the NE-trending Andrew Lake structural trend. Plots using the 206Pb/204Pb ratio or the 207Pb/206Pb ratio were used to illustrate the systematic trends that are observed in the Pb-isotope data from these samples.
On the 206Pb/204Pb ratio multi-hole plot, the Contact U prospect area shows good mineralization potential with the presence of abundant ‘anomalous’ and ‘highly anomalous’ 206Pb/204Pb ratio values (Figure 6C), with U mineralized samples (200 to 31,400 ppm U) from drill-hole CONT-06, CONT-08, and CONT-23 displaying ‘highly anomalous’ 206Pb/204Pb ratio values. Several drill holes located to the north, away from the U prospect, return only ‘barren/background’ ratio values and are indeed barren of U mineralization (e.g., maxima of 21 and 16 ppm U in CONT-14, CONT-15, respectively; Figure 6C,D). However, several other drill-holes, located southwest and northeast along strike of the U prospect, are also barren (e.g., maximum of 26 ppm U in CONT-25, CONT-26, CONT-27; Figure 6C,D), but they return some promising ‘strongly anomalous’ ratio values and are located within an interesting low-gravity anomaly (Figure 2B). The WAL-S data from Contact (Figure 6D) show the same features as the PAD data (Figure 6C).
Downhole 206Pb/204 Pb-ratio ‘excess Pb’ diagrams for drill-hole CONT-23, a moderately-mineralized drill hole in the Contact U prospect containing two mineralized zones, one with 0.80% U3O8 over 25 m, are in Figure 7D,E for PAD and WAL-S data, respectively. Anomalous to highly anomalous 206Pb/204Pb values (PAD; Figure 7D) are present between the two zones in samples containing (near) background-level U contents. Present within this ~80 m-thick region of elevated 206Pb/204Pb values is a single sample containing ‘excess Pb’, located immediately above the upper mineralized zone. The WAL-S data (Figure 7E) show the same features as the PAD data.
The 206Pb/204Pb versus 238U/206Pb ‘excess Pb’ diagrams for the Contact U prospect (Figure 8C,D) show a much weaker ‘excess Pb’ trend than do either the Bong or End deposits (Figure 8A,B). Interestingly, most of the mineralized samples from Contact plot in the upper right quadrant of the diagram, below the 50 Ma growth curve, with very high 206Pb/204Pb ratio values (800 to 25,000). The WAL-S data (Figure 8D) show the same features as the PAD data (Figure 8C).
The 207Pb/206Pb ratio multi-hole plot for the Contact U prospect area (Figure 9C) shows strong mineralization potential, with abundant ‘strongly anomalous’ and ‘highly anomalous’ 207Pb/206Pb ratio values (Figure 9C,D) in non-mineralized samples. The U-mineralized samples from drill-holes CONT-06, CONT-08, and CONT-23 display highly anomalous 207Pb/206Pb ratio values. More importantly, while several drill holes show background ratio values and are barren (e.g., CONT-14, CONT-15; Figure 9C), several other drill-holes are also barren, but they show some promising ‘strongly anomalous’ ratio values (CONT-25, CONT-26, CONT-27; Figure 9C). The same features are also present on the 206Pb/204Pb ratio multi-hole plot (Figure 6C). The WAL-S 207Pb/206Pb ratio data (Figure 9D) show the same features as the PAD data (Figure 9C).
On the U versus 207Pb/206Pb diagrams for the Contact U prospect area, the same features are present using both PAD and WAL data (Figure 10C,D, respectively). There is the expected abundance of data points from the mineralized areas that display ‘strongly anomalous’ and ‘highly anomalous’ 207Pb/206Pb ratios and there are numerous ‘strongly anomalous’ and ‘highly anomalous’ ratio values in samples that contain only low amounts of U (within black rectangle in Figure 10C,D), representing anomalous 207Pb/206Pb ratios that are unsupported by the U contents of the samples. The WAL data (Figure 10D) show the same features as the partial digestion data (Figure 10C).
The U versus 207Pb/206Pb ratio down-hole plots using PAD and WAL data for mineralized drill-hole CONT-06 (Figure 11C,D, respectively) are similar to the mineralized drill-hole from the Bong deposit (Bong-42, Figure 11B, PAD data), with mineralized samples returning ‘highly anomalous/mineralized’ ratio values around 0.1 from the PAD data. ‘Strongly anomalous’ and ‘moderately anomalous’ ratio values are present above the 105 m wide mineralized interval, while below the mineralized interval, ‘weakly anomalous’ and ‘moderately anomalous’ values are present. The data pattern produced for non-mineralized samples by the WAL-S data (Figure 11D) is nearly identical to the PAD data.
The 206Pb/204Pb ratio two-dimensional (2D) plan view map (Figure 12A) illustrates the x-y spatial variations in the adjusted Pb isotope data. The location of the anomalous 206Pb/204Pb ratios outline well the mineralization envelope, as well as a SE-dipping anomaly extension in drill-holes CONT-10 and CONT-11, down-hole anomaly extensions, and anomalous values in drill-holes CONT-25, -26, and -27 (Figure 9C). The 206Pb/204Pb ratio values provide a somewhat larger isotopic anomaly, both above (NW) and below (SE) the mineralization, than do the 207Pb/206Pb ratios (see below). Samples containing ‘excess Pb’ are nearly all located above the main portion of the mineralization envelope that contains the majority of the mineralization.
The 207Pb/206Pb ratio 2D plan view map (Figure 12B) illustrates the x-y spatial variations in the Pb isotope data. As expected, and as already observed in the 206Pb/204Pb ratio data, the strongly and highly anomalous ratio values outline the main mineralization envelope that occurs within a significant low-gravity anomaly [8]. Anomalous values in drill-holes CONT-10 and CONT-11 also show the anomaly extension dipping to the southeast, likely reflecting a structural control. Two groups of barren drill holes (CONT-25 and CONT-26, CONT-27), located southwest and northeast along strike of the main mineralization (Figure 12A inset; Figure 13B), contain some prospective ‘strongly anomalous’ samples. These holes are within moderate low-gravity anomalies that are so far poorly tested. Another low-gravity anomaly, tested by drill-holes CONT-14 and CONT-15 located northwest of the main mineralization, is barren and returned non-prospective background Pb-isotopic ratios (Figure 9C and Figure 13B).
Figure 13A,B depict three-dimensional (3D) diagrams of the radiometric (mineralized) footprint of the Contact U prospect (gamma cps) and the 207Pb/206Pb ratio distribution, respectively. The radiogenic Pb isotope ratios (Figure 13B) form halos outside of the mineralized area depicted in Figure 13A and show that there is mineralization potential both up- and down-strike from the mineralized zone.
5. Discussion
Application of the Pb-isotope pathfinder method in the sandstone environment was pioneered by Dr. Kurt Kyser at the QFIR and has been used extensively in U exploration within the Athabasca Basin of Saskatchewan. Initially, the method made use of partial acid digestion (PAD) data, but the method was enhanced through replacement of the PAD with a weak acid leach (WAL) method to partially leach crushed rock material to extract adsorbed ions [10]. The use of WAL partial leaching was used to facilitate the extraction of adsorbed mobile metals from their host minerals, such as clay minerals, rather than from a PAD of the rock-forming minerals in the sample. However, the WAL analyses are time-consuming and expensive (> US $75/sample for Pb-isotope data only) relative to the quick-turn-around and relatively inexpensive ICP-MS lithogeochemical analyses (ca. US $60/sample for a 60+ element suite, including the Pb-isotopes), following 3- or 4-acid TAD and/or 2-acid PAD, routinely used in mineral exploration sampling and geochemistry projects. To date, there is no public information available that compares WAL Pb-isotope data to the abundant ICP-MS Pb-isotope geochemical data, particularly the PAD data.
5.1. Comparison and Evaluation of Pb-Isotopic Data from Various Digestion and Leach Methods
5.1.1. TAD Versus PAD
It is well-known that the total digestion (TAD) data are of limited use in element dispersion evaluation, because they incorporate Pb sourced from the decay of U present in resistate minerals resident within the rock (e.g., zircon) that will mask the mobile (adsorbed) Pb isotope signal. Nevertheless, a comparison was carried out between the TAD data and the PAD data because such data are routinely available in multi-element ICP-MS analytical packages. Both data sets show near-log-normal distributions, but the values obtained from TAD are significantly greater than those obtained from PAD (Figure 3) as a result of the total dissolution of the rock compared to partial dissolution. A consequence of the TAD is the lithology-dependent liberation of additional elemental content from resistate minerals, like zircon, tourmaline, and other silicate minerals, compared to the less aggressive leaching of the PAD. The Pb-isotopes released from these minerals are related to the formation of these rock-forming minerals and not to any later primary or secondary dispersion that is the target for the Pb-isotope pathfinder exploration method. The observed difference between digestion results is greater in basement metamorphic material than in orthoquartzitic Thelon and Athabasca sandstone because of the greater quantities of these resistate minerals in the basement lithologies. The mean values for the TAD and PAD data are significantly different at both the 95% and 98% significance levels, thus it is statistically unlikely that the TAD data and the PAD data come from distributions with equal population means.
Use of isotope ratios eliminates some of the effects of the quantity differences observed between the digestion methods, but the 204Pb data have lower associated analytical precision than the other Pb-isotopes, due to their generally nearer-to-detection limit abundances (Pers. Comm., R. Millar, SRC-GA, 2015), and there is relatively poor correlation of the TAD and PAD 204Pb results (Figure 3). Because of the lower precision, ratios using 204Pb (e.g., 206Pb/204Pb; Figure 3D) are less reliable, they show greater scatter on the TAD versus PAD plots, and thus they provide less confidence in interpretation for mineral exploration. The 207Pb/206Pb ratio data are more robust, with the data showing a relatively consistent TAD versus PAD relationship, and less, although still relatively broad, data scatter especially in the middle of the plot (Figure 3E). Overall, these features indicate that the TAD data should not be used in Pb-isotope pathfinder exploration in sandstone or basement. The PAD data are better suited to Pb-isotope pathfinder exploration; however, they are also obtained from a type of Aqua Regia digestion that is more aggressive than a WAL.
5.1.2. WAL Variants
While the PAD data are better suited to Pb-isotope pathfinder exploration than TAD data, the use of WAL data over PAD data has been said by [10] to be more useful in U exploration. This is because the weak acid leaches are less aggressive and they are carried out on a size-fraction material that targets clay minerals, rather than on ground sample pulp in which the clay mineral content has been diluted by the major rock-forming minerals. In this study, two variants of the WAL were used. The WAL data from QFIR were obtained following leaching by 2% nitric acid, while the WAL data from the SRC were obtained following leaching by 5% nitric acid. Both data sets show log-normal distributions and the WAL-S and WAL-Q analyses provide very similar amounts of Pb-isotope extraction (Figure 5A–C; Table 1), both providing less Pb extraction than the PAD. The mean values for the WAL-S and WAL-Q data are not significantly different, so it is statistically likely that the WAL-S data and the WAL-Q data come from distributions with equal population means. Both isotope ratios (206Pb/204Pb, 207Pb/206Pb) show similar data scatter (Figure 5D,E), but the 207Pb/206Pb ratio data appear to be more robust for use in mineral exploration interpretation. For the variety of data plots produced (Figure 5), these two WAL data sets are not significantly different and, thus, either data set can be used to compare WAL Pb-isotope results to PAD results.
5.1.3. PAD Versus WAL: Bong and End Deposits
As for the TAD versus PAD Pb-isotope results comparison, the values obtained from PAD are significantly greater than those obtained from either of the WALs (Figure 4) as a result of the partial dissolution of rock-forming minerals in the PAD compared to the extraction of only adsorbed mobile metals by the WAL. The PAD data set shows a near-log-normal distribution, while the WAL data are log-normally distributed; also, as for the TAD versus PAD comparison, the PAD versus WAL comparison indicates that it is statistically unlikely that the PAD data and the WAL data come from distributions with equal population means. The 204Pb PAD and WAL data values are also more poorly correlated than those for 206Pb and 207Pb, with greater data scatter in the 204Pb results. As observed above, use of isotope ratios eliminates some of the effects of the quantity differences seen between the PAD and WAL digestion methods, but ratios using 204Pb are less reliable and show greater scatter (206Pb/204Pb ratio, Figure 4D) relative to the 207Pb/206Pb ratio data (Figure 4E), with a relatively consistent PAD to WAL relationship.
A variety of data plots using the 206Pb/204Pb ratio and the 207Pb/206Pb ratio were used in an empirical manner to illustrate the similarities between the PAD data set and the WAL data set. The “Holk” ‘excess Pb’ diagrams (206Pb/204Pb-p vs. 238U*/206Pb-p plot) for non-mineralized samples from the Bong deposit, End deposit, and the Contact prospect (Figure 8A–C) show that many data points follow a path that is broadly between the ~50 Ma radiogenic Pb growth curve and the 250 Ma growth curve. This data path indicates that lead was lost from U minerals ~50-250 Ma after the U minerals were formed—i.e., a Pb-loss event (or series of Pb-loss events) that occurred relatively soon after the U minerals formed. The diagram illustrating the Contact PAD data (Figure 8C) is essentially the same as the one showing the WAL data (Figure 8D), depicting the same features: data points following the same growth curve and data points fall into the same regions of the diagram, particularly the same pattern of data points falling in the ‘excess Pb’ field. This latter feature is important in U exploration because the abundance of data points in this field indicates the degree in which the samples display ‘excess Pb’, unsupported by the U content in the samples.
Sandstone around the sandstone-hosted unconformity-related U deposits typically returns radiogenic 206Pb/204Pb isotope ratios (>30; often >100), with Pb isotopic compositions that are commonly unsupported by the amount of U in the sandstone [4,10] (see Section 3). This ‘excess Pb’ is interpreted to be superimposed upon the original rock by movement or transport of Pb and U through the rocks. This pattern is consistent with the introduction of radiogenic Pb from the U deposits during syn- and/or post-mineralization fluid events (primary and/or secondary dispersion). The presence of these radiogenic 206Pb/204Pb ratios show that the sandstone was permeable to later fluids. The Kiggavik basement data also show this feature, in both the PAD data and the WAL data, on the 206Pb/204Pb down-hole diagrams presented in Figure 6 and Figure 7. The multi-hole diagrams for some Bong deposit (Figure 6A), End deposit (Figure 6B), and Contact prospect (Figure 6C,D) drill-holes show that non-mineralized samples within these deposit and prospect areas also return high ratio values, in both the PAD and WAL data, in the same range as mineralized samples from drill-holes Bong-42, CONT-06, and CONT-23. Importantly for U exploration, several other drill-holes that are barren show some promising ‘strongly anomalous’ ratio values (e.g., Bong-50, Figure 6A). The presence of excess Pb is consistent with the introduction of these daughter isotopes from the nearby U deposits during post-mineralization fluid events. Several drill holes return only ‘barren/background’ ratio values and are indeed barren of U mineralization (e.g., Bong-46 and Bong-49, End-10-02A). The 206Pb/204 Pb ratio ‘excess Pb’ down-hole plot for Bong-49 (Figure 7A), located away from the Bong mineralized zone, shows that all sample values fall within the ‘background’ field and nearly all lie close to the 18.7 average crustal value. No samples contain ‘excess Pb’. Similarly, drill-hole END-10-04, located >160 m away from the main End deposit U mineralization, returned ‘background’ to very weakly ‘anomalous’ 206Pb/204Pb values from all samples, with none containing ‘excess Pb’. In contrast, well-mineralized drill-holes Bong-42 and END-09-08A (Figure 7B,C, respectively) are typical of the Bong and End U deposits, with END-09-08A containing a mineralized intersection of 0.65% U3O8 over 48.5 m. ‘Anomalous’ and ‘highly anomalous’ 206Pb/204Pb ratio values are present in numerous samples that contain background U contents, both above and below the mineralized zones in these drill-holes. Present within this >350 m-thick region of elevated 206Pb/204Pb ratio values in END-09-08A are numerous samples containing ‘excess Pb’, especially in rock located below the mineralized zone. The same features are observed in a moderately mineralized drill-hole from the Contact U prospect that contains two mineralized zones, one with 0.80% U3O8 over 25 m (CONT-23; Figure 7D,E), although to a lesser extent and degree. ‘Anomalous’ to ‘highly anomalous’ 206Pb/204Pb values are present, in both the PAD and WAL data, between the two zones in (near) background-level U samples. What is also present within this ~80 m-thick region of elevated 206Pb/204Pb values is a single sample containing ‘excess Pb’, located immediately above the upper mineralized zone, consistent with dispersion of these daughter isotopes during post-mineralization fluid events.
For the 207Pb/206Pb ratio diagrams, sandstone in the vicinity of sandstone-hosted deposits show strongly anomalous 207Pb/206Pb ratio values that correspond well to elevated U values, but some samples display low ratio values, suggestive of a strong radiogenic signature, in samples with low U contents [4,10]. At Kiggavik, basement-hosted deposits and prospects like Bong, End, Andrew Lake, Kiggavik Main, and Contact, also provide abundant samples displaying ‘highly anomalous’ 207Pb/206Pb isotopic signatures, particularly in samples also containing elevated U contents (Figure 10A,B). However, there are also numerous ‘highly anomalous’ and ‘strongly anomalous’ samples that (presently) contain only low amounts of U. These anomalous Pb-isotope ratios are, thus, unsupported by contained U content (see Section 3), suggesting that the radiogenic Pb was mobile and derived from a U-mineralized source, away from the sample, or that the sample material itself has lost U. Samples from other exploration areas, to date found to be apparently barren, typically only display ‘barren’ and ‘weakly anomalous’ ratio values, with only rare ‘strongly anomalous’ ratio values. Data from the Contact U prospect area (Figure 10C: PAD; 10D: WAL) display a similar abundance of data points from both the PAD and WAL data that have ‘strongly anomalous’ and ‘highly anomalous’ 207Pb/206Pb ratios. There are also numerous samples that return ‘strongly anomalous’ and ‘highly anomalous’ ratios and that contain only low amounts of U. However, the number and proportion of samples from the Contact area that fall into these very prospective fields are smaller than those observed for the U deposits such as Bong and End.
The 207Pb/206Pb ratio multi-hole diagrams for Kiggavik illustrate the location of samples containing ‘strongly anomalous’ and ‘highly anomalous’ Pb-isotope ratios in individual drill holes within a given area. As for the 206Pb/204Pb-ratio multi-hole diagrams, the 207Pb/206Pb multi-hole diagrams for some Bong deposit (Bong-36, Bong-37, Bong-52; Figure 9A), End deposit (END-09-08A, END-09-11; Figure 9B), and Contact prospect (Figure 9C) drill-holes show that non-mineralized samples within these deposit and prospect areas also return low-ratio ‘strongly anomalous’ and ‘highly anomalous’ values that are in the same range as mineralized samples from drill-holes Bong-42, CONT-06, and CONT-23. Other drill-holes that are barren, like Bong-41, Bong-48, Bong-49, End-10-02A, and CONT-15, return ‘barren’ and ‘weakly anomalous’ values only. Samples from several non-mineralized drill-holes at the Contact prospect (CONT-25, CONT-26, CONT-27; Figure 9C) return some ‘strongly anomalous’ ratio values, suggesting that this area has promising potential for U mineralization, or that there has been remobilization of previously existing mineralization to this area. The Contact PAD data for non-mineralized samples (Figure 9C) produce essentially the same diagram as the comparable WAL data (Figure 9D), with the same features being present on both.
The 207Pb/206Pb ratios presented on a down-hole plot for the barren drill-hole Bong-49 (Figure 11A) are nearly all ‘barren’, much like the 206Pb/204Pb versus U down-hole plot, with only a few ‘weakly anomalous’ samples. The ratio values from samples from the mineralized drill-hole Bong-42 show a different pattern, with abundant ‘moderately anomalous’ and ‘strongly anomalous’ values in a nearly 200 m-wide zone located above the broad mineralized intersection, with the ratio values decreasing steadily toward the mineralized zone where some non-mineralized samples return ‘strongly anomalous’ ratio values immediately above the mineralized intersection (Figure 11B). As expected, nearly all mineralized samples return ‘highly anomalous/mineralized’ ratio values, usually <0.1. The down-hole plots for mineralized drill-hole CONT-06 (Figure 11C: PAD data; 11D: WAL data) are similar to that for the mineralized drill-hole Bong-42 (Figure 11B), with mineralized samples returning ‘highly anomalous/mineralized’ ratio values around 0.1. ‘Strongly anomalous’ and ‘moderately anomalous’ ratio values are present, in both the PAD and WAL data, above the 105 m wide mineralized interval, while below the mineralized interval, ‘weakly anomalous’ and ‘moderately anomalous’ values are present.
In all of the Pb-isotope ratio diagrams presented, it has been demonstrated that the Pb-isotope data show systematic trends associated with dispersion from the U mineralization. The PAD data from non-mineralized samples also show the same data patterns as the WAL data, even though the absolute quantities of the Pb-isotopes extracted from the samples differ significantly between the PAD and WAL leaches. For example, the Holk ‘excess Pb’ diagram for the Contact PAD data (Figure 8C) is essentially the same as the one showing the WAL data (Figure 8D), depicting the same features, particularly the same pattern of data points falling into the ‘excess Pb’ field. The PAD data also show the same features as the WAL data in the other illustrative Pb-isotope ratio diagrams (Figure 6, Figure 7, Figure 9, Figure 10, and Figure 11). While the WAL leach targets adsorbed mobile metals for extraction and the PAD treatment leaches these metals, as well as some metals from partially dissolved non-resistate minerals, it is apparent that the dilution effect on the Pb-isotopic signature from partial dissolution of the major rock-forming minerals is not great. Thus, in practice, it appears that the PAD data can be used as a proxy for WAL data if WAL data is unavailable, particularly the 207Pb/206Pb data.
5.2. Pb-Isotope Pathfinder Dispersion Geochemistry Evaluation: Contact Prospect
As illustrated above, the WAL data and the PAD data from the Contact prospect display the same features on the diagrams presented, despite the absolute quantities of the Pb-isotopes being different. On the 2D plan views of the Contact U prospect footprint, anomalous values of both the 206Pb/204Pb and 207Pb/206Pb ratios outline the main mineralization envelope (PAD data; Figure 12A,B, respectively). Here, the 206Pb/204Pb ratio values appear to form a slightly larger anomaly extent than do the 207Pb/206Pb ratio values, with abundant ‘anomalous’ and ‘highly anomalous’ values present. Samples containing ‘excess Pb’ are present, with nearly all lying structurally above the mineralization envelope. While there are values from the Contact samples that lie in the ‘excess Pb’ field on the “Holk” diagram, the quantity and proportion are lower than for the Bong and End deposits. This feature may reflect a possible mineralization quantity difference between the deposits and the prospect. The abundance of data points from mineralized samples in the top-right quadrant of this diagram (Figure 8C), located below the 50 Ma growth curve suggests that a relatively recent U remobilization has occurred. Both Pb-isotope ratios also show an anomaly extension dipping to the southeast in non-mineralized material, likely reflecting structural control in drill-holes CONT-10 and CONT-11. Southwestward and northeastward along strike of the main mineralization, samples from several holes (CONT-25, CONT-26, CONT-27) contain prospective ‘strongly anomalous’ 207Pb/206Pb ratio values (Figure 9C,D), suggesting that these drill-holes show potential for mineralization in those areas. Another low-gravity anomaly exploration target area to the north of the Contact U mineralization returns non-prospective background 206Pb/204Pb and 207Pb/206Pb ratios in barren drill-holes CONT-14 and CONT-15 (Figure 6C,D and Figure 9C,D) that intersected the targeted gravity anomaly. The background U values and the lack of promising ‘strongly anomalous’ Pb-isotope ratio values in these two drill-holes downgrades this exploration target area.
The proportion of samples from the Contact prospect that fall into the very prospective ‘highly anomalous’ 207Pb/206Pb ratio field is lower that observed for U deposits, such as Bong and End; however, the 207Pb/206Pb ratio 3D view of the Contact U prospect (Figure 13B) shows the presence of highly-anomalous ratios located outside of the mineralized area, which is depicted in Figure 13A by the >500 cps gamma probing contours. The 207Pb/206Pb ratio anomaly region outside of the mineralized zone shows a limited footprint and typically does not extend as far as the end of the drill holes and the 206Pb/204Pb ratio anomaly region is of roughly similar extent. However, these anomalous values are useful for evaluation of drill-holes and of poorly-defined mineralized regions. Mineralized drill holes are identified well on the 206Pb/204Pb ratio and 207Pb/206Pb ratio multi-hole diagrams and are well discriminated from ‘barren’ drill holes. Importantly, ‘promising’ drill holes that show ‘strongly anomalous’ Pb-isotopic ratio values, yet are barren of U, can be identified for follow-up drilling. While the limited anomaly footprints do not extend very far from the basement-hosted mineralization and so are not suitable for regional-scale targeting, they do indicate locations of potential mineralization and structural extensions to existing mineralization on a prospect-scale from examination of individual drill-hole Pb-isotope data and evaluation of mineralized zones. In a more general sense, the Pb-isotope pathfinder geochemical method that provides the extents and orientations of the anomalous regions can also be useful to improve understanding of how and when fluids moved to disperse U and Pb in the basement environment.
6. Conclusions
In general, total-digestion Pb-isotope data should not be used in Pb-isotope pathfinder U exploration.
The two varieties of Weak Acid Leaches (SRC, QFIR) provided data that were not significantly different. Either WAL variety can be used in U exploration using Pb-isotope pathfinder geochemistry.
The partial digestion Pb-isotope data for the basement-hosted U deposits of the Kiggavik area provide results that are very similar to those obtained for the WAL data. Both sets of data produced interesting vectoring results in scatterplots, down-hole plots, and plan views. In the absence of WAL Pb-isotope data, the partial digestion Pb-isotope data can be used for drill-hole- and prospect-scale evaluation and exploration vectoring purposes.
Diagrams using the 206Pb/204Pb and 207Pb/206Pb ratios show systematic trends useful in unconformity-type U exploration. They show that Pb-isotope dispersion has occurred around the basement-hosted U deposits at Kiggavik, although relatively tightly to the host structures (faults). This dispersion forms a target for the Pb-isotope pathfinder method in the basement environment, similar to what has been previously done in the sandstone environment.
The 206Pb/204Pb versus U plots provide information on Pb isotopic compositions that are supported, or unsupported, by the amount of U presently contained in the rock. These isotopic data are used to generate an ‘excess Pb’ content qualifier that can be displayed on ‘adjusted’ 206Pb/204Pb downhole plots. Raw 206Pb/204Pb downhole plots do not provide information on ‘excess Pb’ content, but the ‘adjusted’ 206Pb/204Pb downhole plots highlight these U-unsupported isotopic values.
While the Pb-isotope anomaly (halo) footprints are limited in extent beyond the mineralization outline in these basement rocks, they are useful for individual drill-hole evaluation and evaluation of mineralized zones. However, the lack of extensive anomalism beyond the basement-hosted mineralization limits use of the Pb-isotope dispersion exploration method in regional targeting.
Author Contributions
Conceptualization, D.Q. and A.B.; Methodology, D.Q.; Software, D.Q.; Validation, A.B.; Formal Analysis, D.Q.; Investigation, D.Q. and A.B.; Resources, D.Q. and A.B.; Data Curation, D.Q.; Writing-Original Draft Preparation, D.Q.; Writing–Review & Editing, D.Q. and A.B.; Visualization, D.Q. and A.B.; Supervision, D.Q.; Project Administration, D.Q. All authors have read and agreed to the published version of the manuscript.
Funding
This research was funded by AREVA Resources Canada Inc.
Acknowledgments
This study began as a result of discussions between the authors and the late Kurt Kyser of the Queen’s Facility for Isotope Research (QFIR) at Queen’s University. The authors thank Orano Canada Inc. (formerly AREVA Resources Canada Inc.) for geological and logistical support in the field, as well as for the analytical support, especially Patrick Ledru and John Robbins. John Robbins is also thanked for providing comments and suggestions for improving the manuscript. The Saskatchewan Research Council’s Geoanalytical Laboratory is also thanked for performing the lithogeochemical analyses, for their in-kind contribution of a set of WAL leaches and Pb-isotope analyses, and for the comments and suggestions provided by Rob Millar. The QFIR is thanked for performing a set of WAL analyses and for the comments and suggestions provided by Steve Beyer. Reviews by two anonymous reviewers contributed to improving the content of the manuscript.
Conflicts of Interest
The authors declare no conflict of interest.
References
- Quirt, D.; Benedicto, A. Application of lead isotopes in uranium exploration at Kiggavik (NE Thelon area, Nunavut). In Proceedings of the GAC-MAC Joint Annual Meeting, Whitehorse, Yukon, 1–3 June 2016; poster and abstract no. 89, Abstracts/Resumés. 2016; Volume 39, p. 75. [Google Scholar]
- Quirt, D.; Benedicto, A.; Millar, R. Lead isotopes in exploration for basement-hosted uranium at Kiggavik (Nunavut). In Proceedings of the GAC-MAC Joint Annual Meeting, Kingston, Ontario, 14–18 May 2019; poster and abstract, Abstracts/Resumés. 2017; Volume 40, p. 322. [Google Scholar]
- Benedicto, A.; Quirt, D.; Robbins, J. Lead isotopes in exploration for basement-hosted uranium at Kiggavik (Nunavut). Goldschmidt Abstr. 2019, 255. [Google Scholar]
- Quirt, D.H. Applying Pb isotopes in unconformity-type uranium exploration. In Proceedings of the 24th IAGS, Fredericton, NB, Canada, 1–4 June 2009; Lentz, D., Thorne, K.G., Beal, K.-L., Eds.; 2009; pp. 445–448. [Google Scholar]
- Kyser, K.; Lahusen, L.; Drever, G.; Dunn, C.; Leduc, E.; Chipley, D. Using Pb isotopes in surface media to distinguish anthropogenic sources from undercover uranium sources. Comptes Rendus-Geosci. 2015, 347, 215–226. [Google Scholar] [CrossRef]
- Fayek, M.; Shabaga, B.; Sharpe, R.; Quirt, D. Application of SIMS U-Pb and Pb-Pb geochronology of uraninite and galena from selected Canadian uranium deposits. In Applied Isotope Geochemistry; Eglington, B., Fayek, M., Kyser, K., Eds.; Topics in Mineral Sciences; Mineralogical Association of Canada: Québec, QC, Canada, 2019; Volume SC48, pp. 59–76. [Google Scholar]
- Faure, G. Principles of Isotope Geology; John Wiley and Sons: New York, NY, USA, 1986; 589p. [Google Scholar]
- Grare, A.; Benedicto, A.; Lacombe, O.; Trave, A.; Ledru, P.; Blain, M.; Robbins, J. The Contact uranium prospect, Kiggavik project, Nunavut (Canada): Tectonic history, structural constraints and timing of mineralization. Ore Geol. Rev. 2018, 93, 141–167. [Google Scholar] [CrossRef] [Green Version]
- Gulson, B.L. Lead isotopes in mineral exploration. In Developments in Economic Geology 23; Elsevier: Amsterdam, The Netherlands, 1986; 245p. [Google Scholar]
- Holk, G.J.; Kyser, T.K.; Chipley, D.; Hiatt, E.E.; Marlatt, J. Mobile Pb-isotopes in Proterozoic sedimentary basins as guides for exploration of uranium deposits. J. Geochem. Explor. 2003, 80, 297–320. [Google Scholar] [CrossRef]
- Martz, P.; Mercadier, J.; Perret, J.; Villeneuve, J.; Deloule, E.; Cathelineau, M.; Quirt, D.; Doney, A.; Ledru, P. Post-crystallization alteration of natural uraninites: Implications for dating, tracing, and nuclear forensics. Geochim. Cosmochim. Acta 2019, 249, 138–159. [Google Scholar] [CrossRef]
- Carr, G.; Rutherford, N. U exploration using Pb isotopes: Opportunities in partial extraction geochemistry. In Proceedings of the 22nd International Geochemical Exploration Symposium (IGES 2005), Perth, Australia, 19–23 September 2005. [Google Scholar]
- IAEA. World Distribution of Uranium Deposits (UDEPO) with Uranium Deposit Classification; IAEA-TECHDOC-1629; International Atomic Energy Agency: Vienna, Austria, 2009; 117p. [Google Scholar]
- IAEA. Unconformity-Related Uranium Deposits; IAEA-TECHDOC-1857; International Atomic Energy Agency: Vienna, Austria, 2018; 295p. [Google Scholar]
- Fayek. Uranium ore deposits: A review. In Uranium: Cradle to Grave; Burns, P.C., Sigmon, G., Eds.; Short Course; Mineralogical Association of Canada: Québec, QC, Canada, 2013; Volume 43, pp. 121–147. [Google Scholar]
- Grare, A.; Benedicto, A.; Lacombe, O.; Trave, A.; Robbins, J.; Blain, M. Structural controls on uranium mineralization at the Kiggavik Project (NE Thelon area, Canada). SGA 2017 extended abstract. In Proceedings of the SGA Symposium, Quebec, QC, Canada, 20–23 August 2017. [Google Scholar]
- Grare, A.; Benedicto, A.; Mercadier, J.; Lacombe, O.; Trave, A.; Guilcher, M.; Richard, A.; Ledru, P.; Blain, M.; Robbins, J.; et al. Structural controls and metallogenic model of polyphase uranium mineralization in the Kiggavik area (Nunavut, Canada). Miner. Depos. 2020. [Google Scholar] [CrossRef]
- Gall, Q.; Peterson, T.D.; Donaldson, A. A proposed revision of Early Proterozoic stratigraphy of the Thelon and Baker Lake basins, Northwest Territories. Northwest Territ. Curr. Res. Part C Geol. Surv. Canada 1992, 92-1C, 129–137. [Google Scholar]
- Hiatt, E.E.; Kyser, K.; Dalrymple, R.W. Relationships among sedimentology, stratigraphy, and diagenesis in the Proterozoic Thelon Basin, Nunavut, Canada: Implications for paleoaquifers and sedimentary-hosted mineral deposits. J. Geochem. Explor. 2003, 80, 221–240. [Google Scholar] [CrossRef]
- Davis, W.J.; Gall, Q.; Jefferson, C.W.; Rainbird, R.H. Fluorapatite in the Paleoproterozoic Thelon Basin: Structural-stratigraphic context, in situ ion microprobe U–Pb ages, and fluid-flow history. Geol. Soc. Am. Bull. 2011, 123, 1056–1073. [Google Scholar] [CrossRef]
- Chamberlain, K.R.; Schmitt, A.K.; Swappa, S.M.; Harrison, T.M.; Swoboda-Colberg, N.; Bleeker, W.; Peterson, T.D.; Jefferson, C.W.; Khudoley, A. In situ U–Pb SIMS (IN-SIMS) micro-baddeleyite dating of mafic rocks: Method with examples. Precambrian Res. 2010, 183, 379–387. [Google Scholar] [CrossRef]
- Jefferson, C.W.; Pehrsson, S.; Peterson, T.; Chorlton, L.; Davis, W.; Keating, P.; Gandhi, S.; Fortin, R.; Buckle, J.; Miles, W.; et al. Northeast Thelon Region Geoscience Framework—New Maps and Data for Uranium in Nunavut; Open File 6949; Geological Survey of Canada: Ottawa, ON, Canada, 2011; p. 1. [Google Scholar] [CrossRef]
- Ramaekers, P.; Jefferson, C.W.; Yeo, G.M.; Collier, B.; Long, D.G.F.; Drever, G.; McHardy, S.; Jiricka, D.; Cutts, C.; Wheatley, K.; et al. Revised geological map and stratigraphy of the Athabasca Group, Saskatchewan and Alberta. In EXTECH IV: Geology and Uranium EXploration TECHnology of the Proterozoic Athabasca Basin, Saskatchewan and Alberta; Jefferson, C.W., Delaney, G., Eds.; Geological Survey of Canada: Ottawa, ON, Canada, 2007; pp. 155–192. [Google Scholar]
- Hoeve, J.; Sibbald, T.I.I. On the genesis of Rabbit Lake and other unconformity-type uranium deposits in northern Saskatchewan, Canada. Econ. Geol. 1978, 73, 1450–1473. [Google Scholar]
- Hoeve, J.; Quirt, D.H. Mineralization and host-rock alteration in relation to clay mineral diagenesis and evolution of the Middle Proterozoic Athabasca Basin, northern Saskatchewan, Canada; Technical Report; Saskatchewan Research Council: Saskatoon, SK, Canada, 1984; p. 187. [Google Scholar]
- Hoeve, J.; Quirt, D. A stationary redox front as a critical factor in the formation of high-grade unconformity-type uranium ores in the Athabasca Basin, northern Saskatchewan. Bullétin Minéralogique 1987, 110, 157–171. [Google Scholar] [CrossRef]
- Peterson, T.D. Geology of the Dubawnt Lake area, Nunavut-Northwest Territories; Geological Survey of Canada: Ottawa, ON, Canada, 2006; Volume 580, p. 51. [Google Scholar]
- Davis, W.J.; Hanmer, S.; Tella, S.; Sandeman, H.A.; Ryan, J.J. U–Pb geochronology of the MacQuoid supracrustal belt and Cross Bay plutonic complex: Key components of the northwestern Hearne subdomain, western Churchill Province, Nunavut, Canada. Precambrian Res. 2006, 145, 53–80. [Google Scholar] [CrossRef]
- Pehrsson, S.J.; Berman, R.; Davis, W.J. Paleoproterozoic orogenesis during Nuna aggregation: A case study of reworking of the Archean Rae craton, Woodburn Lake, Nunavut. Precambrian Res. 2013, 232, 167–188. [Google Scholar]
- Jefferson, C.W.; Thomas, D.J.; Gandhi, S.S.; Ramaekers, P.; Delaney, G.; Brisbin, D.; Cutts, C.; Quirt, D.; Portella, P.; Olson, R.A. Unconformity-associated uranium deposits of the Athabasca Basin, Saskatchewan and Alberta. In EXTECH IV: Geology and Uranium Exploration Technology of the Proterozoic Athabasca Basin, Saskatchewan and Alberta; Jefferson, C.W., Delaney, G., Eds.; Geological Survey of Canada: Ottawa, ON, Canada, 2007; pp. 23–67. [Google Scholar]
- Peterson, T.D. Geological Setting and Geochemistry of the ca. 2.6 Ga Snow Island Suite in the Central Rae Domain of the Western Churchill Province; Open File 7841; Nunavut. Geol Survey of Canada: Ottawa, ON, Canada, 2015. [Google Scholar]
- Johnstone, D.; Bethune, K.; Quirt, D.; Benedicto, A. Lithostratigraphic and structural controls of uranium mineralization in the Kiggavik East Zone, Centre Zone, and Main Zone deposits. In Abstracts-Résumés, Proceedings of the GAC-MAC Joint Annual Meeting, Whitehorse, YT, Canada, 1–3 June 2016; Geological Association of Canada: St. John’s, NL, Canada, 2016; Volume 39, p. 41. [Google Scholar]
- Johnstone, D.; Bethune, K.; Quirt, D.; Benedicto, A.; Ledru, P. Lithostructural controls of U mineralization in the Kiggavik Main and Centre zones, north-central Rae craton: A record of long-lived tectonism and ground preparation for U ore systems. In Abstracts-Résumés, Proceedings of the Joint Annual Meeting, Kingston, ON, Canada, 14–18 May 2017; Geological Association of Canada: St. John’s, NL, Canada; Mineralogical Association of Canada: Québec, QC, Canada, 2017; Volume 40, p. 190. [Google Scholar]
- Rainbird, R.H.; Davis, W.J.; Pehrsson, S.J.; Wodicka, N.; Rayner, N.; Skulski, T. Early Paleoproterozoic supracrustal assemblages of the Rae domain, Nunavut, Canada: Intracratonic basin development during supercontinent break-up and assembly. Precambrian Res. 2010, 181, 167–186. [Google Scholar] [CrossRef]
- Roy, R.; Benedicto, A.; Grare, A.; Béhaegel, M.; Yoann, R.; Grant, H. Three-dimensional gravity modelling applied to the exploration of uranium unconformity-related basement-hosted deposits: The Contact prospect case study, Kiggavik, NE Thelon region (Nunavut, Canada). Can. J. Earth Sci. 2017, 54, 869–882. [Google Scholar]
- Scott, J.M.J.; Peterson, T.D.; Jefferson, C.W.; Cousens, B.L. Petrology and geochronology of Paleoproterozoic intrusive rocks, Kiggavik uranium camp, Nunavut. Can. J. Earth Sci. 2015, 518, 1–80. [Google Scholar] [CrossRef]
- LeCheminant, A.N.; Heaman, L.M. MacKenzie igneous events, Canada: Middle Proterozoic hotspot magmatism associated with ocean opening. Earth Planet. Sci. Lett. 1989, 96, 38–48. [Google Scholar] [CrossRef]
- Heaman, L.M.; LeCheminant, A.N. U-Pb baddeleyite ages of the Muskox intrusion and MacKenzie dyke swarm, N.W.T., Canada; Joint Annual Meeting, Program with Abstracts; Geological Association of Canada: St. John’s, NL, Canada; Mineralogical Association of Canada: Québec, QC, Canada, 1988; Volume 13, p. A53. [Google Scholar]
- Sharpe, R.; Fayek, M.; Quirt, D.; Jefferson, C.W. Geochronology and genesis of the Bong uranium deposit, Thelon Basin, Nunavut, Canada. Econ. Geol. 2015, 110, 1759–1777. [Google Scholar]
- Shabaga, B.; Fayek, M.; Jefferson, C.W.; Camacho, A. Mineralogy, geochronology, and genesis of the Andrew Lake uranium deposit, Thelon Basin, Nunavut, Canada. Can. J. Earth Sci. 2017, 54, 850–868. [Google Scholar] [CrossRef]
- Quirt, D.H. Athabasca unconformity-type uranium deposits: One deposit type with many variations. In Uranium Geochemistry, Proceedings of International Conference, Géochime de l’Uranium, Nancy, France, 13–16 April 2003; Cuney, M., Ed.; Université Henri-Poincaré: Nancy, France, 2003; pp. 309–312. [Google Scholar]
- Chi, G.; Haid, T.; Quirt, D.; Fayek, M.; Blamey, N. Petrography, fluid inclusion analysis, and geochronology of the End uranium deposit, Kiggavik, Nunavut, Canada. Miner. Deposita 2017, 52, 211–232. [Google Scholar] [CrossRef]
- Pagel, M.; Michard, A.; Juteau, M.; Turpin, L. Sm–Nd, Pb–Pb, and Rb–Sr systematics of the basement in the Cigar Lake area, Saskatchewan, Canada. Can. J. Earth Sci. 1993, 30, 731–742. [Google Scholar] [CrossRef]
Figure 1.
Geological map of the Churchill structural province showing the location of the Athabasca and Thelon basins, and the Kiggavik project area. STZ: Snowbird Tectonic Zone; CWB: Chipewyan-Wathaman batholith, ALF: Andrew Lake Fault, ASB: Aberdeen sub-basin. (After [8]).
Figure 1.
Geological map of the Churchill structural province showing the location of the Athabasca and Thelon basins, and the Kiggavik project area. STZ: Snowbird Tectonic Zone; CWB: Chipewyan-Wathaman batholith, ALF: Andrew Lake Fault, ASB: Aberdeen sub-basin. (After [8]).

Figure 2.
Simplified geology of the Kiggavik area and the location of the Contact prospect (A); filled circles represent the U deposits (red) and prospects (yellow) (from [8]). (B) The footprint of the Contact mineralization (>0.0425% U3O8; red) and the alteration halo (grey) projected on a Bouguer gravity anomaly map (from [35]).

Figure 3.
Scatterplots of total digestion (TAD) versus partial digestion (PAD) analytical results for 204Pb (A), 206Pb (B), 207Pb (C), 206Pb/204Pb (D), and 207Pb/206Pb (E). (F) Quantile-Quantile plot of TAD 207Pb data, with results of Student’s t-Test of means for 207Pb.
Figure 3.
Scatterplots of total digestion (TAD) versus partial digestion (PAD) analytical results for 204Pb (A), 206Pb (B), 207Pb (C), 206Pb/204Pb (D), and 207Pb/206Pb (E). (F) Quantile-Quantile plot of TAD 207Pb data, with results of Student’s t-Test of means for 207Pb.

Figure 4.
Scatterplots of PAD versus WAL-Q analytical results for 204Pb (A), 206Pb (B), 207Pb (C), 206Pb/204Pb (D), and 207Pb/206Pb (E). (F) Quantile-Quantile plot of PAD 207Pb data, with results of Student’s t-Test of means for 207Pb.
Figure 4.
Scatterplots of PAD versus WAL-Q analytical results for 204Pb (A), 206Pb (B), 207Pb (C), 206Pb/204Pb (D), and 207Pb/206Pb (E). (F) Quantile-Quantile plot of PAD 207Pb data, with results of Student’s t-Test of means for 207Pb.

Figure 5.
Scatterplots of WAL-S versus WAL-Q analytical results for 204Pb (A), 206Pb (B), 207Pb (C), 206Pb/204Pb (D), and 207Pb/206Pb (E). (F) Quantile-Quantile plot of WAL-Q 207Pb data, with results of Student’s t-Test of means for 204Pb.
Figure 5.
Scatterplots of WAL-S versus WAL-Q analytical results for 204Pb (A), 206Pb (B), 207Pb (C), 206Pb/204Pb (D), and 207Pb/206Pb (E). (F) Quantile-Quantile plot of WAL-Q 207Pb data, with results of Student’s t-Test of means for 204Pb.

Figure 6.
206Pb/204Pb ratio multi-hole plots. (A) Bong U deposit, PAD; (B) End U deposit, PAD; (C) Contact U prospect, PAD; and (D) Contact U prospect, WAL-S. Non-mineralized samples are in green, mineralized samples are in red and orange. Colour bands represent arbitrary divisions of the ratio range from barren/background values (<30, green), through values considered to be anomalous (30–100, orange), to those values considered to be highly anomalous, such as found in mineralization (>100, pink).

Figure 7.
Downhole 206Pb/204 Pb-ratio excess Pb diagrams. (A) Barren drill-hole Bong-49, PAD; (B) mineralized drill-hole Bong-42, PAD; (C) mineralized drill-hole End-09-08A, PAD; (D) mineralized drill-hole CONT-23, PAD; and (E) CONT-23, WAL-S. Colour bands as for Figure 6. Purple diamonds represent samples with ‘excess Pb’ content (see text); U contents are shown by red circles.

Figure 8.
“Holk” 206Pb/204Pb versus 238U/206Pb excess Pb diagrams. (A) Bong U deposit, non-mineralized samples, PAD; (B) End U deposit, non-mineralized samples, PAD; (C) Contact U prospect, PAD; (D) Contact U prospect, non-mineralized samples, WAL-S. Pink, dark gray, and light gray regions denote samples containing ‘excess Pb’ using 2800 Ma, 2200 Ma, and 1750 Ma radiogenic Pb growth curves, respectively.

Figure 9.
The 207Pb/206Pb ratio multi-hole plots. (A) Bong U deposit; PAD, (B) End U deposit, PAD, (C) Contact U prospect, PAD (see text for field descriptions), and (D) Contact U prospect, WAL-S. Non-mineralized samples are in green, mineralized samples are in red and orange. Colour bands represent arbitrary divisions of the ratio range from barren/background values (gray), through values considered to be weakly to moderately to strongly anomalous (blue, green, and orange, respectively), to those values considered to be highly anomalous, such as found in mineralization (pink).

Figure 10.
U versus 207Pb/206Pb diagrams (A) Kiggavik camp samples, TAD; (B) Kiggavik camp samples, PAD; (C) Contact U prospect, non-mineralized, PAD; (D) Contact U prospect, non-mineralized, WAL-S. Colour bands as for Figure 9.
Figure 10.
U versus 207Pb/206Pb diagrams (A) Kiggavik camp samples, TAD; (B) Kiggavik camp samples, PAD; (C) Contact U prospect, non-mineralized, PAD; (D) Contact U prospect, non-mineralized, WAL-S. Colour bands as for Figure 9.

Figure 11.
Downhole 207Pb/206 Pb-ratio excess Pb diagrams. (A) Barren drill-hole Bong-49, PAD; (B) mineralized drill-hole Bong-42, PAD; (C) mineralized drill-hole CONT-06, PAD; and (D) CONT-06, WAL-S. Colour bands as for Figure 9.
Figure 11.
Downhole 207Pb/206 Pb-ratio excess Pb diagrams. (A) Barren drill-hole Bong-49, PAD; (B) mineralized drill-hole Bong-42, PAD; (C) mineralized drill-hole CONT-06, PAD; and (D) CONT-06, WAL-S. Colour bands as for Figure 9.

Figure 12.
Pb-isotope two-dimensional (2D) plan view maps of the Contact U prospect. (A) 206Pb/204Pb, PAD; (B) 207Pb/206Pb, PAD. The hatched areas represent the plan view of the mineralized envelope that extends from surface to ca. 150 m below surface.
Figure 12.
Pb-isotope two-dimensional (2D) plan view maps of the Contact U prospect. (A) 206Pb/204Pb, PAD; (B) 207Pb/206Pb, PAD. The hatched areas represent the plan view of the mineralized envelope that extends from surface to ca. 150 m below surface.

Figure 13.
U gamma probing and Pb-isotope three-dimensional (3D) models of the Contact U prospect. (A) U gamma counts (cps), with the intensity of orange shade being proportional to the gamma data; (B) PAD 207Pb/206Pb ratio values superimposed on the gamma data, with green to blue isosurfaces representing the ratio values that correspond to the orange (strongly anomalous) and pink (highly anomalous) fields of Figure 9, Figure 10 and Figure 11.


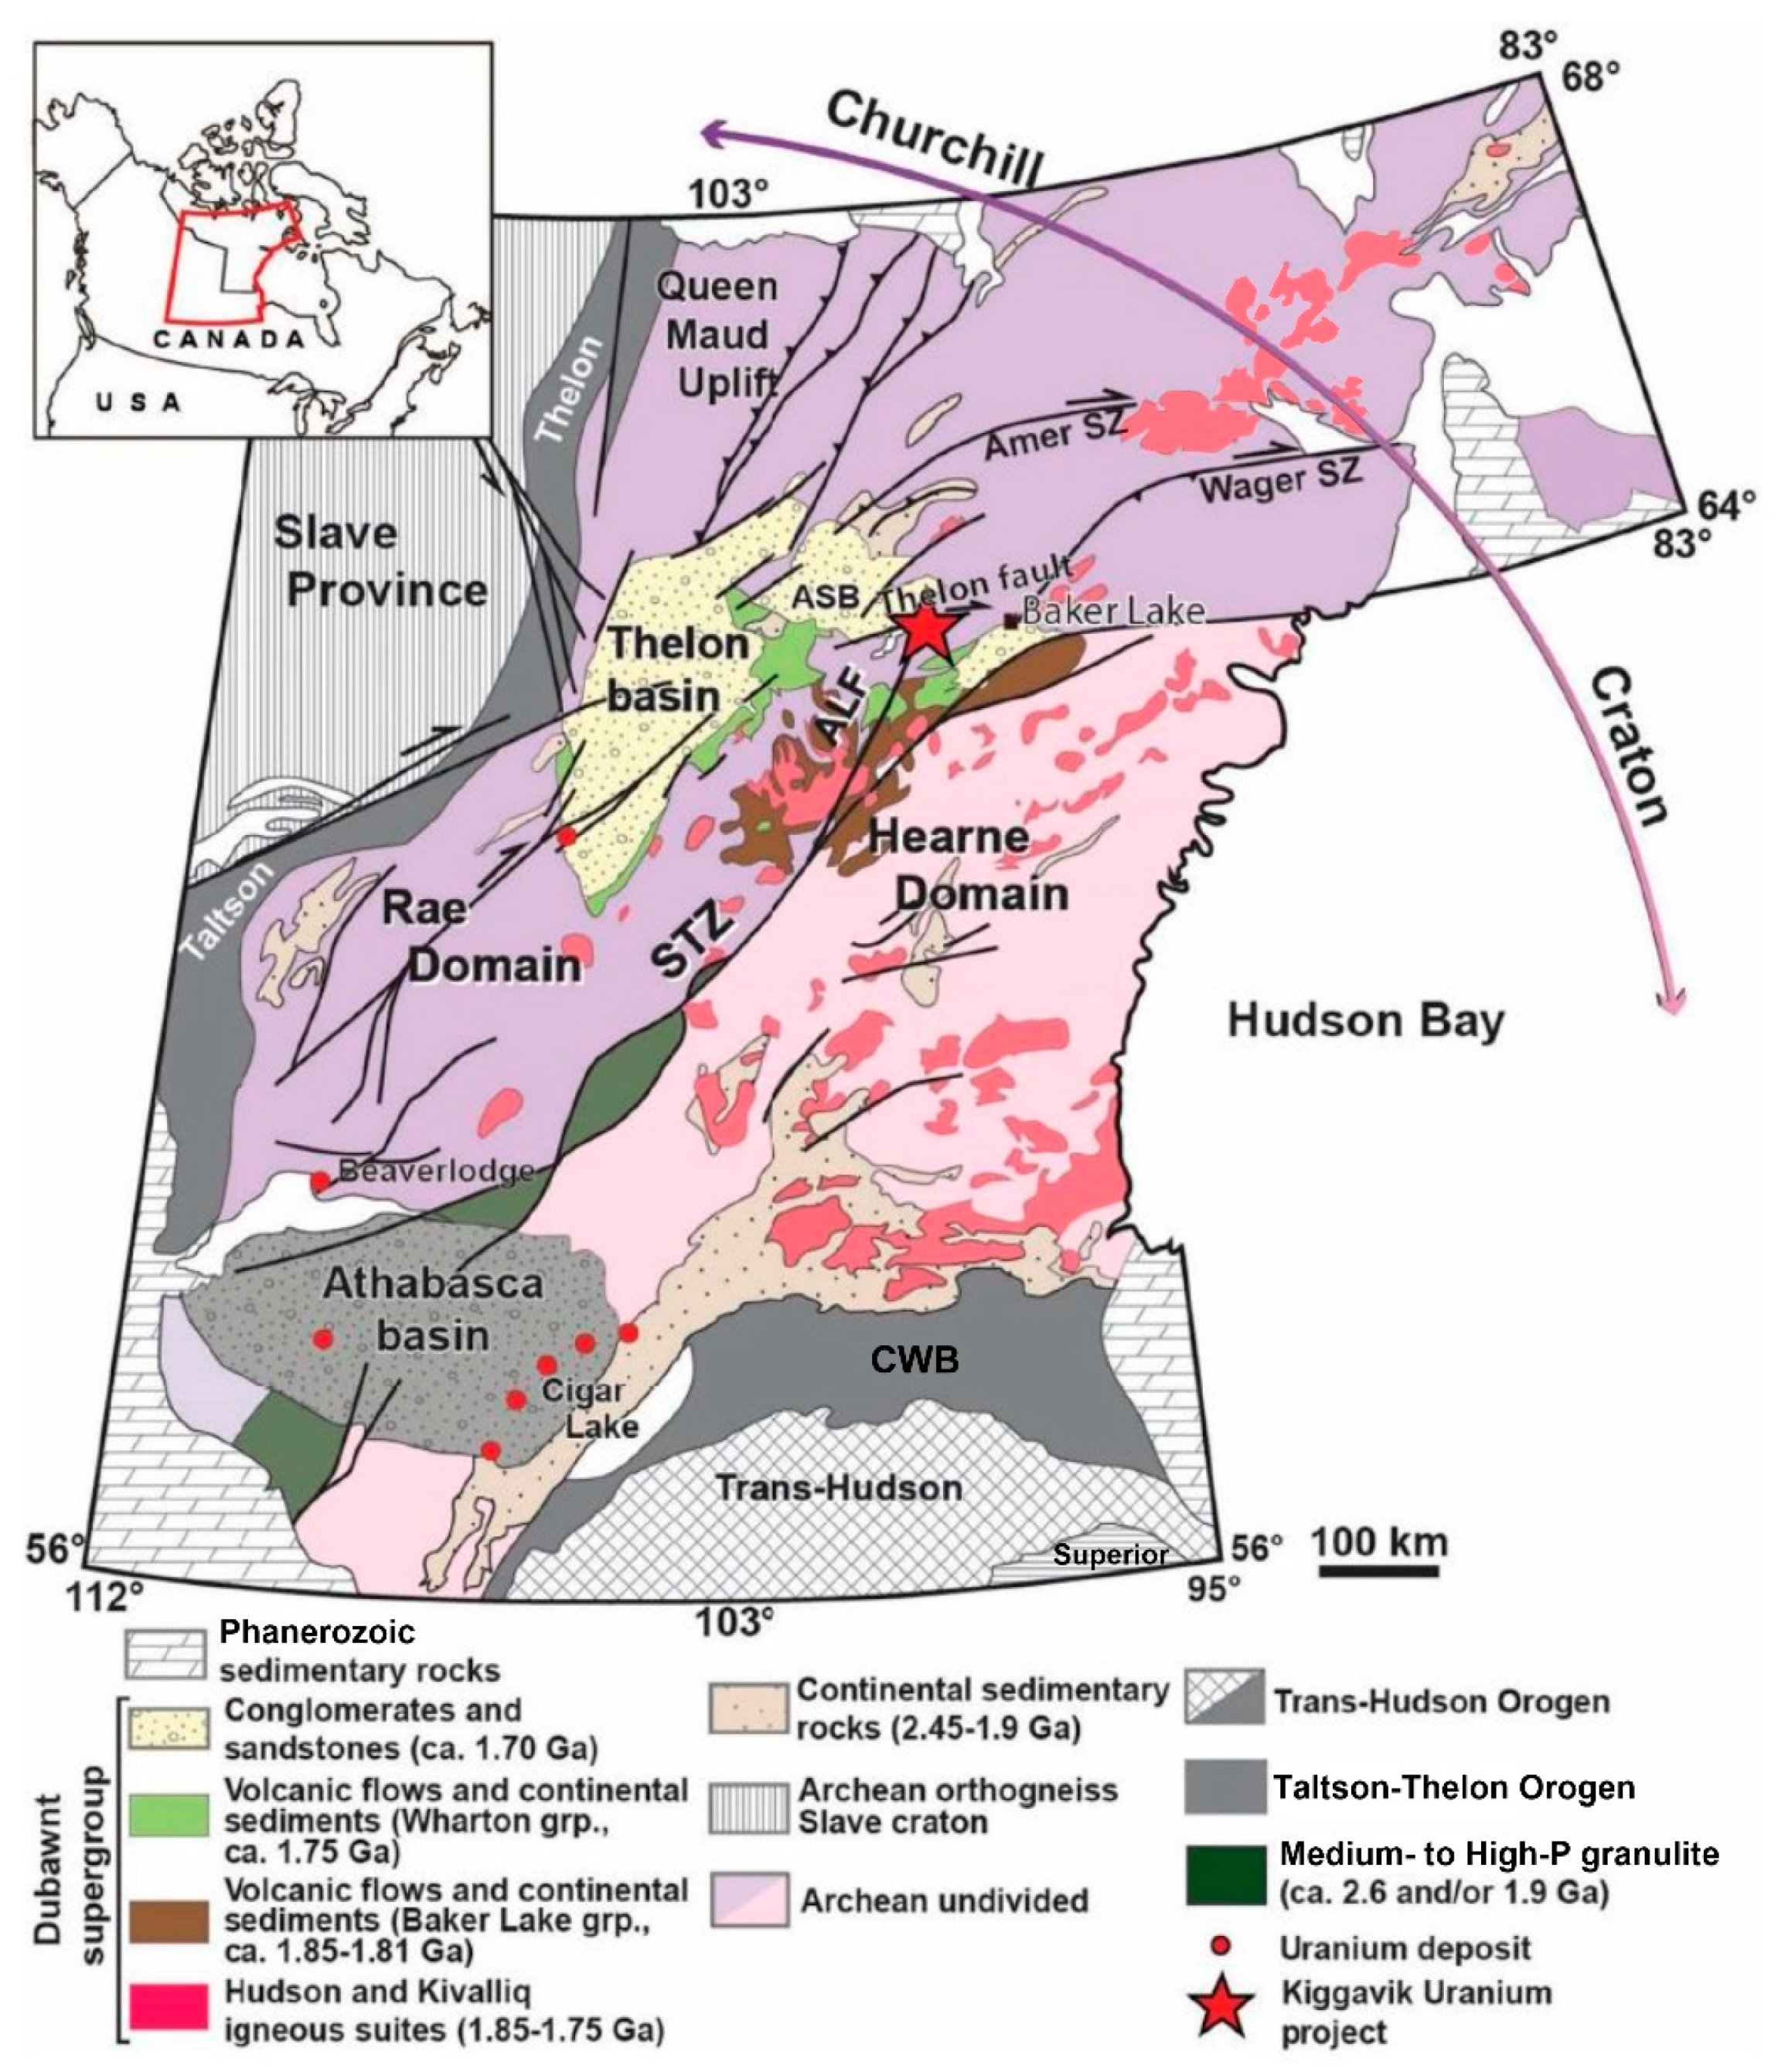
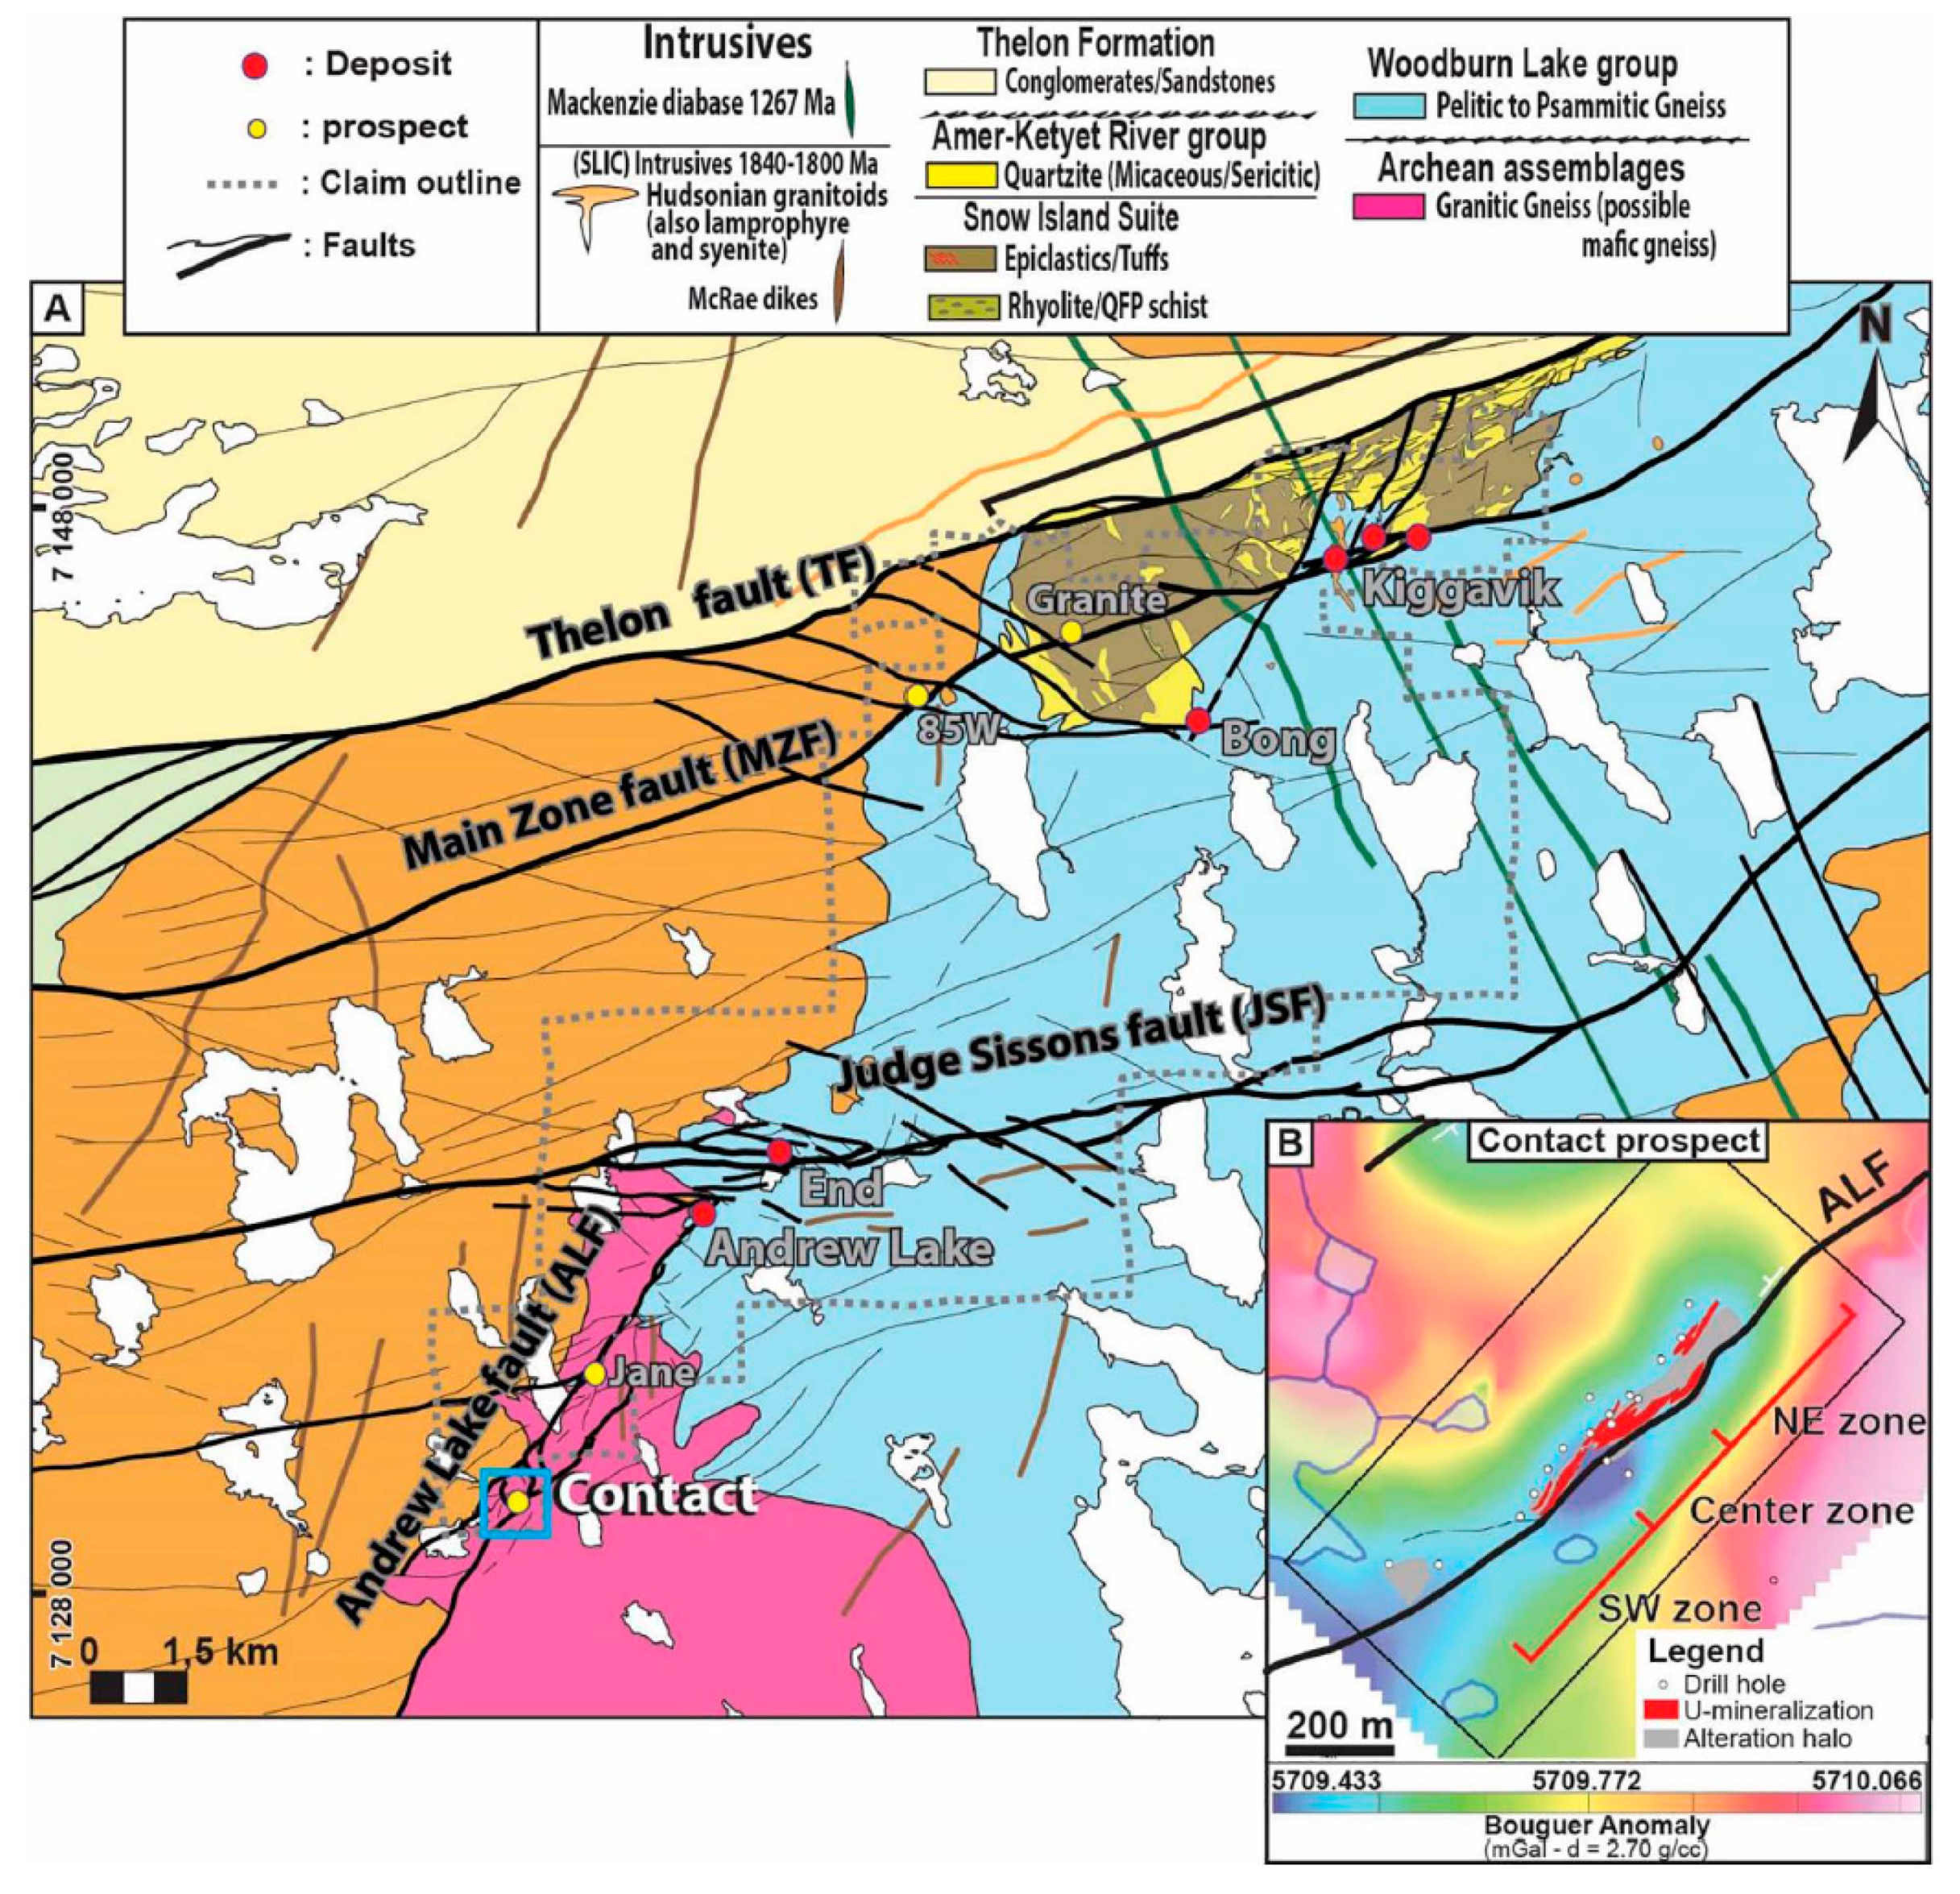
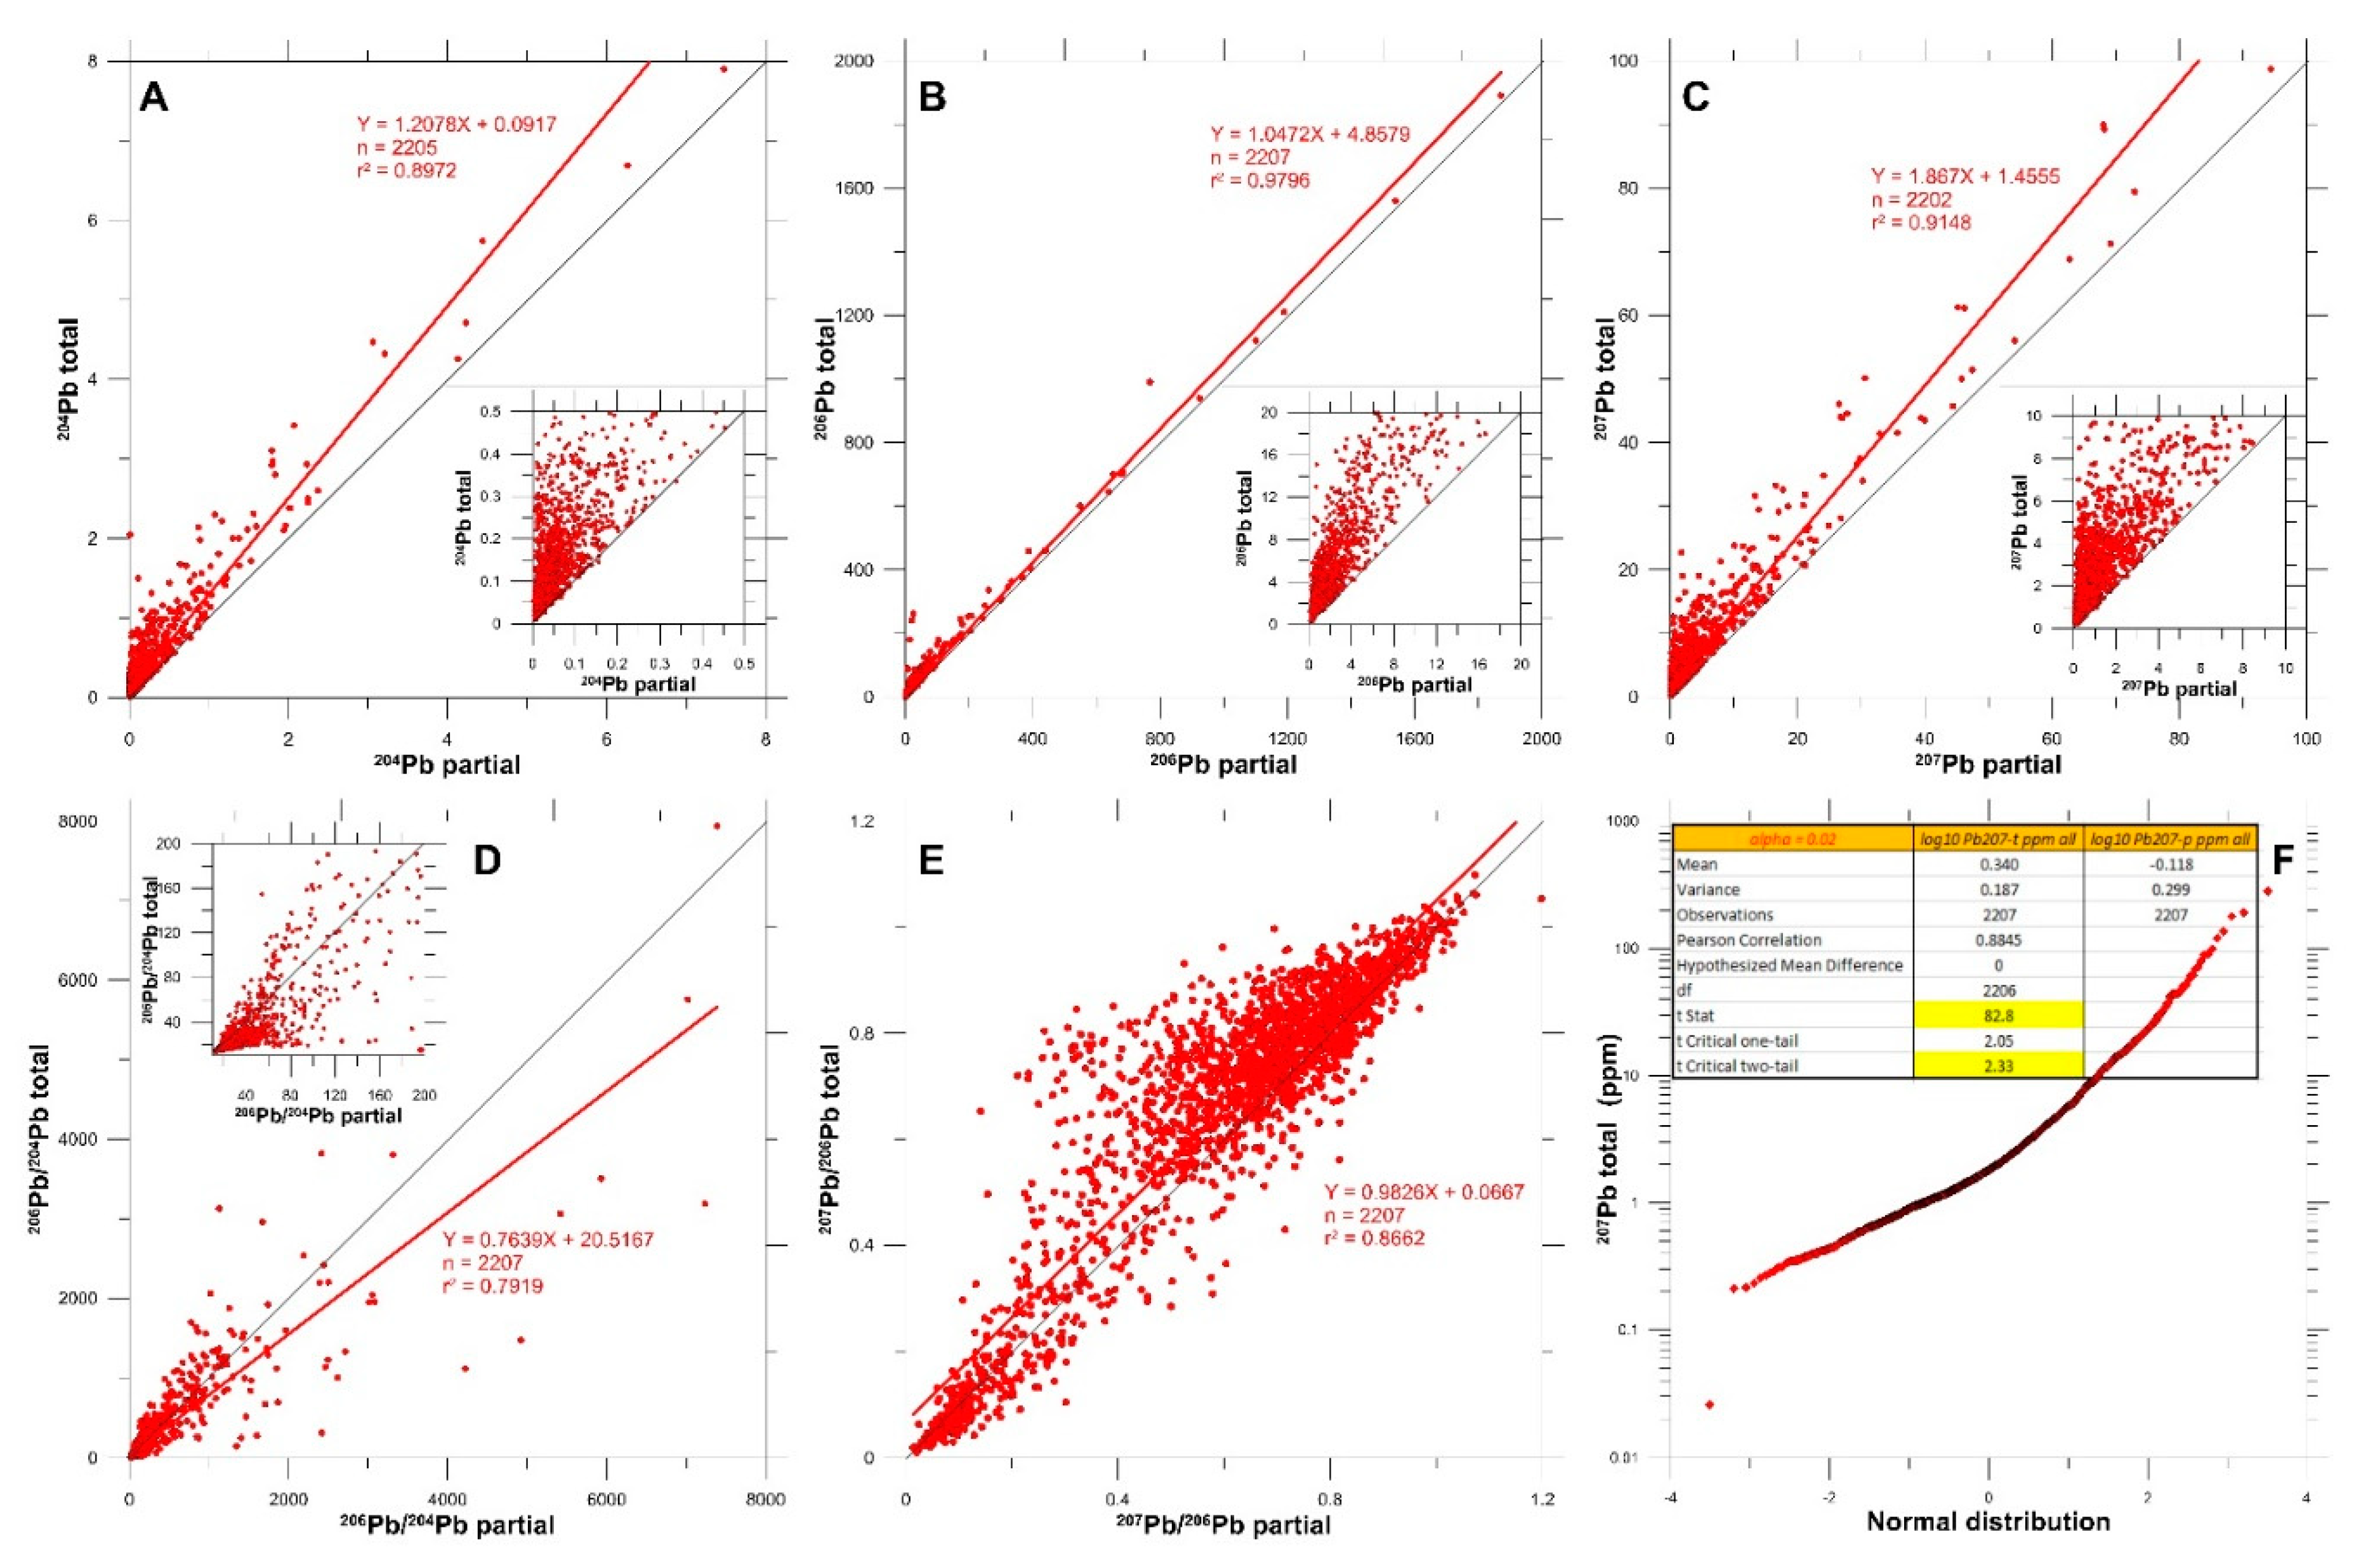
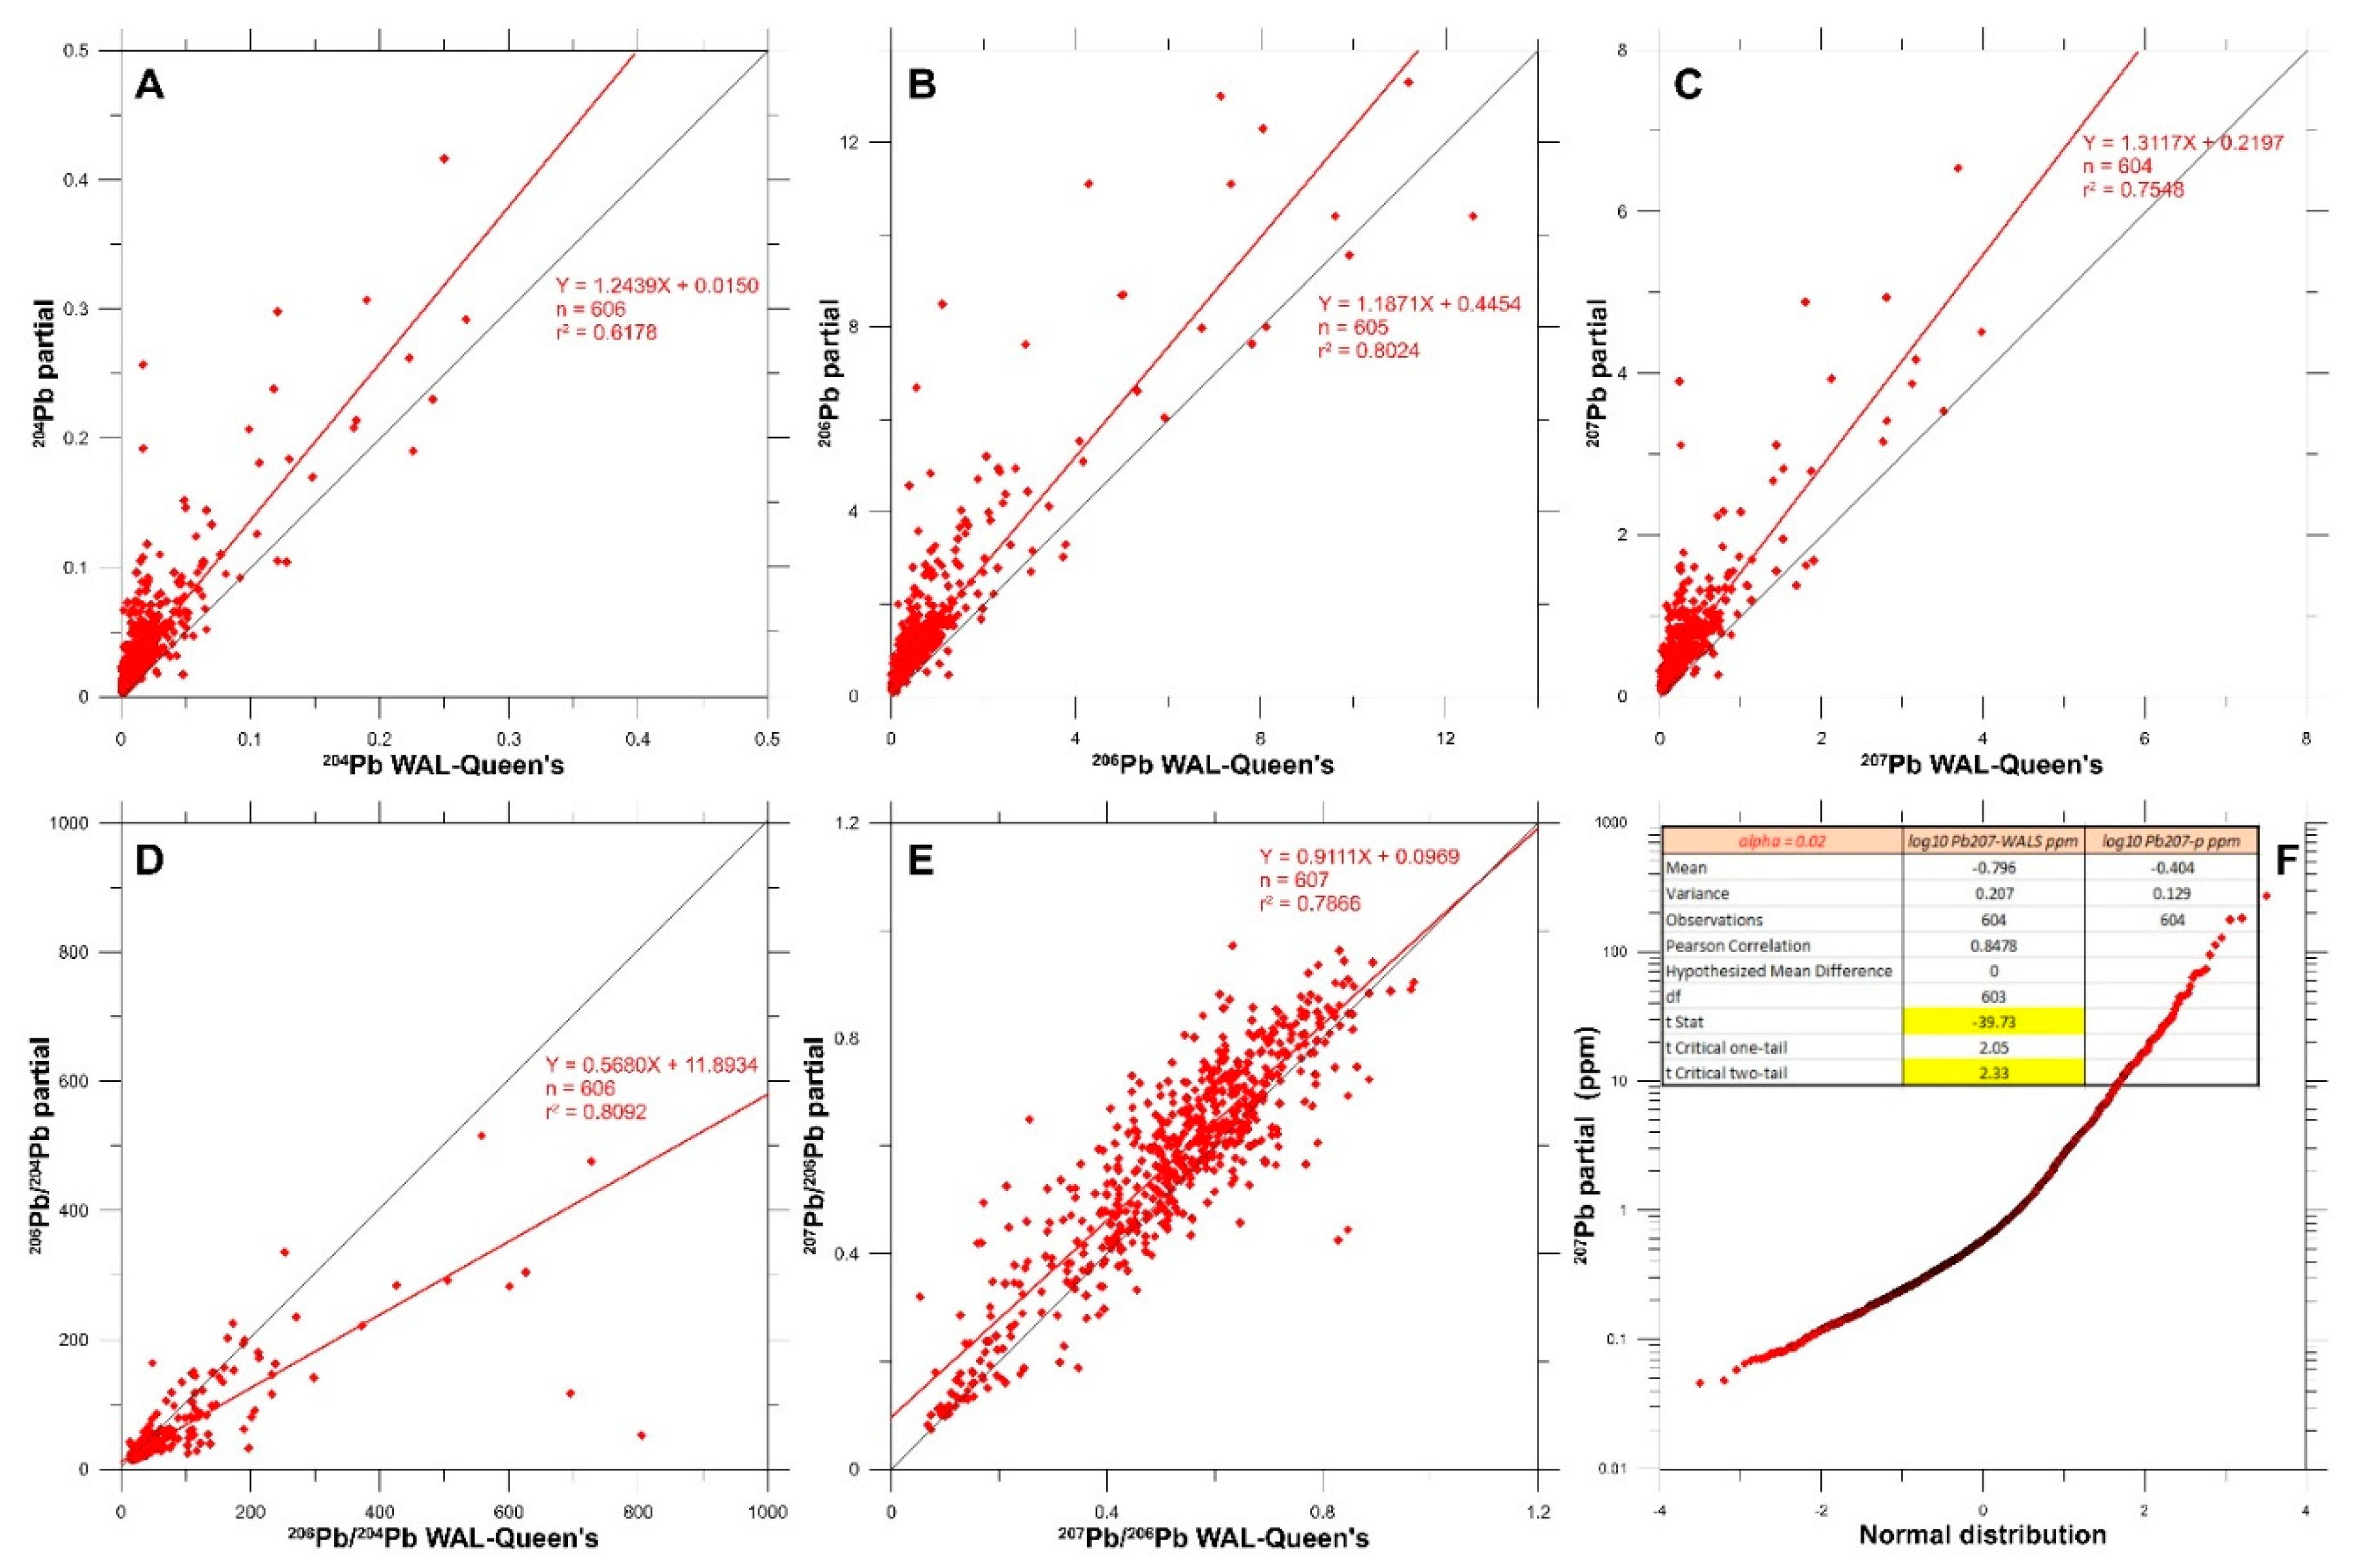
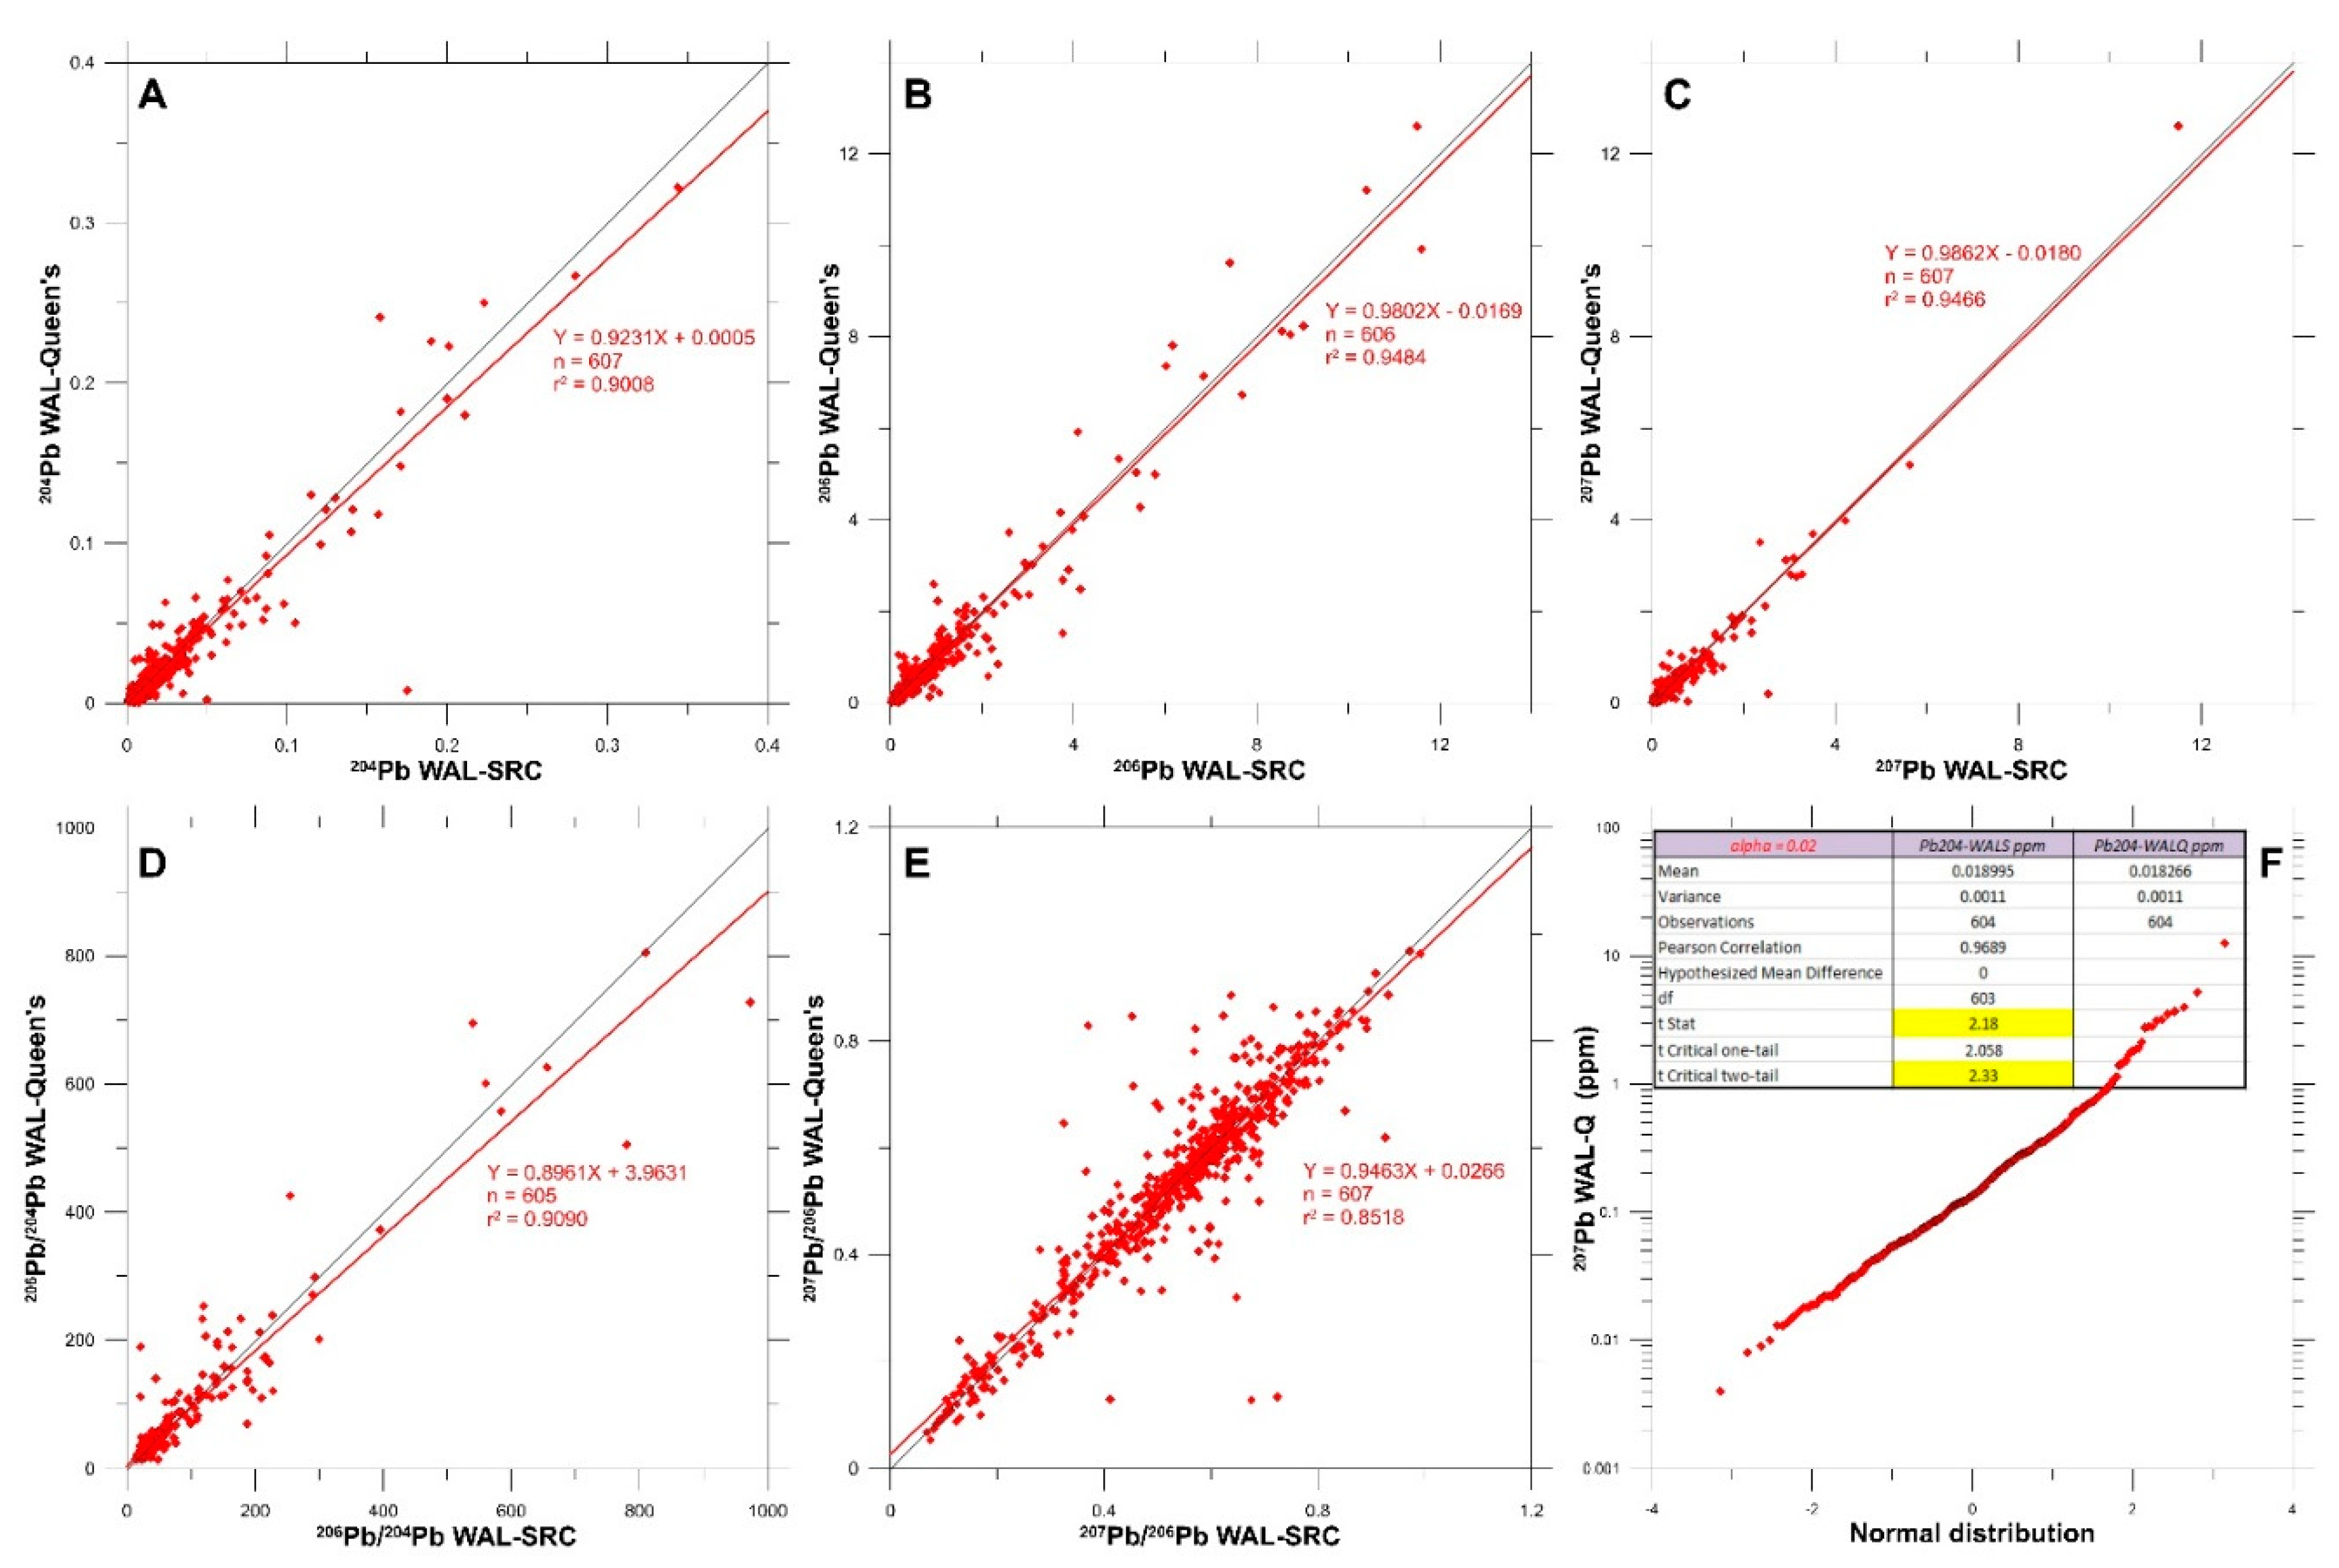
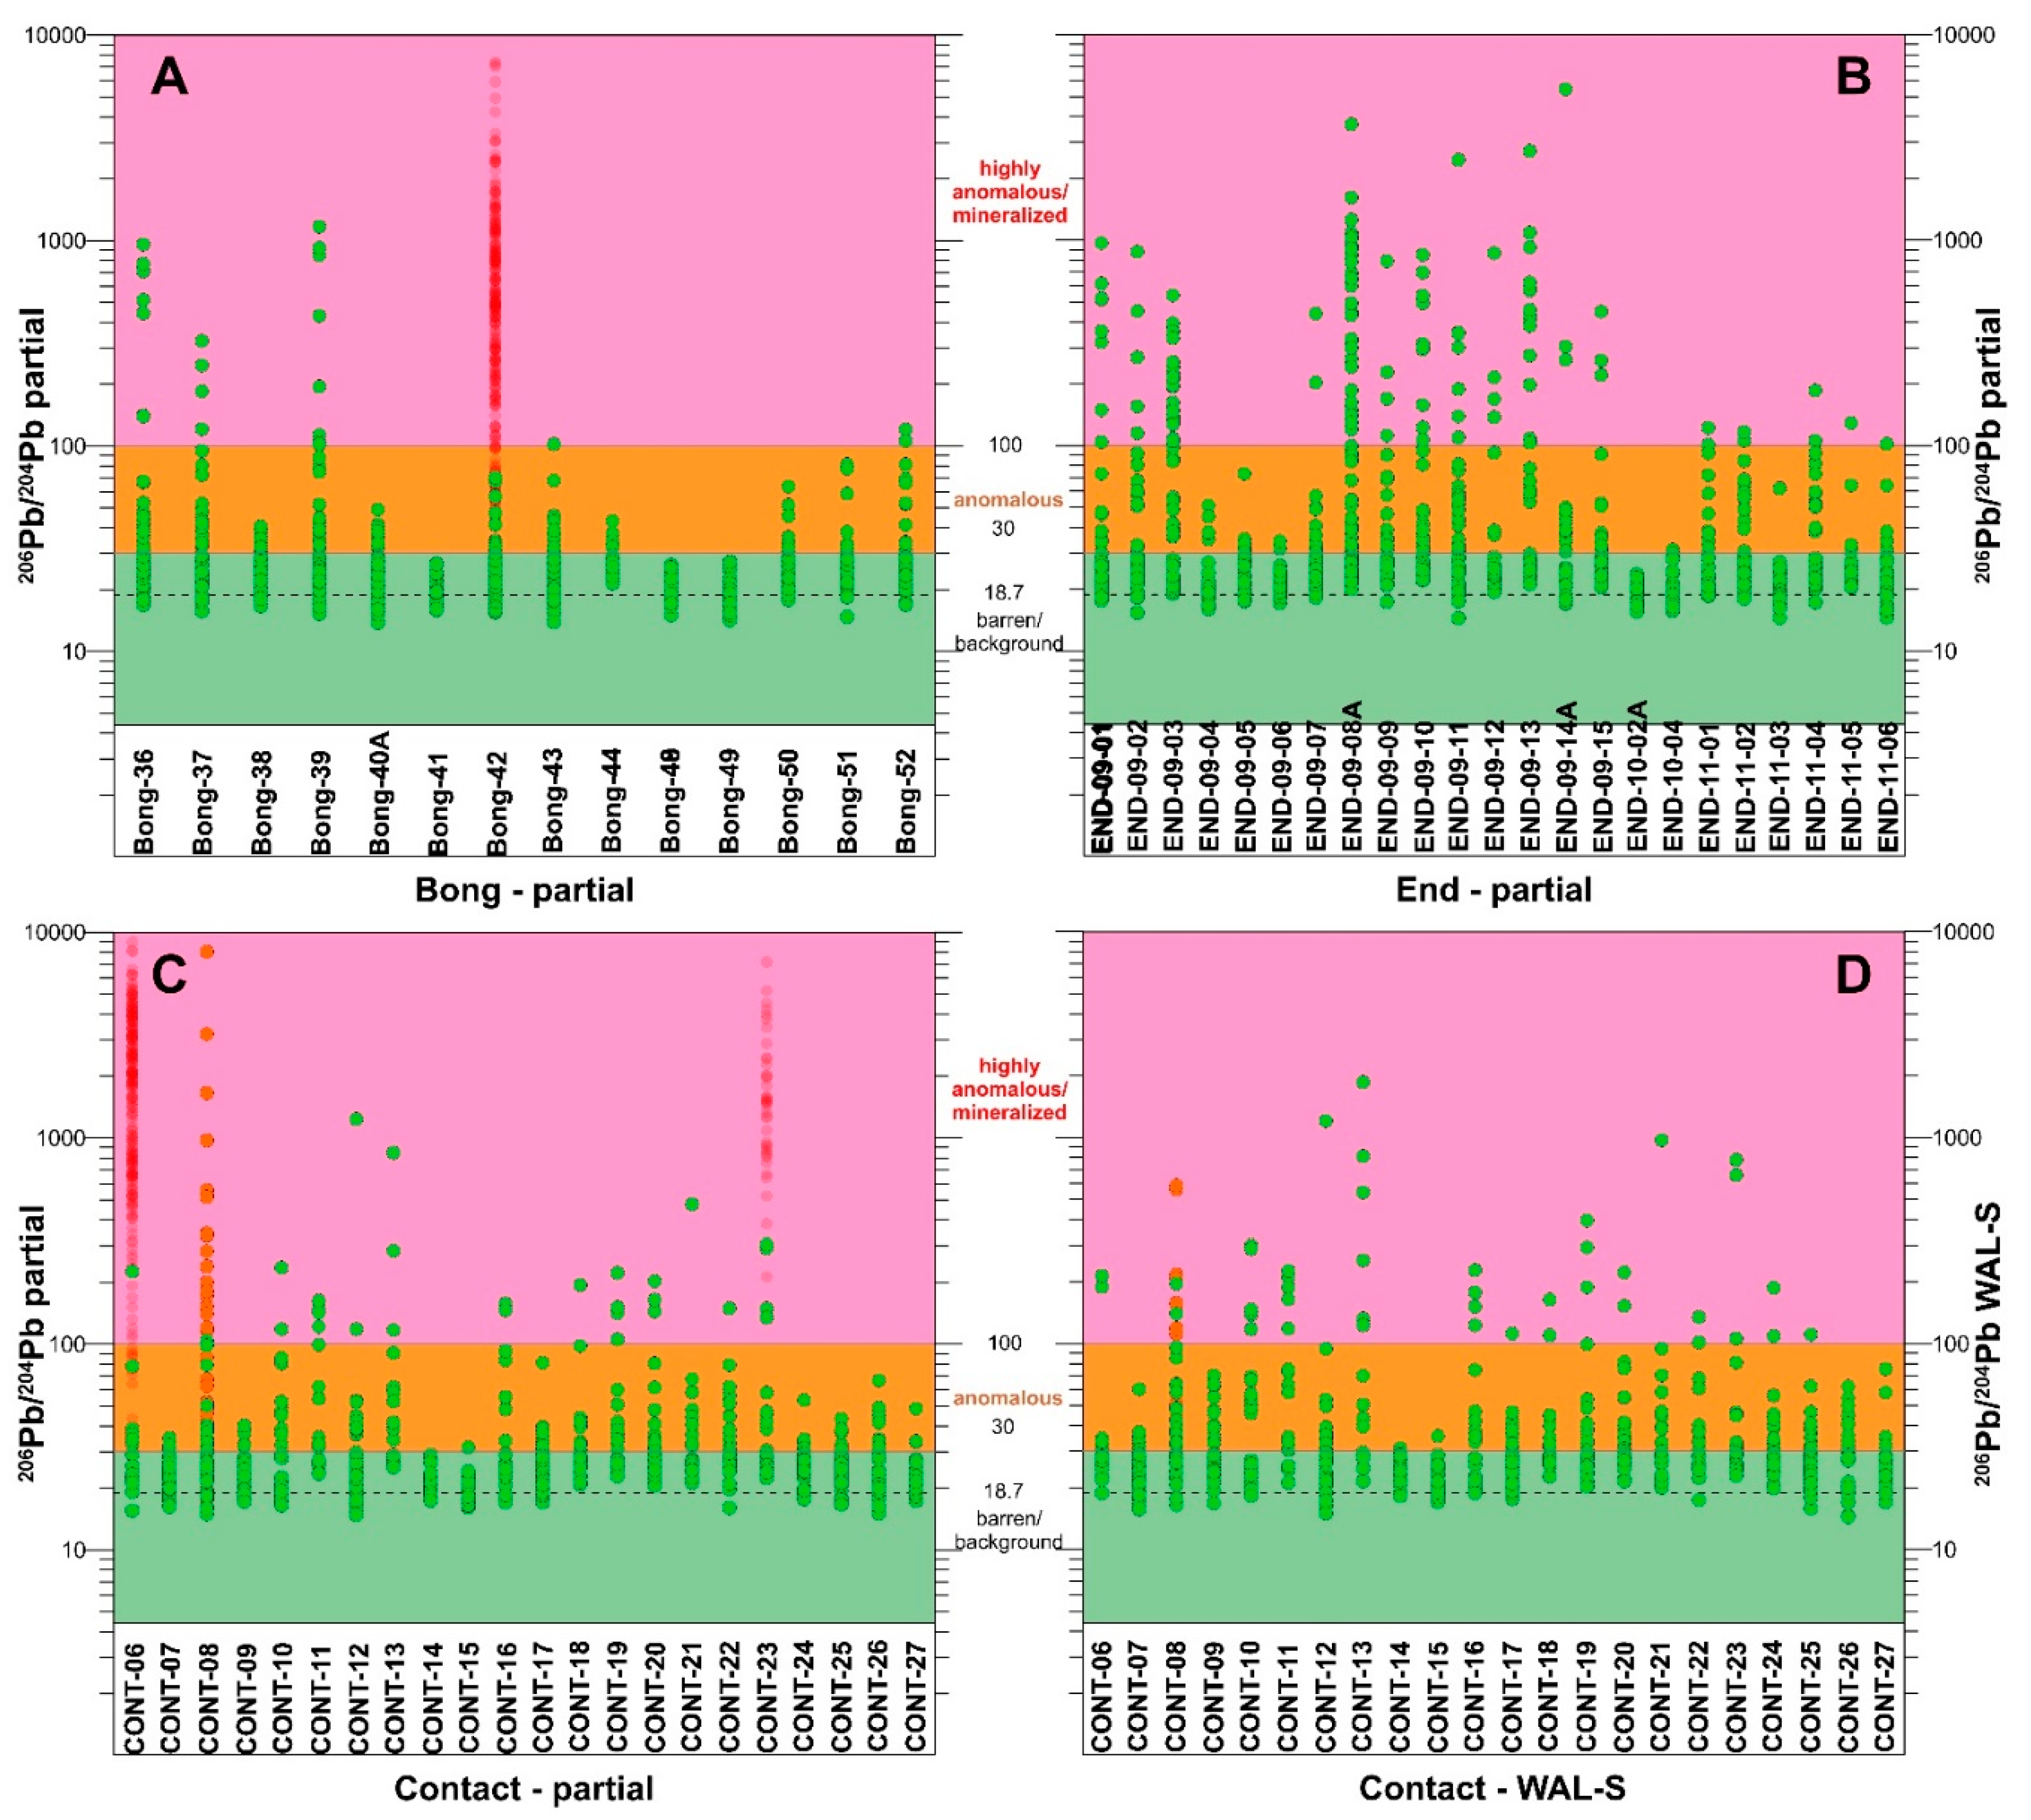
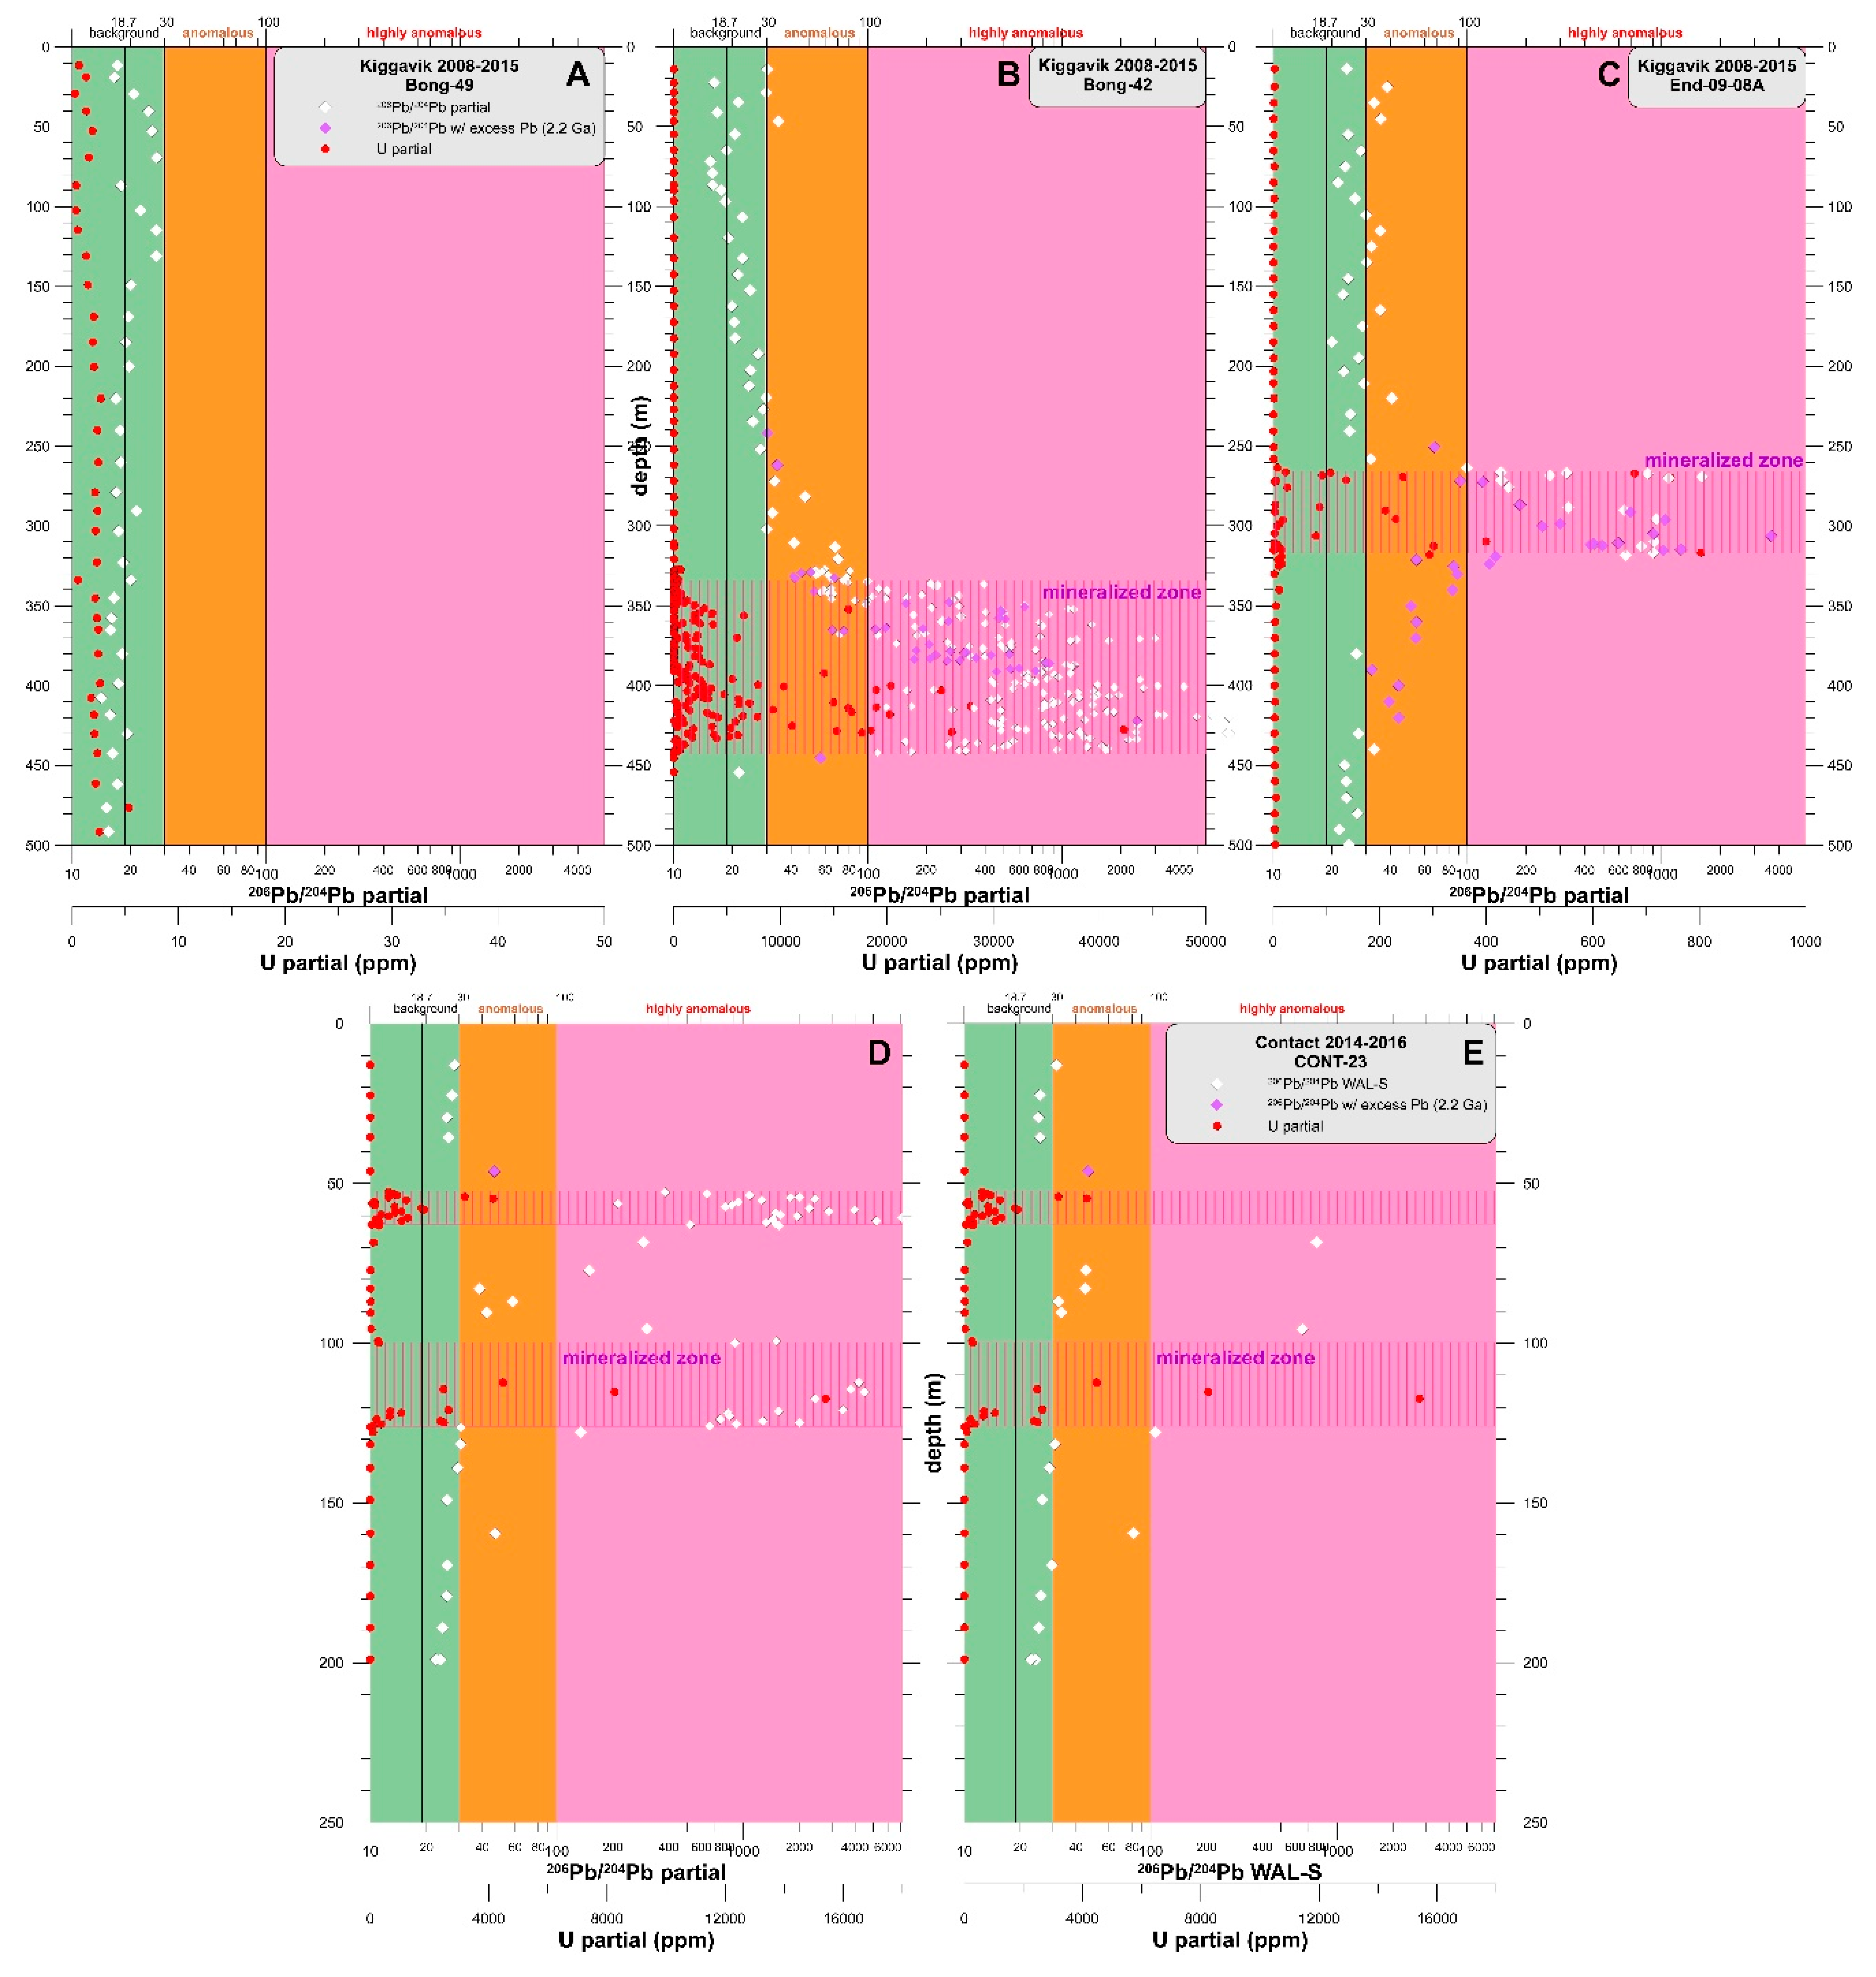
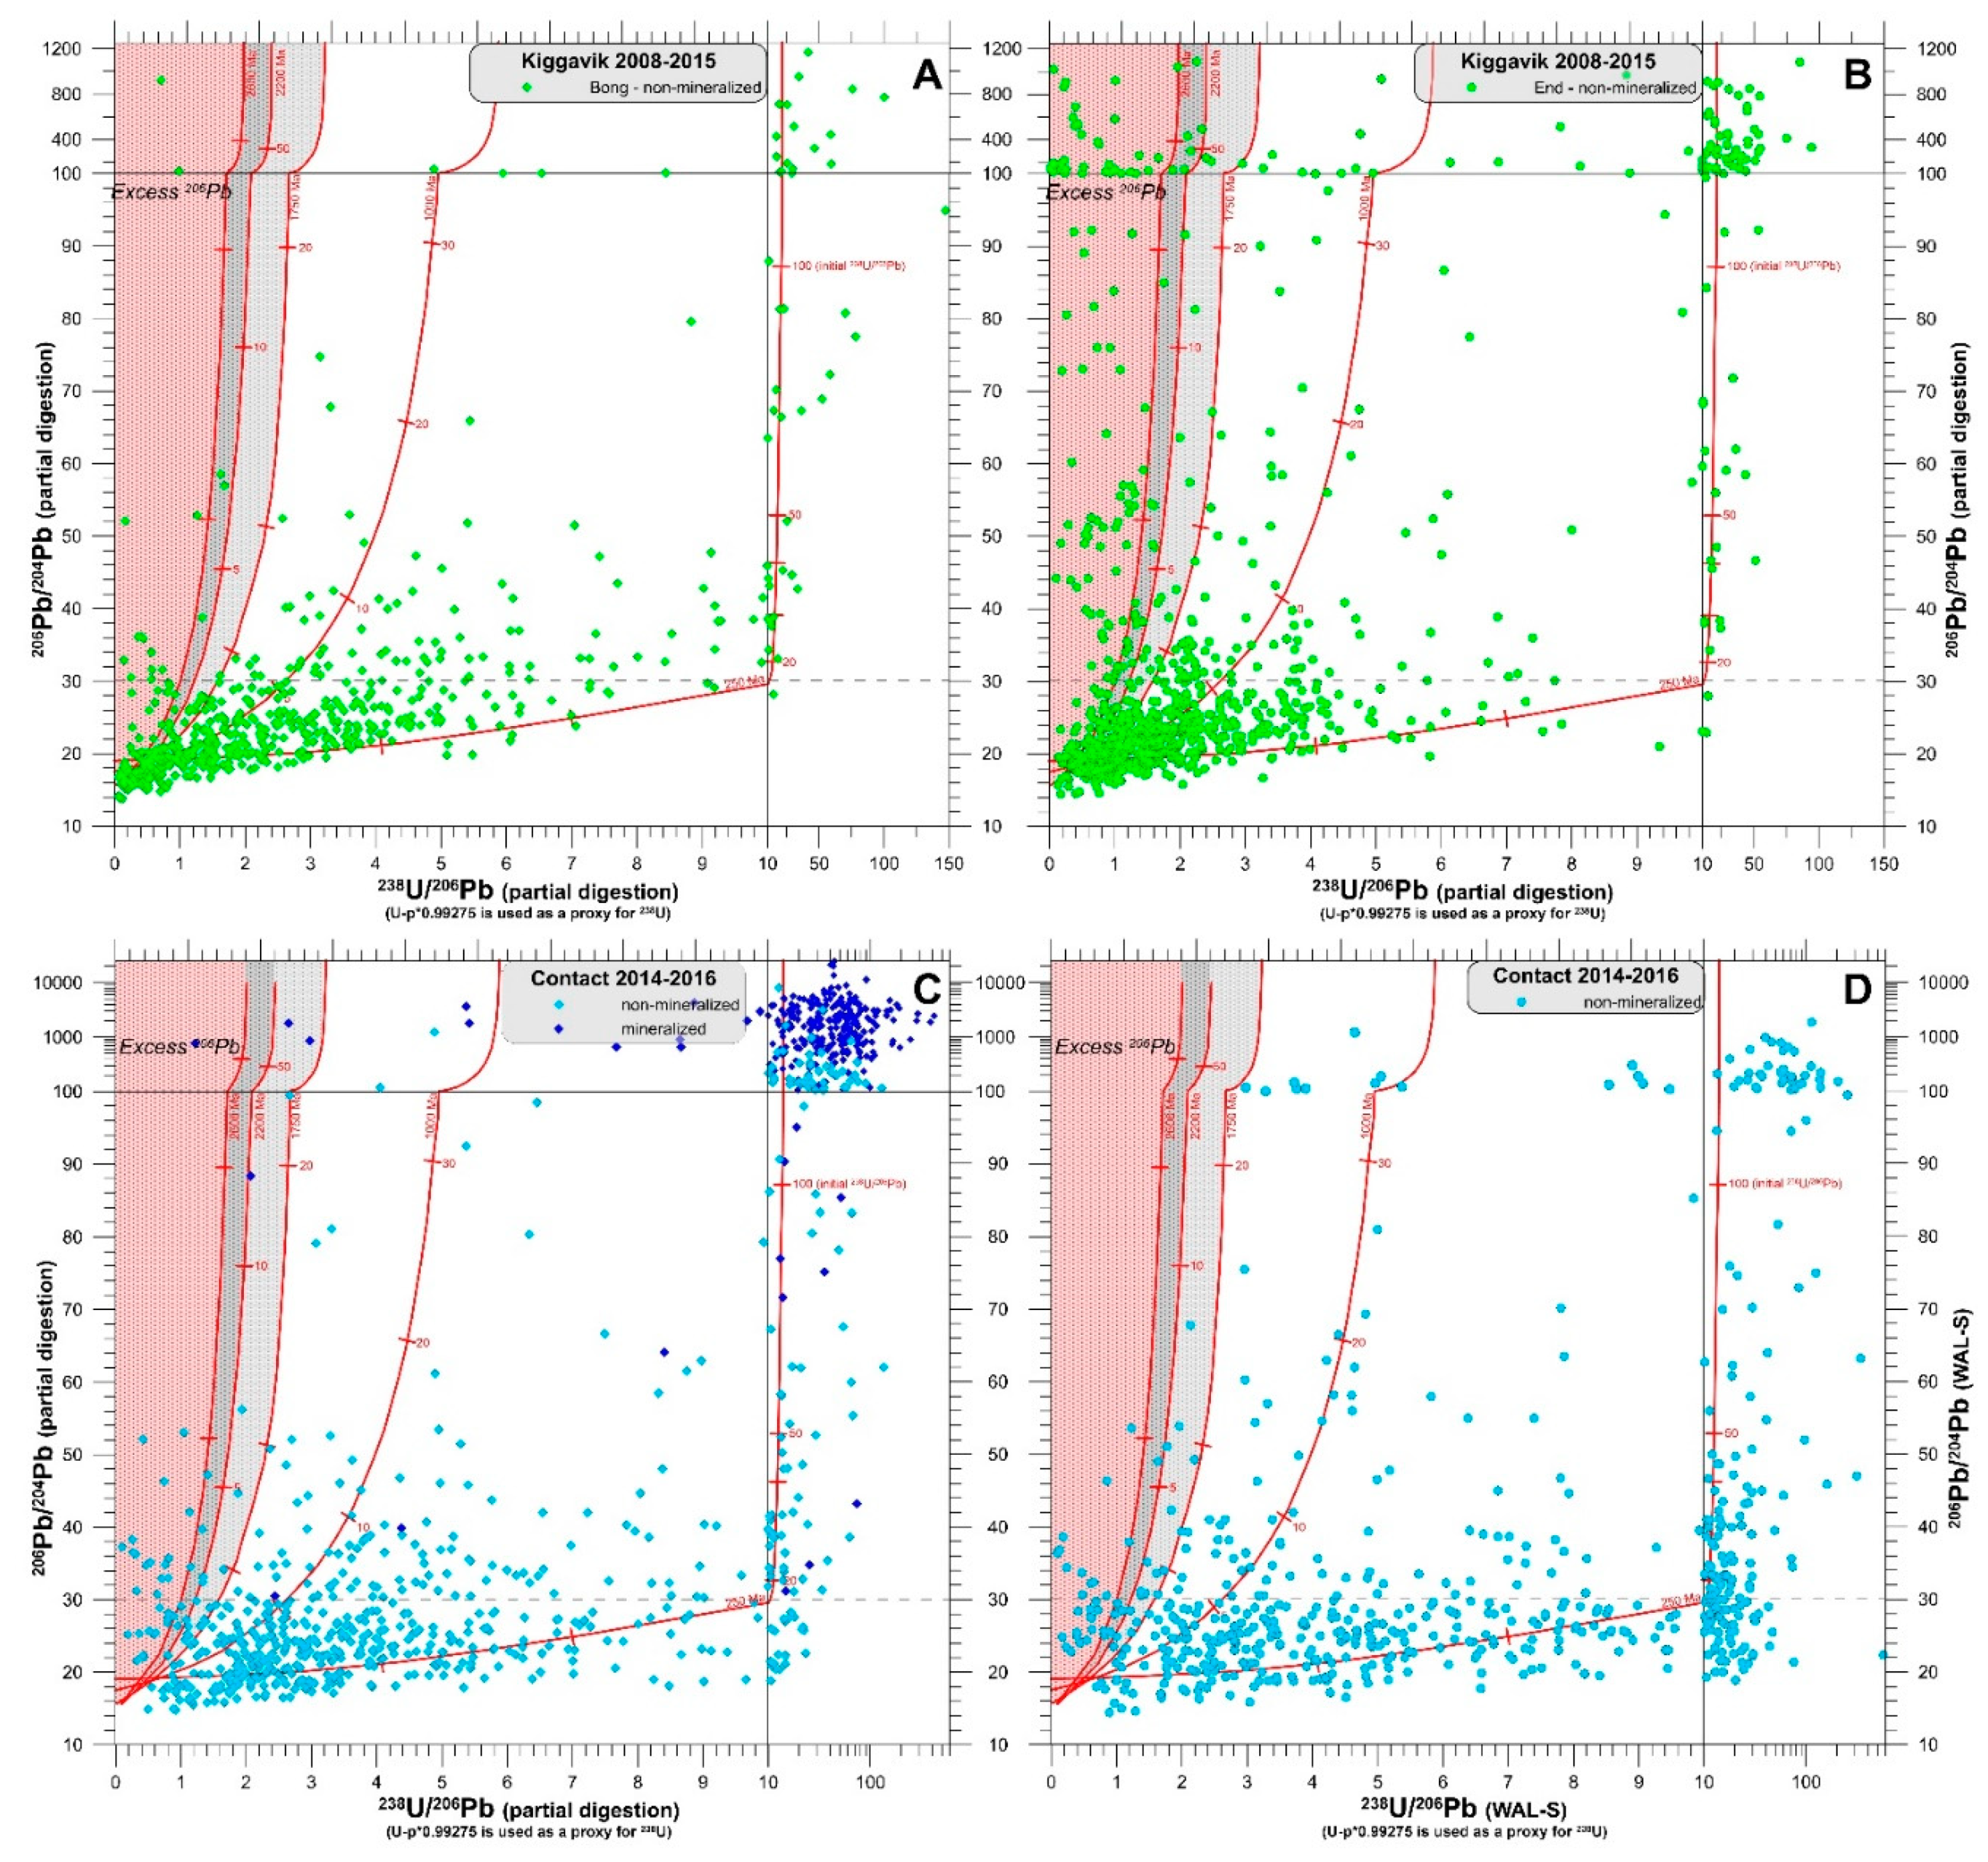
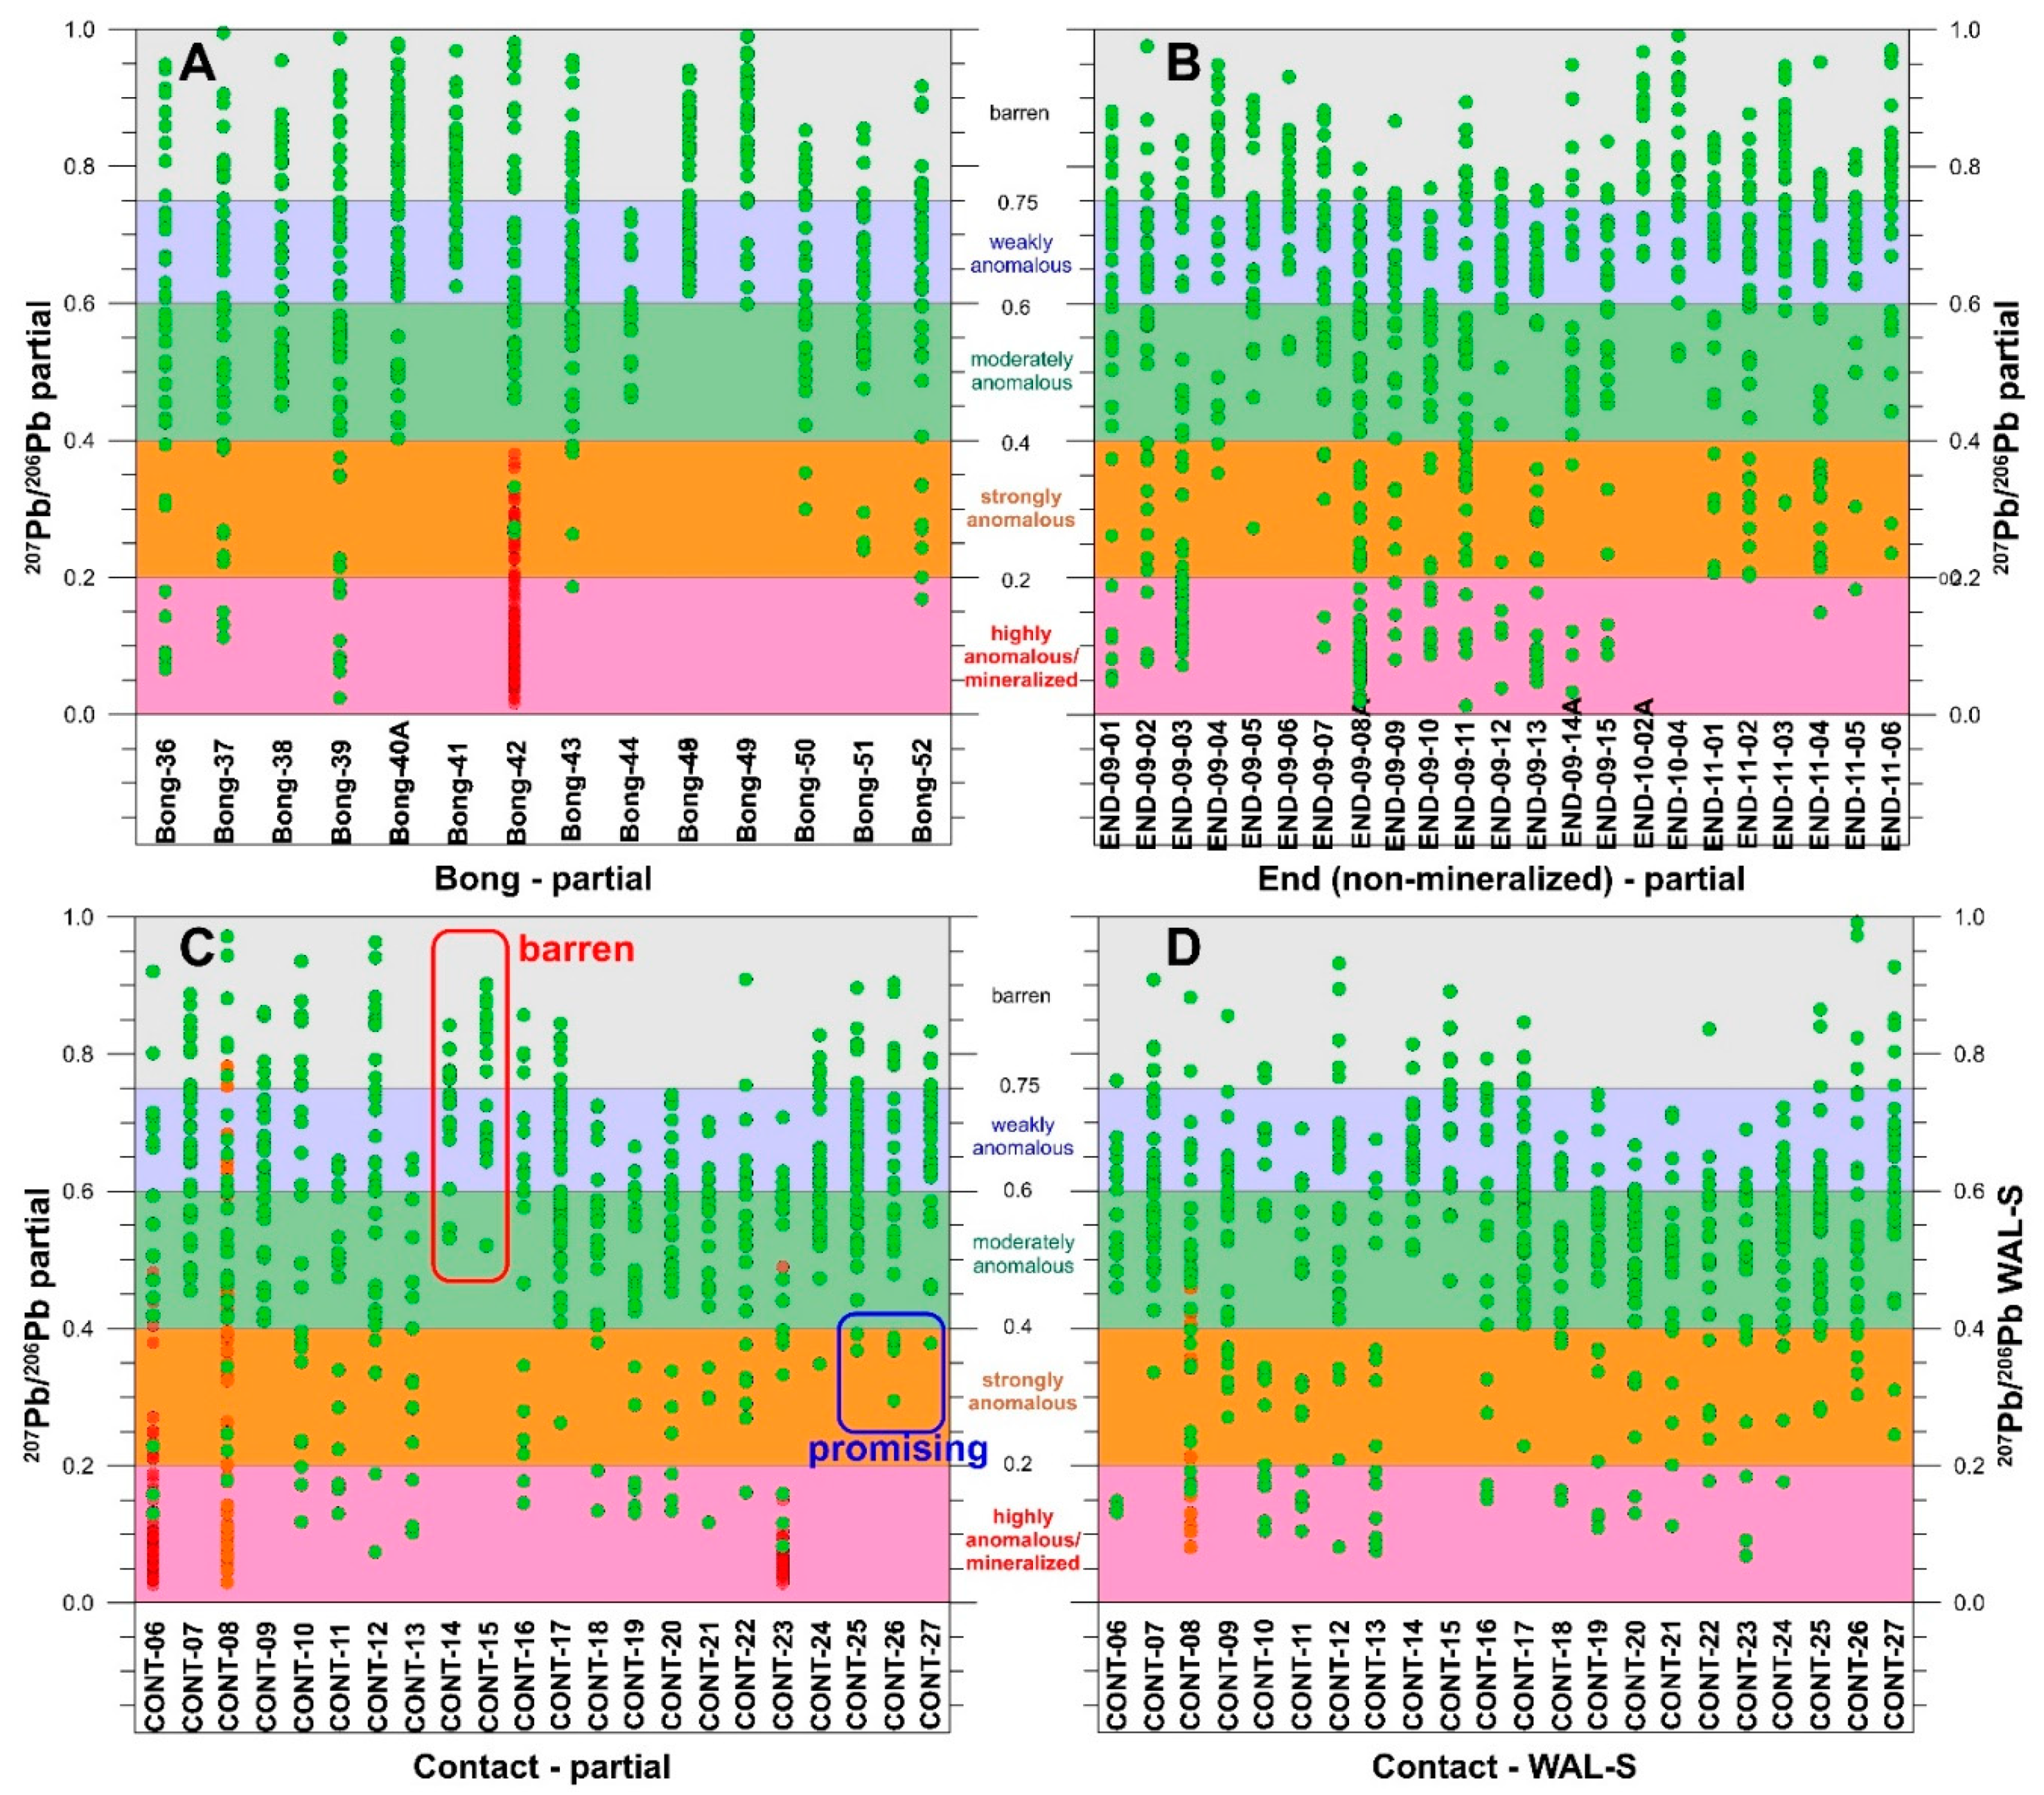
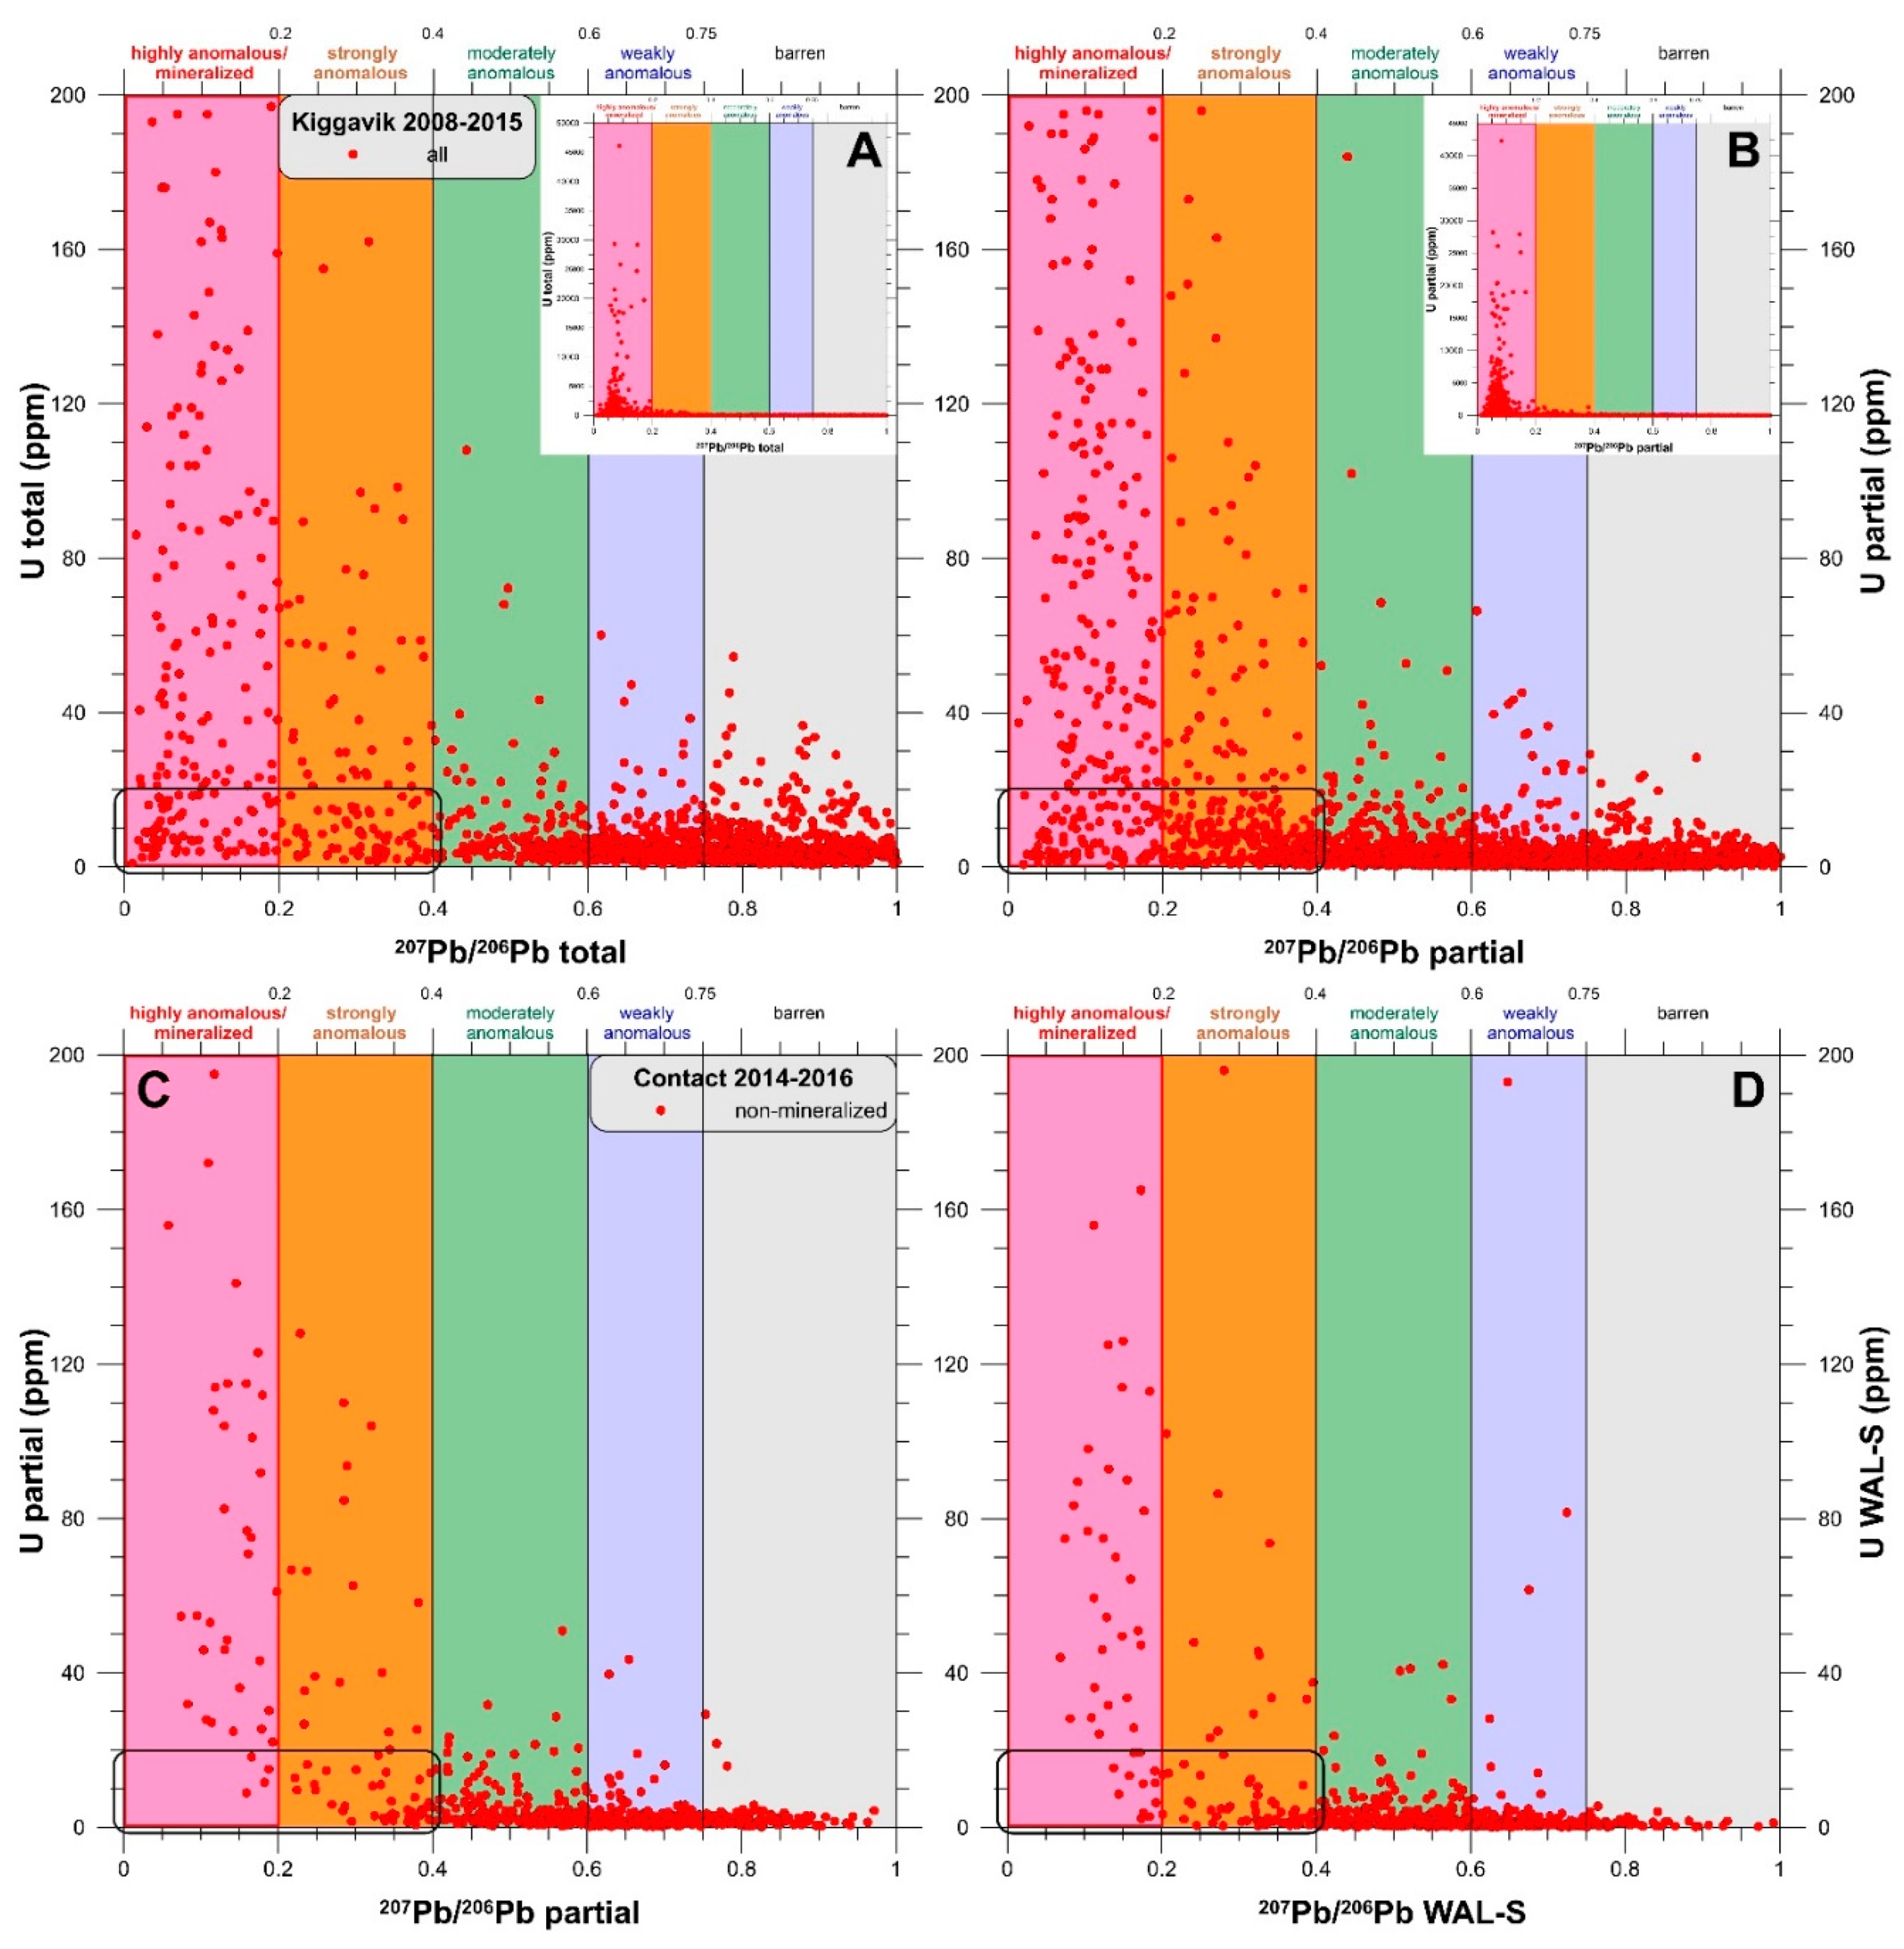
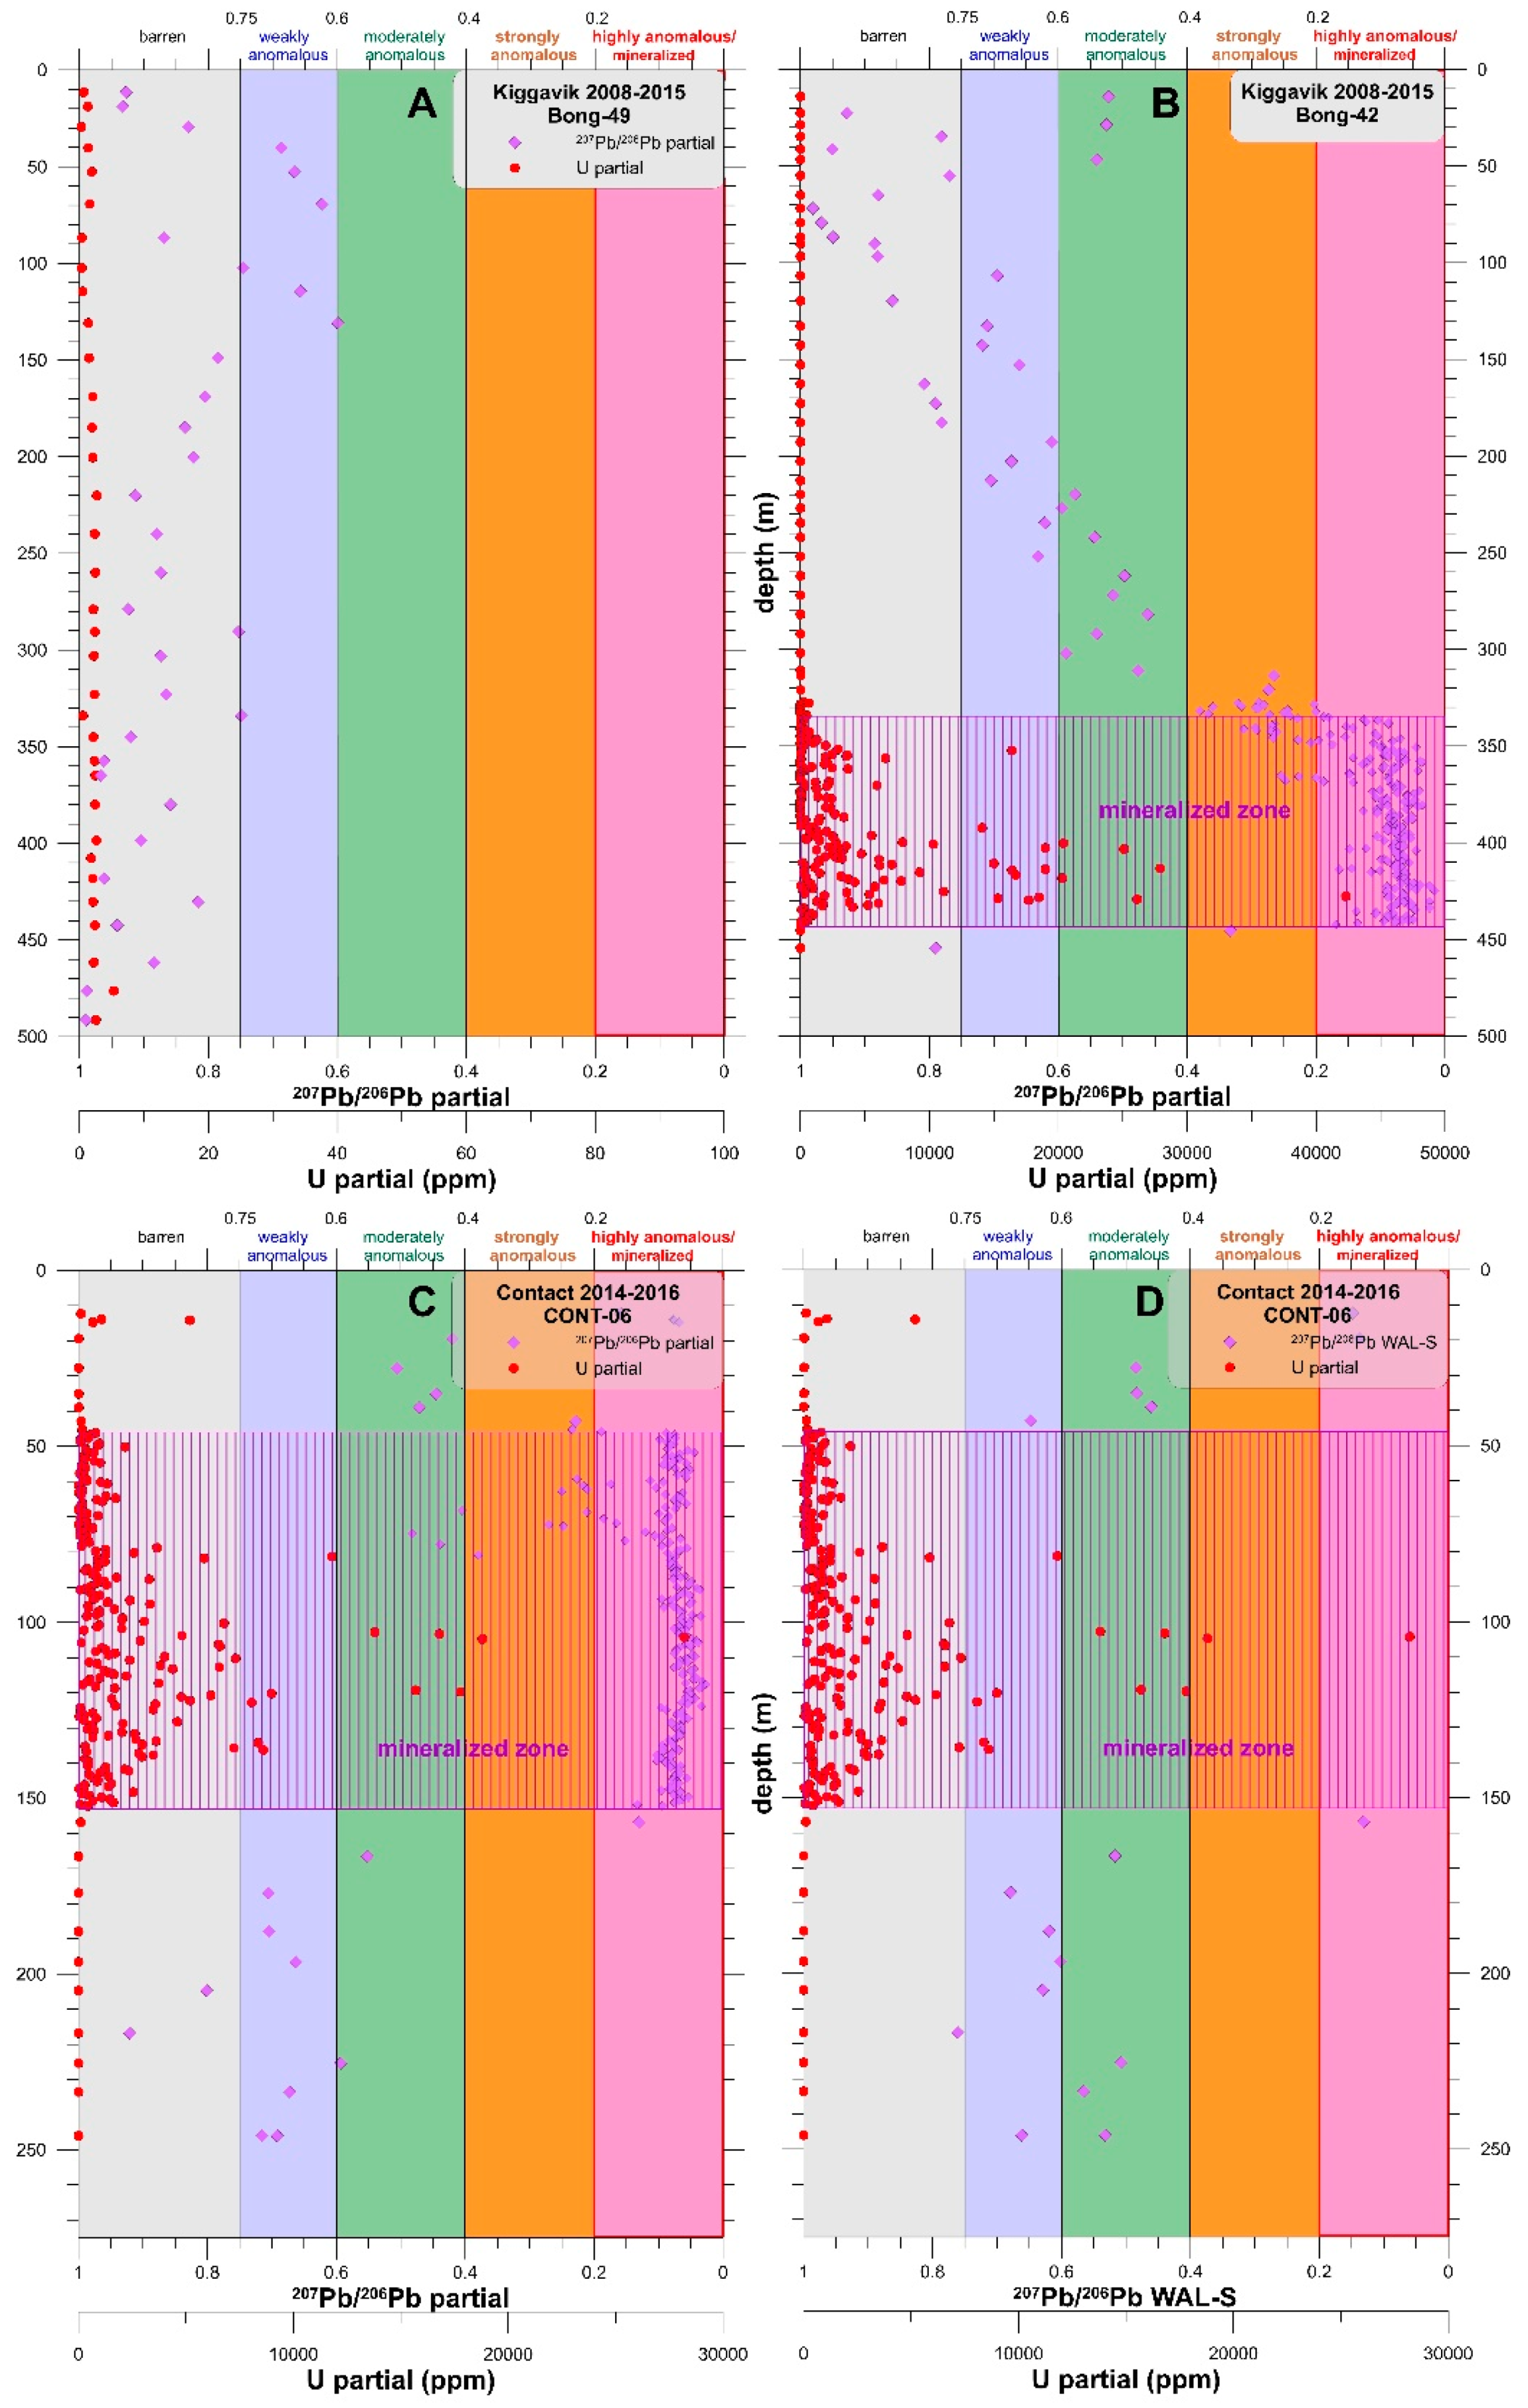
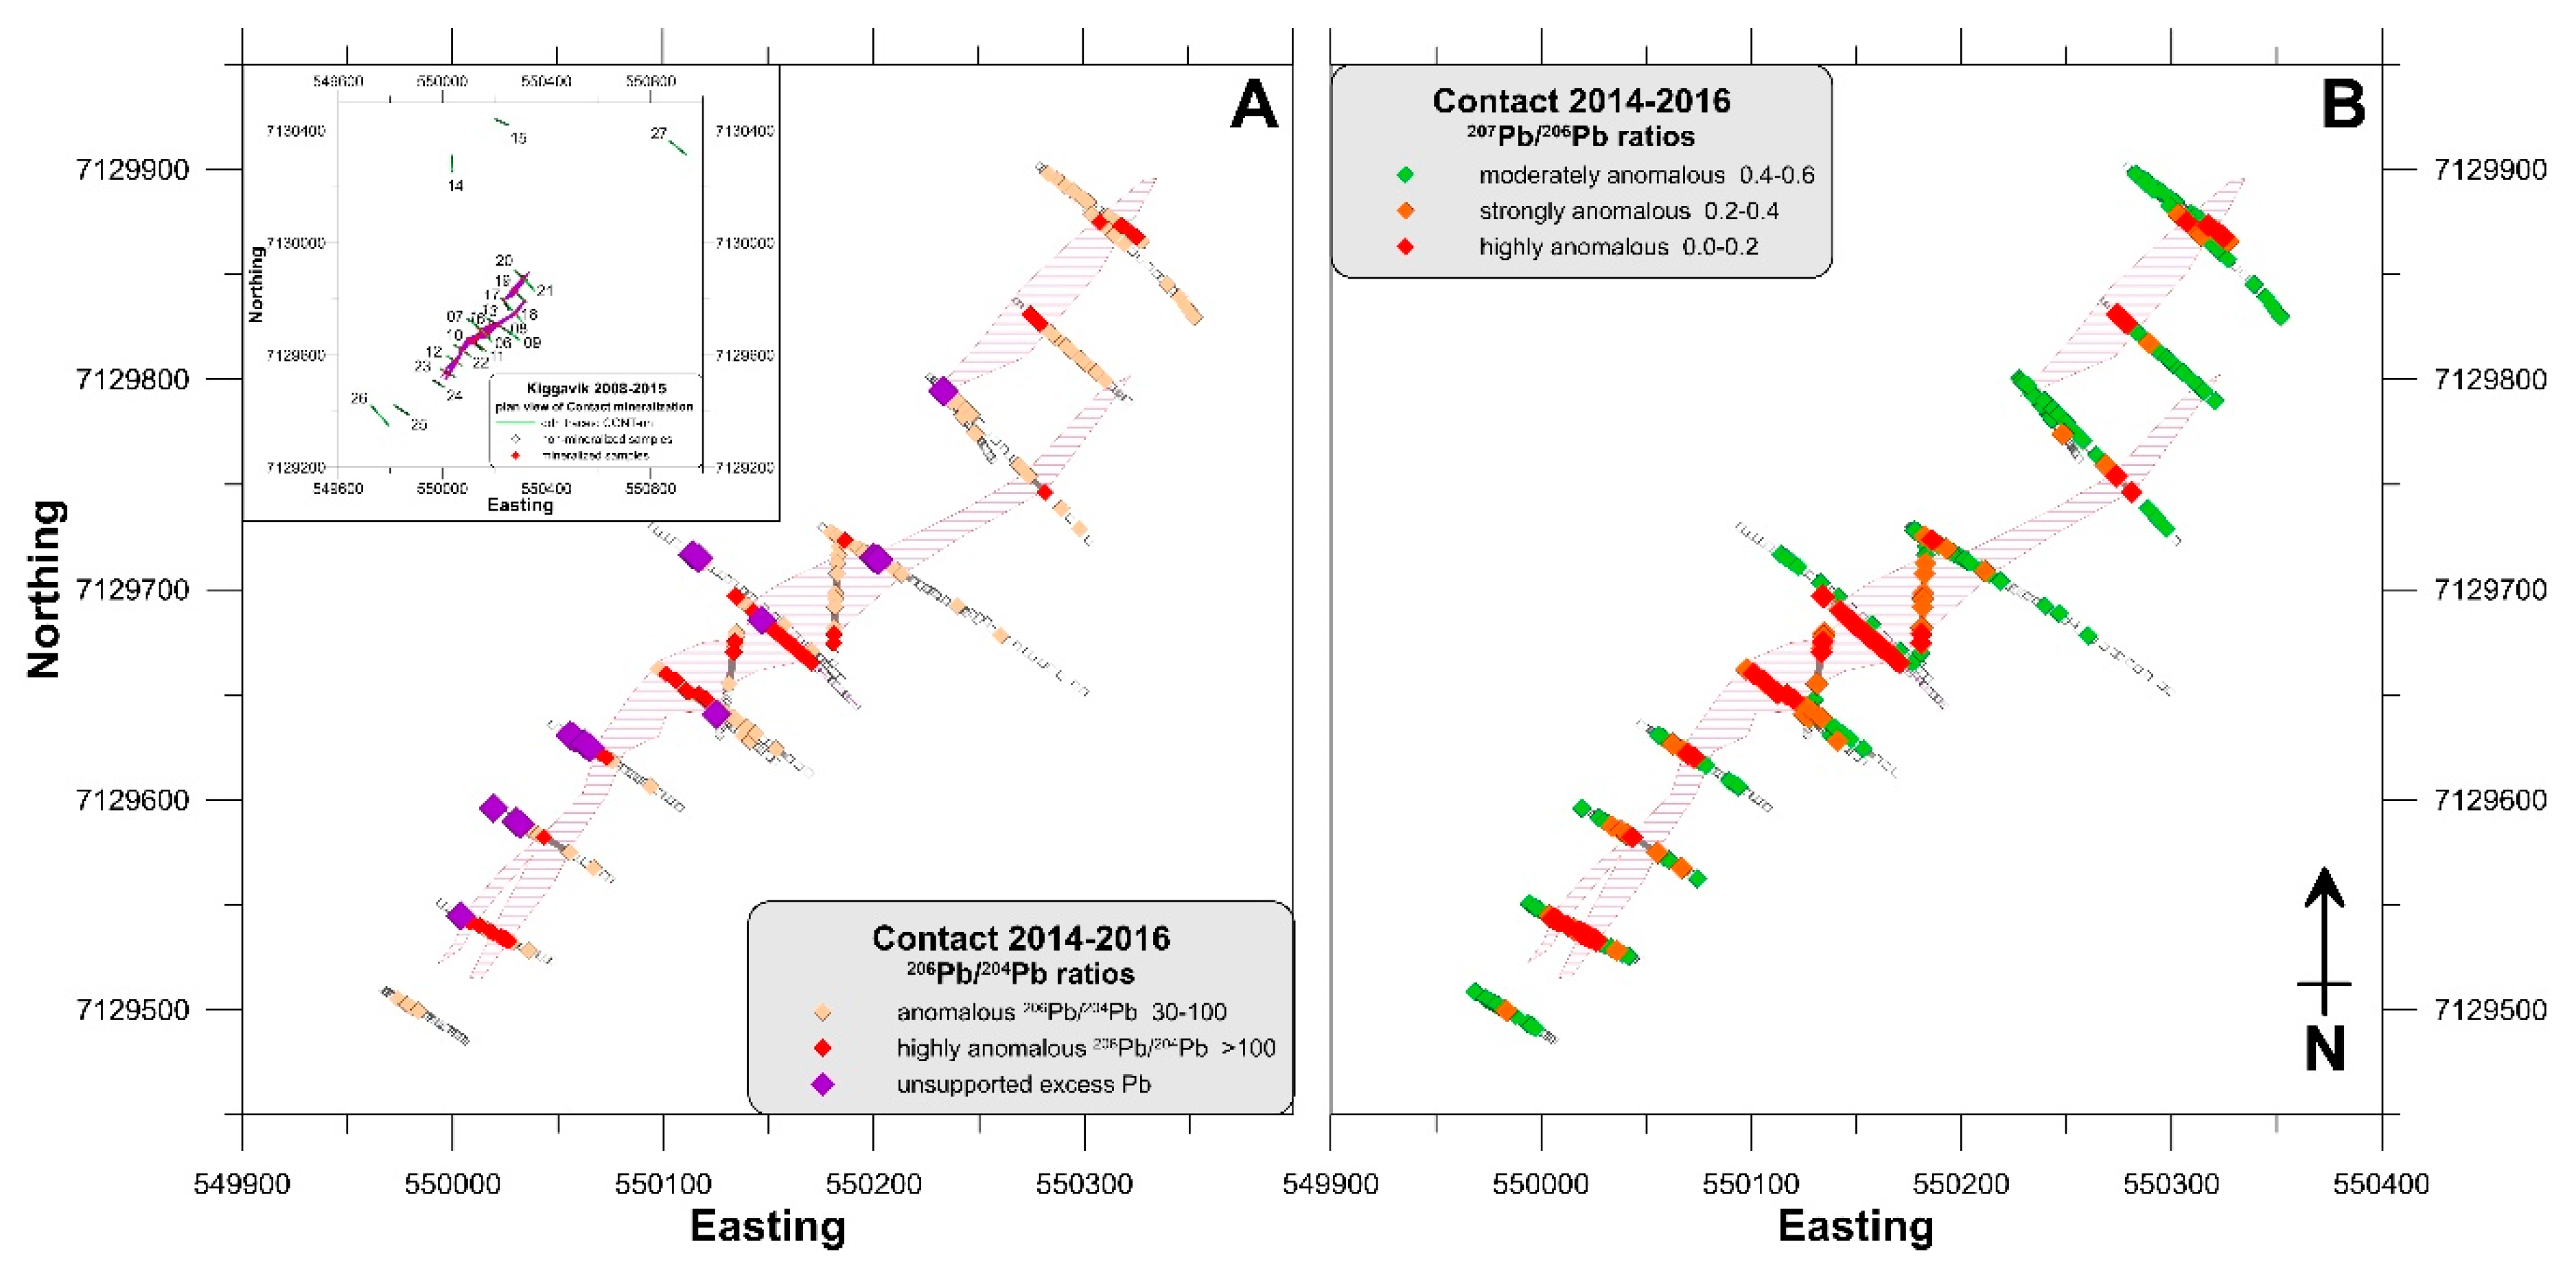
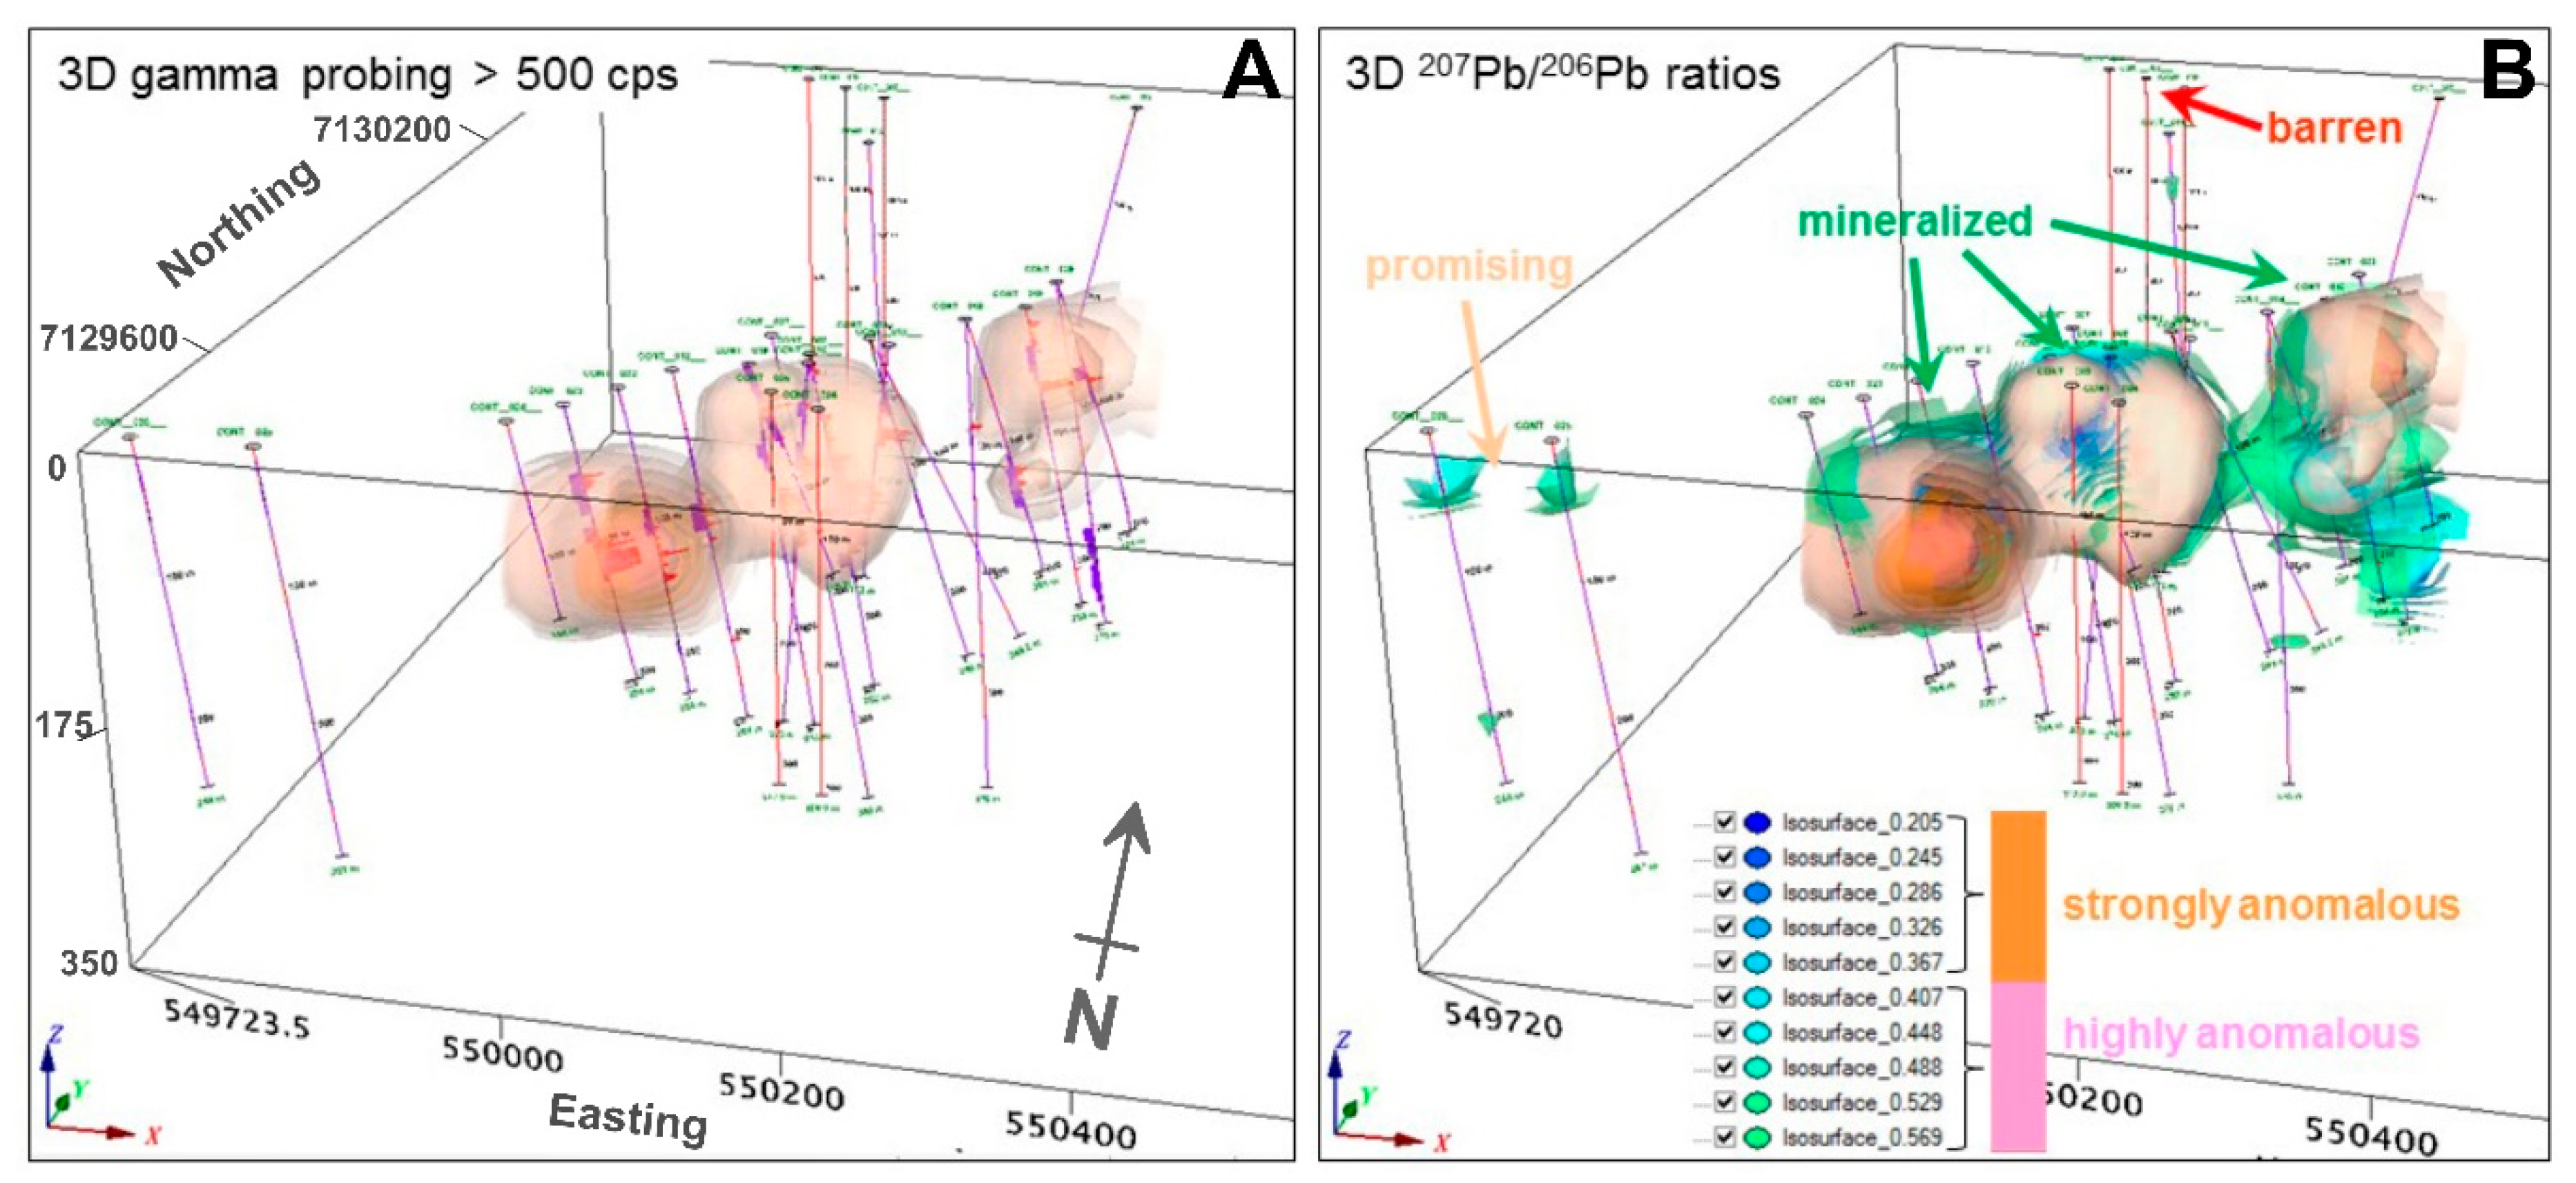
Table 1.
Univariate statistical information on the Pb-isotope data obtained from various digestions and leaches. Abbreviations “-t” and “-p” refer to TAD and PAD, respectively. See text for descriptions of the WAL-S and WAL-Q leaches.
Table 1.
Univariate statistical information on the Pb-isotope data obtained from various digestions and leaches. Abbreviations “-t” and “-p” refer to TAD and PAD, respectively. See text for descriptions of the WAL-S and WAL-Q leaches.
| Statistic | 204Pb-t | 206Pb-t | 207Pb-t | 208Pb-t | 204Pb-p | 206Pb-p | 207Pb-p | 208Pb-p |
|---|---|---|---|---|---|---|---|---|
| Geometric Mean | 0.122 | 4.434 | 2.185 | 4.972 | 0.040 | 1.661 | 0.762 | 1.751 |
| Median | 0.105 | 3.000 | 1.815 | 4.220 | 0.032 | 1.080 | 0.590 | 1.410 |
| Mode | 0.064 | 2.020 | 1.010 | 2.600 | 0.014 | 1.200 | 1.040 | 1.140 |
| Minimum | 0.004 | 0.347 | 0.026 | 0.114 | 0.002 | 0.097 | 0.046 | 0.154 |
| Maximum | 12 | 1890 | 282 | 464 | 11.2 | 1870 | 270 | 456 |
| Count | 2208 | 2208 | 2208 | 2208 | 2207 | 2207 | 2207 | 2207 |
| Confidence Level on mean (95.0%) | 0.0051 | 0.2417 | 0.0913 | 0.1913 | 0.0021 | 0.1065 | 0.0401 | 0.0834 |
| Statistic | 204Pb-WAL-S | 206Pb-WAL-S | 207Pb-WAL-S | 208Pb-WAL-S | 204Pb-WAL-Q | 206Pb-WAL-Q | 207Pb-WAL-Q | 208Pb-WAL-Q |
| Geometric Mean | 0.010 | 0.335 | 0.162 | 0.452 | 0.009 | 0.306 | 0.147 | 0.408 |
| Median | 0.009 | 0.308 | 0.153 | 0.436 | 0.009 | 0.272 | 0.134 | 0.378 |
| Mode | 0.004 | 0.140 | 0.062 | 0.182 | 0.004 | 0.209 | 0.063 | 1.100 |
| Minimum | 0.001 | 0.022 | 0.010 | 0.024 | 0.001 | 0.008 | 0.004 | 0.014 |
| Maximum | 0.344 | 111 | 11.5 | 17 | 0.322 | 126 | 12.6 | 15.5 |
| Count | 607 | 607 | 607 | 607 | 607 | 607 | 607 | 607 |
| Confidence Level on mean (95.0%) | 0.0009 | 0.0309 | 0.0139 | 0.0387 | 0.0008 | 0.0293 | 0.0129 | 0.0355 |
© 2020 by the authors. Licensee MDPI, Basel, Switzerland. This article is an open access article distributed under the terms and conditions of the Creative Commons Attribution (CC BY) license (http://creativecommons.org/licenses/by/4.0/).
Share and Cite
MDPI and ACS Style
Quirt, D.; Benedicto, A. Lead Isotopes in Exploration for Basement-Hosted Structurally Controlled Unconformity-Related Uranium Deposits: Kiggavik Project (Nunavut, Canada). Minerals 2020, 10, 512. https://doi.org/10.3390/min10060512
AMA Style
Quirt D, Benedicto A. Lead Isotopes in Exploration for Basement-Hosted Structurally Controlled Unconformity-Related Uranium Deposits: Kiggavik Project (Nunavut, Canada). Minerals. 2020; 10(6):512. https://doi.org/10.3390/min10060512
Chicago/Turabian StyleQuirt, David, and Antonio Benedicto. 2020. "Lead Isotopes in Exploration for Basement-Hosted Structurally Controlled Unconformity-Related Uranium Deposits: Kiggavik Project (Nunavut, Canada)" Minerals 10, no. 6: 512. https://doi.org/10.3390/min10060512
Note that from the first issue of 2016, this journal uses article numbers instead of page numbers. See further details here.