Article

Spatial-Temporal Pattern of Black Carbon (BC) Emission from Biomass Burning and Anthropogenic Sources in New South Wales and the Greater Metropolitan Region of Sydney, Australia

1
Department of Planning, Industry and Environment (DPIE), Lidcombe, NSW 2141, Australia
2
Department of Environmental Science, Macquarie University, Sydney, NSW 2109, Australia
*
Author to whom correspondence should be addressed.
Atmosphere 2020, 11(6), 570; https://doi.org/10.3390/atmos11060570
Submission received: 27 April 2020 / Revised: 23 May 2020 / Accepted: 27 May 2020 / Published: 31 May 2020
(This article belongs to the Special Issue 10th Anniversary of Atmosphere: Air Quality)

Abstract

:
Biomass burnings either due to Hazards Reduction Burnings (HRBs) in late autumn and early winter or bushfires during summer periods in various part of the world (e.g., CA, USA or New South Wales, Australia) emit large amount of gaseous pollutants and aerosols. The emissions, under favourable meteorological conditions, can cause elevated atmospheric particulate concentrations in metropolitan areas and beyond. One of the pollutants of concern is black carbon (BC), which is a component of aerosol particles. BC is harmful to health and acts as a radiative forcing agent in increasing the global warming due to its light absorption properties. Remote sensing data from satellites have becoming increasingly available for research, and these provide rich datasets available on global and local scale as well as in situ aethalometer measurements allow researchers to study the emission and dispersion pattern of BC from anthropogenic and natural sources. The Department of Planning, Industry and Environment (DPIE) in New South Wales (NSW) has installed recently from 2014 to 2019 a total of nine aethalometers to measure BC in its state-wide air quality network to determine the source contribution of BC and PM2.5 (particulate Matter less than 2.5 μm in diameter) in ambient air from biomass burning and anthropogenic combustion sources. This study analysed the characteristics of spatial and temporal patterns of black carbon (BC) in New South Wales and in the Greater Metropolitan Region (GMR) of Sydney, Australia, by using these data sources as well as the trajectory HYSPLIT (Hybrid Single Particle Lagrangian Integrated Trajectory) modelling tool to determine the source of high BC concentration detected at these sites. The emission characteristics of BC in relation to PM2.5 is dependent on the emission source and is analysed using regression analysis of BC with PM2.5 time series at the receptor site for winter and summer periods. The results show that, during the winter, correlation between BC and PM2.5 is found at nearly all sites while little or no correlation is detected during the summer period. Traffic vehicle emission is the main BC emission source identified in the urban areas but was less so in the regional sites where biomass burnings/wood heating is the dominant source in winter. The BC diurnal patterns at all sites were strongly influenced by meteorology.

1. Introduction

Bushfires are a high-risk feature of the Australian landscape, impacting communities through loss of property, infrastructure and environmental damage. These can often result in injury and death to wildlife and people, with prominent recent examples including the Black Saturday in Victoria (February 2009), Blue Mountains in New South Wales (October 2013) and the widespread 2019–2020 bushfires across the east coast of Australia (September 2019–February 2020). To mitigate these risks, hazard reduction burns are performed during favourable weather conditions in cooler months, in order to decrease available wood fuel load during the warmer months. Consequently, smoke from both hazard reductions and wildfires creates health hazards for communities exposed to smoke, particularly to individuals with predisposed conditions such as cardiovascular, respiratory, physiological and asthma, which is evident by the increase in emergency dispatches and hospitalisations during bushfire events resulting in high smoke concentrations [1,2].
Black carbon (BC), a marker for combustion sources, is one of the largest contributors to PM2.5. BC is a carbonaceous aerosol by-product which arises from the incomplete combustion of fossil fuels or biomass burning, or through pyrolysis [3]. BC is therefore associated with various organic substances produced from combustion. As BC absorbs light and radiates back to the atmosphere, it is also found to be the second most important contributor to climate change after carbon dioxide [4]. BC emitted from combustion sources into the atmosphere plays an important role in changing the Planetary Boundary Layer (PBL) as it induces heating by radiation absorption in the upper PBL and reduces incoming radiation to ground. BC hence reduces surface heat flux and depresses the development of the PBL, as Ding et al. (2016) [5] showed in their simulation study using the Weather Research Forecasting meteorological and air chemistry model (WRF-Chem). As a consequence of this depression of the PBL, higher pollutant including BC concentrations occur in the PBL. Ding et al. (2016) [5] coined this phenomenon as the “dome effect”. In addition to this positive feedback mechanism, Liu et al. (2018) [6] recently described another new positive feedback mechanism involving aerosols, PBL, Relative Humidity (RH) and secondary aerosols from their field experiment and model simulation study. Increasing level of PM (Particulate Matter) in the atmosphere decreases the PBL height. This decrease of PBL height results in an increase of RH by weakening the vertical transport of water vapor, which in turn increases the formation of secondary PM through heterogenous aqueous reactions and hence further enhances the overall PM concentration, weakens incoming solar radiation and decreases PB height.
The main sources of BC include vehicle emission, wood heating and biomass burning, including prescribed burns and bushfires [7]. Cope et al. (2008) [8] showed a strong relationship between the outdoor BC concentration in Baltimore with the number of vehicles counted in the neighbourhood. Differentiation between BC sources, such as vehicle emission, biomass burning for heating or bushfire, can be problematic due to the variance in BC origin [9]. Black carbon (BC) is defined operationally as carbon measured by light absorption method and differentiated from elemental carbon (EC), which is usually measured using thermal-optical methods [10].
Exposure to PM2.5 and BC has detrimental health outcomes with elevated morbidity and mortality, especially in high risk groups such as those with cardio-respiratory disease [7,11]. Presently, adverse health impact of BC is inconclusive, however increases in hospital admissions and emergency dispatches during high smoke periods is evident [1,10]. The WHO [10], in a summary report on the short-term health effects of BC, suggested that BC measurements are better a indicator of harmful particulate emission from combustion sources (especially traffic) than those undifferentiated PM2.5 or PM10 measurements. However, evidence of differences between long-term health impact of BC and total PM was inconclusive [10]. More recently, Hvidtfeldt et al. (2019) [12], in their study of long-term residential exposure to PM2.5, BC and others pollutants and mortality in a Danish cohort, found, for PM2.5 and cardio-vascular disease (CVD) mortality, a hazard ratio (HR) or relative risk of 1.29 (95% CI: 1.13–1.47) per 5 μg/m3 while, for BC, a HR of 1.16 (95% CI: 1.05–1.27) per 1 μg/m3. This result shows higher risk of BC on CVD mortality as compared to that of PM2.5. Segersson et al. (2017) [13] used higher relative risk factor for BC compared to PM2.5 in their study of health impact of PM10, PM2.5 and BC from different source sectors in three cities in Sweden.
The ambient exposure to BC is difficult to measure due to the spatial and temporal fluctuations in emissions, climatic conditions, seasonality, chemical transformation and depositional processes [7]. In Australia, BC maxima, under ordinary condition, occur during winter, the main sources being wood fire heating and hazard reductions, while spikes in BC concentration during summer result from episodic bushfires [14]. Fire behaviour and intensity along with climatic conditions are determinants in the spatial and temporal distribution of BC in Sydney. Investigating relationships between BC and bushfire activity using historical bushfire records and aethalometer records is the first step in quantifying the contribution of bushfire activity to elevated PM2.5.
The defining physical and chemical properties of BC include microstructure, morphology, thermal stability, solubility and light absorption [3]. Resistance to chemical transformation results in BC being highly stable with long lifetime in the atmosphere [3]. Lou et al. (2018) [15] showed that BC amplifies haze over the North China Plain by weakening the East Asian winter monsoon through its influence on the dynamics of the PBL height and hence affect air pollutant dispersion leading to haze episodes. At present, there is no exceedance goal for BC concentration in air quality monitoring. Other criteria pollutants, such as ozone, NO2, CO, SO2, PM2.5 and PM10, have hourly, daily or annual exceedance goals that should not be exceeded in a number of times each year.
Di Ianni et al. (2018) [16] used aerosol light absorption columnar data (AERONET) to derive ground-level BC data for their long-term trend analysis of BC at a site in Rome. The MERRA-2 (Modern-Era Retrospective Analysis for Research and Applications, Version 2) is the most recent satellite reanalysis system developed by NASA [17,18]. An improvement from MERRA to MERRA-2 is the ability to perform aerosol analysis including BC [19]. MERRA-2 uses data assimilation to analyse aerosol optical depth (AOD) from sources such as Moderate Resolution Imaging Spectroradiometer (MODIS), Advanced Very High Resolution Radiometer (AVHRR), Multiangle Imaging Spectro Radiometer (MISR) and Aerosol Robotics Network (AERONET) [19,20]. MODIS measures reflectance from two satellites, Terra and Aqua, to determine AOD from 2002 to present; AVHRR measured oceanic reflectance data from 1979 to 2002; MISR AOD data are available for bright, desert regions for the period 2000 to 2014; and AOD ground based measurements are available from AERONET [19]. MERRA-2 was used to produce simulation of aerosol optical properties for the 2013 Californian wildfires and successfully reproduced the smoke plume [20]. Representation of aerosol optical properties was improved further from the fire source with high level of backscatter which reduced away from the source and agreed with aircraft observations [20]. The agreement between observations and reanalysis demonstrates the potential for MERRA-2 to be used in forecasting of aerosol dispersion such as BC during bushfire events.
The Greater Metropolitan Region of Sydney (GMR) comprises three main urban centres: the Lower Hunter in the north, Sydney in the centre and the Illawarra in the south. The main anthropogenic combustion sources are motor vehicles, power stations, ships, other non-road mobile sources (locomotives, industrial or mining vehicles and aircraft) and wood heating during winter. Motor vehicles are a larger contributor to total BC in the GMR compared to regional areas of the state. Many authors identified the major source of BC in urban area as from motor vehicle, especially diesel vehicles, e.g. Feng et al. (2014) [21] identified traffic emission as the main source of BC in urban Shanghai. The urban sites of Liverpool (Sydney south west), Chullora (central Sydney), Beresfield, Newcastle, Carrington in the Lower Hunter and Wollongong in the Illawarra are in the Greater Metropolitan Region of Sydney (GMR). Of these sites, BC concentration at Liverpool and Chullora are most affected by traffic sources due to the urban build up with major artery roads and high population density.
The objective of this study was to investigate the relationship between combustion sources (such as wood heating, hazard reductions, bush fires and combustion-engine vehicles) and BC concentrations as measured by aethalometers in the Sydney GMR and at other regional areas and to determine the BC distribution pattern in New South Wales (NSW) and the locations of combustion sources from BC monitoring data. The relationship was assessed using BC/PM2.5 ratio or correlation analysis based on monitoring data. As monitoring data are provided in a limited number of sites, the spatiotemporal pattern of BC due to combustion sources in the Greater Metropolitan Region (GMR) of Sydney and long-range sources in New South Wales (NSW) was also estimated using MERRA-2 data assimilation product derived from satellite observation.
We considered three periods when HRBs occurred: May 2015, May 2016 and May 2018. Each of these periods shows the influence of different combustion sources locally and remotely on BC concentration at the receptor points. There were biomass burnings in the agricultural areas of Riverina in the southwest of NSW, wood smoke from domestic wood-fired heaters in NSW on cool-cold evenings, and HRBs sites west of Sydney during these periods. These sources, in addition to urban traffic sources and wood smoke from domestic heating, are the main sources of BC emission. In some regional areas of NSW, such as the Riverina and Armidale, BC from combustion vehicle source is less significant than biomass burning sources from agricultural burnings and wood heating during winter. Newcastle and the Lower Hunter area are key industrial locations for coal mining and export, which are sources of fugitive BC emission. According to the 2008 Greater Metropolitan air emission inventory, coal mining accounted for 14.9% of human made PM2.5 sources (EPA 2012). PM2.5 and black carbon measurements at the monitoring station of Beresfield for the May 2016 period were used for analysis of PM2.5 and BC emission from HRBs during this time. For 8 and 9 May 2018, when large planned biomass burning occurred in the Blue Mountains directly west of Sydney, BC monitoring data from a number of urban stations were used for backward trajectory analysis. The consideration of remote sources, HRBs and local traffic sources is important to understand the relationship between BC and PM2.5 as measured at monitoring sites in the Department of Planning, Industry and Environment (DPIE) air quality monitoring network.

2. Materials and Method

2.1. Measurement Techniques

The BC concentrations analysed in this study were from two sources: The NASA Modern-Era Retrospective Analysis for Research and Applications, Version 2 (MERRA-2) reanalysis [19] and the aethalometer measurements within NSW DPIE air quality monitoring network. Satellite data products from MODIS Aqua/Terra and Lidar data from CALIOP (Cloud-Aerosol Lidar with Orthogonal Polarization) instrument on CALIPSO (Cloud-Aerosol Lidar and Infrared Pathfinder Satellite Observation) satellite were also used to detect the hot spots of biomass burnings as sources of BC emission and smoke plumes.

NSW DPIE Aethalometer Measurements

PM2.5 and BC measurements are provided from the DPIE ambient air quality monitoring network. BC was measured by aethalometer as part of the air quality measurements in the NSW Department of Planning, Industry and Environment (DPIE) Air Quality Monitoring Network (AQMN) in 2013 while PM2.5 was measured using a Beta Attenuation Monitor (BAM). BAM is an USEPA Federal Equivalent Method instrument used for continuous monitoring of ambient PM2.5. Air is drawn through a cyclonic inlet and PM2.5 particles are deposited on a glass fibre filter tape. High energy beta radiation (electron or positron) is then passed through the accumulated particles spot on the filter tape and the radiation absorbed is measured. The loss of beta radiation (beta attenuation) is proportional to the mass of deposited particles on the filter spot. The mass concentration is then calculated from the beta attenuation and the sampled air volume rate. The tape is then advanced to provide a clean surface on the filter tape for the next particles sample. BAM instrument, Thermo Scientific BAM5014, from Thermo Fisher is used at monitoring sites (except Armidale which uses FDMS-TEOM) in the NSW DPIE AQMN. In 2019, there were six air quality monitoring stations (Beresfield, Newcastle, Liverpool, Richmond, Chullora and Wollongong) and Carrington site operating for a short time during winter 2019 in the Sydney, Lower Hunter and Illawarra region and two stations (Armidale and Wagga Wagga North) in regional NSW with aethalometers installed. The locations and details of the stations equipped with aethalometers are shown in Figure 1 and Table 1.
The aethalometers were chosen to be installed at those sites where sources of emissions are known to influence the BC concentration such as high traffic influence, industrial sources or biomass burning. Wagga Wagga North is in the Riverina region where rice stubble burning mostly occurs in late austral autumn and early winter before the rice planting spring season. Armidale, in the New England Tableland, is in in a valley at high elevation, which is marked by relatively cool to cold evening temperatures. Smoke from wood heating, coupled with minimal air movement from wind, can lead to elevated particle concentrations during the evening and early morning. Aethalometers are located in the Lower Hunter region (Beresfield, Newcastle and Carrington) where power stations are close by and local traffic is also considered to be a dominate source. Locations of the aethalometers in Sydney (Richmond, Chullora and Liverpool) and the Illawarra region (Wollongong) are close to local traffic sources with low traffic Richmond site in a low elevation (< 20 m) inland in the basin, surrounded by mountains, bushland and much cooler overnight temperatures than the rest of the GMR. This makes Richmond a slightly different case and it is very close to some of the HRBs.
The type of aethalometer used in this study is the seven-channel aethalometer model AE33 from Magee Scientific. It is used continuously to measure hourly black carbon (BC) concentrations in µg/m3. This model of aethalometer continuously collects aerosol particles on a filter tape from a sample air flow at the rate of 5 L/min [22]. The AE33 model collects two aerosol samples simultaneously with differing accumulation rates, which are combined to eliminate nonlinearity. Light transmission at wavelengths of 370, 470, 520, 590, 660, 880 and 950 nm passes through the filter tape, recording changes in light attenuation at the sample spots and an unloaded portion of the tape. The rate of change in light attenuation and optical properties in the sample spot is then inferred. BC concentration is calculated from optical attenuation changes at the near-infrared 880 nm wavelength with the corresponding mass absorption cross-section of 7.77 m2/g [22]. The light attenuation is expressed as an absorption coefficient which is dependent on the wavelength λ as λ−α (α is the Ångstrom exponent). The division of the aerosol light absorption coefficient by the aerosol light absorption cross-section gives the BC concentration.
Difference in BC measurements on different AE33 aethalometer channels can be used to understand the relative contribution of sources of BC at a site. Sandradewi et al. (2008) [23] used channel 7 at 950-nm wavelength and channel 2 (470 nm) in an AE31 aethalometer, corresponding to the light absorption exponents of 1.1 for traffic and 1.8–1.9 for wood burning, to infer the contributions of each source in particulate matter measurements taken in a Swiss Alpine village during a prolonged atmospheric inversion. The aethalometer AE33 implemented source apportionment of traffic and biomass burning emissions to BC measurement based on Sandradewi et al. (2008) model. This aethalometer model was used [24,25,26] to determine the contribution of BC from fossil fuel and from biomass burning to the total BC in Toronto, Los Angeles basin and Finland. The aethalometer model assumes that BC comes from two emission sources (fossil fuel and biomass burnings) and that absorptions near-UV (470 nm) and near-IR (950 nm) regions are considered to be indicative of BC from biomass burning and fossil fuel sources, respectively [27]. The AE33 manual [27] uses the Absorption Ångström Exponent (AAE) in the λ−α spectral dependency of light absorption as αff = 1 for fossil fuel and αbb = 2 for biomass burning. The following equations describe the light absorption of biomass burning and fossil fuel at 470 and 950 nm wavelength
b abs ( 470 nm ) ff b abs ( 950 nm ) ff = ( 470 950 ) ff
b abs ( 470 nm ) bb b abs ( 950 nm ) bb = ( 470 950 ) bb
b abs ( 470 nm ) =   b abs ( 470 nm ) ff +   b abs ( 470 nm ) bb
b abs ( 950 nm ) =   b abs ( 950 nm ) ff +   b abs ( 950 nm ) bb
where babs(λ) is the absorption coefficient at wavelength λ, babs(λ)ff is the fossil fuel fraction of the absorption coefficient and babs(λ)bb is the biomass burning fraction of the absorption coefficient.
The proportion of biomass burning BB(%) is then
BB ( % ) = b abs ( 950 nm ) bb b abs ( 950 nm )
From this model, the BC from fossil fuel and from biomass burnings are derived. The BB (percentage of biomass burning) parameter is part of the output of the seven-channel AE33 aethalometer. The BC from biomass burning is therefore BC × BB and from fossil fuel as BC × (1 − BB).
There are some uncertainties in BC measurements. Uncertainty of ±5% in absorbance data from two channel aethalometers was reported by Wallace 2005 [28]. In their study of BC using seven-channel aethalometer, Mousavi et al. [24] calculated the uncertainty in the BC concentration to be about 29%. Drinovec et al. (2017) [29] recently showed that the parameter value of the filter loading effect—a saturation of the instrumental response due to the accumulation of the sample in the filter matrix—depends on the size of particles and the particles coating materials. The particle coating material is related to the particle age (recent from local pollution or older from long-range transport). These particle characteristics, such as larger size of BC particle core in winter due to wood burning, influence the BC measurement. They also suggest that the filter-loading parameter value can be used as a proxy to determine the particle coating, thus allowing one to differentiate between local/fresh and transported/aged particles. Regarding the uncertainty in using different channels for source apportionment, it is important to consider which source apportionment model to use for this purpose. Different channels such as 370 and 880 nm to estimate the BC woodsmoke concentration have been used [30]. The difference of BC concentration as measured from 370 nm channel and 880 nm channel is an indicator of woodsmoke. However, the reliability of this method of estimating BC woodsmoke concentration has been challenged [31] as the Ångström exponent (α) for woodsmoke from experimental data from different wood combustion source is highly variable. Healy et al. [32] found that BC, due to biomass burning from 2017 wildfires in Canada, is underestimated by using BB% in the aethalometer model and the absorption Ångström exponent is determined to be 1.35 ± 0.09 smaller than the value 2 for biomass burning used in the aethalometer model. In this study, the aethalometer as implemented in AE33 based on Sandradewi et al. (2008) was used. This model has been used by various authors [24,25,26] recently to study the source apportionment of fossil fuel and biomass burning emission to BC concentration.
The measurement technique and method for source apportionment for BC is still evolving. Despite the limitation of BC measurement accuracy and method of apportionment, the seven-channel AE33 used in this study is currently the best available commercial device to determine the BC concentration in the atmosphere.

2.2. Analysis and Modelling

2.2.1. Linear Regression Analysis

Linear regression analysis between BC and PM2.5 measurements for the austral winter and summer periods were conducted to determine the relationship between BC and PM2.5 at all sites where these measurements are available. It was assumed that the regional NSW sites (Armidale and Wagga Wagga) are more influenced by biomass burnings (and occasional dust storm) than traffic or industrial sources, especially during the winter and when agricultural burning activities preceded the planting season. Furthermore, in the coastal sites of the Sydney metropolitan areas, the formation of secondary PM2.5 from biogenic and anthropogenic sources especially during summer, as well as sea salt particles, influence the relationship between BC/PM2.5 when wood heating or biomass burnings (except wild fires) are typically less significant compared to the winter period. The regression analysis allowed us to determine the patterns at these sites.

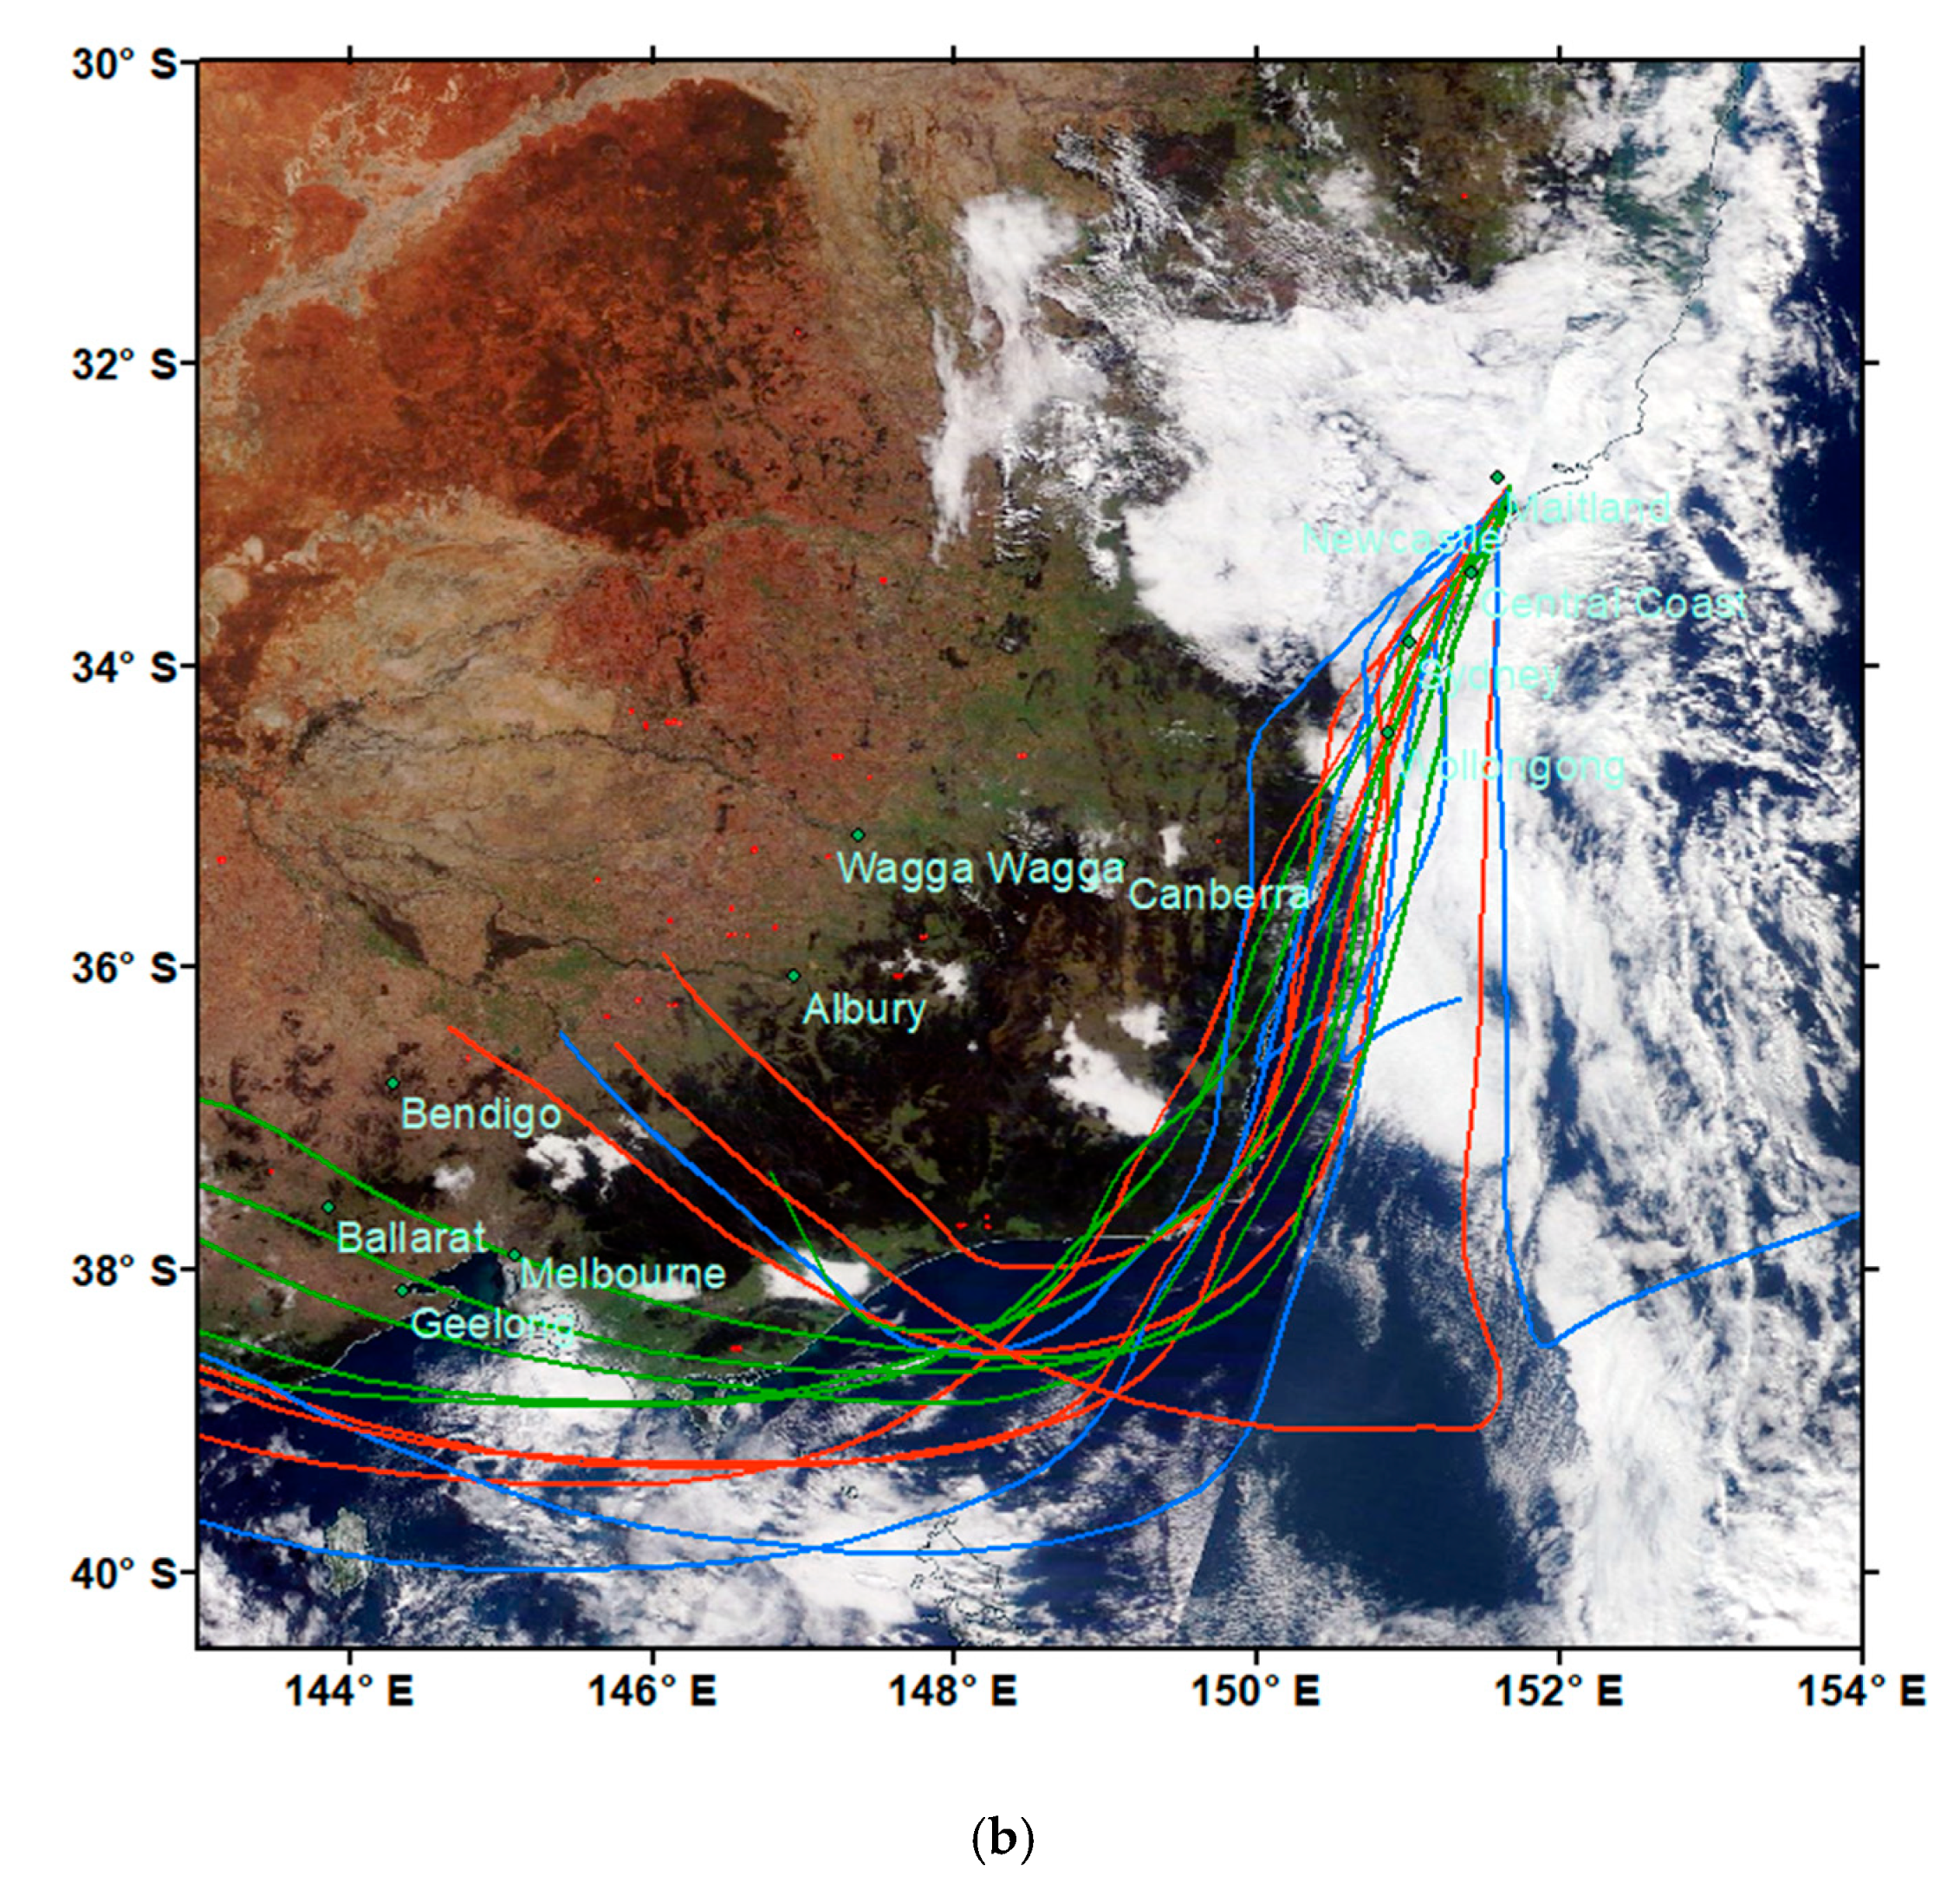
2.2.2. HYSYPLIT Modelling

The Hybrid Single Particle Lagrangian Integrated Trajectory (HYSPLIT) model developed by the Air Resources Laboratory (ARL) in National Oceanographic and Atmospheric Administration (NOAA) [33] is widely used to model and determine the sources air pollution incidences. DeWitt et al. (2019) [34] recently used HYSPLIT to determine the sources of BC in their study of seasonal and diurnal variability of BC, CO and O3 at Rwanda Climate Observatory site. In our study, HYSPLIT was run at with Global Data Assimilation System (GDAS) data at a spatial resolution of 0.25°. The backward trajectories predicted by HYSPLIT having particles released at 10 m for 24 or 48 h were used to determine the location of biomass burning sources that caused high concentration of BC and PM2.5 as measured at the monitoring sites.

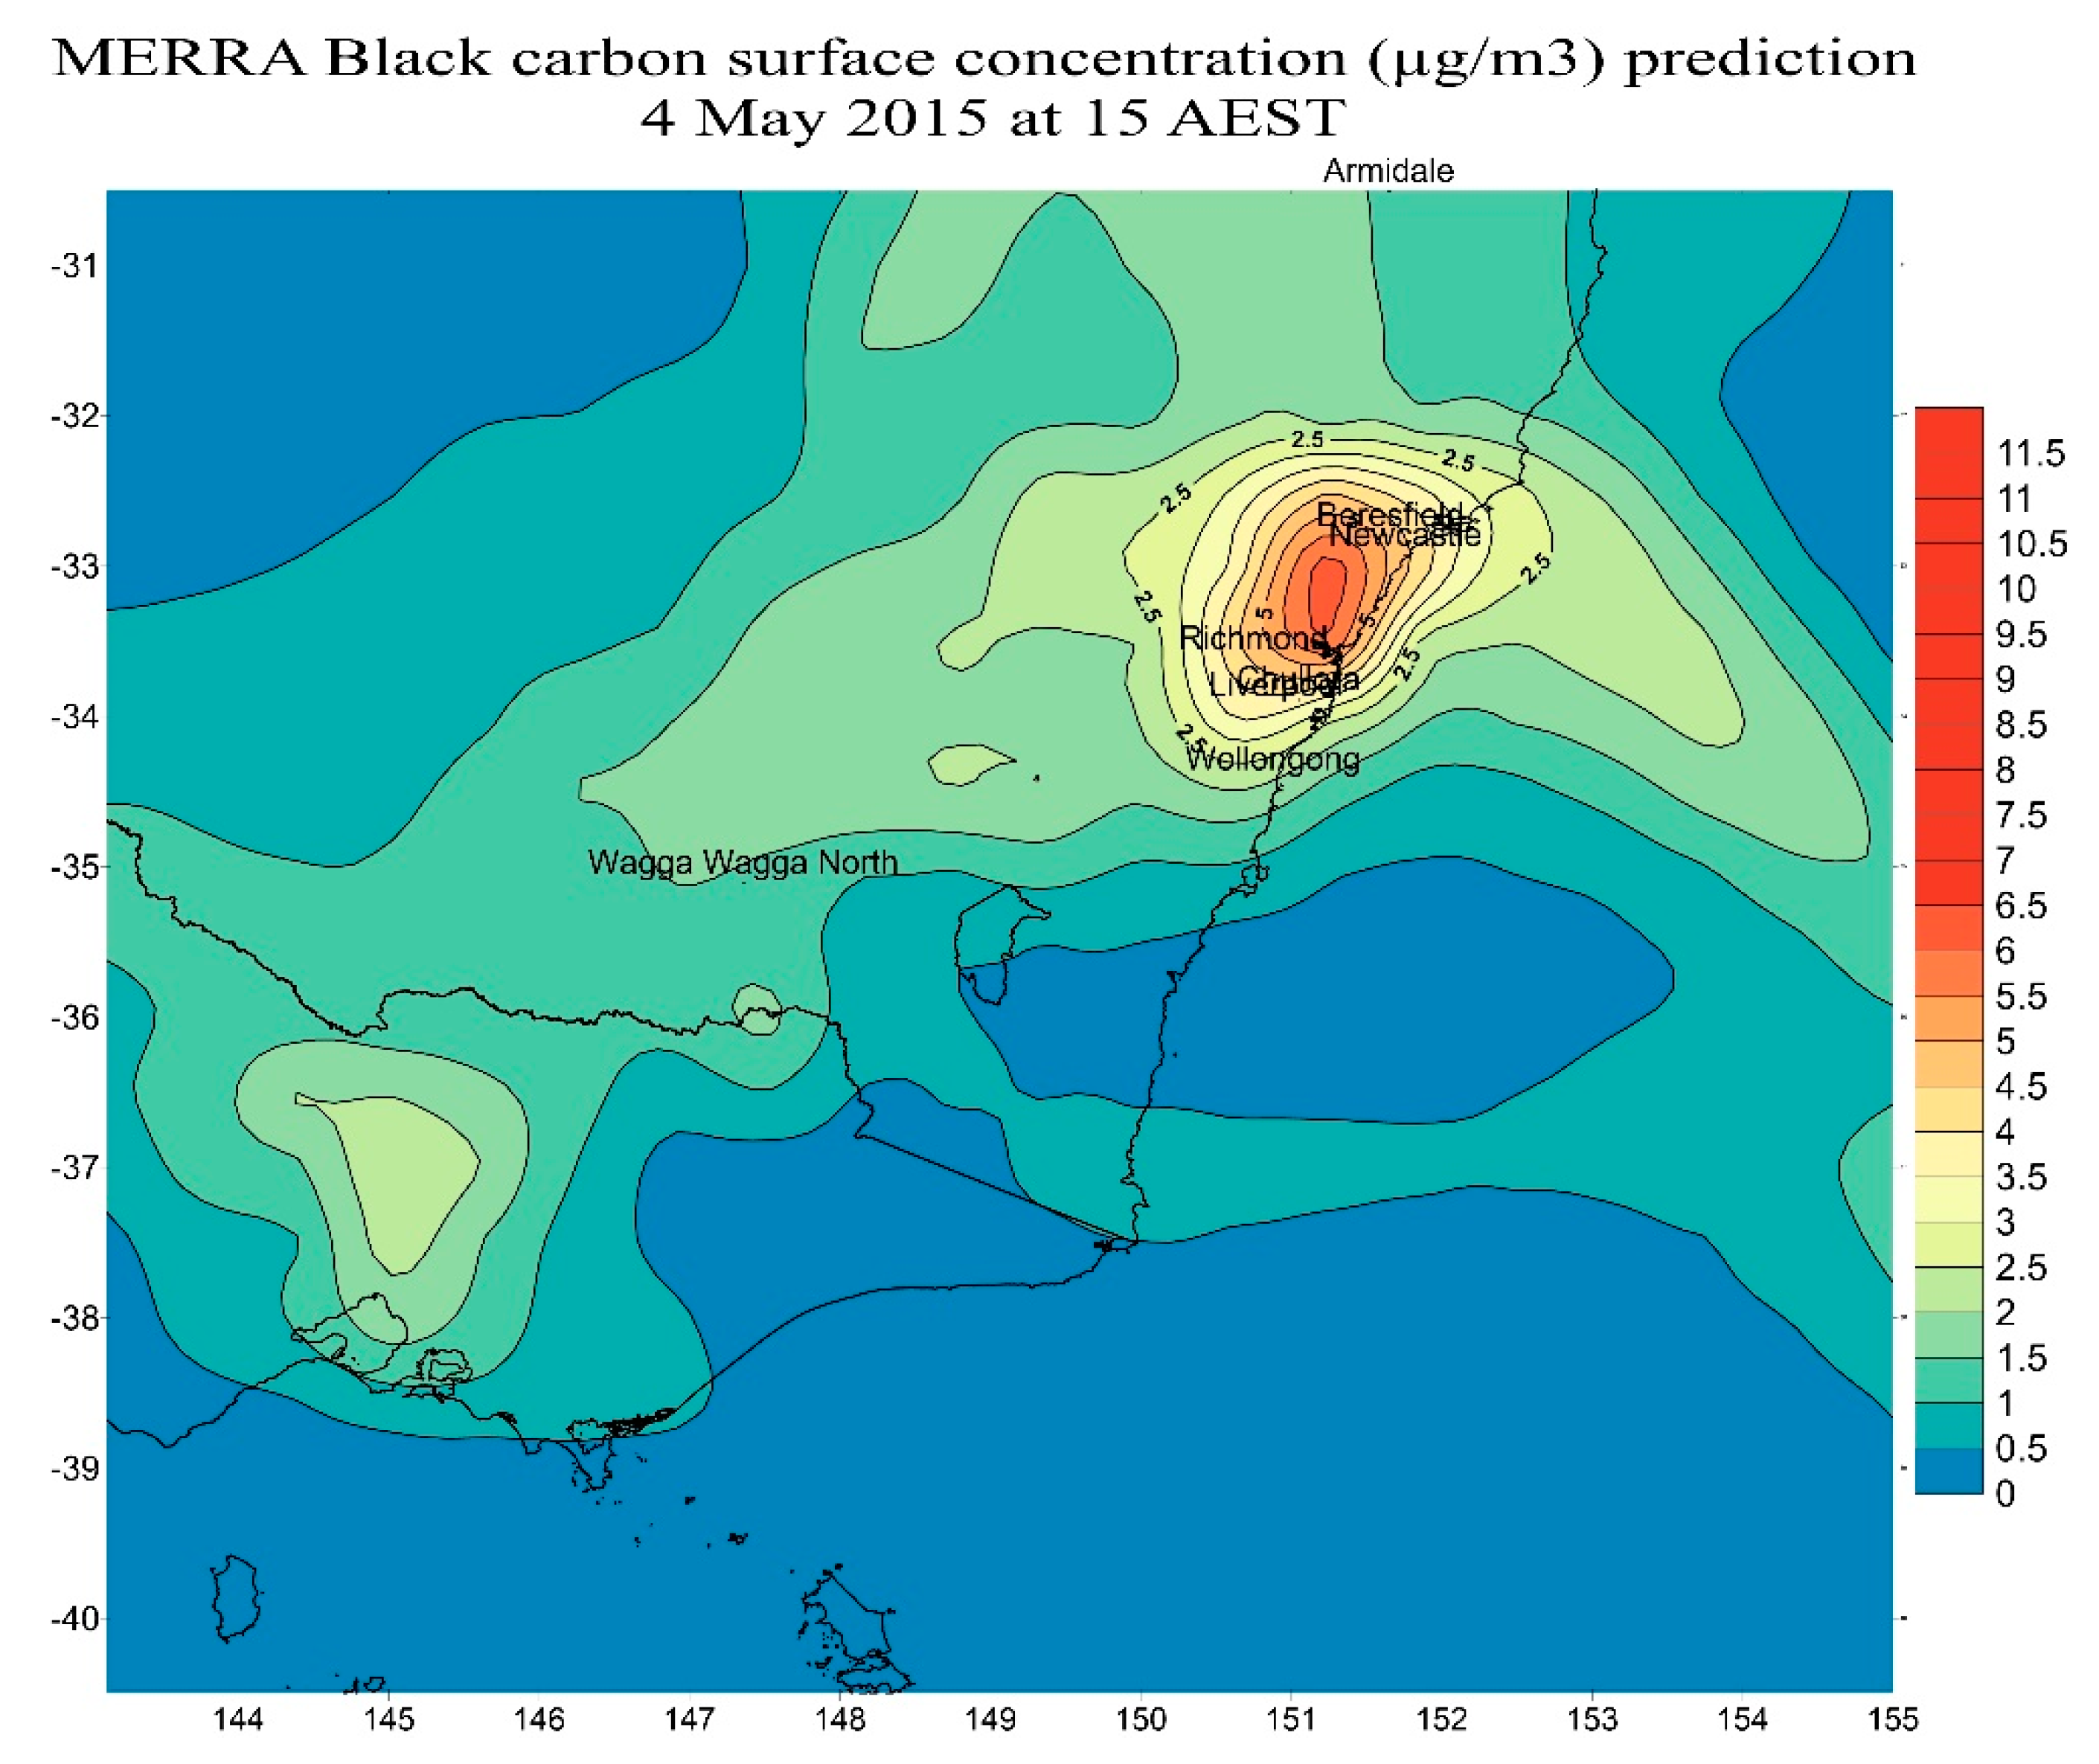
2.2.3. The MERRA-2 Reanalysis

BC predicted surface concentration from the global MERRA-2 Reanalysis model was used to study the BC spatial distribution across NSW. The MERRA-2 reanalysis data produced by NASA’s Global Modelling and Assimilation Office (GMAO) were downloaded from https://portal.nccs.nasa.gov/cgi-lats4d/opendap.cgi?&path=/GEOS-5. The BC concentrations at the surface level, as a component of the MERRA Aerosol Reanalysis (MERRAero) with a 0.5-degree spatial resolution and 3-h interval, were extracted. The MERRAero is based on GEOS-5 which is radiatively coupled to the Goddard Chemistry, Aerosol, Radiation and Transport (GOCART) aerosol module and includes assimilation of aerosol optical depth (AOD) from the MODIS sensor aboard the Aqua/Terra satellites, ground-based AERONET AOD data. The GEOS-5 GOCART module, as described in [35,36], includes 15 aerosol tracers, such as dust, sea salt, sulphate, black and organic carbon, ozone, carbon monoxide and carbon dioxide. MERRAero provides a companion gridded aerosol dataset that can be used to study the impact of aerosols on the atmospheric circulation, climate and air quality [37].
With the number of sites and BC data available, Table 2 shows the temporal analysis and the three cases studies of BC from HRBs performed in this work to determine the characteristics of spatial and temporal patterns of black carbon (BC) in NSW and in the GMR. In the case studies, trajectory analysis was also used to determine the source of high BC concentration detected at a site.
Monitoring data of BC from AE33 aethalometers and PM2.5 from BAM as well as regression analysis and R-program are in the Supplementary Materials.

3. Results

3.1. BC from Motor Vehicle and Other Anthropogenic Sources in Sydney GMR Urban Area

3.1.1. Black Carbon Spatial Pattern Distribution Due to Anthropogenic Sources

Beside natural combustion sources of BC such as bushfires, anthropogenic BC emission sources are also present on the east coast of Australia, mostly from the major cities of Sydney, Melbourne and Brisbane. MERRA-2 aerosol assimilation data product for GEOS-5 allows one to distinguish among various emission sources of BC. Figure 2a shows the BC one-month average surface mass concentration assimilation data from MERRA-2 over south-eastern Australia in May 2018. Figure 2b shows the biomass burning during May 2018 occurred near Sydney, and in the hinterland area near the Queensland–New South Wales border. Figure 2c shows the main BC anthropogenic emission sources located in the cities of Sydney (NSW) and Melbourne (Victoria) and the urban area near the NSW–Queensland border. The BC anthropogenic emission pattern from MERRA-2 assimilation data model (Figure 2c) is similar to that from EDGAR-HTAP global anthropogenic black carbon (BC) emission database, as shown in Figure 2d. The global 2005 anthropogenic EDGAR (Emission Database for Global Atmospheric Research) version 4 compiled for Task Force on Hemispheric Transport of Air Pollution (TF-HTAP) has emission sources (land-based and shipping transport) of many pollutants including BC.
Motor vehicle emission (especially from diesel vehicles) and wood heaters during winter are two major anthropogenic sources of black carbon emission in the developed countries, such as those in the Northern Hemisphere [38,39]. Analysis of measurements of black carbon and PM2.5 at the monitoring stations during summer and winter allowed us to understand the contribution of these sources to the PM2.5 loadings in the GMR.

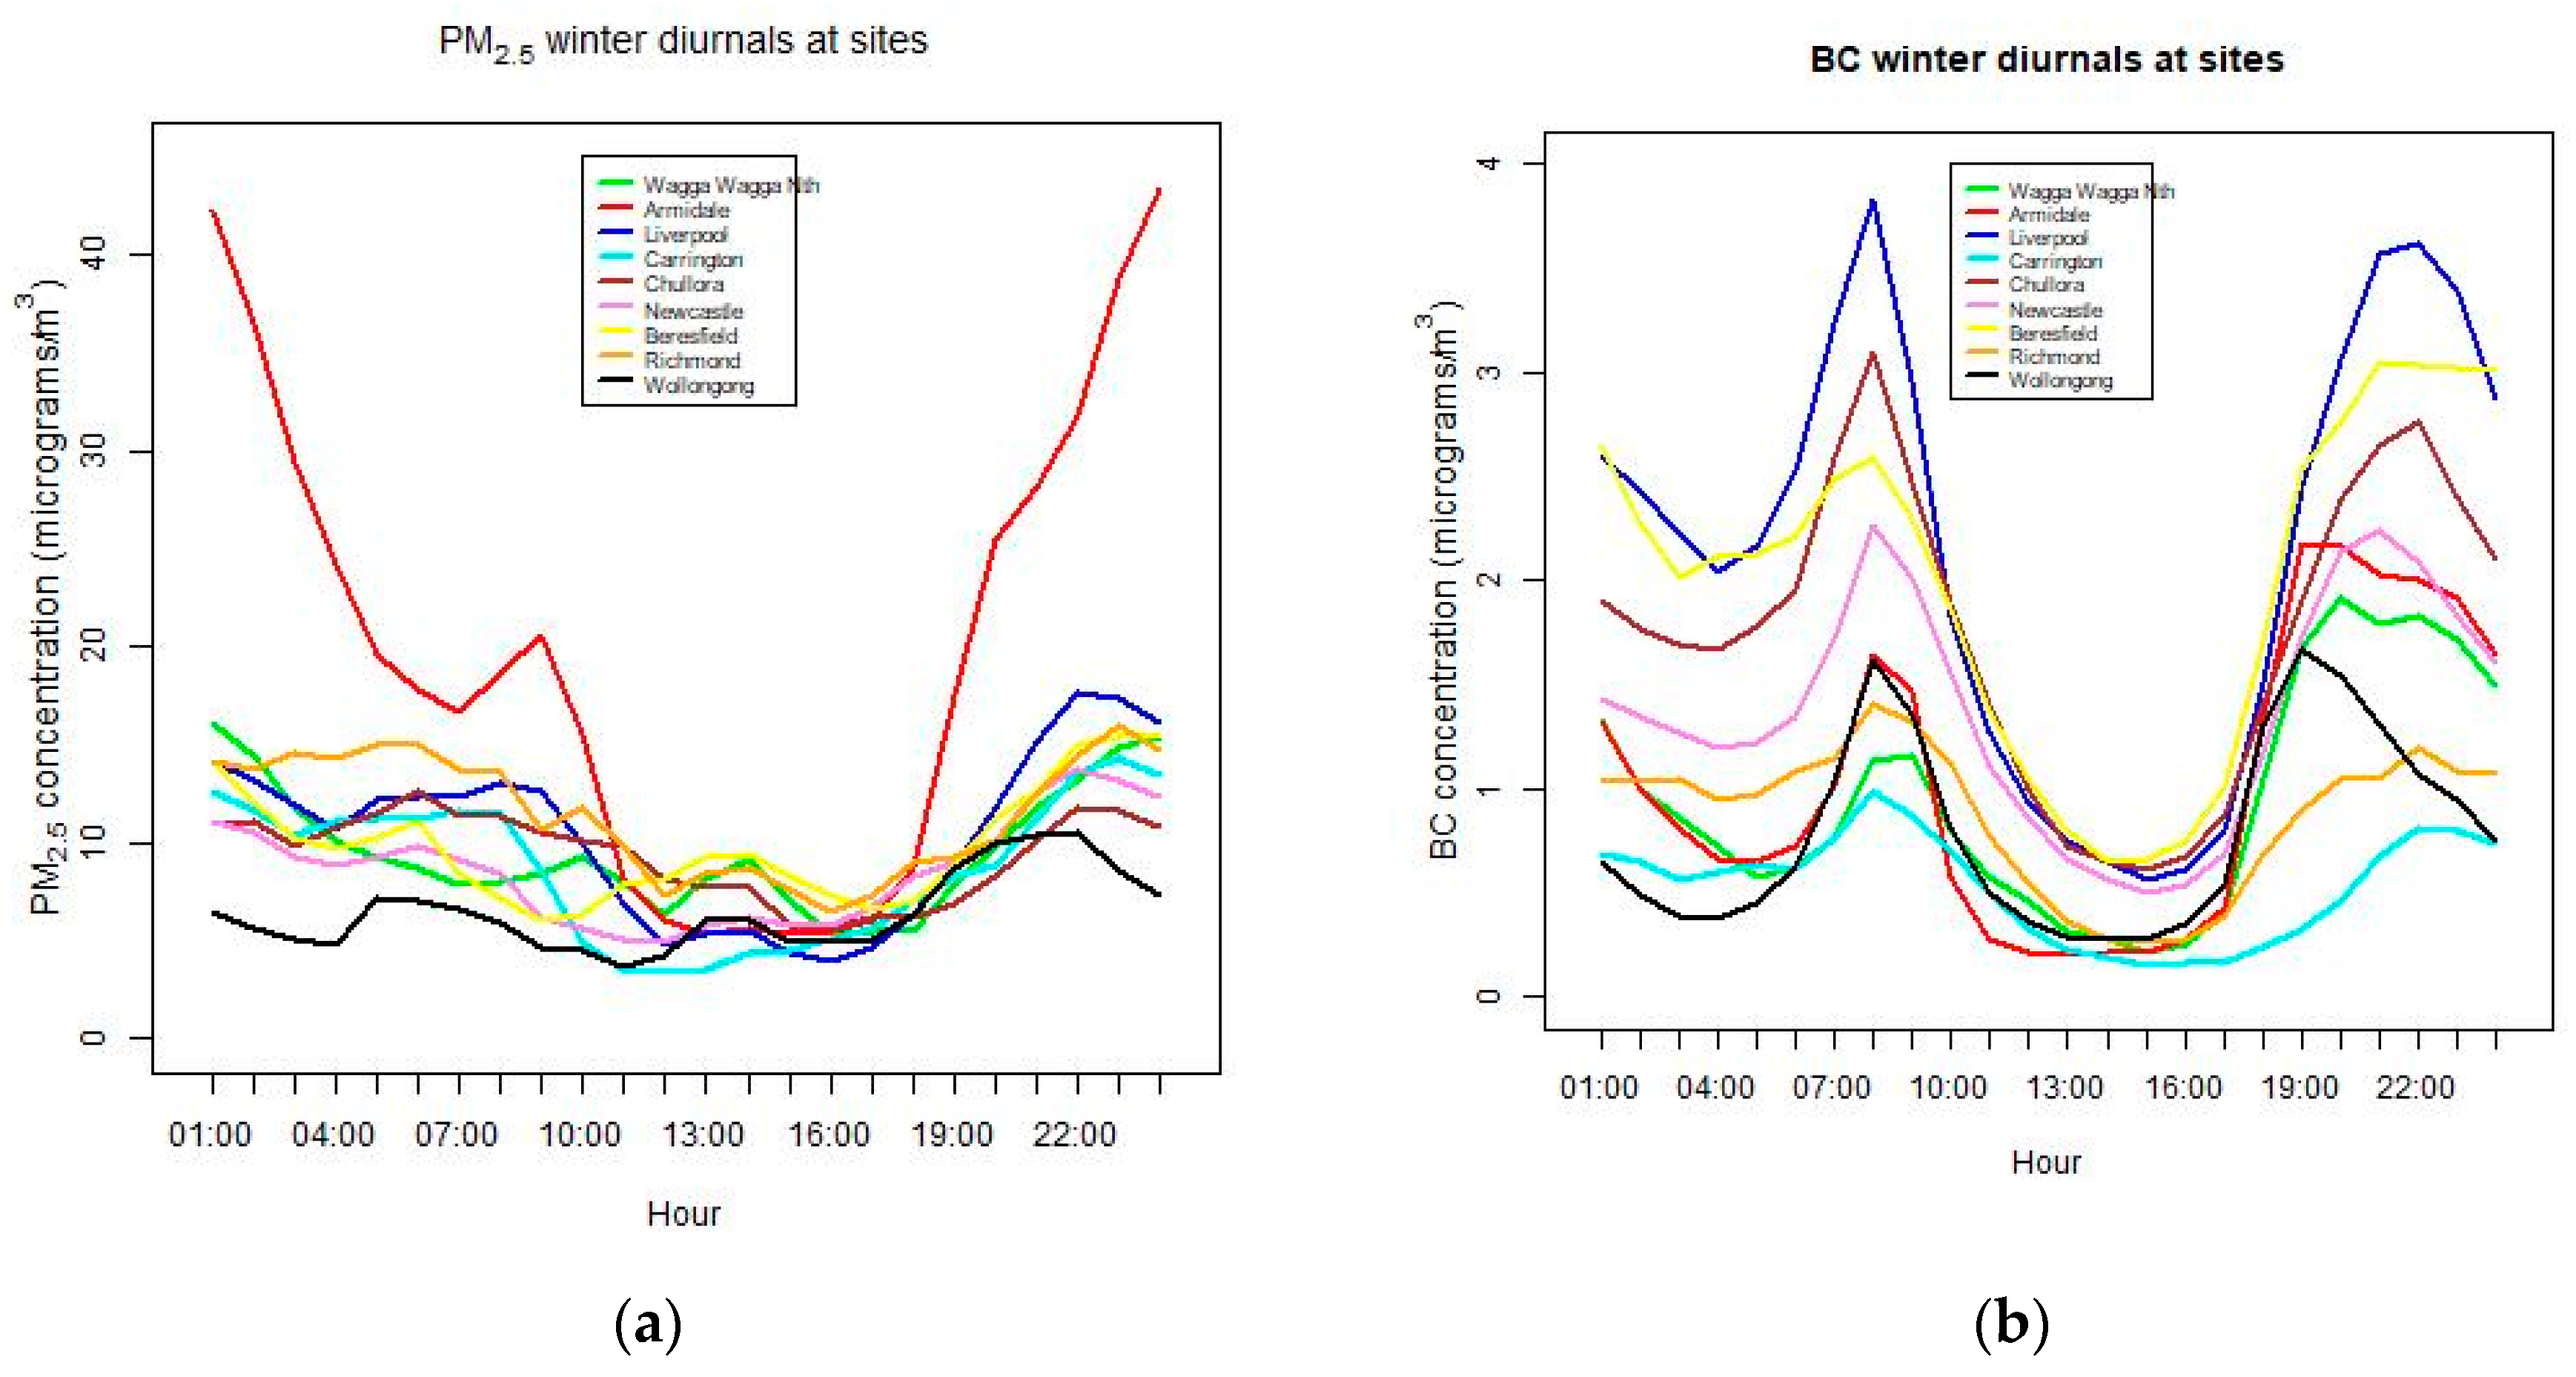
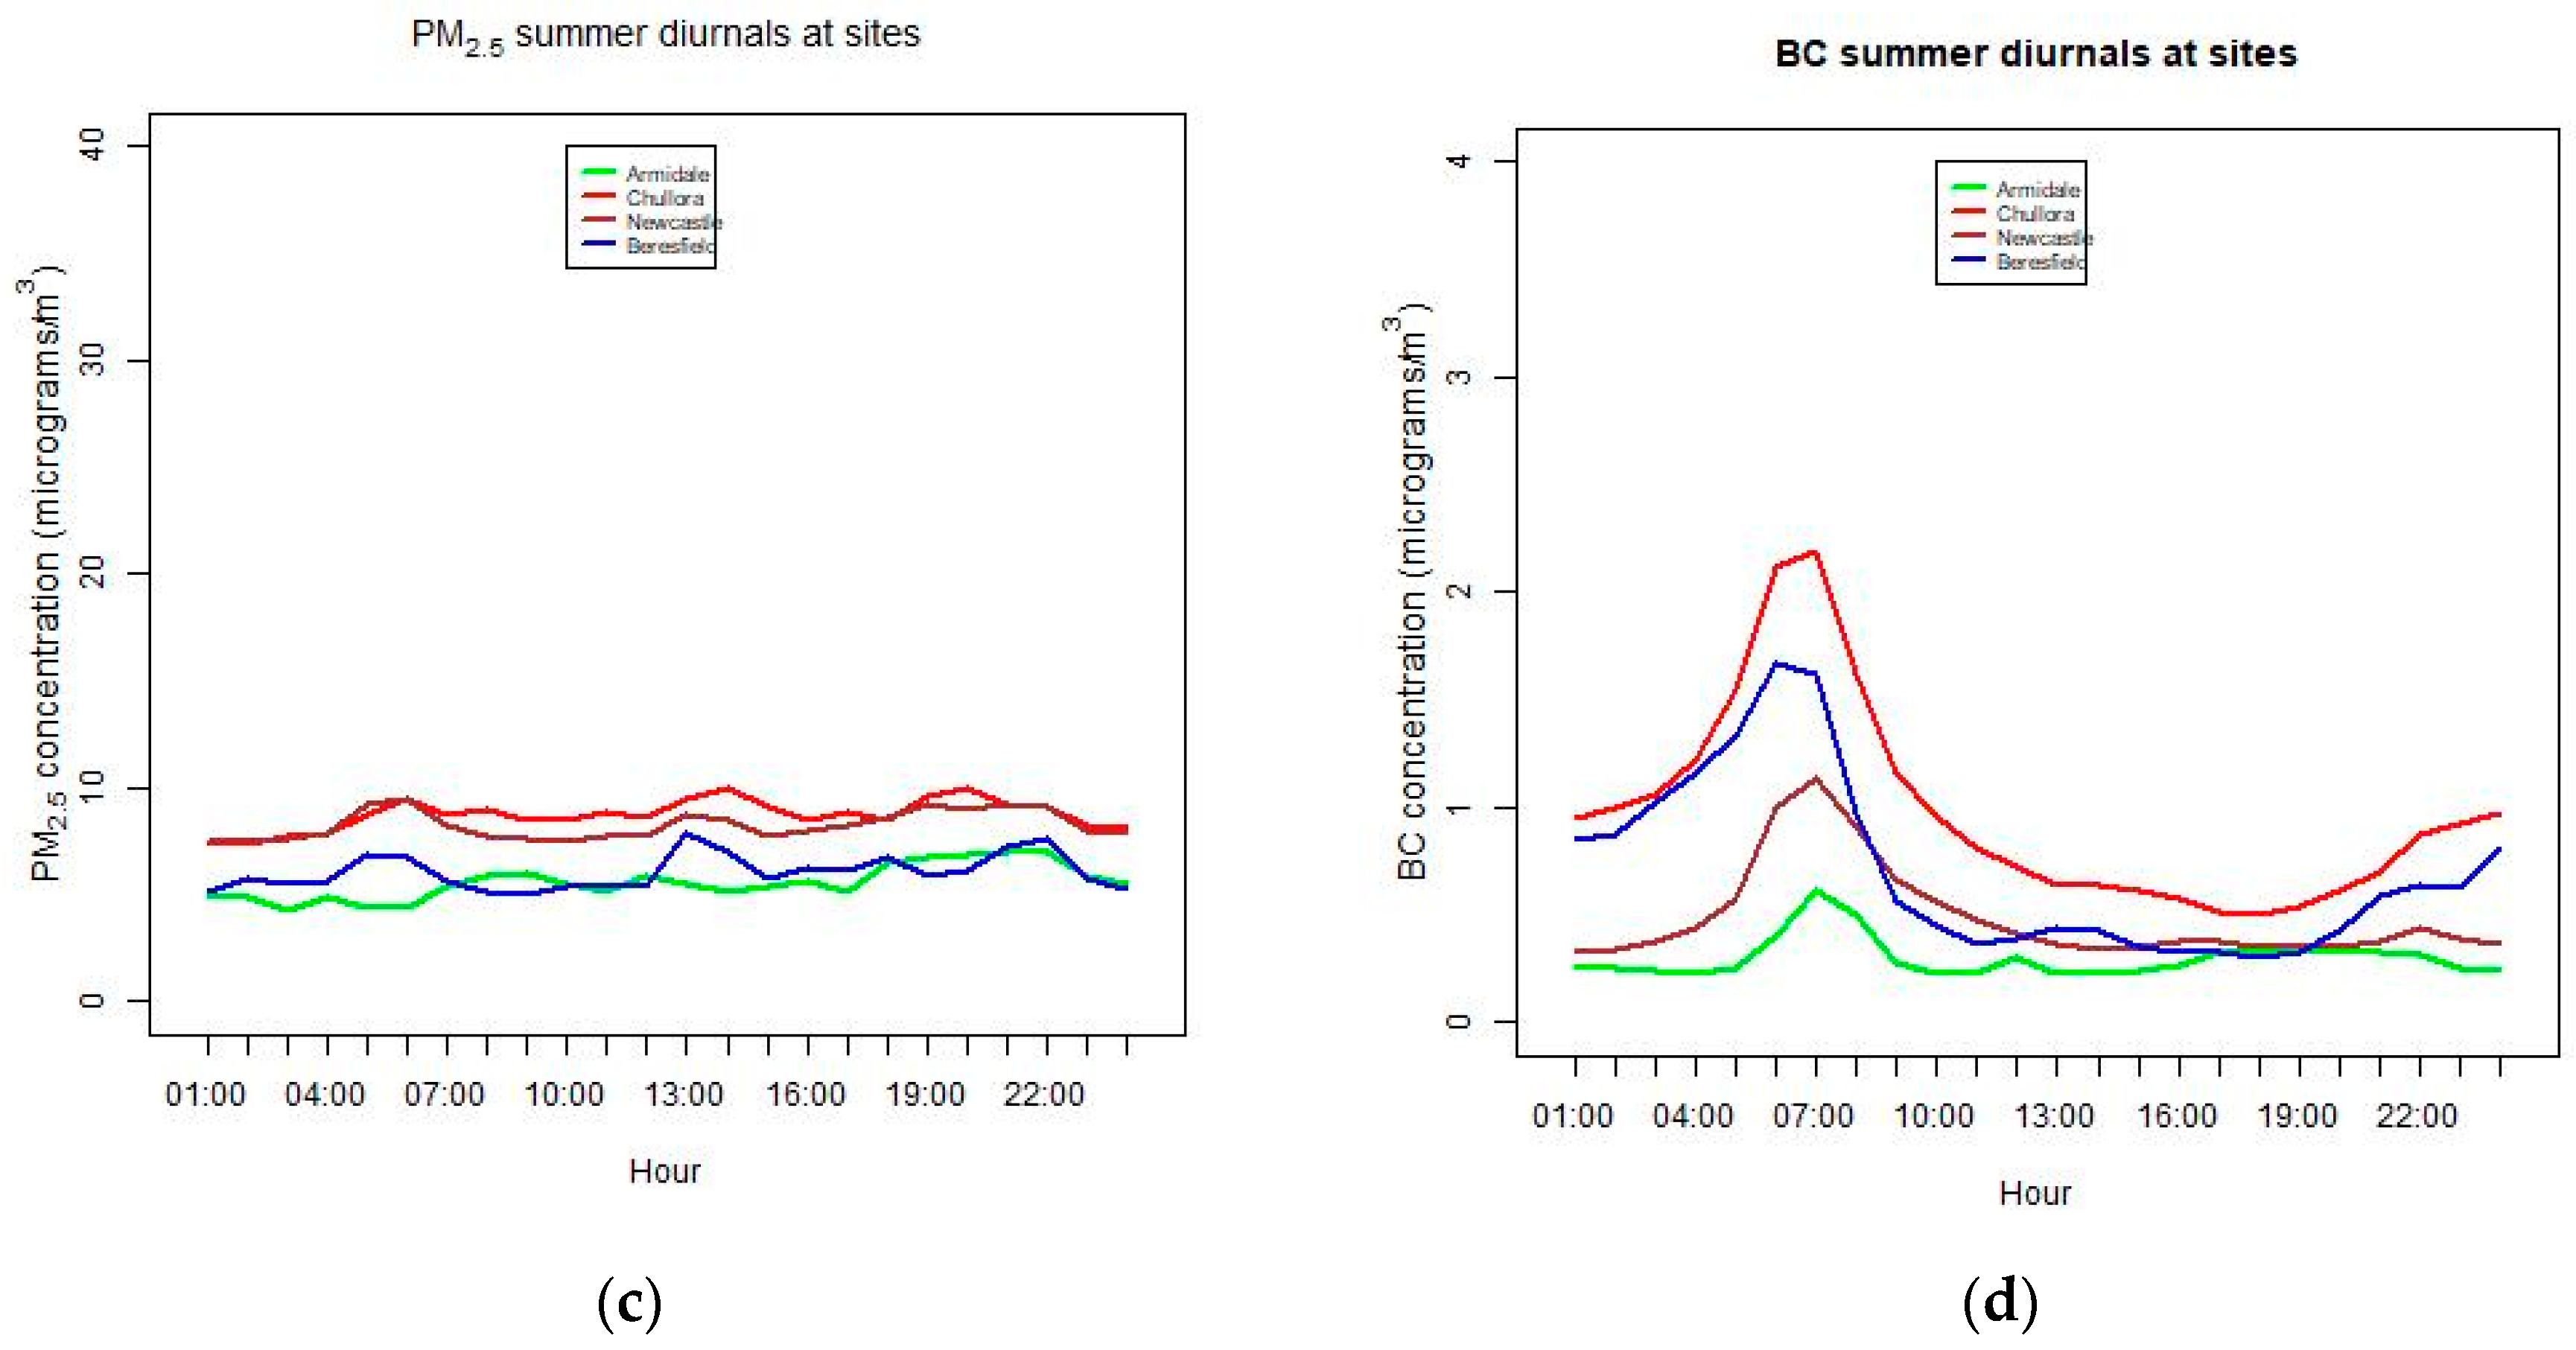
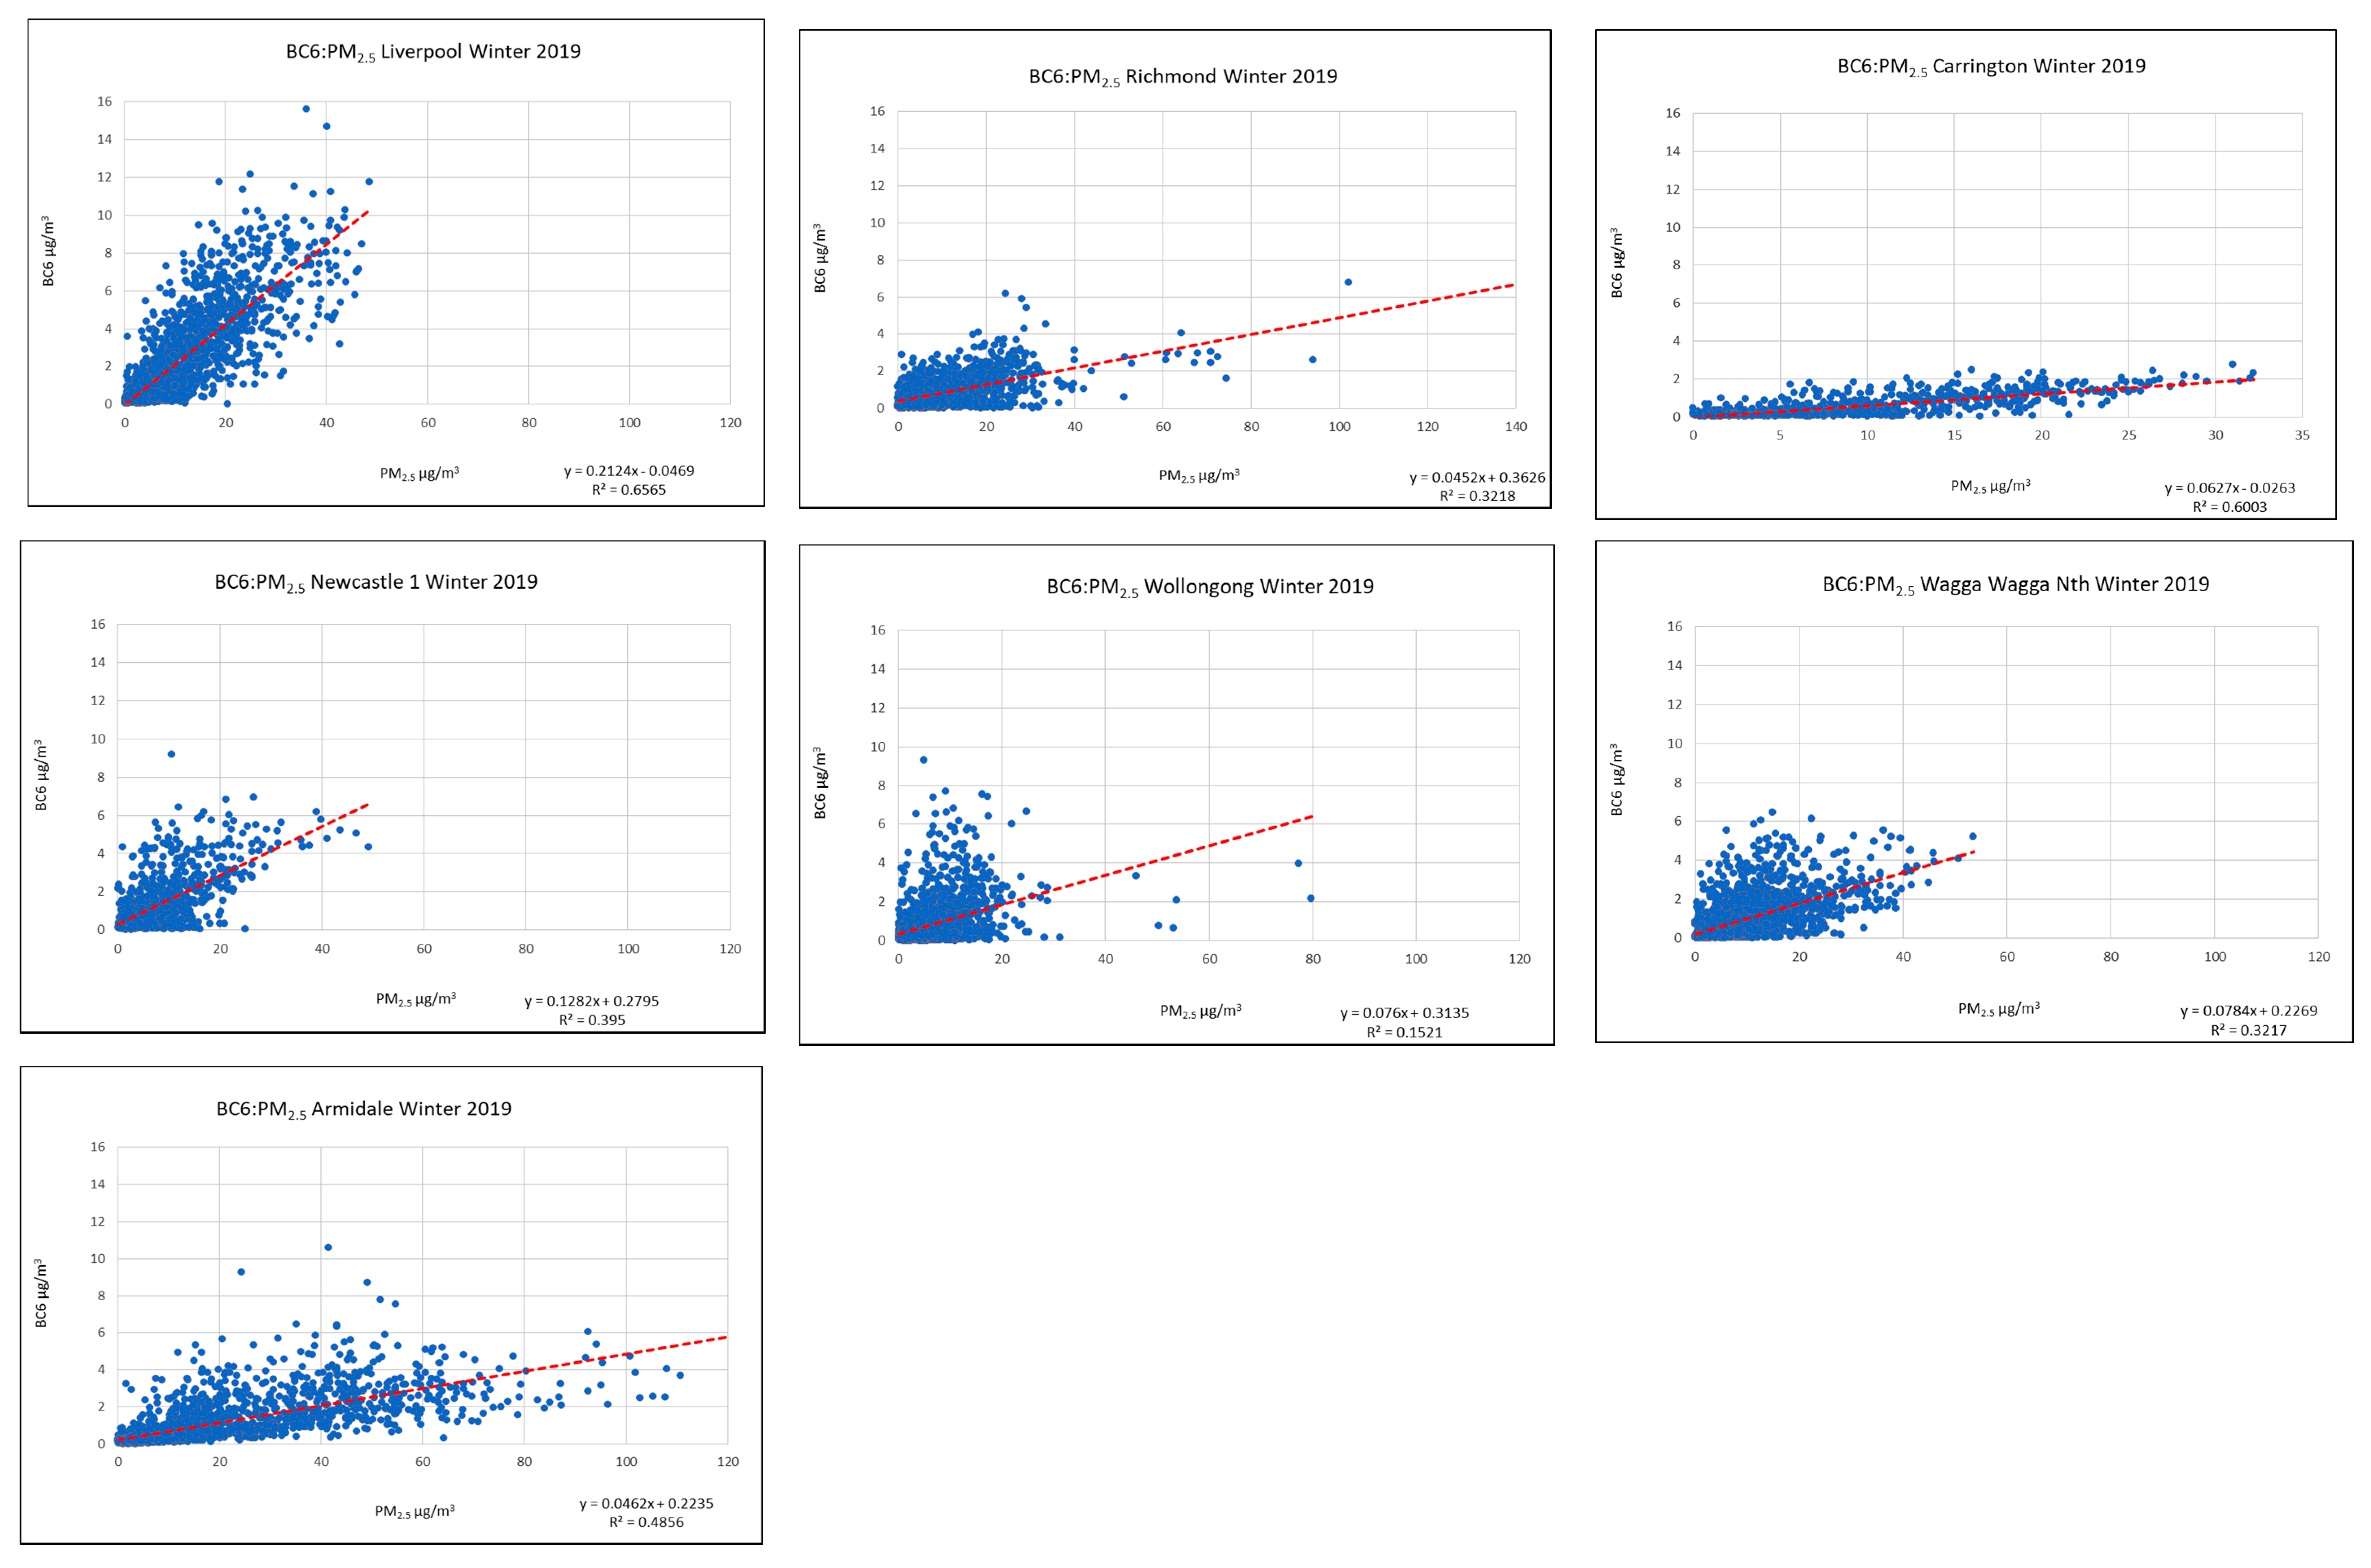
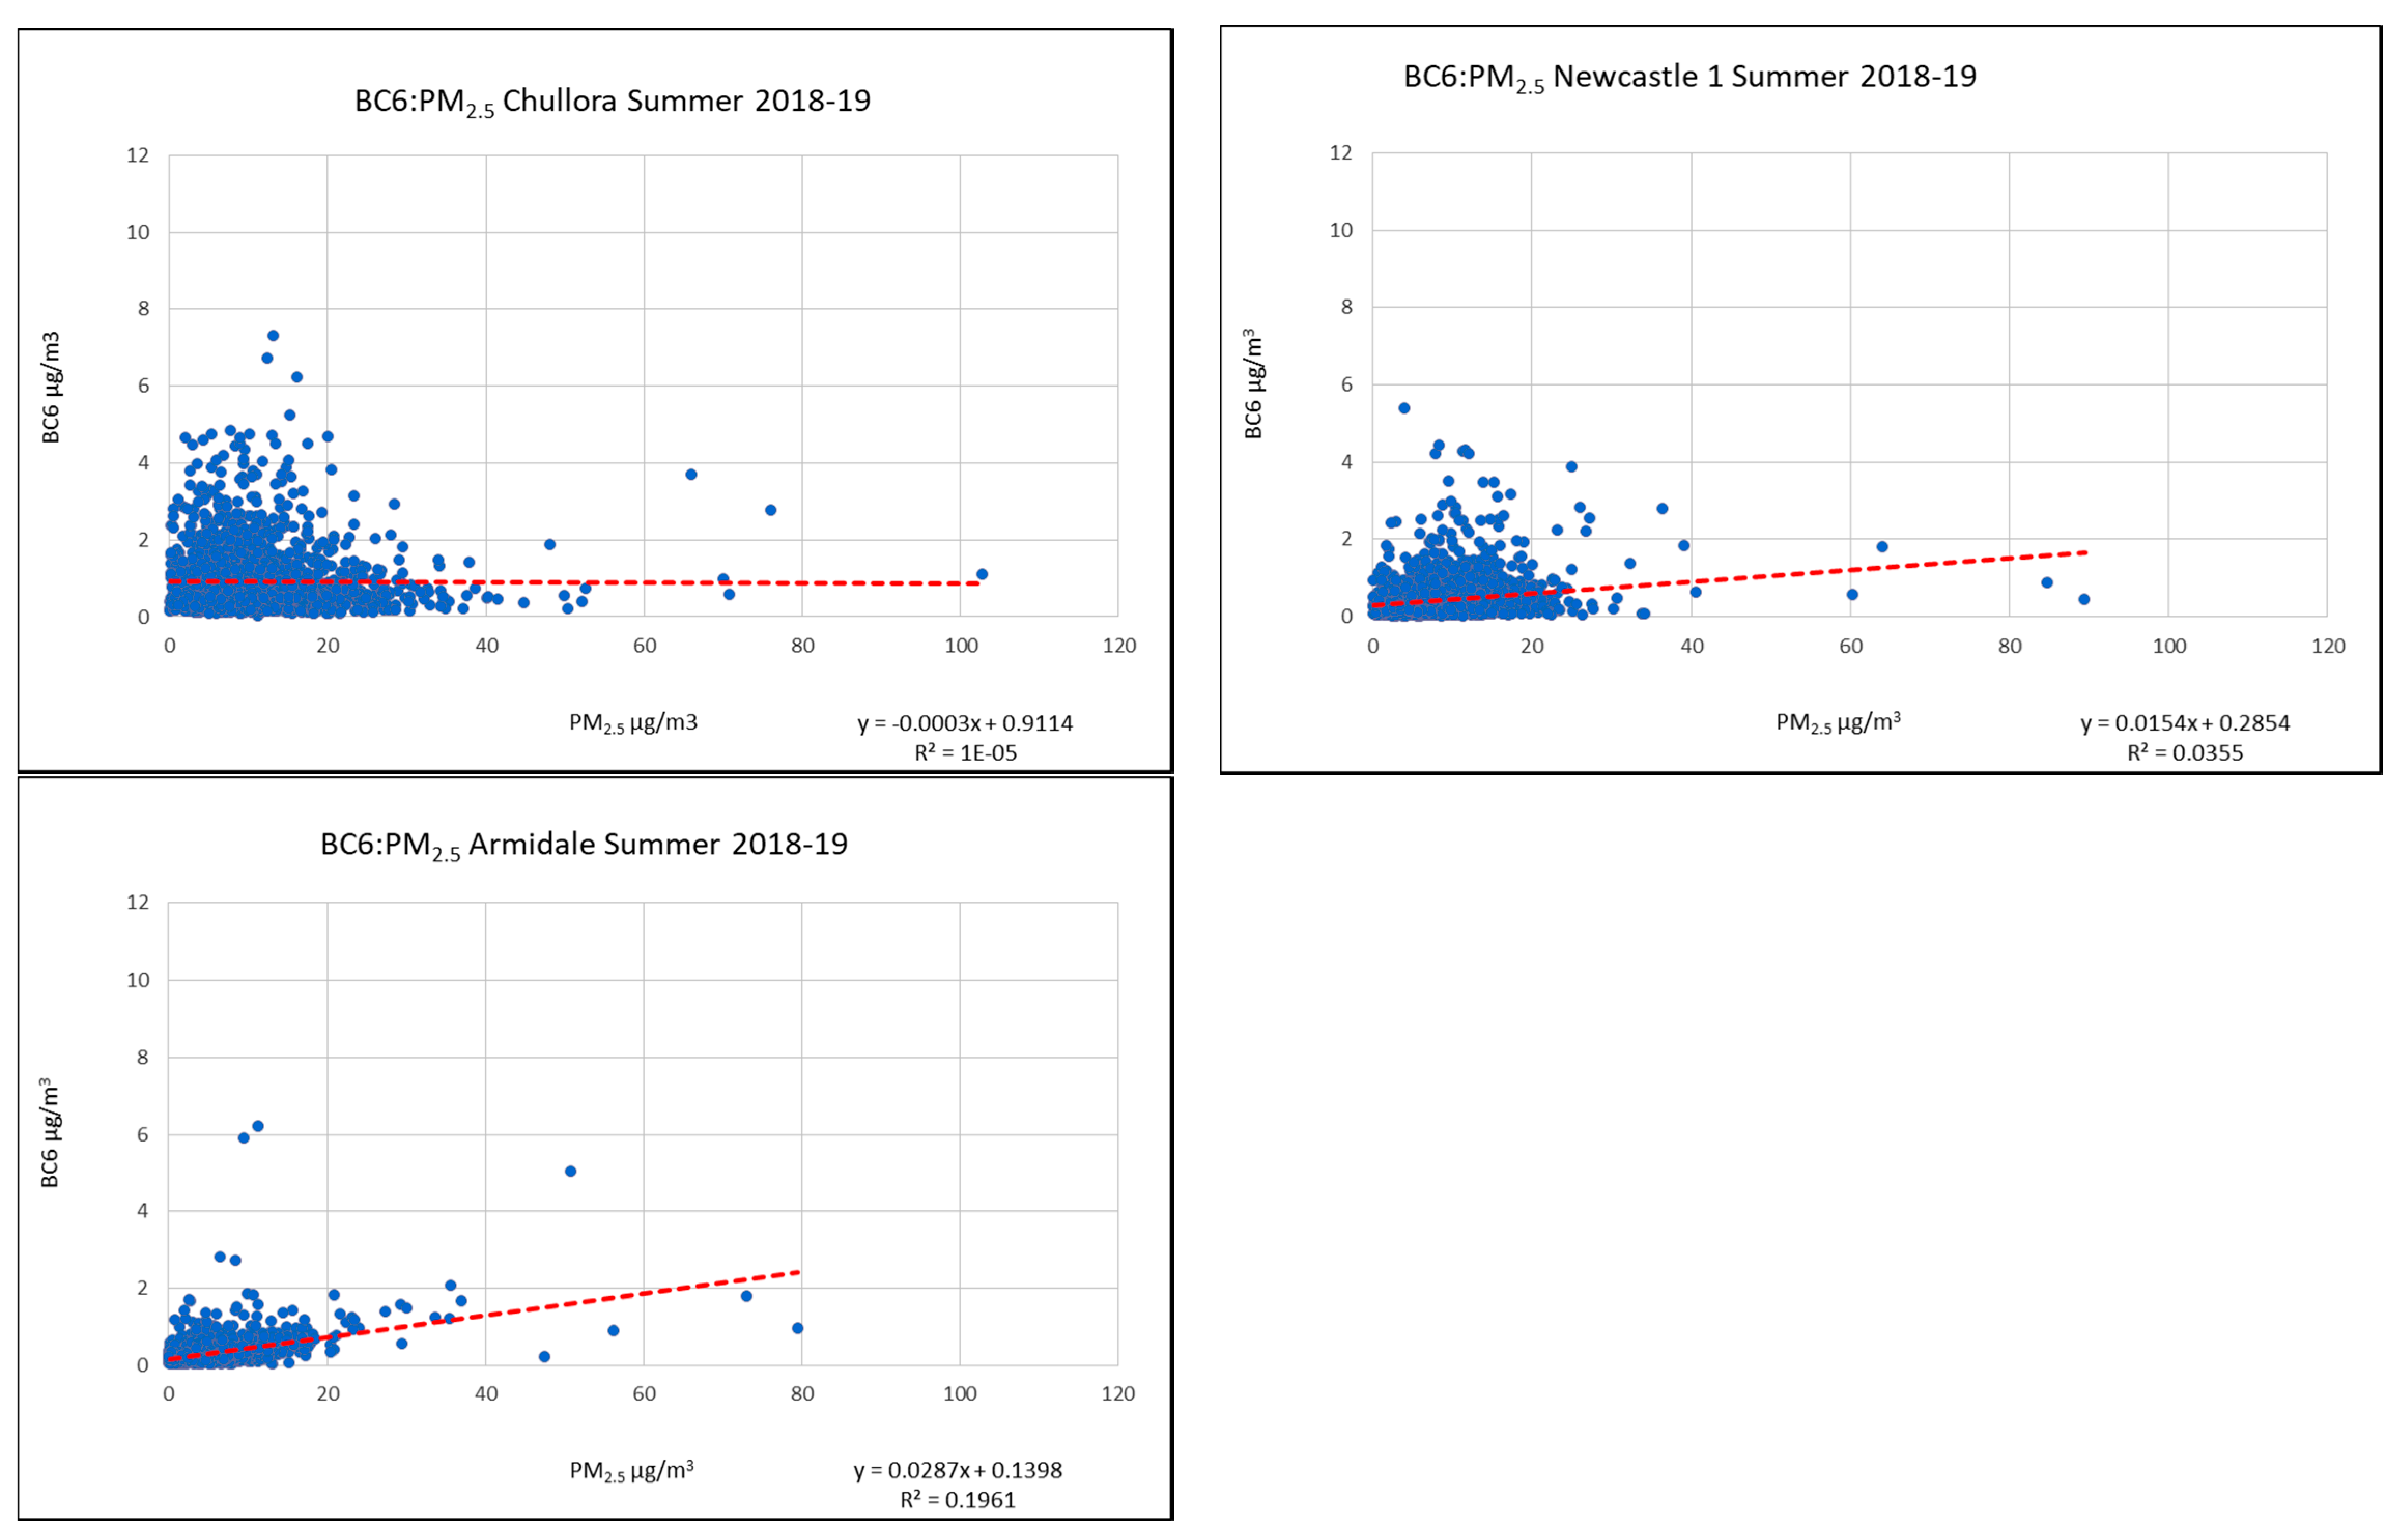
3.1.2. Regression Analysis of BC and PM2.5 during Winter and Summer Periods

The diurnal profiles of BC and PM2.5 at the GMR sites and regional sites during wintertime are shown in Figure 3a,b. The profile was derived from average of hourly data for each hour of the day based on the winter data from 2014 to 2019. Armidale site is strongly influenced by smoke from domestic wood heating during winter, with high PM2.5 and BC concentrations at night compared to those at 8:00 when traffic emissions are the highest. The urban sites at Chullora, Liverpool, Newcastle, Beresfield and Wollongong have pronounced peak of BC concentrations at about 8:00 while Richmond is less pronounced, as it is located at the north-western fringe of the Sydney urban area and therefore has lower traffic impacts. It is also clear that during winter the diurnal profiles of PM2.5 and BC are similar in term of fluctuation across sites with high concentrations during nighttime and lowest concentrations during mid-day and afternoon. This is because there is another important modulating factor: the evolution of the PBL is lowest at nighttime (from about 22:00 to 06:00) and highest at mid-day and afternoon (from 12:00 to 16:00). These two main driving forces, emission and meteorology, define the PM2.5 and BC diurnal profiles [21,40]. Recently, Liu et al., (2018) [6] discovered another feedback mechanism on aerosols and PBL interaction in which secondary aerosols formation from aqueous chemical reactions play a role in the aerosol concentration and PBL positive feedback mechanism.
While motor vehicle combustion is important in influencing BC concentrations during winter at Newcastle, Beresfield, Wollongong and Richmond, it is less important during summer. Aethalometers at Wagga Wagga North, Liverpool, Richmond and Wollongong were only installed since April 2019, and Carrington was installed in July 2019 for a short period of three months. Given the extensive austral 2019–2020 summer bushfires, data still being analysed and as such is atypical for Australian summers. Figure 3c,d shows the PM2.5 and BC averaged diurnal profiles during summer period. Both the BC and PM2.5 concentrations at these sites measured during summer are much less than those measured during winter. There is a morning peak of BC concentration, as seen with winter diurnal pattern, but a late evening peak, similar to that observed during the winter period, at about 22:00, is hardly discernible. The evening peak is also due to lower PBL height at night, which causes higher level of PM2.5 and BC. In contrast, much higher PBL during mid-day period between 12:00 and 17:00, causes reduction in PM2.5 and BC concentration at ground level (Figure 3c,d).
As expected, there is stronger correlation between BC and PM2.5 during the winter (R2 of 0.15–0.65) than the summer (R2 of 0.0–0.19), as presented in Figure 4 and Figure 5, which show the regression of hourly BC and PM2.5 concentrations at various sites for these two seasons. The sites Carrington, Richmond, Liverpool, Wollongong and Wagga Wagga North were operational only for the 2019 winter period; therefore, summer period data are not yet available for analysis. Aethalometer at Carrington was recently removed for used in another location. The stronger correlation between BC and PM2.5 indicates that they have likely originated from a single source emission rather than from different sources such as those at Armidale and Wagga Wagga North which are mostly dominated by biomass burnings. Wood heating in Armidale, in the New England Tableland, is the major emission source of PM2.5 and BC during winter [41]. At Wagga Wagga North, late autumn and winter agricultural biomass burnings are the major sources of emitted PM2.5 and BC.
Compared to other sites, at Liverpool and Carrington, where stronger linear relationship between BC and PM2.5 exists (R2 = 0.65 and 0.60), the PM2.5 and BC diurnal profiles are very similar. Compared with Newcastle, a nearby site of Carrington, the PM2.5 levels are similar on daily average, with Carrington have higher values in the morning (0:00–9:00) and Newcastle higher in the afternoon until late night (10:00–22:00) (Figure 3a). However, BC concentrations are much lower at Carrington as compared with those at Newcastle such as at 8:00 (Figure 3b). Motor vehicle combustion and other combustion sources have higher influence in Newcastle than in Carrington. The BC concentrations at Carrington are low (< 3 μg/m3 for BC), and there is a strong linear relationship of BC and PM2.5 as shown in Figure 4. This site located at the entry to the port of Newcastle, at the mouth of Hunter River and is surrounded on both sides by water. It is isolated from Newcastle Central Business District (CBD) which is nearby and is more strongly influenced by sea breeze. The source of BC and PM2.5 is likely from regional background levels of pollutants. Figure 4 also shows the regression of BC and PM2.5 at other sites including Wagga Wagga North, Armidale, Liverpool, Newcastle, Richmond and Wollongong.
The ratio of hourly BC/PM2.5 is approximately 4% at Armidale, 8% at Wagga Wagga North and 6% at Carrington during winter period. Strong linear relationship between BC and PM2.5 is also found at Liverpool with R2 value of 0.65 and weaker relationship at Newcastle with R2 values of 0.4 and BC/PM2.5 ratio of 21% and 13%, respectively. At Richmond and Wollongong, the linear relationship of BC and PM2.5 is weaker with R2 values of 0.32 and 0.15 and BC/PM2.5 ratio of 4.5% and 8%, respectively. These sites are affected by traffic sources and other combustion sources. Traffic sources are the major sources of BC at these urban sites, especially at Liverpool which is downwind from central and east Sydney where traffic densities are highest. At Newcastle, fugitive coal particles from coal train and port loading was found to be negligible sources of BC and PM2.5.
For summer period, as shown in Figure 5, the regression between BC and PM2.5 at Chullora, Newcastle and Armidale shows there is no relationship between BC and PM2.5 with low R2 value (0.0, 0.035 and 0.19, respectively). As seen from the diurnal patterns of PM2.5 and BC during summer in Figure 3b, the PM2.5 concentrations are low and do not change much during the day while BC varies from mid-day to high values in the late evening. This suggests meteorology with strong convective force plays an important role in defining the relationship of BC and PM2.5.
The composition of PM2.5 includes BC, mineral dust particles, elemental metals, OC (organic carbon), SIO (secondary inorganic aerosol) and SỌA (secondary organic aerosol). BC mostly comes from combustible sources while PM2.5 also comes from other sources such as dust storm and sea salt. The measurement of BC (using aethalometer) and PM2.5 (using BAM) are based on different principles, one on beta radiation attenuation and the other on spectral absorption of particulates collected on filter papers to derive the approximate concentration of BC and PM2.5 in the air (in μg/m3). Even though they are measured using different methods, a comparison of their relative concentration is useful to understand the relationship between PM2.5 and one of its components (BC).
The BB (percentage of biomass burnings) parameter values from the AE33 Aethalometer provide the source apportionment of BC from biomass burning and fossil fuel combustion. Figure 6 shows the BC from fossil fuel combustion (BCff) and from wood burning (BCwb) at a number of sites during winter 2019 (1 June 2019 to 31 August 2019). Emission of BC due fossil fuel combustion from traffic dominate the BC concentration as measured at all the sites, except Armidale which has more BC emitted from wood burning than from fossil fuel.
From the regression analysis at the sites during winter where different sources of BC are known at these sites, it can be estimated that the BC/PM2.5 from biomass burning sources are between 4% and 8% while, for local traffic sources, the ratio is higher (14–21%). With these results using data spanning several years, the characteristics of BC as measured at a site for a shorter period where various sources of BC from local to remote sources can be analysed to determine the influence of these sources on the site. For example, Figure 7a shows the hourly BC/PM2.5 ratio at Chullora during May 2018 when Hazardous Reduction Burnings (HRBs) were carried out by the Rural Fire Service (RFS) of NSW in numerous places outside the GMR. Large fluctuation of BC/PM2.5 occurred from early May to mid-May 2018 and the average ratio decreased from about 20% in early May to about 15%, which is about the baseline BC/PM2.5, toward the end of May 2018. The diurnal pattern of BC and PM2.5 at Chullora in Figure 7b shows BC and PM2.5 peaked at 7 am and 9 am, respectively. At mid-day (13:00–14:00), both BC and PM2.5 were the lowest. This pattern reflected the strong contribution of traffic emissions at this urban site.
In Figure 7b, there is an about 2-h difference (offset) between the BC peak readings and the PM2.5 peak readings during May 2018. The difference suggests that there were other non-combustible type emission sources of PM2.5 (such as sea salt, dust) that were measured at Chullora. The diurnal patterns of BC and PM2.5 are not necessarily similar (or synchronous) at many sites, such as those shown in Figure 3a,b and 7c for the winter period. Even though the peak values of BC concentration in the morning at Chullora, Liverpool and Richmond occur at about the same time, PM2.5 peak values do not. This suggests that the sources of PM2.5 are more heterogenous.
This May 2018 period is examined in the next section. As the site characteristics and baseline BC to PM2.5 ratio is known at each site, the influence of long-range transport of particles from sources such as biomass burnings could be ascertained using both trajectory modelling and observed data.

3.2. BC from Biomass Burnings

In this section, we present the results of using BC measurements and models to describe the three most recent biomass burnings which affected air quality in the Sydney GMR: May 2015, May 2016 and May 2018. These cases are different in their influence at receptor points by the nature of their long-range transport, and the use of ground measurements, satellite observation and models together allowed us to understand how each biomass burning affected air quality and population exposure to air pollutants in different ways.

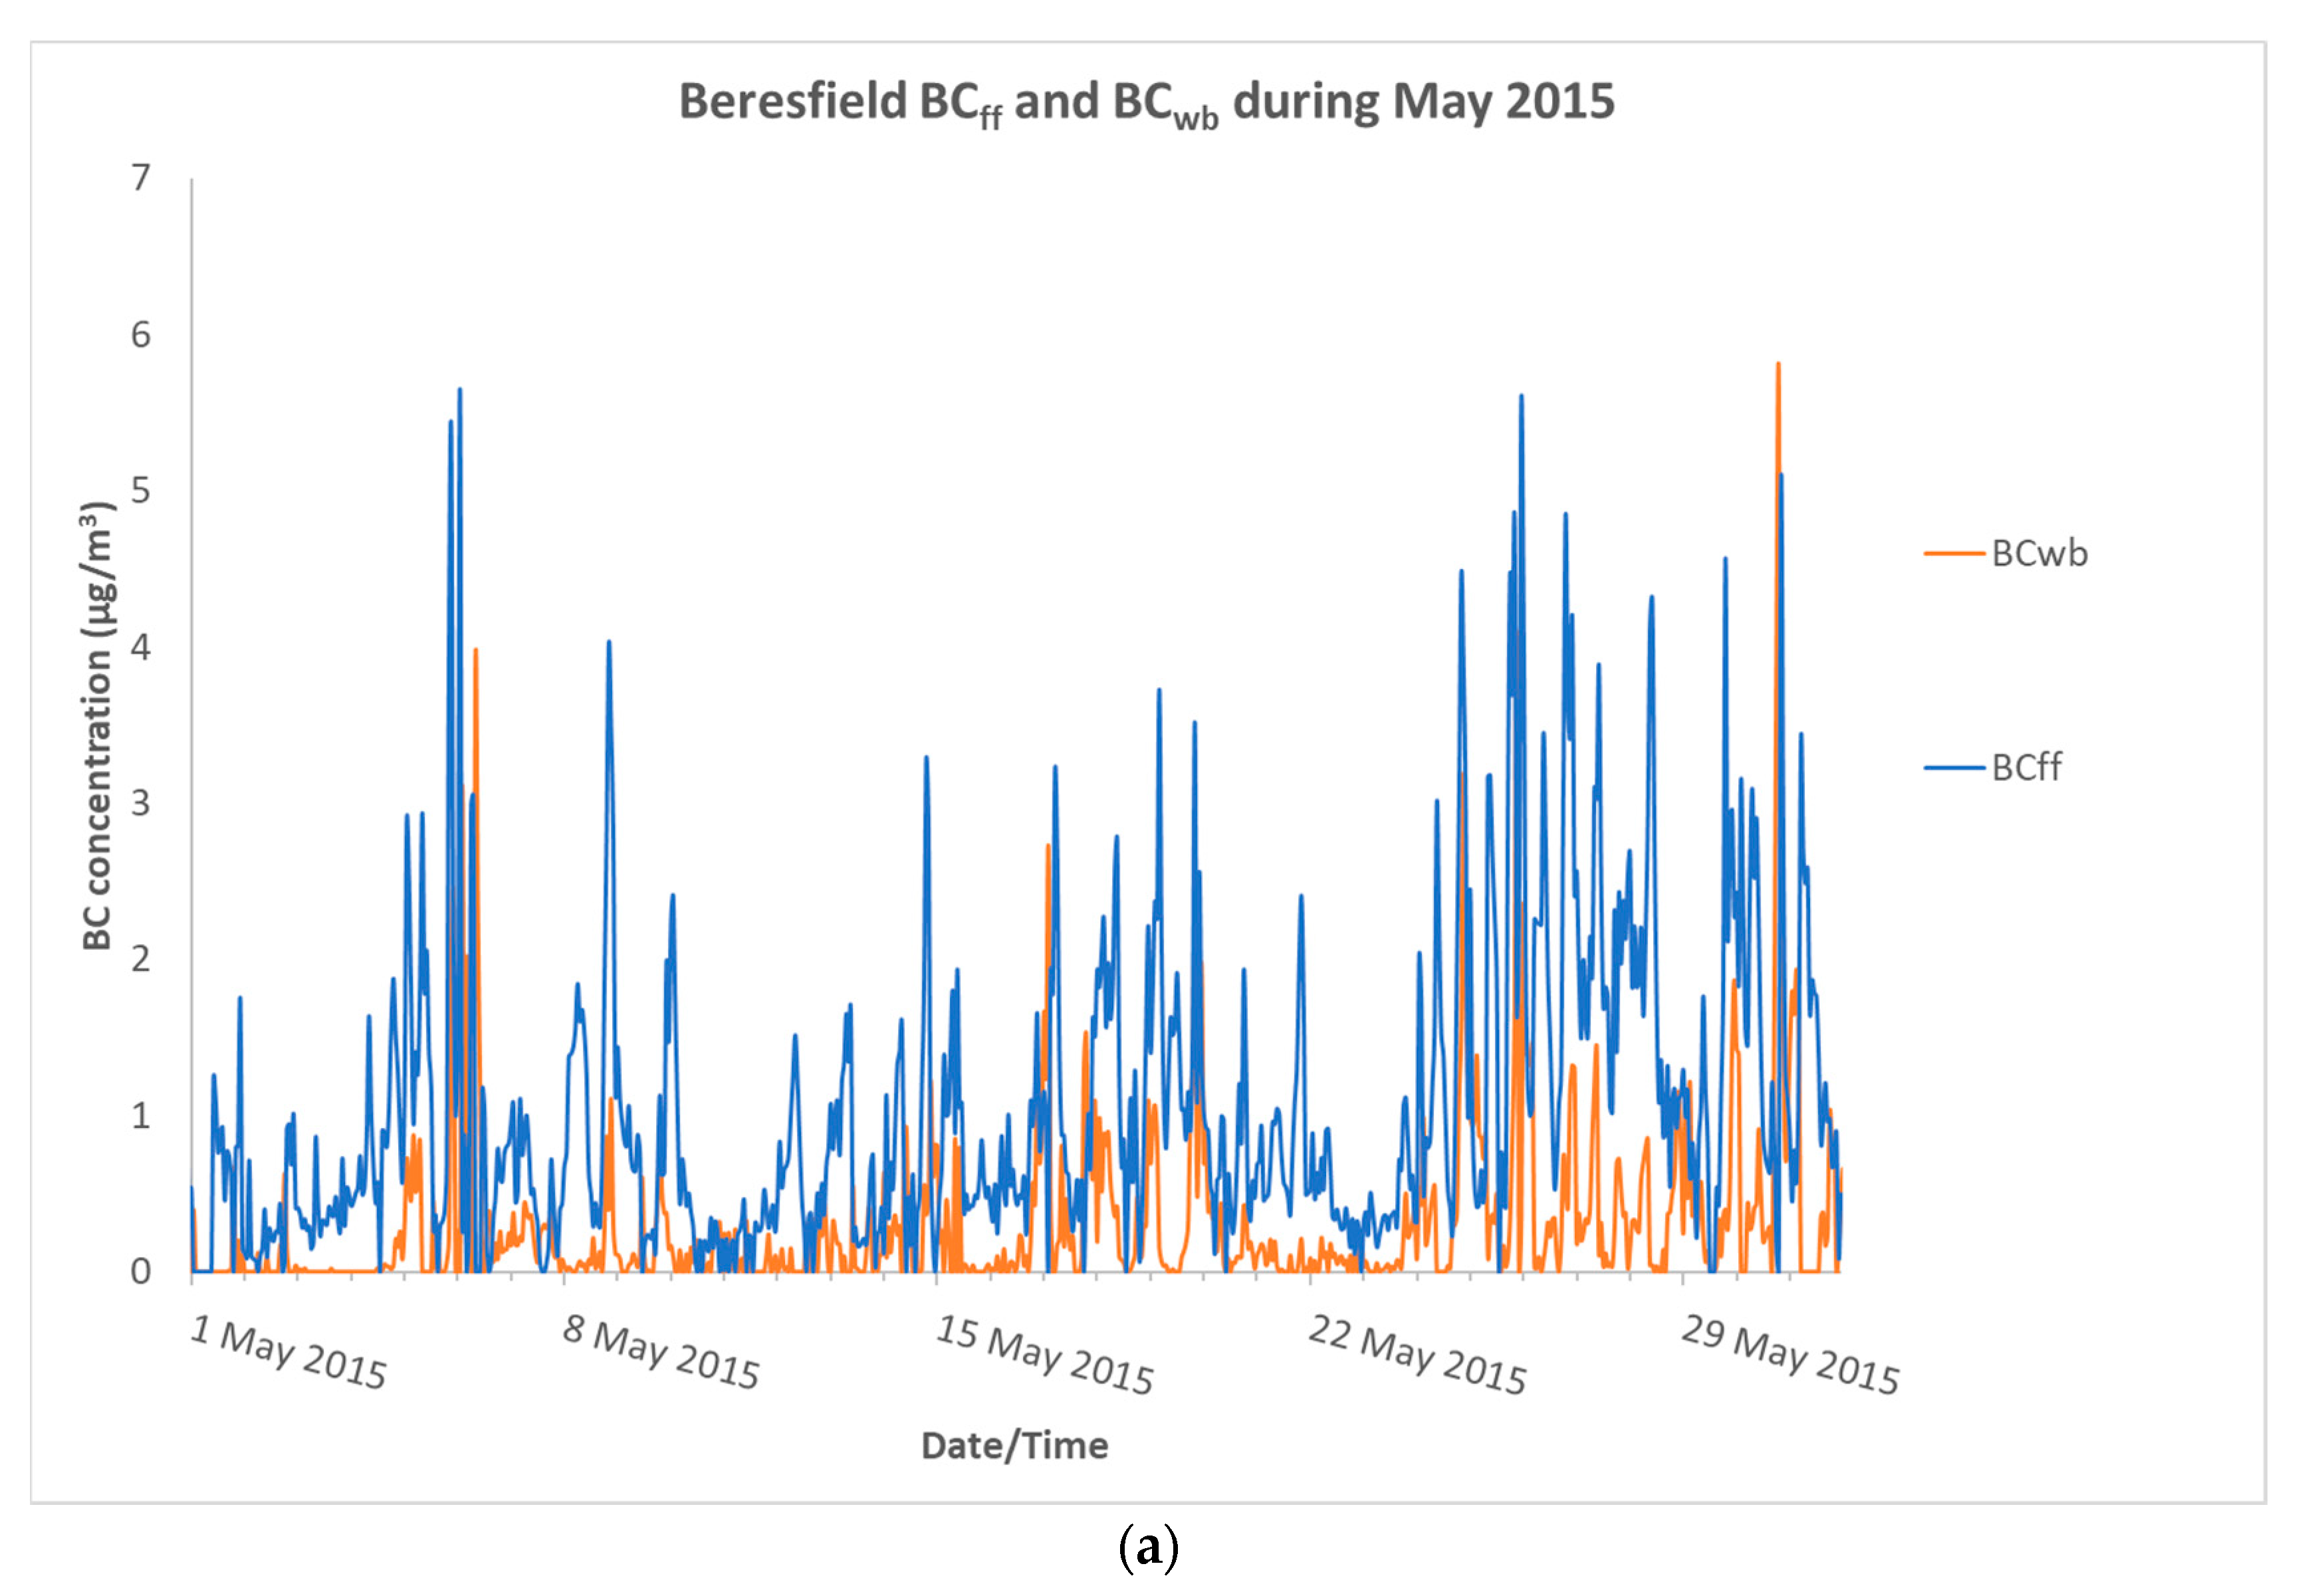
3.2.1. May 2015 Hazard Reduction Burning (HRB)

For the period of May 2015, when HRBs were conducted by the Rural Fire Service (RFS) of New South Wales (NSW), only the Beresfield monitoring station had an aethalometer operational during this period. The aethalometer model as implemented in AE33 provides the apportionment of BC into BC from emission of fossil fuel combustion (BCff) and BC from biomass burnings or wood burning (BCwb). Figure 8a shows the BCff and BCwb as measured during May 2015. Fossil fuel combustion from traffic is the dominant source of BC emission at Beresfield for this period except a few hours during the month.
A HYSPLIT ensemble backward trajectory analysis for 48 h at 10-m height from Beresfield on 4 May 2015 at 15:00 AEST, which corresponds to the peak BC concentration at this site, indicates that the air parcel passed over the biomass burning (representing as red-dot hot spots in Figure 8b) in the Riverina-Mallee agricultural region (between Wagga Wagga and Bendigo) and then over the urban area of Illawarra and Sydney before reaching Beresfield in the Lower Hunter. As specified in NOAA Air Resources Laboratory (ARL) trajectory analysis, each member of the trajectory ensemble is calculated by offsetting the meteorological data by a fixed grid factor (one grid meteorological grid point in the horizontal and 0.01 sigma units in the vertical) and is represented by a colour trajectory in Figure 8b.
Figure 9 shows the BC concentration on 4 May 2015 at 15:00 AEST as predicted from MERRA. The high concentration is mostly located in the GMR and at smaller scale in the Riverina-Mallee agricultural area. The BC as measured at Beresfield at this time most likely came from both sources.

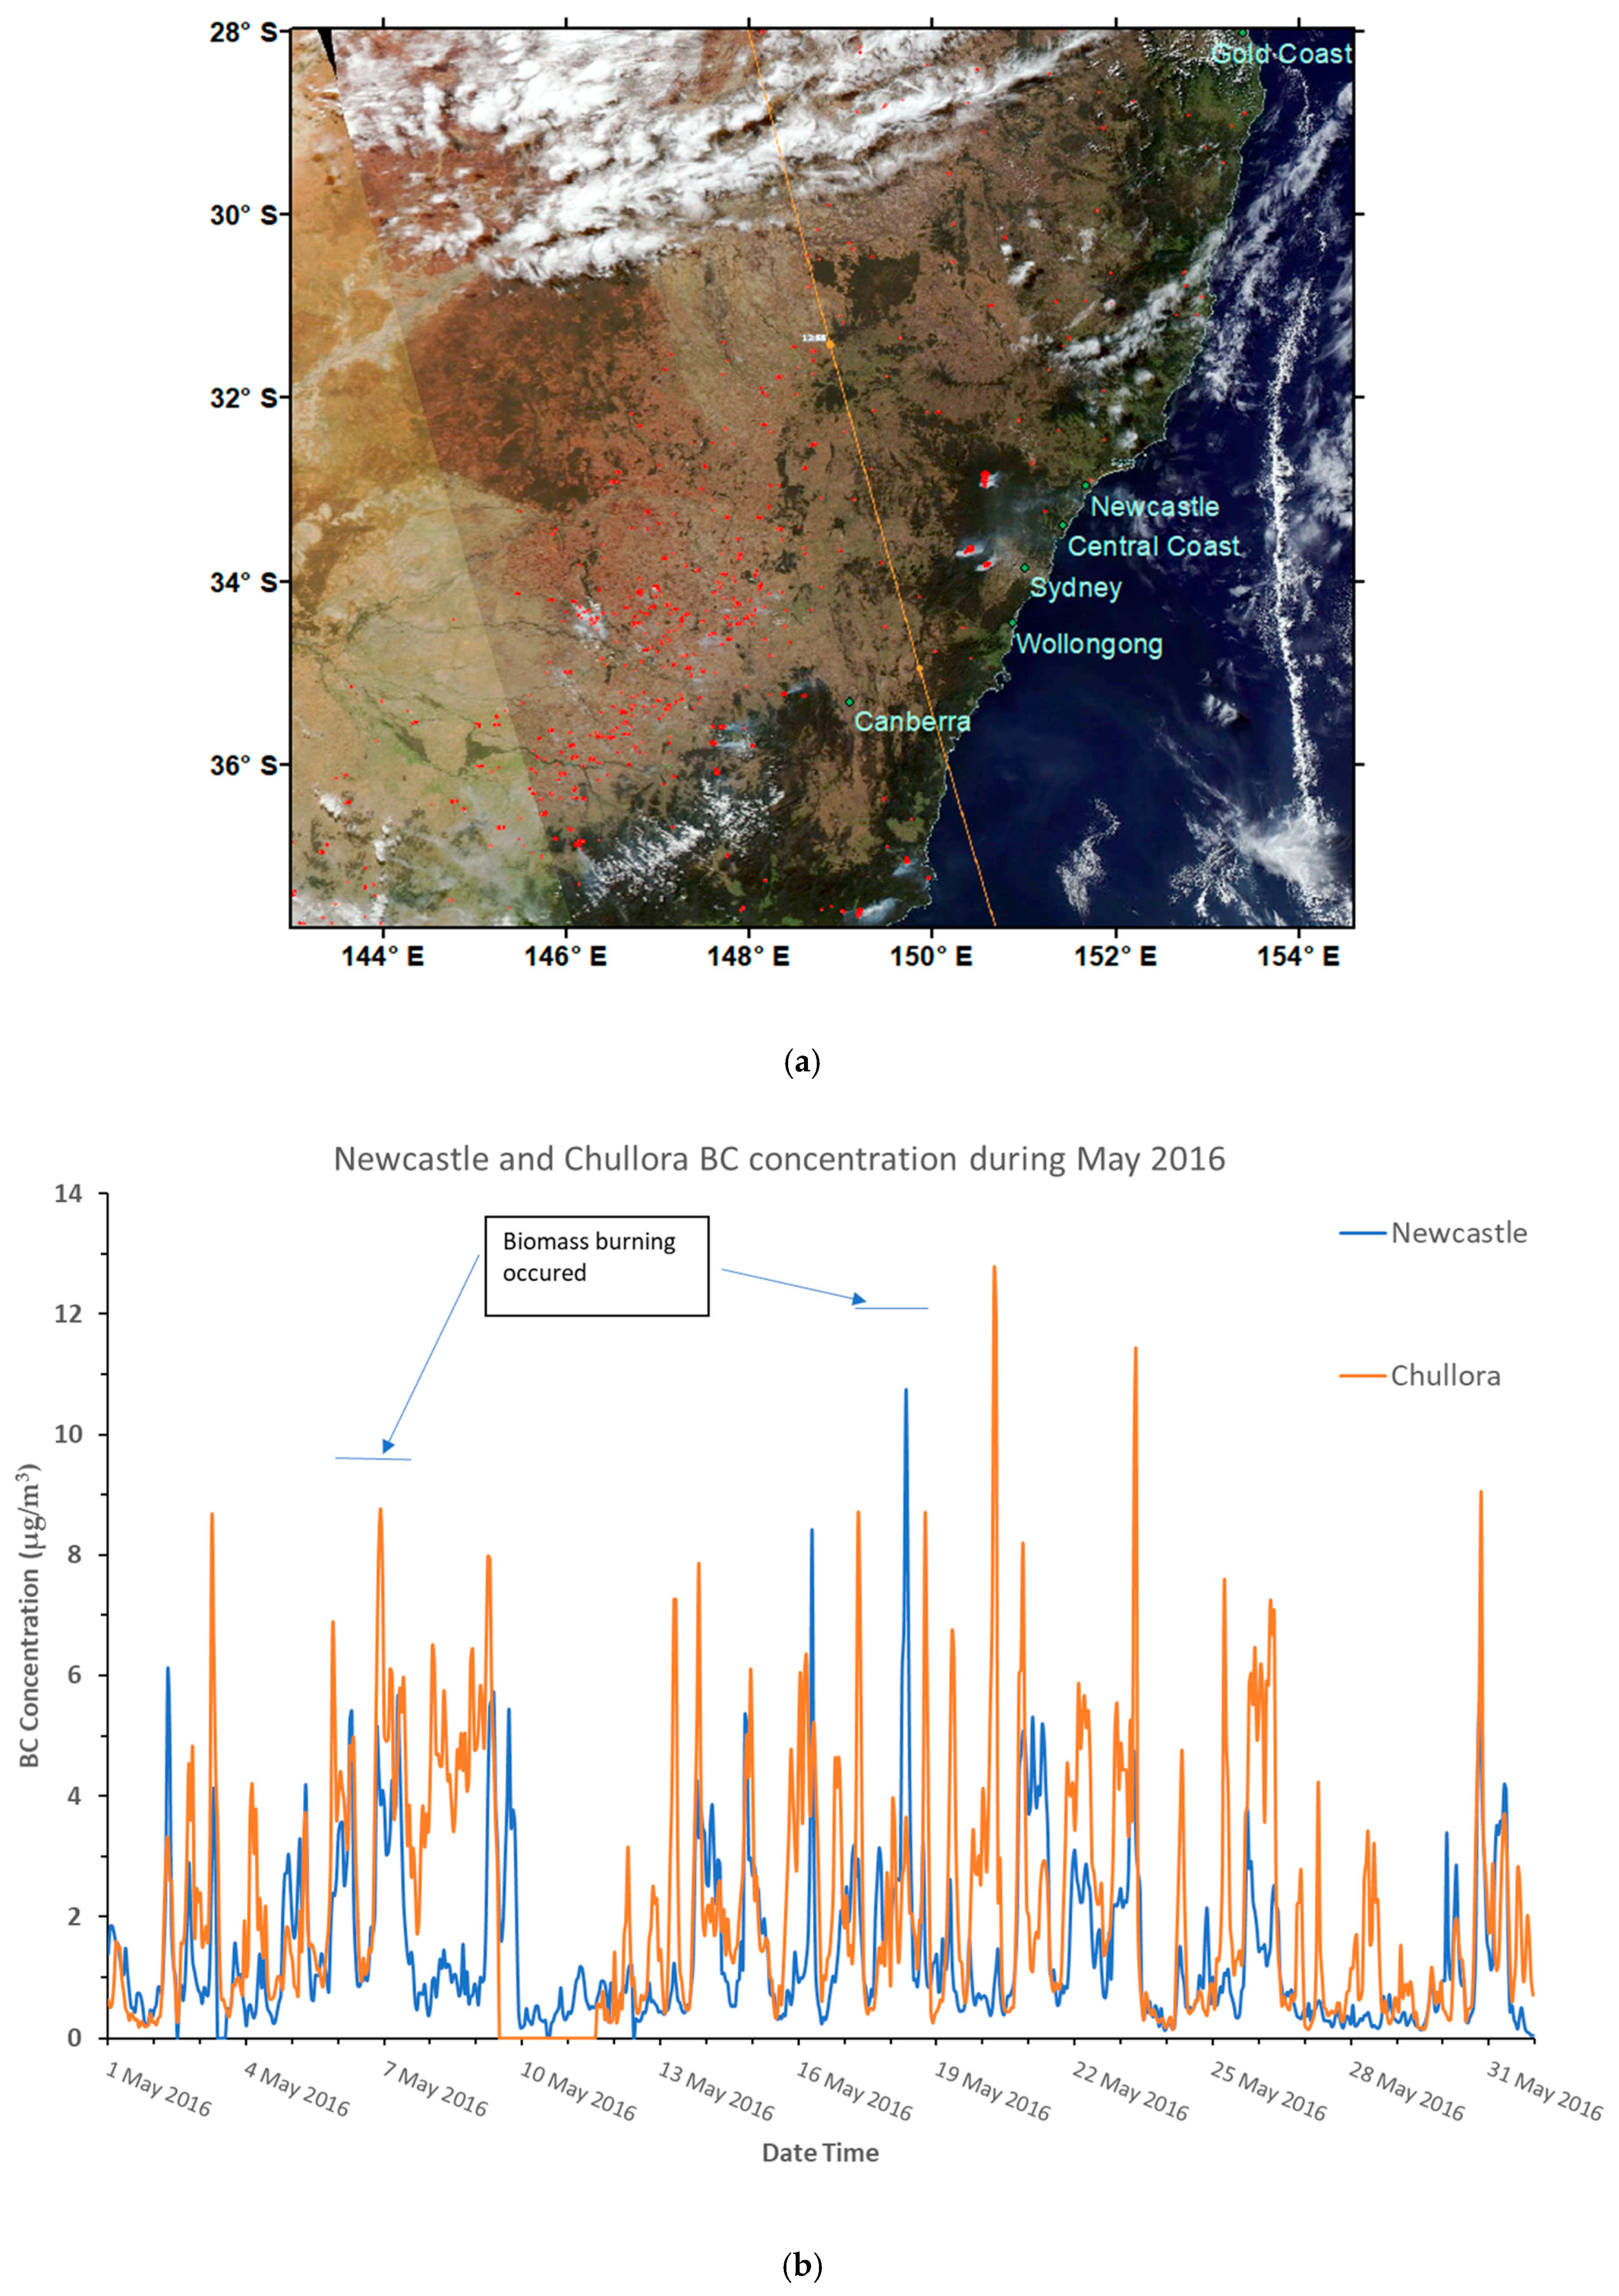
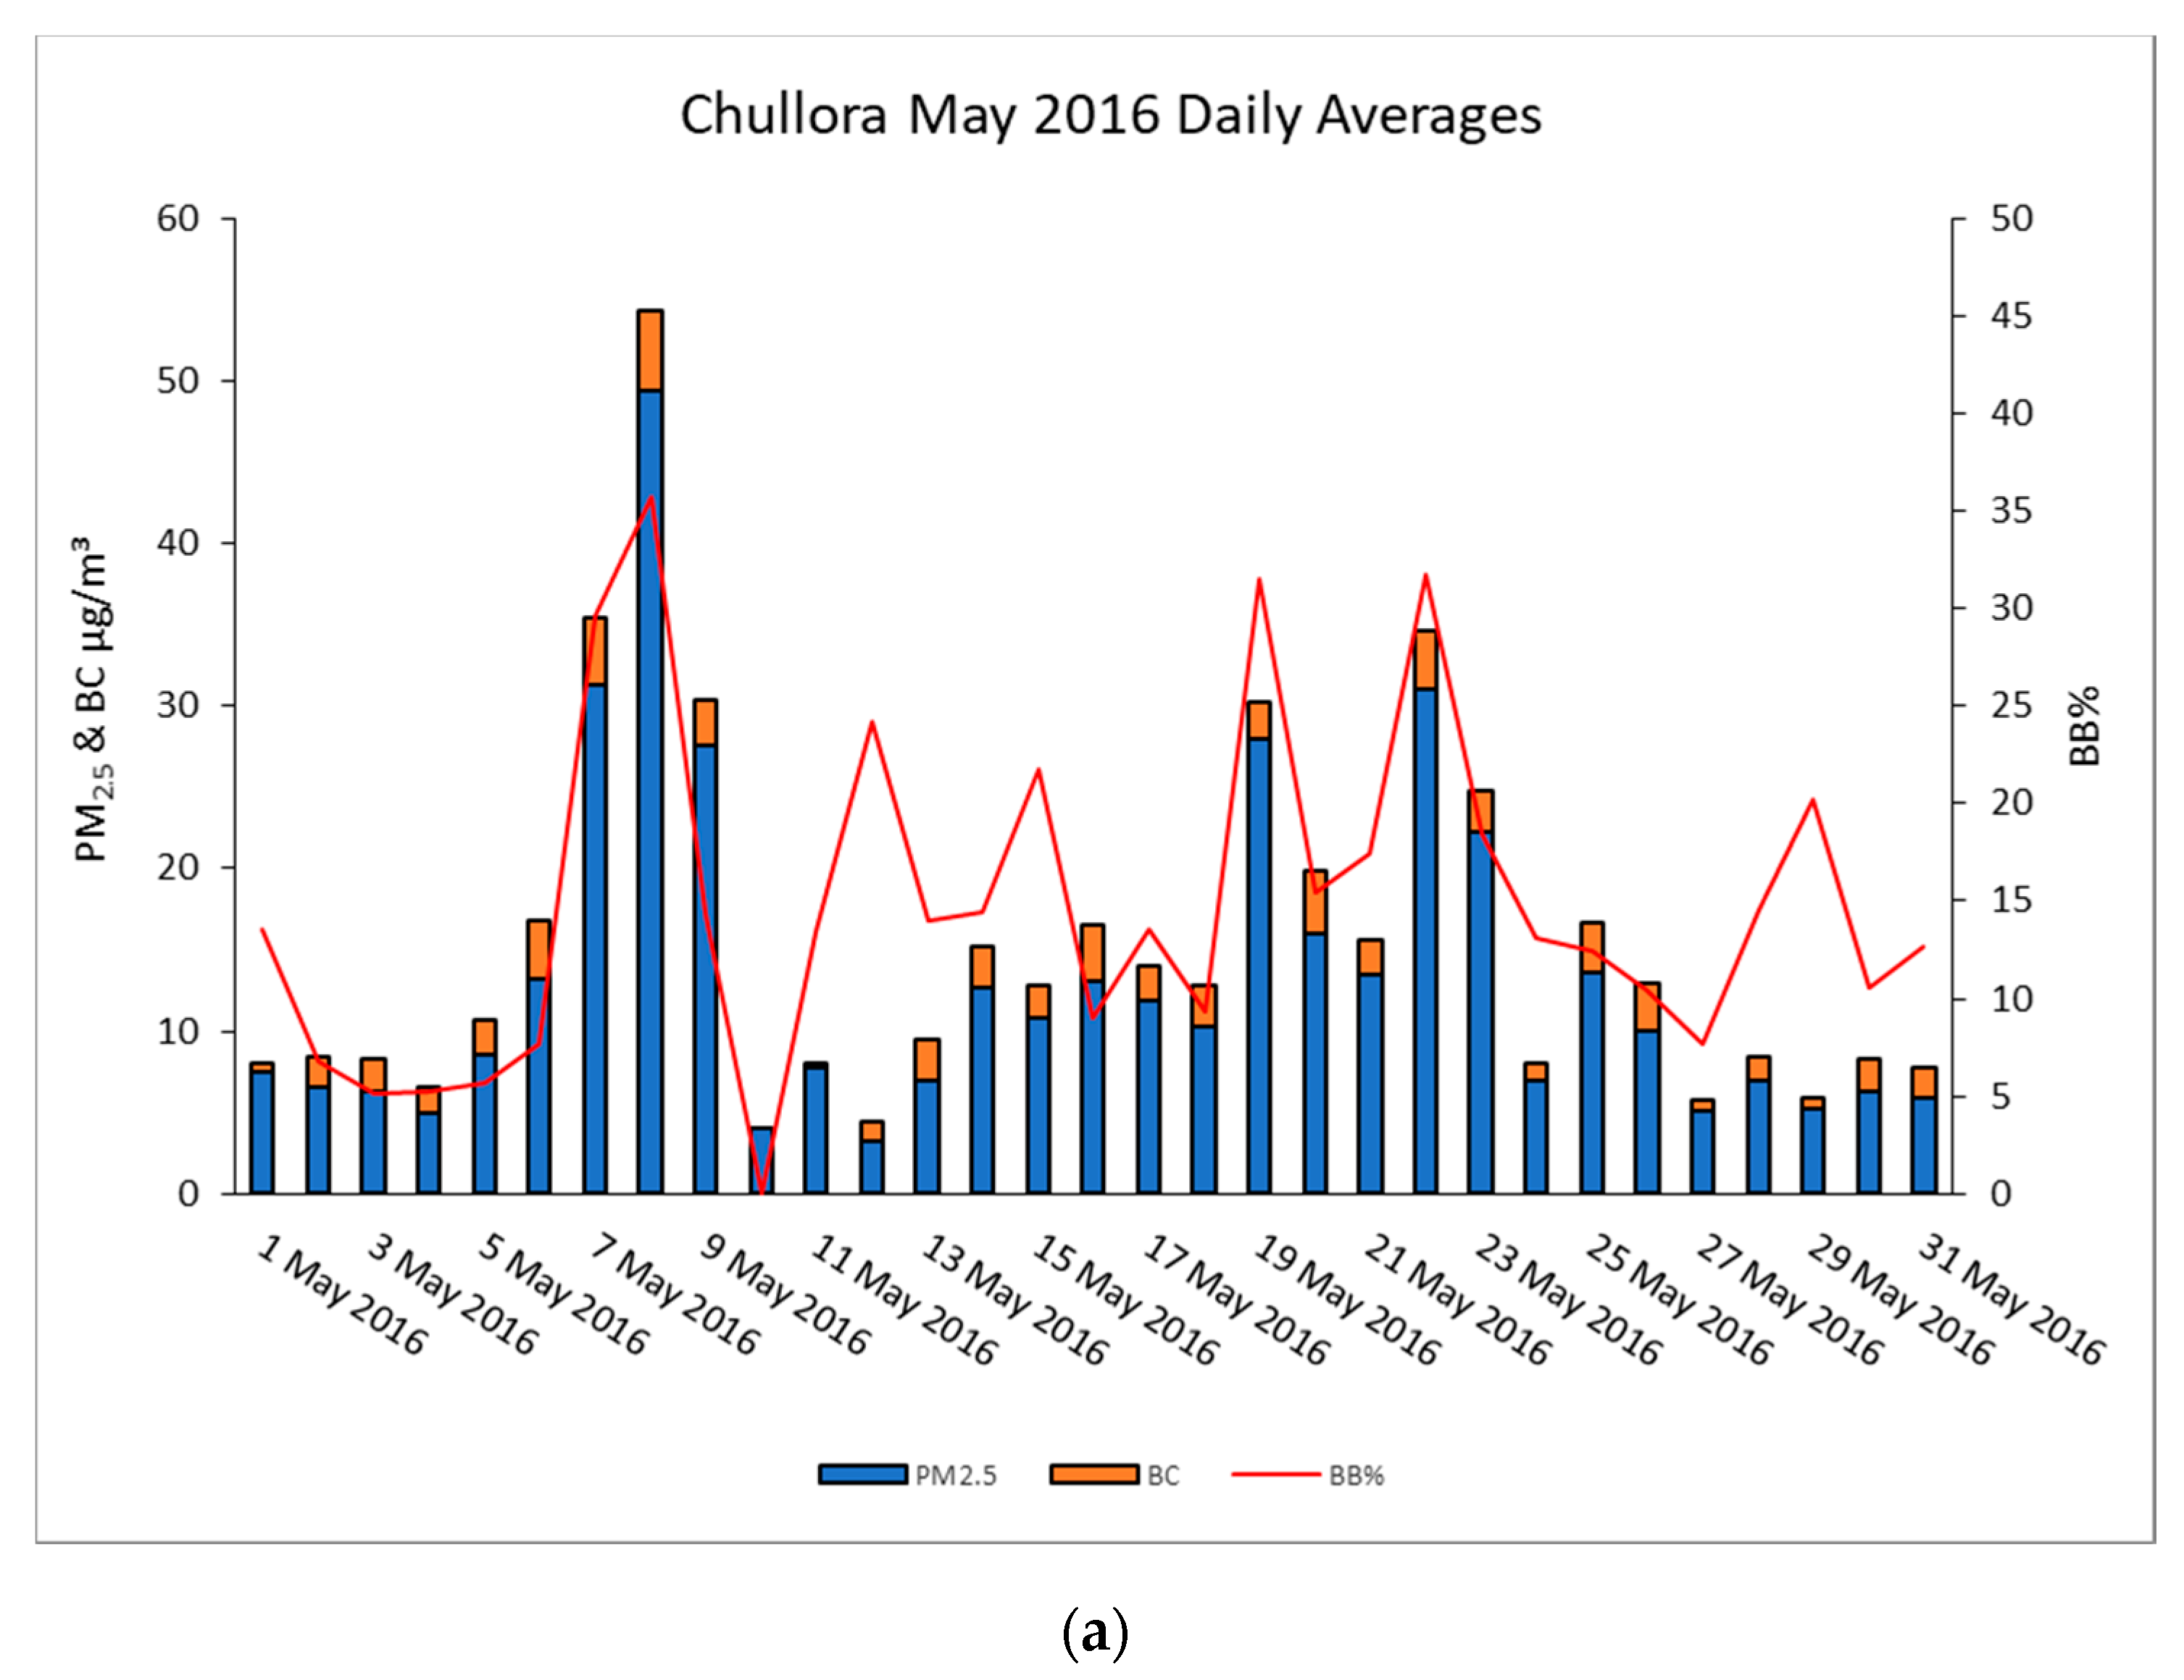
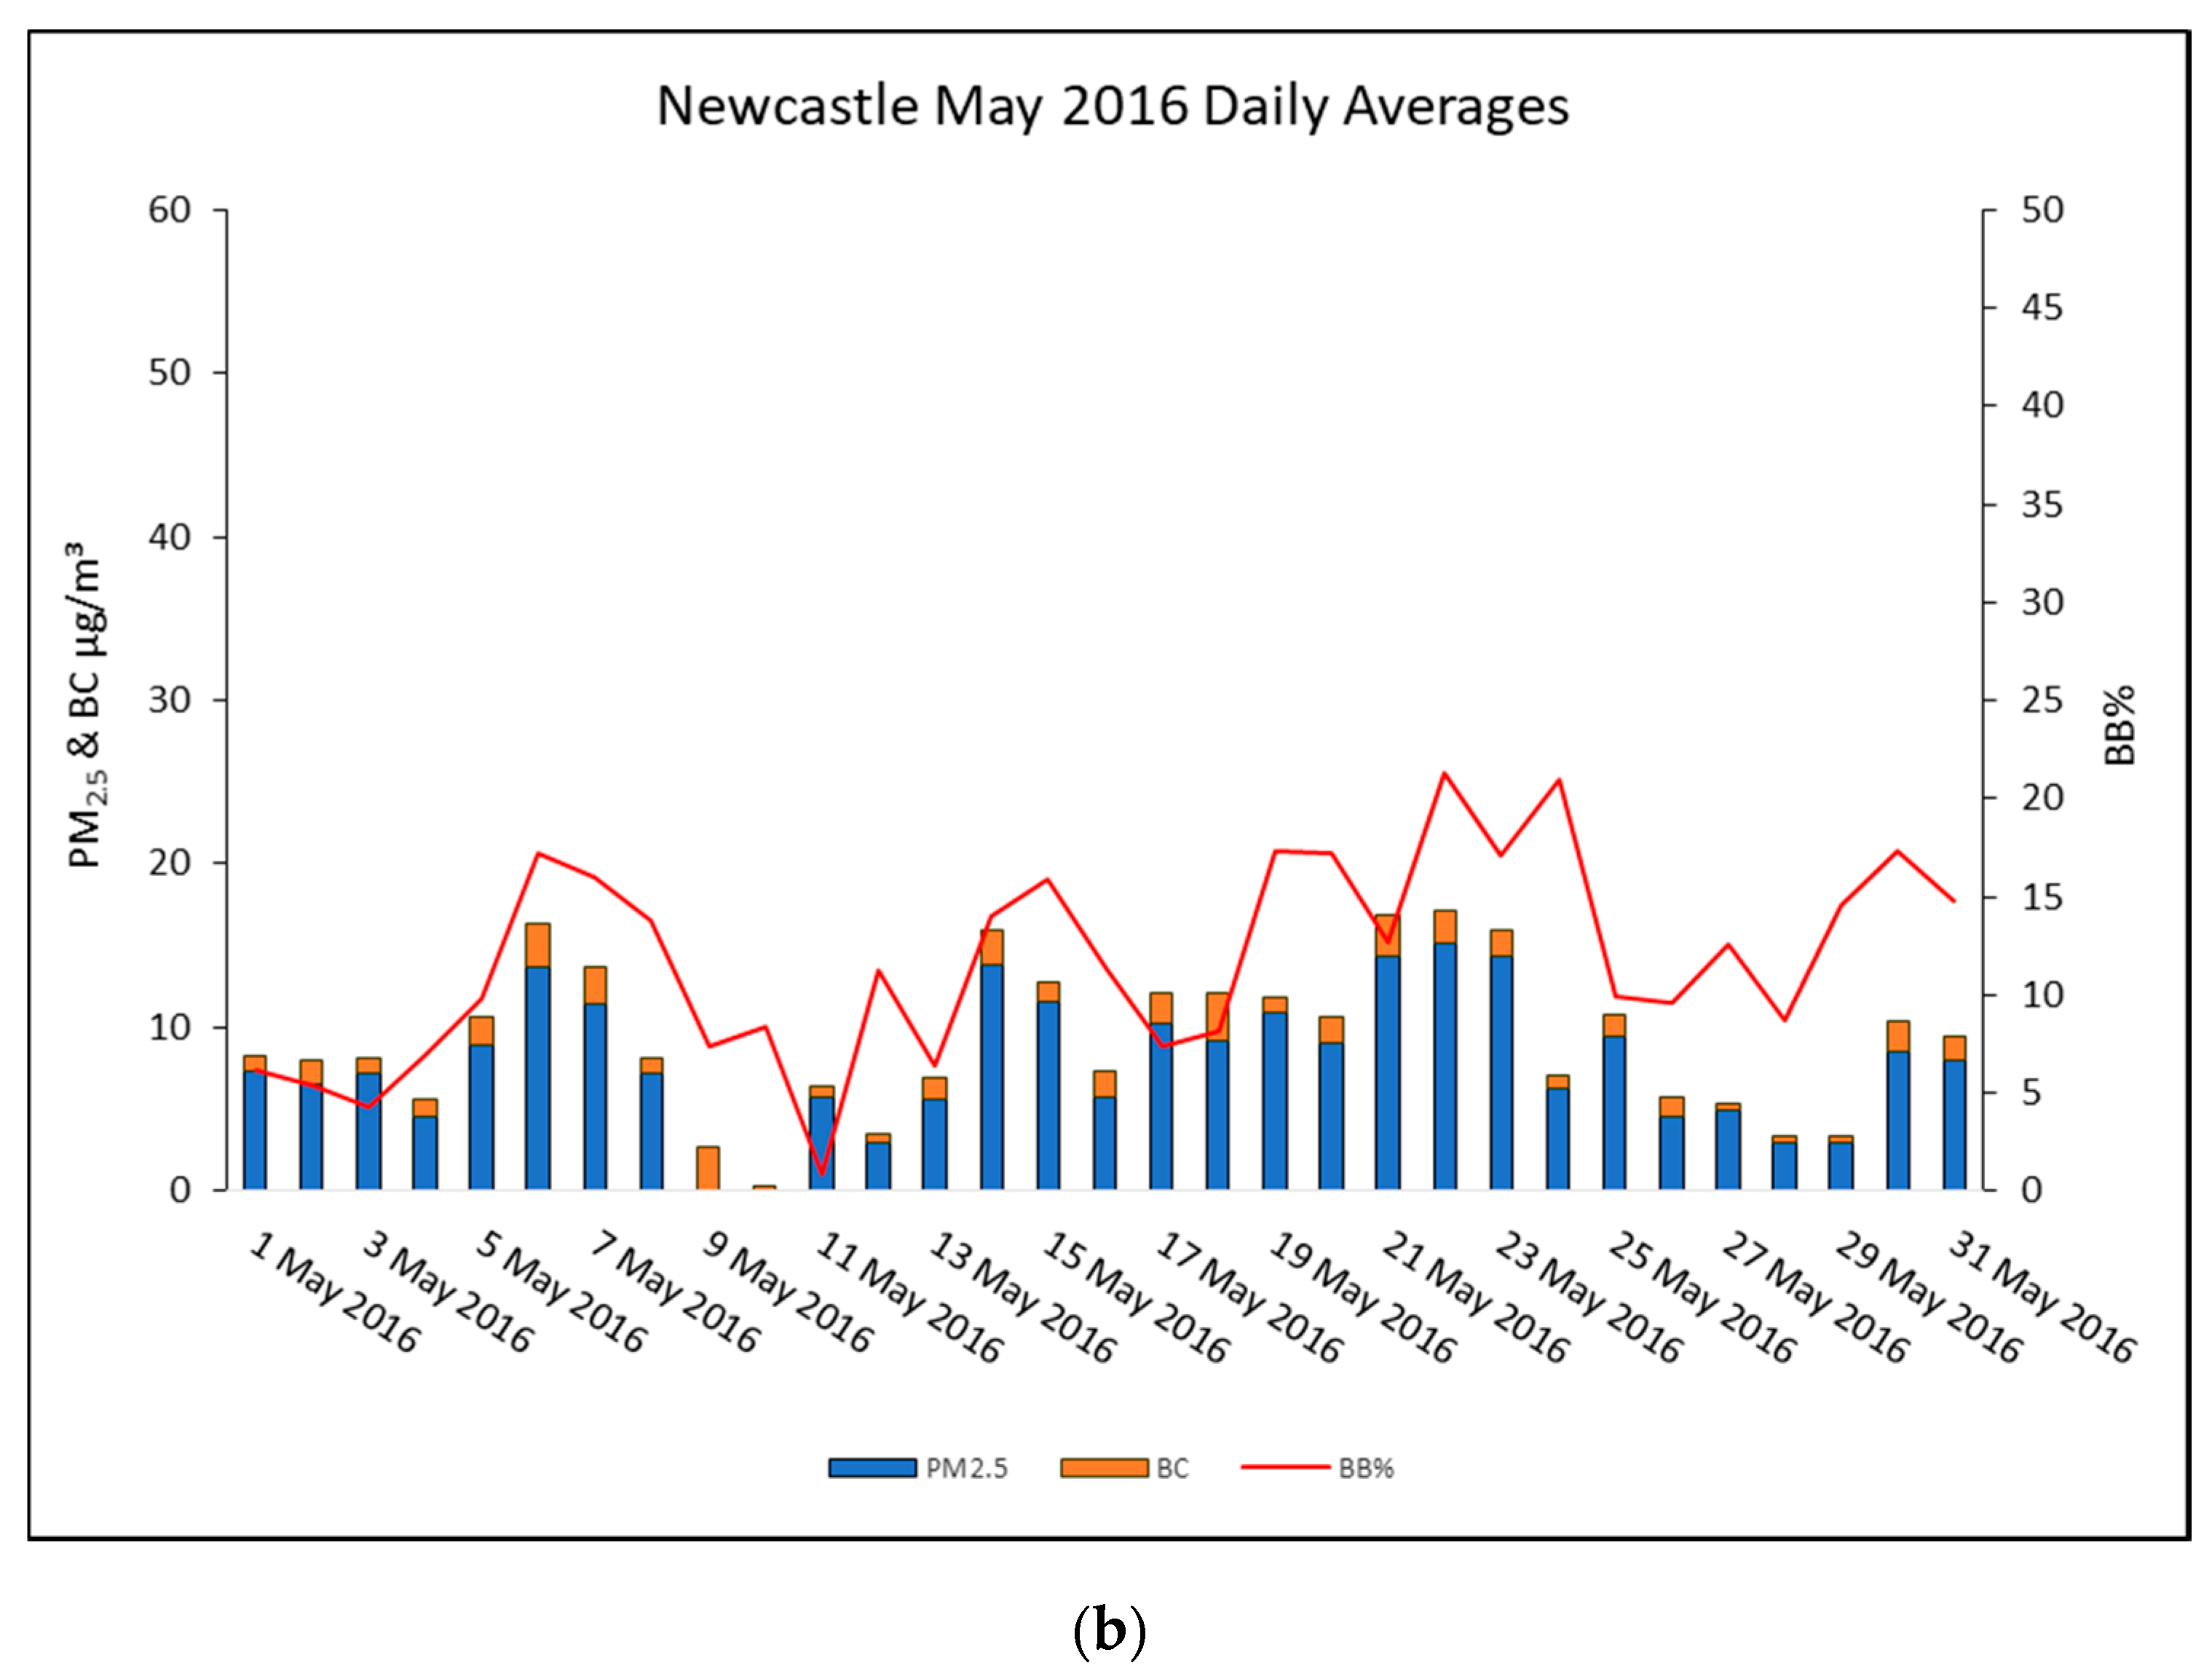
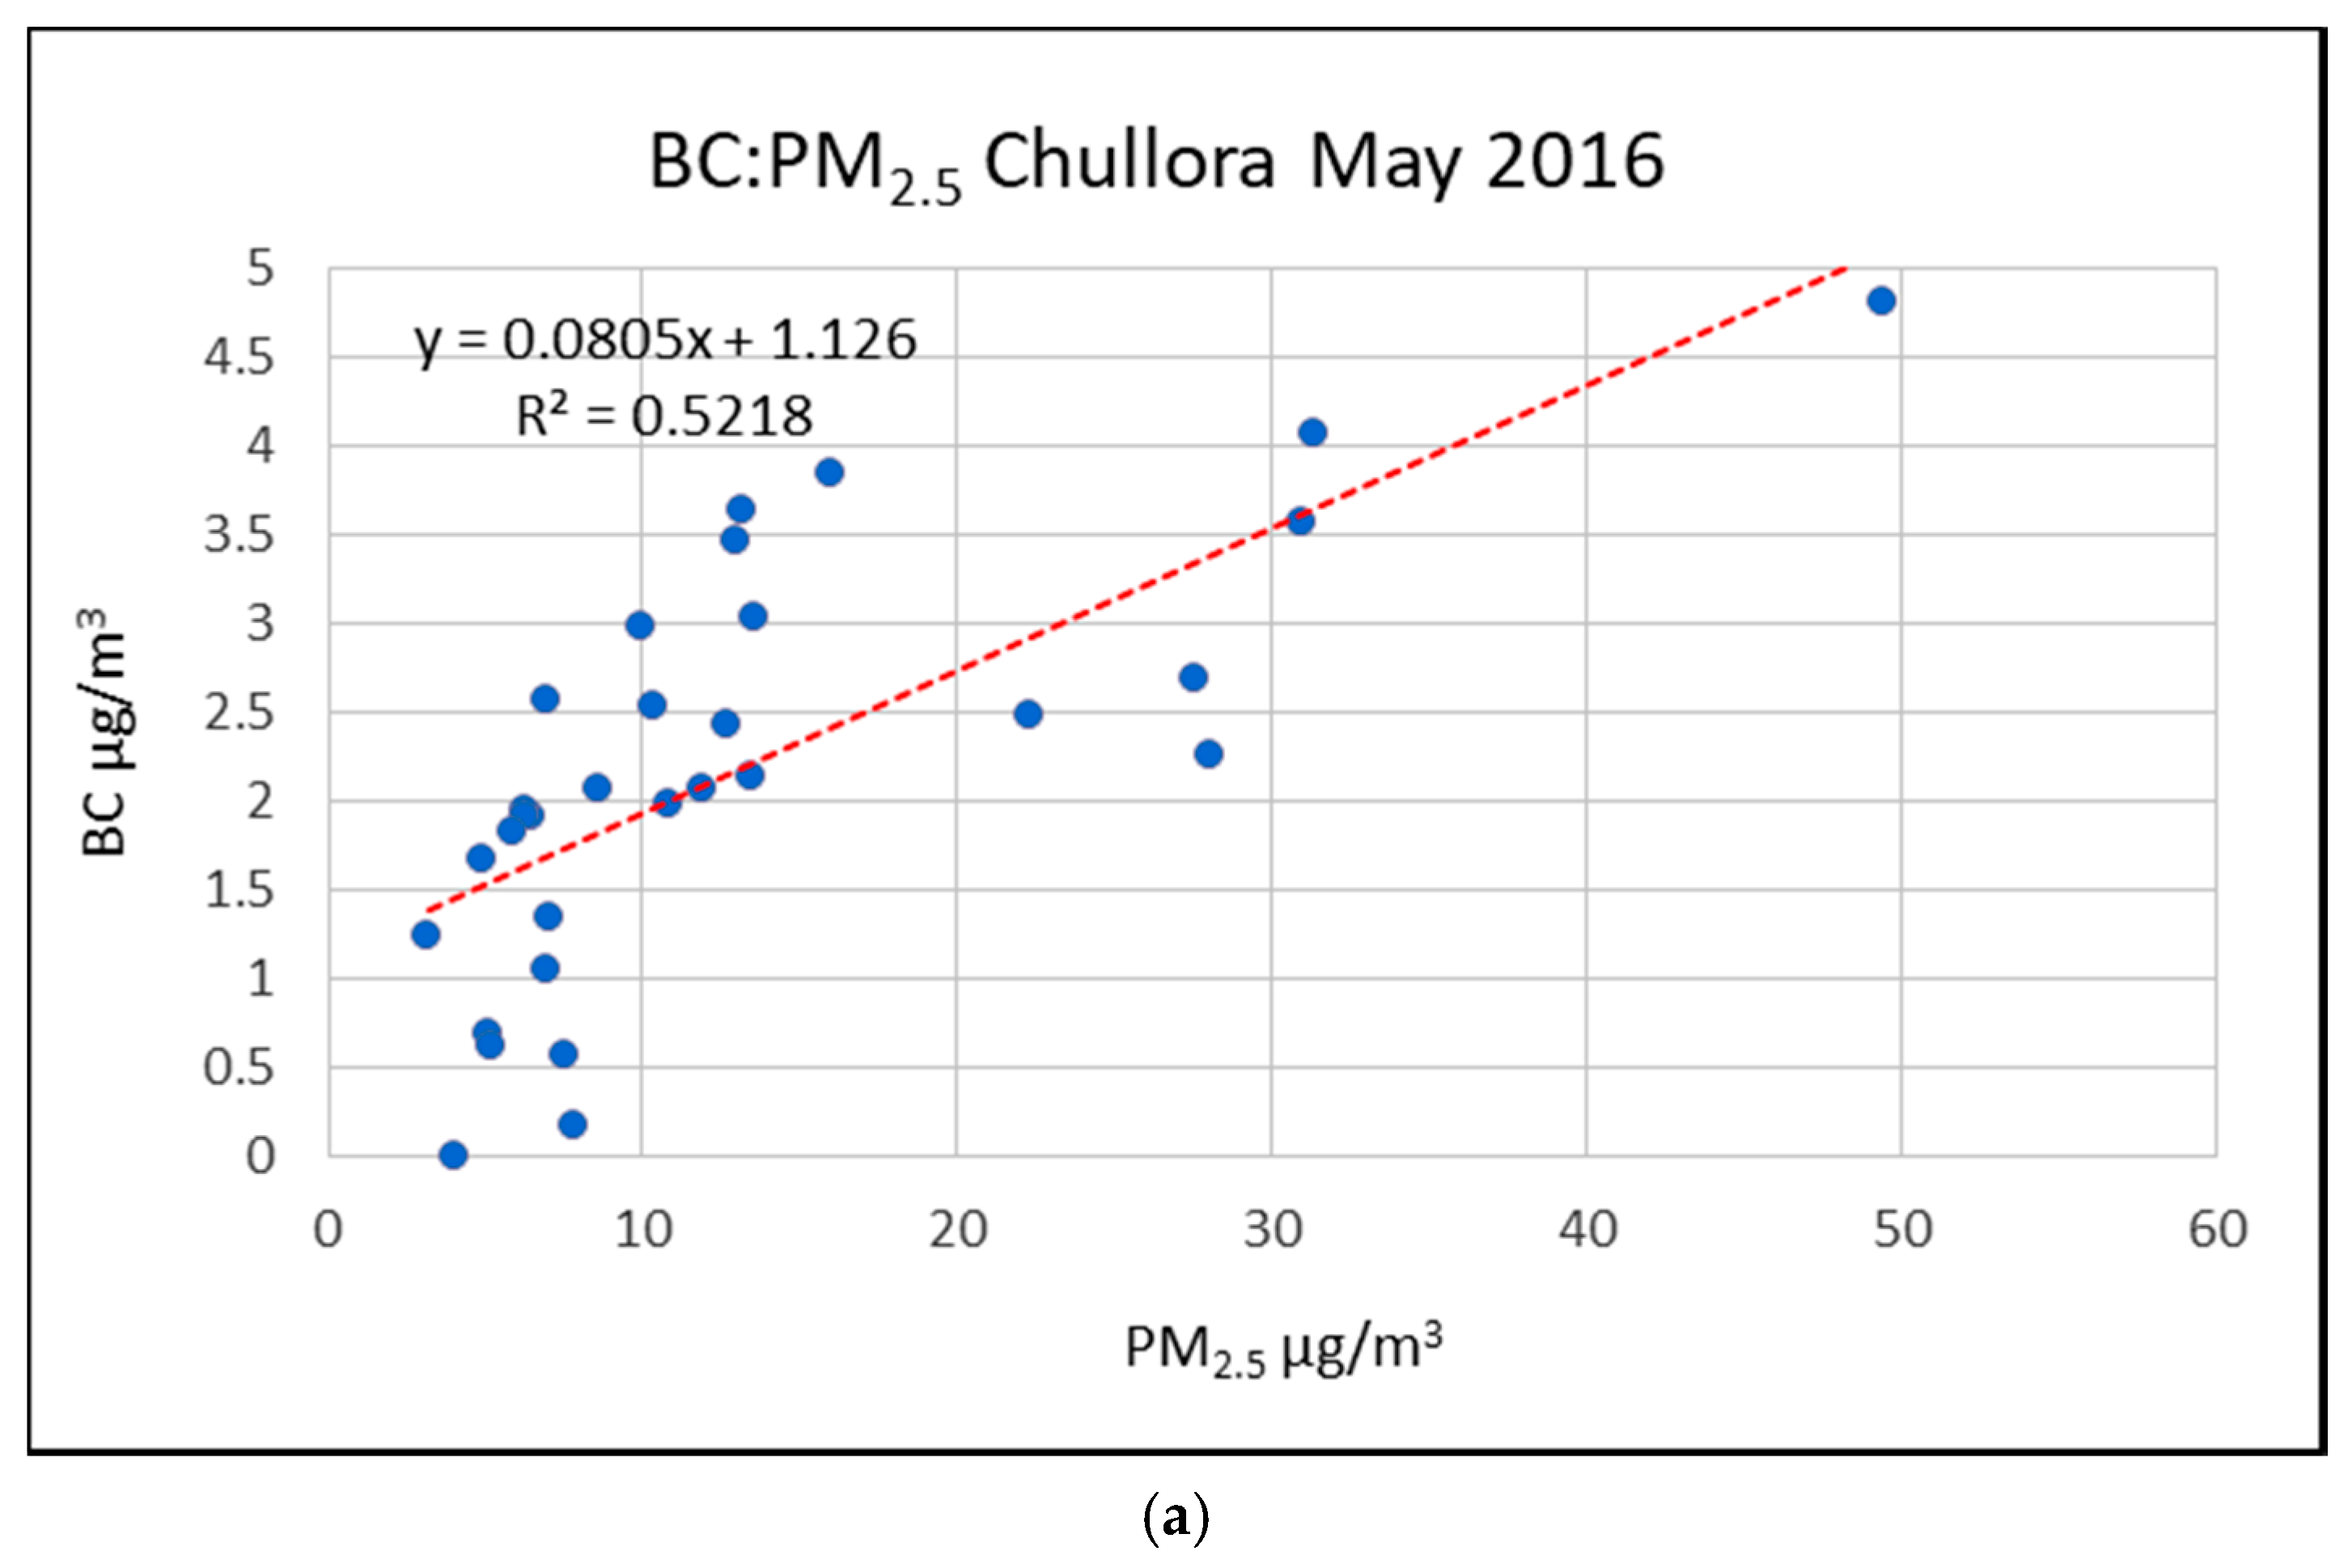
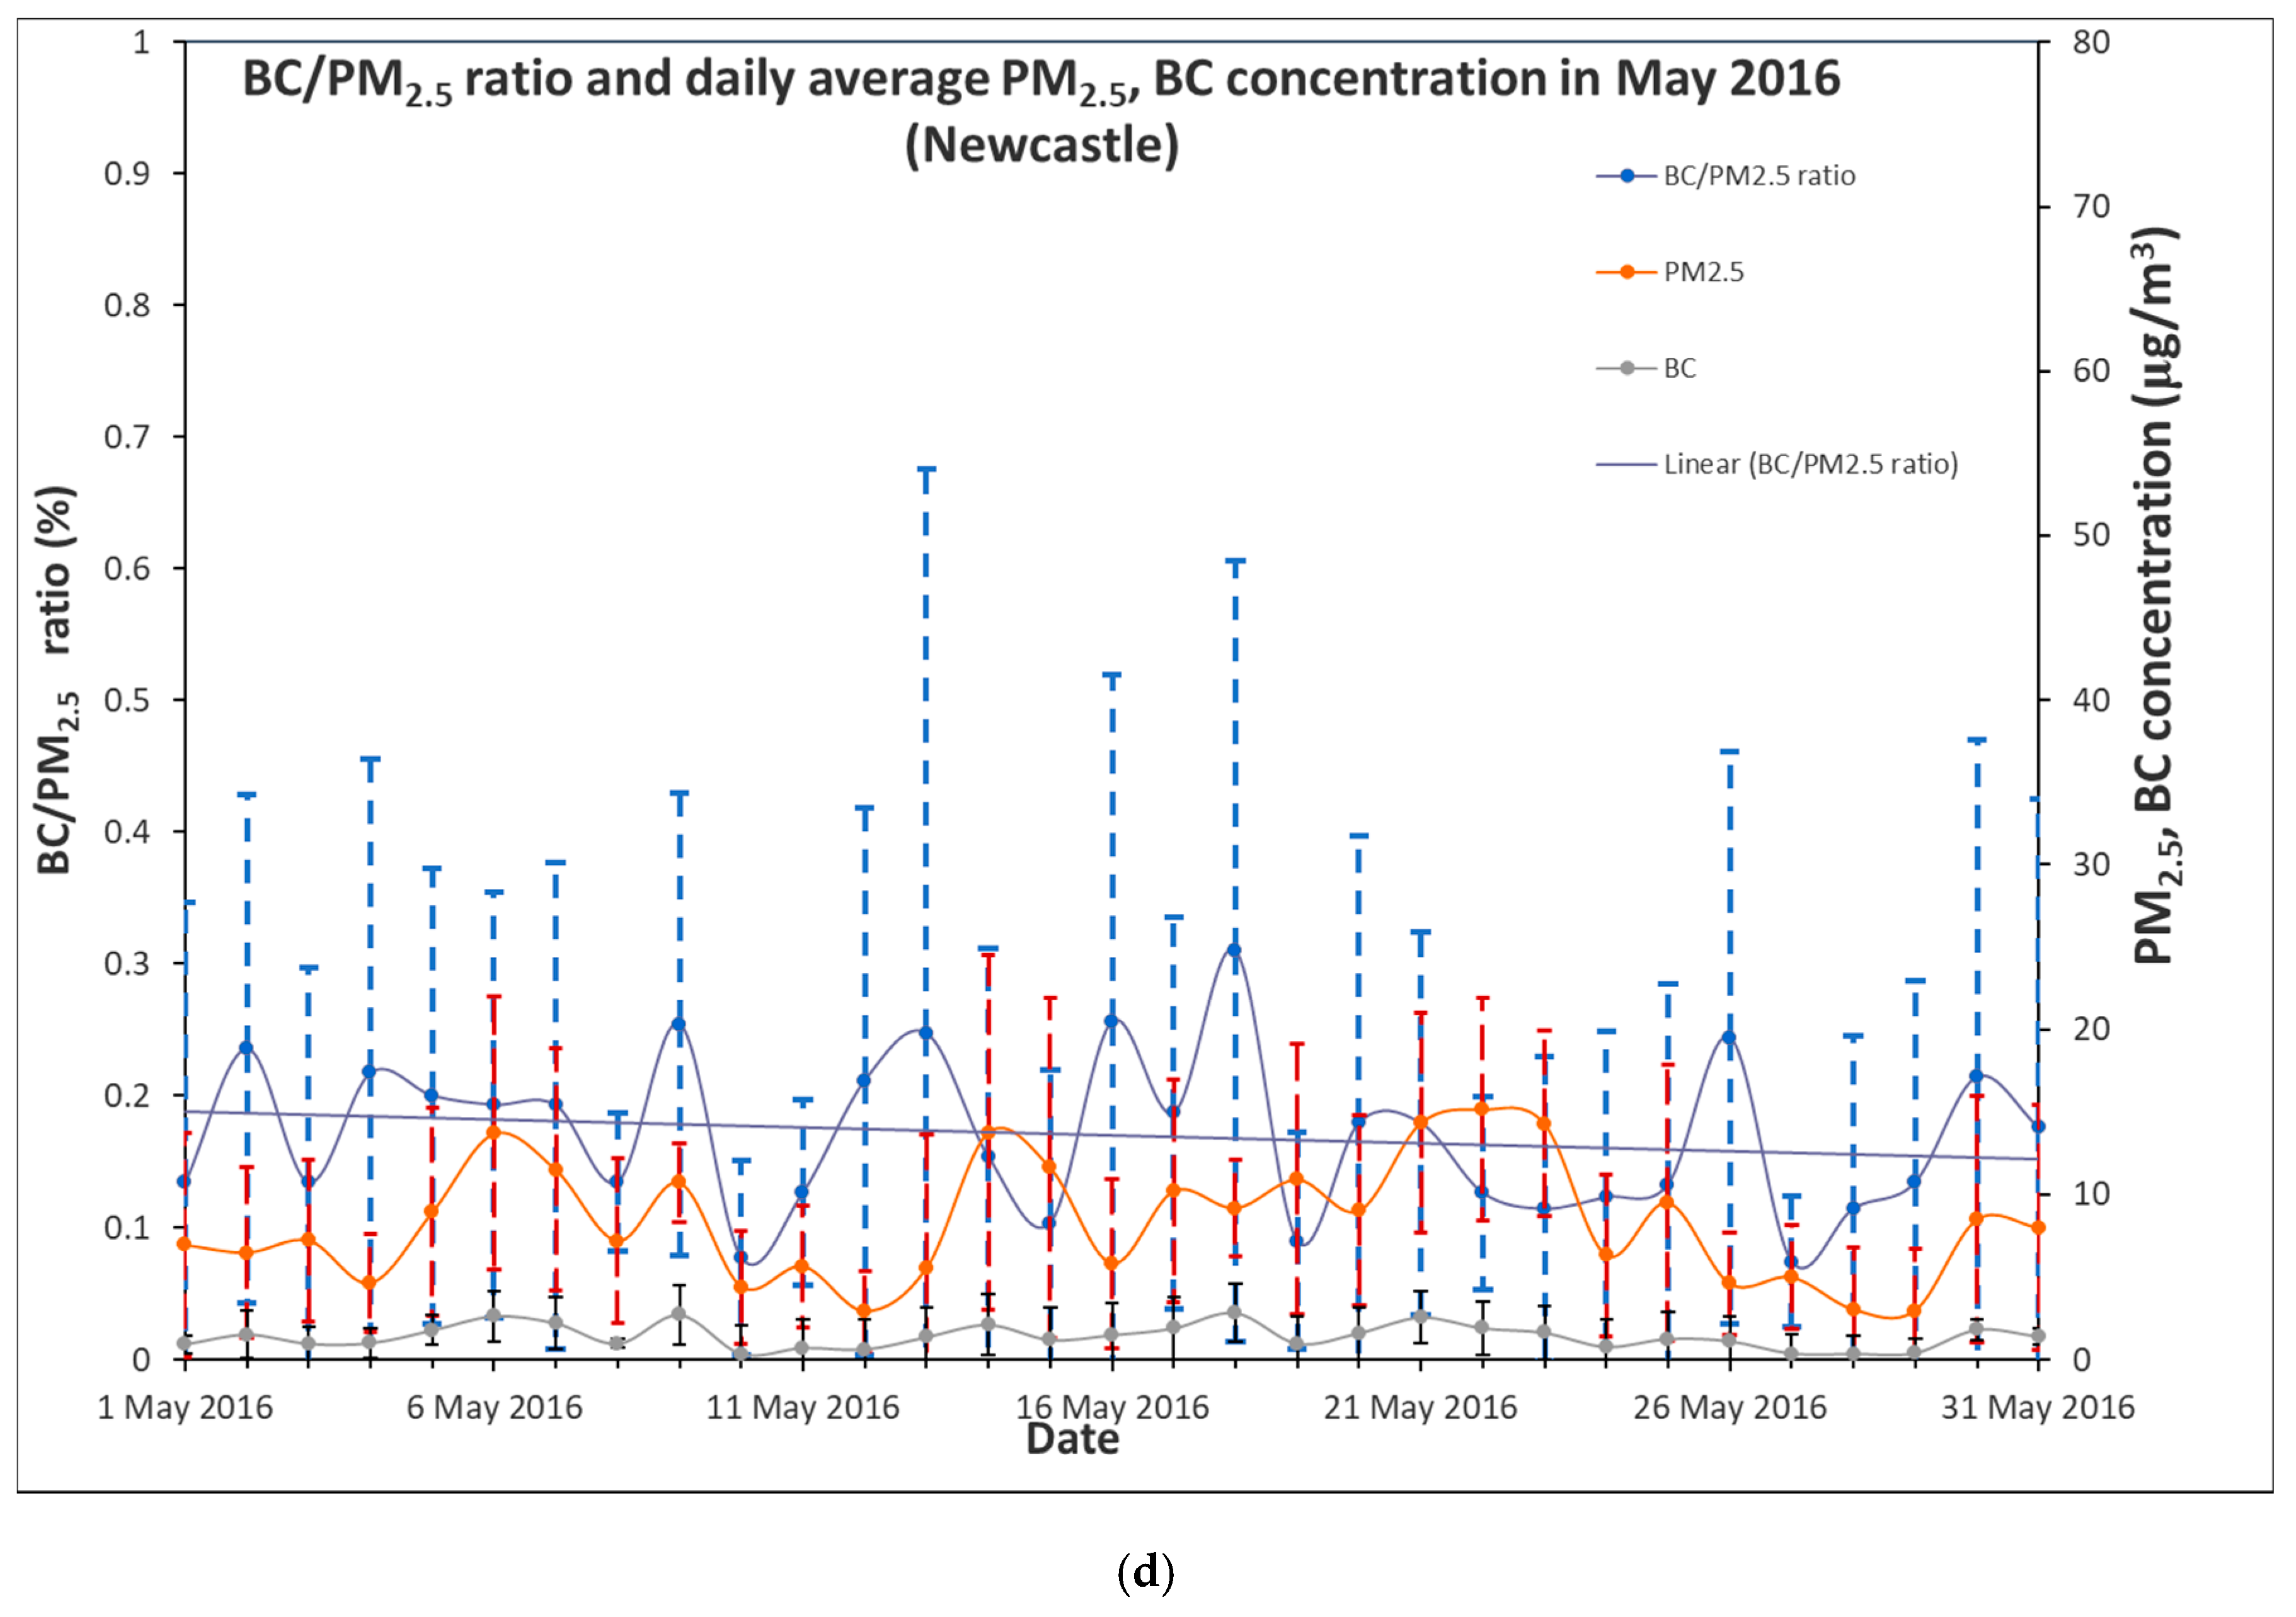
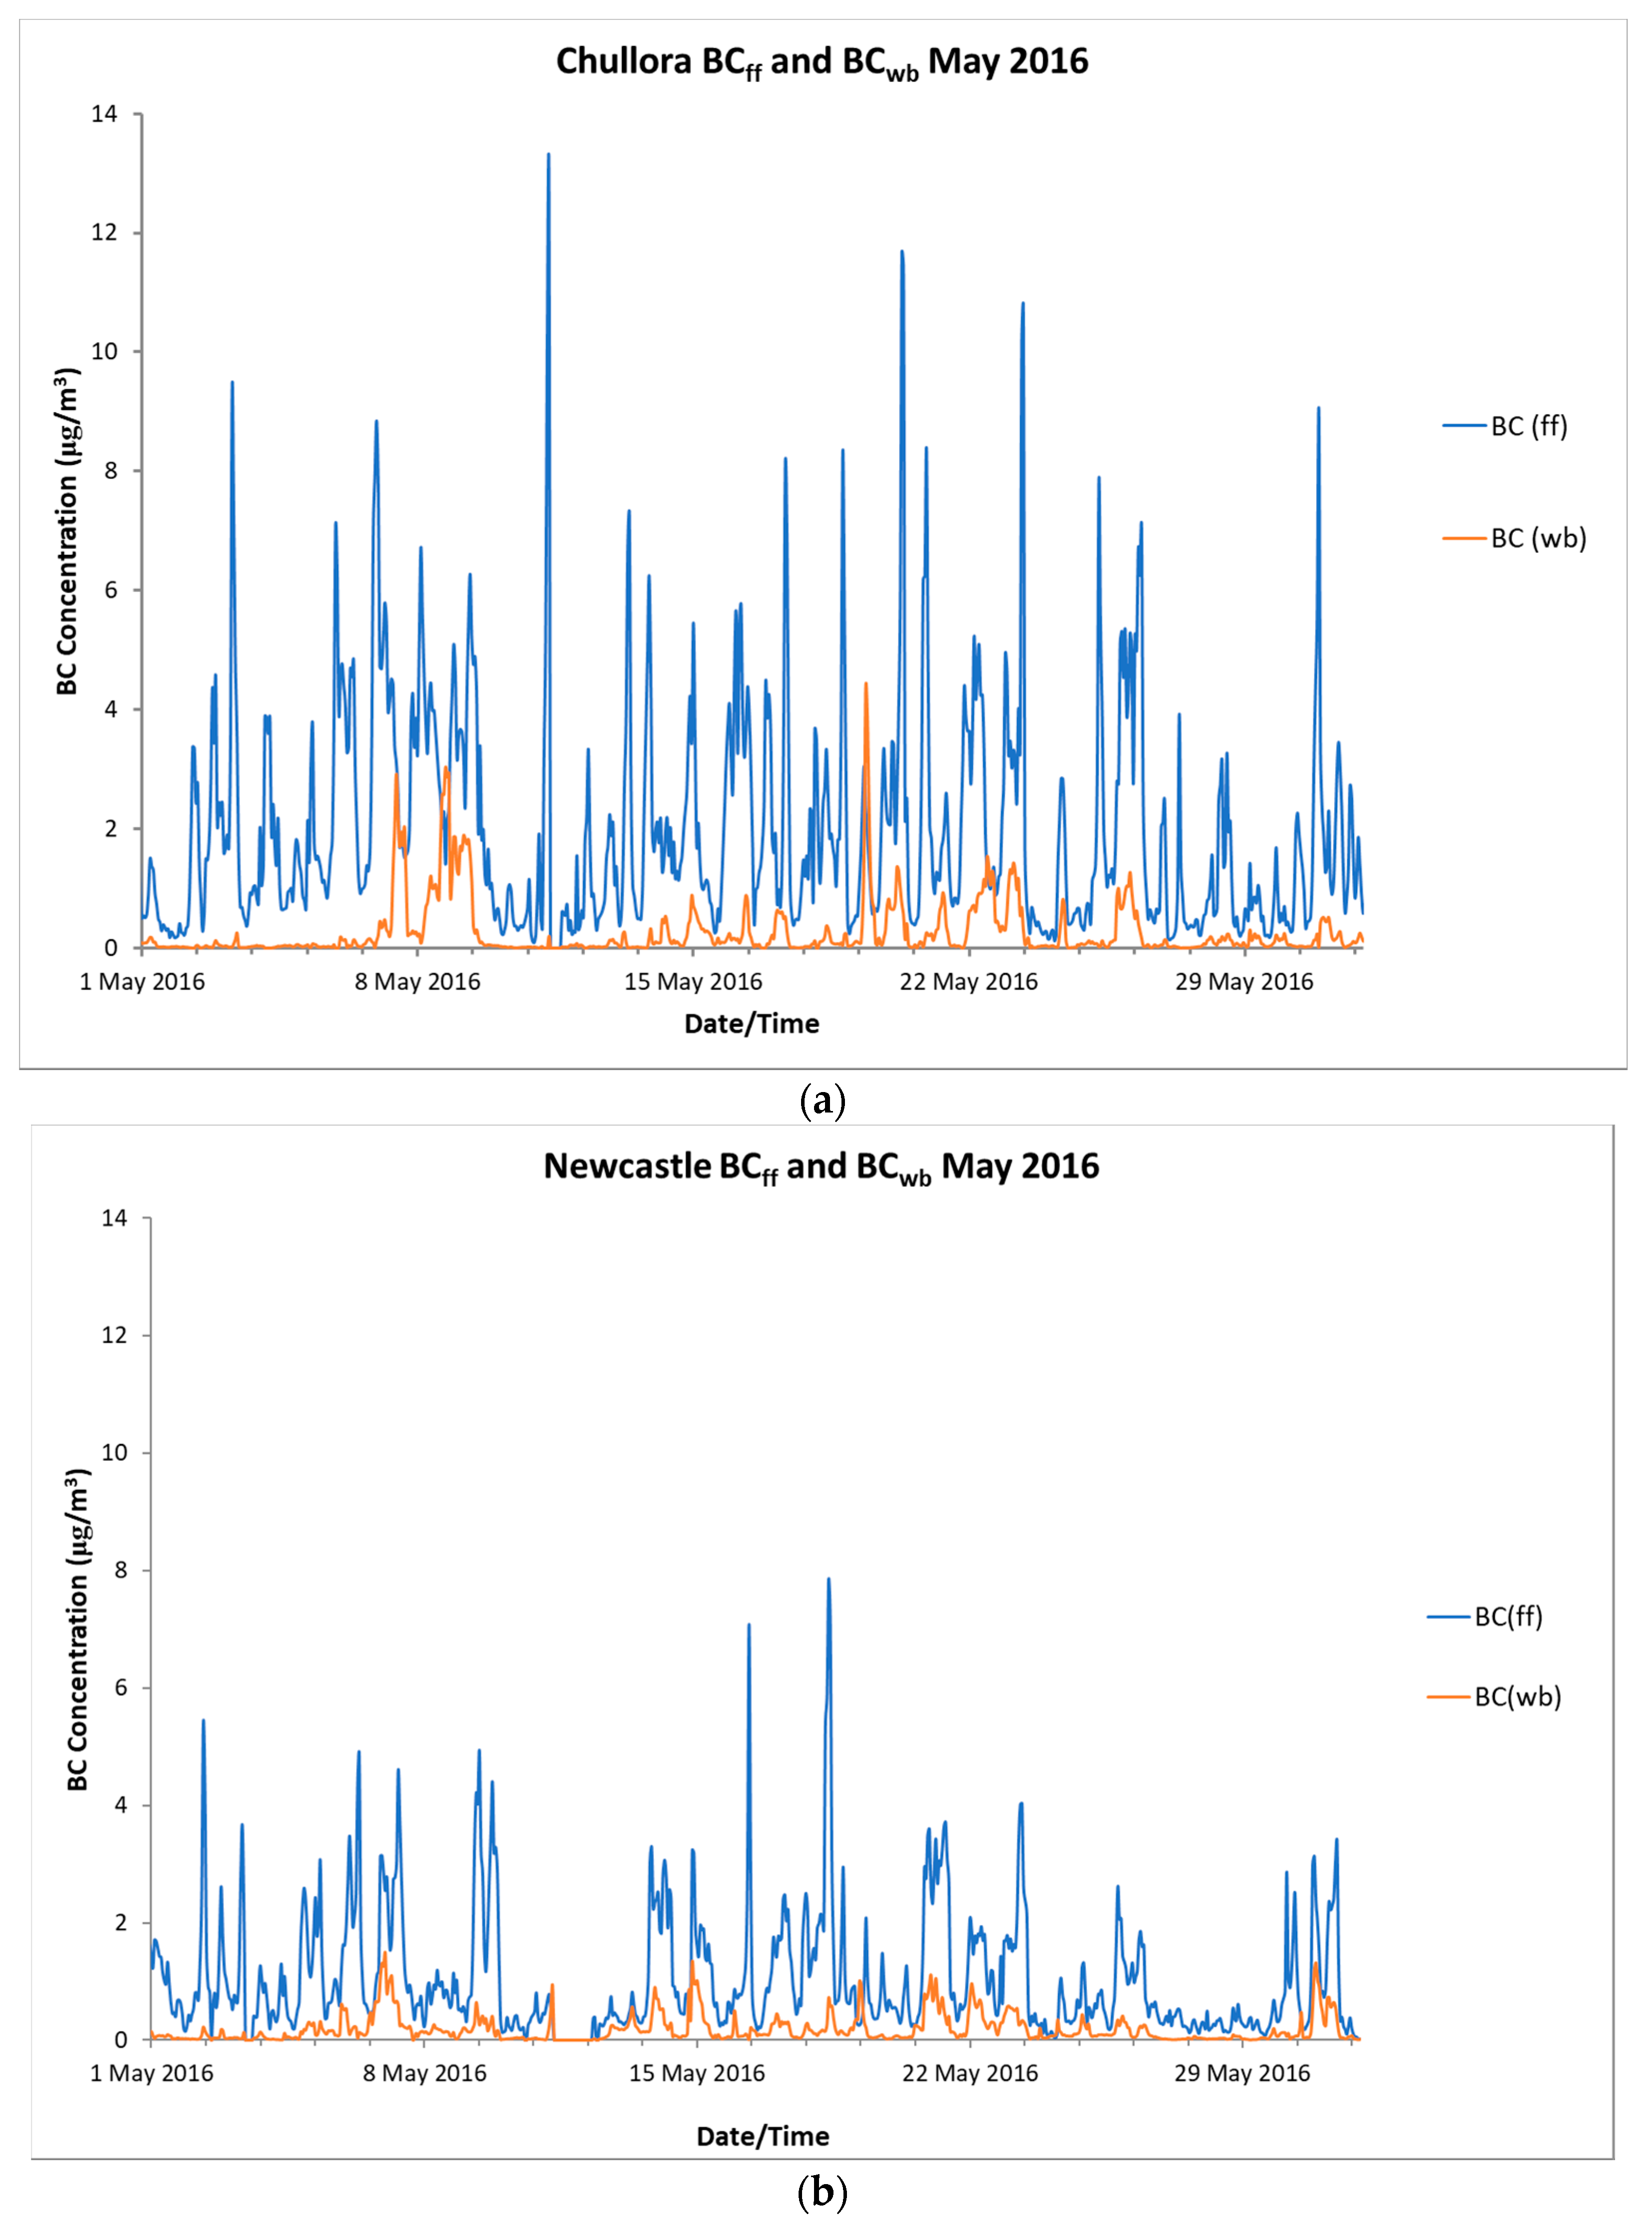
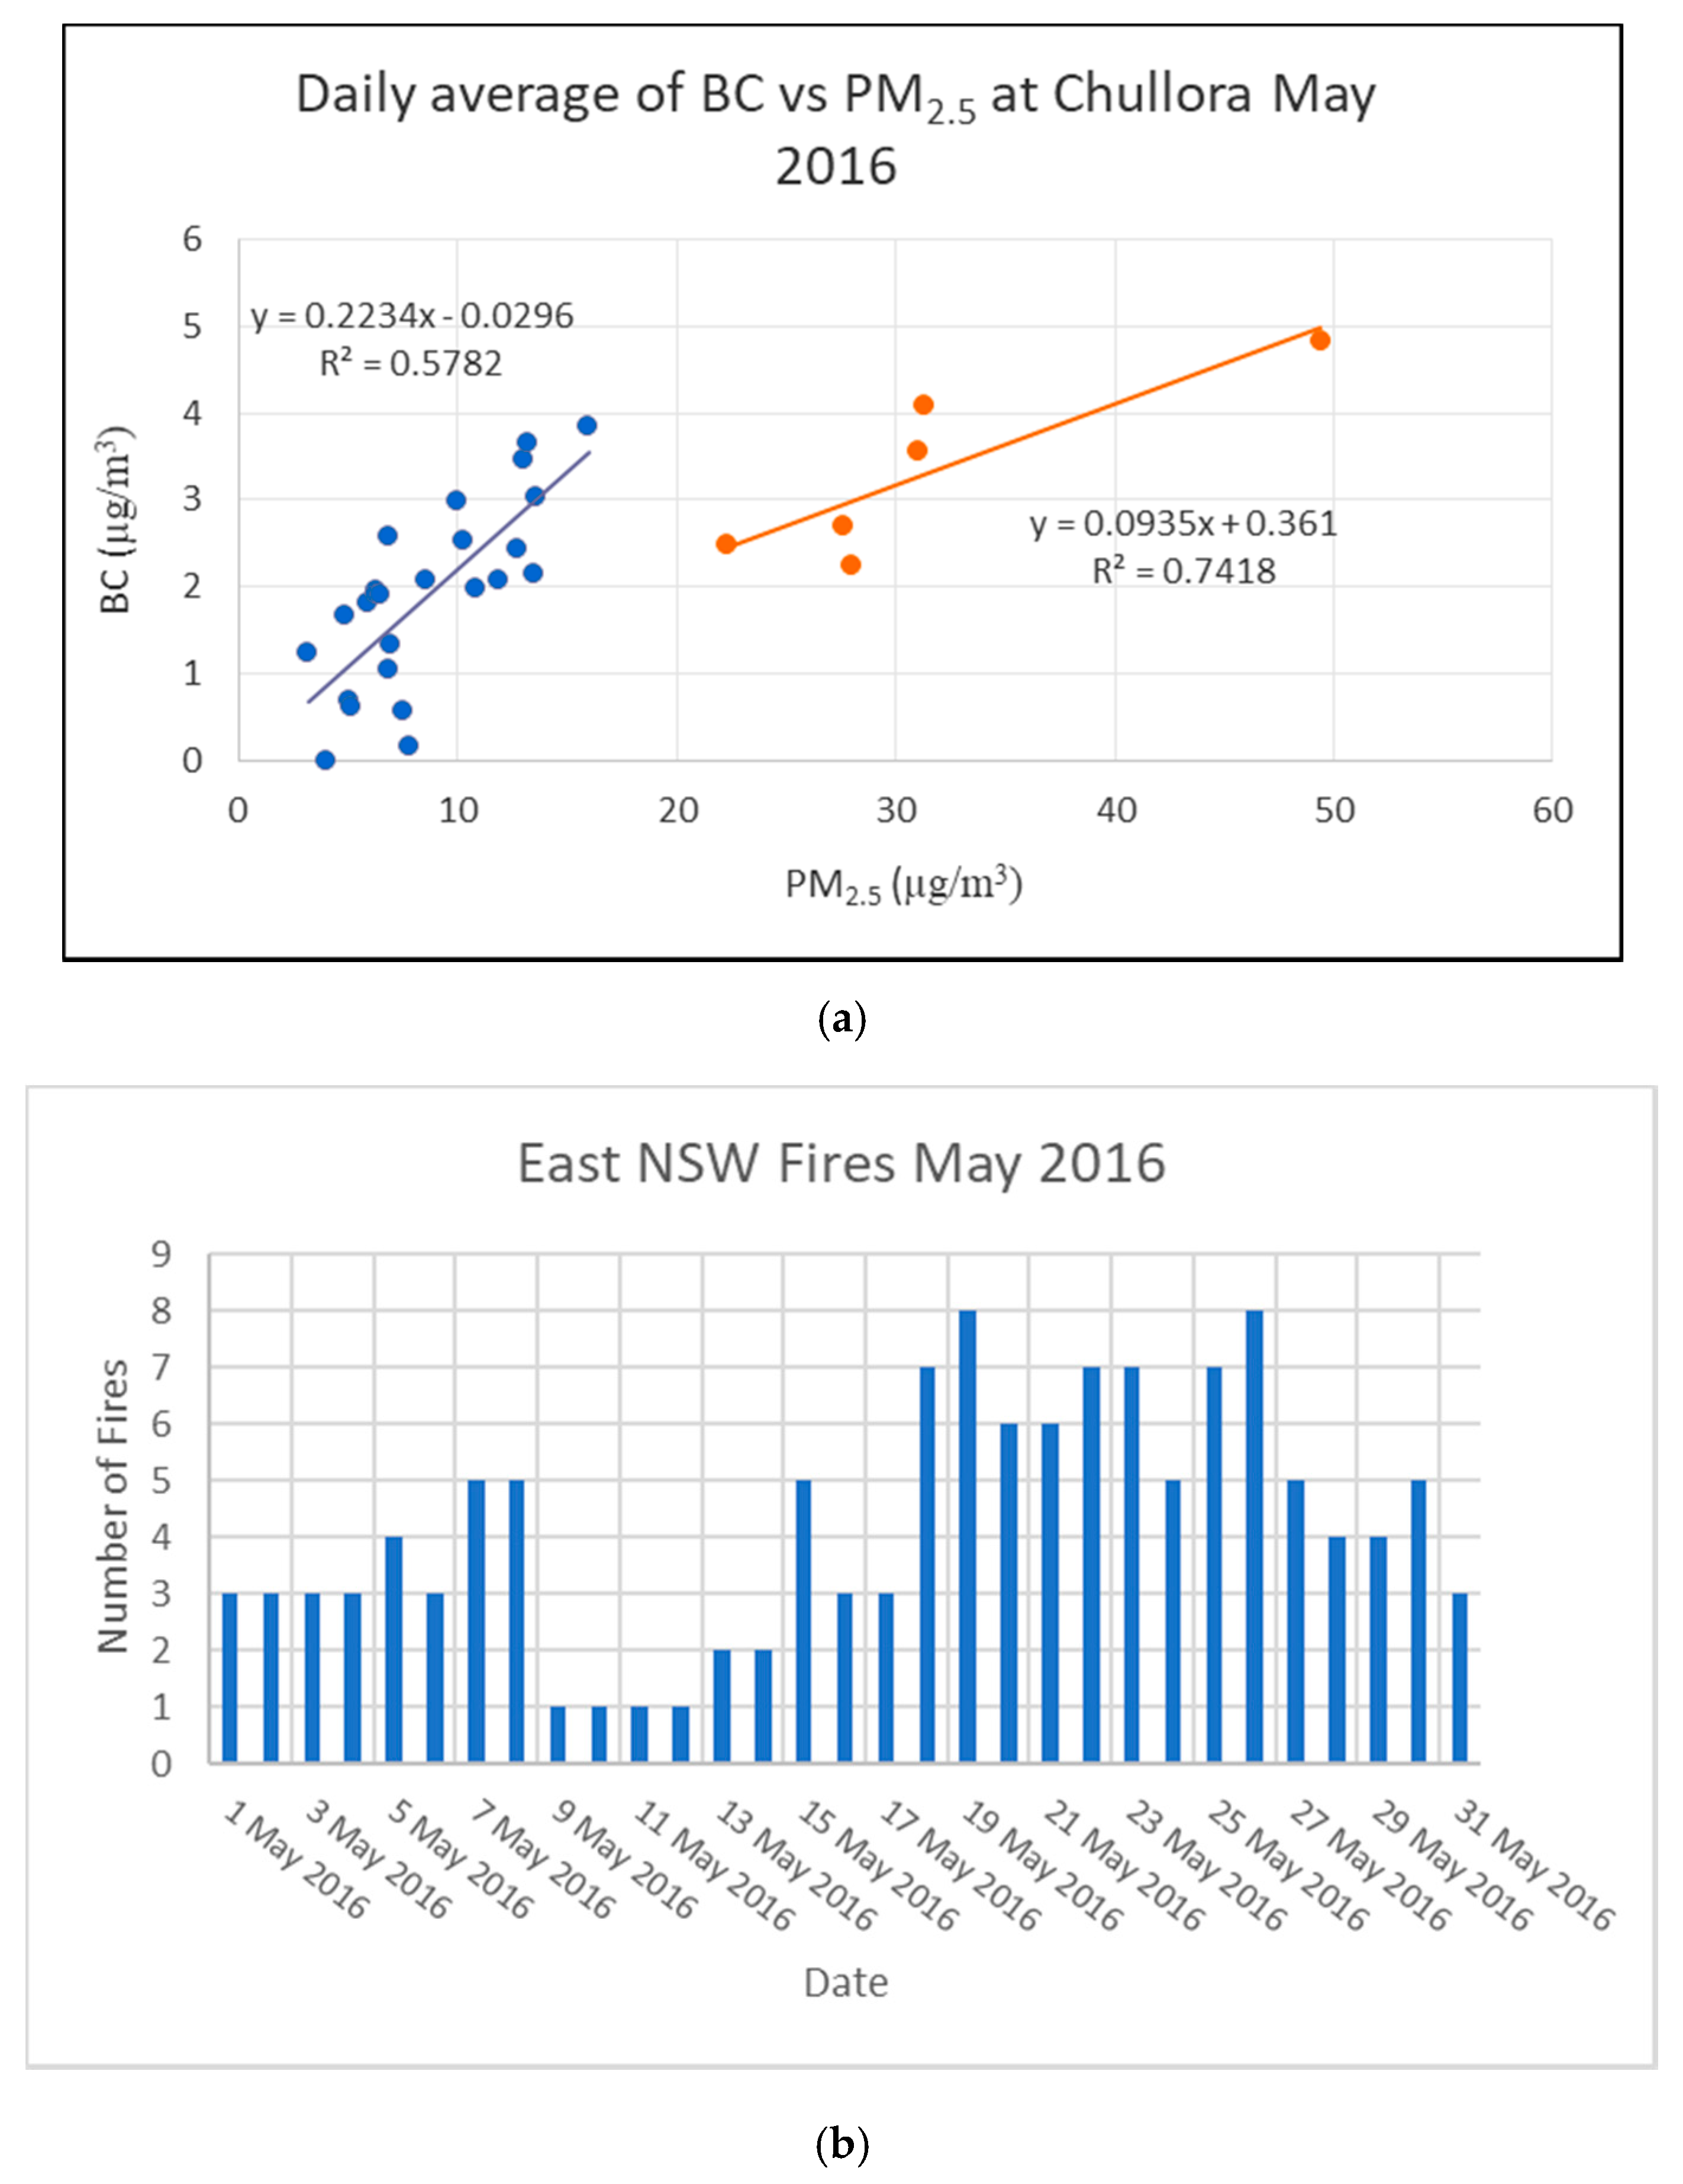
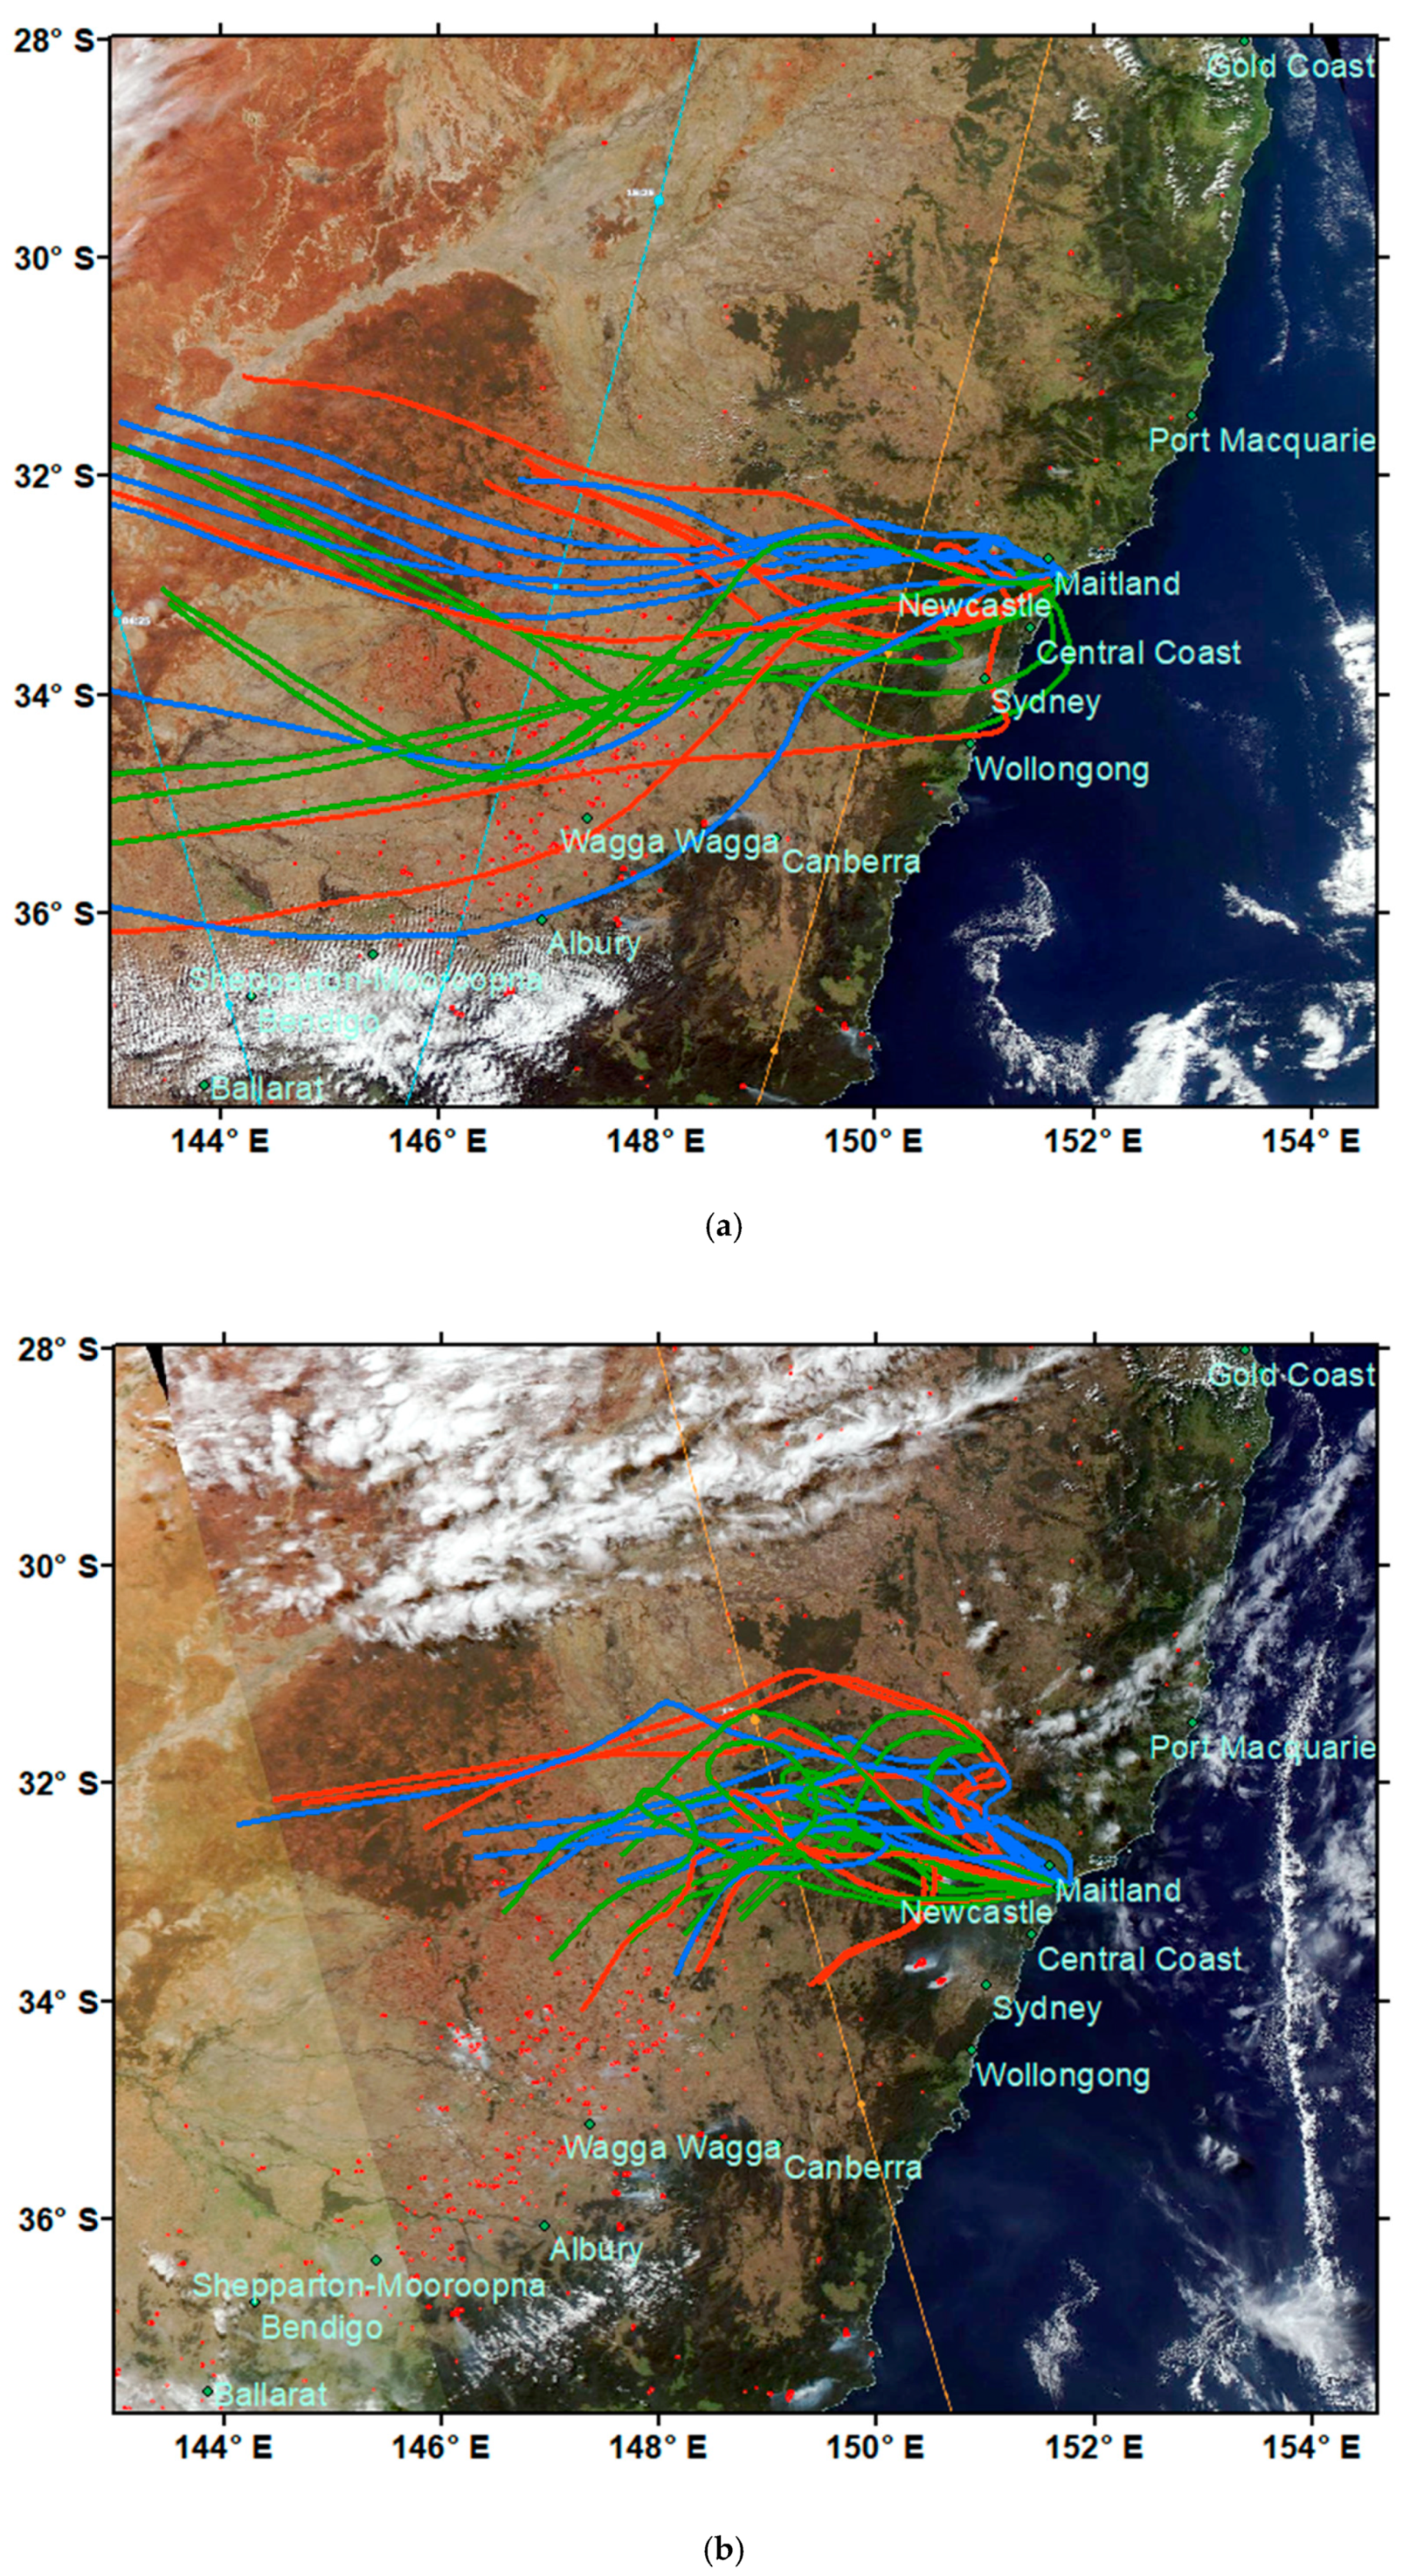
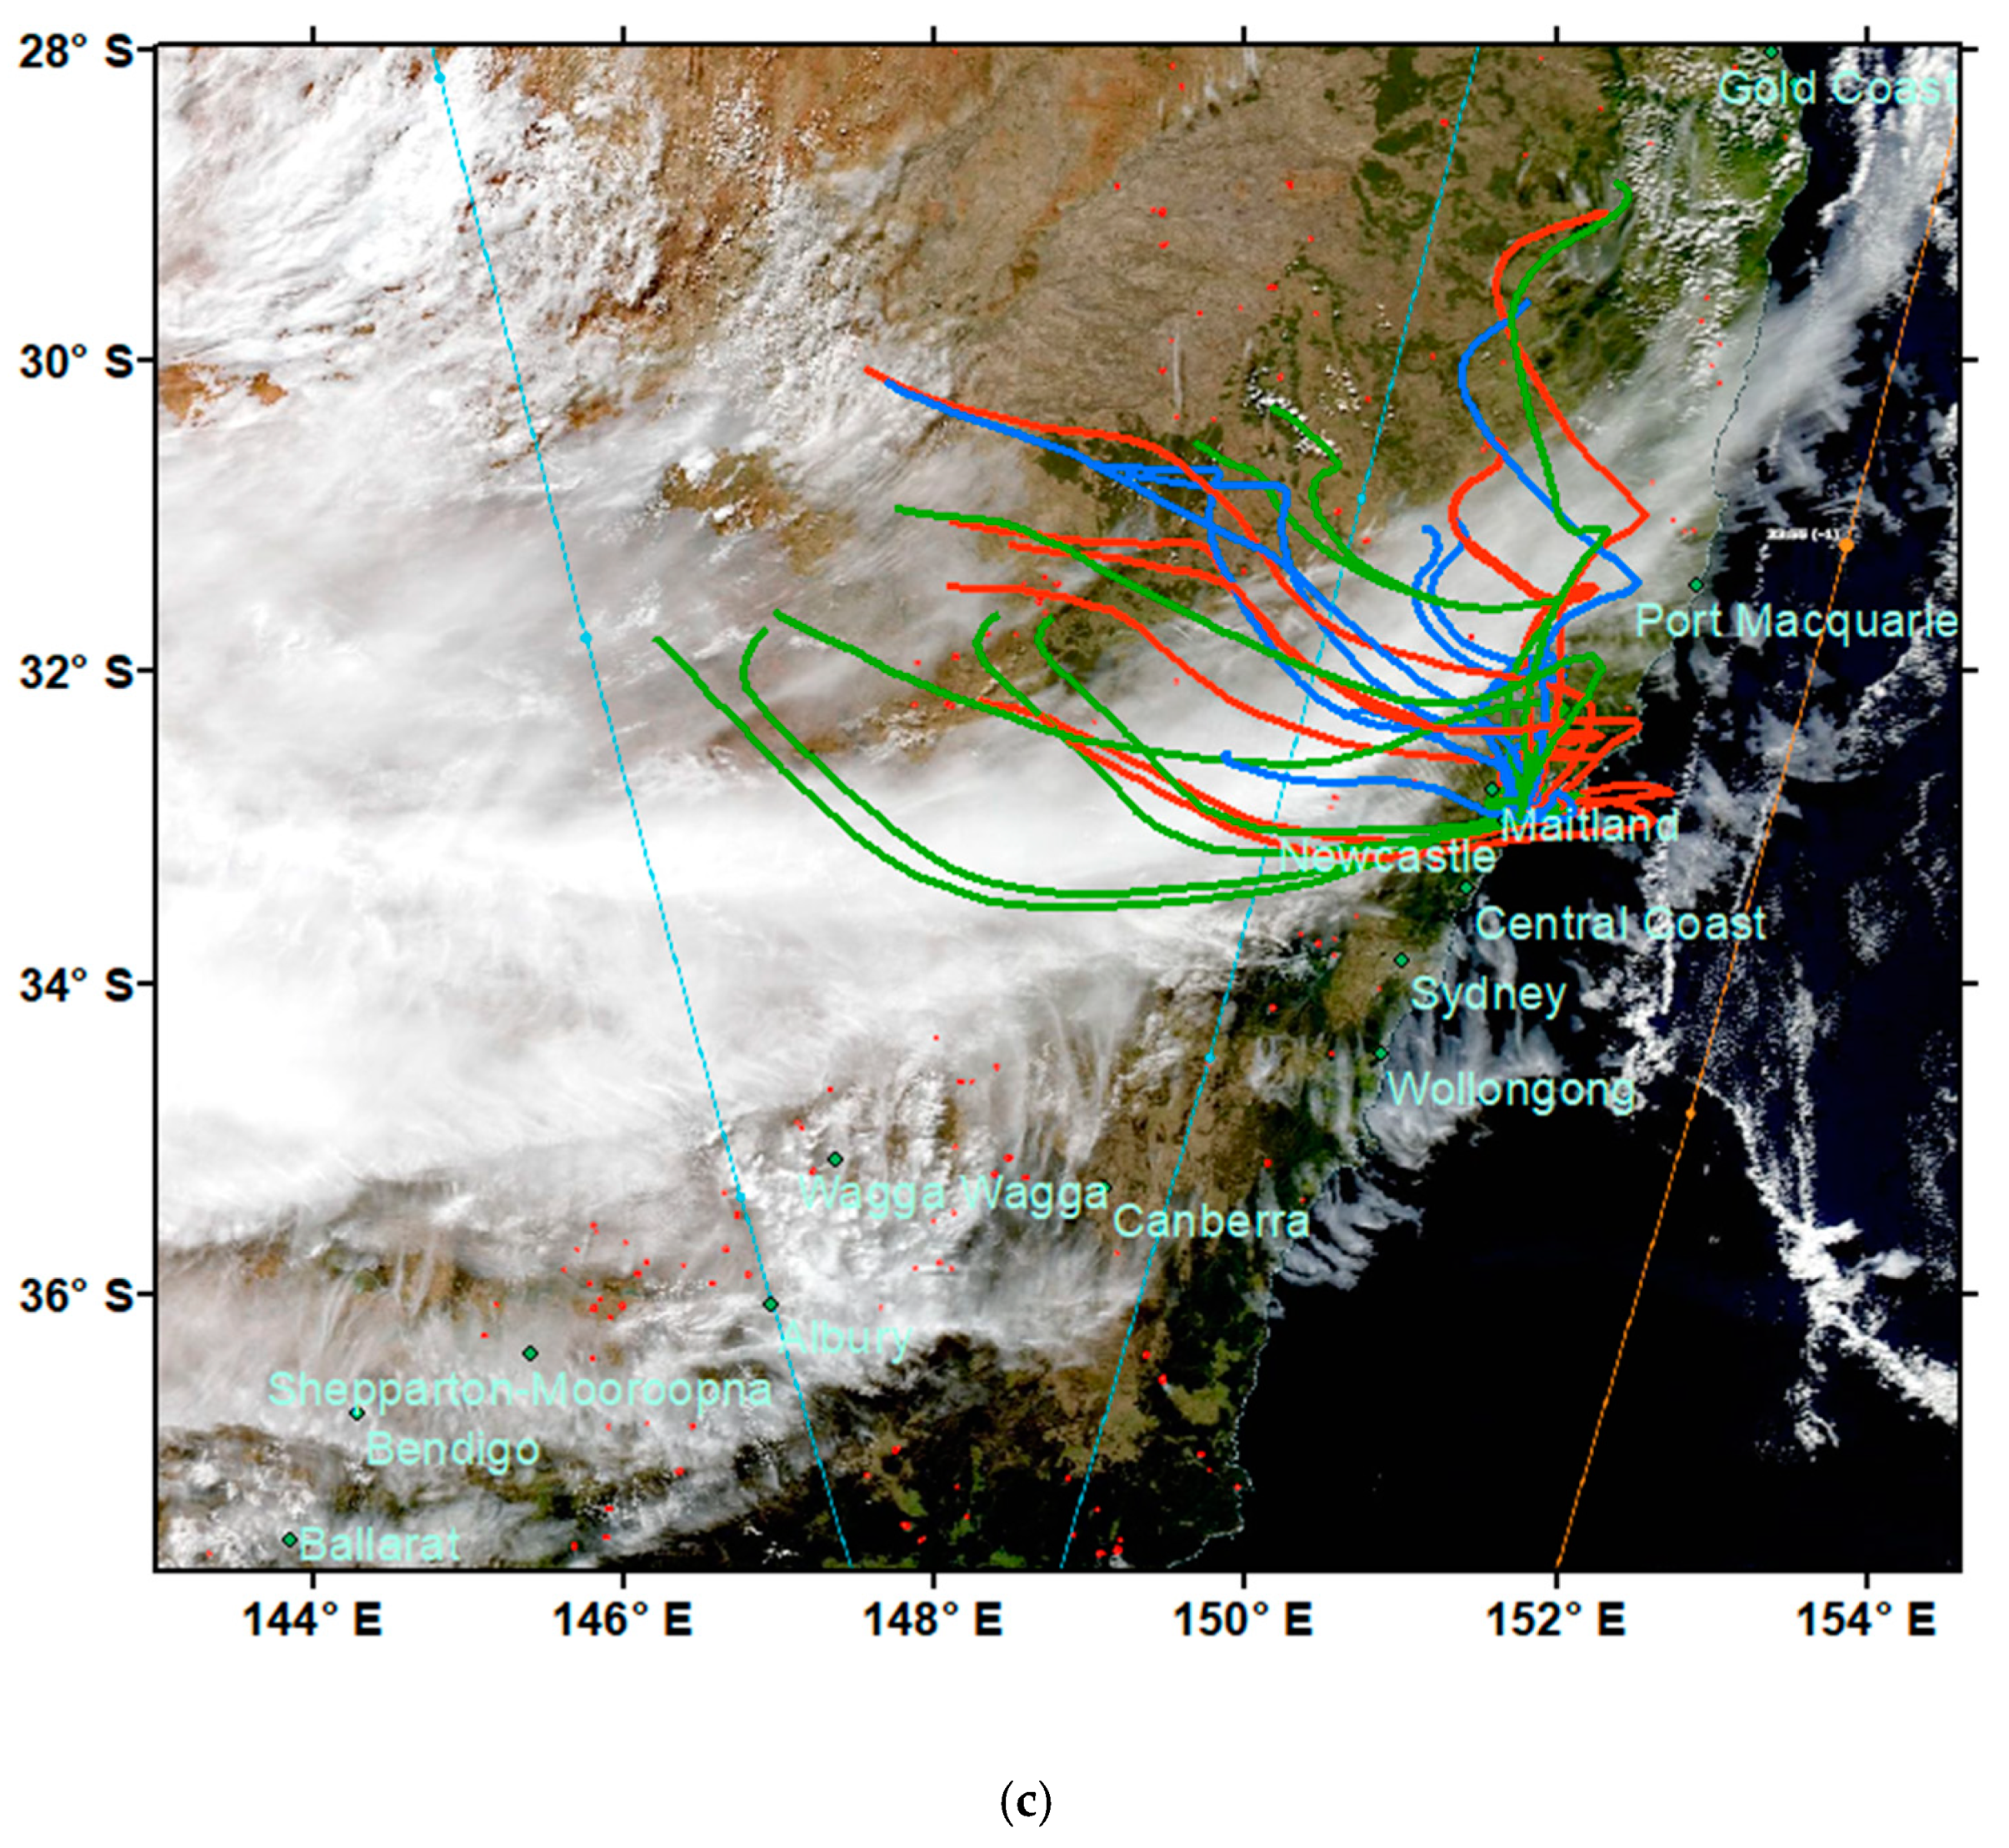
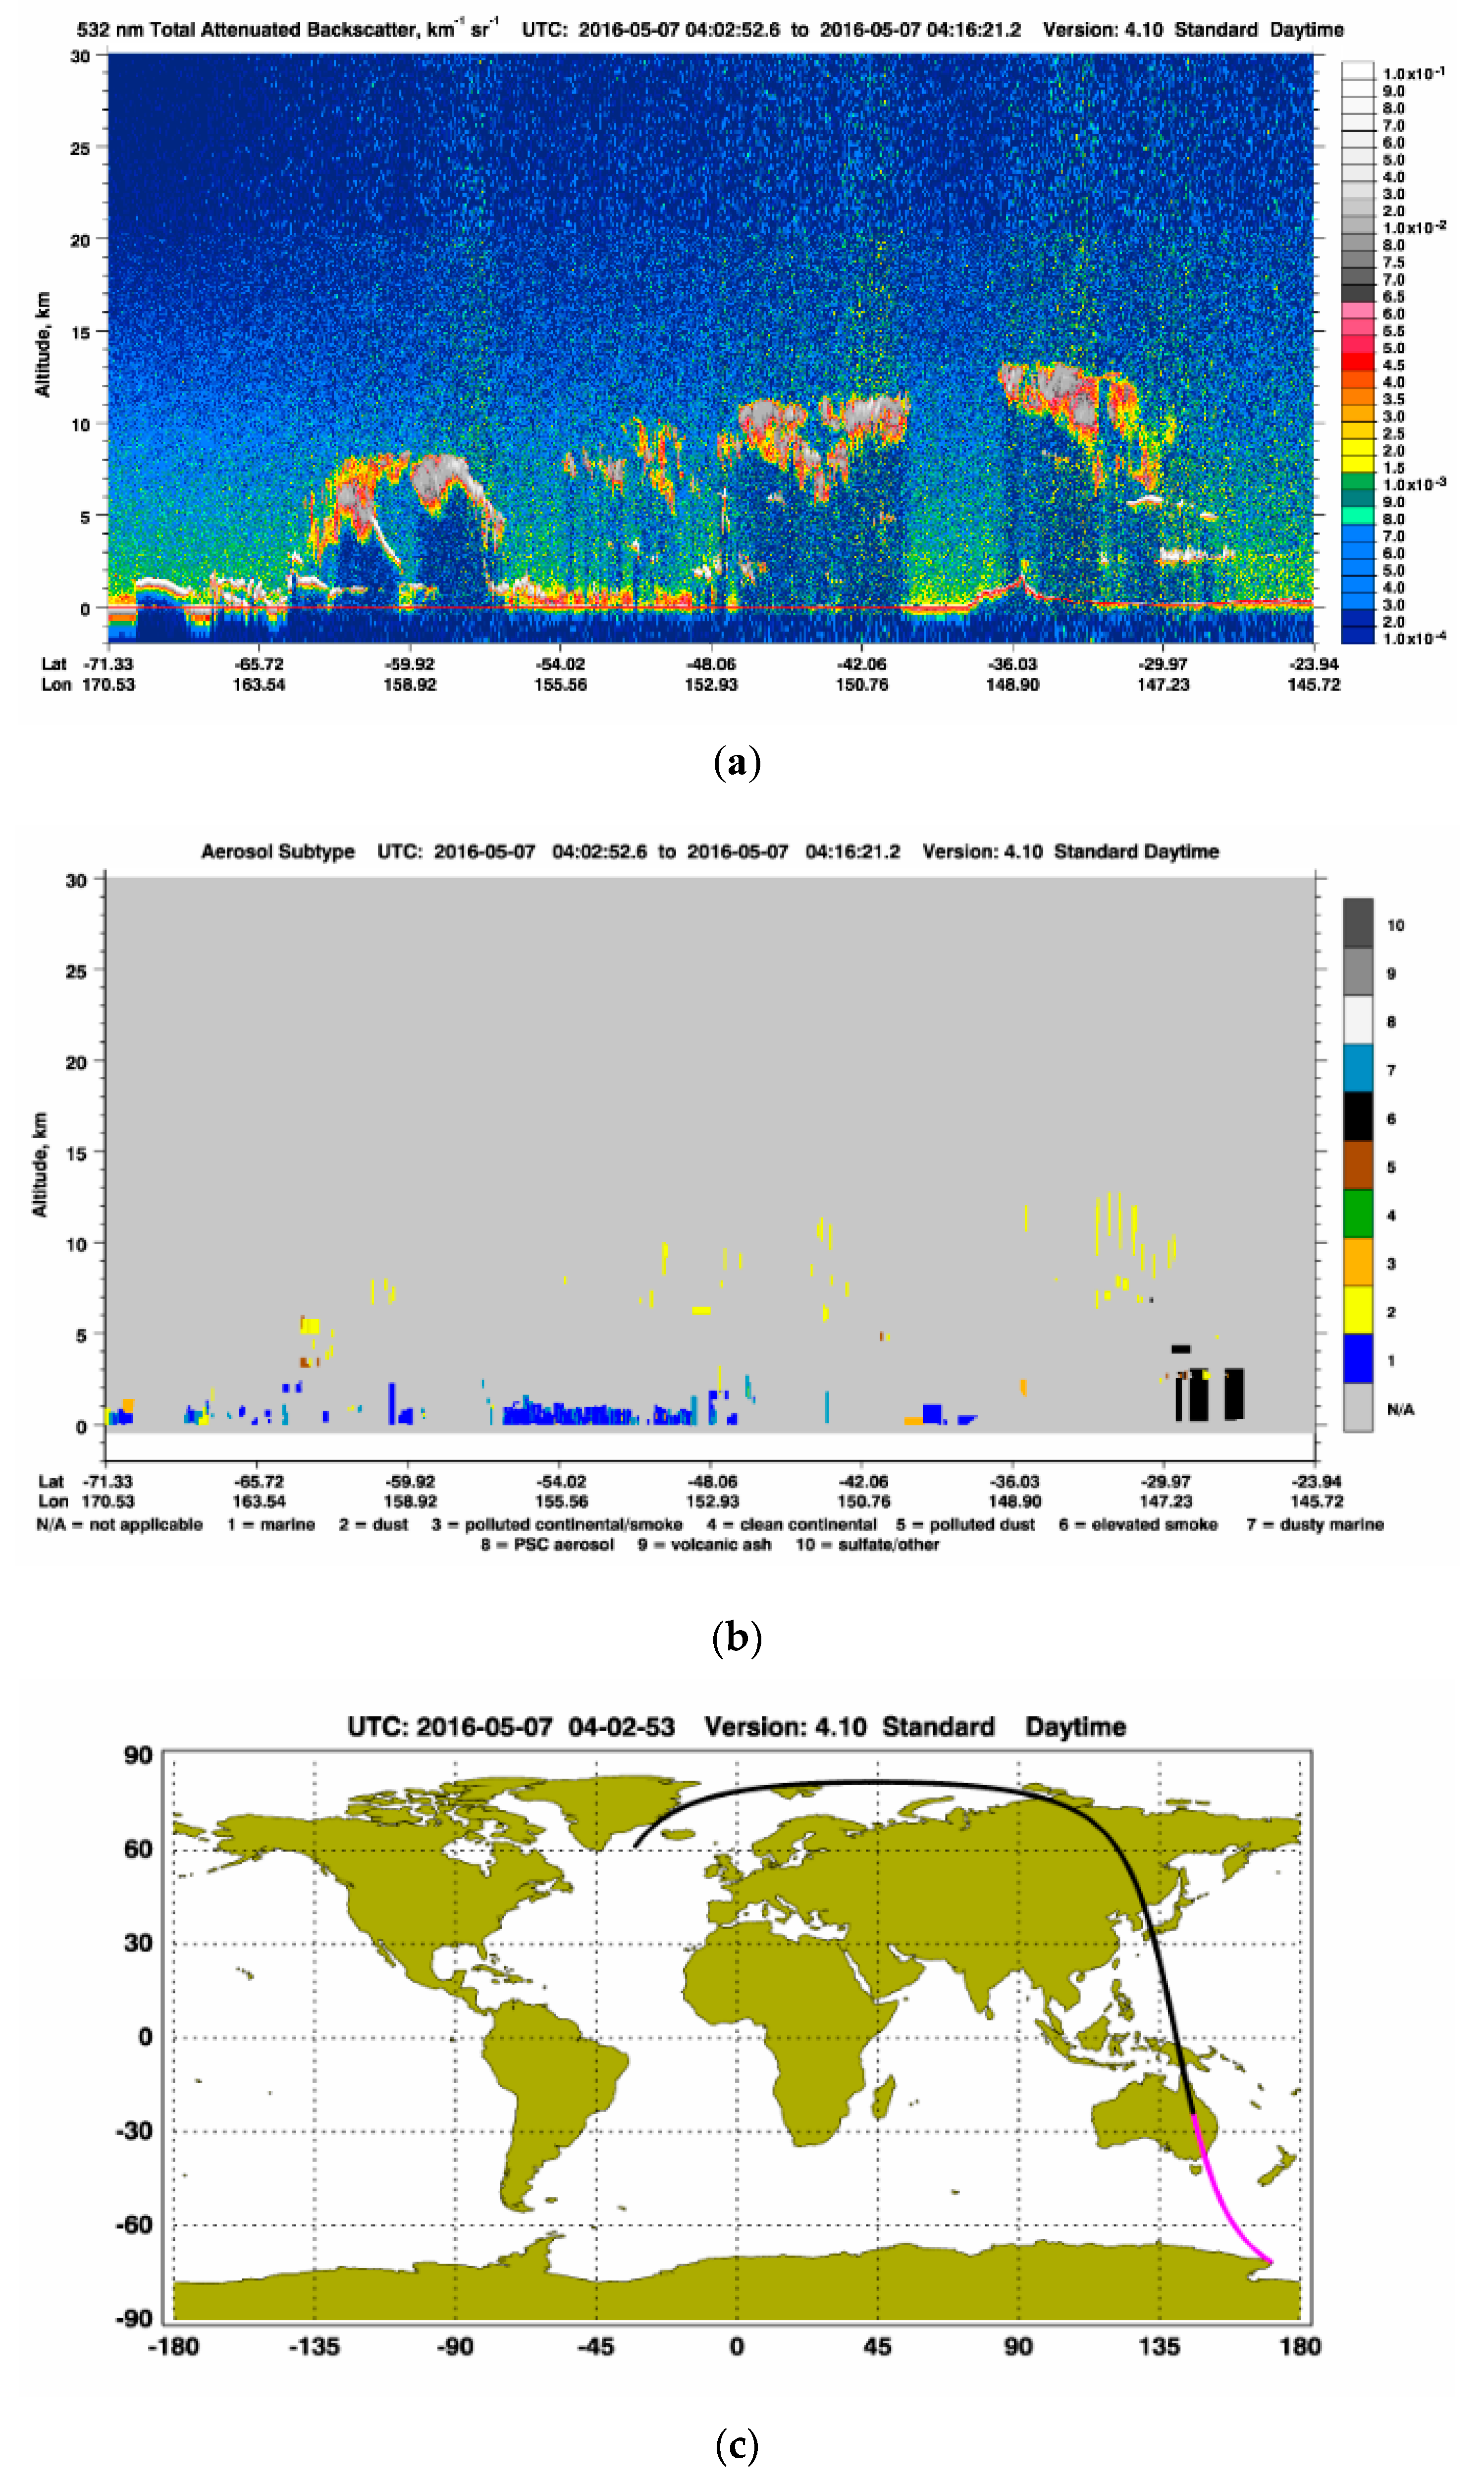
3.2.2. May 2016 Hazard Reduction Burning (HRB) Event

Several HRB operations were conducted during the first week of May 2016 in the Blue Mountains directly west of Sydney. Unfavourable meteorological conditions caused smoke to concentrate under still and strong inversion conditions across greater Sydney, causing high PM2.5 concentrations to be measured. Additionally, during this period of HRBs, there were also large-scale agricultural biomass burning in the Riverina, southwest of Sydney near the border with the state of Victoria. Figure 10 shows the extent of the biomass burnings from MODIS Aqua/Terra satellites on 6 May 2016 and the BC concentrations as measured at Newcastle and Chullora during this period. High concentrations of BC (> 8 μg/m3) were detected at Newcastle in the Lower Hunter and Chullora in Central Sydney.
Three major biomass burnings were conducted by the Rural Fire Service (RFS) outside the Sydney basin: one in the Blue Mountains near Katoomba-Wentworth Falls started during 5–7 May; another at the southwest of the first fire, near Wallacia and Warragamba dam at the edge of the Sydney basin, during 6–7 May; and the last in the north of the Sydney basin located in the National Park (Pisgah Ridge) and west of the Lower Hunter area during 6–8 May. The effect of these fires on particle air pollution in the GMR can be seen in the measurements of PM2.5 and BC at Chullora and Newcastle. Figure 11 shows the daily average of PM2.5, BC and Biomass Burning ratio BB from 1 to 30 May 2016 at Chullora in Sydney and Newcastle in the Lower Hunter. The BB ratio is the proportion of BC due to biomass burning compared to total BC. In Figure 11, it can be seen that the BB ratio and PM2.5 average concentrations for May 2016 at Chullora were higher compared to Newcastle. This means Chullora was affected by the HRBs more than at Newcastle over May 2016 period. The time series patterns for both sites are similar, although Newcastle is of a smaller magnitude. Days of elevated PM2.5 and BC concentrations and BB greater than 30% occurred on 7–9, 19 and 22 May at Chullora. This is expected as the HRB burnings occurred on these days. On the day when maximum PM2.5 and BC occurred (8 May 2016), at Chullora the BB ratio is about 35%, while, at Newcastle, peak PM2.5 and BC concentration occurred on 6 May 2016 and the ratio is lower at about 20%.
Figure 12a,b shows the regression of BC with PM2.5 at Chullora and Newcastle. The daily average time series of PM2.5, BC and BC/PM2.5 (and its trend line) at Chullora and Newcastle are shown in Figure 12c,d. The dotted vertical lines are the ±σ (standard deviation of intraday hourly variation on the day) from the daily mean. There is a significant variation of hourly BC/PM2.5 during the 24-h period in each day. In the previous study [42] of BC at Newcastle for the period from 10 December 2015 to 25 May 2017, the average BC/PM2.5 was reported at about 10% and could reach up to 30% in autumn–winter. For the May 2016 period, Figure 12d shows the ratio varies between 5% and 30%, which is in line with the previous study [42].
Source apportionment of BC at Newcastle and Chullora into fossil fuel combustion (traffic) and biomass burnings shows that fossil fuel contribute most to BC concentration at these sites during May 2016. as shown in Figure 13. Healy et al. (2019) [32] reported that the aethalometer model (with biomass burning AAE value of 2) underestimates the contribution of biomass burning to BC by up to a factor of 3 during 2017 boreal summer wildfires in Canada. The lower values of biomass burning AAE compared to 2 of the aethalometer depends on the combustion efficiency and type of biomass fuel. For this reason, the BCwb and BCff proportion would be different with BCwb (and BB%) should be higher than indicated in Figure 13 obtained from the aethalometer model used in AE33.
At Chullora. there are two distinct regression patterns, which show the influence of biomass burnings and combustion vehicles source, as shown in Figure 14a. At the high concentration end corresponding to biomass burnings influence, the regression slope is about 10%, while, at the lower end, the regression slope is about 22%, which is due mostly to local traffic sources. Park and Lee 2015 [43] in their study of characterisation and sources of BC in PM2.5 at a site close to a roadway in Gwangju (Korea) classified two BC episodes based on BC, PM2.5 and secondary SO4−2 concentrations. They found that the BC observed during Episode A, which was associated with high BC and low PM2.5, SO4-2 concentrations, was attributed to local produced emission (traffic). BC during Episode B, which was associated with high concentrations of BC, PM2.5 and SO4−2, was influenced by long-range transport from China as well as local emissions. This corresponds with the observations at Chullora site in May 2016, which has two distinct patterns of BC and PM2.5 relationship.
Using RFS HRB data for 2016, the number of fires for NSW East were counted for each day and is plotted in Figure 14b. This can be compared with the PM2.5 and BC time series which show strong correspondence to fire activity in the area. Overall, for May 2016, the PM2.5 and BC concentration and BC/PM2.5 trends correlate to the number of bushfires burning in NSW East region.
The HRB fires were detected at Newcastle from the trace of black carbon as measured by aethalometer. HYSPLIT ensemble backward trajectory analyses from Newcastle when the peaks of black carbon concentration were measured on 5 May 2016 at 08:00 AEST, 6 May 2016 at 08:00 AEST and 7 May 2016 at 08:00 AEST show that the first peak of BC concentration was mainly caused by the fire in the Blue Mountain with strong possibility of contribution from fires in Riverina agricultural areas bordering the regional cities of Wagga Wagga, Griffith, Leeton, Young and Cootamundra. The second and third peaks were mainly caused by the hazard reduction burning in the National Park west of Newcastle, and again strong possibility of contribution from fires in agricultural areas for the second peak. Figure 15 shows the ensemble backward trajectories from HYSPLIT at these times when the black carbon concentration peaks were detected at Newcastle.
Figure 16 shows the spatial pattern of BC extinction AOT (Aerosol Optical Thickness) and BC surface mass concentration average at resolution of 0.5° × 0.625° for May 2016 as predicted by MERRA model (obtained from Giovanni online https://giovanni.gsfc.nasa.gov/). The high concentration of AOT and surface BC in the Blue Mountains near Sydney correspond to the HRB areas. Observed measurements of total AOD on MODIS Aqua satellite at lower resolution of 1° × 1° averaged over the same period in Figure 17 also show corresponding high BC AOD with HRB areas near Sydney. Note that high AOT and surface BC concentration are also present in the state of Victoria, the Riverina agricultural area near the border of Victoria and New South Wales, northern NSW near Queensland and correspond to fire hot spots in those areas.
Lidar data from CALIPSO instrument on CALIOP satellite can be used to detect the smoke aerosols. However, the 7 May 2016 was the only day where the satellite path passed near the HRB areas. Figure 18a shows the total attenuated backscatter and aerosol sub-type profile along the satellite path. The aerosols were confined mostly on the 1-km layer above ground. Figure 18b shows thick layers of smoke aerosols from a few hundred metres to 3 km above the northern NSW and Queensland border area and dust at high altitude (7–12 km) along the CALIOP satellite path from (−27°, 146°) to (−29°, 147°). The dust and smoke aerosol layers correspond to the high AOT and AOD in this area, as shown in Figure 16 and Figure 17.

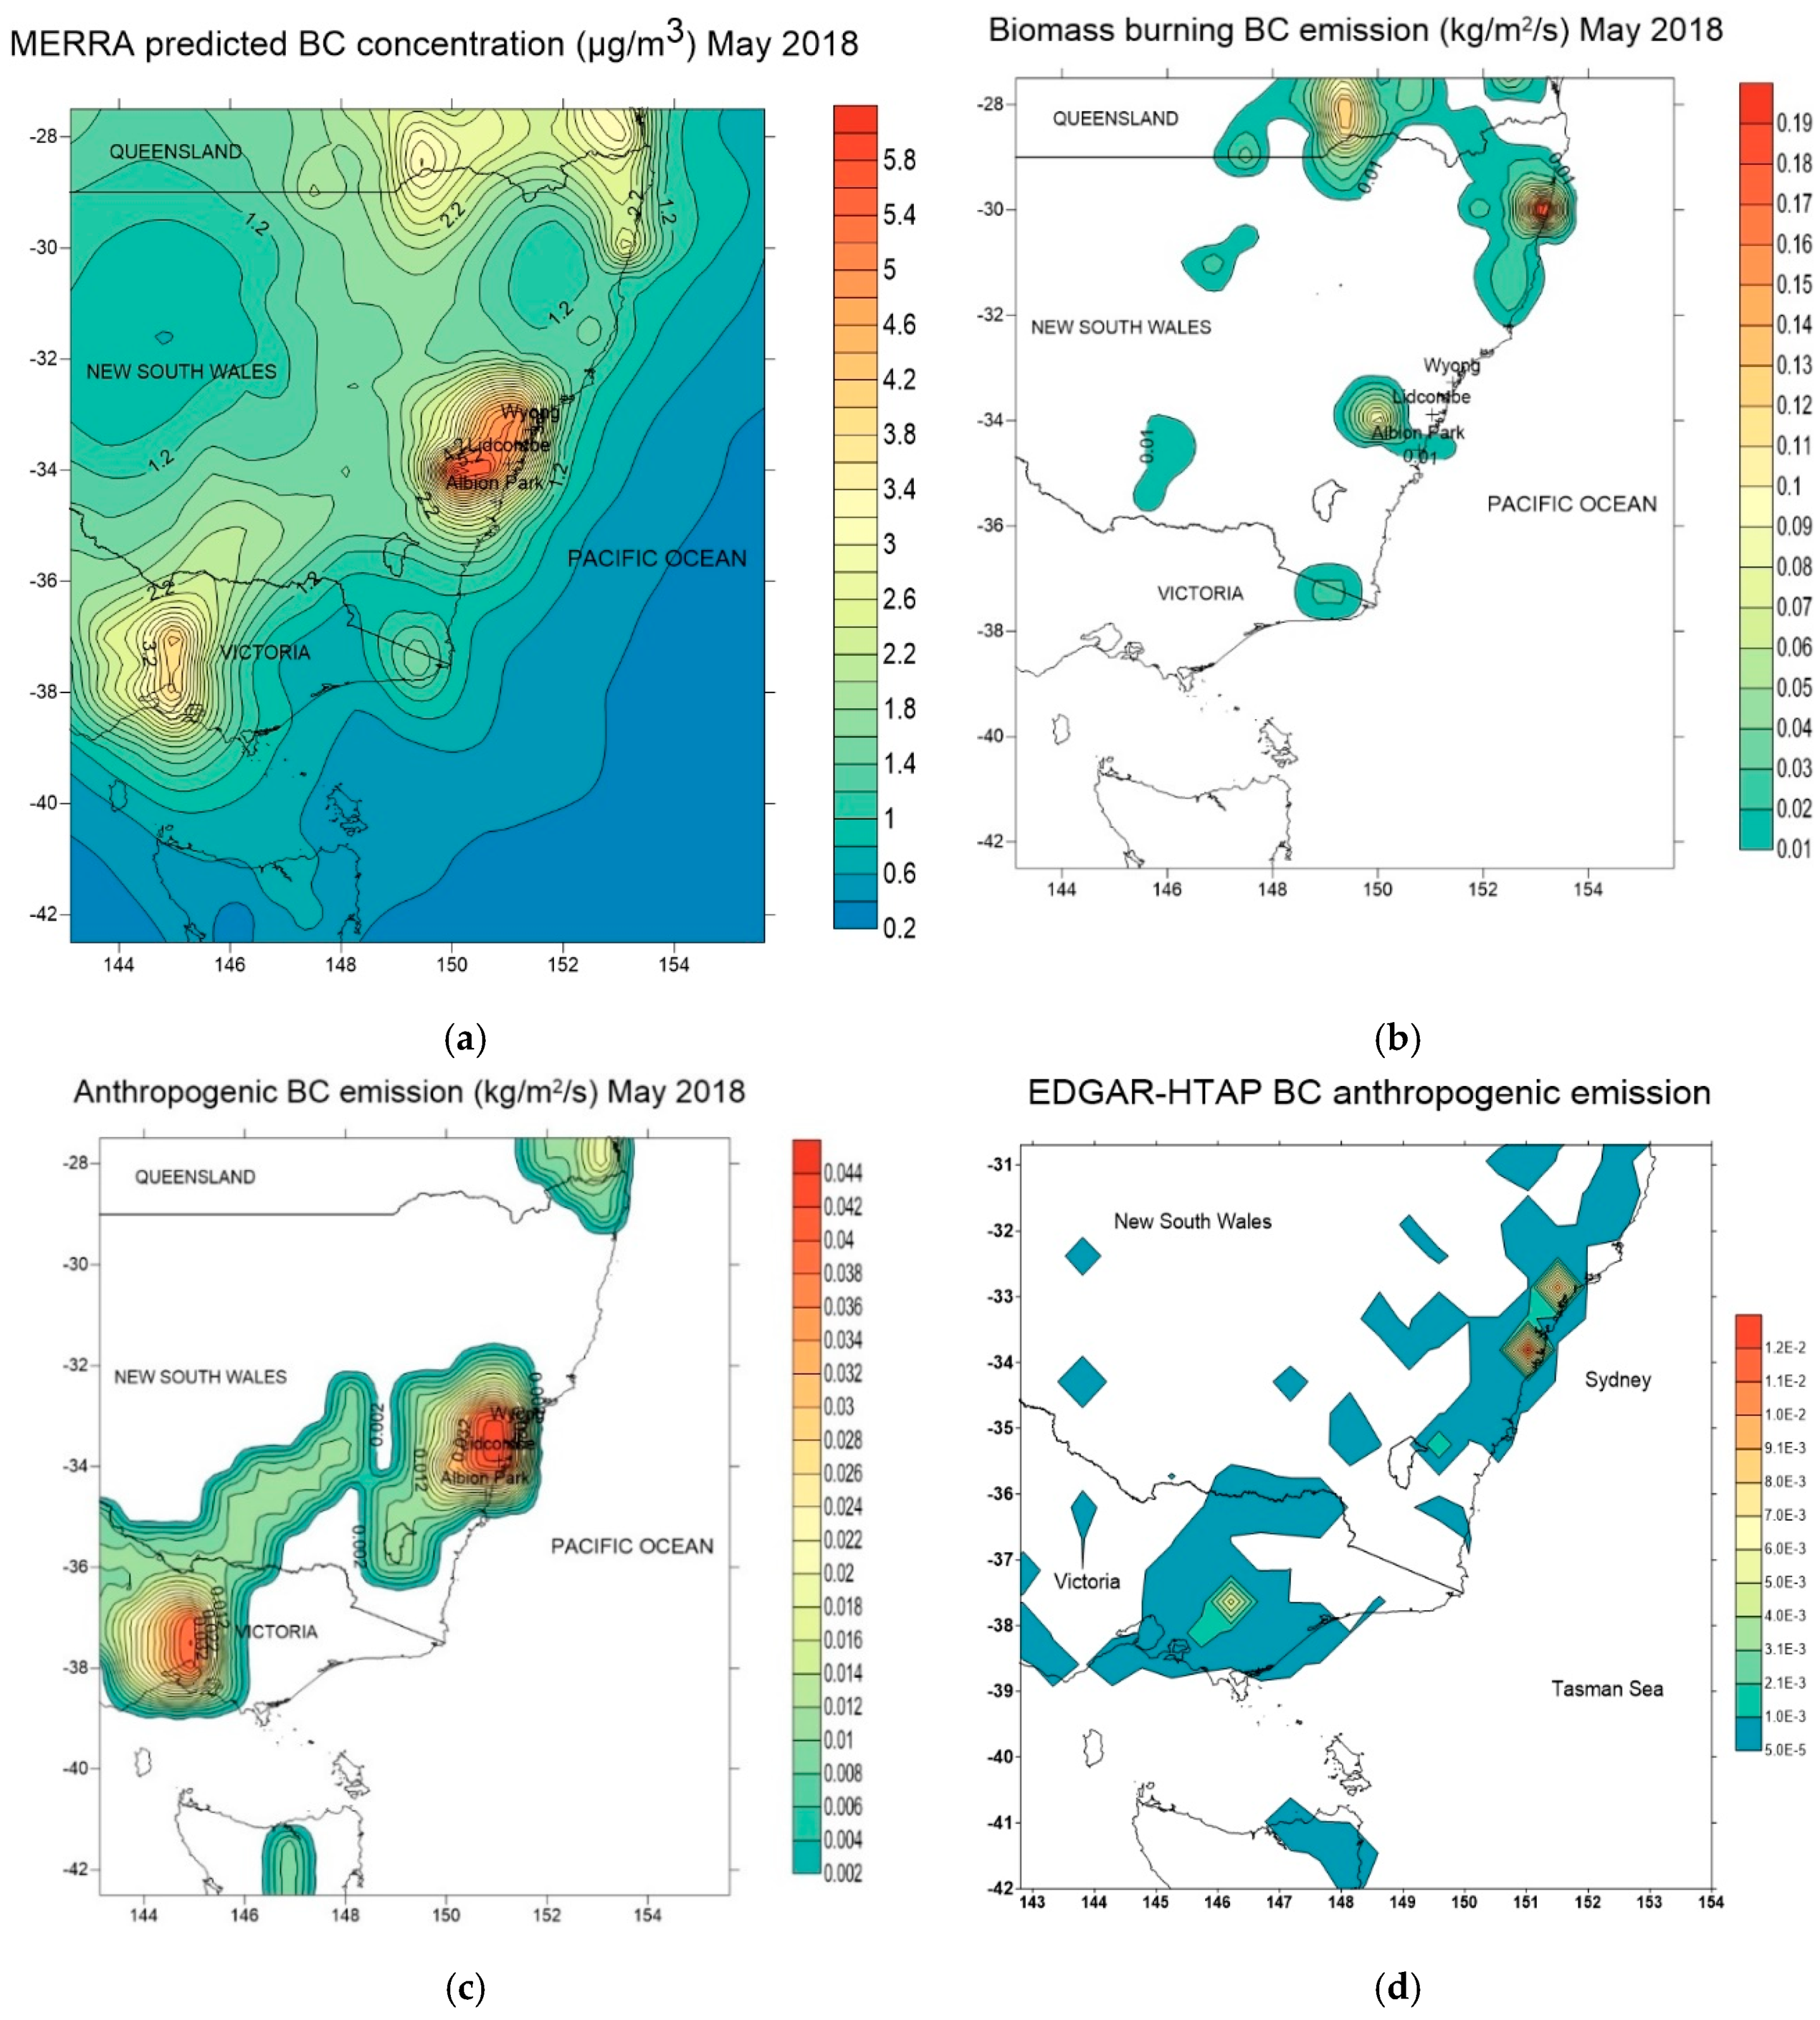
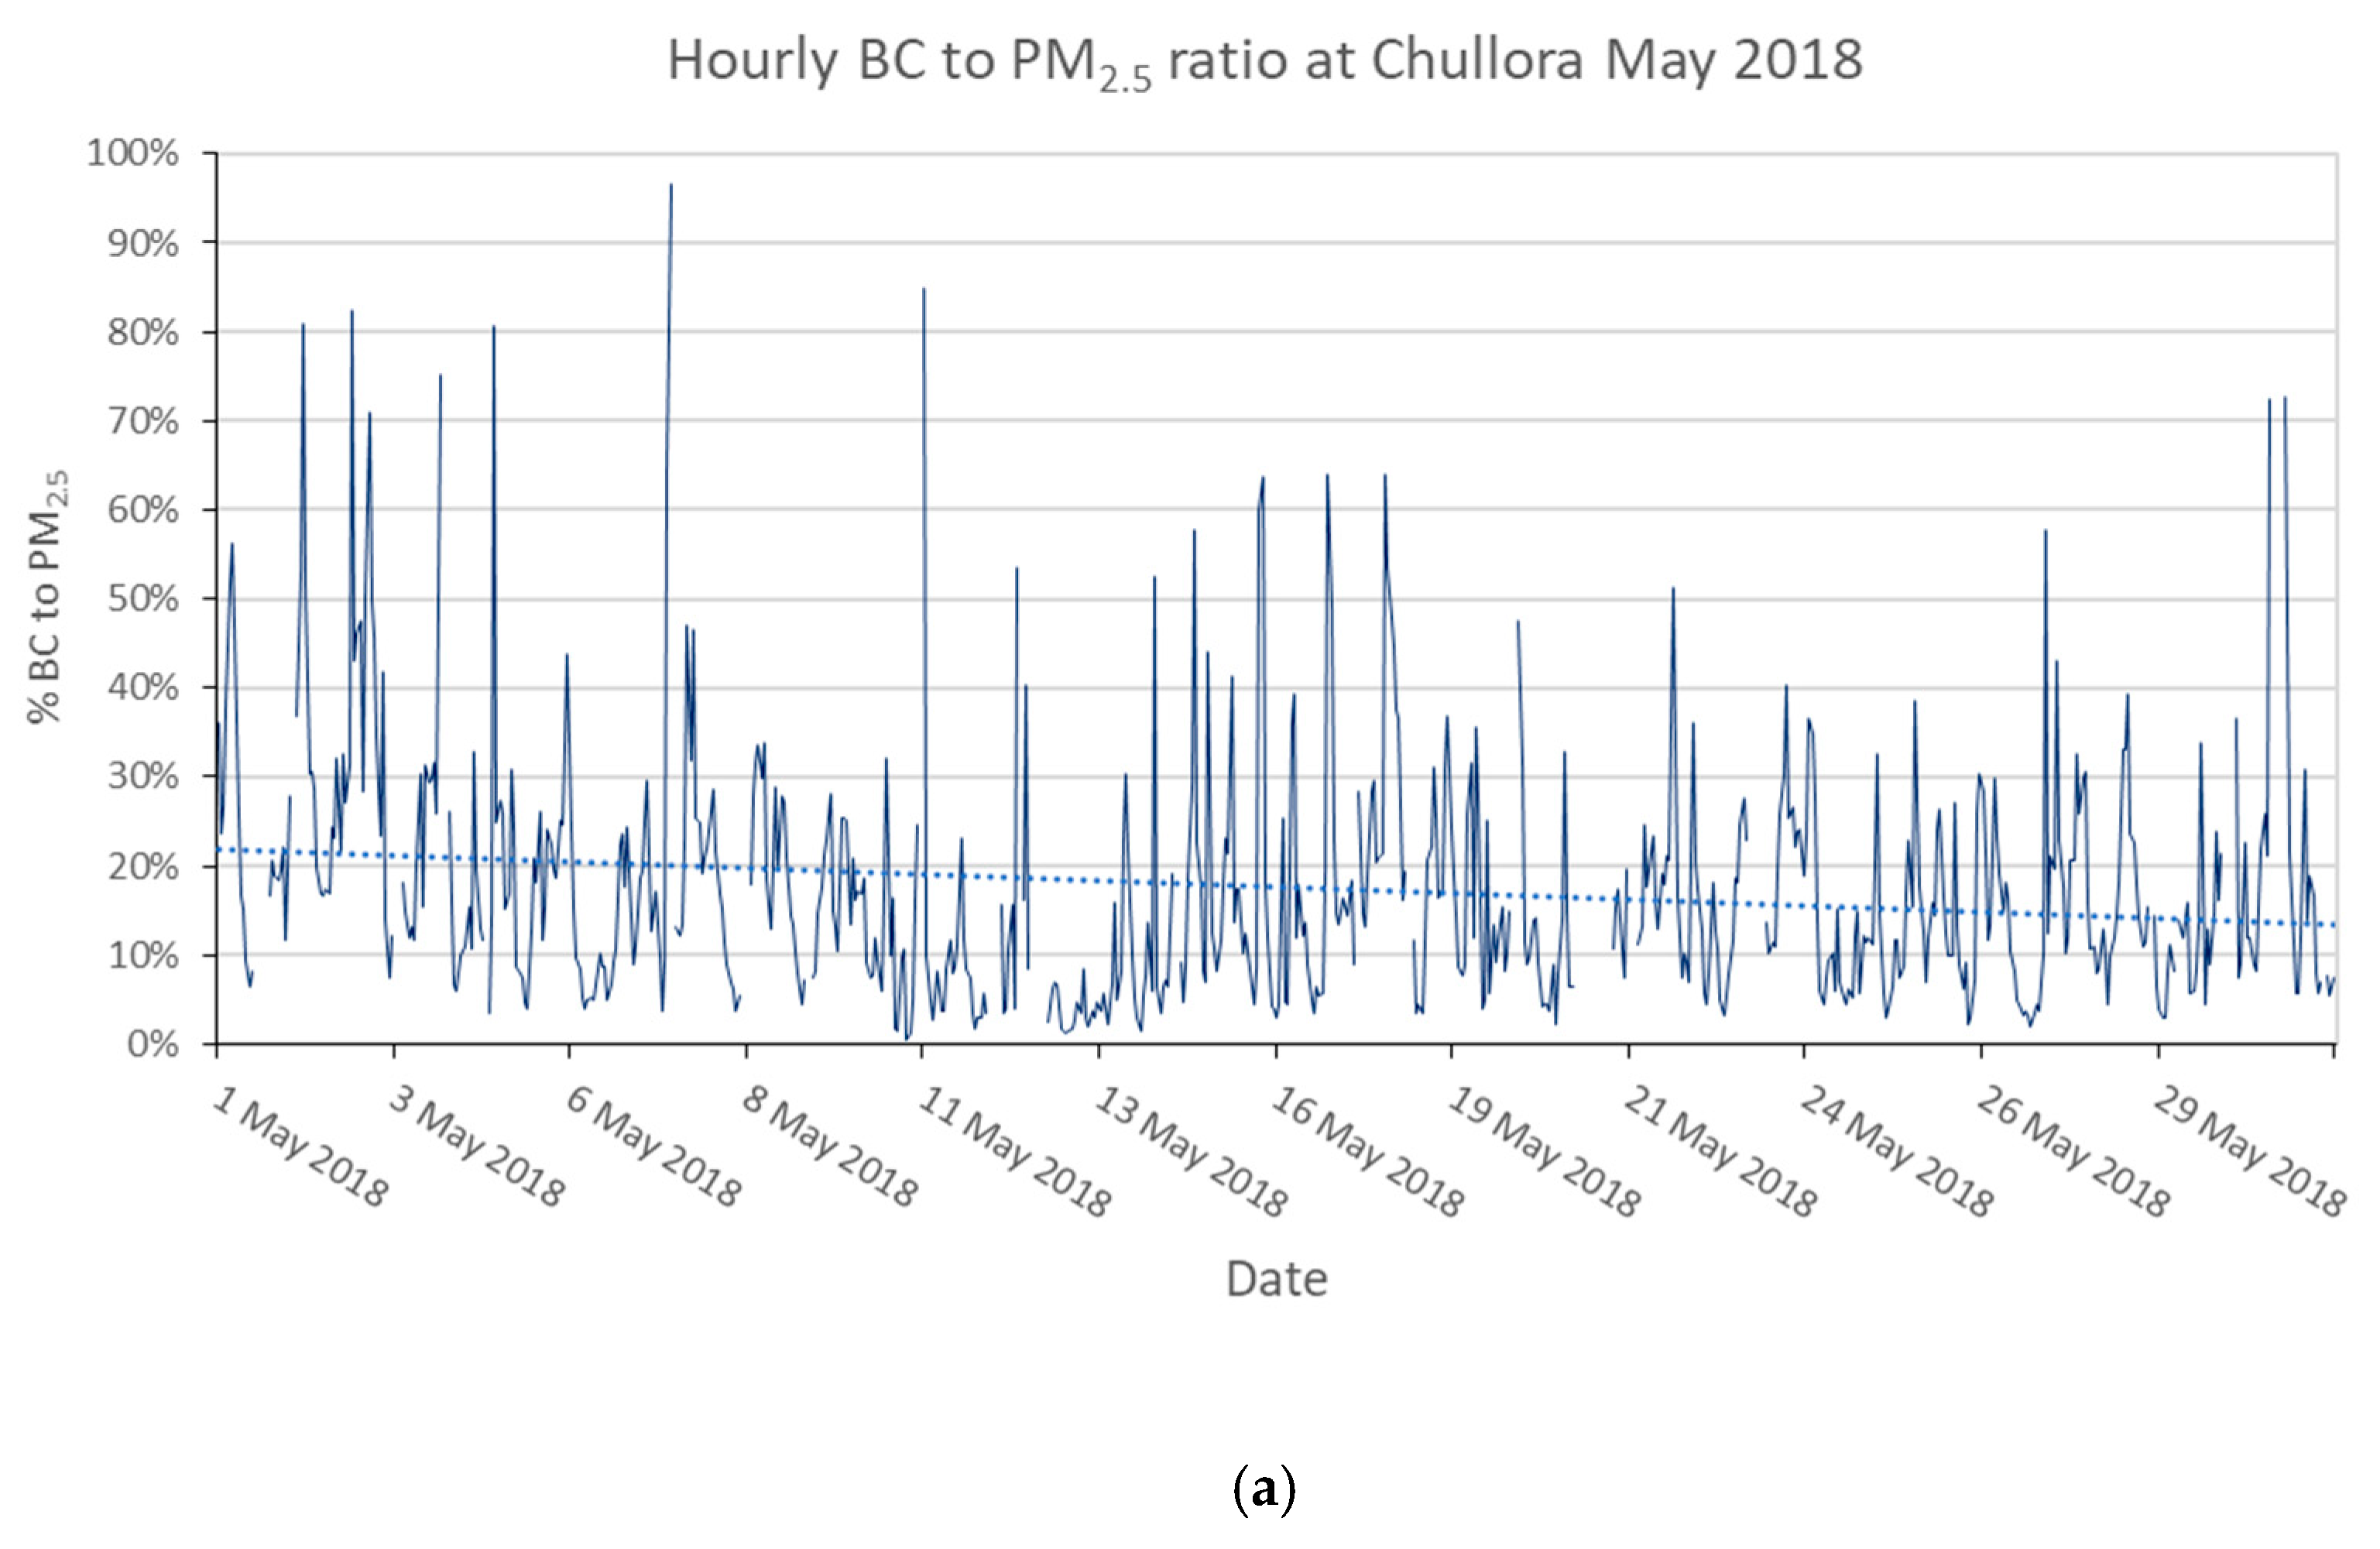
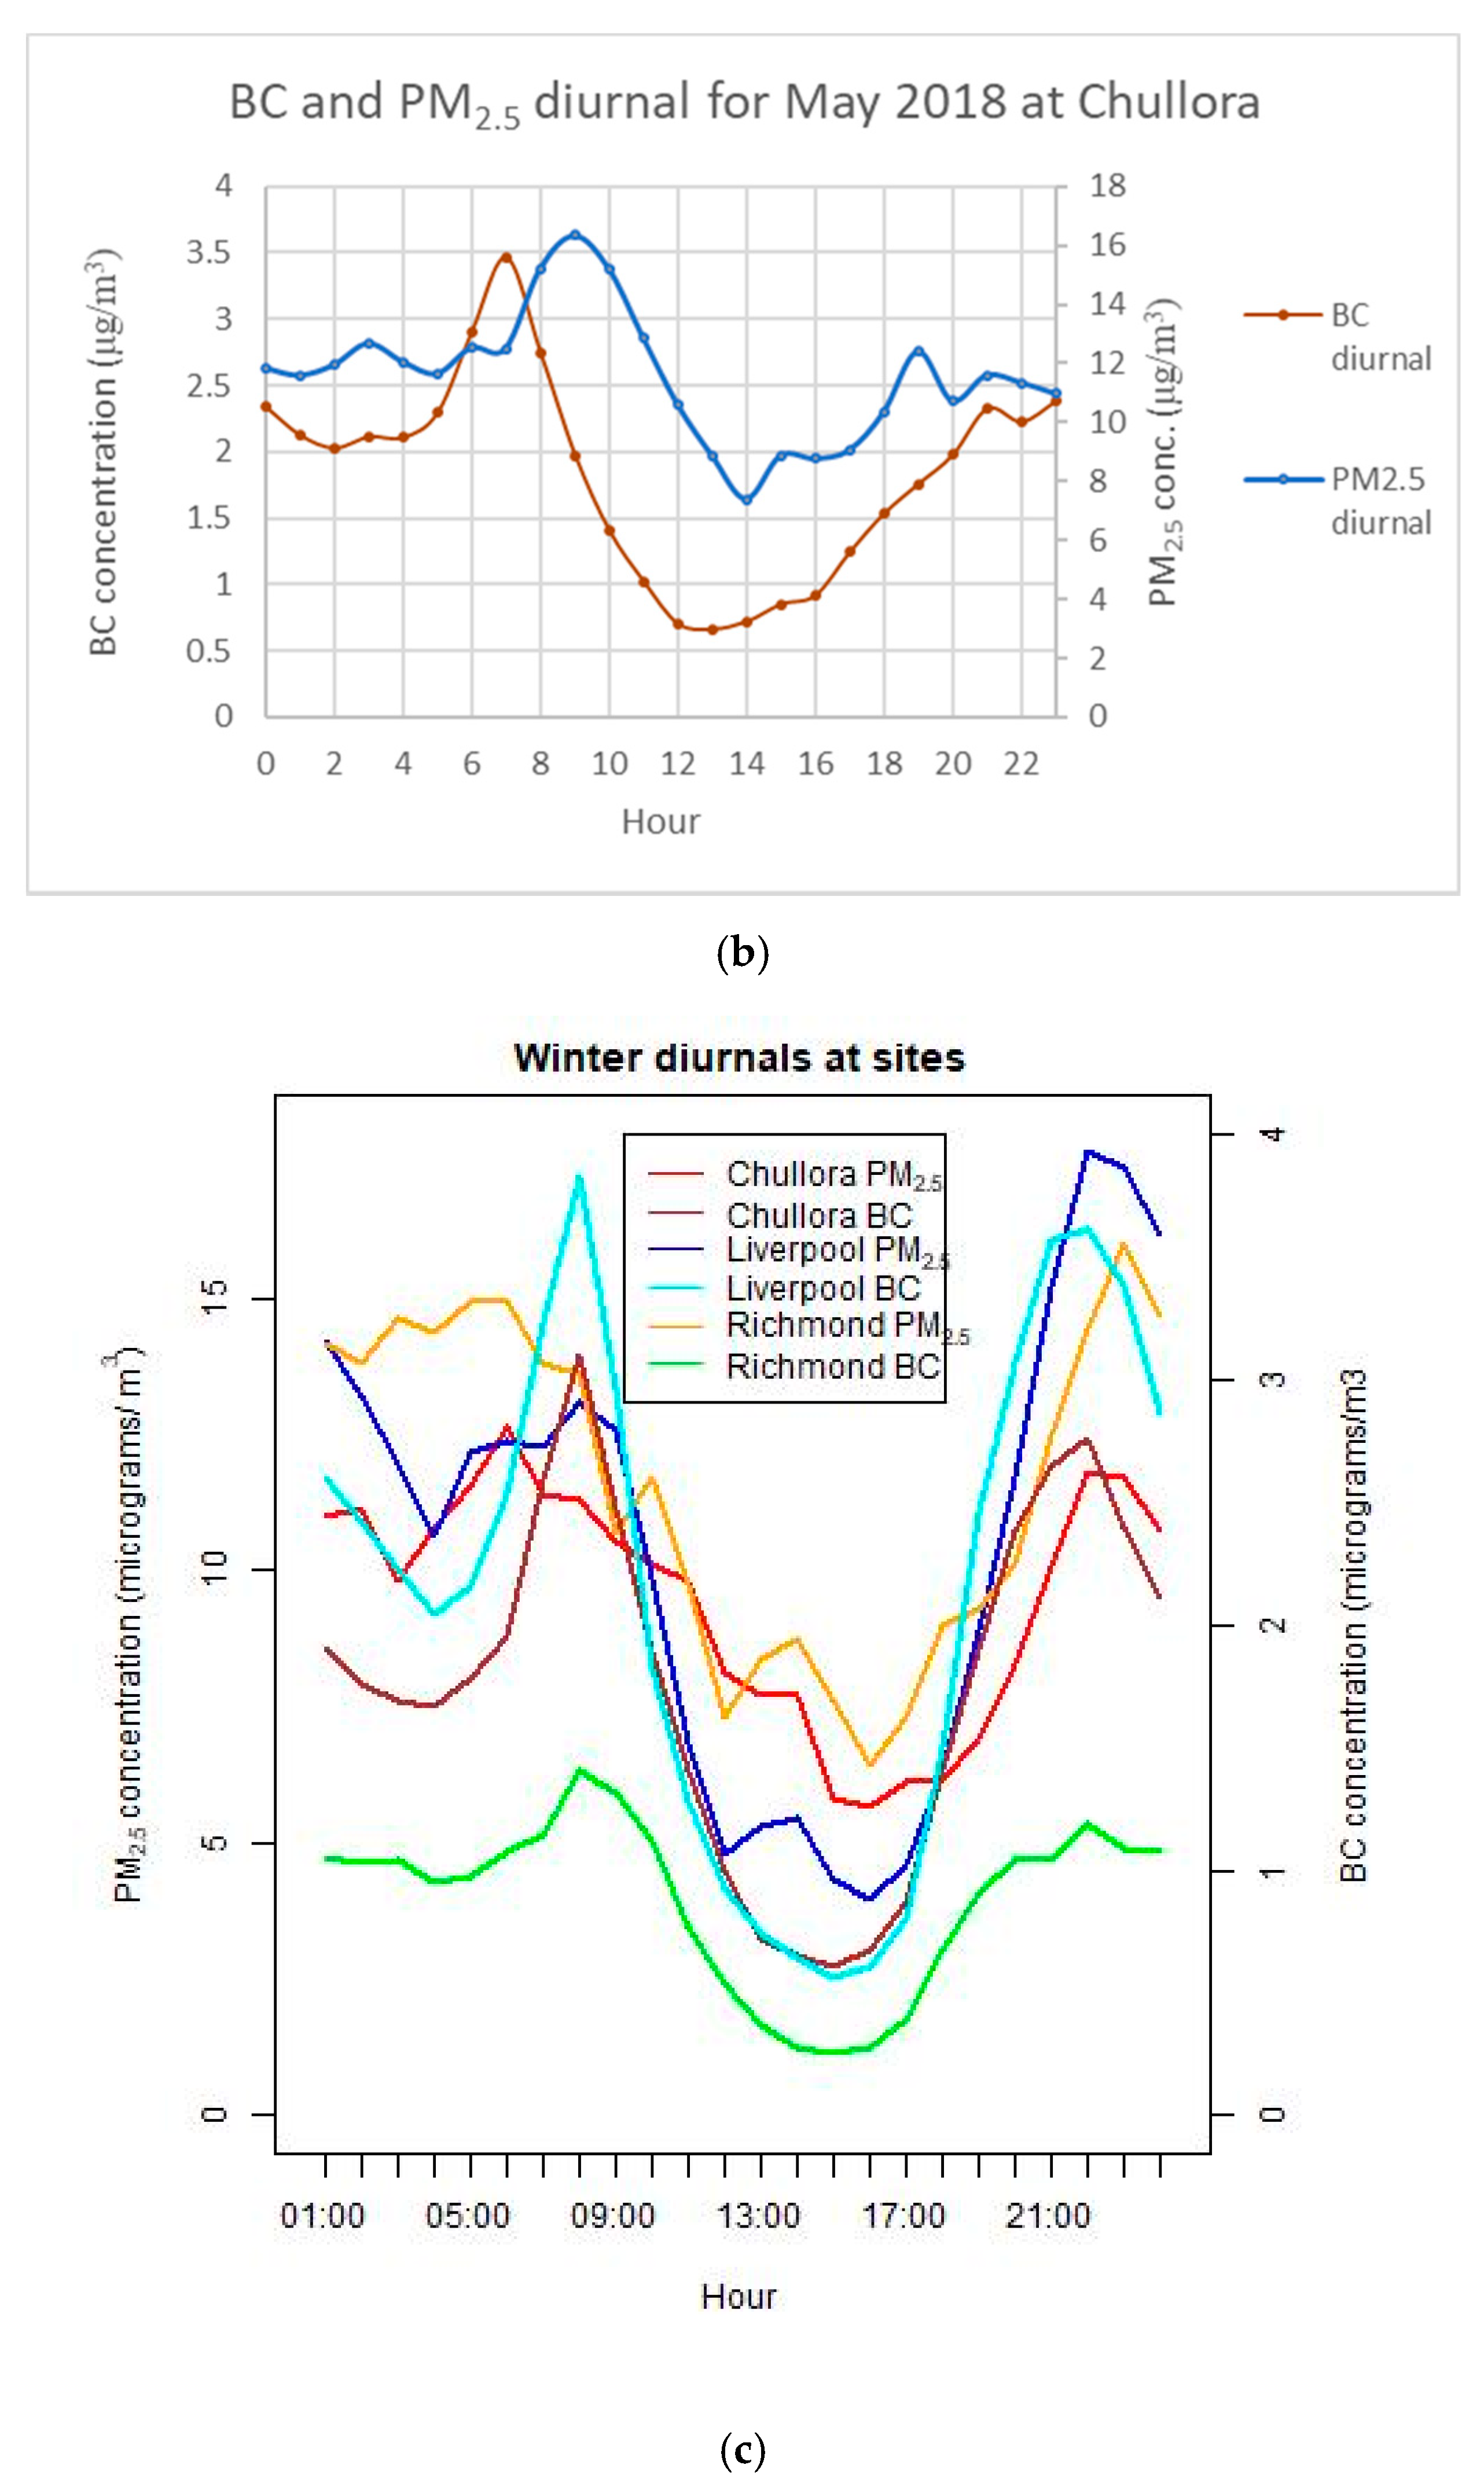
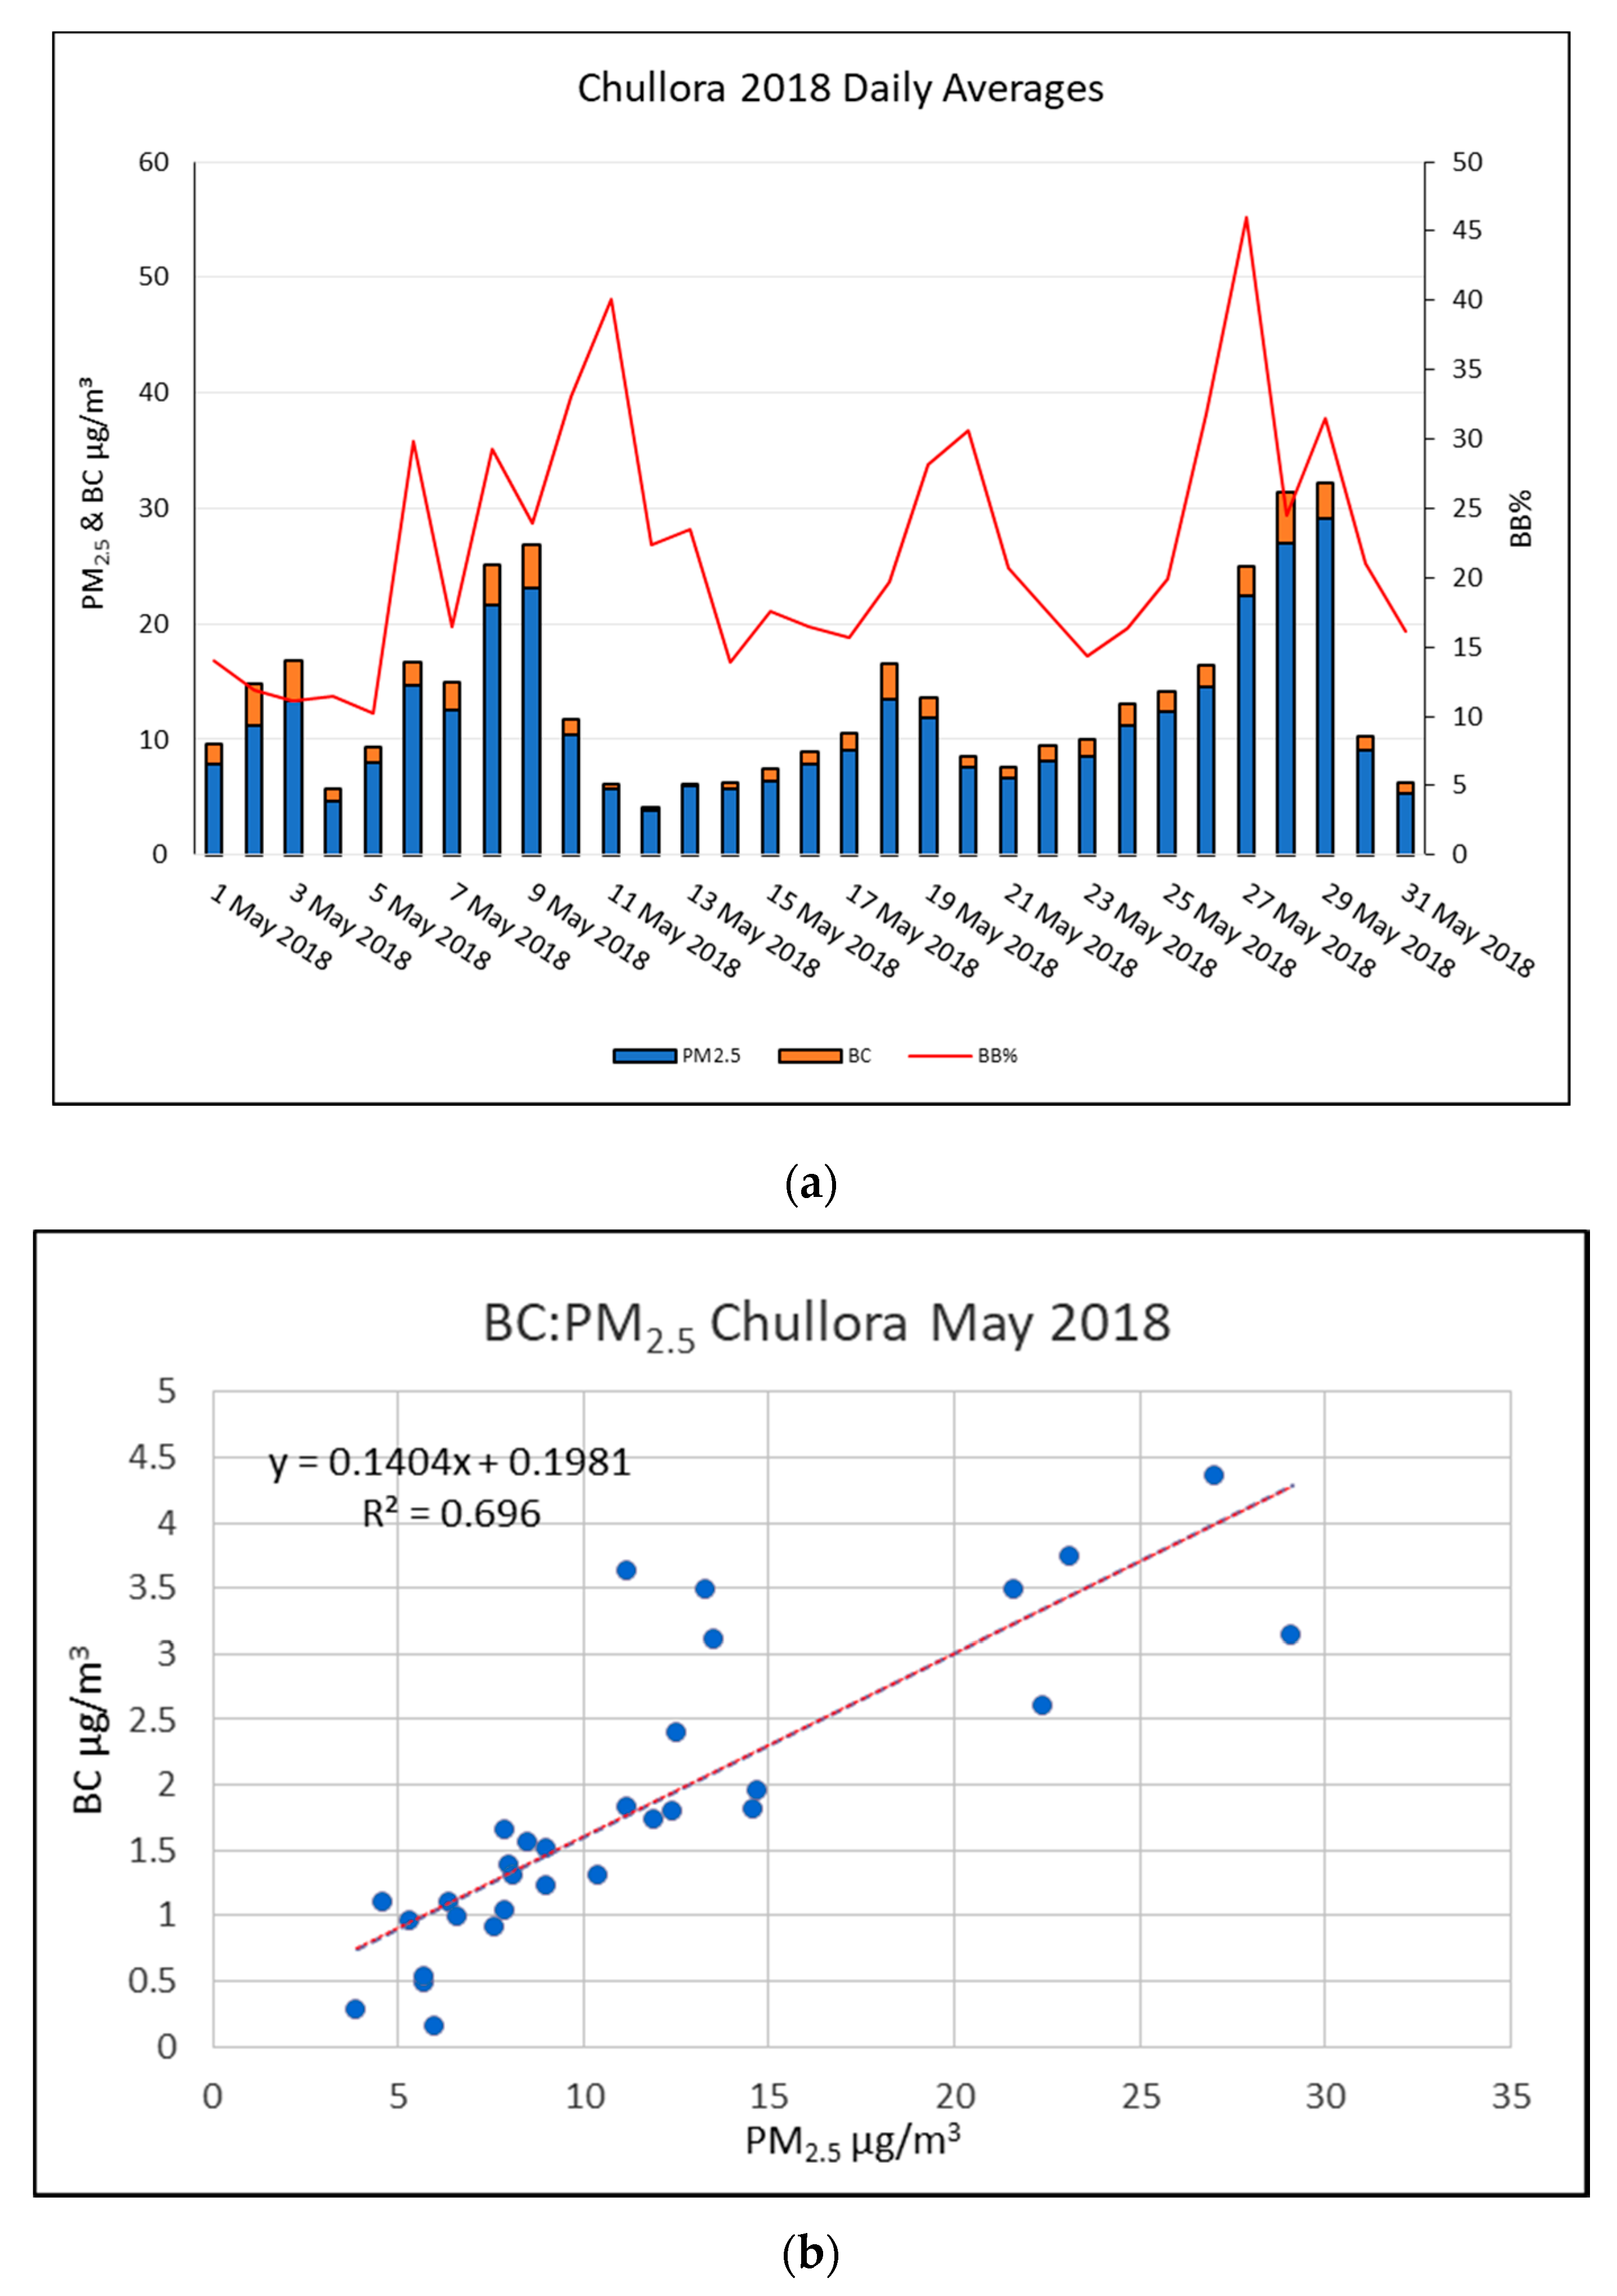
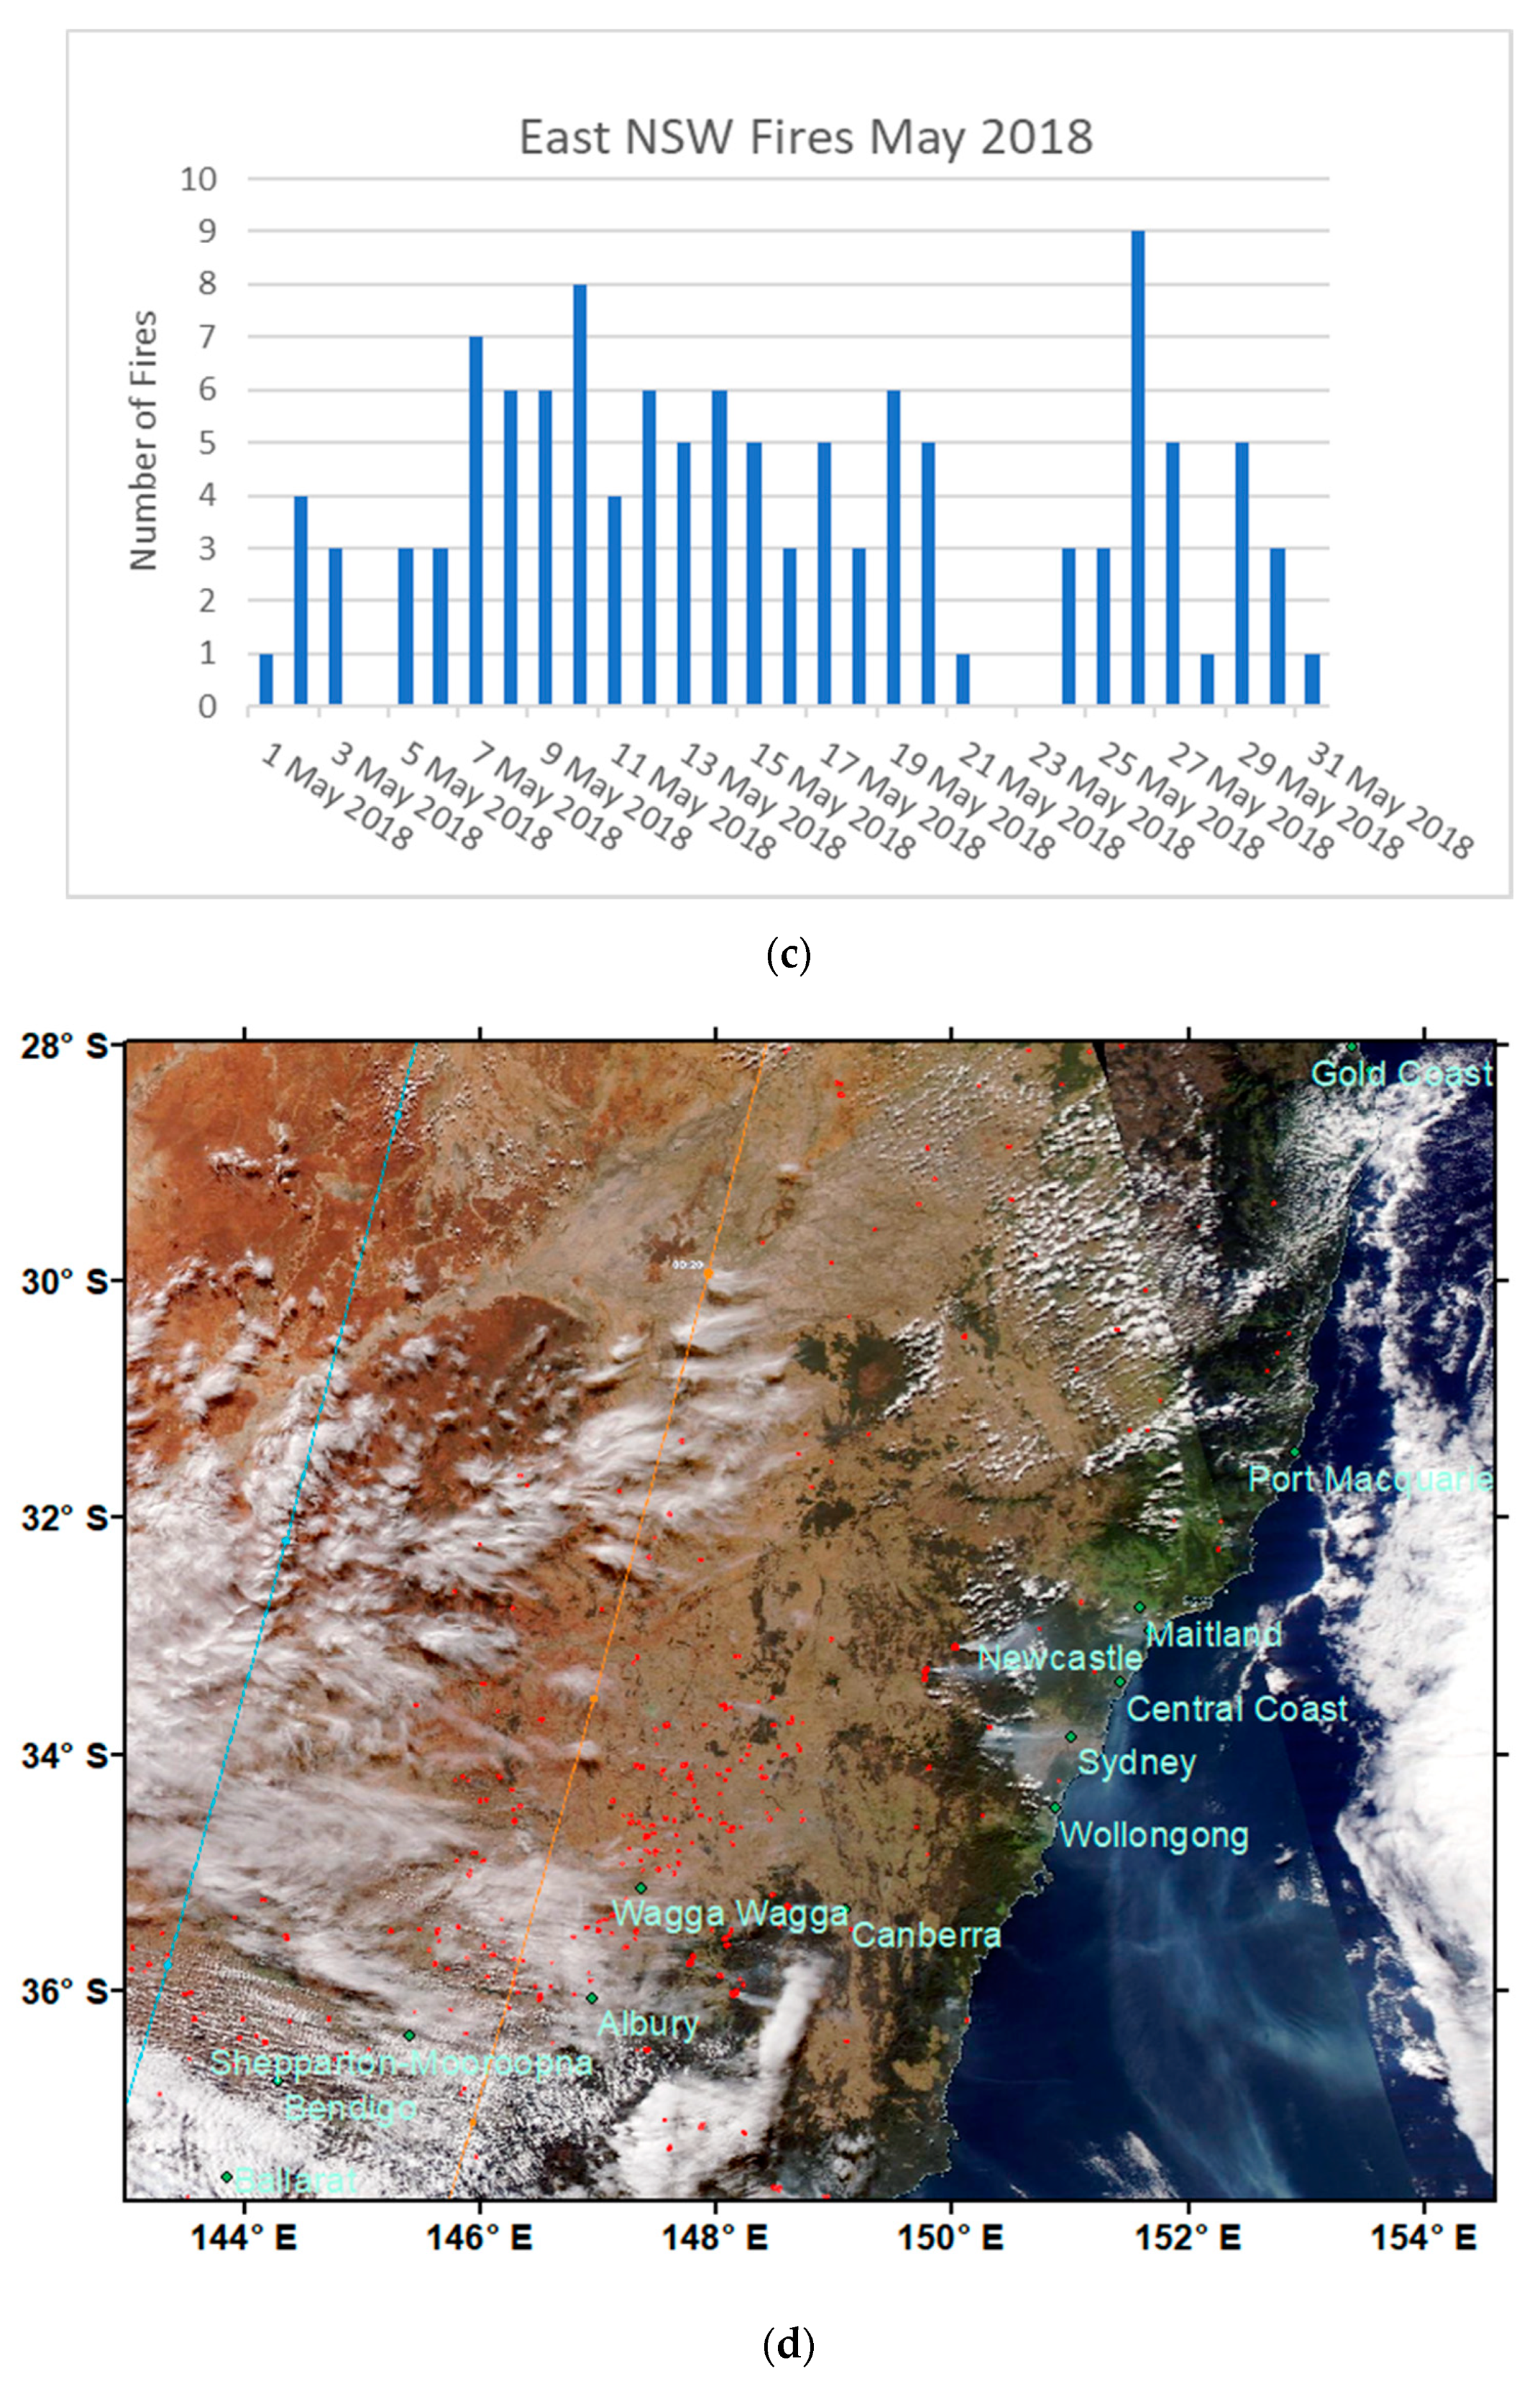
3.2.3. May 2018 Biomass Burnings

During the May 2018 period (from 1 May 2018 to 31 May 2018), a number of biomass burnings occurred in the vicinities of the Greater Metropolitan Region of Sydney affecting the air quality. The daily number of hazard reduction burnings in eastern NSW for May 2018, as counted from the fire history shapefiles provided by the Rural Fire Service (RFS), is shown in Figure 19c. The region included in the count is within 300 km to the north, south and west of Sydney. Figure 19a,c shows there is a correspondence between the daily number of fires and the daily average concentration of PM2.5 at Chullora monitoring station. Higher BB ratio and BC and PM2.5 concentration indicate higher smoke related concentration of PM2.5.
Percentage of BB is higher during this period compared to that during May 2016. Days of BB greater than 30% occur on 9–11, 20, 26–27 and 29 May. Of interest are the two days of 8 and 9 May 2018. On these days, as shown in Figure 19d, the biomass burnings in the Blue Mountain, west of Sydney, cause visible smoke plumes across the GMR. Figure 19b shows the regression of BC and PM2.5 during May 2018. The five points in the far right of the regression line, where high values of BC and PM2.5 (> 20 μg/m3) were detected at Chullora, correspond to 8, 9, 27, 28 and 29 May 2018. These high BC and PM2.5 were due to the transport of smoke from biomass burnings to the receptor site of Chullora. The presence of these high BC and PM2.5 values shifts the regression line downward from BC/PM2.5 of about 20% to 14%.
HYSPLIT backward trajectory analysis for 24 h on 9 May 2018 at 00:00 AEST (8 May 2028 14:00 UTC) when high concentration of BC (8.2 μg/m3) was detected at Chullora showed that the sources of high BC concentration were from the fires in the Blue Mountain, as shown in Figure 20. Similar backward trajectory on other hours when high BC were detected at Chullora on 8 and 9 May 2018 also indicated that the sources of high BC were from fires in the Blue Mountains.

4. Discussion

BC is produced from combustion sources and therefore is a better indicator to determine the source of the biomass burnings than PM2.5 or Back Scattering Coefficient (BSC) from nephelometer. The composition of OC and BC in PM2.5 as emitted from biomass burning and fossil fuel combustion such as coal or petrol/diesel fuel is different. As shown in Figure 14, by isolating the different BC emission sources (such as biomass burning or traffic related fuel combustion) from the BC/PM2.5 relationship, the high level of BC at a particular place can be attributed to a biomass burning source. For fossil fuel combustion, the contribution, or emission factor, of BC to PM2.5 mass depends on the type of fossil fuel source. For petrol/diesel fuel combustion from traffic, our results show that motor vehicle emission profile BC/PM2.5 is between 14% and 21%. This result can be compared to previous studies in various cities around the world. Song et al. (2014) [44] derived a BC/PM2.5 average of about 18% at a roadside site in Macao. In Jordan, Hussein et al. (2019) [45] reported that the BC to PM2.5 ratio is about 12% at an urban university campus. At a traffic site in Helsinki, Finland, Viidanoja et al. (2002) [46] conducted a study on one-year measurement period on diurnal PM2.5 and PM10 organic carbon (OC) and BC. They found that BC was at 14 ± 8% and 7 ± 4% of the total PM2.5 and PM10, respectively. Pérez et al. (2009) [47], in their study on the influence of road traffic emission on urban air quality in Barcelona, found at an urban site the BC/PM2.5 for traffic emission is about 13%. These results correspond our results for Sydney.
To determine the contribution of BC concentration from anthropogenic sources such as traffic emission, the relationship between PM2.5 and BC at a site can be derived from long-term time series correlation analysis excluding the bush fires and hazardous reduction burning days. In the Sydney GMR, one of the most important anthropogenic sources of BC is motor vehicle emission. The BC to PM2.5 concentration ratio from correlation analysis at Liverpool and Chullora, which are located in the southwest of Sydney and approximately in the centre of the Sydney metropolitan area, respectively, was about 21% and 11%, indicating traffic is the main contribution of measured BC, especially at Liverpool. This is in line with BB as calculated from 470 and 950 nm channels in AE33 aethalometer. In the previous study of BC at Newcastle, Upma et al. [42] reported that the BC/PM2.5 for the period from 10 December 2015 to 25 May 2017 on average is about 10% with higher values of 12–15% for autumn and winter. During autumn–winter, it can reach up to 30%. As with Sydney, BC in the Newcastle area mostly comes from traffic source.
The characteristics of the biomass burning, such as fuel type and combustion efficiency or fire behaviour during flaming or smothering stage, influence the emission factor of various species including BC and PM2.5. Each biomass burning is different and is unique. It is therefore beneficial to compare BC/PM2.5 ratios from cities in the tropics which are influenced by both traffic and biomass burnings. In a study at a traffic-influenced site in Dhaka, Bangladesh, BC accounted for an annual average contribution to the total PM2.5 of 33 ± 12% [48]. The authors of [48] noted that the sampling site in Dhaka was also influenced by both local and regional biomass burnings outside Dhaka. The high BC/PM2.5 ratio of 33% indicated that biomass burnings contributed to the BC and PM2.5 at this site. Their reported biomass burnings BC/PM2.5 ratios from 30% to 40% are different from our results, which show only from 4% to 8%. Santoso et al. (2013) [49] in their study of atmospheric BC in PM2.5 in Indonesian cities using collected samples for 2011 reported that the average percentage of BC in PM2.5 concentrations in Bandung, Jakarta, Palangka Raya, Serpong and Yogyakarta was 18%, 22%, 45%, 17% and 26%, respectively. The higher BC/PM2.5 of 45% in Palangka Raya than those of other cities was explained as due to forest fires that occurred frequently during the sampling period.
The high percentage of BC/PM2.5 at these sites in Indonesia and Bangladesh indicates biomass fires in the environment around these sites are at flaming stage more than at smothering phase. Biomass burning fires usually progress in two phases: flaming and smothering. Zhang et al. (2015) [50], in their measurement study of biomass burnings of wheat stubble, rice straw and rapeseed residue, found a strong linear correlation between BC and PM2.5 with high PM2.5/BC emission ratio in the smouldering phase (up to 80.7 mg/m3) compared to the flaming phase (2.0 mgm−3). This means the contribution of BC to PM2.5 mass was as high as 50% in the flaming phase while in the smouldering phase it decreased to about 1% [50].
In another study of vehicle emission and PM2.5 mass concentrations in six Brazilian state capital cities from winter 2007 to winter 2008 [51], the average BC concentration was reported as approximately 30% of PM2.5 mass. It is likely that biomass burnings, both local and regional, played a role in the resulted measurements of BC and PM2.5 in these cities. Gustafsson et al. (2009) [52], in their radiocarbon measurement study to determine the sources of brown haze over South Asia which plays as important to South Asian climate forcing as greenhouse gases, found that about two-thirds of BC is from biomass combustion while the rest is from fossil fuel combustion.
The ratio of BC/PM2.5 emission from motor vehicle emissions depends on the vehicle fleet composition and the emission standards as applied to the fleet. It is therefore expected that the composition of BC and PM2.5 can be different in each country. In Sydney at Chullora and the Lower Hunter at Newcastle, even though there were biomass burnings on a few days for the months of May 2016 and May 2018, the ratios of BC/PM2.5 are approximately about between 14% and 20% at these two locations averaged over the whole month. At Liverpool site, located in the southwest of Sydney, close to some major roads that are gridlocked in peak hour and downwind from major traffic sources of Sydney city, the BC/PM2.5 ratio is about 21% during the winter period of 2019. This result is comparable to those of Macao, Amman, Barcelona and Helsinki, which are less likely to be influenced by biomass burnings over the year. Traffic has more impact on BC concentration in Sydney overall compared to biomass burnings. However, during days where biomass burnings occurred and transported to Sydney, in which high BC and PM2.5 were detected, the BC/PM2.5 ratio is usually lower than 21% at about 10–15% but occasionally high and can be above 30% as in our case study of May 2016 at Chullora.
Our study also shows that there are little or no correlation between BC and PM2.5 during the summer period at all sites that have data available for analysis. The diurnal profiles for both BC and PM2.5 during summer at all the urban and regional sites show their concentration are much lower compared to those during winter. Compared to winter period, the PM2.5 and BC concentration peak of traffic pattern in the morning is detected during summer period but at night the peak is much smaller if not discernible. For the years with data available, bushfires were not a major factor in PM2.5 measurements at these locations. The warmer weather and fire restrictions also limits domestic and agricultural sources of BC. Additionally, the nocturnal boundary layer is significantly higher, which further limits the concentration of BC which occurs under lower boundary layers during cooler months.
At night, the boundary layer is lowest and hence higher concentrations of PM2.5 and BC were detected for both summer and winter period. Miao et al. (2019) [40], in their study of PBL height and PM2.5 pollution in 13 megacities in China, found that PBL height meteorology is one of the most critical factors affecting PM2.5 concentration in these cities and the diurnal cycle often shows two peaks, one in the early morning and the other in the evening corresponding to lower PBL height and peak anthropogenic emission from activities at these times. Tiwari et al. (2013) [53], in their study of diurnal and seasonal variations of BC and PM2.5 over New Delhi, India, found that BC concentrations usually peaked between 06:00 and 10:00 Local Standard Time (LST) and again between 21:00 and 23:00 LST, which correspond to the morning and evening traffic and meteorological effect of PBL and that the BC concentrations are higher during winter than summer. Our results on the diurnal profiles correspond to their results. In our study, the BC and PM2.5 levels are higher in winter period compared to those in summer period. This is consistent with others, e.g. the authros of [54] in their study of PM2.5 and BC exposure in New Delhi, a city which can often have high concentrations of BC and PM2.5, found that personal exposures to PM2.5 and BC are much higher in winter compared to those during summer (about nine times for PM2.5 and six times for BC) and there is a stronger correlation of personal exposure measurements of PM2.5 and BC and corresponding ambient measurements from fixed sites during winter compared to those during summer.
In the Sydney region, there is less biomass burnings from wood heating and HRBs but potentially more bushfires and more secondary organic aerosols (SOA) formation of PM2.5 from biogenic sources during the summer. Apart from dust from occasional dust storms originating from Central Australia and western New South Wales in early spring and summer, bushfires are a regular occurrence in and around the Sydney region; the bushfire danger period is from October to March with possible extensions due to high fuel loads and prevailing dry conditions.
The effects of bushfires on air quality is dependent on fire intensity and amount of pollutants emitted. High intensity fires with high emissions can produce high injection plumes which have the capacity to extend through the troposphere into the stratosphere resulting in wider ranges of transportation [14]. Low intensity fires are mostly confined to the PBL, consequently producing high BC concentrations [14]. High BC measurement at a site can be traced to a combustion source by using HYSPLIT backward trajectory model. The application of this model in our study has shown its usefulness in finding the location of the sources of high BC or PM2.5 as measured at particular sites in the May 2015, May 2016 and May 2018 periods during which HRBs and agricultural stubble burnings occurred in NSW. The MERRA-2 BC and aerosol assimilation system from GEOS-5 model and CALIPSO satellite product are also valuable to verify the BC temporal and spatial pattern as predicted from model such as WRF-Chem. However, the MERRA-2 BC prediction does not correspond well with observations in our case studies. Low resolution in both spatial and temporal domains which does not take into account local sources is one of the reasons.
Our future study will focus on the BC modelling based on the Weather Research Forecast WRF-Chem model using emission inventory of BC from local and global data sources. This will allow us to determine the predicted spatiotemporal distribution pattern of BC and PM2.5 concentration and their relationship across the modelling domain from various anthropogenic and natural BC emission sources. In addition, PM2.5 composition data from Australia’s Nuclear Science and Technology Organisation (ANSTO) based on Ion Beam Analysis at their monitoring sites in Sydney will be also used to further understand the contribution of BC sources at a site.
This study shows that BC monitoring in NSW the past few years has provided a rich source of data to study the effect of biomass burnings (such as bushfires or Hazard Reduction Burning) and combustion sources (mainly motor vehicles) on particle pollution in New South Wales. The health impact of BC is gaining interest due to its toxicity and potential higher risk than PM2.5. As a radiative forcing agent for global warming, BC has played an important role in climate change model considerations. Recent studies have shown that the brown haze covering much of the South Asia and Indian Ocean came mostly from biomass burnings [52]. Accurate modelling of their effect is required for reducing the uncertainties in many current global climate models. The scale of BC emission from biomass burnings such as bushfires in NSW in particular and Australia in general is quite significant, comparable to other regions (such as South America, Central Africa and South and Southeast Asia) but the fate of BC in the air in NSW is currently little understood.

5. Conclusions

Interests in BC due to its health impact in epidemiology and short-term global warming potential in accelerating climate change is increasing recently. The introduction of aethalometers to measure BC in the NSW DPIE air quality monitoring network in 2014 at Chullora and Beresfield and since then expanded to six monitoring sites has facilitated the determination of the contribution of various natural and anthropogenic combustion sources to particles concentration in the atmosphere. The BC data, in addition to other ambient pollutants, are a valuable source for air quality, health impact and climate change studies. This study focused on the spatiotemporal pattern of BC emission from biomass and fossil fuel combustion and their effect on air quality in NSW. In the GMR urban areas, motor vehicle emissions are identified as the main anthropogenic source to BC emission. Its composition in PM2.5 at various sites with distinct regressive patterns during the winter is compared to regional sites at Armidale and Wagga Wagga North, where wood heating and agricultural biomass burnings are the dominant sources of BC emission. The fingerprint of winter BC/PM2.5 attributed to different combustion sources originated from local traffic or wood heating to remote biomass burnings is helpful in determining the attribution of BC emission at a site. The diurnal profiles of BC for winter and summer show a distinct early morning peak at about 8 am for winter but no such peak was found in the summer period. There is no correlation between BC and PM2.5 during summer, while, in winter, correlations are found at varying degrees of correlation coefficients at different sites in urban and regional areas.
This study also shows that the aethalometer instruments in the DPIE network are valuable to detect the dispersion and distribution pattern of pollutants from biomass burnings as well as to determine the location of these burnings using both ground and satellite data and model and trajectory analysis such as HYSPLIT.

Supplementary Materials

The following are available online at https://www.mdpi.com/2073-4433/11/6/570/s1, Data Deposit and Software Source Code.

Author Contributions

Conceptualisation, H.N.D. and K.S.; methodology, H.N.D., K.S., S.W. and D.S.; data procurement: D.S., K.S., G.G., J.K. and R.H.; formal analysis, H.N.D., K.S., S.W., D.S. and L.T.-C.C.; investigation, H.N.D., K.S., T.T., L.T.-C.C., S.W. and U.D.; writing—original draft preparation, H.N.D., K.S., L.T.-C.C. and S.W.; visualisation, H.N.D.; supervision, H.N.D. and M.R.; and project administration, H.N.D., M.R., K.B. and M.A. All authors have read and agreed to the published version of the manuscript.

Funding

This research received no external funding.

Acknowledgments

The MERRA-2 data used in this study/project were provided by the Global Modeling and Assimilation Office (GMAO) at NASA Goddard Space Flight Center. Analyses and visualisations, where they are indicated in the paper, were produced with the Giovanni online data system, developed and maintained by the NASA GES DISC, and the CALIPSO satellite products from NASA Langley Research Center (http://www-calipso.larc.nasa.gov/products/lidar/browse_images/production/). We also acknowledge the NOAA Air Resources Laboratory (ARL) for the provision of the HYSPLIT transport and dispersion model and/or READY website (http://www.ready.noaa.gov) used in this publication.

Conflicts of Interest

The authors declare no conflict of interest.

Data availability

The data used in this work are available in the data deposit. R code is also included.

References

  1. Salimi, F.; Henderson, S.B.; Morgan, G.G.; Jalaludin, B.; Johnston, F. Ambient particulate matter, landscape fire smoke, and emergency ambulance dispatches in Sydney, Australia. Environ. Int. 2017, 99, 208–212. [Google Scholar] [CrossRef]
  2. Broome, R.A.; Johnston, F.; Horsley, J.; Morgan, G.G. A rapid assessment of the impact of hazard reduction burning around Sydney, May 2016. Med. J. Aust. 2016, 205, 407–408. [Google Scholar] [CrossRef] [PubMed]
  3. Petzold, A.; Ogren, J.; Fiebig, M.; Laj, P.; Li, S.-M.; Baltensperger, U.; Popp, T.; Kinne, S.; Pappalardo, G.; Sugimoto, N.; et al. Recommendations for reporting “black carbon” measurements. Atmos. Chem. Phys. Discuss. 2013, 13, 8365–8379. [Google Scholar] [CrossRef] [Green Version]
  4. Walsh, M.P. PM2.5: Global progress in controlling the motor vehicle contribution. Front. Environ. Sci. Eng. 2014, 8, 1–17. [Google Scholar] [CrossRef]
  5. Ding, A.; Huang, X.; Nie, W.; Sun, J.N.; Kerminen, V.-M.; Petäjä, T.; Su, H.; Cheng, Y.; Yang, X.-Q.; Wang, M.H.; et al. Enhanced haze pollution by black carbon in megacities in China. Geophys. Res. Lett. 2016, 43, 2873–2879. [Google Scholar] [CrossRef]
  6. Liu, Q.; Jia, X.; Quan, J.; Li, J.; Li, X.; Wu, Y.; Chen, D.; Wang, Z.; Liu, Y. New positive feedback mechanism between boundary layer meteorology and secondary aerosol formation during severe haze events. Sci. Rep. 2018, 8, 6095. [Google Scholar] [CrossRef]
  7. Williams, R.D.; Knibbs, L.D. Daily personal exposure to black carbon: A pilot study. Atmos. Environ. 2016, 132, 296–299. [Google Scholar] [CrossRef] [Green Version]
  8. DeCastro, B.R.; Wang, L.; Mihalic, J.N.; Breysse, P.N.; Geyh, A.S.; Buckley, T.J. The longitudinal dependence of black carbon concentration on traffic volume in an urban environment. J. Air Waste Manag. Assoc. 2008, 58, 928–939. [Google Scholar] [CrossRef]
  9. Crawford, J.; Griffiths, A.; Cohen, D.D.; Jiang, N.; Stelcer, E. Particulate Pollution in the Sydney Region: Source Diagnostics and Synoptic Controls. Aerosol Air Qual. Res. 2016, 16, 1055–1066. [Google Scholar] [CrossRef] [Green Version]
  10. WHO. Health Effects of Black Carbon; WHO Regional Office for Europe: Geneva, Switzerland, 2012. [Google Scholar]
  11. Janssen, N.A.; Hoek, G.; Simic-Lawson, M.; Fischer, P.; Van Bree, L.; Brink, H.T.; Keuken, M.; Atkinson, R.; Anderson, H.R.; Brunekreef, B.; et al. Black Carbon as an Additional Indicator of the Adverse Health Effects of Airborne Particles Compared with PM10 and PM2.5. Environ. Health Perspect. 2011, 119, 1691–1699. [Google Scholar] [CrossRef] [Green Version]
  12. Hvidtfeldt, U.A.; Sørensen, M.; Geels, C.; Ketzel, M.; Khan, J.; Tjønneland, A.; Overvad, K.; Brandt, J.; Raaschou-Nielsen, O. Long-term residential exposure to PM2.5, PM10, black carbon, NO2, and ozone and mortality in a Danish cohort. Environ. Int. 2019, 123, 265–272. [Google Scholar] [CrossRef] [PubMed]
  13. Segersson, D.; Eneroth, K.; Gidhagen, L.; Johansson, C.; Omstedt, G.; Nylén, A.E.; Forsberg, B. Health Impact of PM10, PM2.5 and Black Carbon Exposure Due to Different Source Sectors in Stockholm, Gothenburg and Umea, Sweden. Int. J. Environ. Res. Public Health 2017, 14, 742. [Google Scholar] [CrossRef] [PubMed] [Green Version]
  14. Rea, G.; Paton-Walsh, C.; Turquety, S.; Cope, M.E.; Griffith, D. Impact of the New South Wales fires during October 2013 on regional air quality in eastern Australia. Atmos. Environ. 2016, 131, 150–163. [Google Scholar] [CrossRef] [Green Version]
  15. Lou, S.; Yang, Y.; Wang, H.; Smith, S.J.; Qian, Y.; Rasch, P.J. Black Carbon Amplifies Haze Over the North China Plain by Weakening the East Asian Winter Monsoon. Geophys. Res. Lett. 2019, 46, 452–460. [Google Scholar] [CrossRef] [Green Version]
  16. Di Ianni, A.; Costabile, F.; Barnaba, F.; Di Liberto, L.; Weinhold, K.; Wiedensohler, A.; Struckmeier, C.; Drewnick, F.; Gobbi, G. Black Carbon Aerosol in Rome (Italy): Inference of a Long-Term (2001–2017) Record and Related Trends from AERONET Sun-Photometry Data. Atmosphere 2018, 9, 81. [Google Scholar] [CrossRef] [Green Version]
  17. Randles, C.; Da Silva, A.M.; Buchard, V.; Colarco, P.R.; Darmenov, A.; Govindaraju, R.; Smirnov, A.; Holben, B.; Ferrare, R.; Hair, J.; et al. The MERRA-2 Aerosol Reanalysis, 1980 Onward. Part I: System Description and Data Assimilation Evaluation. J. Clim. 2017, 30, 6823–6850. [Google Scholar] [CrossRef]
  18. Molod, A.; Takács, L.; Suárez, M.; Bacmeister, J. Development of the GEOS-5 atmospheric general circulation model: Evolution from MERRA to MERRA2. Geosci. Model Dev. 2015, 8, 1339–1356. [Google Scholar] [CrossRef] [Green Version]
  19. Gelaro, R.; Mccarty, W.; Suárez, M.J.; Todling, R.; Molod, A.; Takacs, L.; Randles, C.; Darmenov, A.; Bosilovich, M.G.; Reichle, R.; et al. The Modern-Era Retrospective Analysis for Research and Applications, Version 2 (MERRA-2). J. Clim. 2017, 30, 5419–5454. [Google Scholar] [CrossRef]
  20. Buchard, V.; Randles, C.; Da Silva, A.M.; Darmenov, A.; Colarco, P.R.; Govindaraju, R.; Ferrare, R.; Hair, J.; Beyersdorf, A.J.; Ziemba, L.D.; et al. The MERRA-2 Aerosol Reanalysis, 1980 Onward. Part II: Evaluation and Case Studies. J. Clim. 2017, 30, 6851–6872. [Google Scholar] [CrossRef]
  21. Feng, J.; Zhong, M.; Xu, B.; Du, Y.; Wu, M.; Wang, H.; Chen, C. Concentrations, seasonal and diurnal variations of black carbon in PM2.5 in Shanghai, China. Atmos. Res. 2014, 147, 1–9. [Google Scholar] [CrossRef]
  22. Drinovec, L.; Močnik, G.; Zotter, P.; Prévôt, A.S.H.; Ruckstuhl, C.; Coz, E.; Rupakheti, M.; Sciare, J.; Muller, T.; Wiedensohler, A.; et al. The “dual-spot” Aethalometer: An improved measurement of aerosol black carbon with real-time loading compensation. Atmos. Meas. Tech. 2015, 8, 1965–1979. [Google Scholar] [CrossRef] [Green Version]
  23. Sandradewi, J.; Prévôt, A.S.H.; Szidat, S.; Perron, N.; Alfarra, M.; Lanz, V.A.; Weingartner, E.; Baltensperger, U. Using Aerosol Light Absorption Measurements for the Quantitative Determination of Wood Burning and Traffic Emission Contributions to Particulate Matter. Environ. Sci. Technol. 2008, 42, 3316–3323. [Google Scholar] [CrossRef] [PubMed]
  24. Mousavi, A.; Sowlat, M.H.; Hasheminassab, S.; Polidori, A.; Sioutas, C. Spatio-temporal trends and source apportionment of fossil fuel and biomass burning black carbon (BC) in the Los Angeles Basin. Sci. Total. Environ. 2018, 641, 1231–1240. [Google Scholar] [CrossRef] [PubMed]
  25. Healy, R.M.; Sofowote, U.; Su, Y.; Debosz, J.; Noble, M.; Jeong, C.-H.; Wang, J.; Hilker, N.; Evans, G.; Doerksen, G.; et al. Ambient measurements and source apportionment of fossil fuel and biomass burning black carbon in Ontario. Atmos. Environ. 2017, 161, 34–47. [Google Scholar] [CrossRef]
  26. Helin, A.; Niemi, J.V.; Virkkula, A.; Pirjola, L.; Teinilä, K.; Backman, J.; Aurela, M.; Saarikoski, S.; Rönkkö, T.; Asmi, E.; et al. Characteristics and source apportionment of black carbon in the Helsinki metropolitan area, Finland. Atmos. Environ. 2018, 190, 87–98. [Google Scholar] [CrossRef]
  27. Magee Scientific. Aethalometer® Model AE33 User Manual Version 1.54; Magee Scientific: Ljubljana, Slovenia, 2016. [Google Scholar]
  28. Wallace, L.A. Real-Time Measurements of Black Carbon Indoors and Outdoors: A Comparison of the Photoelectric Aerosol Sensor and the Aethalometer. Aerosol Sci. Technol. 2005, 39, 1015–1025. [Google Scholar] [CrossRef]
  29. Drinovec, L.; Gregorič, A.; Zotter, P.; Wolf, R.; Bruns, E.A.; Prévôt, A.S.H.; Petit, J.-E.; Favez, O.; Sciare, J.; Arnold, I.J.; et al. The filter-loading effect by ambient aerosols in filter absorption photometers depends on the coating of the sampled particles. Atmos. Meas. Tech. 2017, 10, 1043–1059. [Google Scholar] [CrossRef] [Green Version]
  30. Wang, Y.; Hopke, P.K.; Ratigan, O.V.; Xia, X.; Chalupa, D.C.; Utell, M.J. Characterization of esidential wood combustion particles using the two-wavelength aethalometer. Environ. Sci. Technol. 2011, 45, 7387–7393. [Google Scholar] [CrossRef]
  31. Harrison, R.M.; Beddows, D.; Jones, A.M.; Calvo, A.; Alves, C.; Pio, C. An evaluation of some issues regarding the use of aethalometers to measure woodsmoke concentrations. Atmos. Environ. 2013, 80, 540–548. [Google Scholar] [CrossRef] [Green Version]
  32. Healy, R.M.; Wang, J.M.; Sofowote, U.; Su, Y.; Debosz, J.; Noble, M.; Munoz, A.; Jeong, C.-H.; Hilker, N.; Evans, G.J.; et al. Black carbon in the Lower Fraser Valley, British Columbia: Impact of 2017 wildfires on local air quality and aerosol optical properties. Atmos. Environ. 2019, 217, 116976. [Google Scholar] [CrossRef]
  33. Stein, A.; Draxler, R.R.; Rolph, G.D.; Stunder, B.J.B.; Cohen, M.D.; Ngan, F. NOAA’s HYSPLIT Atmospheric Transport and Dispersion Modeling System. Bull. Am. Meteorol. Soc. 2015, 96, 2059–2077. [Google Scholar] [CrossRef]
  34. DeWitt, H.L.; Gasore, J.; Rupakheti, M.; Potter, K.E.; Prinn, R.G.; Ndikubwimana, J.D.D.; Nkusi, J.; Safari, B. Seasonal and diurnal variability in O3, black carbon, and CO measured at the Rwanda Climate Observatory. Atmos. Chem. Phys. Discuss. 2019, 19, 2063–2078. [Google Scholar] [CrossRef] [Green Version]
  35. Colarco, P.; Da Silva, A.; Chin, M.; Diehl, T. Online simulations of global aerosol distributions in the NASA GEOS-4 model and comparisons to satellite and ground-based aerosol optical depth. J. Geophys. Res. Space Phys. 2010, 115. [Google Scholar] [CrossRef] [Green Version]
  36. Colarco, P.; Kahn, R.A.; Remer, L.A.; LevyiD, R. Impact of satellite viewing swath width on global and regional aerosol optical thickness statistics and trends. Atmos. Meas. Tech. Discuss. 2013, 6, 10117–10163. [Google Scholar] [CrossRef] [Green Version]
  37. Chen, S.-P.; Lu, C.-H.; McQueen, J.; Lee, P.; McQueen, J. Application of satellite observations in conjunction with aerosol reanalysis to characterize long-range transport of African and Asian dust on air quality in the contiguous U.S. Atmos. Environ. 2018, 187, 174–195. [Google Scholar] [CrossRef]
  38. Stohl, A.; Klimont, Z.; Eckhardt, S.; Kupiainen, K.; Shevchenko, V.; Kopeikin, V.M.; Novigatsky, A. Black carbon in the Arctic: The underestimated role of gas flaring and residential combustion emissions. Atmos. Chem. Phys. Discuss. 2013, 13, 8833–8855. [Google Scholar] [CrossRef] [Green Version]
  39. Kupiainen, K.; Klimont, Z. Primary emissions of fine carbonaceous particles in Europe. Atmos. Environ. 2007, 41, 2156–2170. [Google Scholar] [CrossRef]
  40. Miao, Y.; Li, J.; Miao, S.; Che, H.; Wang, Y.; Zhang, X.; Zhu, R.; Liu, S. Interaction Between Planetary Boundary Layer and PM2.5 Pollution in Megacities in China: A Review. Curr. Pollut. Rep. 2019, 5, 261–271. [Google Scholar] [CrossRef] [Green Version]
  41. Robinson, D.; Monro, J.; Campbell, E. Spatial variability and population exposure to PM2.5 pollution from woodsmoke in a New South Wales country town. Atmos. Environ. 2007, 41, 5464–5478. [Google Scholar] [CrossRef]
  42. Dutt, U.; Jiang, N.; Ross, G.; Gunaratnam, G. Application of the Aethalometer for Black Carbon Source Analysis. Air Qual. Clim. Chang. 2018, 52, 6–10. [Google Scholar]
  43. Park, S.-S.; Lee, K.H. Characterization and sources of black carbon in PM2.5at a site close to a roadway in Gwangju, Korea, during winter. Environ. Sci. Process. Impacts 2015, 17, 1794–1805. [Google Scholar] [CrossRef]
  44. Song, S.; Wu, Y.; Zheng, X.; Wang, Z.; Yang, L.; Li, J.; Hao, J. Chemical characterization of roadside PM2.5 and black carbon in Macao during a summer campaign. Atmos. Pollut. Res. 2014, 5, 381–387. [Google Scholar] [CrossRef] [Green Version]
  45. Hussein, T.; Saleh, S.S.A.; Dos Santos, V.N.; Abdullah, H.; Boor, B.E. Black Carbon and Particulate Matter Concentrations in Eastern Mediterranean Urban Conditions: An Assessment Based on Integrated Stationary and Mobile Observations. Atmosphere 2019, 10, 323. [Google Scholar] [CrossRef] [Green Version]
  46. Viidanoja, J.; Sillanpää, M.; Laakia, J.; Kerminen, V.-M.; Hillamo, R.; Aarnio, P.; Koskentalo, T. Organic and black carbon in PM2.5 and PM10: 1 year of data from an urban site in Helsinki, Finland. Atmos. Environ. 2002, 36, 3183–3193. [Google Scholar] [CrossRef]
  47. Perez, N.; Pey, J.; Cusack, M.; Reche, C.; Querol, X.; Alastuey, A.; Viana, M. Variability of Particle Number, Black Carbon, and PM10, PM2.5, and PM1Levels and Speciation: Influence of Road Traffic Emissions on Urban Air Quality. Aerosol Sci. Technol. 2010, 44, 487–499. [Google Scholar] [CrossRef]
  48. Begum, B.A.; Hossain, A.; Nahar, N.; Markwitz, A.; Hopke, P.K. Organic and Black Carbon in PM2.5 at an Urban Site at Dhaka, Bangladesh. Aerosol Air Qual. Res. 2012, 12, 1062–1072. [Google Scholar] [CrossRef] [Green Version]
  49. Santoso, M.; Lestiani, D.D.; Hopke, P.K. Atmospheric black carbon in PM2.5 in Indonesian cities. J. Air Waste Manag. Assoc. 2013, 63, 1022–1025. [Google Scholar] [CrossRef] [Green Version]
  50. Zhang, T.; Wooster, M.J.; Green, D.; Main, B. New field-based agricultural biomass burning trace gas, PM 2.5, and black carbon emission ratios and factors measured in situ at crop residue fires in Eastern China. Atmos. Environ. 2015, 121, 22–34. [Google Scholar] [CrossRef] [Green Version]
  51. Andrade, M.F.; De Miranda, R.M.; Fornaro, A.; Kerr, A.; Oyama, B.; De Andre, P.A.; Saldiva, P.H. Vehicle emissions and PM2.5 mass concentrations in six Brazilian cities. Air Qual. Atmos. Health 2010, 5, 79–88. [Google Scholar] [CrossRef] [Green Version]
  52. Gustafsson, Ö.; Kruså, M.; Zencak, Z.; Sheesley, R.J.; Granat, L.; Engstrom, E.; Praveen, P.S.; Rao, P.S.P.; Leck, C.; Rodhe, H. Brown Clouds over South Asia: Biomass or Fossil Fuel Combustion? Science 2009, 323, 495–498. [Google Scholar] [CrossRef]
  53. Tiwari, S.; Srivastava, A.; Bisht, D.; Parmita, P.; Srivastava, M.K.; Attri, S. Diurnal and seasonal variations of black carbon and PM2.5 over New Delhi, India: Influence of meteorology. Atmos. Res. 2013, 125, 50–62. [Google Scholar] [CrossRef]
  54. Pant, P.; Habib, G.; Marshall, J.D.; Peltier, R.E. PM2.5 exposure in highly polluted cities: A case study from New Delhi, India. Environ. Res. 2017, 156, 167–174. [Google Scholar] [CrossRef] [PubMed]
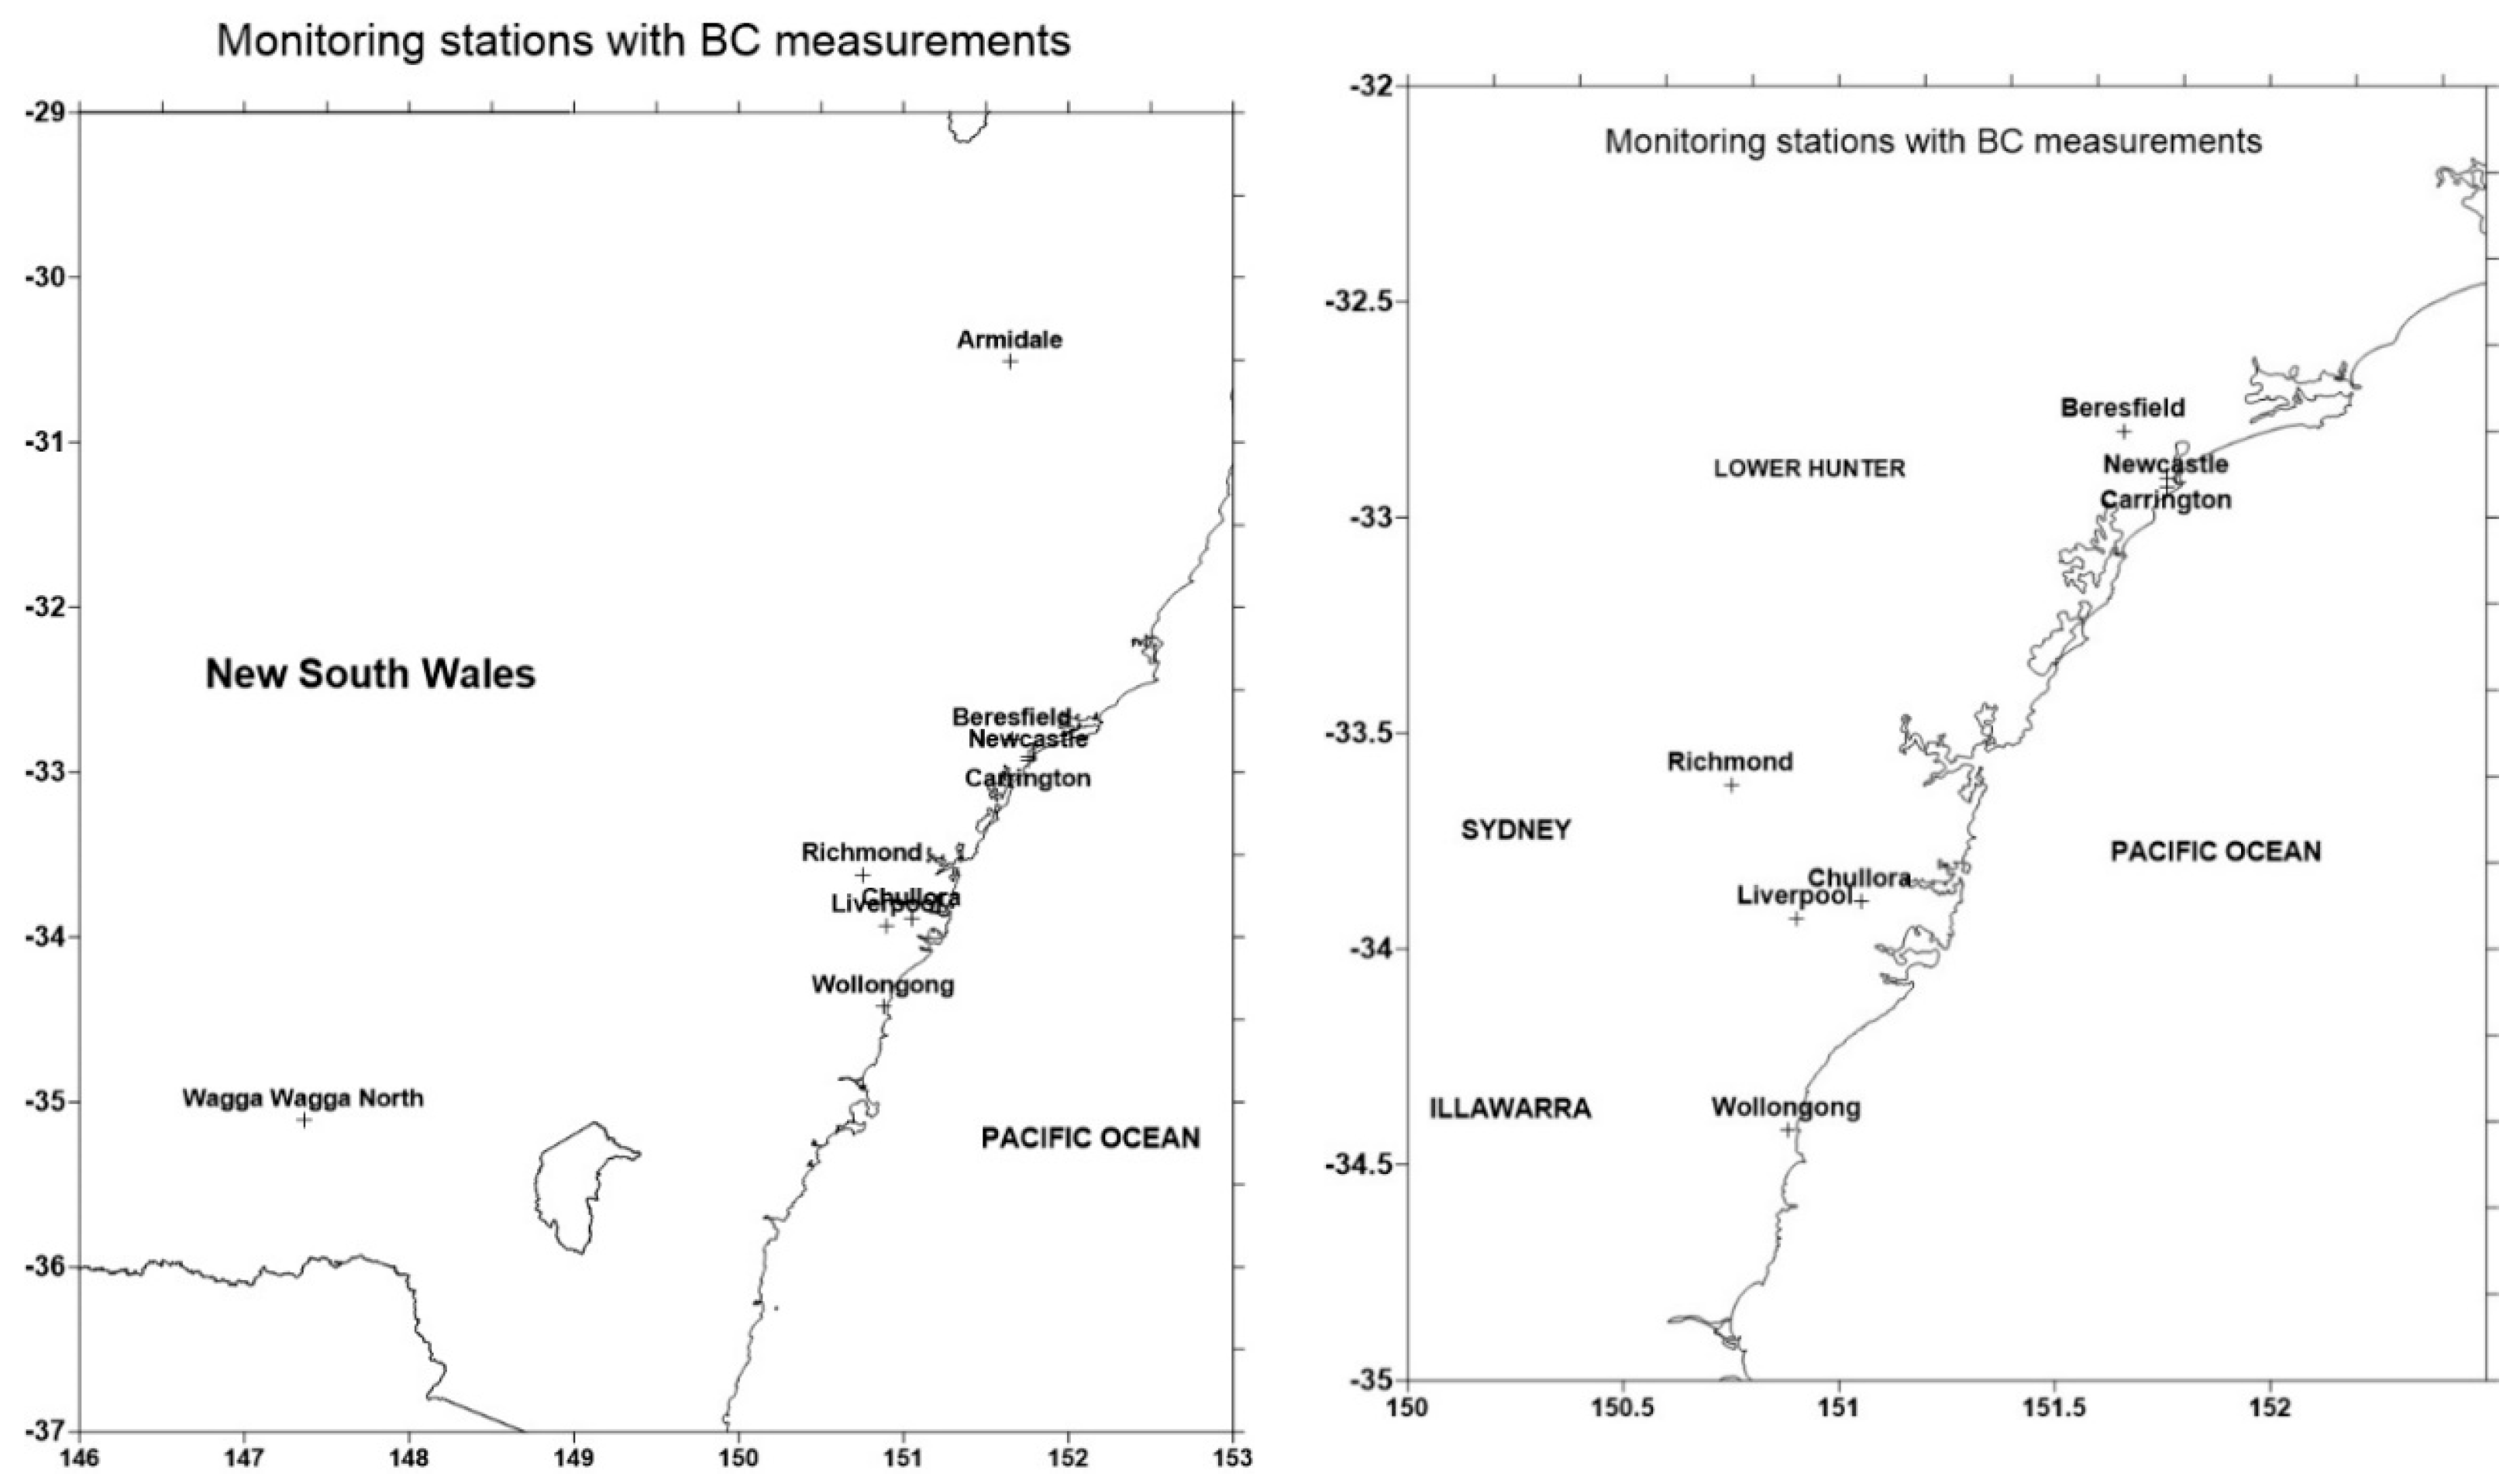
Figure 1. Air quality monitoring stations in NSW (left) and in the Greater Metropolitan Region of Sydney (GMR) with aethalometers installed (right).
Atmosphere 11 00570 g001
Figure 2. (a) BC one-month average surface mass concentration (May 2018); (b) BC emission from biomass burning sources; (c) BC emission from anthropogenic sources as provided from MERRA-2 of GEOS-5 model; and (d) EDGAR-HTAP global anthropogenic black carbon (BC) emission (µg/m3 m/s) at 15 km × 15 km resolution.
Atmosphere 11 00570 g002
Figure 3. PM2.5 and BC diurnal profiles: (a,b) for winter period at Wagga Wagga North, Armidale, Liverpool, Carrington, Chullora, Newcastle, Beresfield, Richmond and Wollongong; and (c,d) for summer period at Armidale, Chullora, Newcastle and Beresfield. Diurnal profiles are derived from averaging of hourly data over a number of years at each hour of the 24-h period.
Atmosphere 11 00570 g003aAtmosphere 11 00570 g003b
Figure 4. Regression of BC versus PM2.5 for 2019 winter period at Liverpool, Richmond (Sydney region), Carrington, Newcastle (Lower Hunter region), Wollongong (Illawarra region), Wagga Wagga North and Armidale in regional New South Wales.
Atmosphere 11 00570 g004
Figure 5. Regression of BC versus PM2.5 during summer period. There is little or no correlation between BC and PM2.5 hourly concentration during summer. There are some high peaks of BC at Armidale due to bushfires occurring in the north west of Armidale in February.
Atmosphere 11 00570 g005
Figure 6. BC concentration from biomass burnings (wood heating) (BCwb) and from fossil fuel combustion (BCff) at Chullora, Liverpool, Wagga Wagga North and Armidale during winter 2019.
Atmosphere 11 00570 g006
Figure 7. (a) Hourly BC/PM2.5 ratio at Chullora with average decrease from about 20% to 15% during May 2018 when many HRBs occurred outside Sydney; (b) BC and PM2.5 average diurnal patterns during May 2018 at Chullora; and (c) BC and PM2.5 diurnal pattern during winter period at Chullora, Liverpool and Richmond.
Atmosphere 11 00570 g007aAtmosphere 11 00570 g007b
Figure 8. (a) BC from fossil fuel combustion (BCff) and from biomass burning (BCwb) as measured by AE33 aethalometer for May 2015 at Beresfield. Note that, on 6 May 2015, there was also a dust storm from the region west of Beresfield. (b) HYSPLIT ensemble backward trajectory for 48 h from Beresfield at 10-m height on 4 May 2015 5:00 UTC (15:00 AEST local time).
Atmosphere 11 00570 g008aAtmosphere 11 00570 g008b
Figure 9. MERRA predicted black carbon surface concentration (µg/m3) on 4 May 2015 at 15:00 AEST.
Atmosphere 11 00570 g009
Figure 10. (a) Biomass burning hot spots and smoke plumes in the Blue Mountains west of Sydney and Newcastle as detected by MODIS satellites on 6 May 2016; and (b) hourly BC concentration as measured by aethalometer at Chullora and Newcastle from 1 to 30 May 2016. The biomass burning for Hazardous Reduction Burnings occurred during 6–7 and 17–18 May 2016.
Atmosphere 11 00570 g010
Figure 11. Daily average of PM2.5, BC and Biomass Burning ratio (BB) for May 2016: (a) at Chullora; and (b) at Newcastle. The BC values are stacked on the PM2.5 ones in the column graph.
Atmosphere 11 00570 g011aAtmosphere 11 00570 g011b
Figure 12. Regression of BC versus PM2.5 for May 2016: (a) at Chullora; and (b) at Newcastle. Chullora is more affected by HRBs as shown by the two distinct regression patterns (below 20 µg/m3 and above 20 µg/m3). Daily average ratio of BC/PM2.5 (with trend line), PM2.5 and BC concentration during May 2016: (c) at Chullora; and (d) at Newcastle. The dotted vertical lines are the ±σ (standard deviation of intraday hourly variation on the day) from the daily mean.
Atmosphere 11 00570 g012aAtmosphere 11 00570 g012bAtmosphere 11 00570 g012c
Figure 13. BC from fossil fuel combustion (BCff) and from biomass burnings (BCwb) for May 2016: (a) at Chullora; and (b) at Newcastle.
Atmosphere 11 00570 g013
Figure 14. (a) Two regression lines BC vs. PM2.5 for values of PM2.5 below and above 20 μg/m3 at Chullora; and (b) daily number of fires for May 2016 in the NSW East.
Atmosphere 11 00570 g014
Figure 15. HYSPLIT ensemble backward trajectories overlaid on MODIS Aqua/Terra satellite images with hot spots (small red dots) for 48 h from Newcastle at 10-m height on: (a) 5 May 2016 08:00 AEST; (b) 6 May 2016 08:00 AEST; and (c) 7 May 2016 08:00 AEST. The Riverina region near Wagga Wagga and Albury has many hot spots (a,b). Panel (b) shows some smoke plumes originating from some of the hot spots. (c) White clouds covered much of western NSW and the north coast, north of Port Macquarie, and smoke clouds from fires are visible between Canberra and Wollongong. Each of the different colour trajectories represents one ensemble member of the trajectory analysis.
Atmosphere 11 00570 g015aAtmosphere 11 00570 g015b
Figure 16. (a) Time averaged map (May 2016) of black carbon extinction AOT 550 nm monthly 0.5° × 0.625° (MERRA-2 Model M2TMNXAER v5.12.4); and (b) time averaged map of black carbon surface mass concentration monthly 0.5° × 0.625° (MERRA-2 Model M2TMNXAER v5.12.4) kgm−3. High monthly values of BC column AOT and surface concentration in the Blue Mountains and the Riverina region can be seen.
Atmosphere 11 00570 g016
Figure 17. Time averaged map of AOD 550 nm (deep blue, land-only) daily 1° (MODIS-Aqua MYD08_D3 v6.1) for the period 4–7 May 2016.
Atmosphere 11 00570 g017
Figure 18. (a) Aerosols measured by CALIOP in the daytime transect from (−71.33, 170.53) to (−23.94, 145.72) on 7 May 2016 532 nm total attenuated backscatter; (b) profile of aerosol subtypes (1–10) with black colour representing the elevated smoke aerosol type (subtype 6); and (c) the satellite path (pink) corresponding to the lidar vertical aerosol profile in (a,b).
Atmosphere 11 00570 g018
Figure 19. (a) Daily average PM2.5 concentration at Chullora for May 2018 period; (b) the regression of BC and PM2.5 as measured at Chullora showing a linear relationship with correlation coefficient R2 = 0.696; (c) the daily number of hazardous reduction burnings in the region around Sydney; and (d) MODIS Aqua/Terra satellite image with hot spots and burn area location on 9 May 2018. Note that smoke plumes from the fires in the Blue Mountain and in the western region affects the nearby Sydney metropolitan areas including the Central Coast and Newcastle. Many hot spots mainly due to agricultural burnings are also visible in the Riverina (middle of map (d)).
Atmosphere 11 00570 g019aAtmosphere 11 00570 g019b
Figure 20. (a) Ensemble HYSPLIT backward trajectories from Chullora on 9 May 2019 00:00 AEST (8 May 2019 14:00 UTC). (b) Same as (a) but with MODIS and hot spots location. The backward trajectories showed the sources of high BC concentration came from the fires in the Blue Mountain (middle of (b)). Fires in the Riverina (bottom left of (b)) did not influence the BC concentration in Chullora and the GMR area.
Atmosphere 11 00570 g020
Table 1. NSW DPIE air quality monitoring stations with aethalometer installed.
NSW Air Quality Monitoring SiteAQMN RegionLatitude (South)Longitude (East)Elevation Above Sea Level (m)Aethalometer Measurement Commissioned (*)
ChulloraSydney33°53′38″151°02′43″4014 March 2014
LiverpoolSydney33°55′58″150°54′21″259 May 2019
RichmondSydney33°37′06″150°44′45″2330 April /2019
BeresfieldLower Hunter32°47′54″151°39′36″1610 December 2014
NewcastleLower Hunter32°55′57″151°45′30″199 December 2015
CarringtonLower Hunter32°54′35″151°45′48″318 July 2019
WollongongIllawarra34°25′07″150°53′11″1129 April 2019
ArmidaleRegional NSW30°30′30″151°39′41″97912 April 2018
Wagga Wagga NorthRegional NSW35°6′16″147°21′37″1813 April 2019
(*) The date of aethalometer installation at the site do not necessary determine the data availability as aethalometer operated at Carrington for a short period. Other sites operate continuously but can have some missing values due to instrument problems during operation. Overall, the coverage for all sites which started operation and still operating up to now is above 80%. From June 2019, the coverage is higher due to an intensive campaign and quality control conducted at important sites in NSW. For the six main sites in Winter 2019 (main campaign), Richmond, Liverpool, Wagga, Armidale, Newcastle, Wollongong, coverage in terms of hourly data ranges over that three months (24 × 92 days) is about 85–97%. For the later period (September–April 2020 inclusive) which has been quality control in much more detail, it is about 92–98% for those six sites.
Table 2. Winter and summer BC study and 3 case studies of BC from Hazardous Reduction Burnings (HRBs).
PeriodsSitesMethodsNotes
Winter (2019)9 sitesRegression analysisAll sites
Summer (2018/19)4 sitesRegression analysisChullora, Beresfield,
Newcastle and Armidale
May 2015BeresfieldTrajectory
May 2016Chullora and NewcastleRegression and trajectory
May 2018ChulloraRegression and trajectory

