Retrospective Analysis of Tree Decline Based on Intrinsic Water-Use Efficiency in Semi-Arid Areas of North China

1
Institute of Desertification Studies, Chinese Academy of Forestry, Beijing 100091, China
2
Key Laboratory of State Forestry Administration on Soil and Water Conservation, Beijing Forestry University, Beijing 100083, China
*
Author to whom correspondence should be addressed.
Atmosphere 2020, 11(6), 577; https://doi.org/10.3390/atmos11060577
Submission received: 14 April 2020
/
Revised: 26 May 2020
/
Accepted: 28 May 2020
/
Published: 1 June 2020
(This article belongs to the Special Issue Past Climate Reconstructed from Tree Rings)
Abstract
:Long-term tree growth is significantly affected by climate change, which have become a global concern. Tree-ring width and isotopic information can show how trees respond to climate change on a long-term scale and reveal some phenomena of tree decline or death. In this study, we used isotopic techniques and investigated annual changes in carbon isotope composition and tree-ring width of Populus simonii Carr. in Zhangbei, as well as trends in tree-ring carbon discrimination (Δ13C) and iWUE in normal, mildly declining and severely declining trees, in order to make a retrospective analysis and further understand the process of tree decline. We found that there were significant differences (p < 0.01 **) in δ13C, Δ13C, ci and iWUE at different decline stages, meaning that the δ13C and iWUE could be new indicators of tree health. The iWUE of all groups increased significantly, while the growth rate of declined P. simonii was much higher than that of normal growth P. simonii. According to the analysis, there may be a threshold of iWUE for healthy trees, which once the threshold value is exceeded, it indicates that trees are resistant to adversity and their growth is under stress. Similarly, the changing trend of BAI supports our conclusion with its changes showed that tree growth became slower and slower as degradation progressed. iWUE inferred from tree-ring stable carbon isotope composition is a strong modulator of adaptation capacity in response to environmental stressors under climate change. Elevated annual temperatures and increased groundwater depth are all contributing to the decline of P. simonii in north China.
1. Introduction
In the north of China, disastrous weather such as gale, sand storm, sand blowing, sand floating are frequent [1,2].Thus, it is vulnerable to perennial wind and sand invasion, especially in Beijing, Tianjin and Hebei, which was called Jing-Jin-Ji Area. Since the end of the 1950 s, large-scale protection forest were constructed [3,4]. After more than 40 years of construction, shelter forest in this area have achieved great success and played an important role in controlling wind and sand, which became the important ecological barrier in Jing-Jin-Ji Area [5].
Populus simonii Carr. is a fast-growing deciduous broad-leaved tree species, widespread in China [6]. At the beginning of construction, P. simonii. was the main afforestation tree species with its low cost and fast growth. However, over the past ten years, there were a large area of degeneration and death in the poplar shelterbelts. The area of the degraded forest is close to 80%, while the dead and the dying are about 1/3 of the total area. One reason for this high mortality could be aging of these trees and decline of physiological functions as a natural result of aging. Another reason, however, may be related to external factors such as widespread and rapid drought [7,8] but the specific reasons should be traced to the physiological responses of the poplar in the past.
There are many hypotheses that cause death of trees, such as failure of hydraulics, carbon starvation and biologic attack [9,10,11,12]. Most of the trees mortality at regional level are related to drought [9]. Plants have different physiological responses to different intensity and duration of drought in the process of growth, which is one of the reasons why some plants die in drought and some plants can survive [13]. The carbon isotope composition of tree rings is an effective tool for retrospective understanding ecophysiology of the responses of trees to CO2 and climate change on the long time scales.
Stomatal conductance is influenced by environmental variations [14,15,16], which affects the gradient between atmospheric CO2 concentration (Ca) and internal leaf CO2 concentration (Ci) and in turn determines the isotope composition of assimilated carbon [15]. Therefore, tree ring chronology is widely used in research fields such as tree response to climate change. Under drought stress, plants reduce the stomatal conductance to avoid the failure of the hydraulics, which leads to the decrease of photosynthesis rate and the increase of δ13C. Moreover, 13C ratio is directly related to intrinsic water use efficiency (iWUE). iWUE increased with elevated atmospheric CO2 concentration and drought stress.
The aggravation of climate change, uneven distribution and irrational utilization of water resources, have led to serious shortage of water resources in Jing-Jin-Ji Area, resulting in large areas plant mortality. However, why did the Poplar in Bashang have shown various degrees of degeneration? When did the differentiation begin during its growth process? Clarifying these questions is of great significance for exploring the causes of large area degradation of Poplar shelterbelt in the north of China. In this study, we examined annual changes in stable carbon isotope composition and tree-ring width, investigating trends in tree-ring carbon discrimination (Δ13C) and iWUE in normal, mild declining and severe declining P. simonii in Bashang areas. The specific goals of the study were to make explicit in these aspects: (1) the growth and degraded conditions of P. simonii; (2) δ13C, Δ13C, iWUE and basal area increment (BAI) in different degrees of degradation; (3) combined environmental factors and eco-physiological indices, found the main reasons for the degradation of Poplar.
2. Materials and Methods
2.1. Study Sites and Tree Sampling
The study was carried out in Zhangbei County (41°9′ N, 114°42′ E), Hebei Province. The region is characterized by a continental monsoon climate of temperate zone with the average elevation about 1300 m. The average annual temperature is about 3.2 °C and the annual precipitation is about 300 mm. In addition, this region is rich in wind energy potential, that the days when wind–force level is beyond seven are over 30 days. Annual average sunshine time is 2897.8 h and the frost-free period is about 90–110 d.
The poplar shelter forest was built in 1978 and the main forestation species was Populus simonii Carr. P. simonii is resistant to drought and cold, usually sprouting in April and fast growing in June and July. Then leaves begin to fall into the dormancy period in September. We divided the Poplar shelter forest into three different degrees of degradation according to the rate of dieback (rd), included normal (rd = 0), mild declining (rd < 30%) and severe declining (rd > 50%). rd is defined as the following formula:
where Nd is the number of trees with dieback and N is the number of total trees in each plot. Four plots were selected for every degraded stand; therefore, 12 plots were selected in this study. Within each plot, 20 P. simonii were selected for sampling. One or two cores were taken from each tree at breast height (1.3 m) from different sections of the stem using a 5-mm increment borer (a total of 276 cores were collected). In order to prevent cores from damage, the collected samples were stored in glass tubes.
2.2. Tree-Ring Width, Basal Area Increment and Stable Carbon Isotope Composition Analysis
The methods of tree-ring width and stable carbon isotope composition analysis were referred to previous studies [17]. The core samples were sanded with grain study that varied from 400 to 1500 to make the tree-rings more clearly visible for cross-dating. Then, they were divided into two sections: 125 cores were used for width measurements and the remaining 151 cores were used to evaluate stable carbon isotopes. After natural drying and fixation, tree ring widths were measured at a resolution of 0.01 mm from each of the cores using LINTAB 6 measurement equipment (Frank Rinn, Heidelberg, Germany) and the data were analyzed using Time Series Analysis and Presentation (TSAP) software package (Frank Rinn, Heidelberg, Germany). Cross-dating of the tree-ring data were verified using COFECHA, which assesses the quality of cross-dating and the measurement accuracy of tree-ring series using a segmented time–series correlation technique [18,19]
Tree-ring width decreases with age in mature trees due to the diameter growth of the stem. Therefore, BAI is more appropriate than diameter at breast height increment (DBHI) for modeling tree growth and forest productivity. BAI was estimated according to the following formula:
where R is the radius at breast height and n is the year of tree-ring formation.
The cores were divided into individual rings using a scalpel to cut along ring lines under a stereomicroscope (40× magnification) and rings within the same year were pooled. Earlywood and latewood were not separated for the isotopic analyses, as recent studies have shown that there is no difference between the two wood types at an isotopic level [20,21]. Several recent studies have tested and proved the representativeness of pooled isotopic series for tree-ring δ13C compared to individual isotopic series [22,23,24,25,26]. Thus, we pooled tree rings of the same year into centrifuge tubes and injected deionized water into it, then shook it for about 30 s twice to wash off surface contamination. After drying by the oven under 85 °C for 24 h, the samples were ground into powder using a ball mill, followed by sieving through an 80-mesh sieve. Different components of wood differ isotopically and most studies have concentrated on analysis of cellulose, as the dominant and most easily isolated component of wood [27,28]. The δ13C values obtained from cellulose showed no apparent temporal offset in the climate signal (Loader et al., 2004, in press). In this study, cellulose was extracted for stable carbon isotope composition analysis. The method for cellulose extraction was modified from Loader [29,30]. To obtain better homogenization of the cellulose, we used an ultrasonic water bath (JY92-2D, Scientz Industry, Ningbo, China) to break the break the cellulose fibers. After extraction, we packed 0.10-0.12 mg of cellulose in silver capsules, then conveyed each capsule into a high-temperature conversion element analyzer (HT-O, HEKAtech GMBH, Wegberg, Germany) linked to a gas stable-isotope mass spectrometer (ThermoFinnigan, Thermo Fisher Scientific, Inc., Waltham, MA, USA). Three subsamples of one sample were analyzed and the average values were calculated. δ13C time series were then corrected for changes in atmospheric δ13Ca of CO2 [28].
The results from the isotope ratio deviations are presented using the common δ notation:
where R refers to the ratio of the 13C to 12C isotopes in the sample (‘sa’) and the reference [‘re’, compared to the PDB (Pee Dee Belemnite) standard] [31,32].
Isotopic discrimination between the carbon of atmospheric CO2 and plant carbon (Δ13C) in C3 plant is a result of the preferential use of 12C over 13C during photosynthesis [33]. It is defined as follows:
where δ13Ca and δ13C are the isotope ratios of carbon (13C/12C) in atmospheric CO2 and tree-ring cellulose, respectively.
The relative rates of carbon fixation and stomatal conductance are the primary factors of Δ13C. According to the model proposed by Farquhar [33], Δ13C and δ13C have different trends.
where a is the discrimination against 13CO2 during CO2 diffusion through the stomata (a = 4·4‰), b is the discrimination associated with carboxylation (b = 27‰) and ci and ca are the intercellular and ambient CO2 concentrations, respectively.
Fick’s law is as follows:
The ratio of leaf conductance to water vapor is 1.6 gCO2 and the change in stable carbon isotope composition can be related to the A/gH2O ratio as follows:
iWUE was calculated using the following equation:
2.3. Climate Data, CO2 Records and δ13Ca
All meteorological data were obtained from the Zhangbei Meteorological Station (114.70° E, 41.15° N) located at 1393.3 m ASL, 13.4 km from the study area. The data were checked for quality and consistency and included the annual temperatures, annual relative humidity, as well as annual precipitation, from 1977 to 2016. Annual atmospheric CO2 concentration and δ13Ca data records were monitored at the Shangdianzi Atmospheric Background Station (40°65’ N, 117°12’ E).
2.4. Statistical Analysis
To model tree growth, we measured all cores ring widths and used the average ring width to calculate BAI for that year. Regression analyses and t-test were used to identify significant trends in δ13C, Δ13C, Ci, iWUE and BAI from 1977 to 2016 and to test the relationships between iWUE and environmental factors (include annual temperature, relative humidity and precipitation). R2 and p-values were also estimated. All statistical analyses were carried out using the SPSS 11.0 statistical software package (SPSS, Chicago, IL, USA).
3. Results
3.1. Climatic Variability and Trends
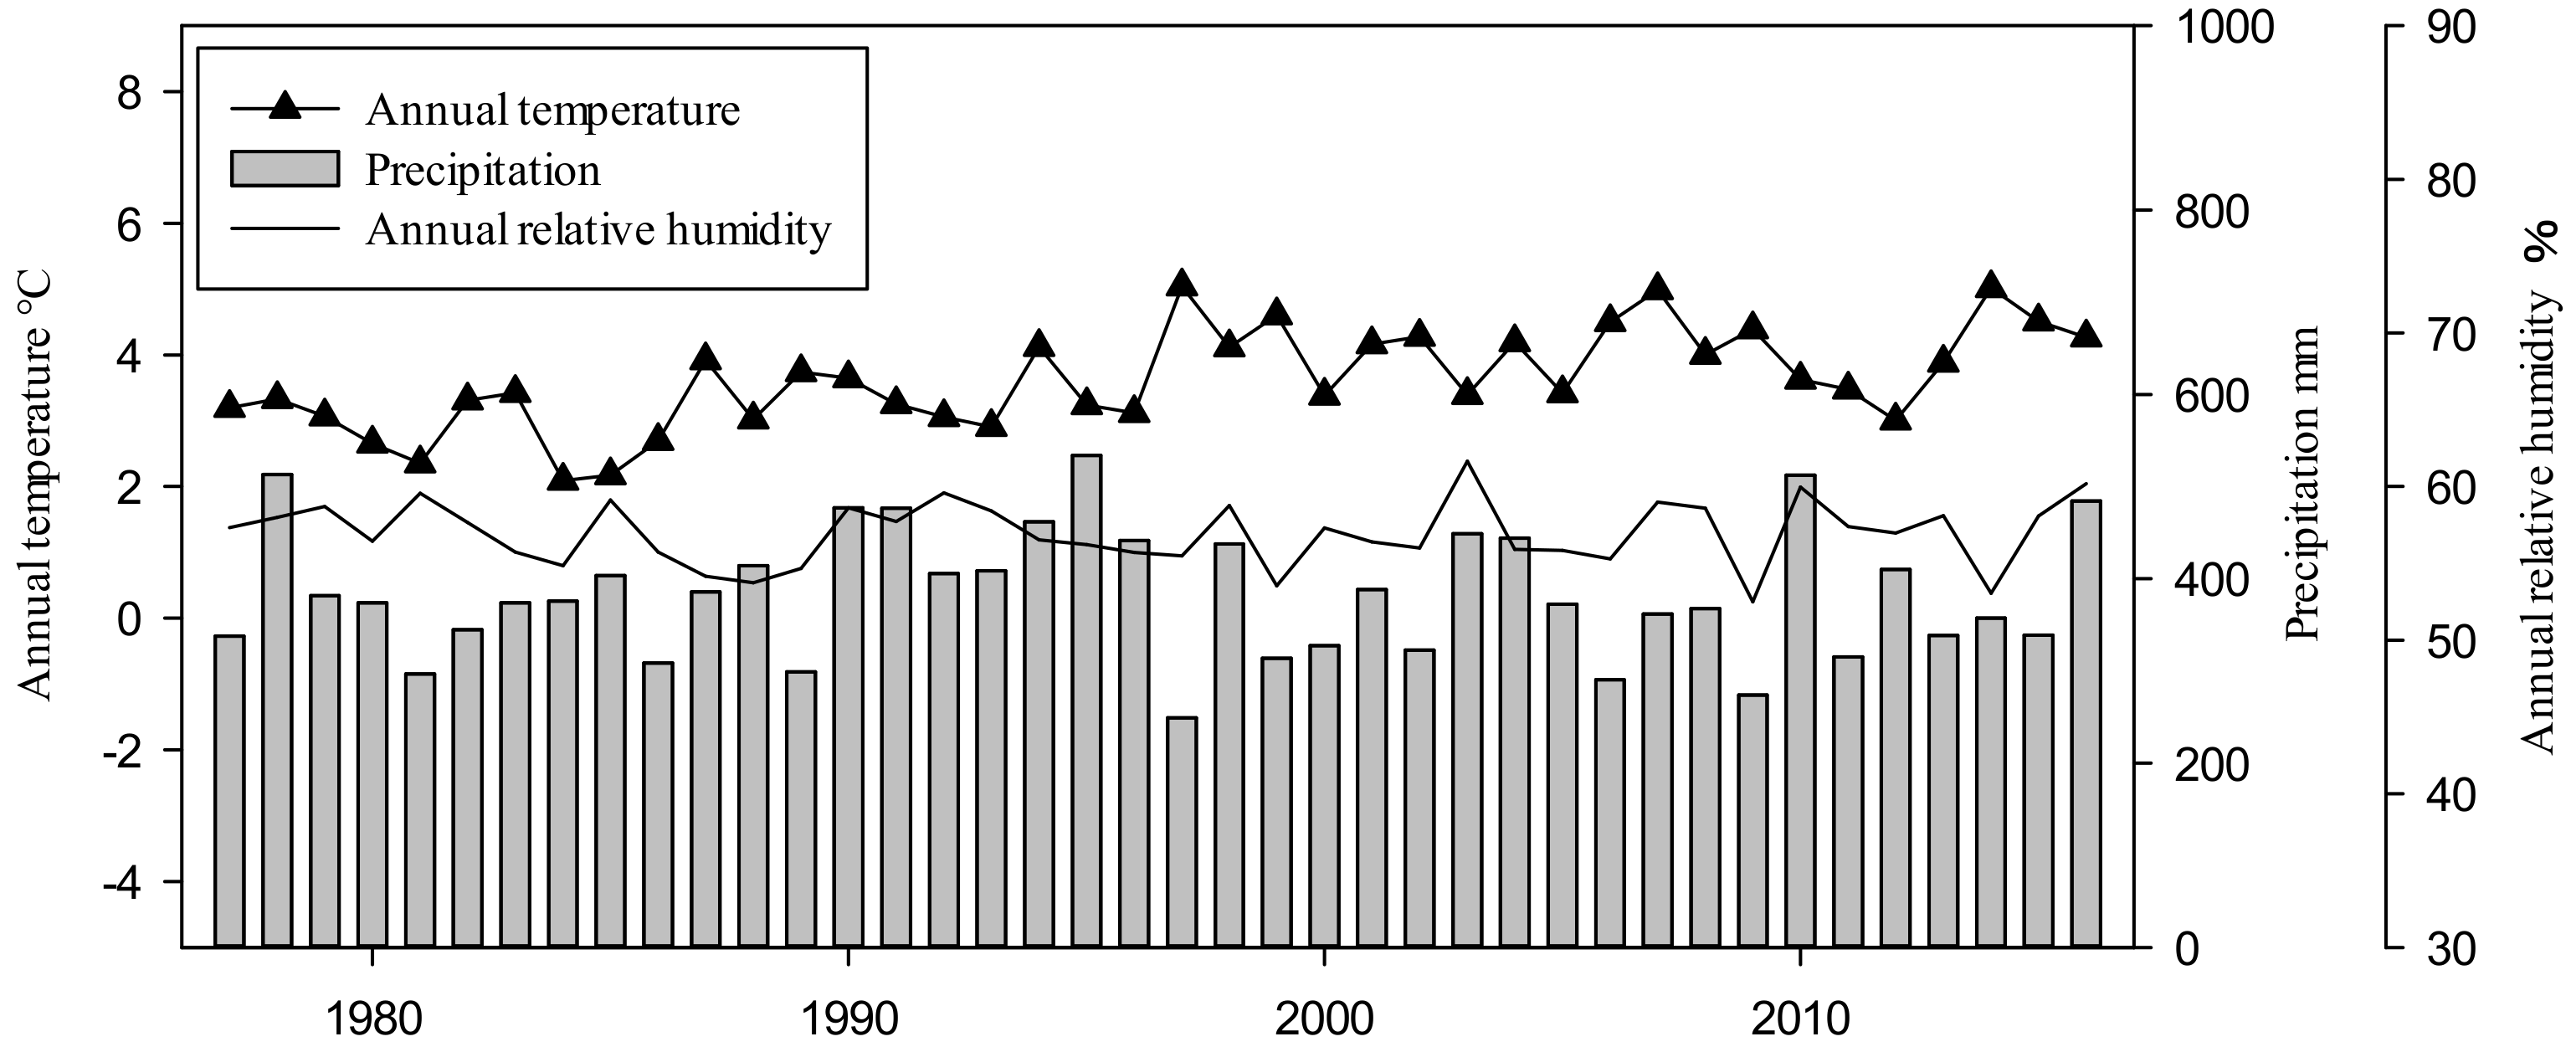
As Figure 1 shows, annual temperatures in the study area ranged from 2.08 °C to 5.04 °C, with an average temperature of 3.62 °C. Moreover, there was an increasing trend of 0.039 °C per year during the study period. Annual precipitation differed significantly among calendar years, ranging from 244.91 mm to 533.82 mm, with an average precipitation of 384.06 mm. Moreover, a year of extreme drought occurred in 1997, with an annual precipitation of only 245 mm. Annual relative humidity showed relatively smooth variation, ranging from 52.49% to 61.66%. Linear regressions showed a significant increase in mean annual temperature during 1977 to 2016 (R2 = 0.384, p < 0.01 **). The trend of annual precipitation was not significant (R2 = 0.002, p = 0.77).
3.2. Patterns of δ13C, Δ13C, Ci and iWUE
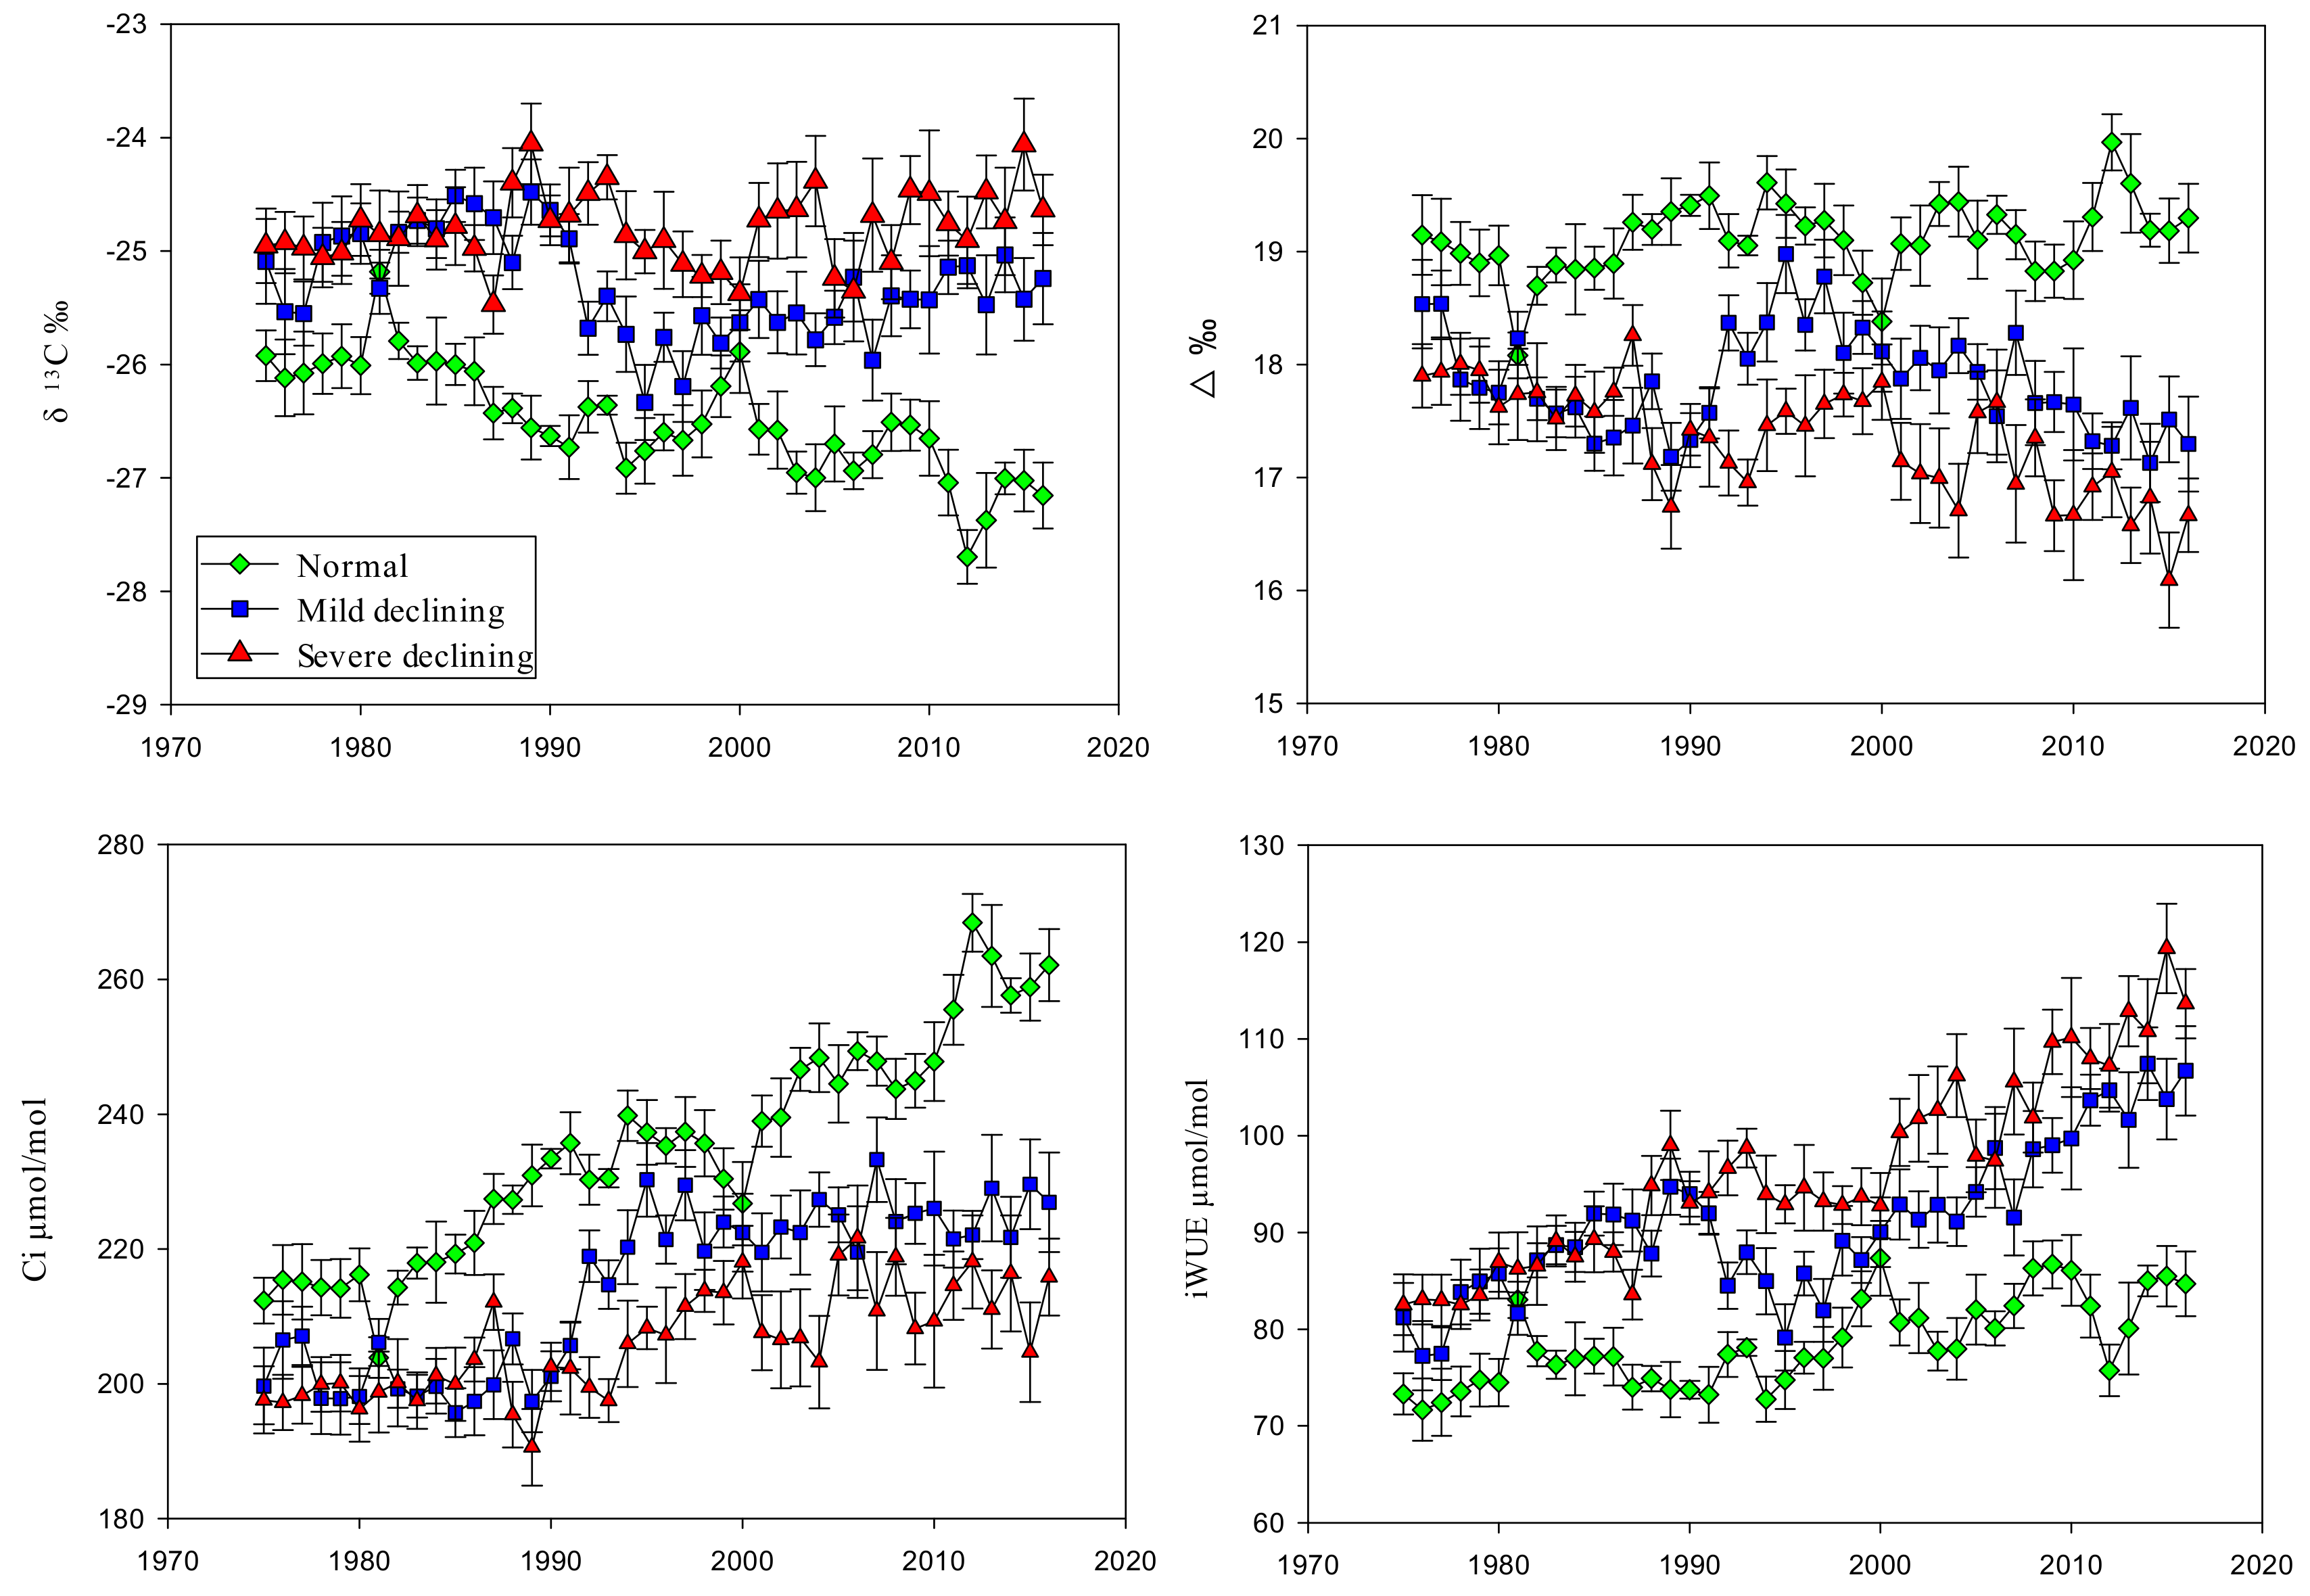
Field investigation showed that there were 102,000 hm2 of poplar shelter forest in Zhangbei County, of which the declined forest area was about 81,100 hm2, accounting for 79.5% of the total area of poplar shelter forest. Figure 2 shows the annual variations of δ13C, Δ13C, ci and iWUE of normal, mild declining and severe declining poplar between 1977 and 2016. There were significant differences (p < 0.01 **. “*” means that the differences between contrast groups are significant and the significance of differences represented by “**” is greater than that represented by “*”.) among normal, mild declining and severe declining trees on δ13C, Δ13C, ci and iWUE. The δ13C were significantly different between declining poplar and normal poplar, that the δ13C of normal poplar was much lower than that of declining poplar. In addition, mild declining poplar have lower δ13C than severe declining poplar. The δ13C of normal poplar showed a downward trend, especially during 1980 to 1990 and 2000 to 2016, ranged from −27.69‰ to −25.79‰; however, declining poplar (include mild and severe declined) ranged from −24.06‰ to −26.33‰. The δ13C of normal grown poplar were much lower than declining poplar, with the average of 1.108‰. In contrast with δ13C, Δ13C showed opposite quantitative relationship among different degradation, in which the Δ13C of normal growth (ranged from 18.381‰ to 19.968‰) were higher than declining trees (ranged from 16.093‰ to 18.979‰). Moreover, the Δ13C of normal growth showed a slight increasing trend, which was smoothly in the first half and fluctuated in the last half. Linear regression analysis that there was no significant increase on mild declining trees with a great fluctuation during 1994 to 2000 and the Δ13C of severe declining poplar had a significant decreasing trend (r2 = 0.548, p < 0.01 **). In addition, the SE of declining poplar were larger than that of normal poplar.
Figure 2c illustrated the variations in ci inferred from the tree-ring δ13C chronology and atmospheric CO2 concentration. During the past 40 years, a strong increase in ci generally paralleled the increase in atmospheric CO2 concentration, which resulted in relatively constant and significant increases in iWUE (Figure 2d). Higher ci values were associated with lower discrimination Δ13C. We can see that the ci decreased as the degree of degradation increased in this area. The increased trend in ci of normal poplar was most significant (p < 0.01 **) compared with declined site. In the years before 1994, ci of mild and severe declining poplar changed smoothly and had statistically insignificant differences. After that, there were obviously jump both in mild and severe declined sites accompanied with significant differences and greater SE.
Both in non-declining and declining sites, the iWUE increased significantly, particularly since the end of the 90 s while the Δ13C trends exhibited the opposite pattern (a decrease). There were significant differences among normal, mild declining and severe declining trees, which the iWUE increased the declining became more serious in this area. iWUE of normal poplar increased at a rate of 0.277 μmol mol−1 per year, ranged from 71.693 μmol mol−1 to 81.348 μmol mol−1 during the study period. iWUE of mild declining poplar increased at a rate of 0.749 μmol mol−1 per year, ranged from 77.479 μmol mol−1 to 106.698 μmol mol−1. iWUE of severe declining poplar increased at a rate of 0.797 μmol mol−1 per year, ranged from 82.57 μmol mol−1 to 119.345 μmol mol−1.
3.3. Patterns of Tree-Ring Width and BAI
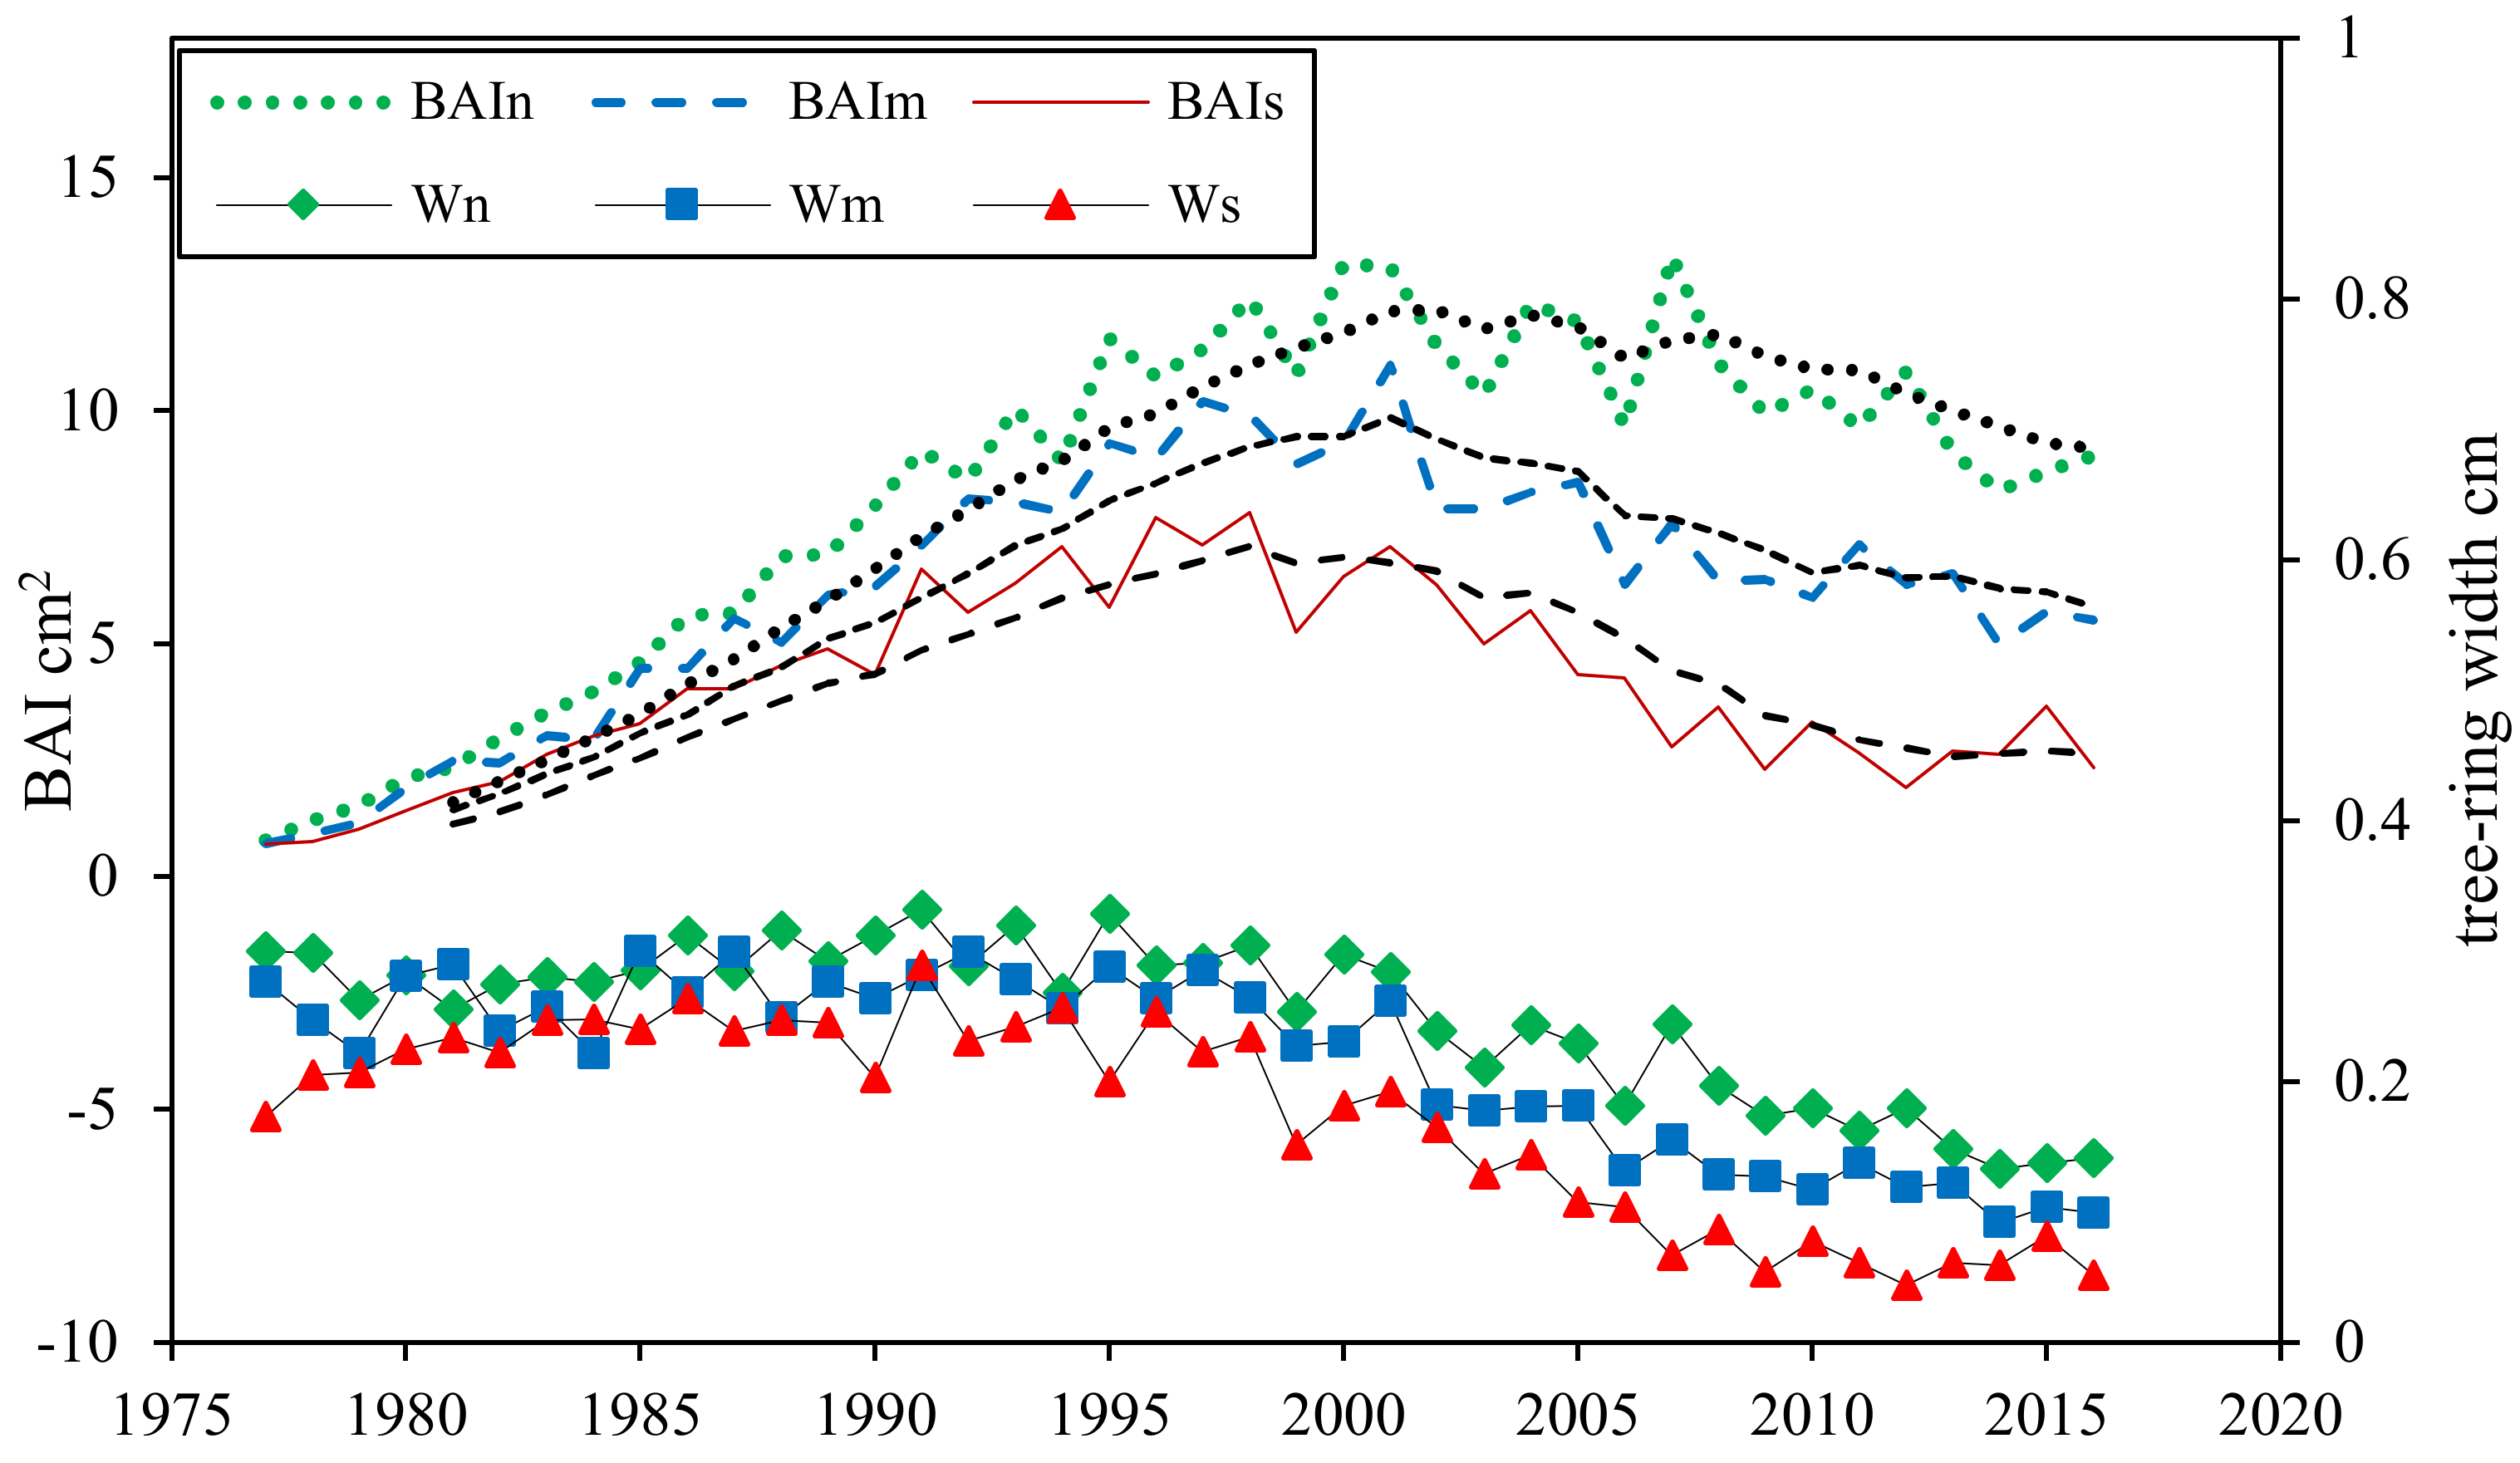
Tree-ring widths of all sites showed similar trends that stable at the first stage and significantly decreased since the end of 90 s in around 1997 calendar year (Figure 3), ranging from 0.0438 cm to 0.299 cm. The average Wn is 0.252 cm, 1.167-times of averaged Wm and 1.456-times of averaged Ws. It is noteworthy that Ws showed an obviously fluctuation during 1990 to 2000, followed by a significant downward trend. The BAI of all sites showed similar trends that were significant quadratic curves increase during the first decades and then decreased. However, the time when BAI began decreasing in different sites were inconsistent. From the curve, BAIn reached its peak in 2003 and then decreased, while the BAIm and BAIs peaked in 2001 and 1997, two and six years earlier than that of the normal poplar separately.
3.4. Variations of Soil Water Content and Groundwater Depth
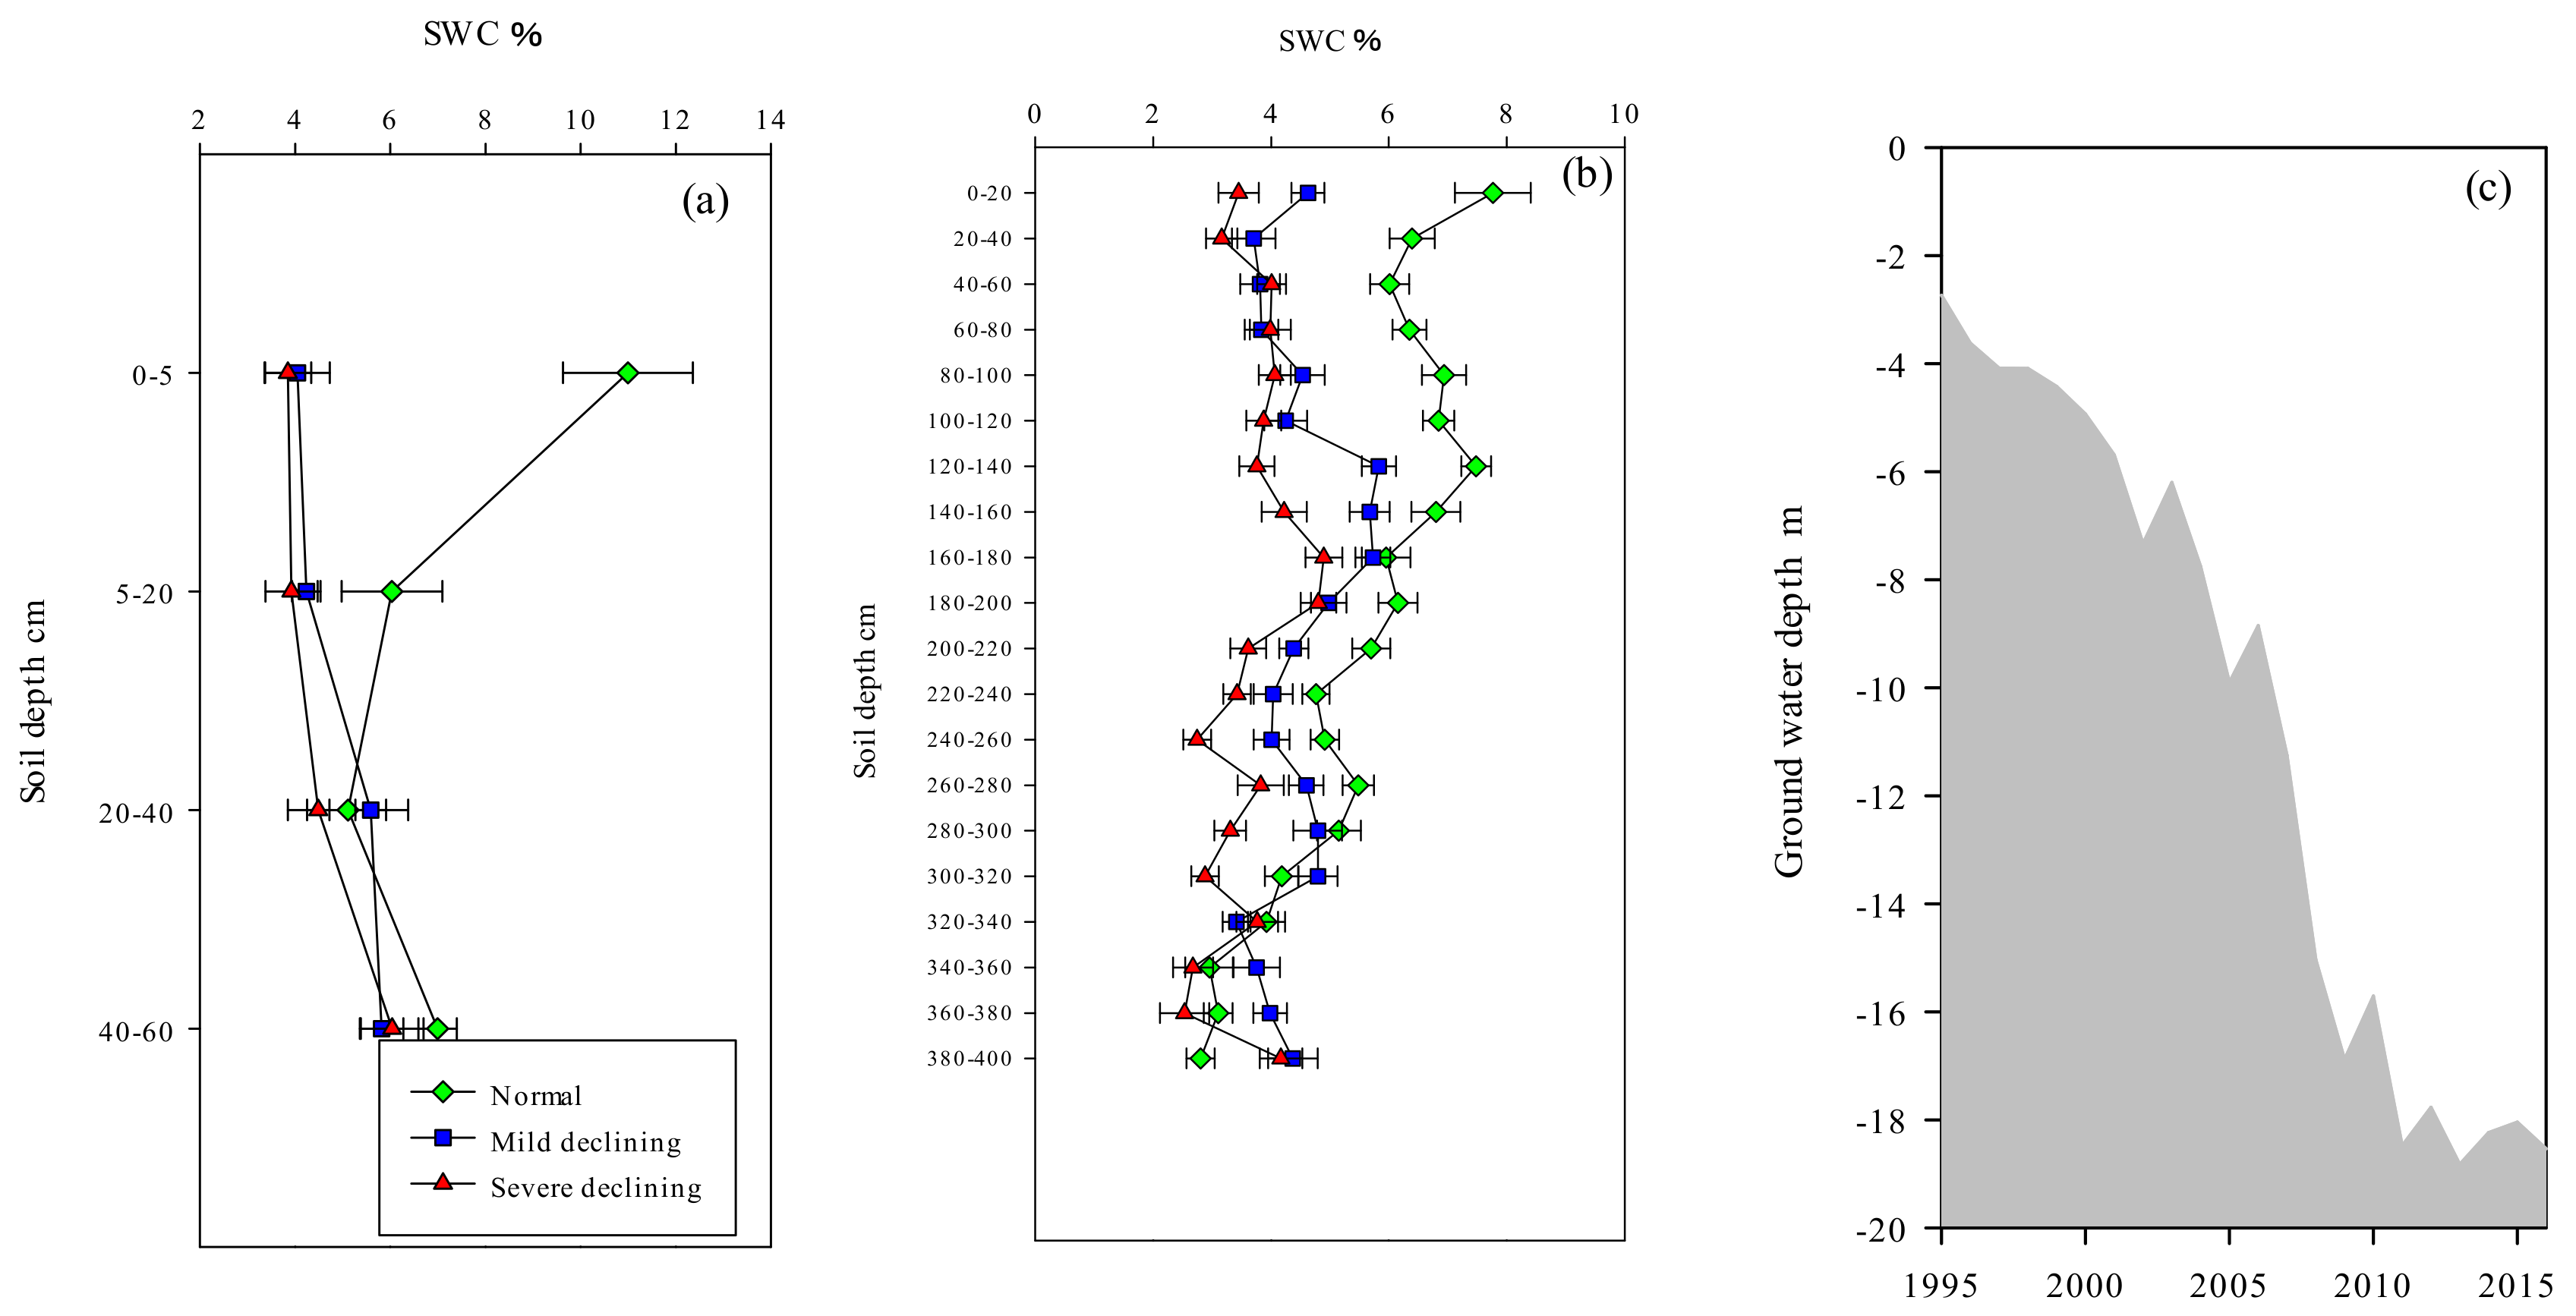
In the main distribution area of root system, SWC of normal, mild declining and severe declining sites showed significant differences (p < 0.01 **), especially between normal and declining sites (Figure 4a). There was a great disparity between normal and severe declining sites in SWC of 0–5 cm soil depth, which was approximately differed 7.15%. In addition, this gap gradually decreased with the increase of soil depth. SWC of normal site decreased along with the depth increased, significantly during 0–40 cm (p < 0.01 **) and then stabilized at approximately 6%, ranged from 4.99% to 10.99%. In contrast with normal site, SWC of declining sites showed relatively stable trends, ranged from 3.84% to 6.04%. Overall, the SWC of normal sites were higher than declined sites, especially in the surface soil. In addition to 0–60 cm that distributed tree roots, we also dilled more than four meters underground to measure the SWC of deeper soil, showed in (Figure 4b). We detected a significantly difference between normal sites and declined sites during 0–160 cm soil depth (p < 0.01 **) and the differences were getting not significant gradually with the depth increased. Figure 4c showed that the groundwater level was relatively high before 1998 and it was less than 4 m below the ground. However, ground water table began depress in 1999 and then the depression accelerated in 2002, rapidly from 6 m dropped to about 18 m in 2014.
3.5. Relationships between δ13C of Different Sites and Annual Temperature, Relative Humidity and Annual Precipitation
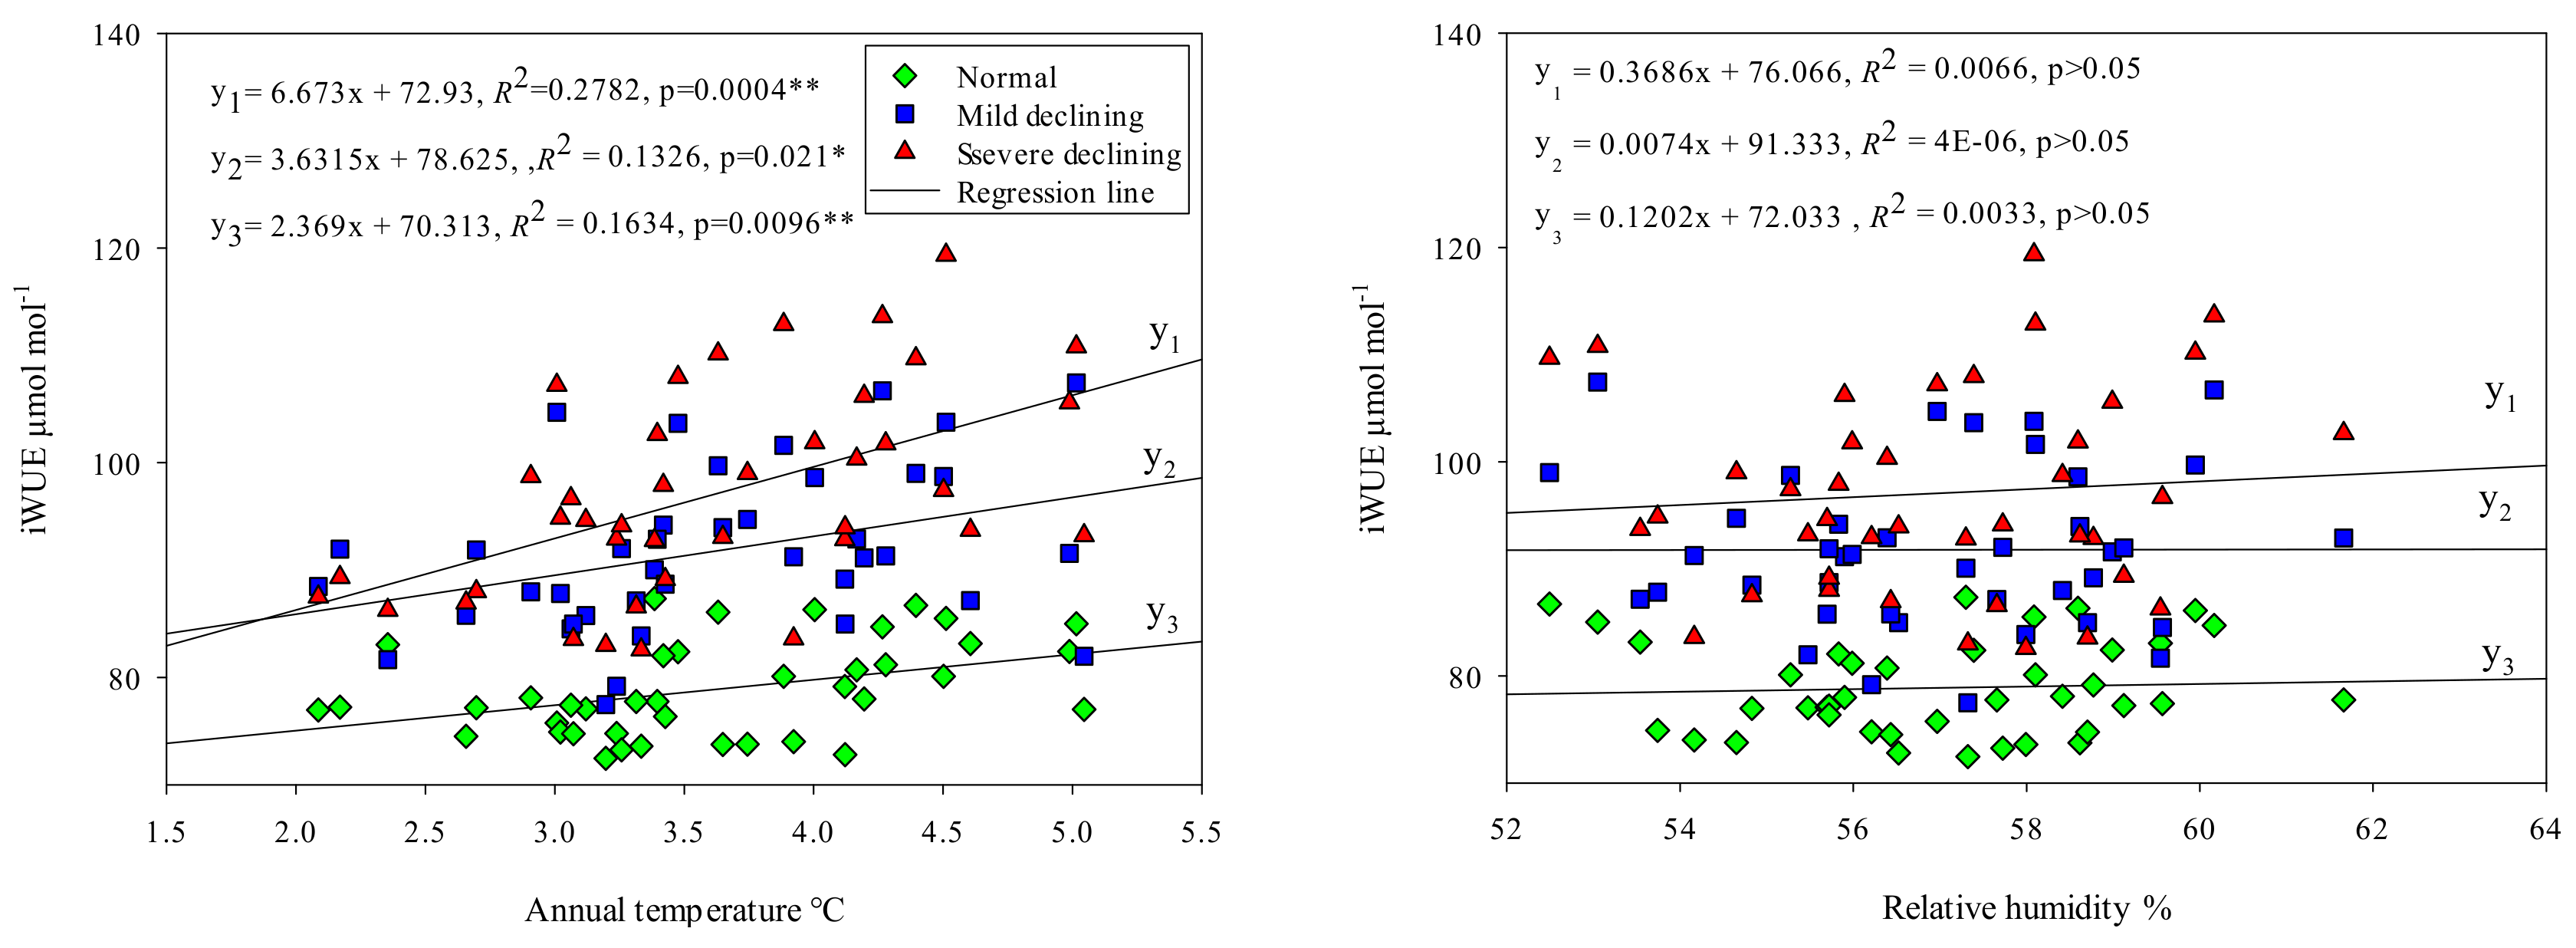
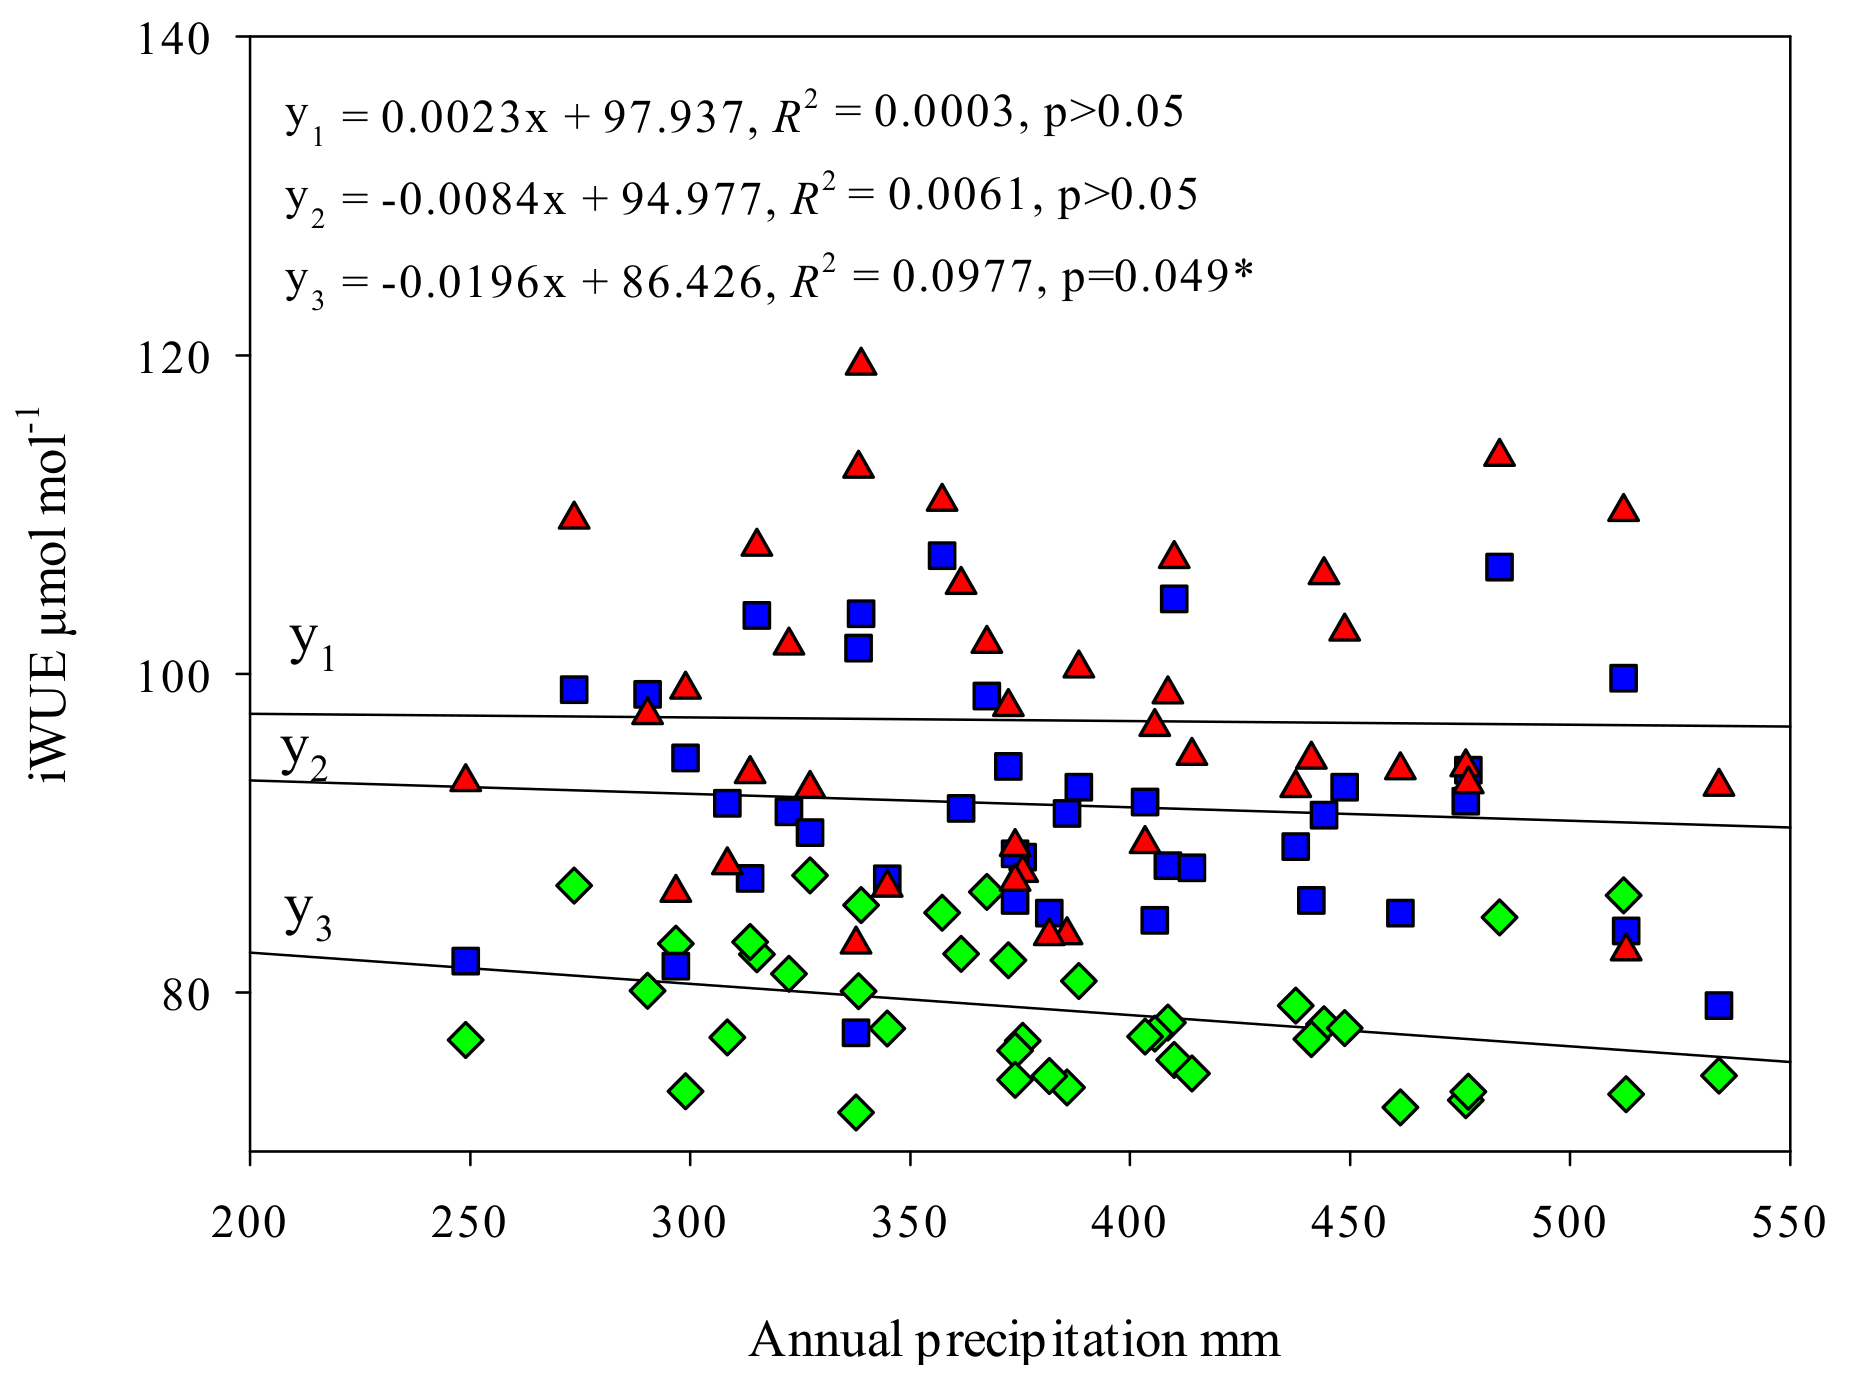
Figure 5 shows that iWUE of all sites were significantly positively correlated with annual temperature (p < 0.05 *) and the relationships between iWUE and several declined, iWUE and normal poplar, were extremely significantly positively (p < 0.01 **). The slope of the linear equation of severe declining poplar and annual temperature is 1.8-times that of mild declining poplar, 2.8-times that of the normal poplar. There were no significant correlations between iWUE of all sites and annual relative humidity (p > 0.05), indicated that iWUE was less effected by relative humidity in long time scale both on declining and non-declining sites. The relationships between iWUE of normal poplar and annual precipitation was significantly negative (p < 0.05 *). However, there were no significant correlations between iWUE of declining poplar and annual precipitation (p > 0.05).
4. Discussion
4.1. Drought-Induced Growth Decline and Trends of Water-Use Efficiency
Populus simonii—a native tree species in northern China—is distributed widely from Qinghai to the east coast and from the Heilongjiang River to the Yangtze River. Because of its strong adaptability and resistance, P. simonii was used as a sand-fixing and major pioneer tree species in China [34,35]. In order to meet the market demand for wood and study raw materials, there were many large-scale afforestation of poplar in China in the 50 s of the last century, increasing the risk of drought vulnerability in plantation. Many scholars worried about the potential consequences of this plantation pattern on the environment and regional water balance and similar concerns have become a reality in other regions [36]. Tree growth (BAI) was influenced by tree age and the growth began to decline after the mature period. However, the curve of the BAI showed that the growth of the declining poplar began to decline in 1997, six years ahead of the normal poplar, indicating that in addition to the internal factors, the growth of the declining poplar was affected by the external environmental factors. The annual precipitation in 1997 was only 245 mm and the extreme drought has begun to make difference in the growth of declining poplar and normal poplar. Extreme climatic events have a very important impact on plant growth and death. Nardini et al. found that in extreme summer droughts, the water relations and carbohydrates of woody angiosperms were affected and the failure of the hydraulics and shoots lead trees to death [37]. In the shelter forests of the same age, non-declining poplar had the largest diameter and with the deepening of declining, diameters were being decreased, indicating that the degradation seriously affected the growth of poplar. As the poplar was a high water consumption and low water use plant [38], it was not suitable for the growth of the site condition of shortage water condition, such as Bashing areas. Therefore, the government in this region needs to adjust future afforestation measures, gradually replacing poplar with other tree species.
δ13C of decline poplar was obviously higher than that of normal poplar, which was consisted with other studies [39]. iWUE increased with drought and CO2 concentration [17]. However, it is impossible for water-use efficiency to rise indefinitely. According to physiological and ecological characteristics of different tree species, the iWUE of trees have its variation range [8,17,40]. Water use efficiency is the result that balanced transpiration and photosynthesis, water consumption and carbon sequestration of trees level. In this study, we found that iWUE of normal poplar ranged from 71.693 μmol mol−1 to 81.348 μmol mol−1 during the study period, however, iWUE of severe declining poplar ranged from 82.57 μmol mol−1 to 119.345 μmol mol−1. The iWUE of severe declining poplar was greater than that of normal poplar. Although the iWUE of declining poplar was high, poplar can not maintain such high water use efficiency for long time as a high water consumption tree species, thus reducing growth to avoid death caused by hydraulics failure or other reasons [41]. Therefore, we speculated that iWUE could be an index to indicate the situation for trees to adapt to the environment. Taking the poplar as an example, if we measured its iWUE increased to 90 μmol mol−1, the poplar was in a water stress. Because the δ13C and iWUE reflect the adaptability and tolerance of tree species to drought stress, it can be used to select suitable species for afforestation. It also highlights that iWUE should be incorporated into a conceptual framework for assessing the vulnerability of forest ecosystems to climate change, particularly in drought prone regions. It supports decision-making for the forestry sector to avoid or slow down the decline of poplar.
Plant adapt to drought stress via multiple mechanisms such as adjusting growth rate and increasing Iwue [32,33,34,35,36,37,38,39,40,41,42,43,44] Larger iWUE meant that declining poplars received more severe water stress than non-declining poplars, which may be one of the main reasons for differentiation. In tropical forests where water condition is not a limiting factor, the increase of iWUE caused by the increase of CO2 concentration did not increase the growth of trees. On the contrary, the growth of trees declined in spite of the increase of iWUE in arid areas [43,45], which was consisted with our study.
4.2. Response of Poplar to Environmental Variations
The response of plants to the changes in environmental factors can be reflected by tree-ring stable carbon isotope composition. When the environment changes, the 13C identification of CO2 in the tree leaves is changed and ultimately affects 13C in the tree ring cellulose. The constraints imposed by water stress on net photosynthesis were traditionally analyzed in terms of ‘stomatal’ and ‘non-stomatal’ limitations [46,47,48,49,50], the former resulting from the resistance to CO2 diffusion to intercellular leaf spaces and the latter being often implicitly assumed as a metabolic constraint. While it is well established that stomatal closure is one the first events taking place during drought [51], a long-standing controversy exists on which limitation is prevailing when water stress progresses [52,53,54,55]. During drought stress, the plant tend to closes the stomata to avoid hydraulic failure, reducing the intracellular CO2 concentration and δ13C increased. Almeida et al. characterized poplar aquaporins (AQPs) to investigate their possible functions in differential drought responses of Populus balsamifera and Populus simonii × balsamifera leaves [56].
Tree-ring δ13C and iWUE are influenced by the internal factors such as age [57], assimilation rate and stomatal conductance [33], as well as external factors such as air temperature, precipitation, relative humidity and atmospheric CO2 concentration. iWUE of both the declining and the non-declining poplar have significant positive correlation with annual temperature (p < 0.05*), which may be due to the increases of CO2 assimilation rate and vapor pressure deficit (VPD) and the closure of some pores in the plant to reduce the excessive evaporation of water, which leads to the increase of δ13C and iWUE [58]. The slope of the linear equation of severe declining poplar and annual temperature is 1.8-times that of mild declining poplar, 2.8-times that of the normal poplar, indicated that the iWUE of declining poplar is more sensitive to temperature changes. Some studies found that there was no significant correlation between temperature and iWUE of Mediterranean plants, indicating that temperature has little effect on the annual variations of iWUE [42]. The correlation between iWUE and water-related environmental factors (precipitation and relative humidity) was not significant, which was different from previous studies. Brienen et al. found that tree-ring δ13C of tropical forest trees have a significant negative correlation with precipitation and relative humidity [59]; Battipaglia et al. found that precipitation is the main controlling factor of iWUE. When the precipitation gradient is from wet to dry, the iWUE will decrease with precipitation [42]. The correlations between iWUE of poplar and precipitation, relative humidity were not significant implied that iWUE may be affected by other factors, such as the physiological drought caused by the increase of air temperature.
The studied area is in the ecotone of agriculture and animal husbandry, which production mode has shifted from animal husbandry to agriculture since 1999. A large increase in water use resulted in the increase of groundwater depth, which had an important impact on the water use of local plants [60]. With the increase of groundwater depth, the iWUE of poplar was also increased, indicating that the degradation of poplar was affected by the variations of groundwater depth. The extreme drought event in 1997 was an important turning point in the process of poplar degradation. The rising trend of iWUE after 1997 showed that the growth of poplar was subjected to severe environmental stress. Water-transport barriers and hydraulic failures are prone to occur under extremely arid environments, leading to plant defoliation, withered shoots and even death [13,61,62]. Changes in land use have increased water consumption and the overexploitation of groundwater, which leads to the increase of the depth of groundwater and further intensifies the degree and intensity of drought—leading to the decline and death of the poplar.
5. Conclusions
Tree-ring δ13C and iWUE increased as a result of P. simonii declining, and with increasing iWUE, the radial growth slowed gradually after peaking. There is a physiological tolerance threshold in iWUE of P. simonii, beyond that would trigger tree-declines.Tree-ring δ13C and iWUE operate as strong modulators of the adaptation capacity in response to environmental stressors. These results provide understanding of growth decline processes regarding not only regional climatic trends, but also the inherent adaptive capacity of P. simonii to face drought by augmenting iWUE. Elevated annual temperature and increased depth of groundwater are all contributing to the decline of P. simonii in Zhangbei. Extreme drought in 1997 maybe the starting point for P. simonii degradation.
Author Contributions
All authors contributed to the study conception and design. Material preparation, data collection and analysis were performed by W.L., X.Y., G.J. The first draft of the manuscript was written by W.L. and all authors commented on previous versions of the manuscript. All authors read and approved the final manuscript.
Funding
This research was funded by the State Key Research and Development Program of China Grant Number 2016YFC0500806, the National Natural Science Foundation of China Grant Number 41430747, the Beijing Municipal Education Commission Grant Number CEFF-PXM2018_014207_000024 and the Basal Research Fund of Central Public Welfare Scientific Institution Grant Number CAFYBB2016QA021. Moreover, The APC was funded by the State Key Research and Development Program of China Grant Number 2016YFC0500806. All experiments were in compliance with the current laws of the country in which they were performed.
Conflicts of Interest
The authors declare no conflict of interest.
References
- Zhang, J.-Q.; Zhang, C.-L.; Chang, C.-P.; Wang, R.-D.; Liu, G. Comparison of wind erosion based on measurements and SWEEP simulation: A case study in Kangbao County, Hebei Province, China. Soil Tillage Res. 2017, 165, 169–180. [Google Scholar]
- Xu, D.; Ding, X. Assessing the impact of desertification dynamics on regional ecosystem service value in North China from 1981 to 2010. Ecosyst. Serv. 2018, 30, 172–180. [Google Scholar]
- Zhang, Y.; Peng, C.; Li, W.; Tian, L.; Zhu, Q.; Chen, H.; Fang, X.; Zhang, G.; Liu, G.; Mu, X. Multiple afforestation programs accelerate the greenness in the ‘Three North’region of China from 1982 to 2013. Ecol. Indic. 2016, 61, 404–412. [Google Scholar]
- Lü, Y.; Zhang, L.; Feng, X.; Zeng, Y.; Fu, B.; Yao, X.; Li, J.; Wu, B. Recent ecological transitions in China: Greening, browning, and influential factors. Sci. Rep. 2015, 5, 8732. [Google Scholar]
- Tan, M.; Li, X. Does the Green Great Wall effectively decrease dust storm intensity in China? A study based on NOAA NDVI and weather station data. Land Use Policy 2015, 43, 42–47. [Google Scholar]
- Chen, K.; Peng, Y.; Wang, Y.; Korpelainen, H.; Li, C. Genetic relationships among poplar species in section Tacamahaca (Populus L.) from western Sichuan, China. Plant Sci. 2007, 172, 196–203. [Google Scholar]
- Clifford, M.J.; Royer, P.D.; Cobb, N.S.; Breshears, D.D.; Ford, P.L. Precipitation thresholds and drought-induced tree die-off: Insights from patterns of Pinus edulis mortality along an environmental stress gradient. New Phytol. 2013, 200, 413–421. [Google Scholar]
- Sun, S.; He, C.; Qiu, L.; Li, C.; Zhang, J.; Meng, P.J.A.; Meteorology, F. Stable isotope analysis reveals prolonged drought stress in poplar plantation mortality of the Three-North Shelter Forest in Northern China. Agric. For. Meteorol. 2018, 252, 39–48. [Google Scholar]
- Sevanto, S.; McDowell, N.G.; Dickman, L.T.; Pangle, R.; Pockman, W.T. How do trees die? A test of the hydraulic failure and carbon starvation hypotheses. Plant Cell Environ. 2014, 37, 153–161. [Google Scholar]
- Brodribb, T.J.; Cochard, H. Hydraulic failure defines the recovery and point of death in water-stressed conifers. Plant Physiol. 2009, 149, 575–584. [Google Scholar]
- Hoffmann, W.A.; Marchin, R.M.; Abit, P.; Lau, O.L. Hydraulic failure and tree dieback are associated with high wood density in a temperate forest under extreme drought. Glob. Chang. Biol. 2011, 17, 2731–2742. [Google Scholar]
- Salmon, Y.; Torres-Ruiz, J.M.; Poyatos, R.; Martinez-Vilalta, J.; Meir, P.; Cochard, H.; Mencuccini, M. Balancing the risks of hydraulic failure and carbon starvation: A twig scale analysis in declining S cots pine. Plant Cell Environ. 2015, 38, 2575–2588. [Google Scholar]
- McDowell, N.; Pockman, W.T.; Allen, C.D.; Breshears, D.D.; Cobb, N.; Kolb, T.; Plaut, J.; Sperry, J.; West, A.; Williams, D.G. Mechanisms of plant survival and mortality during drought: Why do some plants survive while others succumb to drought? New Phytol. 2008, 178, 719–739. [Google Scholar]
- Field, C.B.; Jackson, R.B.; Mooney, H.A. Stomatal responses to increased CO2: Implications from the plant to the global scale. Plant Cell Environ. 1995, 18, 1214–1225. [Google Scholar]
- Battipaglia, G.; Saurer, M.; Cherubini, P.; Calfapietra, C.; McCarthy, H.R.; Norby, R.J.; Francesca Cotrufo, M. Elevated CO2 increases tree-level intrinsic water use efficiency: Insights from carbon and oxygen isotope analyses in tree rings across three forest FACE sites. New Phytol. 2013, 197, 544–554. [Google Scholar]
- Ainsworth, E.A.; Long, S.P. What have we learned from 15 years of free-air CO2 enrichment (FACE)? A meta-analytic review of the responses of photosynthesis, canopy properties and plant production to rising CO2. New Phytol. 2005, 165, 351–372. [Google Scholar]
- Weiwei, L.; Xinxiao, Y.; Guodong, J.; Hanzhi, L.; Ziqiang, L. Responses of Intrinsic Water-use Efficiency and Tree Growth to Climate Change in Semi-Arid Areas of North China. Sci. Rep. 2018, 8, 308. [Google Scholar]
- Nock, C.A.; Baker, P.J.; Wanek, W.; Leis, A.; Grabner, M.; Bunyavejchewin, S.; Hietz, P. Long-term increases in intrinsic water-use efficiency do not lead to increased stem growth in a tropical monsoon forest in western Thailand. Glob. Chang. Biol. 2011, 17, 1049–1063. [Google Scholar]
- Holmes, R.L. Computer-assisted quality control in tree-ring dating and measurement. Tree Ring Bull. 1983, 43, 69–78. [Google Scholar]
- Borella, S.; Leuenberger, M.; Saurer, M.; Siegwolf, R. Reducing uncertainties in δ13C analysis of tree rings: Pooling, milling, and cellulose extraction. J. Geophys. Res. Atmos. 1998, 103, 19519–19526. [Google Scholar]
- Di Matteo, G.; De Angelis, P.; Brugnoli, E.; Cherubini, P.; Scarascia-Mugnozza, G. Tree-ring Δ13C reveals the impact of past forest management on water-use efficiency in a Mediterranean oak coppice in Tuscany (Italy). Ann. For. Sci. 2010, 67, 510. [Google Scholar]
- Leavitt, S.W. Tree-ring isotopic pooling without regard to mass: No difference from averaging δ13C values of each tree. Chem. Geol. 2008, 252, 52–55. [Google Scholar]
- Liu, Y.; Wang, R.; Leavitt, S.W.; Song, H.; Linderholm, H.W.; Li, Q.; An, Z. Individual and pooled tree-ring stable-carbon isotope series in Chinese pine from the Nan Wutai region, China: Common signal and climate relationships. Chem. Geol. 2012, 330, 17–26. [Google Scholar]
- Szymczak, S.; Joachimski, M.; Bräuning, A.; Hetzer, T.; Kuhlemann, J. Are pooled tree ring δ13C and δ18O series reliable climate archives?—A case study of Pinus nigra spp. laricio (Corsica/France). Chem. Geol. 2012, 308, 40–49. [Google Scholar]
- Woodley, E.J.; Loader, N.; McCarroll, D.; Young, G.; Robertson, I.; Gagen, M. Estimating uncertainty in pooled stable isotope time-series from tree-rings. Chem. Geol. 2012, 294, 243–248. [Google Scholar]
- Wu, G.; Liu, X.; Chen, T.; Xu, G.; Wang, W.; Zeng, X.; Zhang, X. Elevation-dependent variations of tree growth and intrinsic water-use efficiency in Schrenk spruce (Picea schrenkiana) in the western Tianshan Mountains, China. Front. Plant Sci. 2015, 6, 309. [Google Scholar]
- Tognetti, R.; Lombardi, F.; Lasserre, B.; Cherubini, P.; Marchetti, M. Tree-ring stable isotopes reveal twentieth-century increases in water-use efficiency of Fagus sylvatica and Nothofagus spp. in Italian and Chilean mountains. PLoS ONE 2014, 9, e113136. [Google Scholar]
- McCarroll, D.; Loader, N.J. Stable isotopes in tree rings. Quat. Sci. Rev. 2004, 23, 771–801. [Google Scholar]
- Loader, N.; Robertson, I.; Barker, A.; Switsur, V.; Waterhouse, J. An improved technique for the batch processing of small wholewood samples to α-cellulose. Chem. Geol. 1997, 136, 313–317. [Google Scholar]
- Liu, X.; Wang, W.; Xu, G.; Zeng, X.; Wu, G.; Zhang, X.; Qin, D.J.T.P. Tree growth and intrinsic water-use efficiency of inland riparian forests in northwestern China: Evaluation via δ13C and δ18O analysis of tree rings. Tree Physiol. 2014, 34, 966–980. [Google Scholar]
- Farquhar, G.; Hubick, K.; Condon, A.; Richards, R. Carbon isotope fractionation and plant water-use efficiency. In Stable Isotopes in Ecological Research; Springer: Berlin/Heidelberg, Germany, 1989; pp. 21–40. [Google Scholar]
- Coplen, T.B.J.N. Discontinuance of SMOW and PDB. Nature 1995, 375, 285. [Google Scholar]
- Farquhar, G.D.; Sharkey, T.D. Stomatal conductance and photosynthesis. Ann. Rev. Plant Physiol. 1982, 33, 317–345. [Google Scholar]
- Wei, Z.; Du, Q.; Zhang, J.; Li, B.; Zhang, D. Genetic diversity and population structure in Chinese indigenous poplar (Populus simonii) populations using microsatellite markers. Plant Mol. Biol. Rep. 2013, 31, 620–632. [Google Scholar]
- Chen, J.; Song, Y.; Zhang, H.; Zhang, D. Genome-wide analysis of gene expression in response to drought stress in Populus simonii. Plant. Mol. Biol. Rep. 2013, 31, 946–962. [Google Scholar]
- Fernández, M.E.; Gyenge, J.; Schlichter, T. Water flux and canopy conductance of natural versus planted forests in Patagonia, South America. Trees 2009, 23, 415–427. [Google Scholar]
- Nardini, A.; Casolo, V.; Dal Borgo, A.; Savi, T.; Stenni, B.; Bertoncin, P.; Zini, L.; McDowell, N.G. Rooting depth, water relations and non-structural carbohydrate dynamics in three woody angiosperms differentially affected by an extreme summer drought. Plant Cell Environ. 2016, 39, 618–627. [Google Scholar]
- Yue, G.; Zhao, H.; Zhang, T.; Niu, L. Sap flow characteristics of growing poplar seedlings in Horqin sand land. J. Des. Res. 2009, 29, 674–679. [Google Scholar]
- Linares, J.C.; Camarero, J.J. From pattern to process: Linking intrinsic water-use efficiency to drought-induced forest decline. Glob. Chang. Biol. 2012, 18, 1000–1015. [Google Scholar]
- Gao, Y.; Zhu, X.; Yu, G.; He, N.; Wang, Q.; Tian, J.J.A.; Meteorology, F. Water use efficiency threshold for terrestrial ecosystem carbon sequestration in China under afforestation. Agri. For. Meteorol. 2014, 195, 32–37. [Google Scholar]
- Amlin, N.M.; Rood, S.B. Drought stress and recovery of riparian cottonwoods due to water table alteration along Willow Creek, Alberta. Trees 2003, 17, 351–358. [Google Scholar]
- Battipaglia, G.; De Micco, V.; Brand, W.A.; Saurer, M.; Aronne, G.; Linke, P.; Cherubini, P. Drought impact on water use efficiency and intra-annual density fluctuations in E rica arborea on E lba (I taly). Plant Cell Environ. 2014, 37, 382–391. [Google Scholar]
- Urrutia-Jalabert, R.; Malhi, Y.; Barichivich, J.; Lara, A.; Delgado-Huertas, A.; Rodríguez, C.G.; Cuq, E. Increased water use efficiency but contrasting tree growth patterns in Fitzroya cupressoides forests of southern Chile during recent decades. J. Geophys. Res. Biogeosci. 2015, 120, 2505–2524. [Google Scholar]
- Wils, T.H.; Robertson, I.; Woodborne, S.; Hall, G.; Koprowski, M.; Eshetu, Z. Anthropogenic forcing increases the water-use efficiency of African trees. J. Quat. Sci. 2016, 31, 386–390. [Google Scholar]
- Lévesque, M.; Siegwolf, R.; Saurer, M.; Eilmann, B.; Rigling, A. Increased water-use efficiency does not lead to enhanced tree growth under xeric and mesic conditions. New Phytol. 2014, 203, 94–109. [Google Scholar]
- Jones, H. Partitioning stomatal and non-stomatal limitations to photosynthesis. Plant Cell Environ. 1985, 8, 95–104. [Google Scholar]
- Ni, B.-R.; Pallardy, S.G. Stomatal and nonstomatal limitations to net photosynthesis in seedlings of woody angiosperms. Plant Physiol. 1992, 99, 1502–1508. [Google Scholar]
- Kubiskem, M.; Abrams, M. Stomatal and nonstomatal limitations of photosynthesis in 19 temperate tree species on contrasting sites during wet and dry years. Plant Cell Environ. 1993, 16, 1123–1129. [Google Scholar]
- Wilson, K.B.; Baldocchi, D.D.; Hanson, P.J. Quantifying stomatal and non-stomatal limitations to carbon assimilation resulting from leaf aging and drought in mature deciduous tree species. Tree Physiol. 2000, 20, 787–797. [Google Scholar]
- Grassi, G.; Magnani, F. Stomatal, mesophyll conductance and biochemical limitations to photosynthesis as affected by drought and leaf ontogeny in ash and oak trees. Plant Cell Environ. 2005, 28, 834–849. [Google Scholar]
- Chaves, M.M.; Pereira, J.S.; Maroco, J.; Rodrigues, M.L.; Ricardo, C.P.P.; Osório, M.L.; Carvalho, I.; Faria, T.; Pinheiro, C. How plants cope with water stress in the field? Photosynthesis and growth. Ann. Bot. 2002, 89, 907–916. [Google Scholar]
- Tezara, W.; Mitchell, V.; Driscoll, S.; Lawlor, D. Water stress inhibits plant photosynthesis by decreasing coupling factor and ATP. Nature 1999, 401, 914. [Google Scholar]
- Cornic, G. Drought stress inhibits photosynthesis by decreasing stomatal aperture–not by affecting ATP synthesis. Trends Plant Sci. 2000, 5, 187–188. [Google Scholar]
- Lawlor, D.W.; Cornic, G. Photosynthetic carbon assimilation and associated metabolism in relation to water deficits in higher plants. Plant. Cell Environ. 2002, 25, 275–294. [Google Scholar]
- Flexas, J.; Medrano, H. Drought-inhibition of photosynthesis in C3 plants: Stomatal and non-stomatal limitations revisited. Ann. Bot. 2002, 89, 183–189. [Google Scholar]
- Almeida-Rodriguez, A.M.; Cooke, J.E.; Yeh, F.; Zwiazek, J.J. Functional characterization of drought-responsive aquaporins in Populus balsamifera and Populus simonii× balsamifera clones with different drought resistance strategies. Physiol. Plant. 2010, 140, 321–333. [Google Scholar]
- Skubel, R.; Arain, M.A.; Peichl, M.; Brodeur, J.J.; Khomik, M.; Thorne, R.; Trant, J.; Kula, M. Age effects on the water-use efficiency and water-use dynamics of temperate pine plantation forests. Hydrol. Process. 2015, 29, 4100–4113. [Google Scholar]
- Will, R.E.; Wilson, S.M.; Zou, C.B.; Hennessey, T.C. Increased vapor pressure deficit due to higher temperature leads to greater transpiration and faster mortality during drought for tree seedlings common to the forest–grassland ecotone. New Phytol. 2013, 200, 366–374. [Google Scholar]
- Brienen, R.J.; Wanek, W.; Hietz, P. Stable carbon isotopes in tree rings indicate improved water use efficiency and drought responses of a tropical dry forest tree species. Trees 2011, 25, 103–113. [Google Scholar]
- Franks, P.J.; Drake, P.L.; Froend, R.H. Anisohydric but isohydrodynamic: Seasonally constant plant water potential gradient explained by a stomatal control mechanism incorporating variable plant hydraulic conductance. Plant Cell Environ. 2007, 30, 19–30. [Google Scholar]
- Nardini, A.; Battistuzzo, M.; Savi, T. Shoot desiccation and hydraulic failure in temperate woody angiosperms during an extreme summer drought. New Phytol. 2013, 200, 322–329. [Google Scholar]
- Barbeta, A.; Mejía-Chang, M.; Ogaya, R.; Voltas, J.; Dawson, T.E.; Peñuelas, J. The combined effects of a long-term experimental drought and an extreme drought on the use of plant-water sources in a Mediterranean forest. Glob. Chang. Biol. 2015, 21, 1213–1225. [Google Scholar]
Figure 1.
Annual temperature (T), relative humidity (RH) and precipitation (P) at the study site (1977–2016).
Figure 1.
Annual temperature (T), relative humidity (RH) and precipitation (P) at the study site (1977–2016).

Figure 2.
Annual variations of normal, mild declining and severe declining P. simonii in: the tree-ring cellulose stable carbon isotope (δ13C; (a)), tree-ring cellulose stable carbon discrimination (Δ13C; (b)), intercellular CO2 mole fractions (Ci; (c)) and the intrinsic water-use efficiency (iWUE; (d)) between 1977 and 2016. Error bars indicate the standard error (SE) of the mean values.

Figure 3.
Annual variations in tree-ring width and basal area increment (BAI, cm2) of normal, mild declining and severe declining P. simonii. Wn represents the tree-ring width of normal poplar; Wm represents the tree-ring width of mild declining poplar; Ws represents the tree-ring width of severe declining poplar. BAIn, BAIm and BAIs represent the basalt area increment of normal, mild declining and severe declining P. simonii. separately. The dotted lines represent the smoothed results using a 10-year fast Fourier transform (FFT) filter to emphasize long-term variations.

Figure 4.
Soil water content at different soil depths and annual variations of ground water depth during 1995 to 2016: (a) soil water content (SWC,%) at 0–60 cm soil depths (the main root distribution of poplar) of normal, mild declining and severe declining P. simonii; (b) soil water content (SWC,%) at 0–400 cm soil depth of normal, mild declining and severe declining P. simonii; (c) ground water depth. Error bars indicate the standard error (SE) of the mean values.

Figure 5.
Relationships between iWUE of different sites and annual temperature (T), relative humidity (RH) and annual precipitation (P). Linear regressions, regression equations and significant levels were shown in figures. “*” means that the linear relationship of regression equation is significant.


© 2020 by the authors. Licensee MDPI, Basel, Switzerland. This article is an open access article distributed under the terms and conditions of the Creative Commons Attribution (CC BY) license (http://creativecommons.org/licenses/by/4.0/).
Share and Cite
MDPI and ACS Style
Lu, W.; Yu, X.; Jia, G. Retrospective Analysis of Tree Decline Based on Intrinsic Water-Use Efficiency in Semi-Arid Areas of North China. Atmosphere 2020, 11, 577. https://doi.org/10.3390/atmos11060577
AMA Style
Lu W, Yu X, Jia G. Retrospective Analysis of Tree Decline Based on Intrinsic Water-Use Efficiency in Semi-Arid Areas of North China. Atmosphere. 2020; 11(6):577. https://doi.org/10.3390/atmos11060577
Chicago/Turabian StyleLu, Weiwei, Xinxiao Yu, and Guodong Jia. 2020. "Retrospective Analysis of Tree Decline Based on Intrinsic Water-Use Efficiency in Semi-Arid Areas of North China" Atmosphere 11, no. 6: 577. https://doi.org/10.3390/atmos11060577
Note that from the first issue of 2016, this journal uses article numbers instead of page numbers. See further details here.