Anti-Migratory Effects of 4′-Geranyloxyferulic Acid on LPS-Stimulated U937 and HCT116 Cells via MMP-9 Down-Regulation: Involvement of ROS/ERK Signaling Pathway

 , , , ,
Abstract
:1. Introduction
2. Materials and Methods
2.1. Cell Culture
2.2. MTT Assay for Cell Viability and Cytotoxicity
2.3. Cell Cycle Analysis
2.4. Migration Assay for U937 Cells
2.5. Scratch Assay
2.6. Analysis of MMP-9 Activity by Gelatin Zymography
2.7. mRNA Extraction and qRT-PCR Analysis
2.8. Western Blot
2.9. ROS Production Analysis
2.10. Cell Senescence Assay
2.11. Annexin V/PI Detection of Apoptotic and Necrotic Cells in Flow Cytometry
2.12. Caspase 3 Assay
2.13. Statistical Analysis
3. Results
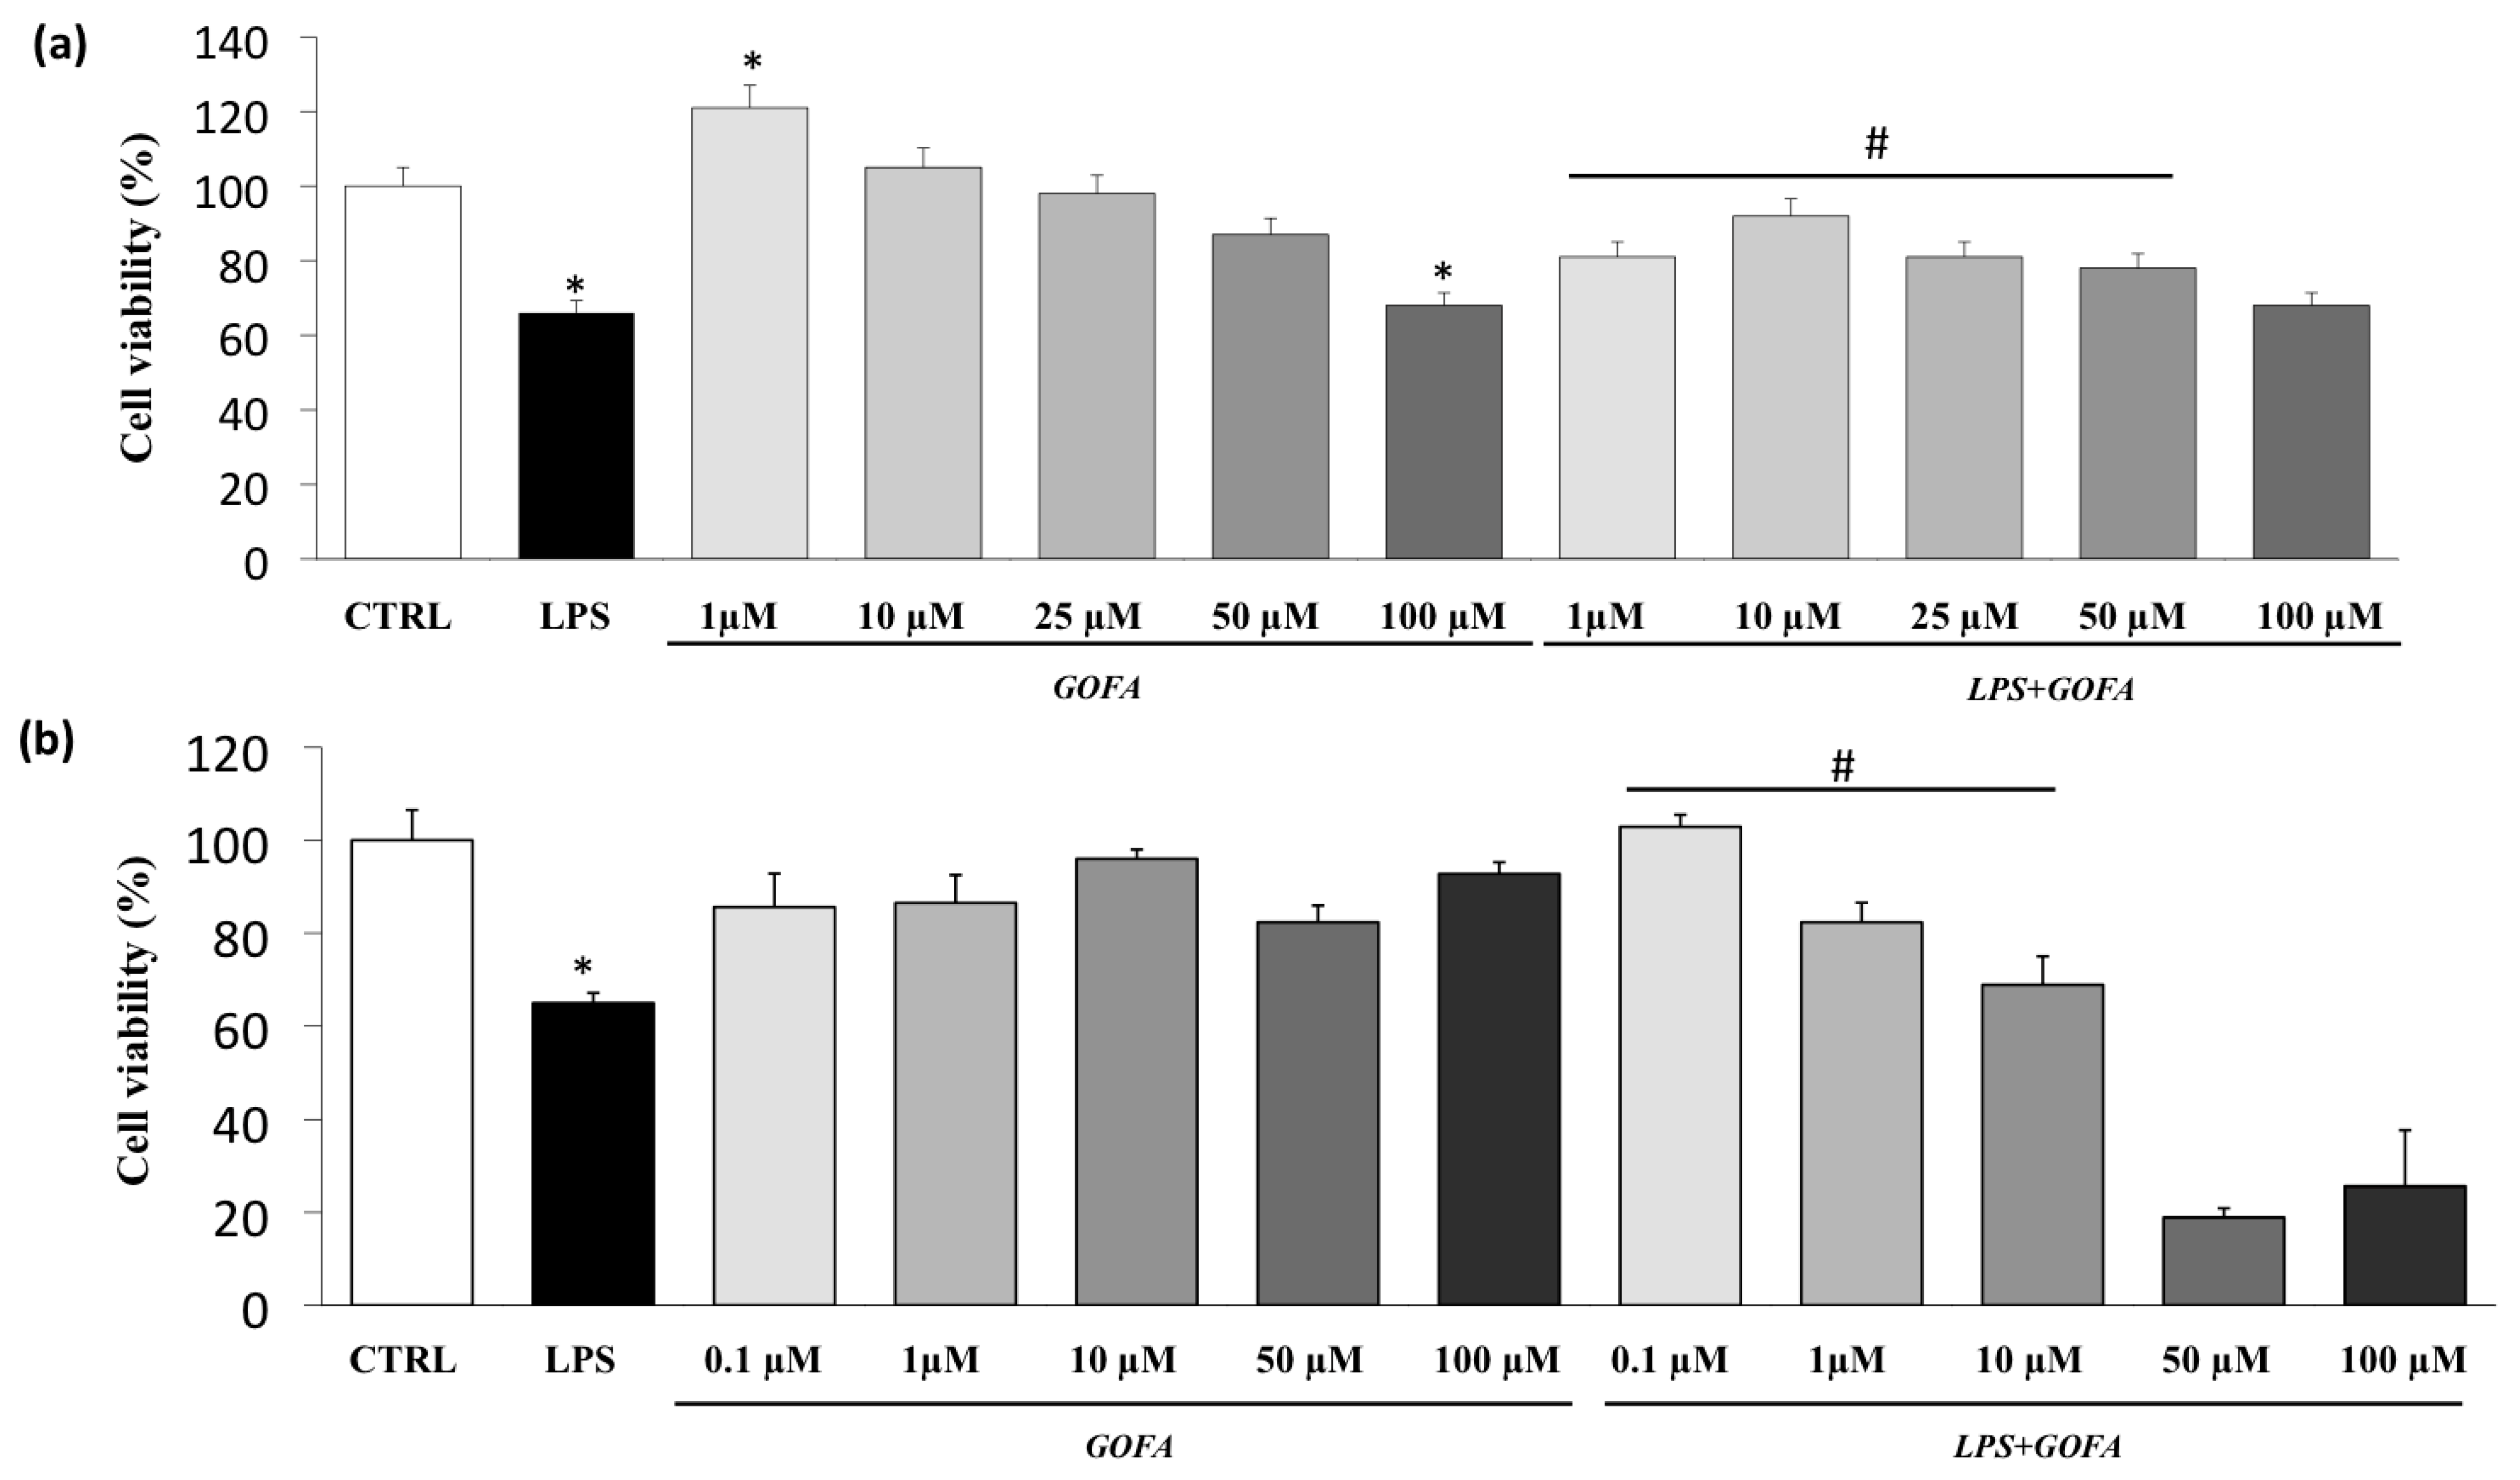
3.1. Cell Viability
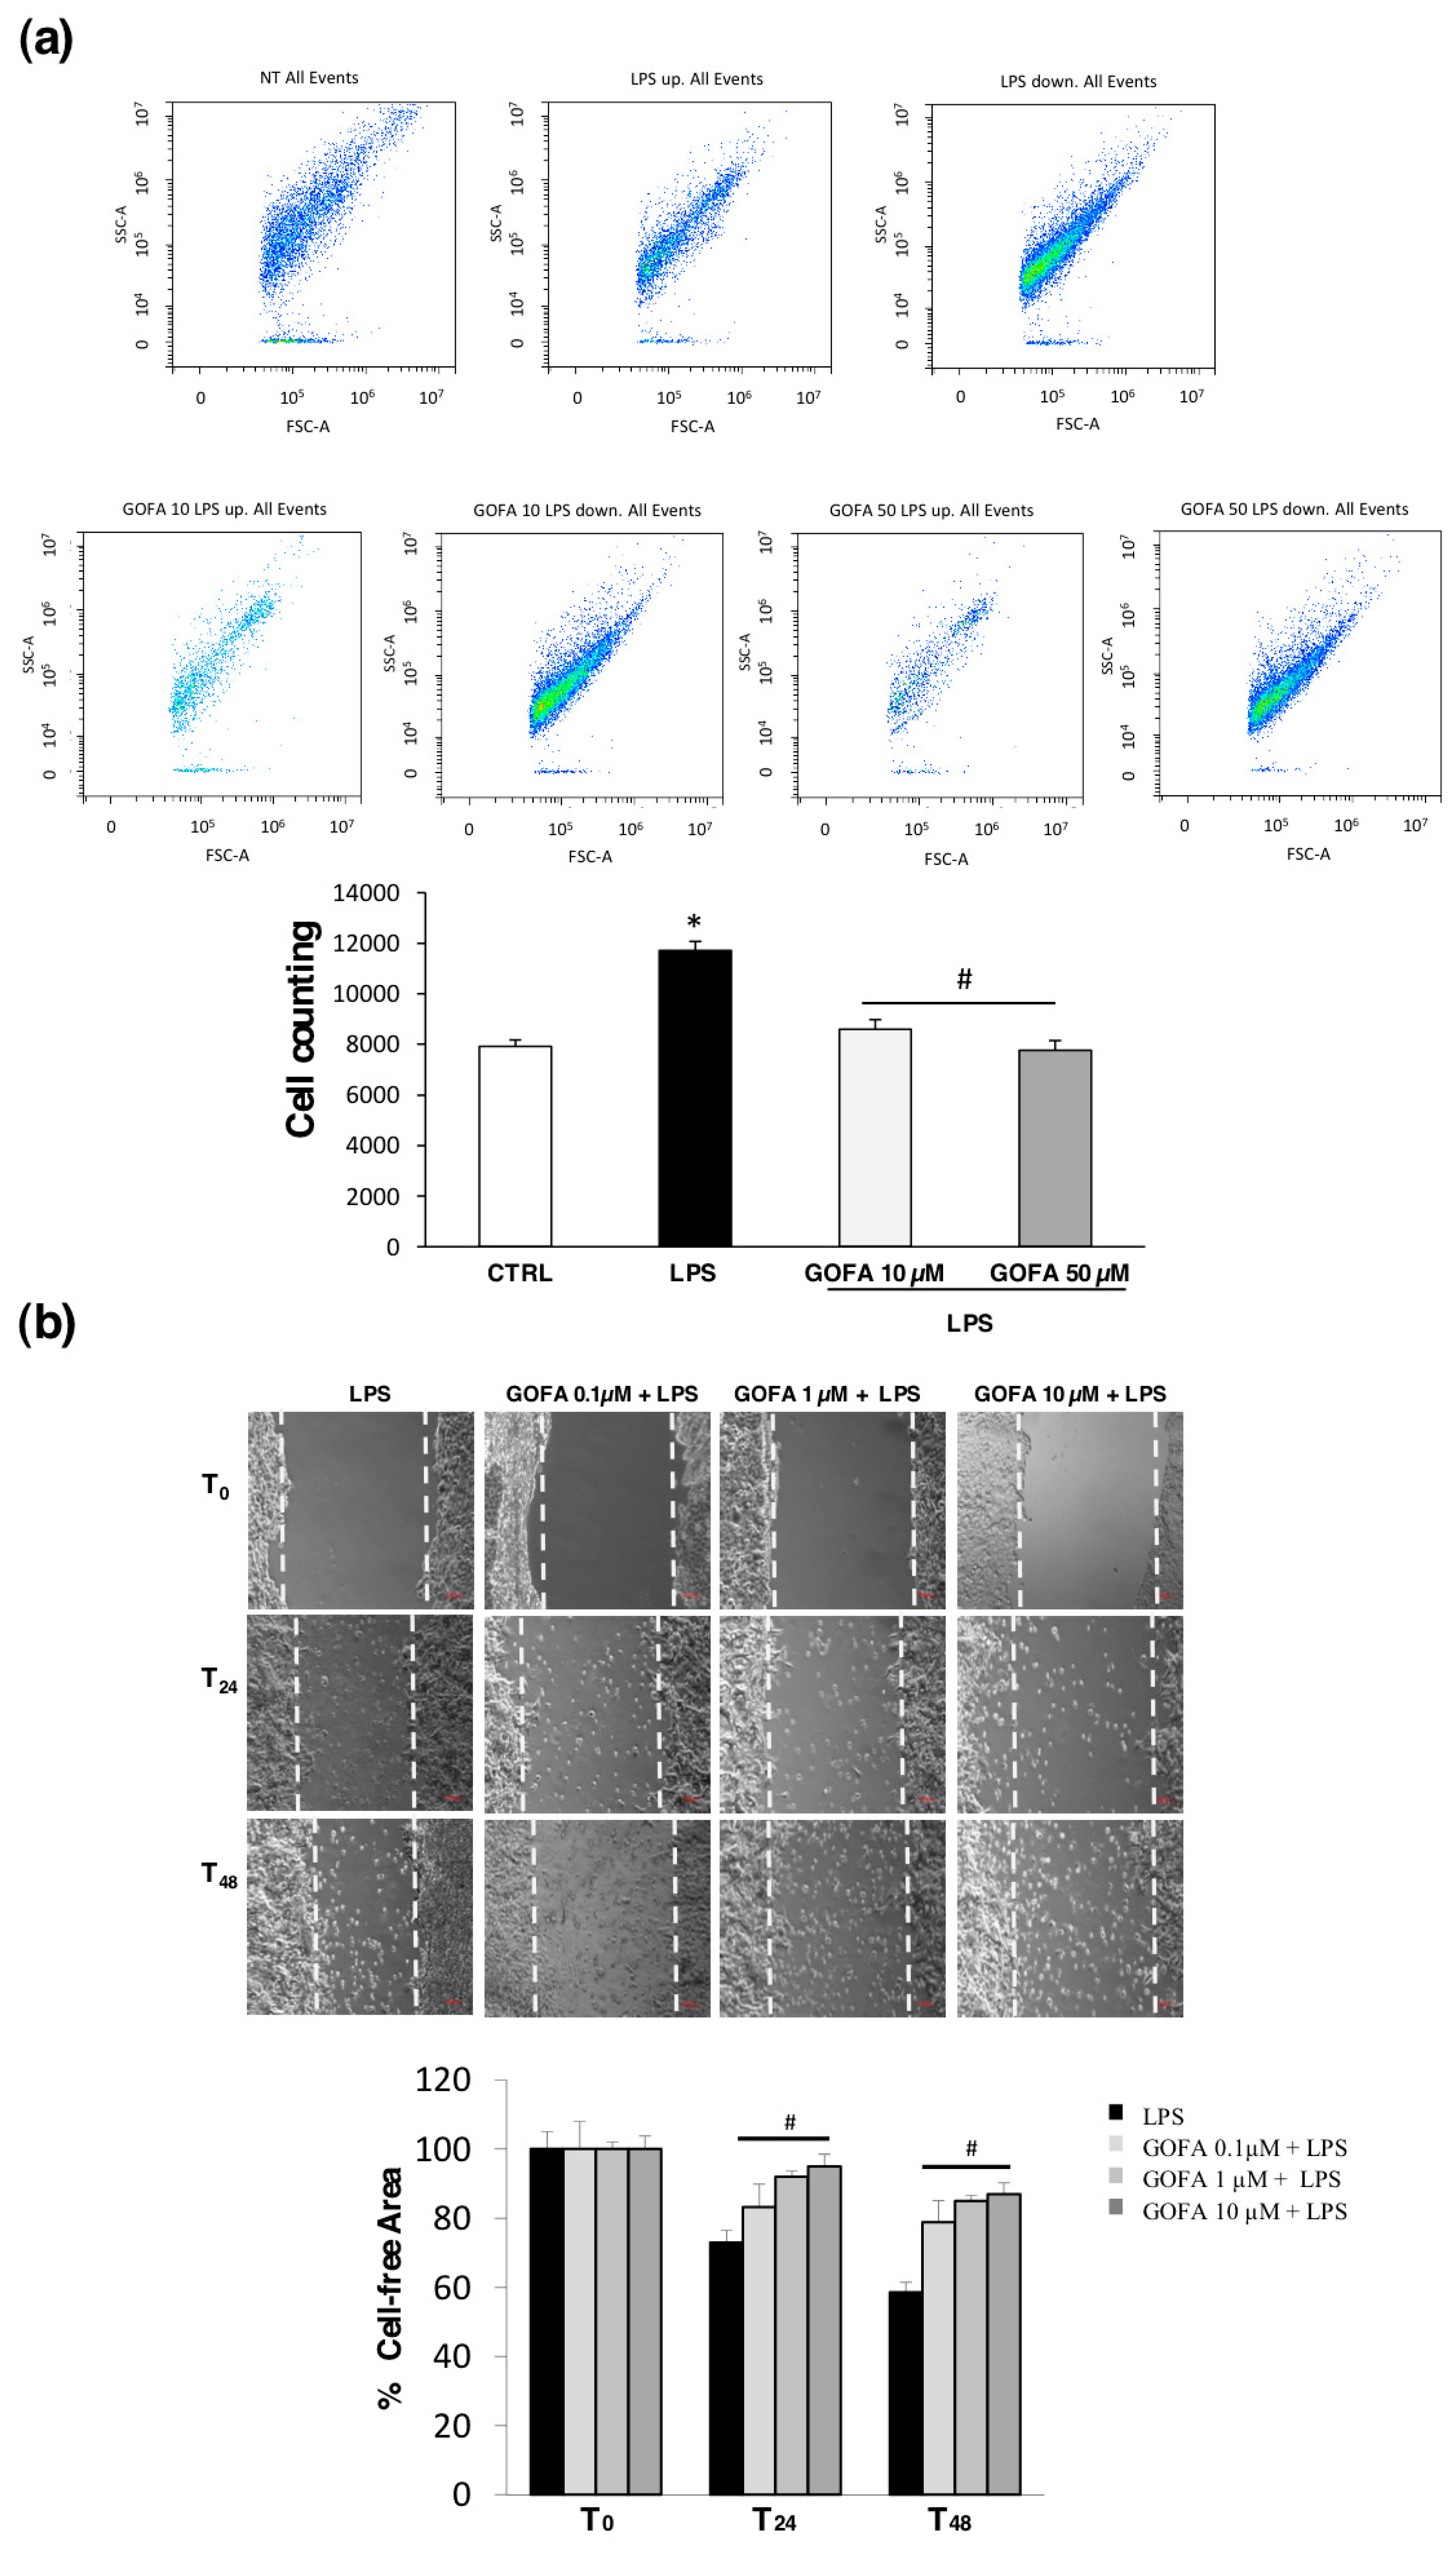
3.2. GOFA Affects Cell Proliferation and Migration
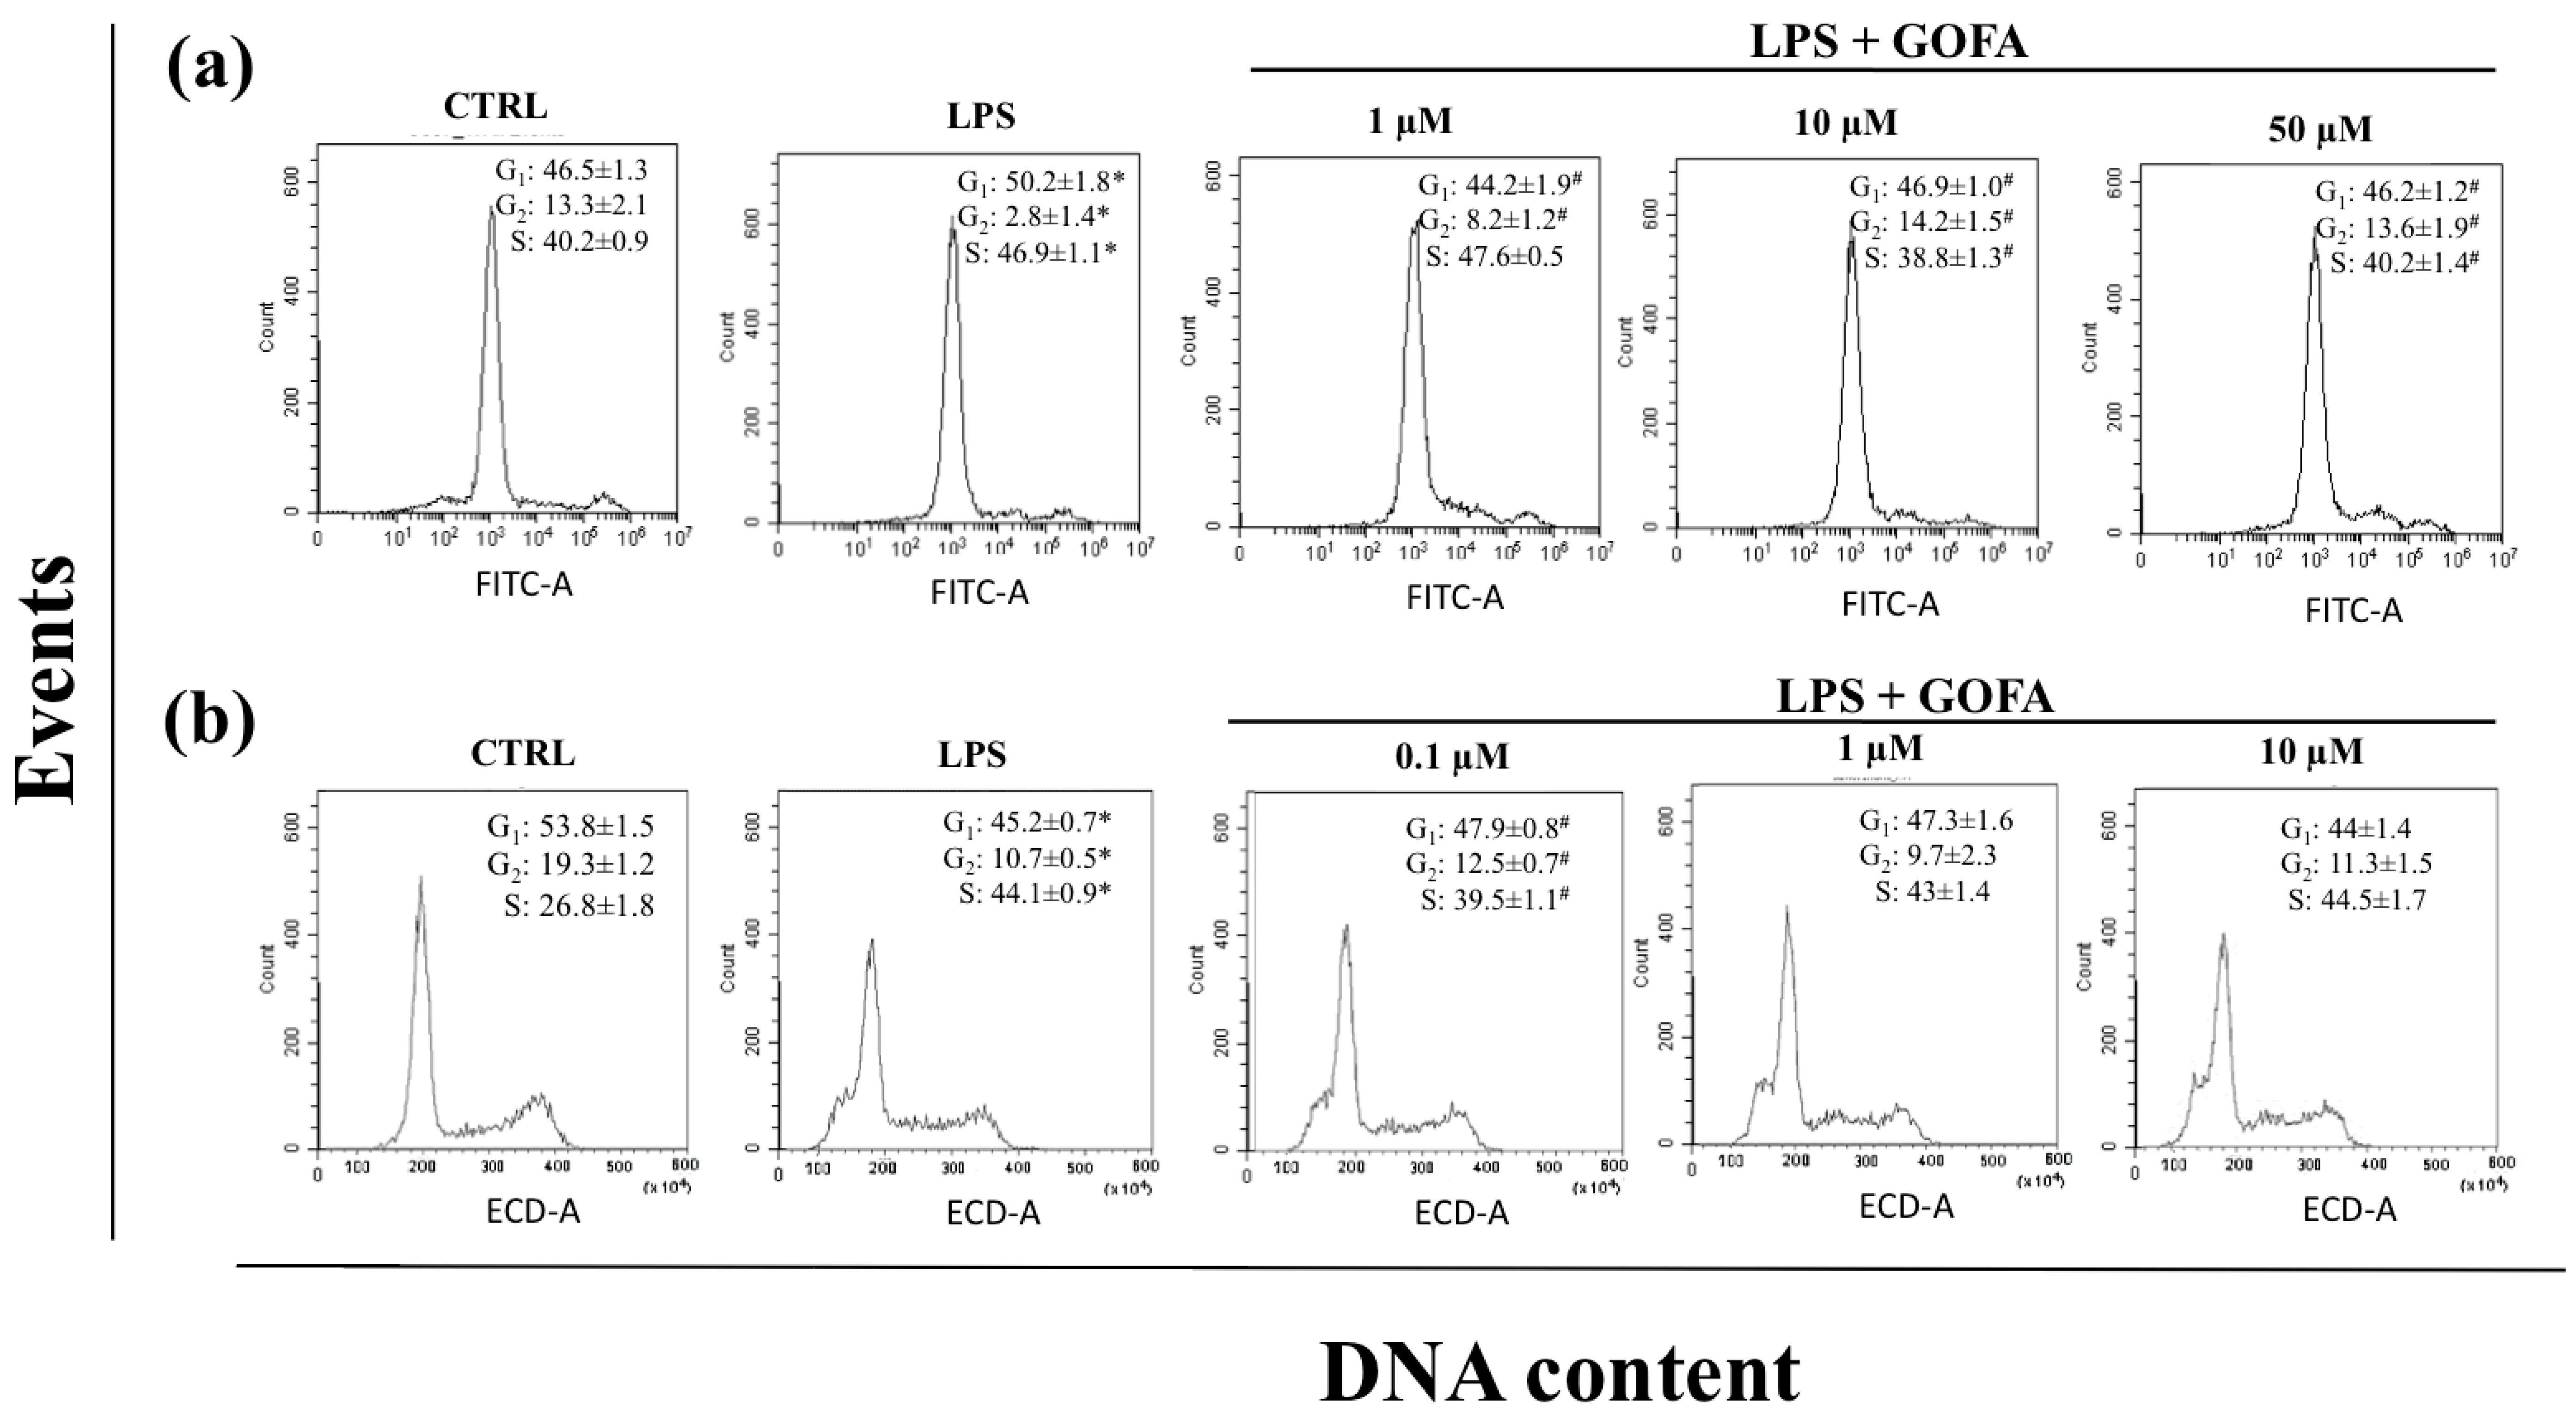
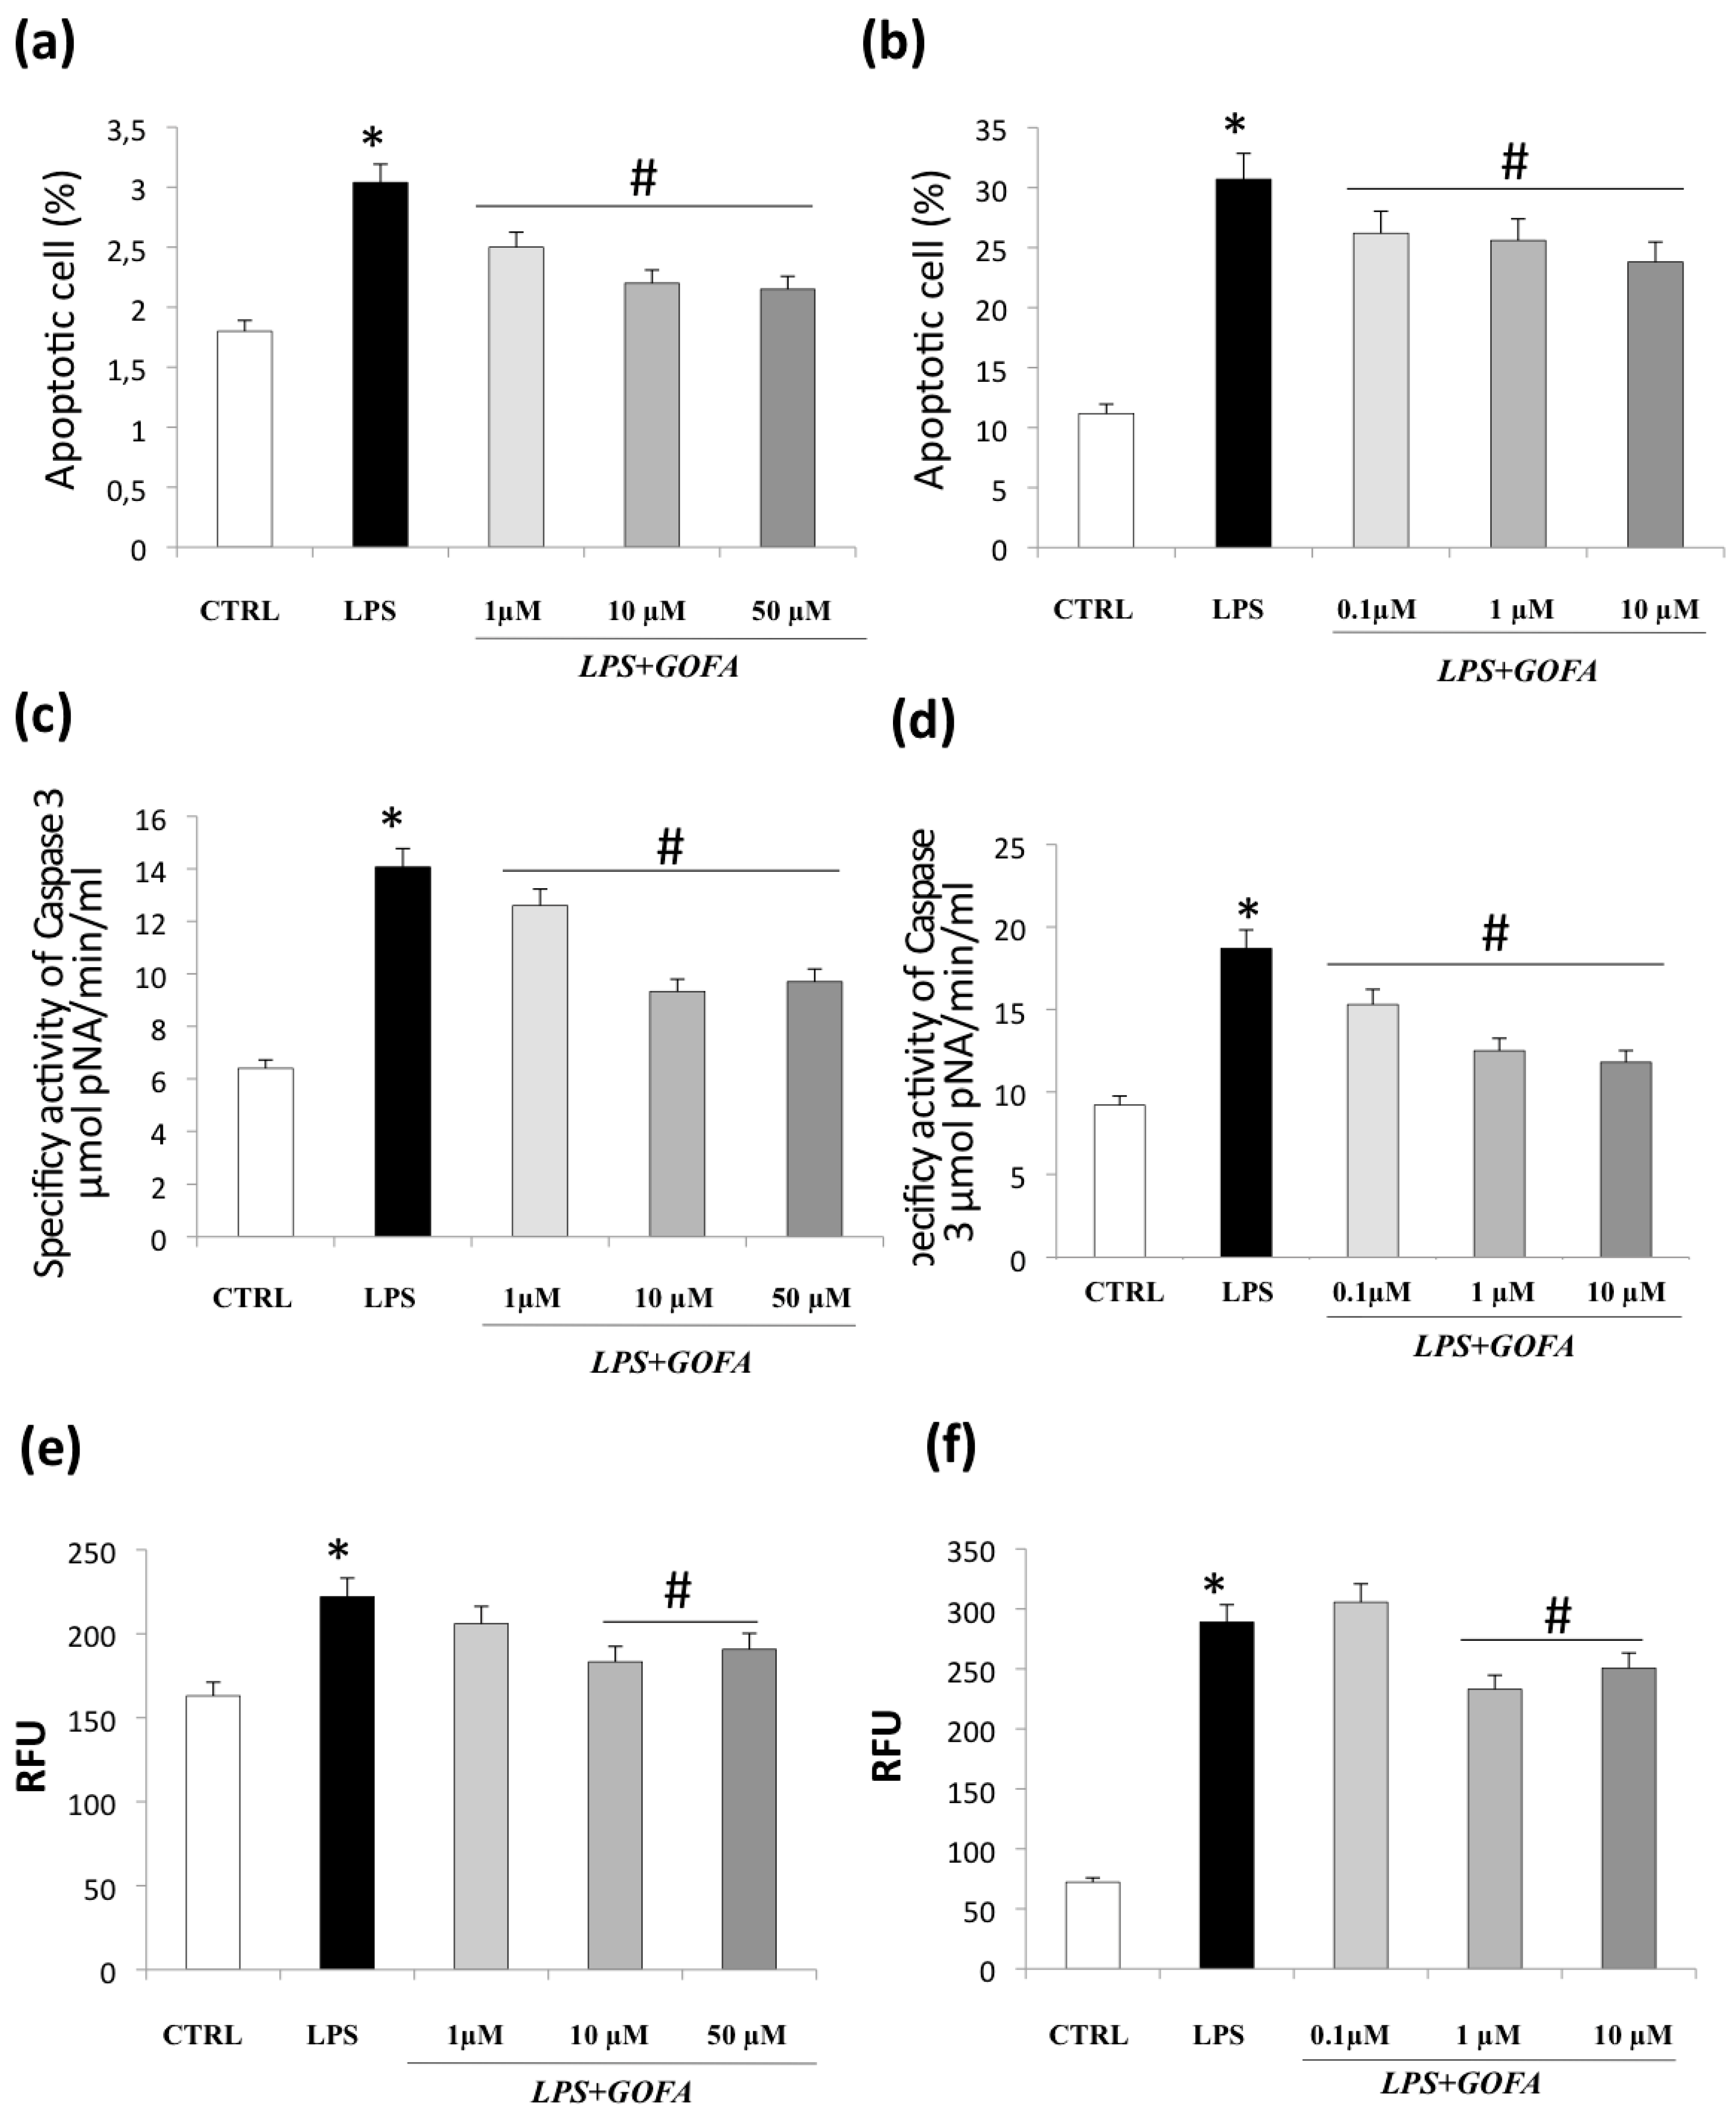
3.3. GOFA Attenuates Apoptosis and Cell Senescence
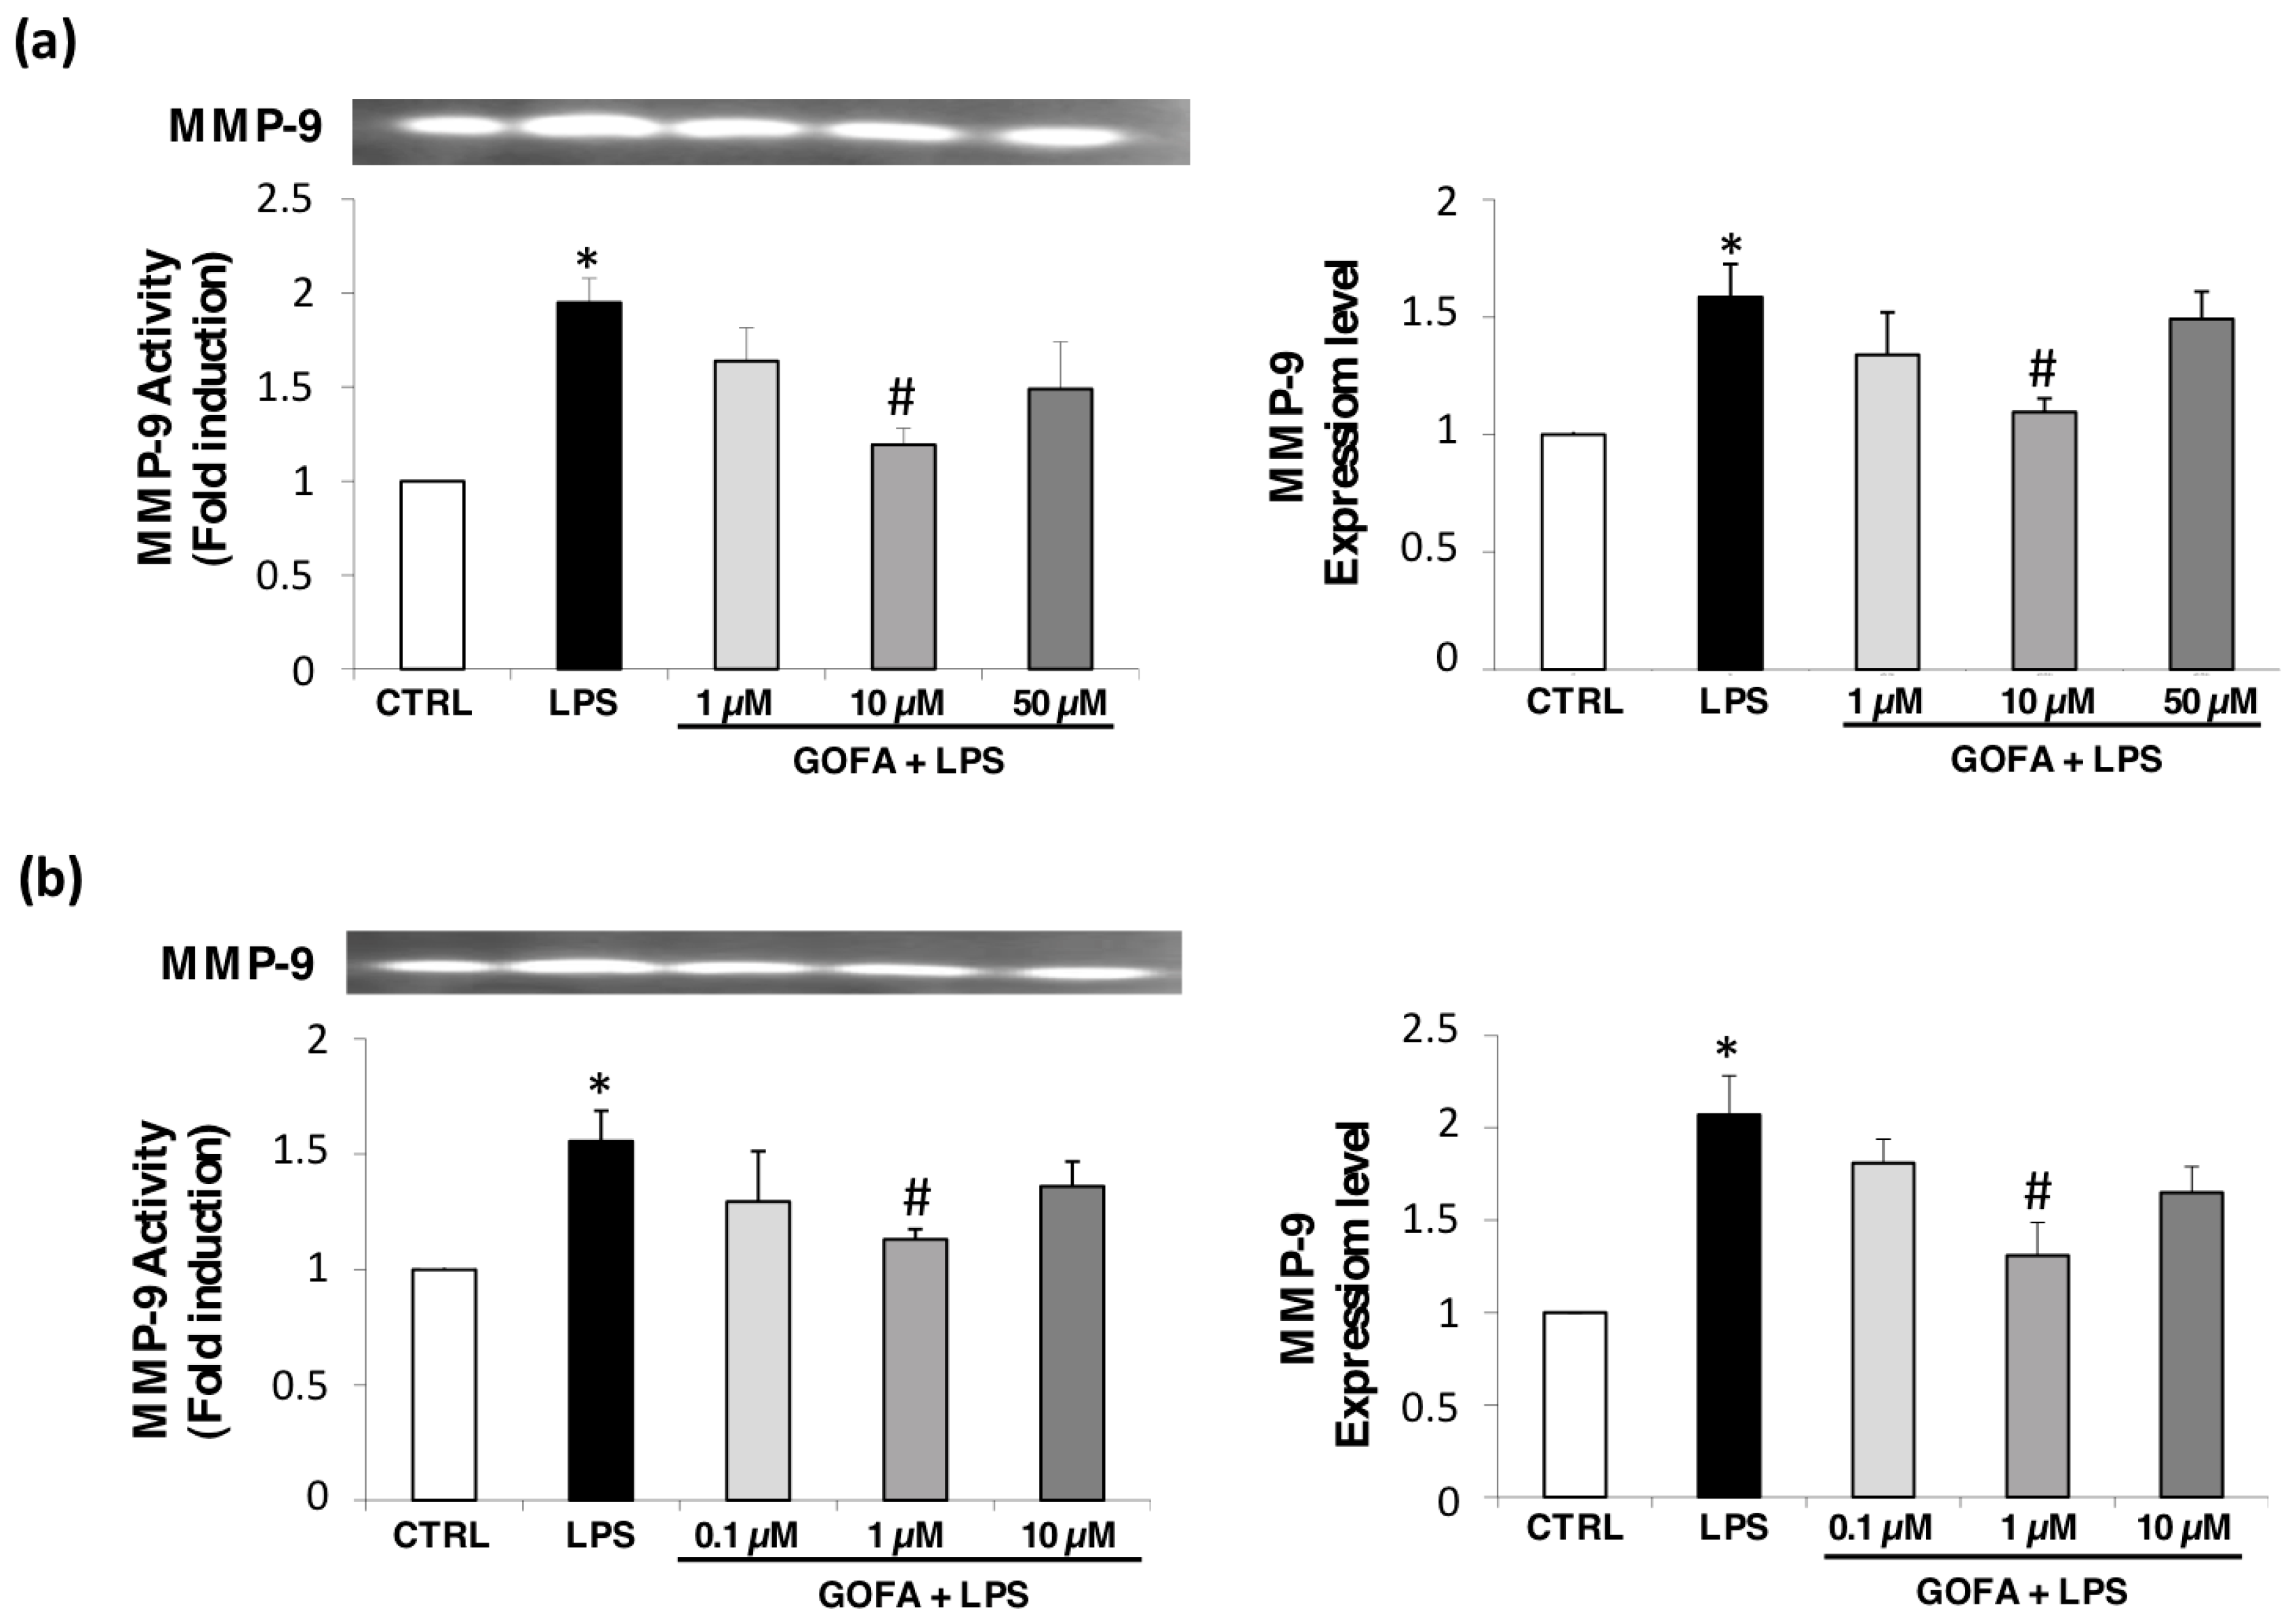
3.4. GOFA Effects on MMP-9 Expression and Activity
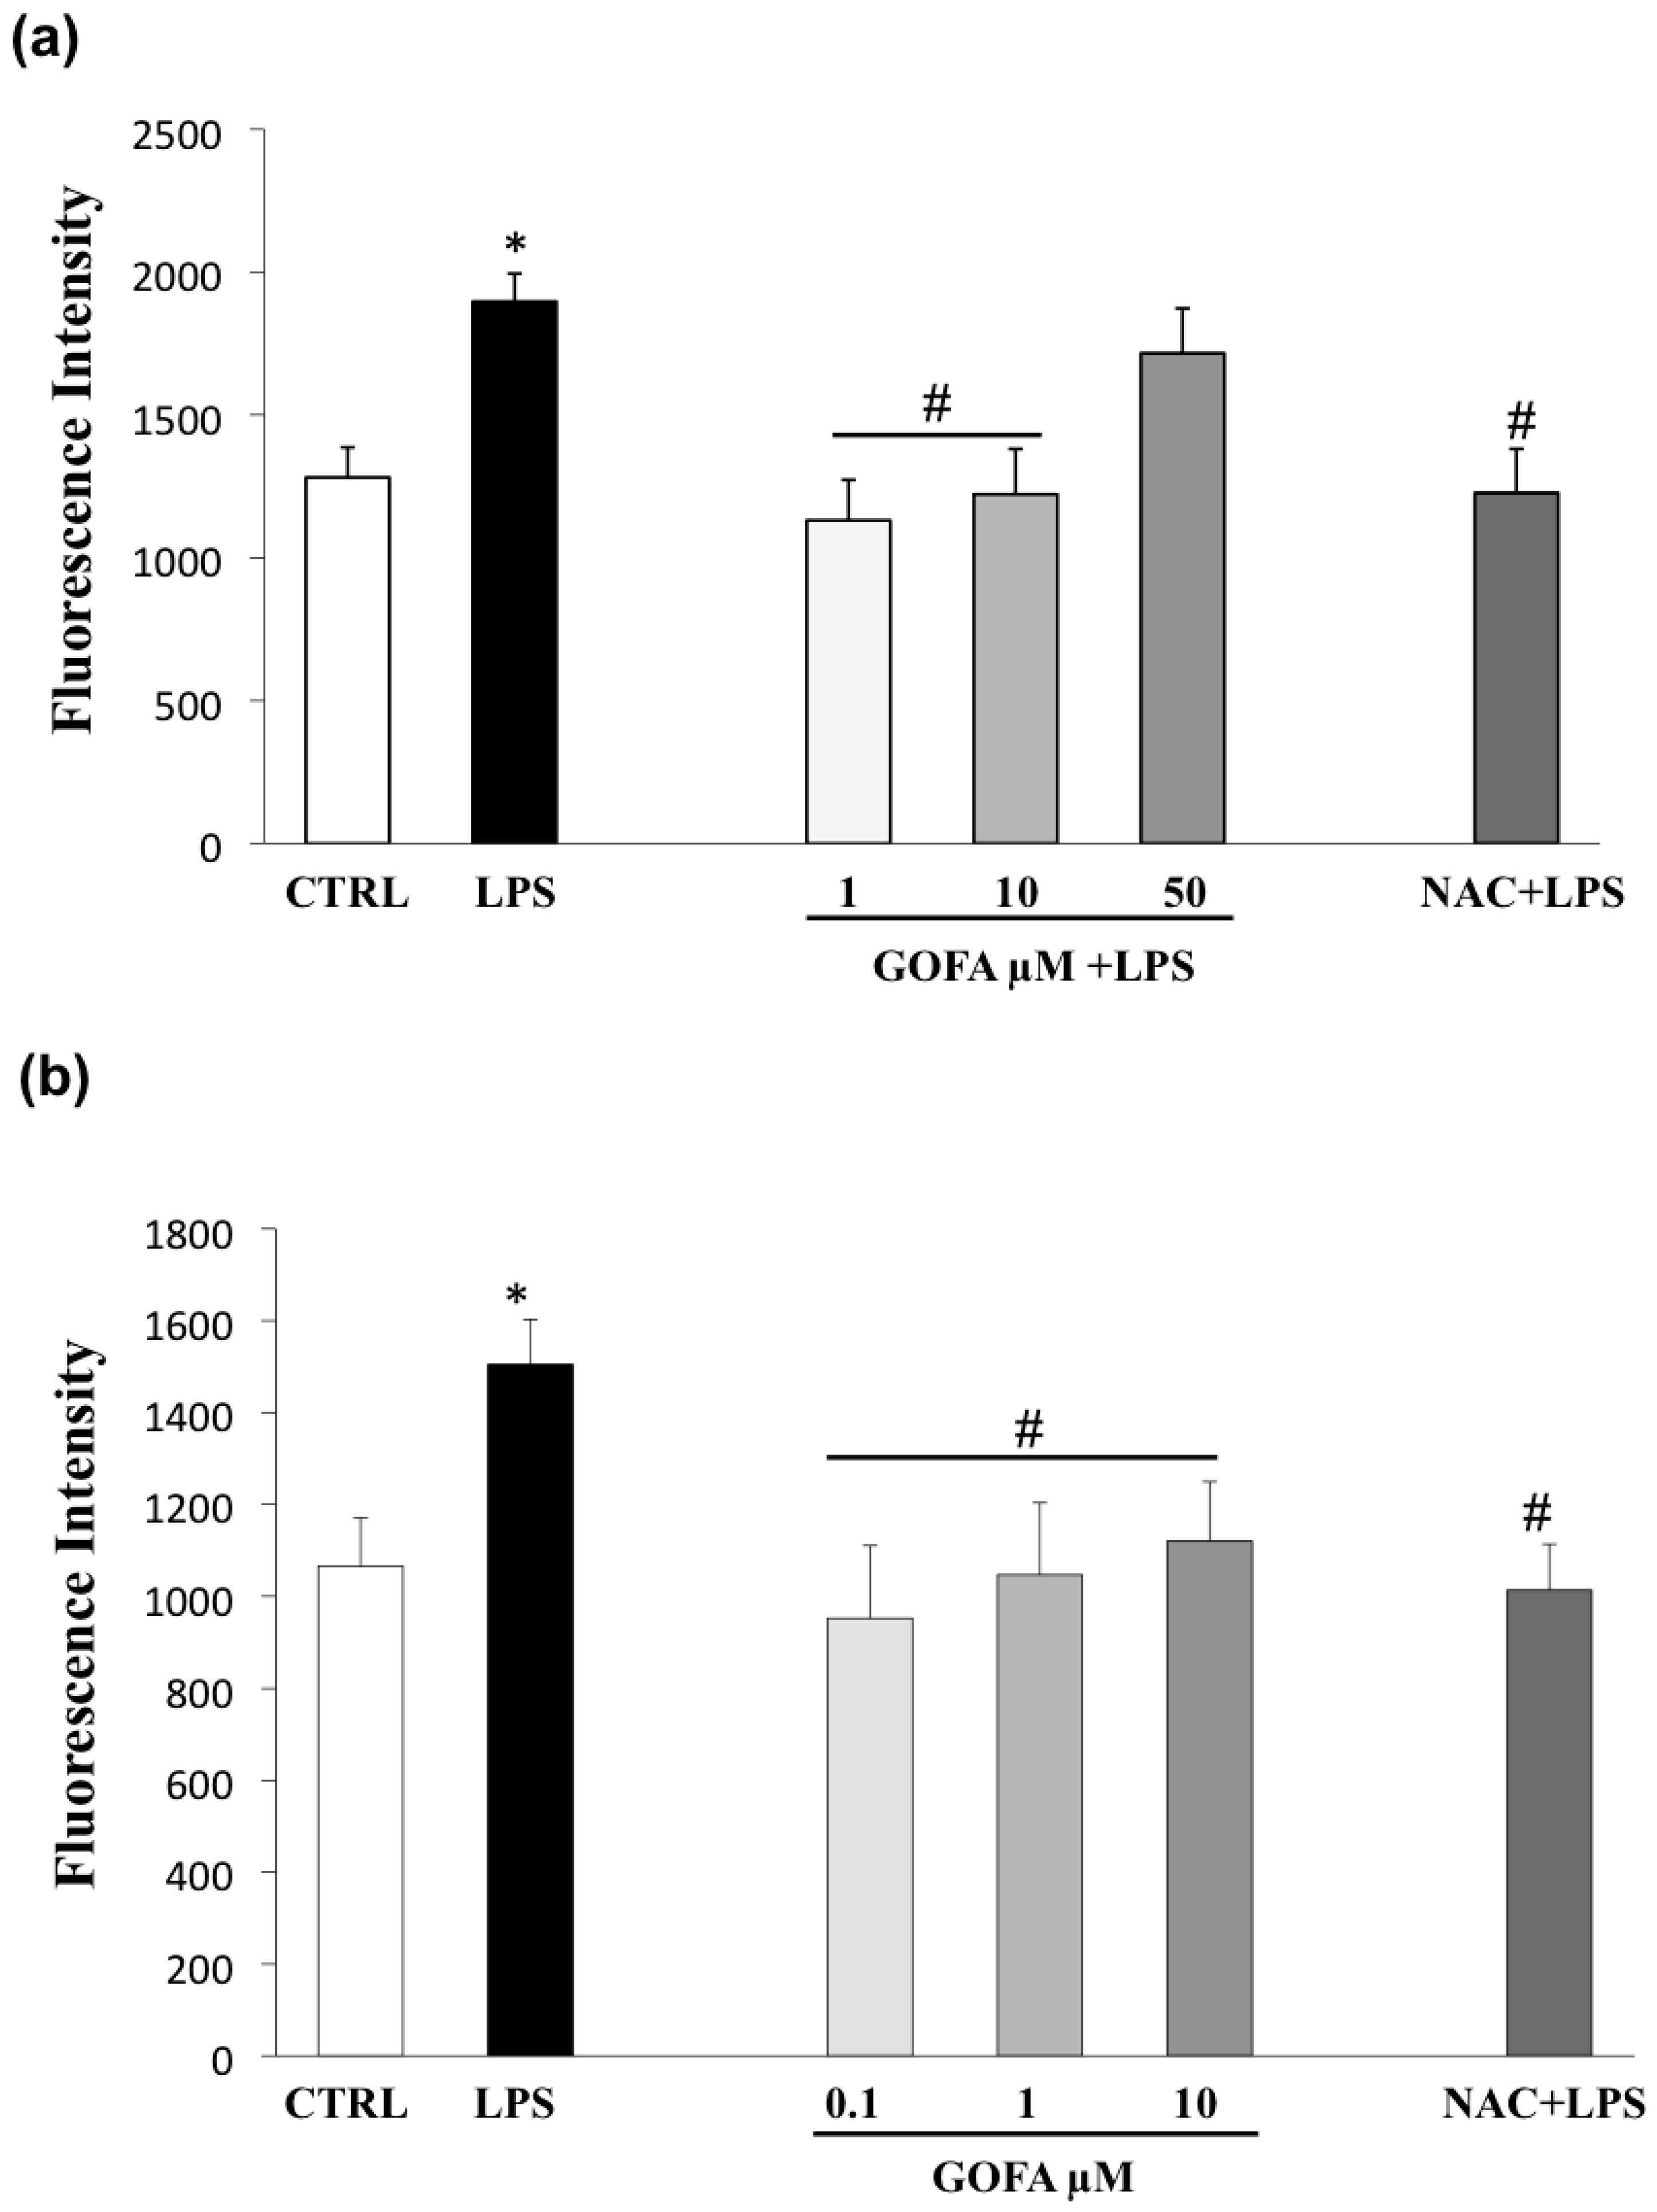
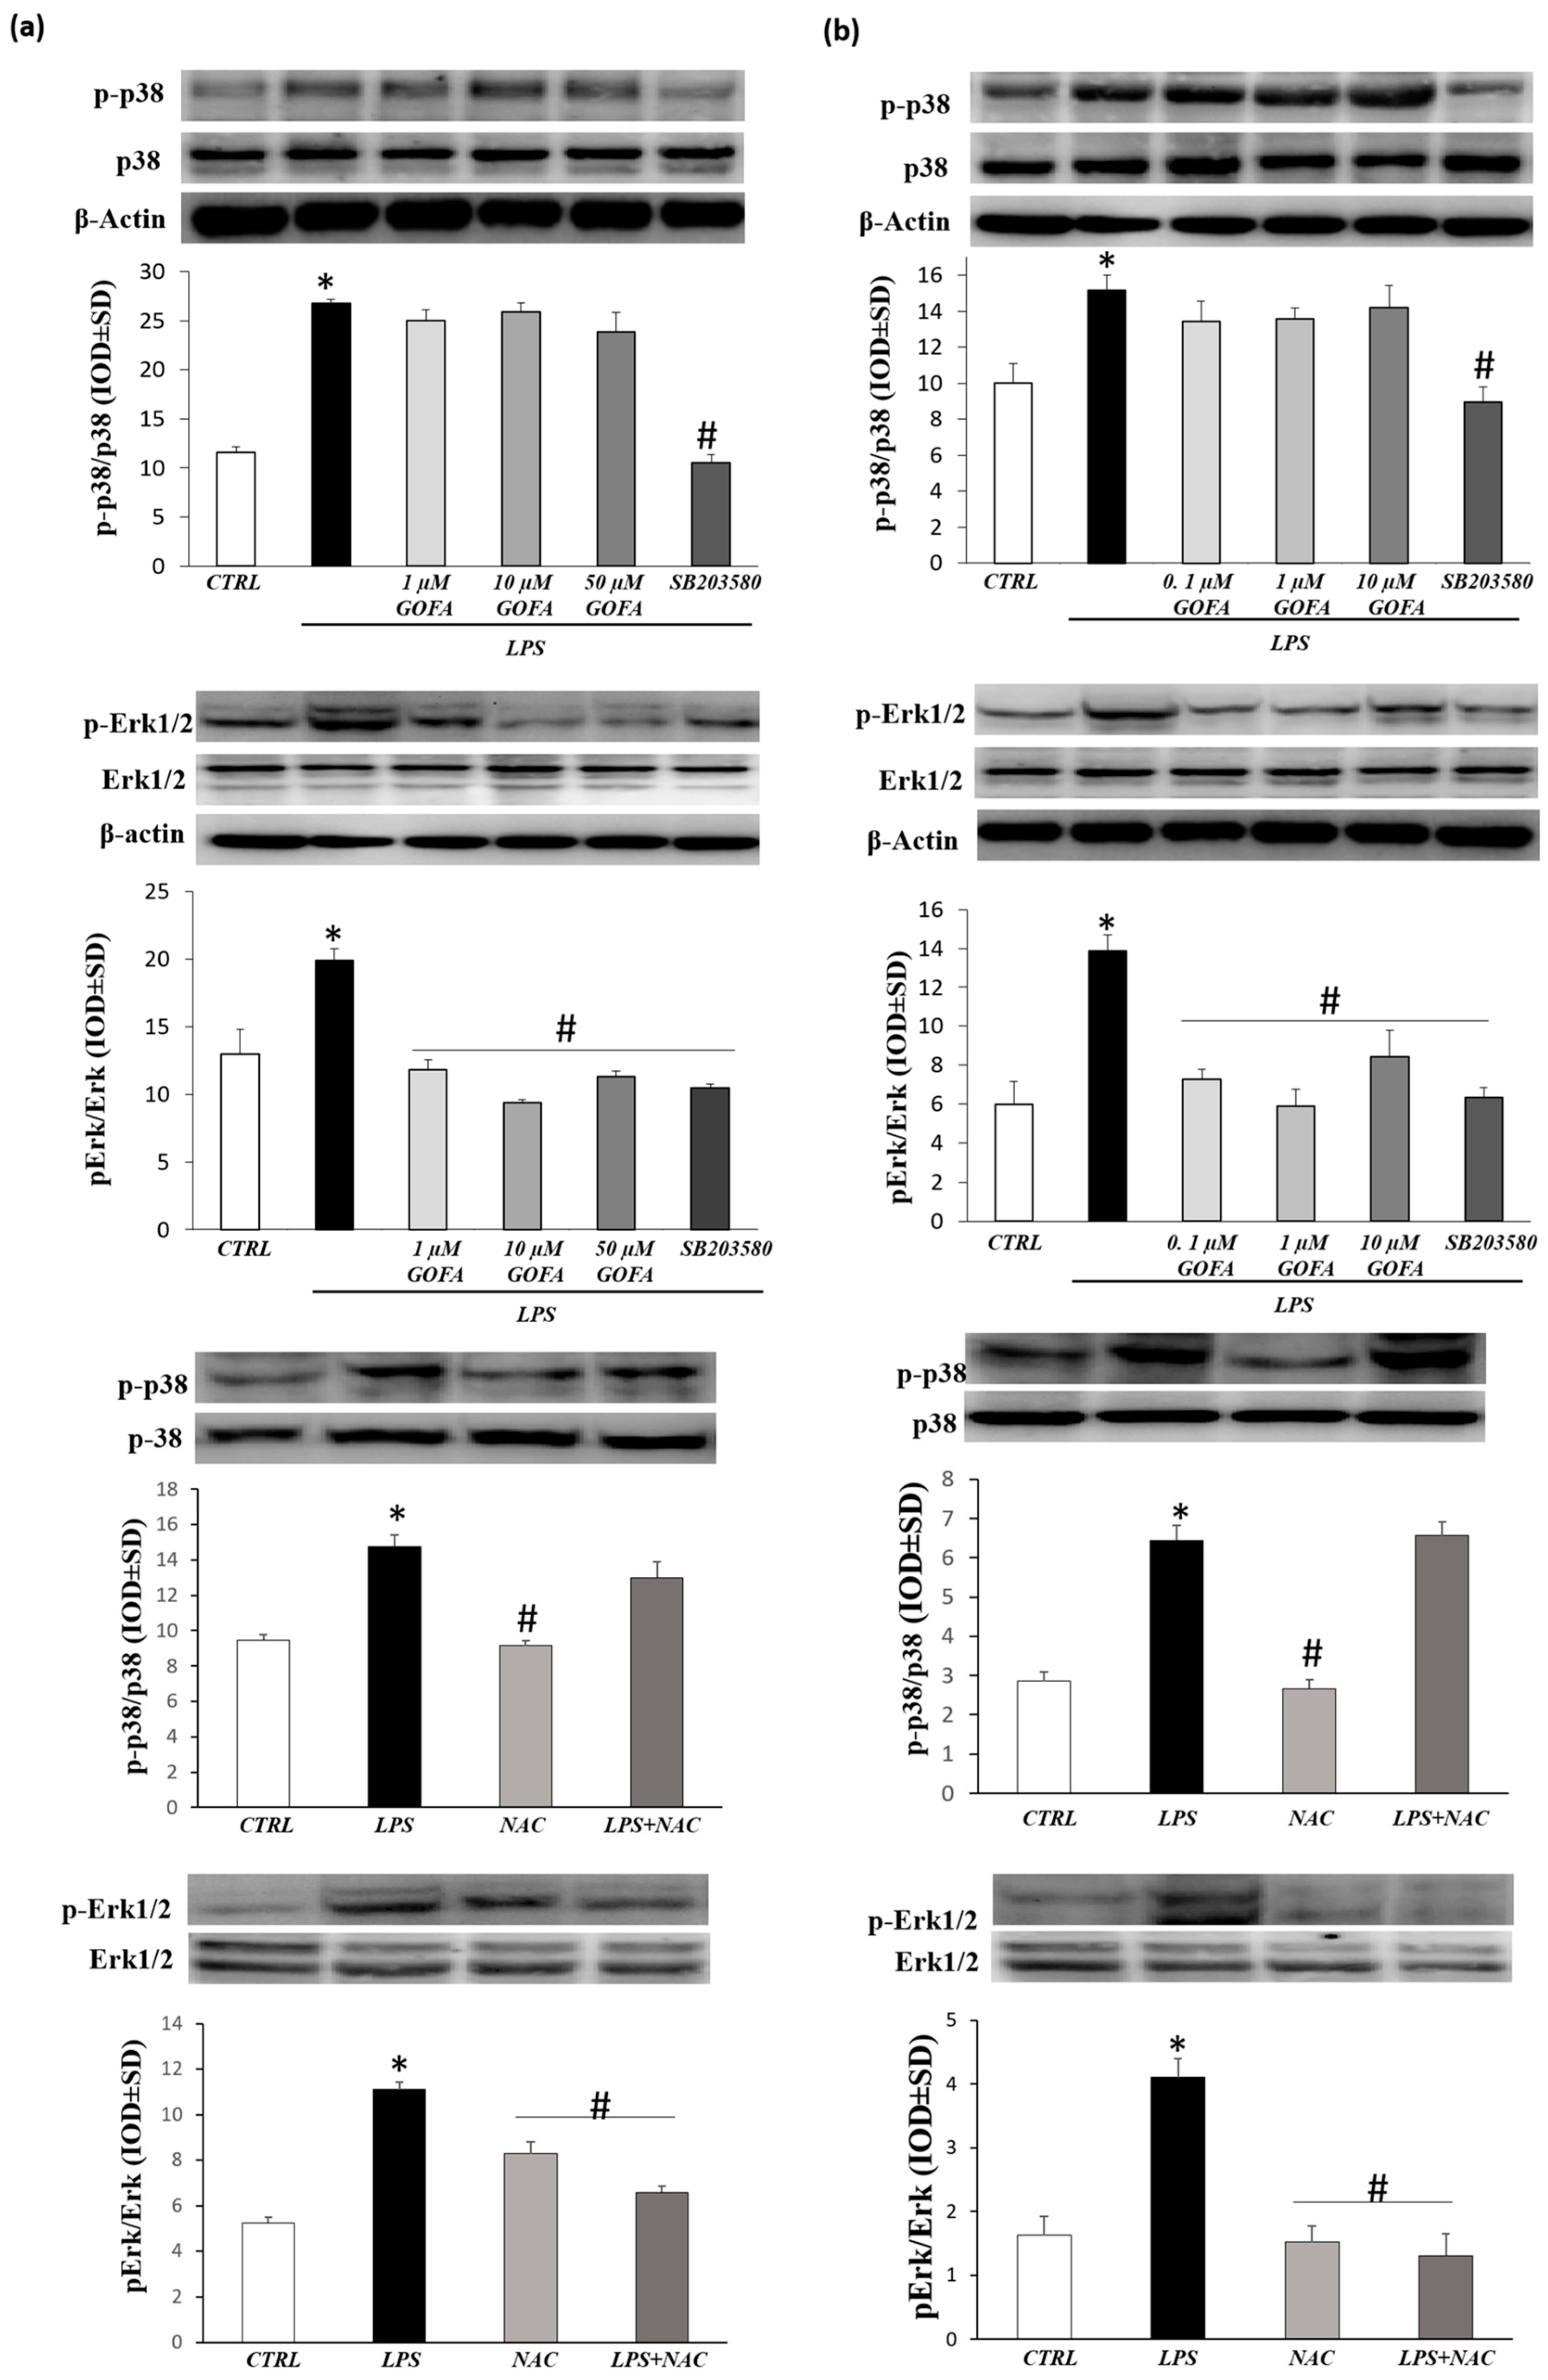
3.5. GOFA Inhibits Invasion of U937 and HCT116 Cells by Reducing MMP-9 Activity via ROS/ERK Pathway
4. Discussion
Author Contributions
Funding
Acknowledgments
Conflicts of Interest
References
- Patruno, A.; Ferrone, A.; Costantini, E.; Franceschelli, S.; Pesce, M.; Speranza, L.; Amerio, P.; D’Angelo, C.; Felaco, M.; Grilli, A.; et al. Extremely low-frequency electromagnetic fields accelerates wound healing modulating MMP-9 and inflammatory cytokines. Cell Prolif. 2018, 51, e12432. [Google Scholar] [CrossRef] [PubMed] [Green Version]
- Jeong, D.; Lee, J.; Park, S.H.; Kim, Y.A.; Park, B.J.; Oh, J.; Sung, G.H.; Aravinthan, A.; Kim, J.H.; Kang, H.; et al. Antiphotoaging and Antimelanogenic Effects of Penthorum chinense Pursh Ethanol Extract due to Antioxidant- and Autophagy-Inducing Properties. Oxid. Med. Cell Longev. 2019, 2019, 9679731. [Google Scholar] [CrossRef] [PubMed]
- Bauvois, B. New facets of matrix metalloproteinases MMP-2 and MMP-9 as cell surface transducers: Outside-in signaling and relationship to tumor progression. Biochim Biophys Acta. 2012, 1825, 29–36. [Google Scholar] [CrossRef] [PubMed]
- Franceschelli, S.; Pesce, M.; Ferrone, A.; Gatta, D.M.; Patruno, A.; De Lutiis, M.A.; Quiles, J.L.; Grilli, A.; Felaco, M.; Speranza, L. Biological Effect of Licochalcone C on the Regulation of PI3K/Akt/eNOS and NF-κB/iNOS/NO Signaling Pathways in H9c2 Cells in Response to LPS Stimulation. Int. J. Mol. Sci. 2017, 18, 690. [Google Scholar] [CrossRef] [PubMed]
- Pesce, M.; Speranza, L.; Franceschelli, S.; Ialenti, V.; Patruno, A.; Febo, M.A.; De Lutiis, M.A.; Felaco, M.; Grilli, A. Biological role of interleukin-1β in defensive aggressive behavior. J. Biol. Regul. Homeost. Agents 2011, 25, 323–329. [Google Scholar]
- Pesce, M.; Patruno, A.; Speranza, L.; Reale, M. Extremely low frequency electromagnetic field and wound healing: Implication of cytokines as biological mediators. Eur. Cytokine Netw. 2013, 24, 1–10. [Google Scholar] [CrossRef] [Green Version]
- Mittal, M.; Siddiqui, M.R.; Tran, K.; Reddy, S.P.; Malik, A.B. Reactive oxygen species in inflammation and tissue injury. Antioxid. Redox Signal. 2014, 20, 1126–1167. [Google Scholar] [CrossRef] [Green Version]
- Iarlori, C.; Gambi, D.; Lugaresi, A.; Patruno, A.; Felaco, M.; Salvatore, M.; Speranza, L.; Reale, M. Reduction of free radicals in multiple sclerosis: Effect of glatiramer acetate (Copaxone). Mult. Scler. 2008, 14, 739–748. [Google Scholar] [CrossRef]
- Bulboaca, A.E.; Boarescu, P.M.; Porfire, A.S.; Dogaru, G.; Barbalata, C.; Valeanu, M.; Munteanu, C.; Râjnoveanu, R.M.; Nicula, C.A.; Stanescu, I.C. The Effect of Nano-Epigallocatechin-Gallate on Oxidative Stress and Matrix Metalloproteinases in Experimental Diabetes Mellitus. Antioxidants 2020, 9, 172. [Google Scholar] [CrossRef] [Green Version]
- Bonnans, C.; Chou, J.; Werb, Z. Remodelling the extracellular matrix in development and disease. Nat. Rev. Mol. Cell Biol. 2014, 15, 786–801. [Google Scholar] [CrossRef]
- Tallant, C.; Marrero, A.; Gomis-Rüth, F.X. Matrix metalloproteinases: Fold and function of their catalytic domains. Biochim. Biophys. Acta 2010, 1803, 20–28. [Google Scholar] [CrossRef] [PubMed]
- Manicone, A.M.; McGuire, J.K. Matrix metalloproteinases as modulators of inflammation. Semin. Cell Dev. Biol. 2008, 19, 34–41. [Google Scholar] [CrossRef] [PubMed] [Green Version]
- Tokito, A.; Jougasaki, M. Matrix Metalloproteinases in Non-Neoplastic Disorders. Int. J. Mol. Sci. 2016, 17, 1178. [Google Scholar] [CrossRef] [PubMed] [Green Version]
- Kessenbrock, K.; Plaks, V.; Werb, Z. Matrix metalloproteinases: Regulators of the tumor microenvironment. Cell 2010, 141, 52–67. [Google Scholar] [CrossRef] [Green Version]
- Pesce, M.; Franceschelli, S.; Ferrone, A.; De Lutiis, M.A.; Patruno, A.; Grilli, A.; Felaco, M.; Speranza, L. Verbascoside down-regulates some pro-inflammatory signal transduction pathways by increasing the activity of tyrosine phosphatase SHP-1 in the U937 cell line. J. Cell Mol. Med. 2015, 19, 1548–1556. [Google Scholar] [CrossRef] [PubMed]
- Epifano, F.; Fiorito, S.; Taddeo, V.A.; Genovese, S. 4′-Geranyloxyferulic acid: An overview of its potentialities as an anti-cancer and anti-inflammatory agent. Phytochem. Rev. 2015, 14, 607–612. [Google Scholar] [CrossRef]
- Perera, P.Y.; Mayadas, T.N.; Takeuchi, O.; Akira, S.; Zaks-Zilberman, M.; Goyert, S.M.; Vogel, S.N. CD11b/CD18 acts in concert with CD14 and Toll-like receptor (TLR) 4 to elicit full lipopolysaccharide and taxol-inducible gene expression. J. Immunol. 2001, 166, 574. [Google Scholar] [CrossRef] [Green Version]
- Kojima, M.; Morisaki, T.; Izuhara, K.; Uchiyama, A.; Matsunari, Y.; Katano, M.; Tanaka, M. Lipopolysaccharide increases cyclo-oxygenase-2 in a colon carcinoma cell line through nuclear factor-kB activation. Oncogene 2000, 19, 1225–1231. [Google Scholar]
- Chow, J.C.; Young, D.W.; Golenbock, D.T.; Christ, W.J.; Gusovsky, F. Toll-like receptor-4 mediates lipopolysaccharide-induced signal transduction. J. Biol. Chem. 1999, 274, 10689. [Google Scholar] [CrossRef] [Green Version]
- Ikebe, M.; Kitaura, Y.; Nakamura, M.; Tanaka, H.; Yamasaki, A.; Nagai, S.; Wada, J.; Yanai, K.; Koga, K.; Sato, N.; et al. Lipopolysaccharide (LPS) increases the invasive ability of pancreatic cancer cells through the TLR4/MyD88 signaling pathway. J. Surg. Oncol. 2009, 100, 725–731. [Google Scholar] [CrossRef]
- Franceschelli, S.; Gatta, D.M.P.; Pesce, M.; Ferrone, A.; Quiles, J.L.; Genovese, S.; Epifano, F.; Fiorito, S.; Taddeo, V.A.; Patruno, A.; et al. New approach in translational medicine: Effects of electrolyzed reduced water (ERW) on NF-κB/iNOS pathway in U937 cell line under Altered Redox State. Int. J. Mol. Sci. 2016, 17, 1461. [Google Scholar] [CrossRef] [PubMed] [Green Version]
- Modulation of CAT-2B-Mediated l-Arginine Uptake and Nitric Oxide Biosynthesis in HCT116 Cell Line Through Biological Activity of 4′-Geranyloxyferulic Acid Extract from Quinoa Seeds. Int. J. Mol. Sci. 2019, 13, 3262.
- Bruyere, C.; Genovese, S.; Lallemand, B.; Ionescu-Motatu, A.; Curini, M.; Kiss, R.; Epifano, F. Growth inhibitory activities of oxyprenylated and non-prenylated naturally occurring phenylpropanoids in cancer cell lines. Bioorg. Med. Chem. Lett. 2011, 21, 4173–4178. [Google Scholar] [CrossRef] [PubMed]
- Patruno, A.; Fornasari, E.; Di Stefano, A.; Cerasa, L.S.; Marinelli, L.; Baldassarre, L.; Sozio, P.; Turkez, H.; Franceschelli, S.; Ferrone, A.; et al. Synthesis of a novel cyclic prodrug of S-allyl-glutathione able to attenuate LPS-induced ROS production through the inhibition of MAPK pathways in U937 cells. Mol. Pharm. 2015, 12, 66–74. [Google Scholar] [CrossRef]
- Patruno, A.; Pesce, M.; Marrone, A.; Speranza, L.; Grilli, A.; De Lutiis, M.A.; Felaco, M.; Reale, M. Activity of matrix metallo proteinases (MMPs) and the tissue inhibitor of MMP (TIMP)-1 in electromagnetic field-exposed THP-1 cells. J. Cell Physiol. 2012, 227, 2767–2774. [Google Scholar] [CrossRef]
- Patruno, A.; Franceschelli, S.; Pesce, M.; Maccallini, C.; Fantacuzzi, M.; Speranza, L.; Ferrone, A.; De Lutiis, M.A.; Ricciotti, E.; Amoroso, R.; et al. Novel aminobenzyl-acetamidine derivative modulate the differential regulation of NOSs in LPS induced inflammatory response: Role of PI3K/Akt pathway. Biochim. Biophys. Acta 2012, 1820, 2095–2104. [Google Scholar] [CrossRef]
- Grilli, A.; De Lutiis, M.A.; Patruno, A.; Speranza, L.; Cataldi, A.; Centurione, L.; Taccardi, A.A.; Di Napoli, P.; De Caterina, R.; Barbacane, R.; et al. Effect of chronic hypoxia on inducible nitric oxide synthase expression in rat myocardial tissue. Exp. Biol. Med. 2003, 228, 935–942. [Google Scholar] [CrossRef]
- Cacciatore, I.; Marinelli, L.; Di Stefano, A.; Di Marco, V.; Orlando, G.; Gabriele, M.; Gatta, D.M.P.; Ferrone, A.; Franceschelli, S.; Speranza, L.; et al. Chelating and antioxidant properties of l-Dopa containing tetrapeptide for the treatment of neurodegenerative diseases. Neuropeptides 2018, 71, 11–20. [Google Scholar] [CrossRef]
- Di Nisio, C.; Sancilio, S.; Di Giacomo, V.; Rapino, M.; Sancillo, L.; Genovesi, D.; Di Siena, A.; Rana, R.A.; Cataldi, A.; Di Pietro, R. Involvement of cyclic-nucleotide response element-binding family members in the radiation response of Ramos B lymphoma cells. Int. J. Oncol. 2016, 48, 28–36. [Google Scholar] [CrossRef] [Green Version]
- Campisi, J. Cellular senescence: Putting the paradoxes in perspective. Curr. Opin. Genet. Dev. 2011, 21, 107–112. [Google Scholar] [CrossRef] [Green Version]
- Miyamoto, S.; Epifano, F.; Curini, M.; Genovese, S.; Kim, M.; Ishigamori-Suzuki, R.; Yasui, Y.; Sugie, S.; Tanaka, T. A novel prodrug of 4′-geranyloxy-ferulic acid suppresses colitis-related colon carcinogenesis in mice. Nutr. Cancer 2008, 60, 675–684. [Google Scholar] [CrossRef] [PubMed]
- Genovese, S.; Epifano, F. Recent developments in the pharmacological properties of 4′-geranyloxyferulic acid, a colon cancer chemopreventive agent of natural origin. Curr. Drug Targets 2012, 13, 1083–1088. [Google Scholar] [CrossRef] [PubMed]
- Tanaka, T.; de Azevedo, M.B.; Durán, N.; Alderete, J.B.; Epifano, F.; Genovese, S.; Tanaka, M.; Tanaka, T.; Curini, M. Colorectal cancer chemoprevention by 2 beta-cyclodextrin inclusion compounds of auraptene and 4′-geranyloxyferulic acid. Int. J. Cancer 2010, 126, 830–840. [Google Scholar] [CrossRef] [PubMed]
- Taddeo, V.A.; Genovese, S.; Carlucci, G.; Ferrone, V.; Patruno, A.; Ferrone, A.; de Medina, P.; Fiorito, S.; Epifano, F. Quantitative profiling of 4′-geranyloxyferulic acid and its conjugate with l-nitroarginine methyl ester in mononuclear cells by high-performance liquid chromatography with fluorescence detection. J. Pharm. Biomed. Anal. 2017, 133, 49–55. [Google Scholar] [CrossRef] [PubMed]
- Krivennikov, S.I.; Greten, F.R.; Karin, M. Immunity, inflammation, and cancer. Cell 2010, 140, 883–899. [Google Scholar] [CrossRef] [PubMed] [Green Version]
- Chen, C.Y.; Kao, C.L.; Liu, C.M. The Cancer Prevention, Anti-Inflammatory and Anti-Oxidation of Bioactive Phytochemicals Targeting the TLR4 Signaling Pathway. Int. J. Mol. Sci. 2018, 19, 2729. [Google Scholar] [CrossRef] [Green Version]
- Zhang, R.; Qi, F.; Zhao, F.; Li, G.; Shao, S.; Zhang, X.; Yuan, L.; Feng, Y. Cancer-associated fibroblasts enhance tumor-associated macrophages enrichment and suppress NK cells function in colorectal cancer. Cell Death Dis. 2019, 10, 273. [Google Scholar] [CrossRef] [Green Version]
- Genovese, S.; Fiorito, S.; Taddeo, V.A.; Epifano, F.; Paciotti, R.; Coletti, C.; Franceschelli, S.; Speranza, L.; Ferrone, A.; Felaco, M.; et al. Effects of geranyloxycinnamic acids on COX-2 and iNOS functionalities in LPS-stimulated U937 mononuclear cells. Chem. Sel. 2016, 1, 5479–5486. [Google Scholar]
- Baker, D.J.; Alimirah, F.; van Deursen, J.M.; Campisi, J.; Hildesheim, J. Oncogenic senescence: A multi-functional perspective. Oncotarget 2017, 8, 27661–27672. [Google Scholar] [CrossRef] [Green Version]
- Cerella, C.; Grandjenette, C.; Dicato, M.; Diederich, M. Roles of Apoptosis and Cellular Senescence in Cancer and Aging. Curr. Drug Targets 2016, 17, 405–415. [Google Scholar] [CrossRef] [Green Version]
- Coppé, J.P.; Desprez, P.Y.; Krtolica, A.; Campisi, J. The senescence-associated secretory phenotype: The dark side of tumor suppression. Annu. Rev. Pathol. 2010, 5, 99–118. [Google Scholar] [CrossRef] [PubMed] [Green Version]
- Klein, T.; Bischoff, R. Physiology and pathophysiology of matrix metalloproteases. Amino Acids 2011, 41, 271–290. [Google Scholar] [CrossRef] [PubMed] [Green Version]
- Roy, R.; Yang, J.; Moses, M.A. Matrix metalloproteinases as novel biomarkers and potential therapeutic targets in human cancer. J. Clin. Oncol. 2009, 27, 5287–5297. [Google Scholar] [CrossRef] [PubMed] [Green Version]
- Turpeenniemi-Hujanen, T. Gelatinases (MMP-2 and -9) and their natural inhibitors as prognostic indicators in solid cancers. Biochimie 2005, 87, 287–297. [Google Scholar] [CrossRef] [PubMed]
- Yu, X.F.; Han, Z.C. Matrix metalloproteinases in bone marrow: Roles of gelatinases in physiological hematopoiesis and hematopoietic malignancies. Histol. Histopathol. 2006, 21, 519–531. [Google Scholar]
- Lee, W.J.; Shin, C.Y.; Yoo, B.K.; Ryu, J.R.; Choi, E.Y.; Cheong, J.H.; Ryu, J.H.; Ko, K.H. Induction of matrix metalloproteinase-9 (MMP-9) in lipopolysaccharidestimulated primary astrocytes is mediated by extracellular signal-regulated protein kinase 1/2 (Erk1/2). Glia 2003, 41, 15–24. [Google Scholar] [CrossRef]
- Underwood, D.C.; Osborn, R.R.; Bochnowicz, S.; Webb, E.F.; Rieman, D.J.; Lee, J.C.; Romanic, A.M.; Adams, J.L.; Hay, D.W.; Griswold, D.E. SB 239063, a p38 MAPK inhibitor, reduces neutrophilia, inflammatory cytokines, MMP-9, and fibrosis in lung. Am. J. Physiol. Lung Cell Mol. Physiol. 2000, 279, L895–L902. [Google Scholar] [CrossRef]


© 2020 by the authors. Licensee MDPI, Basel, Switzerland. This article is an open access article distributed under the terms and conditions of the Creative Commons Attribution (CC BY) license (http://creativecommons.org/licenses/by/4.0/).
Share and Cite
Franceschelli, S.; Gatta, D.M.P.; Ferrone, A.; Mezza, G.; Speranza, L.; Pesce, M.; Grilli, A.; Gallorini, M.; Giacomo, V.d.; Ghinassi, B.; et al. Anti-Migratory Effects of 4′-Geranyloxyferulic Acid on LPS-Stimulated U937 and HCT116 Cells via MMP-9 Down-Regulation: Involvement of ROS/ERK Signaling Pathway. Antioxidants 2020, 9, 470. https://doi.org/10.3390/antiox9060470
Franceschelli S, Gatta DMP, Ferrone A, Mezza G, Speranza L, Pesce M, Grilli A, Gallorini M, Giacomo Vd, Ghinassi B, et al. Anti-Migratory Effects of 4′-Geranyloxyferulic Acid on LPS-Stimulated U937 and HCT116 Cells via MMP-9 Down-Regulation: Involvement of ROS/ERK Signaling Pathway. Antioxidants. 2020; 9(6):470. https://doi.org/10.3390/antiox9060470
Chicago/Turabian StyleFranceschelli, Sara, Daniela Maria Pia Gatta, Alessio Ferrone, Giulia Mezza, Lorenza Speranza, Mirko Pesce, Alfredo Grilli, Marialucia Gallorini, Viviana di Giacomo, Barbara Ghinassi, and et al. 2020. "Anti-Migratory Effects of 4′-Geranyloxyferulic Acid on LPS-Stimulated U937 and HCT116 Cells via MMP-9 Down-Regulation: Involvement of ROS/ERK Signaling Pathway" Antioxidants 9, no. 6: 470. https://doi.org/10.3390/antiox9060470