

Abstract
Graphene that consists of less than 10 layers is expensive; moreover, it tends to agglomerate. These disadvantages restrict its utility. In this regard, the present study aimed to reduce the number of layers of a functionalized graphene (FG) with 10–30 layers to less than 10 layers by using an ultrasonic processor. We prepared nanocomposite films of polyvinyl alcohol (PVA) incorporated with FG by a simple hydrothermal method and ultrasonic dispersion. Oxygen transmission rate and water vapor permeability were considerably increased on account of modifying PVA with FG. Furthermore, the mechanical properties, thermostability, and barrier properties were improved. The barrier efficiency of the nanocomposites at different temperatures remained high for long periods of operation because of the network bonding. A simple procedure involving relatively low-cost nanomaterials could unlock the potential of nanocomposite FG/PVA films in the fields of coating, packaging, and semiconductor materials.
Export citation and abstract BibTeX RIS
1. Introduction
Traditional petroleum-based plastics have been widely used as packaging materials because of their low density, low cost, and favorable moldability [1, 2]. However, in line with considerations of sustainable ecosystem, an increasing number of people would rather prefer biodegradable packaging materials [3–6]. In that context, we examined enhanced nanocomposite polymer films that degrade at faster rates than the traditional petroleum-based plastic films [7–9].
Polyvinyl alcohol (PVA) is an ethynyl polymer (i.e. an acetylene-based polymer). PVA exhibits the following characteristics: properties between those of plastics and rubber, excellent film-forming and adhesion tendencies, high chemical polarity and solubility in water, ability to biodegrade, and a nontoxic nature. It also has outstanding chemical resistance, mechanical strength, and physical properties. In fields such as fuel cell [10], drug delivery [11], paper lamination [12], and textile spinning and weaving [13], PVA covers a wide range of industrial applications, and it has better advantages as a packaging material than PET [14, 15], PP [16, 17], PE [18–21], and other base materials. Accordingly, the aforementioned merits qualify PVA to be an ideal choice as a polymer matrix for the present work. However, pure PVA films lack sufficient strength to withstand the demands of packaging materials. They should have robust mechanical properties and long shelf-life. Hence, measures must be taken to overcome such shortcomings and to keep abreast of the emerging developments of materials in the market.
To modify composite materials, nanomaterials have been added to polymer matrices, an approach that has found a niche in research [22–25]. Peng et al [26]. reported that nano-ZnO and nano-SiO2 could effectively improve the mechanical strength, moisture and oxygen barrier properties, and hydrophobicity of composite films. Thomas et al [27]. discovered that incorporating or embedding cupric nanoparticles into PVA enhanced the mechanical properties, tensile strength, and Young's modulus of the nanocomposite relative to pure PVA. Zahid et al [28]. found that PVA nanocomposites with carbon nanoparticles have good dispersibility and better mechanical, thermal, optical and flame retardant properties than PVA.
Since 1985, carbon nanomaterials [29–34], such as fullerenes, carbon fibers, carbon nanotubes, and graphene, have attracted intense attention worldwide because they have remarkable thermal, electrical, and mechanical properties—particularly graphene because of its repeating hexagonal honeycomb cell lattice structure. Graphene oxidizes at a temperature as high as 400 °C. It has exceptional mechanical properties and thermal conductivity, superhigh specific surface area, and outstanding barrier properties [35]. There are a number of studies on the preparation of composites from graphene and PVA [36–38]. But the graphene mentioned in the studies on improving the mechanical properties of PVA is mostly in the form of graphene oxide (GO), and not the real graphene, because graphene is incompatible with PVA; it is difficult to disperse graphene in the substrate. However, GO is expensive and not suitable for mass production.
In the present work, a functionalized graphene (FG)—graphene with carboxyl groups—was used to strengthen PVA. The reaction between −COOH in FG and −OH in PVA generated ester chemical bonds that tightened internal linkages in the nanocomposite material. Graphene commonly has less than 10 layers, but graphene with even fewer layers than usual is extremely expensive and prone to agglomeration. Hence, to prevent aggregation in the PVA matrix, FG with 10–30 layers was considered. First, FG was dispersed in water with the help of an ultrasonic processor, which also stripped FG into fewer layers. Then, hydrothermal blending was used to prepare nanocomposites of PVA with different amounts of the stripped FG. The obtained nanocomposites were subjected to ultrasonic processing to ensure that there was no FG aggregation, during which PVA was also intercalated into FG.
We investigated the effect of FG on the properties of nanocomposite PVA films, including morphology, tensile strength, elongation at break, oxygen barrier properties, and water vapor permeability. These PVA films would provide environment-friendly materials for food packaging, coating, semiconductor industries, and other applications.
2. Experimental section
2.1. Materials
All chemical reagents used in the present study were of analytical grade and required no further purification. PVA (1788 type) was purchased from Shanghai Titan Scientific Co., Ltd (Shanghai, China). A specially customized grade of FG with carboxyl groups was provided by Apex Nano, Ltd (New Taipei City, Taiwan). The number of graphene layers ranged from 10 to 30.
2.2. Preparation of films
2.2.1. Preparation of pure PVA films.
To prepare an aqueous PVA solution, 19 g PVA was added to distilled water, and the total amount of solution was brought to 100 g. The solution was vigorously agitated and heated on a magnetic stirrer–heater at 80 °C for 2 h until the PVA was completely dissolved. The PVA solution was kept sealed and set aside for a day. Afterward, the prepared PVA solution was spread evenly on a clean glass plate by using a scraper with a blade thickness of 0.8 mm (a method known as solution casting). The glass plate was placed in an oven to dry the cast film at 55 °C for 2 h and then at 100 °C for 1 h, and the film was peeled off the plate. Ultimately, the film was tested for its performance and properties.
2.2.2. Preparation of nanocomposite FG/PVA films.
Nanocomposite FG/PVA films were prepared as follows. First, 19 g PVA (1788 type) was dissolved in enough amount of distilled water to make a solution weighing 80 g in total amount. Afterward, varying small amounts of custom-made FG (percentage mass ratio of FG to PVA: 0.25, 0.5%, 1, 2, 4%) were added to the aqueous solution of PVA. Prior to the addition of FG to the PVA solution, FG was first dispersed in a little amount of distilled water by using an ultrasonic processor for 10 min. The resulting mixture was stirred well with a glass rod, while adding more distilled water until the total amount of the solution reached 100 g. This final mixture was subjected to ultrasonic processing for 15 min, and then placed on a magnetic stirrer–heater for 2 h. A small amount of an antifoaming agent was added to the mixture, after which it was stirred well with a glass rod. The FG/PVA mixture remained sealed and was allowed to stand for a day. Subsequently, the mixture was cast or coated evenly on a clean glass plate by using a film applicator having a gap or thickness of 0.8 mm. Immediately after the casting, the glass plate was placed in an oven to dry the cast film at 55 °C for 2 h, and then at 100 °C for 1 h. Ultimately, the film was removed and subjected to performance testing, as well as characterized in terms of its properties. Scheme 1 diagrams the process of preparing FG/PVA nanocomposites.
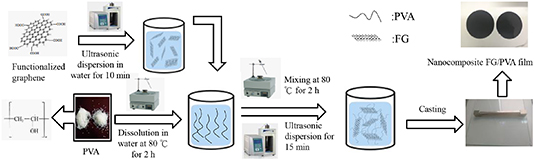
Scheme 1. Preparation of FG/PVA nanocomposites.
Download figure:
Standard image High-resolution image2.3. Characterization of functionalized graphene
2.3.1. Surface chemical structure.
The surface chemical structure was characterized using Fourier transform infrared (FTIR) spectroscopy. FTIR was used to validate the functionalization of graphene with −COOH. The test wavelength ranged from 4000 to 800 cm−1.
2.3.2. Characteristic peaks.
The characteristic peaks of FG were measured by Raman spectroscopy (Thermo DXR, Thermo Fisher Company, USA). According to the change in conjugated electrons reflected by the comparison between the intensities of D and G peaks, the difference in the graphene layers in the two cases of dispersion and non-dispersion was determined [39–41]. The test parameters were as follows: excitation wavelength, 532 nm; power, 10 mW; slit width, 50 μm; optical grating, 900 μm−1; pore diameter, 900 μm, collection time, 6 s; preview time, 6 s; frequency of exposure, 10 times; test wavelength range, 800–3300 cm−1; electric current, 40 mA; scanning rate, 5° min−1.
2.4. Evaluation of nanocomposite film properties
2.4.1. Tensile strength.
An electronic universal testing machine (FBS-10KNW, Forbes Testing Equipment Co., Ltd, Xiamen, China) was used to measure the tensile properties under the film tensile test mode. Tensile strength was the ratio of the maximum load P to the sample cross-sectional area. The tensile load, expressed as δt, was applied along the axial direction of a standard sample at a specified test temperature and humidity. Its calculation formula was as follows:

where  was the tensile strength in MPa; P was the maximum tensile force in N, at which the sample broke; and
  referred to the cross-sectional area (mm2) of the test sample. Elongation at break (
 ) was the relative elongation when the sample broke. It was calculated using the following formula:
where G was the distance (mm) between sample markings and F was the distance (mm) between the markings when the sample broke. The test parameter settings were as follows: sample size, 50 mm × 2 mm; sensor range, 1000 N; set pulling speed, 20 mm min−1.
2.4.2. Surface chemical structure.
FTIR (Nicolet 6700, Thermo Scientific, USA) was used to characterize the spectral characteristics of the nanocomposite FG/PVA films. In FTIR, molecules can selectively absorb some wavelengths of infrared rays, which leads to the transformation of vibrational and rotational energy levels in molecules. The spectra of materials can be obtained by detecting the infrared absorption. It is also known as the molecular vibrational spectrum. The tested wavelength ranged from 800 to 4000 cm−1. Before the test, samples of the nanocomposite films were cut into pieces and kept clean.
2.4.3. Morphology.
Scanning electron microscopy (SEM) and transmission electron microscopy (TEM) were used to understand the morphology of tensile-fractured samples. SEM is an excellent technique for obtaining morphological information by electron beam scanning of the surface of films. It can generate high-resolution 3D surface images, which give description of the sample surface structure. SEM images depicted clearly the morphology of nanocomposite FG/PVA films and the distribution of graphene in them. The films were cut into samples having a size of 1 cm × 1 cm, and they were sprayed with gold. Then, the sample morphology was characterized using SEM (S-4800, Hitachi Company, Japan). The section morphology of pure PVA and nanocomposite FG/PVA films was analyzed. The test parameter settings were as follows: time of gold spraying on sample, 30 s; operating current, 5 mA; scanning or accelerating voltage, 3 kV.
Tecnai G2 F20 TEM (FEI Company, Boston, MA, USA) was also used to observe the morphology of nanocomposite FG/PVA films. Samples of stripped FG/PVA films were added to water. An ultrasonic processor was used to achieve a uniform dispersion. Afterward, a drop of the dispersed sample was placed on a copper grid for testing. The test parameters were as follows: accelerating voltage, 200 kV; point resolution, 0.24 nm; information resolution, 0.14 nm; electron gun energy resolution ⩽0.7 eV.
2.4.4. Phase structure and crystallinity.
X-ray diffraction (XRD) is a crucial tool for generating material phase analysis and crystallinity information. The XRD patterns of PVA and nanocomposite FG/PVA films were obtained using a Bruker/D2 PHASER apparatus (Cu Kαλ = 1.5405 Å) from Germany. The operating parameters were as follows: working voltage, 40 kV; working current, 30 mA; scanning area, step size of 10°–90° at a rate of 0.02° s−1.
2.4.5. Composition and thermal stability.
Thermogravimetric (TG) analysis is a method used to study the composition and thermal stability of materials. The results were obtained by measuring the change in the sample mass and temperature. After the data were gathered, differential TG (DTG) curves were analyzed to evaluate the degree of variation in the sample mass and, in the case of temperature rise, the weight loss rate. TG curves were obtained using a thermal analyzer (STA 409PC, Netzsch Company, Germany), operated under nitrogen flow.
The film samples were heated from 25 °C to 600 °C at a heating rate of 10 °C min−1. Origin software was used to obtain test data on DTG curves, which were descriptive of a first-order differential curve of TG analysis.
2.4.6. Degree of polymerization and crystallization temperature.
Differential scanning calorimetry (DSC, model DSC200 F3, Netzsch, Germany) is a method for determining the degree of polymerization according to the thermal effects of polymer melting processes. Samples and reference materials were separately placed in two crucibles and heated at the same rate. A temperature difference (ΔT) between the sample and the reference material was produced when the sample was subjected to processes such as melting, crystallization, and oxidation. A ΔT approaching zero referred to a proportional relationship between the difference in temperature and thermal power of the sample and the reference material. Parameters, such as T crystallization, T oxidation, T melting, and T decomposition, were evaluated.
where Xc was crystallinity;  and
and  were the melting enthalpy of the tested sample and that of a sample with 100% crystallinity, respectively.
  was calculated from the area of the melting peak in the DSC images. The theoretical enthalpy of PVA with 100% crystallinity was 161 J g−1.
During the test, the temperature was raised from 25 °C to 220 °C at a heating rate of 10 °C min−1. After 10 min of constant temperature, the sample temperature was lowered to room temperature at a rate of 10 °C min−1. The sample was heated again to 220 °C at a rate of 10 °C min−1. Then, the crystallization temperature of the sample was measured.
2.4.7. Oxygen barrier properties.
The oxygen transmission through nanocomposite FG/PVA films was measured using an oxygen permeability tester (VAC-V2, LabThink Co., Ltd, Jinan, China), operated under a standard mode. The amount of oxygen permeation referred to the volume of oxygen per unit area of materials (such as plastic film, aluminum foil, and magnesium-coated vacuum film) per unit time at a constant temperature and a unit pressure difference. It was expressed as volume at standard temperature and pressure, and its unit was cm3 m−2 · d · Pa.
Test parameter settings were as follows: temperature of the test chamber was set to 25 °C; relative humidity was 55%; gas pressure of the upper chamber was 1.01 kgf cm−2; degassing time of the lower chamber was 60 s; total degassing time of upper and lower chambers was 2 h; films 0.8–1.0 mm in thickness were tested under the flow of oxygen and nitrogen.
2.4.8. Water vapor barrier properties.
The water vapor permeability of the nanocomposite films was measured in standard mode by using a water vapor transmission test system (W3/030, LabThink Co., Ltd, Jinan, China). Its equipment software calculated the permeability. Two parameters described the rate of passage of water vapor across the films—amount of water vapor transmission and water vapor transmission coefficient. These two indicated some differences, but both of them could be used to express the capacity of water vapor to pass through a certain material. The amount of water vapor transmission pertained to the weight of the water vapor permeating through the material at a certain temperature and humidity for some time. Whereas, the water vapor transmission coefficient was the standard value of the water vapor transmission amount converted by a factor with a corresponding standard unit; it is used for comparing different test results against the standard values. Water vapor transmission was expressed in g m−2 d−1.
During the test, the working temperature in the test chamber was 25 °C, the thickness of the nanocomposite film was 0.8–1.0 mm, the humidity was 90%, and the time interval for each test was 30 min.
2.4.9. Electrical conductivity.
Graphene has excellent electrical conductivity [42]. The conductivity of nanocomposite FG/PVA films were characterized through resistivity tests involving four-probe circular discs (RTS-8, Four Probes Technology Co., Ltd, Guangzhou, China).
During the test, the diameter and thickness of prepared films were 5 cm and 0.8–1.0 mm, respectively. For each sample, five different points or sets of data were tested, and the average value of the results was taken. The maximum range of the instrument current was 10 μA.
3. Results and discussion
3.1. Analysis of functionalized graphene properties
3.1.1. Surface chemical structure.
Figure 1 represents the FTIR results of FG. In the infrared spectrum, absorption at a wavelength range of 3160–3550 cm−1 referred to the characteristic peak of hydroxyl stretching vibration [43, 44]. The peak at 1758 cm−1 was attributed to the stretching vibration peak of C = O in the carboxyl groups [45]. These spectral data lend confirmation to the presence of carboxylic acid groups in FG.
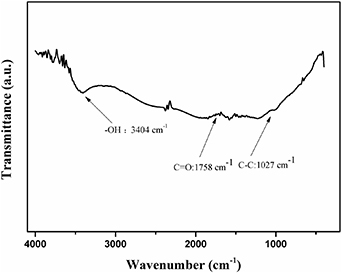
Figure 1. FTIR spectrum of functionala;ptized graphene.
Download figure:
Standard image High-resolution image3.1.2. Number of graphene layers.
Figure 2 compares the Raman spectral results of dispersed and undispersed FG. According to the spectra, G-band was indicated to be the main characteristic peak, relating to the in-plane vibration of sp2 carbon atoms. D-band, associated with the disordered structure, corresponded to the lattice vibration.
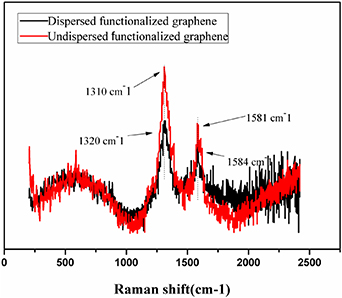
Figure 2. Raman spectra of dispersed and undispersed functionalized graphene.
Download figure:
Standard image High-resolution imageIn the curve of undispersed FG, salient features related to the Raman spectra included D-band and G-band at peaks of 1319 and 1581 cm−1, respectively. However, in the Raman spectrum of dispersed FG (an ultrasonic processor was used for the dispersion), D-band and G-band shifted to 1320 and 1584 cm−1, respectively. The undispersed FG exhibited a sharper G-band, signifying that it had more layers [46, 47].
As depicted in figure 2, the intensity of G-band in dispersed FG was weaker than that in undispersed FG. We can infer that the fewer layers (5–15) of dispersed FG was brought about by partial exfoliation in high-frequency oscillation or ultrasonic processing. Graphene with fewer layers had larger specific surface area and higher reaction efficiency. In the present experiment, FG dispersed in water was ultrasonicated to decrease the number of graphene layers. When the dispersed FG was mixed with PVA, the number of layers of FG could be reduced further by also applying an ultrasonic vibration; more so, the molecular chains of PVA could even be intercalated into FG [48] (figure 3).
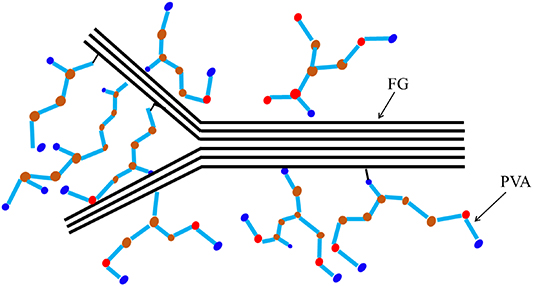
Figure 3. Schematic of intercalated functionalized graphene in polyvinyl alcohol.
Download figure:
Standard image High-resolution image3.2. Analysis of nanocomposite film properties
3.2.1. Mechanical properties.
Table 1 lists the mechanical properties of PVA and nanocomposite FG/PVA films. Figure 4 plots data on tensile strength (figure 4(a)) and elongation at break (figure 4(b)) as a function of the different amounts of FG. The tensile strength of pure PVA was 26.33 MPa. When 0.25% FG was added to PVA, the tensile strength increased to 31.67 MPa. When the amount of FG was increased to 2%, the tensile strength of the nanocomposite film continued to increase and showed a peak at 47 MPa. However, the addition of further amount of FG up to 4% caused the tensile strength to decrease to 27 MPa, which may be considered similar to the tensile strength of pure PVA (26.33 MPa).
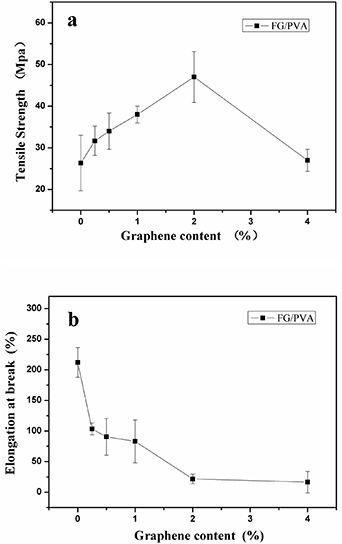
Figure 4. PVA and nanocomposite FG/PVA films: (a) tensile strength; (b) elongation at break.
Download figure:
Standard image High-resolution imageTable 1. Mechanical properties of PVA and nanocomposite FG/PVA films.
| Sample | Tensile strength (MPa) | Yield strength (MPa) | Elongation at break (%) |
|---|---|---|---|
| PVA | 26.33 | 13.33 | 212.03 |
| 0.25%FG/PVA | 31.67 | 19.33 | 107.14 |
| 0.5%FG/PVA | 34 | 20.33 | 90.47 |
| 1%FG/PVA | 38 | 20.67 | 83.06 |
| 2%FG/PVA | 47 | 38.67 | 27.71 |
| 4%FG/PVA | 27 | 16.33 | 16.37 |
The elongation at break of nanocomposite films indicated a downward trend as more FG was added to PVA (figure 4(b)). From 0% FG (pure PVA) to 0.25% FG, the elongation at break decreased from 212.03 to 104.14%. At 2% FG, the elongation at break continued to decrease to 27.71%. A minimum elongation at break of 16.3% was attained at 4% FG.
In a nutshell, the optimal amount of FG was 2%, as the nanocomposite FG/PVA film exhibited the best tensile properties. The mechanical properties had a very good trend up to 2% FG (filler loading), and this is because the filler was well dispersed in the PVA matrix. A further increase in the FG amount resulted in agglomeration that led to a difficult dispersion of FG and, in turn, affected the mechanical properties. This explanation agrees well with the results by Xin et al [49].
3.2.2. Surface chemical structure.
Figure 5 depicts the infrared spectra of three samples. In the spectrum of FG, the peak at wavelength of 3404 cm−1 denoted the characteristic absorption of hydroxyl stretching vibration, which was caused by the O−H stretching frequency of PVA and water. The absorption near 1027 cm−1 was C−C peak, and that at 1758 cm−1 was the peak of C = O present in −COOH [50].
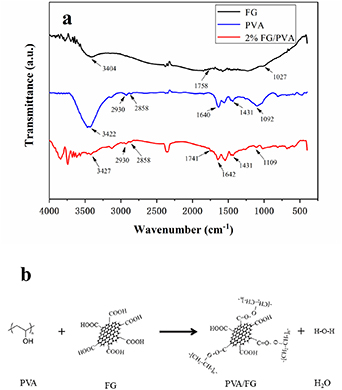
Figure 5. (a) FTIR spectra of FG, PVA film, and nanocomposite 2%FG/PVA film; (b) esterification reaction between PVA and FG, producing FG/PVA nanocomposite film.
Download figure:
Standard image High-resolution imageIn the infrared spectrum of pure PVA film, the characteristic absorption peak at wavelength of 3422 cm−1 pertained to the hydroxyl stretching vibration. The peaks near 2858 and 2930 cm−1 were due to the vibration of −CH2. The infrared absorption peaks at wavenumbers 1640 and 1092 cm−1 corresponded to the −OH bending vibration peak and C−O−C vibration peak, respectively. The peak near 1431 cm−1 signified the tensile vibration peak of C−OH.
The spectrum of 2%FG/PVA indicated shifts in absorption peaks as follows: from 3422, 1640, and 1092 cm−1 to 3427, 1642, and 1109 cm−1, respectively. These shifts were ascribed to the effect of hydrogen bonding between PVA and FG. The absorption peak near 1741 cm−1 referred to the vibration peak of C = O in ester linkage, which was generated from the reaction between −COOH in FG and −OH in PVA. Figure 5(b) shows the esterification reaction between FG and PVA molecules, leading to the production of nanocomposite FG/PVA films. The foregoing data are consistent with those reported by Morimune et al [51].
3.2.3. Morphology.
Figure 6 illustrates the SEM images of fractured pure PVA and nanocomposite FG/PVA films. Unlike the nanocomposite films, pure PVA (figure 6(a)) was flat and smooth. For the case of the nanocomposite 0.25%FG/PVA film (figure 6(b)), as only a small amount of FG was added, FG completely dispersed in the PVA matrix. We observed a few lamellar structures for the case of adding 0.5% and 1% FG (figures 6(c), (d)). The stretched section of the nanocomposite 2%FG/PVA film (figure 6(e)) exhibited a relatively uniform layered structure, where white convex portions appeared, as a result of fracturing the film by applying an external tensile force [52]. This result indicated the apparent compatibility between FG and PVA in greater proportion, and the two were bound together by hydrogen bonding and ester linkage [53]. Therefore, the tensile properties improved. However, when the FG content reached 4% (figure 6(f)), the agglomeration of FG was evident at the film tensile section, which affected the combination of PVA and FG; thus, the tensile properties decreased.
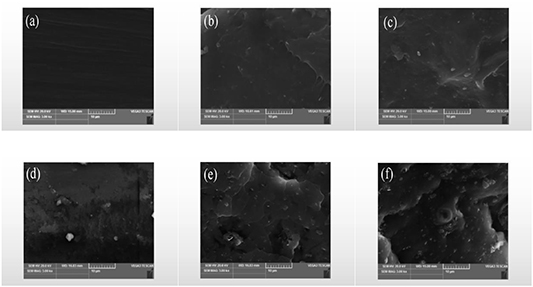
Figure 6. SEM morphology of fractured films: (a) PVA; (b) 0.25%FG/PVA; (c) 0.5%FG/PVA; (d) 1%FG/PVA; (e) 2%FG/PVA; (f) 4%FG/PVA.
Download figure:
Standard image High-resolution imageTo delineate more clearly the morphology, we also captured TEM images (figure 7) of undispersed and dispersed FG, as well as those of nanocomposite FG/PVA films. Figure 7(a) reveals that the number of layers in undispersed FG was roughly 30. As a result of dispersing FG using an ultrasonic processor, the number of layers was reduced to approximately 10 (figure 7(a')). FG was uniformly dispersed in the PVA matrix for the case of adding 1% (figures 7(b), (b')) and 2% (figures 7(c), (c')) FG to PVA (figures 7(b), (b')). Moreover, we deduced that the FG was split, which was likely caused by the intercalation of PVA molecular chains into the graphene sheets; hence, the number of layers was cut down to 4–6. However, FG dispersed unevenly in the PVA matrix when the FG content was 4% (figures 7(d)–(d')). A lot of thick sheets were evident in figure 7(d'), and the number of layers in FG accrued to more than 10 because of the self-agglomeration of FG in the nanocomposite.

Figure 7. TEM morphology: (a) undispersed FG; (a') dispersed FG; (b), (b') 1%FG/PVA; (c), (c') 2%FG/PVA; (d), (d') 4%FG/PVA.
Download figure:
Standard image High-resolution image3.2.4. Crystallinity.
The structure of pure PVA and nanocomposite FG/PVA films was characterized using XRD. Figure 8 presents the XRD patterns, where distinct diffraction peaks were evident at 2θ = 19.19° and 19.49°. Pure PVA exhibited a diffraction peak at 2θ = 19.19° [54–57]. Adding FG to PVA caused the peak to shift to the right. When the FG content was 2%, the main peak for the nanocomposite film shifted to the right, where 2θ = 19.49°. This shift may be due to some slight changes in the crystal. For the cases of 2% and 4% FG, a small diffraction peak also appeared at 2θ = 26.16°. FG dispersed well in the PVA matrix when the content of FG was 2%. But when the FG content was increased further from 2% to 4%, the excessive FG tended to agglomerate, and this condition was distinct in the nanocomposite film (figure 7(h)); thus, the intensity at 2θ = 26.16° was stronger.
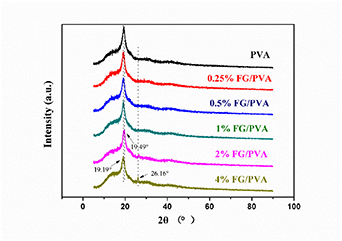
Figure 8. XRD patterns of PVA and nanocomposite FG/PVA films.
Download figure:
Standard image High-resolution image3.2.5. Thermal stability.
The thermal stability of pure PVA and nanocomposite films was characterized through TG analysis. Figure 9(a) presents the TG results, whereas figure 9(b) indicates DTG data. Relative to the thermal stability of pure PVA, the thermal stability of nanocomposite FG/PVA films decreased with increasing temperature (figure 9(a) and table 2). Pure PVA reached 5% weight loss at 77.49 °C. The nanocomposite FG/PVA films attained 5% weight loss at 83.4, 109.94, 118.94, 126.44 and 137.44 °C when the content of FG added to PVA was 0.25, 0.5, 1, 2, and 4%, respectively. The trend of temperatures at 10% weight loss for all nanocomposite films was consistent with that at 5% weight loss. The reaction between −OH in PVA and −COOH in FG contributed to the facility of heat transfer for the nanocomposite film. The reaction heat and pyrolysis products enhanced the thermal decomposition of the PVA matrix. This effect explains the occurrence of more effective thermal decomposition of nanocomposite FG/PVA films during the fusion process. Moreover, reactive groups, such as −COOH and −OH, caused PVA to decompose at a faster rate. However, when 2 and 4% FG were added to the PVA matrix, the nanocomposite FG/PVA films developed resistance that decelerated heat and diffusion of pyrolysis products and, thus, inhibited the thermal decomposition of PVA. Hence, when PVA was overloaded with FG (more than 2%), the thermal stability of nanocomposite FG/PVA films was enhanced. [58, 59]
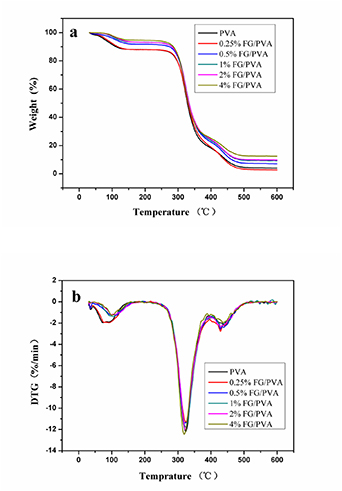
Figure 9. PVA and nanocomposite FG/PVA films: (a)TG curves; (b) DTG curves.
Download figure:
Standard image High-resolution imageTable 2. Thermogravimetric analysis of PVA and nanocomposite FG/PVA films.
| Sample | Temperature at 5% weight loss (°C) | Temperature at 10% weight loss (°C) | Td from DTG (°C) | Residue at 600 °C (%) |
|---|---|---|---|---|
| PVA | 77.49 | 110.49 | 323.2 | 4.01 |
| 0.25%FG/PVA | 83.4 | 116.9 | 325.5 | 2.73 |
| 0.5%FG/PVA | 109.94 | 273.44 | 324.6 | 7.07 |
| 1%FG/PVA | 118.49 | 281.94 | 325.4 | 9.28 |
| 2%FG/PVA | 126.44 | 281.44 | 321.7 | 9.74 |
| 4%FG/PVA | 137.44 | 286.44 | 318.7 | 12.48 |
3.2.6. Thermal properties.
We analyzed the glass transition temperature (Tg), melting temperature, crystallization temperature, and crystallinity of PVA and nanocomposite FG/PVA films through DSC. Figure 10 and tables 3–5 present the results. The first heating curves (figure 10(a)) took unusual shapes because of the different previous thermal histories of the samples. Therefore, the samples were subjected to a second heating test. In the second heating curve, when the FG content increased from 0 to 2%, Tg increased from 74.5 to a maximum value of 75.2 °C. Then, Tg decreased to 74.9 °C when the FG content was further increased to 4%. Clearly, Tg of nanocomposite FG/PVA films gradually increased as a result of introducing moderate amounts of FG. Two reasons accounted for the increment in Tg. First, the nanocomposites had an effect on the mobility of PVA chains. Second, carboxyl groups in FG had a strong interfacial interaction with hydroxyl groups in PVA. The freedom of PVA chains movement would be restricted because of the interaction between FG and the PVA matrix. Nevertheless, an excessive amount of FG caused agglomeration, resulting in the difficult dispersion of FG, which caused Tg of the nanocomposite FG/PVA film to decrease.

Figure 10. PVA and nanocomposite FG/PVA films: (a) first heating curve; (b) first cooling curve; (c) second heating curve.
Download figure:
Standard image High-resolution imageTable 3. First heating for PVA and nanocomposite FG/PVA films.
| Sample | Melting temperature (°C) | Melting enthalpy (J g−1) | Crystallinity (%) |
|---|---|---|---|
| PVA | 189.4 | 28.77 | 18.44 |
| 0.25%FG/PVA | 190.3 | 27.25 | 17.46 |
| 0.5%FG/PVA | 191.8 | 27.03 | 17.3 |
| 1%FG/PVA | 188.7 | 22.33 | 14.32 |
| 2%FG/PVA | 189.7 | 17.27 | 12.24 |
| 4%FG/PVA | 188.2 | 25.09 | 16.07 |
Table 4. First cooling for PVA and nanocomposite FG/PVA films.
| Sample | Crystallization temperature (°C) | Melting enthalpy (J g−1) |
|---|---|---|
| PVA | 107.2 | 5.675 |
| 0.25%FG/PVA | 109.9 | 4.922 |
| 0.5%FG/PVA | 111.1 | 5.203 |
| 1%FG/PVA | 112 | 4.771 |
| 2%FG/PVA | 114.4 | 6.819 |
| 4%FG/PVA | 112.1 | 3.174 |
Table 5. Second heating for PVA and nanocomposite FG/PVA films.
| Sample | Melting temperature (°C) | Melting enthalpy (J g−1) | Crystallinity (%) | Tg (°C) |
|---|---|---|---|---|
| PVA | 157.1 | 15.49 | 9.91 | 71.6 |
| 0.25%FG/PVA | 156.3 | 16.36 | 10.53 | 71.8 |
| 0.5%FG/PVA | 157.7 | 16.13 | 10.33 | 71.9 |
| 1%FG/PVA | 157.5 | 17.22 | 11.06 | 71.8 |
| 2%FG/PVA | 161.1 | 17.62 | 11.34 | 71.8 |
| 4%FG/PVA | 157.5 | 16.62 | 10.64 | 71.8 |
In the first heating process, as the content of FG increased from 0 to 2%, the crystallization temperature of the nanocomposite film rose sharply from 107.2 °C to 114.4 °C. This result may be due to the heterogeneous nucleation of uniformly dispersed FG, which facilitated the nucleation and crystallization of the nanocomposite film during the cooling process. However, the melting temperature increased from 157.1 °C to 161.1 °C (FG content increased from 0 to 2%), and it began to decrease after reaching the highest temperature (FG content was 2%–4%) in the second heating process. This result may be due to the introduction of FG, strengthening the PVA matrix, which caused the nanocomposite films to melt with more difficulty at high temperatures during the heating process. An excessive amount of FG (4%) gave rise to troublesome dispersion of FG in PVA, as evidenced by the aggregation that led to incomplete crystallization [60].
The DSC curves of polymer materials are often affected by complex factors, and their crystallinity is closely related to the thermal history during the cooling process. From figure 10, it can be observed that the shapes of the curves in the first and second heating were significantly different. Therefore, the results of the analysis are generally determined by the second temperature rise. Table 5 shows that the second heating data, in terms of crystallinity of the nanocomposite films, indicated a slight increasing trend with the increase in FG (the highest value was reached when FG was 2%); then, the value decreased when FG was 4%. As described in the previous section, the heterogeneous nucleation of FG in PVA increased the crystallization temperature and made PVA crystals more complete [61–64]. Because the crystallinity did not change much, the peak intensities in the XRD curves for all nanocomposite films were almost the same.
3.2.7. Oxygen barrier properties.
Figure 11 graphs the results of tests on oxygen transmittance of PVA and nanocomposite FG/PVA films. We observed that the oxygen transmittance in pure PVA film was 8.81 cm3 m−2.d.Pa. The oxygen transmittance in the nanocomposite film (0.25% FG) was lower (8.75 cm3 m−2.d.Pa). With increasing amounts of FG, the trend in oxygen transmittance was decreasing. In particular, the oxygen transmittance decreased sharply to 1.28 cm3 m−2.d.Pa when the percentage mass ratio of FG to PVA was 2%. We inferred that the addition of FG was beneficial to enhance the oxygen barrier properties of nanocomposite FG/PVA films because of the overlapping graphene sheets, forming a network structure. The reaction between the −COOH in FG and the −OH in PVA would generate an ester linkage that bound together the components of nanocomposite films. Oxygen had difficulty penetrating the nanocomposite FG/PVA film consisting of tortuous paths. Therefore, the oxygen transmittance in the film considerably decreased [65–71]. In other words, the oxygen barrier properties were clearly enhanced because of the appropriate addition of FG.

Figure 11. Oxygen barrier properties of PVA and nanocomposite FG/PVA films.
Download figure:
Standard image High-resolution imageAs shown in figure 12, the dispersity of graphene had a direct effect on the oxygen barrier properties of the nanocomposite FG/PVA film. When the FG content was 4%, the oxygen transmittance in the film increased, because an excess of FG easily led to its agglomeration and difficult dispersion in the process of preparing and forming the film. In addition, the oxygen barrier properties in the nanocomposite FG/PVA film were influenced by the weaker links in the nanocomposite.
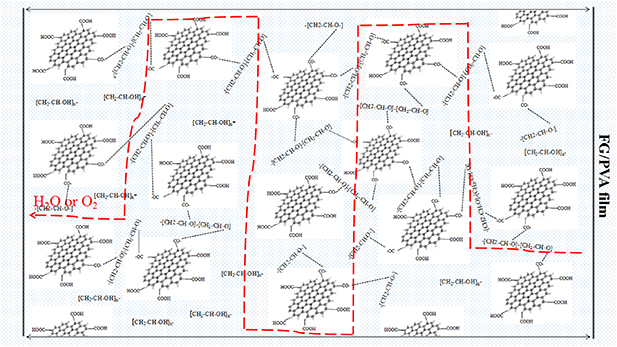
Figure 12. Schematic of water and oxygen permeability in nanocomposite FG/PVA film.
Download figure:
Standard image High-resolution image3.2.8. Water vapor barrier properties.
Figure 13 indicates the results of tests on water vapor barrier properties of PVA and nanocomposite FG/PVA films. The water vapor permeability in pure PVA film reached up to 510.04 g m−2 d−1 because of the existence of a lot of hydrophilic −OH groups in the molecular chains of PVA. The water vapor permeability in the nanocomposite FG/PVA film (0.25% FG) was lower (447.74 g m−2 d−1). Notably, the water vapor permeability in nanocomposite films dropped quickly to 254.13 g m−2 d−1 when the content of FG was 2%. Therefore, we inferred that the water vapor barrier properties of nanocomposite films were enhanced by the introduction of FG because of the wide network structure that originated from the overlapping graphene sheets. The reaction between the −COOH in FG and the −OH in PVA would generate an ester linkage, tightening the bonds in the nanocomposites. However, the water vapor permeability in the nanocomposite FG/PVA film increased when the content of FG reached to 4%. An excessive amount of FG easily led to agglomeration, so FG dispersed poorly during the preparation and formation of films. In addition, the oxygen barrier properties of nanocomposite FG/PVA films were affected by the ineffective interaction between FG and PVA [72–75].

Figure 13. Water vapor barrier properties of PVA and nanocomposite FG/PVA films.
Download figure:
Standard image High-resolution imageThe results of water vapor permeability in pure PVA and nanocomposite FG/PVA films at different temperatures are given in figures 14(a) and (b). We observed that the water vapor permeability in pure PVA film at 25, 30, 35, 40, and 45 °C was 445.76, 626.3, 797.84, 1055.49, and 1222.46 g m−2 d−1, respectively. The corresponding water vapor permeability in the case of 2%FG/PVA decreased to 281.7, 347.29, 434.14, 533.8, and 661.39 g m−2 d−1. These results exhibited that the water vapor barrier efficiency of the two films worsened with increasing operating temperatures [76, 77]. This trend may be due to the easier mobility of molecular chains at high temperatures, making the polymer structure less compact, so water vapor penetrated more easily. On the other hand, the water vapor barrier properties of the nanocomposite 2%FG/PVA film were slightly enhanced with time, showing that the nanocomposite was stable for a long time and had excellent water vapor barrier performance.

Figure 14. Water vapor barrier properties: (a) pure PVA film at different temperatures; (b) nanocomposite 2%FG/PVA film at different temperatures; (c) comparison between PVA and nanocomposite 2%FG/PVA film.
Download figure:
Standard image High-resolution imageFigure 14(c) compares the water vapor barrier properties of pure PVA and the nanocomposite 2%FG/PVA film at various temperatures. It indicates that the barrier properties of the 2%FG/PVA film were much more effective than those of pure PVA at various temperatures, and the nanocomposite film could maintain excellent performance at different temperatures.
3.2.9. Electrical conductivity.
Figure 15 describes the effect of the FG content on the electrical conductivity of nanocomposite FG/PVA films. The conductivity increased linearly with the FG content [78, 79]. The conductivity of pure PVA film was 8.26E−04 s cm−1, whereas that of the nanocomposite film (0.25% FG) was higher at 9.66E−04 s cm−1. As the content of FG increased further to 4%, the conductivity of the nanocomposite FG/PVA film reached to 1.44E − 03 s cm−1. In conclusion, the conductivity of nanocomposite FG/PVA films increased gradually when the content of FG increased from 0 to 4%.

Figure 15. Conductivity of PVA and nanocomposite FG/PVA films.
Download figure:
Standard image High-resolution image
3.2.10. Comprehensive evaluation of performance of nanocomposite FG/PVA films.
Table 6 lists the performance of different PVA nanocomposites reported by different studies. Graphene is rarely used in the preparation of PVA nanocomposites because it lacks functional groups. As such, graphene is not easy to disperse in PVA, and improving the performance of PVA is difficult. Afzal [36] reported that the tensile strength of PVA loaded with graphene was even worse than performance of PVA. Therefore, most studies deal with nanocomposites of PVA with GO. It can be seen from table 6 that although the tensile strength of GO/PVA in some studies was higher than that of FG/PVA nanocomposites in this present study, the improvement rate of pure PVA was not as high. In the study by Xu [68], the tensile strength was also higher than that obtained in this study, but the nanocomposite materials were not only GO and PVA, but nanocellulose fiber (NCF) was also incorporated. Table 6 shows that this work indicated the best improvement on the barrier performance of PVA.
Table 6. Comparison of tensile and oxygen barrier performance of various nanocomposite PVA films.
| Tensile strength | Oxygen barrier performance | ||||
|---|---|---|---|---|---|
| Sample | (MPa) | Promotion rate (%) | cm3 m−2.d.Pa | Promotion rate (%) | Reference |
| FG/PVA | 47 | 78.5 | 1.28 | 588.28 | This work |
| Graphene/PVA | 44.8 | −2.6 | / | / | [36] |
| GO/PVA | 138 | 48.38 | / | / | [51] |
| GO/PVA | 87.6 | 76 | / | / | [60] |
| GO-gPVA/PVA | 68 | 53 | / | / | [63] |
| NCF-GO/PVA | 80.22 | 85.9 | 3 | 265.51 | [68] |
4. Conclusion
Nanocomposite FG/PVA films were prepared by hydrothermal blending. FG imparted conductivity to PVA. The conductivity increased gradually with the increase in the FG content. The introduction of FG enhanced the tensile strength, as well as the water and oxygen barrier properties of nanocomposite FG/PVA films; the conductivity was even improved. However, there was an optimal content of FG: the tensile strength, crystallization temperature, water and oxygen barrier properties of the films were most favorable when the FG content was 2%.
When the FG content was increased to 2%, the oxygen permeability of nanocomposite films decreased to a minimum value of 1.28 cm3 m−2.d.Pa, an improvement of nearly 7 times as much compared with that of pure PVA film.
In conclusion, the optimal content of FG in the PVA matrix was 2%. More than the optimal content, FG began to aggregate.
Acknowledgments
The authors would like to acknowledge the financial support from the following organizations: Wuliangye Group Co. Ltd (CXY2019ZR001); Sichuan Province Science and Technology Support Program (2019JDRC0029); Zigong City Science and Technology (2017XC16; 2019CXRC01; 2022); Opening Project of Material Corrosion and Protection Key Laboratory of Sichuan Province (2017CL03; 2016CL10; 2019CL05; 2018CL08; 2018CL07); Opening Project of Sichuan Province, the Foundation of Introduced Talent of Sichuan University of Science and Engineering (2017RCL31; 2017RCL36; 2017RCL16; 2019RC05; 2019RC07; 2014RC31). Appreciation is also extended to the National Natural Science Foundation of China; Apex Nanotek Co. Ltd; Ratchadapisek Sompote Fund for Postoctoral Fellowship (Chulalongkon University).
Conflict of interest
The authors declare no conflict of interest.
The raw data required to reproduce these findings are available to download from (https://data.mendeley.com/datasets/9bn8hpvkgz/draft?a=e59449cd-0317-4514-8d74-6517aca086aa). The raw SPED data required to reproduce these findings cannot be shared at this time due to technical limitations, but would be available upon request.