Article

Bioenergy on Islands: An Environmental Comparison of Continental Palm Oil vs. Local Waste Cooking Oil for Electricity Generation

by
Christian R. Parra
1,
Adriana Corrêa-Guimarães
1,*,
Luis Manuel Navas-Gracia
1,*,
Ricardo A. Narváez C.
2,3,
Daniel Rivadeneira
3,
Darío Rodríguez
3 and
Angel D. Ramirez
4,*
1
Department of Agricultural and Forestry Engineering, University of Valladolid, UVa, Campus Universitario de Palencia, Avenida de Madrid, 50, 34004 Palencia, Spain
2
Universidad Central del Ecuador, Grupo de Investigación e Ingeniería en Procesos Químicos, Quito EC170521, Ecuador
3
Instituto de Investigacion Geologico y Energetico IIGE, Quito EC170518, Ecuador
4
Escuela Superior Politécnica del Litoral, ESPOL, Facultad de Ingeniería en Mecánica y Ciencias de la Producción, Campus Gustavo Galindo Km. 30.5 Vía Perimetral, P.O. Box 09-01-5863, Guayaquil EC090902, Ecuador
*
Authors to whom correspondence should be addressed.
Appl. Sci. 2020, 10(11), 3806; https://doi.org/10.3390/app10113806
Submission received: 15 May 2020 / Revised: 25 May 2020 / Accepted: 27 May 2020 / Published: 30 May 2020
(This article belongs to the Special Issue Biomass Energy Utilization Systems)

Abstract

:
Energy security on islands is a challenging issue due to their isolation from energy markets and fossil fuel dependence. In addition, islands’ average energy intensity has increased in recent years due to economic development. This research explores the environmental performance of two alternative non-variable bioelectricity feedstocks to increase energy resilience on islands. The study was developed for the Galápagos islands to address the environmental impacts from the direct use of waste cooking oil (WCO) and refined palm oil (RPO) to produce 1 MWh using the life cycle assessment methodological framework. A combination of primary and secondary data sources was used. The results show better performance for the electricity derived from WCO in all the impact categories considered when compared to RPO.

1. Introduction

The energy share of most islands is highly dependent on imported fossil fuels, which exposes them to volatile oil prices, limits economic development, and degrades local natural resources. On average, 88% of the total electricity demand in small island developing states (SIDS) is met by fossil fuels, while the remaining 12% is supplied primarily by hydropower, followed by wind energy and biomass in lower proportions [1]. As an illustrative example, in the island countries of the Caribbean Community (CARICOM), 89.7% of the total installed electricity capacity corresponds to fossil fuel technologies and just 10.2% comes from renewables [2]. Besides this, between the years 2000 and 2015, the average energy intensity (total energy consumption/GDP) in islands has increased by 23.4% with a corresponding emission intensity (total emissions/GDP) increase by 12.4% [3]. This ongoing energy dependence fails to establish a precedent for global action to mitigate the long-term consequences of climate change, which pose a particularly acute threat to islands.
From 2010, the number of peer-reviewed publications about renewable energy in islands has nearly tripled, mainly because of the special attention that some intergovernmental organizations (like the Intergovernmental Panel on Climate Change) have given to island nations as they recognize islands’ vulnerability to climate change [4].
Most studies have focused on variable rather than base renewable energy resources such as biomass. Surrop (2018) identified 41 studies published focused on wind, solar, and ocean-based technologies and just 12 studies about bioenergy in small island developing states (SIDS) during the 2010–2017 period [4].
Studies regarding the potential use of alternative biomass feedstocks for energy production in islands are on topics as diverse as biodiesel production on Crete [5], coconut oil electricity generation in the Pacific Islands [6], biogas production from animal waste in Indonesia [7], forest-waste-derived fuel with waste cooking oil in Taiwan [8], biogas from animal manure in the Canary Islands [9], biomass-fueled combined heat and power (CHP) in Åland Islands [10], and perennial tree pruning biomass for electricity generation in Greece [11]. Biomass research in Ecuador has addressed the energy potential of some residues from important agricultural commodities [12,13,14,15]. In addition, liquid and gaseous biofuel potential generation has also being studied by some authors [16,17,18,19].
There are some existing efforts in many SIDS to use biomass to contribute to the decarbonization of their energy matrixes and to reduce their dependence on imported fuels. The use of vegetable oil for electricity generation has been explored mainly by the Pacific Islands. Vanuatu has two 4 MW diesel engines on Efate (the capital) running on a mixture of 30% coconut oil and 70% petroleum, and 15% of the electricity generated comes from coconut oil [20]. The island of Tokelau declared in 2011 its intention to become the world’s first 100% renewable country. This is to be achieved by a photovoltaic minigrid on each of the three islands which together would provide 90% of the electricity demand with the remaining 10% to come from coconut oil. Samoa also presents small-scale coconut oil utilization by its power utility [21].
The feasibility of using waste cooking oil (WCO) as an alternative energy feedstock in islands has also been addressed in some research evaluating the potential of biodiesel (via recycled cooking oil) use in Singapore [22] and feasibility of Langkawi waste cooking oil (WCO)-derived biodiesel [23].
Life cycle assessment (LCA) is a quantitative methodological framework to assess the environmental performance of products and services throughout their life cycle. LCA has been used with success to assess the environmental sustainability of bioenergy systems [24,25,26,27]. Existing environmental impact studies of biofuels derived from oleaginous feedstocks have mainly focused on biodiesel, such as life cycle analysis of biodiesel production [28], comparative life cycle assessment of diesel production from crude palm oil and waste cooking oil via pyrolysis [29], comparative life cycle assessment of alternative strategies for energy recovery from used cooking oil [30], substitutable biodiesel feedstocks for the U.K. [31], and the used-cooking-oil-to-biodiesel chain in Europe [32].
Furthermore, some authors have studied the combustion emissions of transesterified WCO, mainly in automotive sources, such as the effects of fuel injection pressure on the performance and emissions of a diesel engine fueled with waste cooking oil biodiesel–diesel blends [33], butyl-biodiesel production from waste cooking oil, and fuel properties and emission performance [34], among others.
As shown, although some research has been conducted on the environmental impacts and emissions performance of oleaginous derived fuels, few authors have addressed these issues from the perspective of its straight use as a fuel (non-transesterified) in fixed sources for electricity production [35,36].
In addition, converting waste streams such as waste edible oil into valuable resources represents a three-win solution, dealing simultaneously with human security, pollution, and energy recovery [37]. Circular Economy (CE) is an emerging alternative concept to a traditional linear economy (make, use, dispose) in which resources are kept in use for as long as possible, extracting the maximum value from them whilst in use, and recovering and regenerating products and materials at the end of each service life [38]. The use of waste flows as an energy source is complementary to CE principles [39].
As in the case of most islands, electricity generation in the Galápagos Islands is heavily based on fossil fuels. According to its energy balance, 89% of the electricity produced in the islands comes from fossil fuels, 8.2% from wind, 2.5% from solar, and 0.1% from biofuels [40]. According to Noboa et al. [41], to progressively replace fossil-based energy in Ecuador, other types of non-conventional renewable technologies such as biomass (solid, liquid, and gas) must be developed.
Galápagos has endured severe environmental and economic impacts from fossil fuel spills on its marine reserve. The most serious was caused by a spill from a tanker in 2001, at San Cristóbal Island. A total of 662,447 L of diesel and fuel oil was spilt into the sea. This disaster triggered the decision to foster renewable energy implementation in the islands. In this context, “The Zero Fossil Fuels” initiative was adopted [42]. One component of this project is a biofuel program that aims to reduce the environmental footprint attributed to fossil fuel usage through partial replacement with vegetable oils. In addition, the risks associated with fossil fuel transportation from the mainland to the islands could also be addressed. The biodegradation rate of oleaginous biofuels is 80.4%–91.2% after 30 days, while fossil diesel only reaches 24.5% biodegradation during the same period [43]. Floreana Island is the smallest (172.29 km2) of the inhabited islands of the Galápagos archipelago. It is located 1000 km from Continental Ecuador [44]. Since 2010, the biofuel pilot program has operated on the island using pure Jatropha curcas oil as an energy source in three dual electricity generators which can work indiscriminately with 100% diesel, 100% pure vegetable oil, or any proportion of blends among those. The thermoelectrical group produces 256,713 kWh per year [40]. The current electricity generation by source in Galápagos is shown in Table 1.
The biofuel program also seeks to reach other islands in the future. The estimated biofuel demand for a B20 blend (20% biofuel/80% diesel) for the San Cristobal and Isabela islands is 585,964.4 and 268,003.2 L of biofuel per year, respectively [45].
In terms of electricity generation, Floreana´s biofuel pilot project has tracked the efficiency of diesel and jatropha oil in terms of kWh produced per liter of fuel: 3.43 and 2.64, respectively [40]. Although pure jatropha oil is the current sole biofuel source for electricity generation in Floreana, just 18.7% of the total electricity is produced on the island because of the absence of a robust supply chain. Jatropha curcas production is exclusively based on the collection of mature fruits from plants used as living fences in Manabí province, located in the coastal region of continental Ecuador; agricultural production of the plant at commercial scale is nonexistent in the country. For this reason, it is important to identify environmentally friendly alternatives to permit the permanence of the biofuel project in the islands. As seen in Table 1, the proportions of jatropha oil and diesel are 19.6% vs. 80.4%, respectively [40].
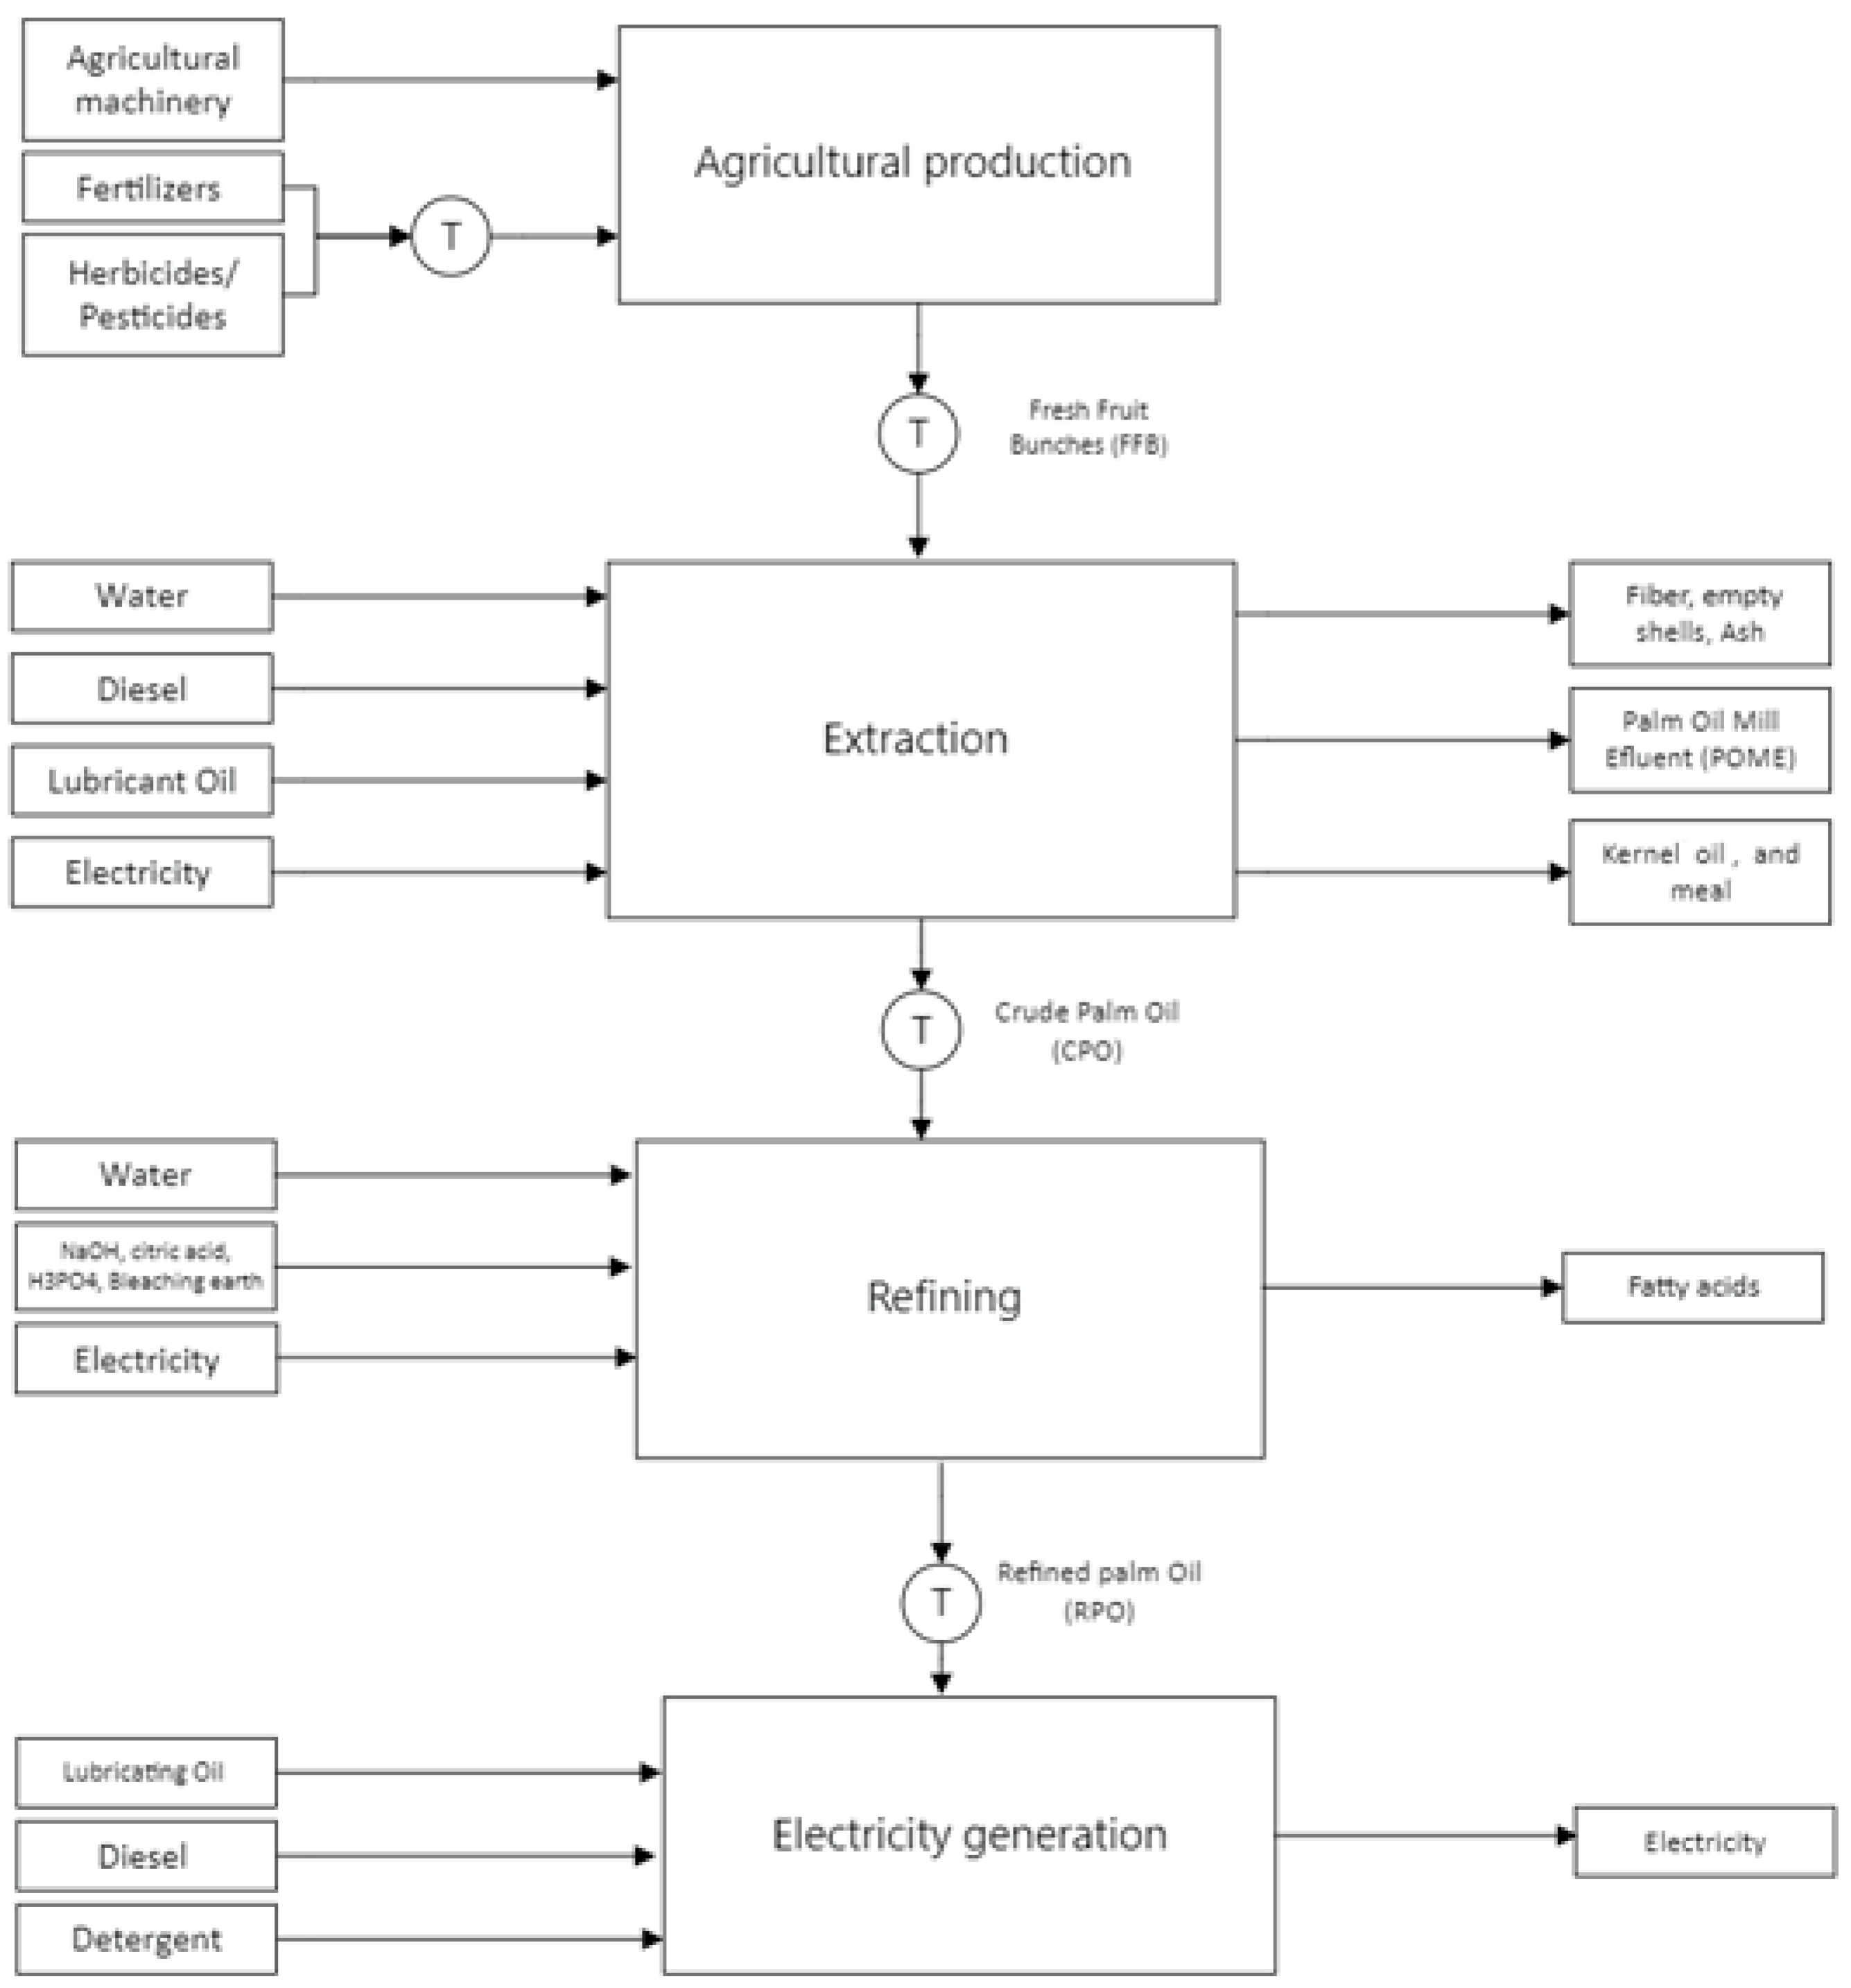
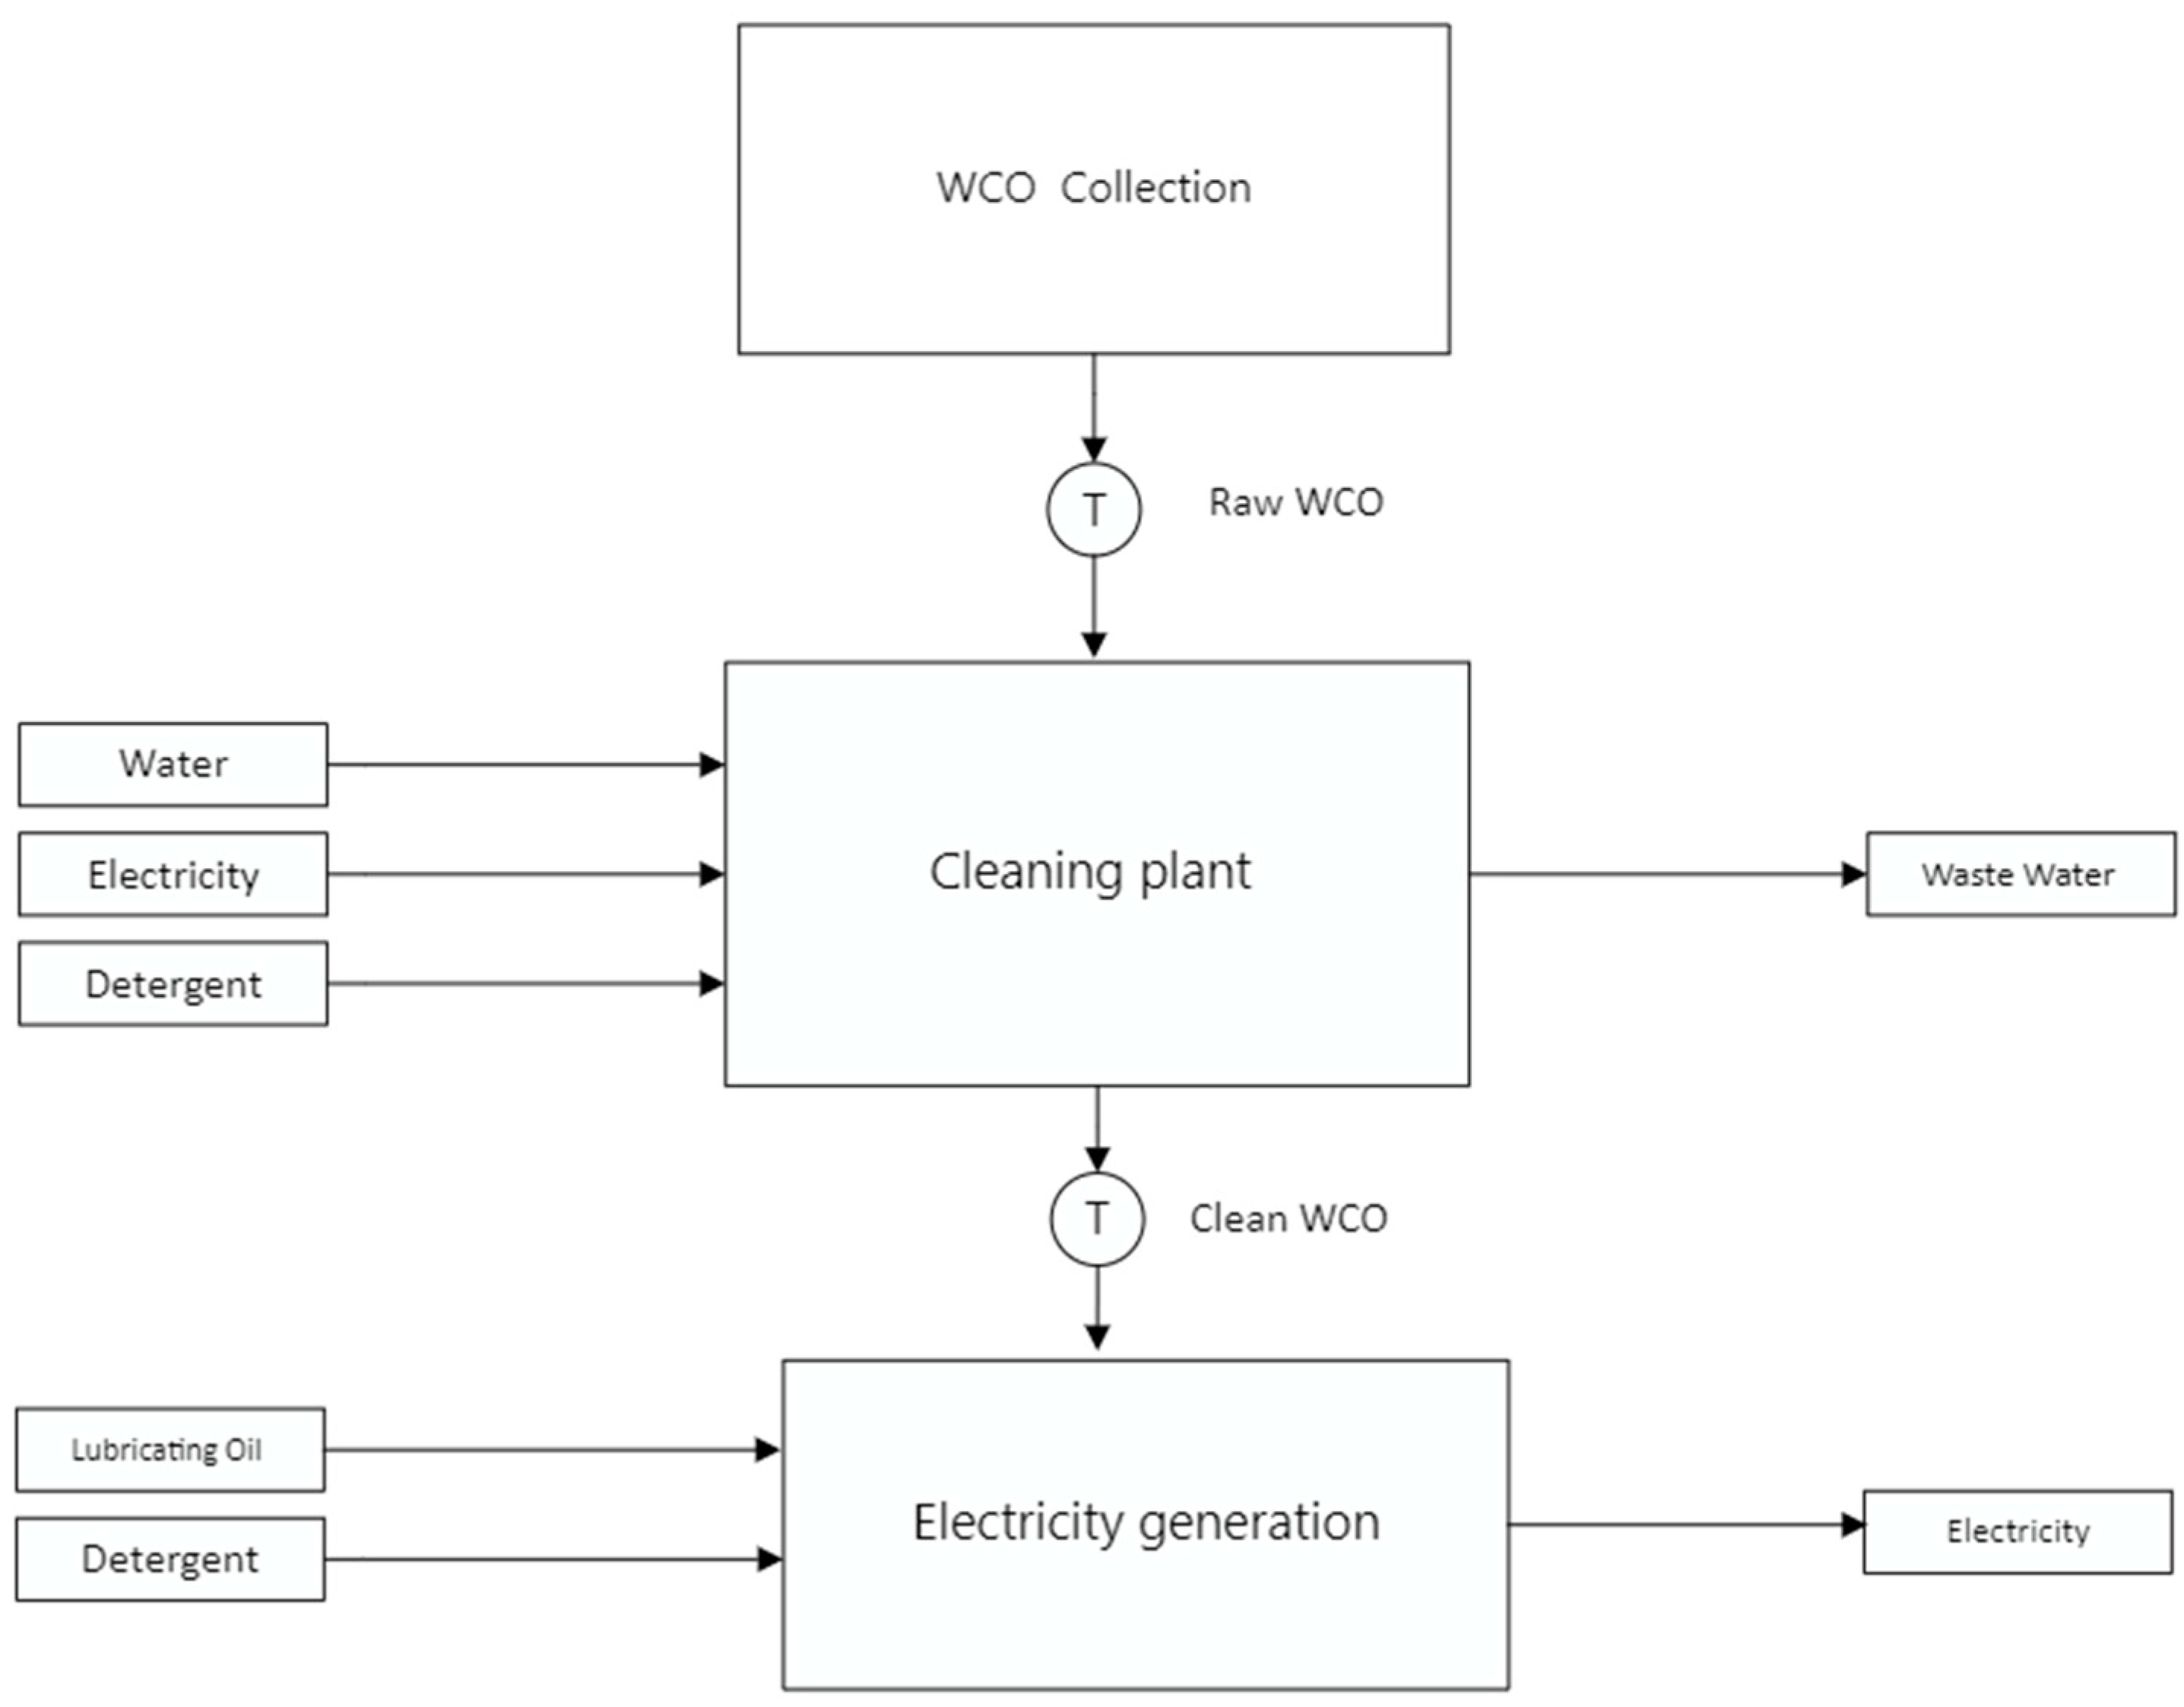
In this context, the goal of this study is to evaluate from an environmental perspective two biomass alternatives for the generation of electricity on islands: refined palm oil (RPO) and waste cooking oil (WCO). The study was developed for the Galápagos Islands due to the singularity of its ecosystem and because of its proactive policy framework aimed to explore the integration of different renewable energy sources.

2. Materials and Methods

Life cycle assessment (LCA) was performed following the standardized method ISO 14040 [46]. The data used were primarily obtained from processes studied in situ, but to some extent, generic LCA data were used, e.g., for the use of fuels in energy supply and transport, while emissions and electricity generation yield from the direct use of RPO and WCO were measured in a test system.

2.1. Goal and Scope

The goal of the present study is to evaluate impacts through a complete life cycle assessment of electricity produced from two potential biofuel sources, (a) refined palm oil (RPO) produced on continental land and (b) locally produced clean waste cooking oil (WCO) in line with CE precepts, and to evaluate whether the production and use of new biofuels can help to reduce fossil fuel imports to islands.

2.2. Functional Unit

The final functional unit (FU) of this study was defined as 1 MWh produced on Floreana Island.

2.3. Life Cycle Inventory

The inventory analysis was developed according to ISO 14040 standards [46] and includes the required energy and material (input) flows as well as products, co-products, emissions, and wastes (outputs) emitted to the environment during all the considered processes.

2.4. System Boundary and Data Sources

2.4.1. Palm-Oil-Based Electricity Product System

In situ inventory data were collected for the five production stages included in this part of the study: (i) palm oil plantation, (ii) palm oil production, (iii) crude palm oil extraction, (iv) palm oil refining (Manabí province), and (v) electricity generation (Floreana Island). Transportation at all stages was included. Figure 1 describes the boundaries of this production system.

2.4.2. Waste Vegetable Oil (WCO) Electricity Product System

In this section of the study, a hypothetical WCO production system on Santa Cruz Island was studied; its boundaries include (i) washing containers, (ii) WCO collection and transportation to the plant, (iii) delivery of WCO from the collection point to the plant, (iv) pre-treatment, (v) processing at the cleaning facility, and (v) transportation to the electricity plant. Unit output: in this phase, 1 metric ton of recovered WCO was used as the unit output.
It must be mentioned that the WCO is assumed to be a waste product. Therefore, the agricultural and industrial production phases are not included, according to standard procedure for the life cycle of waste [47,48]. Figure 2 describes the boundaries of this production system.

2.5. Emissions Testing in Electricity Generation

Primary data were required to compile the emissions inventory of electricity generation as these data were not available. Therefore, an emissions test was carried out in similar conditions to those on Floreana Island using RPO and WCO. A model TESTO 350 emission gas analyzer was used to determine the following parameters: carbon dioxide (CO2), carbon monoxide (CO), and hydrocarbons (HC) [49].
One metric ton of RPO was purchased from a local provider, and to acquire the same amount of WCO, 30% was collected from five different locations and 70% was purchased from a local cooking oil recycler. The WCO was decanted and filtered in a press filter. It must be mentioned that this recycling company exports 100,000 L of WCO monthly to the European Union where it is converted to biodiesel [50].
The emission testing was carried out in Quito city in a test system provided by the Institute of Geological and Energy Research of Ecuador (IIGE, by its acronym in Spanish). The test system consists of a direct diesel injection, horizontal, single-cylinder, four-stroke engine of brand YANMAR, - NFD 13, adapted to an electricity generator. An emission sampler was installed by the end of the exhaust pipe where the TESTO 350 emission sampling probe was set. A combustion emission measurement trial was performed for each of the fuel batches. Figure 3 shows the reception, filtration and test emissions performed.

2.6. Life Cycle Impact Assessment

The life cycle impact assessment (LCIA) method used in this study was the CML 2001 (baseline), a problem-oriented method developed by the Institute of Environmental Sciences of the University of Leiden [51]. This methodology uses the damage-oriented approach or endpoint approach for impact assessment. The impact categories considered in this methodology include the following: carcinogens, respiratory organics and inorganics, climate change, ionizing radiation, ozone layer depletion, ecotoxicity, acidification/eutrophication, land use, and mineral and fossil fuel use.
Simapro version 9.0.033 software was used to calculate the impacts determined by the abovementioned method. A contribution analysis was performed to understand the contributions of specific processes and pollutants to the total impact scores per impact category, and to find the reasons for the differences in environmental impacts between RPO and WCO.

3. Emissions Testing Results

The results are shown in Table 2. These figures are consistent with data registered by Souza (2012) [52]. To estimate the use of the cogeneration unit, the average electricity production for 15 years of life expectancy was assumed from the Ecoinvent database.
CO emissions were in lower concentration in assays performed with diesel fuel. This fact can be related to the physical properties of the fuel that show their effect during its use in an internal combustion engine [53]. In general terms, diesel fuel has been reported to contain a larger amount of energy per mass or volume unit than vegetable oils [54]. In addition, WCO registered a lower CO emission factor than RPO. In such a context, this issue can be associated with the chemical modification that cooking oil may suffer during its use. These changes can affect its properties, such as viscosity or calorific value, which are also relevant for determining its performance in an internal combustion engine [54].
The CO emission figures registered during the experimental test are concordant with the CO2 figures as well. This issue is highlighted by the fact that the diesel appears the most efficient choice in terms of energy and that WCO showed better performance when compared to RCO. In this context, it is affirmed that WCO is a better alternative as a fuel despite being considered a waste material.
Regarding the HC content, a trend like that for CO was found. Despite diesel fuel having no oxygen content in its composition, other properties such as its viscosity (determining fuel injection and air–fuel blending inside the engine) [55] and calorific value caused the combustion efficiency to reach results better than those of the assayed oxygenated fuels. In addition, WCO appeared to be a better fuel when compared to RPO. This can be associated with the partial hydrogenation that oils suffer during the cooking process due to their contact with water at high temperatures [56]. Saturation implies augmented hydrogen content in the oil composition; hence, its calorific value and viscosity increase at a similar rate [57]. The electricity generation test results show fuel consumption levels of 0.216 L/kWh for WCO, 0.328 L/kWh for RPO, and 0.162 L /kWh for diesel.

4. Life Cycle Inventory Results

4.1. Palm-Oil-Based Electricity Production Inventory

Electricity generation from palm oil on islands has mainly being focused on its byproducts [58,59,60]. In this study we aimed to explore the environmental impacts related to the direct use of RPO as an electricity feedstock on islands.
The Latin American region exports 1.9 million t of palm oil per year [61]. In Ecuador, the crop contributes 4% of the agricultural gross domestic product (GDP). The production of this commodity presented annual growth of 8% from 2010 to 2016, becoming the seventh -largest agricultural export and one of the most dynamic industries in the country. In the last five years, 42% of palm oil produced in Ecuador was consumed internally, while 58% was exported for a total of USD 271,000,000. Palm oil production in Ecuador accounts for 300,000 hectares with total investment of 2.2 billion USD and generates 127,000 jobs [62].
According to the National Federation of Palm Oil producers (FEDEPALMA), 78,737 t, equivalent to 70,154,667 L, was exported in 2018 [63]. This number shows that the potential biofuel demand for the Galápagos islands could be easily satisfied by palm oil alone.
In situ data collection was performed for each of the stages described in Section 2.4.1.

4.1.1. Agricultural Phase

The input data of materials and energy required to produce 1 t of palm oil fresh fruit bunches (FFB) (the unit output in this phase) were addressed. The cultivation stage includes all agricultural activities dedicated to the production of immature/mature plants. The selection of the agricultural area for this case study was supported by the Palm Oil Improvement Unit of the National Institute of Agricultural Research of Ecuador (INIAP, by its acronym in Spanish). The area is located at latitude: 0°11′22.79″ S, longitude: 79°12′8.62″ W and represents the typical palm oil agricultural systems of Esmeraldas province, one of the largest producers in Ecuador. The data collected were the result of field visits and experts’ criteria. The yield was defined as an average obtained from field research and statistics developed by INIAP [64]. Regarding land-use change, although palm oil cultivation is linked to deforestation mainly in the Amazonian region of Ecuador [65], the selected productive zone does not present this pattern because it has been under production for 60 years, while the studied crops have an average age of 12 years. Therefore, no land-use changes were attributed in this study.
It must be mentioned that the selected plantations have a better production yield when compared to the national average due to the application of best agricultural practices recommended by the research center [64]. Information regarding fertilizers, pesticides, herbicides, machinery use, and input transportation was collected during visits.
The average agricultural conditions of the productive units studied are shown in Table 3.
Average yearly yields, as well as inventory data of fertilizers, herbicides, pesticides, and energy usage during plantation and harvesting, were collected in situ. Adjustments were made using recommendation charts developed by INIAP [64].
Fertilizers: The total amount of applied fertilizers in the studied plantations was calculated for 25 years as the productive period of the crop. Manure-based fertilization in palm oil crops is not a common practice in Ecuador; hence, it was not included in the study.
Herbicides, pesticides: Data on herbicides and pesticide used per FFB t produced in Ecuador were compiled during site visits; adjustments were made by INIAP.
Energy: In terms of energy consumption, one source was identified: gasoline used on agricultural machinery (a motorized bush cutter).
Transport: The transportation of agricultural inputs from the warehouse to the plantation in EURO 1, 10 t capacity trucks was included using ton-kilometer (tkm) units.

Emissions at the Agricultural Phase

The emission outputs analyzed in this part of the study were emissions to air, water, and soil which occurred during the agricultural production of 1 FFB ton.
Emissions derived from the use of fertilizers were determined using methodologies and models developed by the authors of [66,67,68,69,70]. The Pest LCI2.0.8 model was used for determining pesticide emissions to soil, air, and water [71]. Heavy metal emissions were calculated using the models and methodologies developed by the authors of [72,73] and [74]. Emissions from fertilizer production and pesticides used in the plantation were determined using the Ecoinvent database [75].
Inputs were assigned for 1 t of FFB (Table 4). Finally, the values were processed in Simpapro 9.0.0.3 software considering their origination and end: nature or technosphere.

4.1.2. Industrial Phase Inventory

Extraction Process

The palm oil mill type studied is in Esmeraldas province at latitude: 0°1′34.25″ N, longitude: 79°23′54.65″ W. The facility has a processing capacity of 5.6 t of FFB per hour (90 t of FFB per day). The distance from the plantation to the facility is 31.5 km by road. Process data were obtained from monthly reports provided by the management department. The average crude palm oil (CPO) yield in the studied oil mill is 0.185 t per ton of FFB processed. Fiber residues, 150 kg per ton processed, are used as fuel for generating steam that supplies 97.6% of the total energy demand of the plant; the rest is purchased from the grid. Nevertheless, a diesel-based electricity generator is used in case of electricity shortage and to start engines. Economic allocation was selected in the extraction phase. Table 5 presents the inputs used in this production phase.

Emissions at the Industrial Phase

Emissions to water were estimated using the methodology developed by Hosseini et al. [76], and emissions to air using Jungbluth el al. [77].
Emissions to water and air due to the use of the national electricity grid of Ecuador were adapted from Ramirez et al. [78] using the electricity mix for the year 2018. These emissions are included in Table 5 and Table 6.

4.1.3. Transport

Refining Process

Extracted CPO is transported to a refinery facility located 258 km from the oil mill by road. The refining process removes odors, flavors, and impurities through bleaching and deodorizing methods.
The mass balance of the studied system resulted in a yield of 1 t of RPO per 1.08 t of CPO. The inputs and outputs for this phase are shown in Table 6.

Ground Transportation

The studied palm oil processing mill is located 31.5 km from the plantation in Esmeraldas province, while the refining plant is in Manabí province, 258 km away. Once the oil is extracted, it is transported by a 10 t capacity truck to Timsa port in Guayaquil city. The distance between the processing plant and the port is 326 km by road. Ton-kilometer (tkm) units are included in the study results for each transportation stage.
Assuming the full capacity of a 10 t truck, a total amount of 3260 tkm was estimated. For each metric ton of pure palm oil was assigned 326 tkm for road transportation to Timsa port in Guayaquil city. Finally, once the RPO arrives at Floreana Island, it is transported 0.5 km by truck to the electricity generation facility. The means of transportation selected from the Ecoinvent database in this phase was transport, truck < 10 t, EURO 1.

Marine Transportation

Once the refined palm oil arrives at Timsa port in Guayaquil city, it is shipped to Floreana Island in Galápagos. The route is made by an 834.5 t capacity tanker ship. The route comprises 1283 km to Velasco Ibarra port on Floreana Island. Assuming that the vessel is travelling at full capacity, the allocation results in 1283 tkm for the unit output of 1 Tm of RPO (4119 L). For this component, a 960 t capacity barge ship container with 80% load factor (LF) and empty return was selected from the Ecoinvent database.

4.1.4. Electricity Generation

On Floreana Island, three 89 kW DEUTZ generators of model BF4M101E, year 2010, have been adapted to work with diesel, vegetable oil, or any blend of the two. The fuel currently used is a blend of diesel and pure jatropha oil which varies in proportions according to the availability of the latter. According to the Galápagos energy balance, on average, 9.83 kWh is generated per gallon of vegetable oil [40]. According to the reference information provided by the Galápagos energy balance, it was calculated that 385,086 L of vegetable oil (or 353.085 kg) must be used to generate 1 MWh. Section 3 describes the direct emissions measurement performed. The inputs and outputs of this phase are included in Table 7.

4.2. WCO In Situ Production Inventory

Waste cooking oil (WCO) is defined as an oil-based substance that has been used in cooking or food preparation and is no longer suitable for human consumption [79]. The disposal of large amounts of WCO has become a problematic issue in most countries. WCO cannot be discharged into drains or sewers because this will lead to blockages, odor, or vermin problems and may also pollute watercourses, causing problems to wildlife [80]. It is also a prohibited substance and will cause problems if dumped in municipal solid waste landfills or municipal sewage treatment plants [81]. When WCO reaches natural ecosystems, such as rivers, aquifers, or subsoil, the environmental consequences can be severe. In terms of economic and energy costs, the inappropriate disposal of used cooking oil represents 3 kWh and about 1€, respectively, per kg of WCO delivered to the sewer system [82]. These risks must be highlighted in a fragile ecosystem such as Galápagos Islands.
Using WCO as an alternative fuel for energy generation could therefore be a sustainable solution not only for disposal but also for greenhouse gas (GHG) emission abatement.
Many countries around the world, e.g., Portugal, Greece, Italy, Spain, Belgium, Denmark, China, U.S.A, Australia, Germany, the U.K., and Korea, have implemented regulations for using WCO for energy [83]. Also, WCO could potentially be used as an in-situ-produced biofuel, reducing environmental and capital costs in line with circular economy principles.
The use of this potential energy source would also reduce in a significant manner the environmental impact of fossil-fuel-based energy generation in islands. In this context, collecting and recycling WCO contributes to simultaneously solving three environmental problems: waste reduction by reuse/recovery, reduction of fossil fuel dependence, and reduction of pollutant emissions [84]. Furthermore, studies developed by Caldeira (2018) showed advantages regarding the water footprint for WCO when compared with other biodiesel feedstocks, finding the lowest impact for WCO with 0.03 world m2eq/kg, while for palm oil, the results were 1.26 world m2eq/kg [85].
According to Capuano (2017) [35], the use of WCO in diesel engines is much more feasible for the stationary production of electrical and thermal energy; an illustrative example is the Vegawatt system developed by Owl Power Company in the U.S.A. which produces electricity in situ using WCO [86], and in low-speed diesel engines, i.e., those of large ships [87], rather than for automotive applications. In this last case, direct use of WCO on a large scale is currently not feasible due to the need for changes in the design of the engines, as well as for organization of the distribution network. A comparison of the physical and chemical properties of palm oil, WCO, and diesel is shown in Table 8.
The diesel consumption for electricity generation in CARICOM’s islands is 218 million liters per year or 8.4 M GJ [99]. Taking into account the annual vegetable oil consumption of the Caribbean region [100], the recovery ratio determined by Pardo (2013) [101], and the urban population in each island, we estimate a hypothetical availability of 124 million liters per year of regenerated WCO or 4.2 GJ which could be used to replace 44% of diesel imports for electricity production.
The current population of the Galápagos Islands is 25,500 people [102]. In addition, according to the annual Visitor Report for the protected areas of Galápagos [103], an average of 228,306 tourists (floating population) visit the archipelago every year with average permanency of 7 days; 77% of the total, 159,814 tourists, stay on Santa Cruz Island.
On the other hand, the average annual amount of edible cooking oil used per capita in the Latin American region is 20 kg [104]. The food´s oil absorption ratio is 25% [105]. Nevertheless, the real WCO recovery ratio in the region is estimated to be from 20% to 45% [101,106]. Thus, we can determine an average WCO potential recovery of between 114,259.70 and 257,084.33 kg, or between 121,287.99 and 272,898 L, per year on Santa Cruz Island. According to the Galápagos energy balance, Floreana Island uses 74,944 L of diesel and 18,367 L of vegetable oil (Jatropha curcas) per year as fuels in its dual electricity generators [40]. This fuel demand can be easily covered by WCO produced on Santa Cruz Island.
In addition, the implementation of a WCO value chain could develop a new local industry, creating local employment and reducing foreign exchange expenditures on energy.
In situ and bibliographical data were collected for each of the following production stages: (i) washing containers, (ii) WCO collection and transportation to plant, (iii) delivery of WCO from the collection point to the plant, (iv) pre-treatment, (v) processing at the cleaning facility, and (v) transportation to the electricity plant.

4.2.1. WCO Collection

A hypothetical WCO collection system was drawn in Santa Cruz Island, the most-populated island and main touristic destination of the Galápagos. One hundred and twenty potential WCO collection sites were identified through in situ visits: 32 restaurants and 88 hotels.
Two collection routes were drawn (Figure 4). The first, in the southeast zone of the island, is 4.47 km, and the second, in the northeast zone of the island, is 3.72 km, totaling 8.7 km. Both collecting routes end in a hypothetical cleaning facility located in the electricity company facilities at the following coordinates: latitude 0°44′37.81″ S, longitude 90°19′11.97″ W.

4.2.2. WCO Cleaning

The WCO processing phase comprises the following activities: (i) washing containers, (ii) oil regeneration, (iii) pre-heating, (iv) decantation, (v) sieving and pumping, and (vi) extraction/filtration. The use of electricity and water was estimated according to Lombardi (2018) [30].
The required materials and infrastructure were estimated according to Ripa (2014) [37]. Table 9 shows the inputs required to produce one metric ton of regenerated waste cooking oil.
The electricity mix in Santa Cruz Island was modelled in Simapro software according to the technologies reported in the energy balance of the Galápagos Islands [40].

4.2.3. Transport

For the collection phase, we assumed the use of a EURO1 10 t capacity diesel truck; from the Ecoinvent database, 8.7 tkm was assigned.
The treated WCO is transported by sea from the Santa Cruz port 56.49 km to Simon Bolivar port on Floreana Island. The transport system to be used in this stage is a cargo catamaran. Assuming that the vessel is travelling at full capacity, it was assigned 56.49 tkm for the unit output of 1 Tm of pure palm oil (1088 L). For this component of the process, a barge ship, container, 960 t, 80% LF, empty return, global market, Economic was selected from the Ecoinvent database.

4.2.4. Electricity Generation

The electricity production process is described in Section 4.1.4. The inputs and outputs in this phase are detailed in Table 10, including the direct emissions measurement performed.

5. Life Cycle Impact Assessment Results

5.1. Comparison of Results

The main comparative results from method CML 2001 for RPO and WCO LCA per impact category are shown in Table 11. The results per contributor per type of material are illustrated in Figure 5 and Figure 6.

5.2. Interpretation

Regarding global warming (GWP), the life cycle of WCO decreases this indicator by 94.6% compared with RPO. The primary source of greenhouse gases in the RPO production cycle is methane production from wastewater and landfill emissions in the oil extraction phase. In terms of abiotic depletion, WCO performs 97% better than RPO because of the reduced use of processing facilities and the avoidance of fertilizers (mainly urea) in its production. RPO performed worse than WCO in terms of acidification, mainly because of ammonia release derived from the use of urea as a fertilizer and the use of pesticides in the agricultural production phase. Regarding eutrophication potential, RPO presents a 90% greater contribution than WCO because of the chemical oxygen demand (COD) and nitrogen present in the wastewater at the extraction phase. On the other hand, WCO performs 7.56 times better than RPO regarding ozone depletion over five years. In terms of human toxicity at 20 years, WCO performs 95% better than RPO. The results show 27% better performance of WCO when compared with RPO regarding photochemical oxidation. In terms of terrestrial and marine ecotoxicity, mainly because of the use of herbicides, RPO performs 98% and 71% worse than WCO, respectively. The results comparison for each impact category is illustrated in Figure 7.

6. Discussion

As mentioned in the introduction, there is increasing interest in the research of non-variable energy sources on islands to reduce their dependency on imported fossil fuels. Some studies have been conducted regarding the use of alternative oleaginous sources for energy generation on islands; nevertheless, most of them have focused on biofuels produced through transesterification processes. Few studies have analyzed the use of alternative energy sources such as WCO in island systems. Moreover, there is a lack of research regarding the environmental impacts of electricity generation from biomass feedstocks in this type of ecosystem.
In this context, our study aimed to evaluate the environmental impact of the direct use of non-transesterified feedstock options for electricity generation on islands—imported RPO vs. locally produced WCO—in addition to providing direct data on the emissions from the combustion of these two materials.
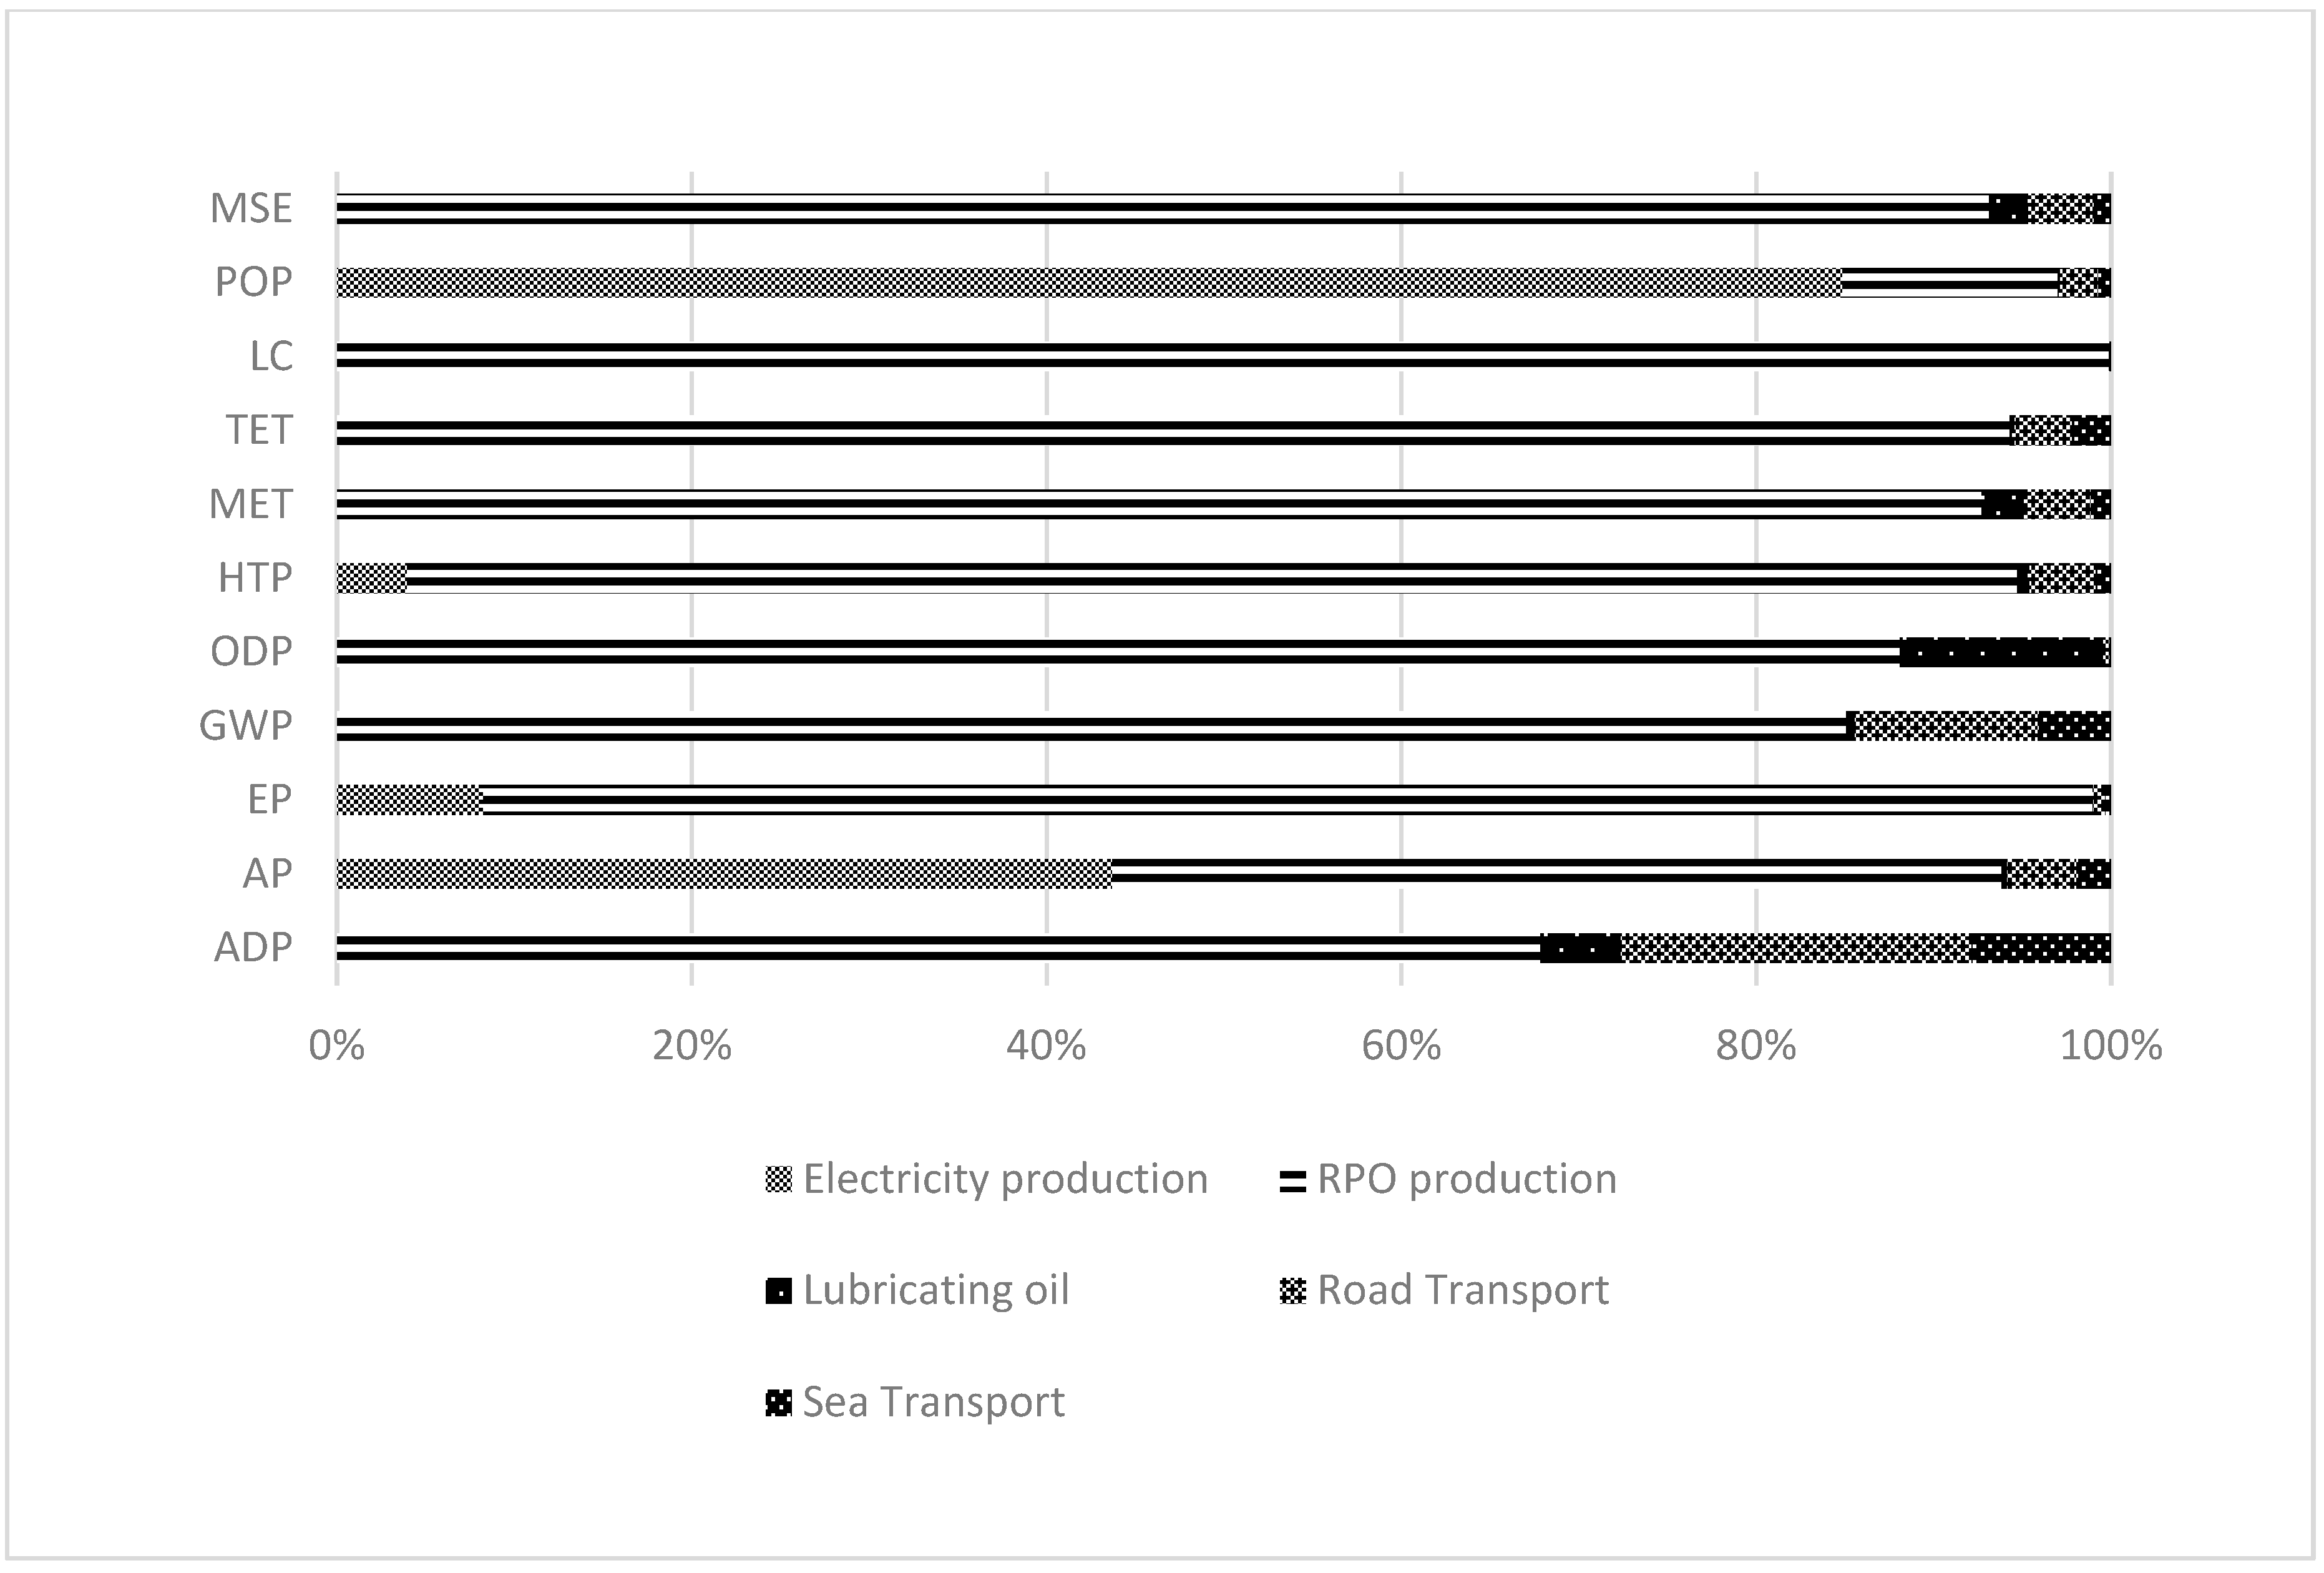
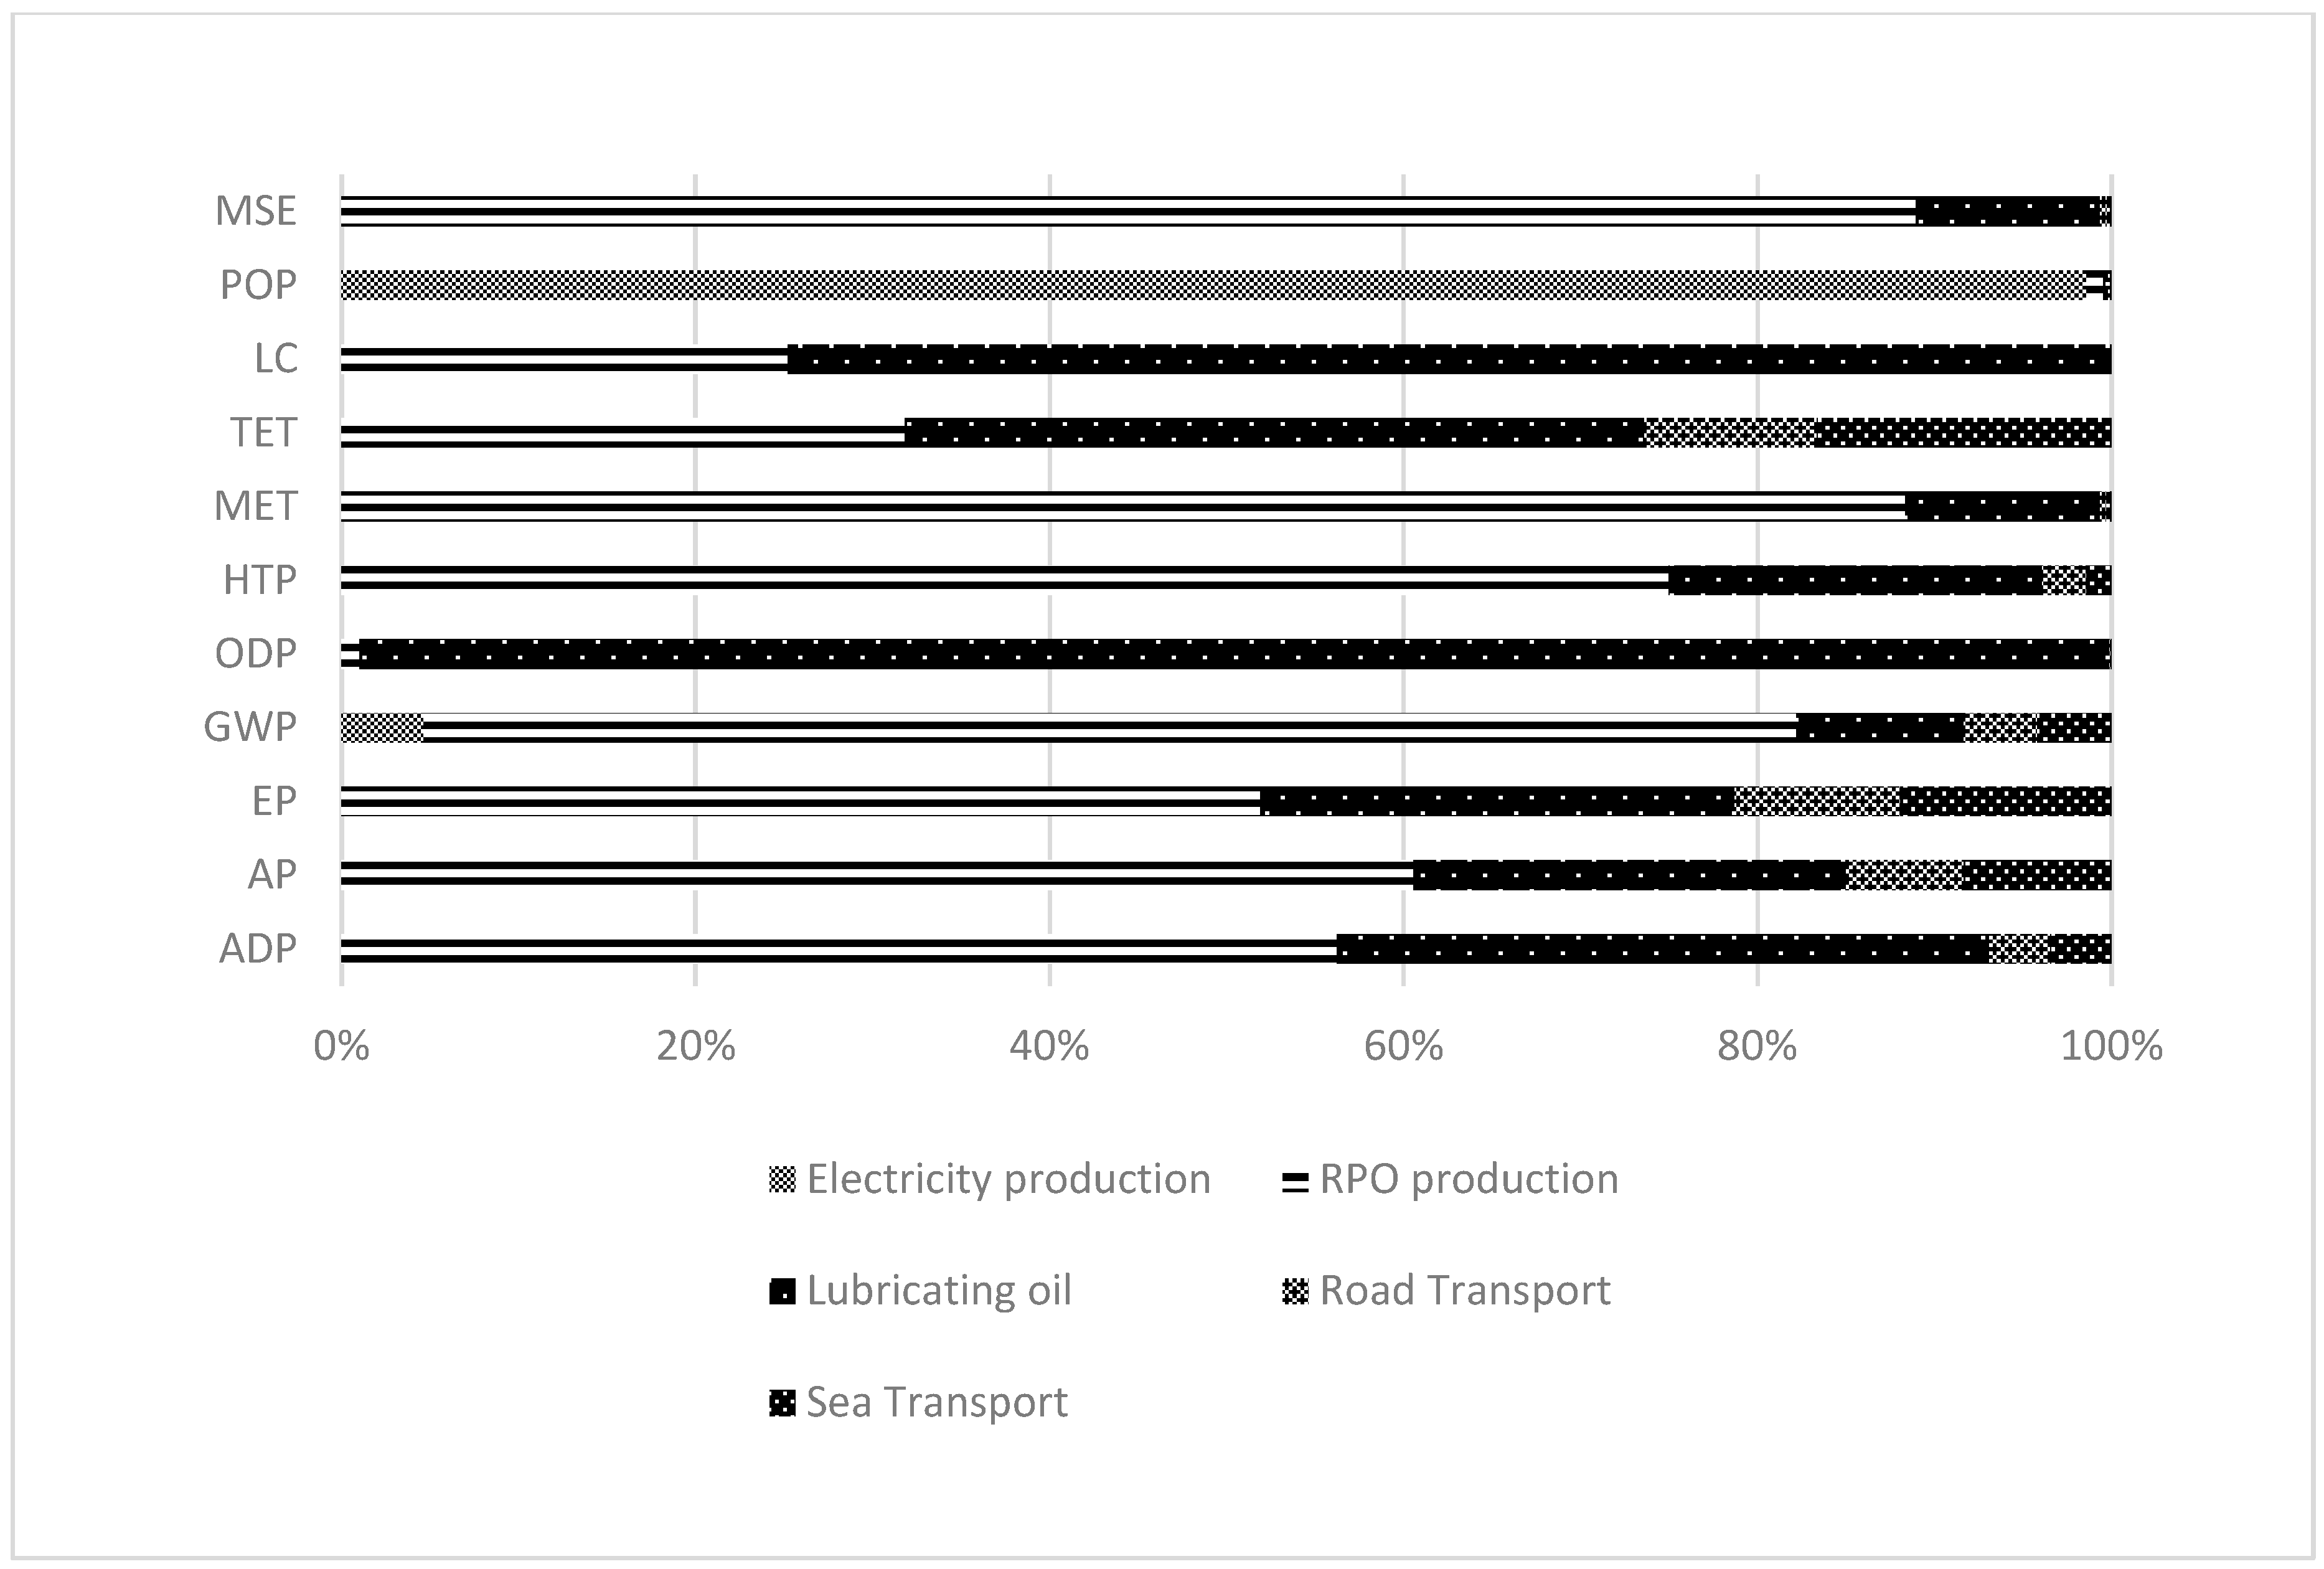
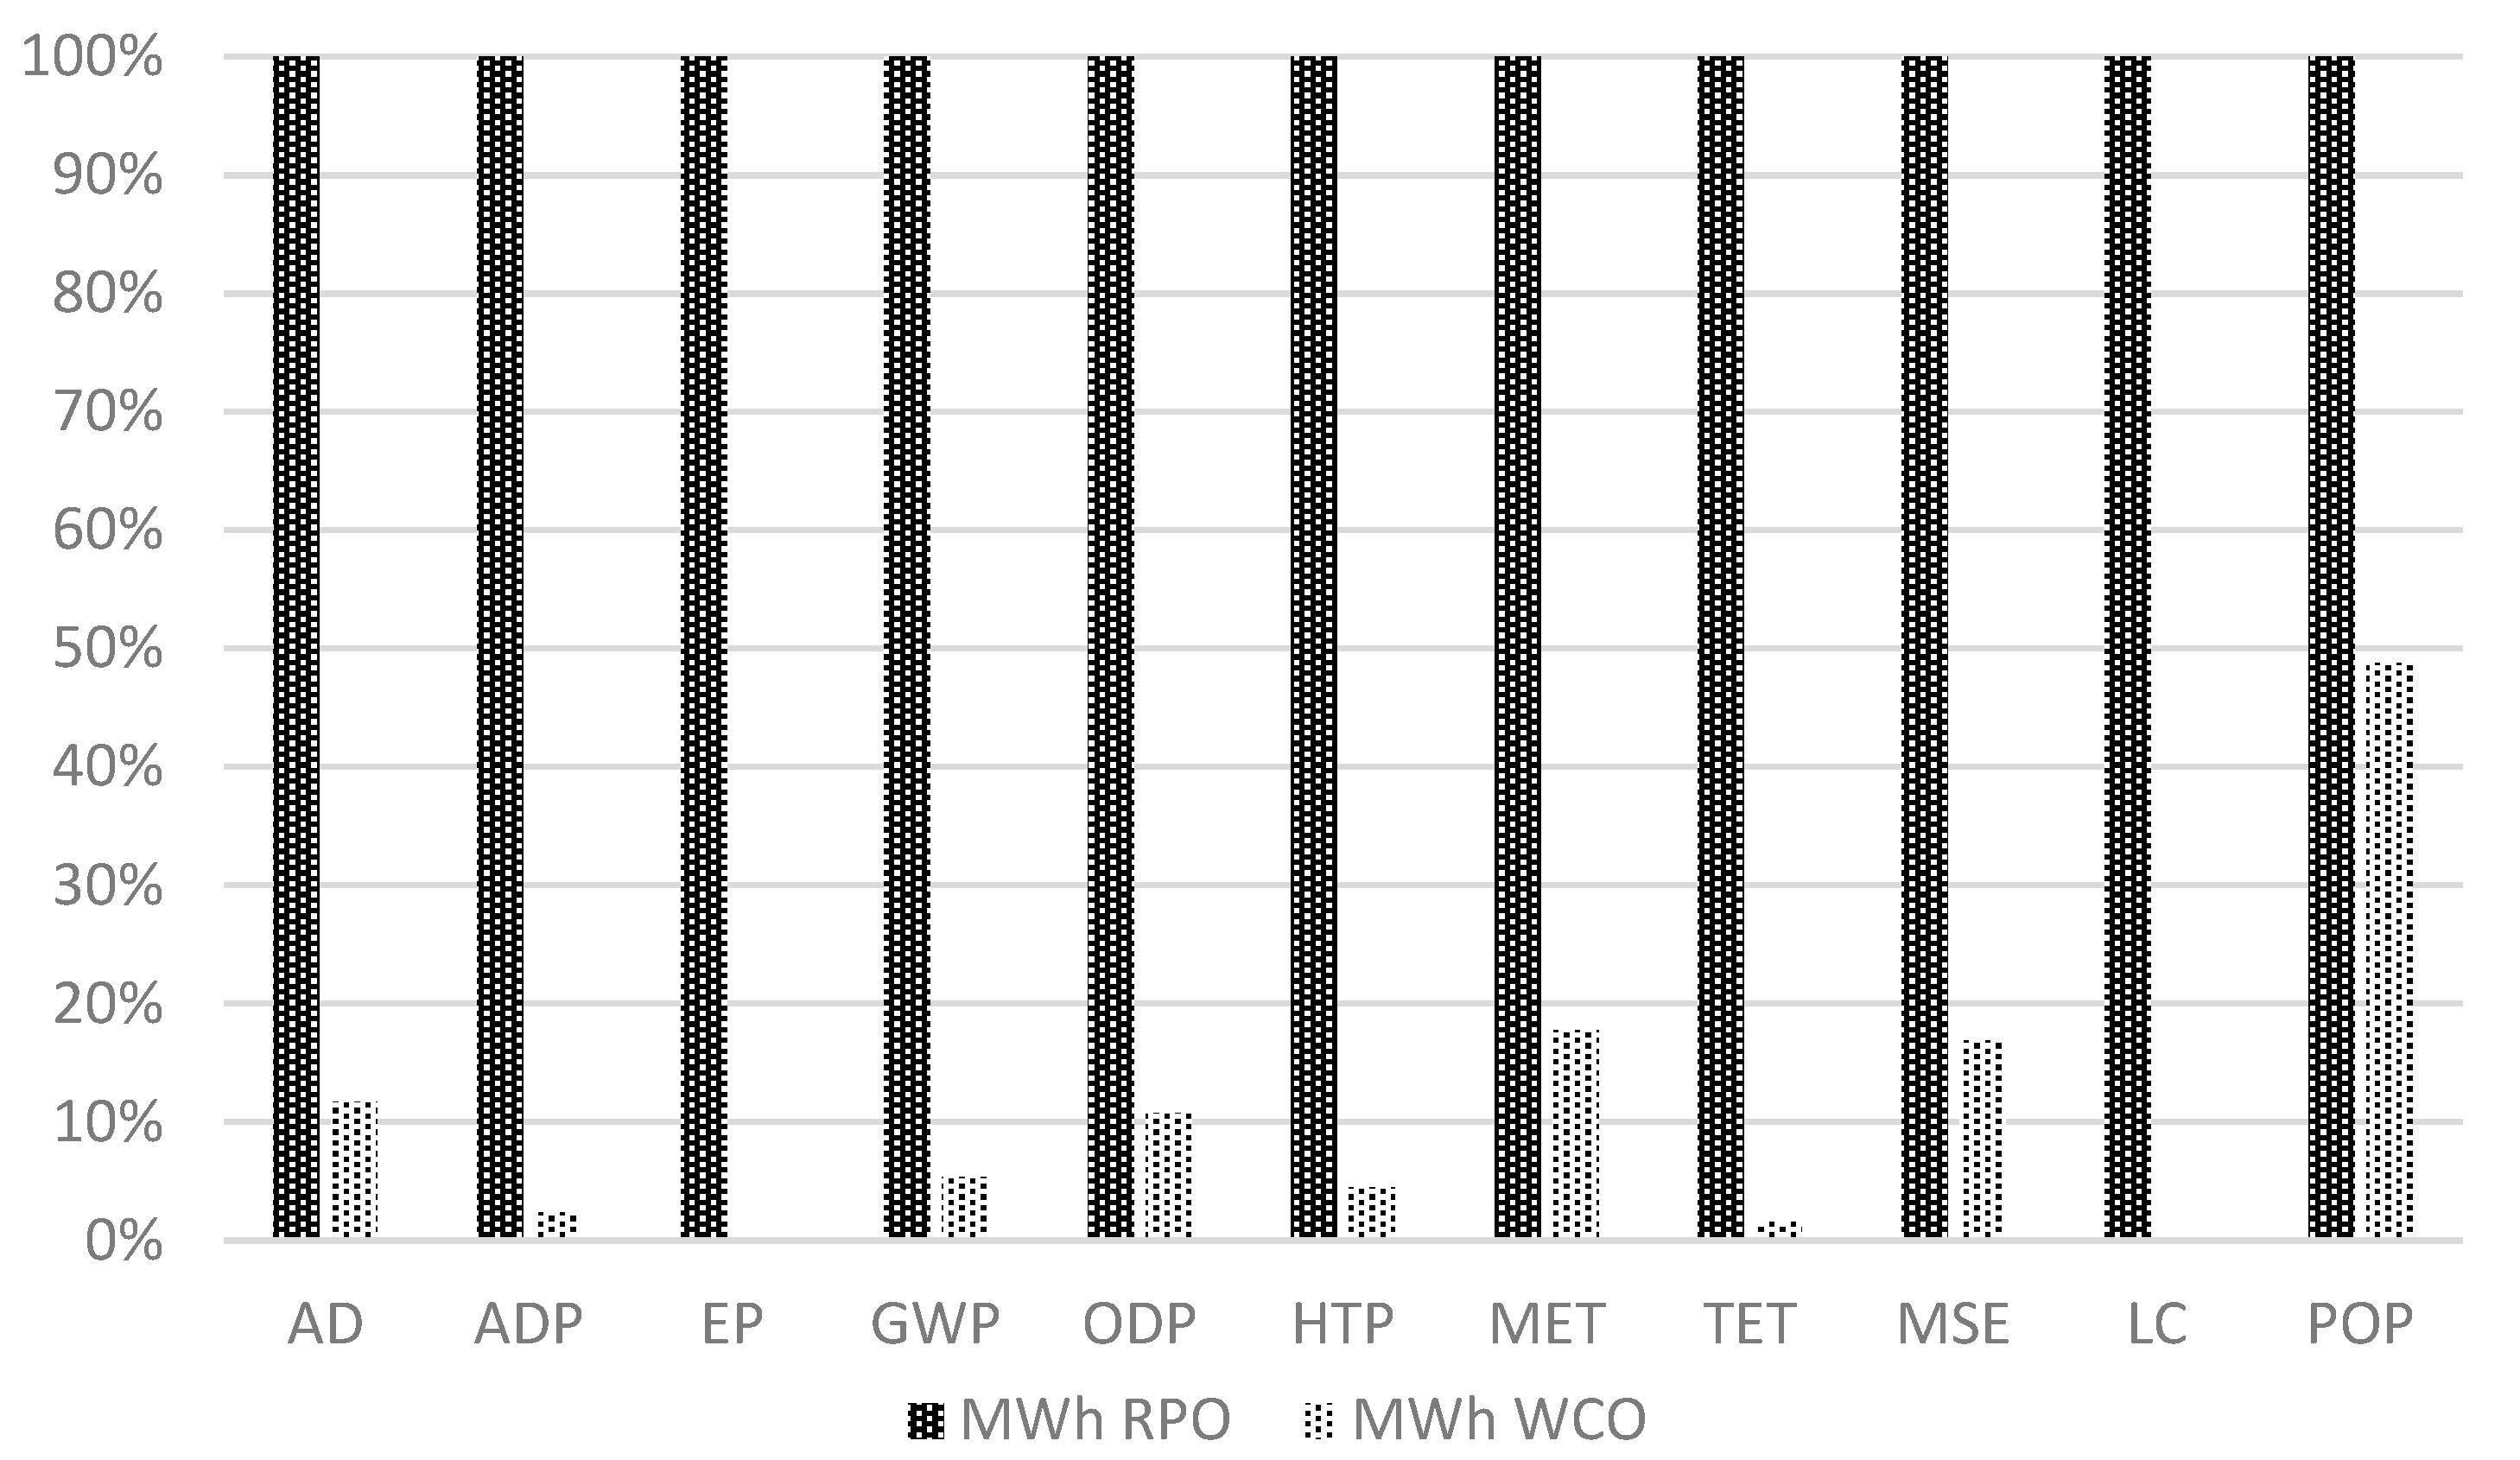
According to the results, straight RPO-based electricity production accounts for a higher environmental footprint when compared to WCO in all impact categories, as presented in Figure 7.
The impact category results presented in Table 11 are coherent in magnitude with similar studies developed for Jatropha curcas-based electricity generation [27].
As mentioned, the main strength of this study is the presentation of a full-chain LCA for both feedstocks to provide inputs to decision-makers when analyzing bioenergy options for islands, and the provision of firsthand measurement data from combustion emissions.
In terms of limitations, we must mention that although the selected agricultural production area represents the average production conditions of palm oil in Ecuador, a bigger sample including other producer provinces and other land-use changes could increase the representativeness of the FFB production system in the country.
Regarding emissions testing and electricity generation yield, our results are in good agreement with the literature [36,97,107]; nevertheless, we observed some contradicting conclusions reported in other studies [108,109]. It is possible to get contradicting results in emissions studies because they are dependent on many variables, such as different physical conditions, experimental atmospheres, test equipment, and, especially, the combustion chamber. In this regard, one of the main weaknesses of this study is that the emissions test was performed in a 10 kW–200 rpm engine; this could result in lower efficiency and higher emissions. In addition, it is very difficult to predict the chemical composition of WCO as it is dependent on many factors like temperature, exposure to air, and cooked food composition, among others [110]. These variables can impact the performance of the final material when combusted. Another important limitation of the study is the limited number of emission measurements performed in conditions other than those of Floreana Island’s electricity generation group.
Regarding the LCA data and results, as mentioned, most of the existing studies analyzed transesterified fuels, which made result comparisons difficult as our study relied on straight use. Nevertheless, the calculated environmental burden reduction from WCO usage is still consistent with the literature [37,48]. According to our results, RPO is the main contributor to GWP with 305 kg CO2 eq, from which around 40% is CH4 derived from wastewater produced during the production of crude palm oil. Palm Oil Mill Effluent (POME) is an underutilized liquid waste stream from palm oil mills which is generated during the palm oil extraction/decanting process and is often seen as a serious environmental issue. Nevertheless, POME could be used as a good biomethane source, which can also be used for energy production. Promising research has addressed the potential of POME to generate biohydrogen and biomethane (or a mixture of these: biohythane) for energy purposes [111]. These alternative POME utilizations could dramatically reduce the GHG footprint during the production phase. The second-largest GHG emission source identified in this study is transport (marine and road), accounting for 61 kg CO2 eq; it is important to mention that this footprint could be reduced if agricultural production areas are located closer to refining facilities and to marine ports.
In addition, N2O contributes 42 kg CO2 eq; this GHG is commonly derived from the use of nitrogen-based fertilization and was estimated as a function of applied N, as mentioned. It is important to mention that by-products of palm oil production can also be used for fertilization: the use of 300 kg of empty FFB could be equivalent to 4.8 kg of potassium chloride (KCL), 0.25 kg diammonium hydrogen phosphate (DAP), and 10 g of borate per plant [112].
In the case of WCO, the higher contributor to GWP (91% of the total) is the use of electricity from the Galápagos electricity grid which, as mentioned, is heavily reliant on fossil fuels. This footprint could be reduced if more renewable energy is integrated into the system. The second GHG source is road and marine transportation.
Regarding RPO-based electricity acidification potential, the main contributor with 1.6 kg SO2 eq is ammonia emissions derived from N fertilizer application during the agricultural production of FFB. Thus, it is important to stress the environmental benefits related to the reduction of chemical nitrogenated fertilization. The second contributor, with 20%, is NOx emission derived from the use of fossil fuels in transport and energy generation during the production process. Regarding WCO-based electricity, the main source of acidification in this study came from SO2 and NOx from the combustion of fossil fuels during electricity generation in the Galápagos grid; these impacts are relevant in sensible ecosystems such as islands. According to Glynn (2018) [113], if CO2 emissions are not reduced, ocean warming and acidification are projected to drastically reduce or eliminate coral reefs from the Galápagos between the years of 2026 and 2035.
In RPO electricity production, chemical oxygen demand (COD) contributes 62% of the total eutrophication potential (PO4 eq); this process is linked to the high amount of oxidizable pollutants found in the wastewater from the extraction phase. In terms of abiotic depletion (ADP), 56% of the total antimony (Sb) equivalent is attributed to the use of fossil fuels in RPO production, including fuels used for input production and materials.
Considering the rich and sensible marine ecosystem of the Galápagos, the main contributor to marine ecotoxicity is wastewater from WCO cleaning with 80.6 1,4 Dichlorobenzene equivalent (1,4–DB eq). In this regard, adequate final disposal of the wastewater in this process is crucial to reducing this environmental impact.
Some of the unanswered questions and future research derived from this study are to (i) study the willingness of business owners to provide WCO in Galápagos or other islands; (ii) conduct emissions testing in conditions similar to those of the electric group located on Floreana Island; (iii) analyze the environmental impacts of WCO disposed in the sewage system in Galápagos; (iv) determine the impact of the potential energy usage of other by-products not exploited in the production cycle, such as palm kernel residues and sludges from the extraction phase; and (v) analyze the land-use change impact of productive zones with high carbon content, such as the Amazonian region.

7. Conclusions

The results of this study indicate that a system based on locally generated waste such as WCO is a superior alternative to continental RPO in environmental terms. This is mostly associated with the fact that WCO is a waste material which does not have environmental or resource impacts associated with its production and processing. The life cycle of RPO includes agricultural production, industrial processing, and transport. In addition, fewer resources are used in the in situ processing and transport of WCO compared to RPO.
Both feedstocks, RPO and WCO, independent of their production impacts, meet the conditions for being used as an energy source for non-variable electricity generation on islands. The experience of Galápagos with the direct use of vegetable oils provides valid evidence for the use of non-transesterified oleaginous feedstocks for electricity generation which can be extrapolated to other islands.
Nevertheless, further analysis should be performed to understand the flows and the current and future availability of WCO on any island that considers this as an option. It is also important to study in more detail the impacts of incorrect WCO disposal in fragile ecosystems such as islands.
Regarding RPO, it is important to include impacts related to land-use change in agricultural productive zones where deforestation is an issue.
Finally, the electricity production test shows that WCO has higher electricity yield when compared to RPO. This can be associated with the partial hydrogenation that oils suffer during the cooking process due to their contact with water at high temperatures.

Author Contributions

Conceptualization, C.R.P., L.M.N.-G. and A.D.R.; Methodology, C.R.P., A.C.-G., L.M.N.-G. and A.D.R.; Software Validation, A.C.-G. and A.D.R.; Formal analysis, L.M.N.-G.; Investigation, C.R.P., A.D.R., A.C.-G., L.M.N.-G., R.A.N.C., D.R. (Darío Rodríguez) and D.R. (Daniel Rivadeneira); Resources, L.M.N.-G.; Writing—original draft preparation, C.R.P.; Writing—review and editing, A.D.R., A.C.-G. and L.M.N.-G.; Visualization, C.R.P.; Supervision, A.C.-G. and A.D.R.; Project administration, L.M.N.-G. and A.D.R. All authors have read and agreed to the published version of the manuscript.

Funding

This research received no external funding.

Acknowledgments

L.M.N.-G. would like to thank the Ministry of Science, Innovation and Universities, Spain, for the “Estancias de Movilidad de Profesores e Investigadores en Centros Extranjeros de Enseñanza Superior e Investigación.” grant program. C.R.P would like to thank to Instituto de Investigación Geológico y Energético (IIGE) of Ecuador.

Conflicts of Interest

The authors declare no conflict of interest. The funders had no role in the design of the study; in the collection, analyses, or interpretation of data; in the writing of the manuscript, and in the decision to publish the results.

References

  1. Ochs, A.; Konold, M.; Auth, K.; Musolino, E.; Killeen, P. Caribbean Sustainable Energy Roadmap and Strategy; WorldwatchInstitute: Washington, DC, USA, 2015; Volume 1. [Google Scholar]
  2. Mcintyre, A.; El-ashram, A.; Ronci, M.; Reynaud, J.; Che, N.; Wang, K.; Acevedo, S.; Lutz, M.; Strodel, F.; Osueke, A.; et al. CARIBBEAN ENERGY: MACRO-RELATED CHALLENGES; International Monetary Fund: Washington, DC, USA, 2016. [Google Scholar]
  3. Ioannidis, A.; Chalvatzis, K.J.; Li, X.; Notton, G.; Stephanides, P. The case for islands’ energy vulnerability: Electricity supply diversity in 44 global islands. Renew. Energy 2019, 143, 440–452. [Google Scholar] [CrossRef]
  4. Surroop, D.; Raghoo, P.; Bundhoo, Z.M.A. Comparison of energy systems in Small Island Developing States. Util. Policy 2018, 54, 46–54. [Google Scholar] [CrossRef]
  5. Skarlis, S.; Kondili, E.; Kaldellis, J.K. Small-scale biodiesel production economics: A case study focus on Crete Island. J. Clean. Prod. 2012, 20, 20–26. [Google Scholar] [CrossRef]
  6. Weir, T. Renewable energy in the Pacific Islands: Its role and status. Renew. Sustain. Energy Rev. 2018, 94, 762–771. [Google Scholar] [CrossRef]
  7. Khalil, M.; Berawi, M.A.; Heryanto, R.; Rizalie, A. Waste to energy technology: The potential of sustainable biogas production from animal waste in Indonesia. Renew. Sustain. Energy Rev. 2019, 105, 323–331. [Google Scholar] [CrossRef]
  8. Lu, Y.J.; Tsai, M.J.; Chang, F.C. Forest Waste Derived Fuel with Waste Cooking Oil. Energy Procedia 2017, 105, 1250–1254. [Google Scholar] [CrossRef]
  9. Ramos-Suárez, J.L.; Ritter, A.; Mata González, J.; Camacho Pérez, A. Biogas from animal manure: A sustainable energy opportunity in the Canary Islands. Renew. Sustain. Energy Rev. 2019, 104, 137–150. [Google Scholar] [CrossRef]
  10. Pääkkönen, A.; Joronen, T. Revisiting the feasibility of biomass-fueled CHP in future energy systems—Case study of the Åland Islands. Energy Convers. Manag. 2019, 188, 66–75. [Google Scholar] [CrossRef]
  11. Sagani, A.; Hagidimitriou, M.; Dedoussis, V. Perennial tree pruning biomass waste exploitation for electricity generation: The perspective of Greece. Sustain. Energy Technol. Assessments 2019, 31, 77–85. [Google Scholar] [CrossRef]
  12. Gaibor-Chávez, J.; Pérez-Pacheco, S.; Velázquez-Martí, B.; Niño-Ruiz, Z. Dendrometric characterization of corn cane residues and drying models in natural conditions in Bolivar Province (Ecuador). Renew. Energy 2016, 86, 745–750. [Google Scholar] [CrossRef]
  13. Pérez-Arévalo, J.J.; Velázquez-Martí, B. Biomass and Bioenergy Evaluation of pruning residues of Ficus benjamina as a primary biofuel material. Biomass Bioenergy 2018, 108, 217–223. [Google Scholar] [CrossRef]
  14. Velazquez-Martí, B.; Gaibor-Chazvez, J.; Nino-Ruiz, Z.; Narbona-Sahuquillo, S. Complete characterization of pruning waste from the lechero tree (Euphorbia laurifolia L.) as raw material for biofuel. Renew. Engry 2018, 129. [Google Scholar] [CrossRef]
  15. López-Villada, J.; Narváez, R.A.; Ramírez, V.; Chulde, D.; Espinoza, S. Microwave Pyrolysis Process Potential of Waste Jatropha Curcas Seed Cake. Renew. Energy Serv. Mank. 2015, 1. [Google Scholar] [CrossRef]
  16. Mun, L.A.; Graefe, S.; Dufour, D.; Gonzalez, A.; Mora, P.; Solı, H. Energy and carbon footprints of ethanol production using banana and cooking banana discard: A case study from Costa Rica and Ecuador. Biomass Bioenergy 2011, 35. [Google Scholar] [CrossRef]
  17. Velazquez-Marti, B.; Pérez-Pacheco, S.; Gaibor-Chávez, J.; Wilcaso, P. Modeling of Production and Quality of Bioethanol Dissolved Sugars Measurements. Energies 2016, 9, 319. [Google Scholar] [CrossRef] [Green Version]
  18. Garcia, J.C.; Machimura, M.T.; Matsui, T. Optimizing Plant Allocation for Bioethanol Production from Agro-residues Considering CO2 Emission and Energy Demand – Supply Balance: A Case Study in Ecuador. Waste Biomass Valoriz. 2012, 435–442. [Google Scholar] [CrossRef]
  19. Gaibor, J.; Zulay, C.; Ruiz, N.; Velázquez, B.; Araceli, M.; Quintana, L. Viability of Biogas Production and Determination of Bacterial Kinetics in Anaerobic Co-digestion of Cabbage Waste and Livestock Manure. Waste Biomass Valoriz. 2019, 10, 2129–2137. [Google Scholar] [CrossRef]
  20. Vanuatu Energy Dept. Vanuatu Department of Energy. Available online: https://doe.gov.vu/doedb/index.php/electricity/ (accessed on 8 August 2019).
  21. Cloin, J. Coconut Oil Biofuel – Clean and Competitive Standard Compression Engine. In Proceedings of the PPA Annual Conference; SOPAC: Port Vila, Vanuatu, 2005; pp. 1–6. [Google Scholar]
  22. Ho, S.H.; Wong, Y.D.; Chang, V.W.C. Evaluating the potential of biodiesel (via recycled cooking oil) use in Singapore, an urban city. Resour. Conserv. Recycl. 2014, 91, 117–124. [Google Scholar] [CrossRef]
  23. Kumaran, P.; Mazlini, N.; Hussein, I.; Nazrain, M.; Khairul, M. Technical feasibility studies for Langkawi WCO (waste cooking oil) derived-biodiesel. Energy 2011, 36, 1386–1393. [Google Scholar] [CrossRef]
  24. Ubando, A.; Rivera, D.R.T.; Chen, W.; Culaba, A.B. A comprehensive review of life cycle assessment (LCA) of microalgal and lignocellulosic bioenergy products from thermochemical processes. Bioresour. Technol. 2019, 291, 121837. [Google Scholar] [CrossRef]
  25. Cherubini, F.; Bird, N.D.; Cowie, A.; Jungmeier, G.; Schlamadinger, B.; Woess-gallasch, S. Energy- and greenhouse gas-based LCA of biofuel and bioenergy systems: Key issues, ranges and recommendations. Resour. Conserv. Recycl. 2009, 53, 434–447. [Google Scholar] [CrossRef]
  26. Muench, S.; Guenther, E. A systematic review of bioenergy life cycle assessments. Appl. Energy 2013, 112, 257–273. [Google Scholar] [CrossRef]
  27. Muñoz, M.; Herrera, I.; Lechón, Y.; Caldés, N.; Iglesias, E. Environmental Assessment of Electricity Based on Straight Jatropha Oil on Floreana Island, Ecuador. BioEnergy Res. 2018, 11, 123–138. [Google Scholar] [CrossRef]
  28. Varanda, M.G.; Pinto, G.; Martins, F. Life cycle analysis of biodiesel production. Fuel Process. Technol. 2011, 92, 1087–1094. [Google Scholar] [CrossRef] [Green Version]
  29. Intarapong, P.; Papong, S.; Malakul, P. Comparative life cycle assessment of diesel production from crude palm oil and waste cooking oil via pyrolysis. Energy Res. 2015, 40, 34–35. [Google Scholar] [CrossRef]
  30. Lombardi, L.; Mendecka, B.; Carnevale, E. Comparative life cycle assessment of alternative strategies for energy recovery from used cooking oil. J. Environ. Manag. 2018, 216, 235–245. [Google Scholar] [CrossRef]
  31. Upham, P.; Thornley, P.; Tomei, J.; Boucher, P. Substitutable biodiesel feedstocks for the UK: A review of sustainability issues with reference to the UK RTFO. J. Clean. Prod. 2009, 17, S37–S45. [Google Scholar] [CrossRef]
  32. Tsoutsos, T.D.; Tournaki, S.; Paraíba, O.; Kaminaris, S.D. The Used Cooking Oil-to-biodiesel chain in Europe assessment of best practices and environmental performance. Renew. Sustain. Energy Rev. 2016, 54, 74–83. [Google Scholar] [CrossRef]
  33. Yesilyurt, M.K. The effects of the fuel injection pressure on the performance and emission characteristics of a diesel engine fuelled with waste cooking oil biodiesel-diesel blends. Renew. Energy 2019, 132, 649–666. [Google Scholar] [CrossRef]
  34. Gao, Y.; Chen, Y.; Gu, J.; Xin, Z.; Sun, S. Butyl-biodiesel production from waste cooking oil: Kinetics, fuel properties and emission performance. Fuel 2019, 236, 1489–1495. [Google Scholar] [CrossRef]
  35. Capuano, D.; Costa, M.; Di Fraia, S.; Massarotti, N.; Vanoli, L. Direct use of waste vegetable oil in internal combustion engines. Renew. Sustain. Energy Rev. 2017, 69, 759–770. [Google Scholar] [CrossRef]
  36. Alessandro, B.D.; Bidini, G.; Zampilli, M.; Laranci, P.; Bartocci, P.; Fantozzi, F. Straight and waste vegetable oil in engines: Review and experimental measurement of emissions, fuel consumption and injector fouling on a turbocharged commercial engine. Fuel 2016, 182, 198–209. [Google Scholar] [CrossRef]
  37. Ripa, M.; Buonaurio, C.; Mellino, S.; Fiorentino, G.; Ulgiati, S. Recycling waste cooking oil into biodiesel: A life cycle assessment. Int. J. Performability Eng. 2014, 10, 347–356. [Google Scholar] [CrossRef]
  38. Ellen MacArthur Foundation Circularity Indicators: An Approach to Measuring Circularity - project overview. Ellen MacArthur Found. 2015, 1–12. [CrossRef]
  39. Caneghem, J.V.; Acker, K.V.; Greef, J.D.; Wauters, G.; Vandecasteele, C. Waste - to - energy is compatible and complementary with recycling in the circular economy. Clean Technol. Environ. Policy 2019, 21, 925–939. [Google Scholar] [CrossRef]
  40. INER. Balance Energético de la Provincia de Galápagos 2015; INER: Quito, Ecuador, 2016. [Google Scholar]
  41. Noboa, E.; Upham, P.; Heinrichs, H. Collaborative energy visioning under conditions of illiberal democracy: Results and recommendations from Ecuador. Energy. Sustain. Soc. 2018, 8. [Google Scholar] [CrossRef]
  42. PNUD ENERGÍA VERDE PARA GALÁPAGOS. Available online: https://www.undp.org/content/dam/ecuador/docs/documentos proyectos ambiente/pnud_ec REVISTA ENERGIA VERDE PARA GALAPAGOS-ilovepdf-compressed.pdf (accessed on 6 May 2017).
  43. Demirbaş, A. Biodegradability of Biodiesel and Petrodiesel Fuels. Energy Sources 2009, 31, 169–174. [Google Scholar] [CrossRef]
  44. KAYMANTA Consulting. LINEA BASE ECONOMICA SOCIAL Y PRODUCTIVA DE LA ISLA FLOREANA; KAYMANTA Consulting: Quito, Ecuador, 2017. [Google Scholar]
  45. INER. Proyecto de Substitución de Diesel por Biodiesel en Galápagos; INER: Quito, Ecuador, 2017. [Google Scholar]
  46. Internationale International Standard ISO 14040. Available online: https://www.iso.org/standard/37456.html (accessed on 8 December 2018).
  47. Guðmundur, B.; Friðriksson, L.; Johnsen, T.; Helga, J.; Bjarnadóttir, L.; Sletnes, H. Guidelines for the Use of LCA in the Waste Management Sector; Nordtest: Amsterdan, The Netherland, 2002. [Google Scholar]
  48. Ozata, I.; Ciliz, N.; Mammadov, A. Comparative Life Cycle Assessment Approach for Sustainable Transport Fuel Production from Waste Cooking Oil and Rapeseed. Available online: https://gin.confex.com/gin/2009/webprogram/Manuscript/Paper2602/Ilker paper 11.05.2009.pdf (accessed on 5 September 2018).
  49. TESTO Portable Emission Analysis. Available online: http://www.testo350.com/testo-350/350-overview.html (accessed on 3 April 2018).
  50. ARC ARC, Aceite Usado de Cocina. Available online: https://www.arc.ec/ (accessed on 2 February 2018).
  51. Guinée, J.B.; Heijungs, R.; Huppes, G.; Kleijn, R.; de Koning, A.; van Oers, L.; Wegener Sleeswijk, A.; Suh, S.; Udo de Haes, H.A.; de Bruijn, H.; et al. Life Cycle Assessment: An Operational Guide to the ISO Standards. Netherlands Minist. Housing Spat. Plan. Environ. 2001, 692. [Google Scholar] [CrossRef]
  52. Souza, O.; Márcia, V.; Pasa, D.; Rodrigues, C.; Belchior, P.; Ricardo, J. Science of the Total Environment Exhaust emissions from a diesel power generator fuelled by waste cooking oil biodiesel. Sci. Total Environ. 2012, 431, 57–61. [Google Scholar] [CrossRef]
  53. Eismark, J.; Christensen, M.; Andersson, M.; Karlsson, A.; Denbratt, I. Role of fuel properties and piston shape in in fl uencing soot oxidation in heavy-duty low swirl diesel engine combustion. Fuel 2019, 254, 115568. [Google Scholar] [CrossRef]
  54. Mat, S.C.; Idroas, M.Y.; Teoh, Y.H.; Hamid, M.F. Assessment of basic properties and thermal analysis of hybrid biofuel blend. Energy Sources 2018, 41, 2073–2082. [Google Scholar] [CrossRef]
  55. Hazar, H.; Sevinc, H.; Sap, S. Performance and emission properties of preheated and blended fennel vegetable oil in a coated diesel engine. Fuel 2019, 254, 115677. [Google Scholar] [CrossRef]
  56. Chuah, L.F.; Klemeš, J.J.; Yusup, S.; Bokhari, A.; Akbar, M.M. Influence of fatty acids in waste cooking oil for cleaner biodiesel. Clean Technol. Environ. Policy 2016, 19, 859–868. [Google Scholar] [CrossRef]
  57. Neves, C.; Tarelho, L.A.C.; Nunes, M.I.; Vargas, E.M. Solid catalysts obtained from wastes for FAME production using mixtures of re fi ned palm oil and waste cooking oils. Renew. Energy 2019, 136. [Google Scholar] [CrossRef]
  58. Bazmi, A.A.; Zahedi, G.; Hashim, H. Progress and challenges in utilization of palm oil biomass as fuel for decentralized electricity generation. Renew. Sustain. Energy Rev. 2011, 15, 574–583. [Google Scholar] [CrossRef]
  59. Loh, S.K. The potential of the Malaysian oil palm biomass as a renewable energy source. Energy Convers. Manag. 2017, 141, 285–298. [Google Scholar] [CrossRef]
  60. Ali, R.; Daut, I.; Taib, S. A review on existing and future energy sources for electrical power generation in Malaysia. Renew. Sustain. Energy Rev. 2012, 16, 4047–4055. [Google Scholar] [CrossRef]
  61. FAO FAOSTAT. Food and Agriculture Organizatio of United Nations. Available online: http://www.fao.org (accessed on 8 March 2019).
  62. Ecuadorian Ministry of Foreign Trade. Informe Sobre El Sector Palmicultor Ecuatoriano; Ecuadorian Ministry of Foreign Trade: Quito, Ecuador, 2017.
  63. FEDEPAL CENSO NACIONAL PALMERO 2017- ECUADOR. Available online: http://fedapal.org/web2017/index.php/estadisticas/nacionales (accessed on 2 August 2018).
  64. INIAP. Manual del Cultivo de la Palma Aceitera, 1st ed.; Dominguez, J.M., Murillo, I., Delgado, J.C., Zambrano, J.L., Jimenez, J., Eds.; INIAP: Santo Domingo de los Tsachilas, Ecuador, 2015. [Google Scholar]
  65. Potter, L.P. La Industria Del Aceite De Palma En Ecuador: ¿Un Buen Negocio Para Los Pequeños Agricultores? Eutopía Rev. Desarro. Económico Territ. 2014, 39–54. [Google Scholar] [CrossRef] [Green Version]
  66. IPCC Chapter 11: N2O Emissions from Managed Soils, and CO2 Emissions from Lime and Urea Application. Available online: http://www.ipcc-nggip.iges.or.jp/public/2006gl/pdf/4_Volume4/V4_11_Ch11_N2O&CO2.pdf (accessed on 4 September 2017).
  67. Schmidt, J.H. Life Cycle Inventory of Rapeseed Oil and Palm Oil: Ph.D. Thesis, Part 3; Aalborg University: Aalborg, Denmark, 2007; p. 276. [Google Scholar] [CrossRef]
  68. Asman, W.A.H. Ammonia Emissions in Europe: Updated Emission and Emission Variations; Directorate-General of the Enviormental: Roskilde, Danmark, 1992. [Google Scholar]
  69. Audsley, E.; Alber, S.; Weidema, B. Harmonisation of Environmental Life Cycle Assessment for Agriculture; European Commission: London, UK, 1997. [Google Scholar]
  70. Canals, L.M. i Contributions to LCA Methodology for Agricultural Systems; Universidad Autonoma de Barcelona: Barcelona, Spain, 2003. [Google Scholar]
  71. Dijkman, T.J.; Birkved, M.; Hauschild, M.Z. PestLCI 2.0: A second generation model for estimating emissions of pesticides from arable land in LCA. Int. J. Life Cycle Assess. 2012, 17, 973–986. [Google Scholar] [CrossRef]
  72. Nemecek, T.; Schnetzer, J. Methods of Assessment of Direct Field Emissions for LCIs of Agricultural Production Systems; Agroscope Reckenholz-Tänikon Research Station ART: Zurich, Switzerland, 2011. [Google Scholar]
  73. Richner, W.; Oberholzer, H.R.; Knuchel, F.; Huguenin-Elie, O.; Ott, S.; Walther, U. Modell zur Beurteilung der Nitratauswaschung in Ökobilanzen – SALCA-NO3. Agroscope Sci. 2014, 5, 1–28. [Google Scholar]
  74. Prasuhn, V. Erfassung der PO4-Austräge für die Ökobilanzierung - SALCA-Phosphor; Zürich-Reckenholz: Zürich, Swizerland, 2006. [Google Scholar]
  75. Wernet, G.; Bauer, C.; Steubing, B.; Reinhard, J.; Moreno-Ruiz, E.; Weidema, B. The ecoinvent database version 3 (part I): Overview and methodology. Int. J. Life Cycle Assess. 2016, 21, 1218–1230. [Google Scholar] [CrossRef]
  76. Hosseini, S.E.; Wahid, M.A. Pollutant in palm oil production process. J. Air Waste Manag. Assoc. 2015, 65, 773–781. [Google Scholar] [CrossRef] [PubMed]
  77. Jungbluth, N.; Chudacoff, M.; Dauriat, A.; Dinkel, F.; Doke, G.; Faist Emmenegger, M.; Gnansounou, E.; Kljun, N.; Schleiss, K.; Spielmann, M.; et al. Life cycle inventories of bioenergy. Final Rep. Ecoinvent 2007, 143–157. [Google Scholar]
  78. Ramirez, A.D.; Rivela, B.; Boero, A.; Melendres, A.M. Lights and shadows of the environmental impacts of fossil-based electricity generation technologies: A contribution based on the Ecuadorian experience. Energy Policy 2019, 125, 467–477. [Google Scholar] [CrossRef]
  79. Tsai, W.-T. Mandatory Recycling of Waste Cooking Oil from Residential and Commercial Sectors in Taiwan. Resources 2019, 8, 38. [Google Scholar] [CrossRef] [Green Version]
  80. Envirowise; RH Environmental Limited. Guide Better Management of Fats, Oils and Greases in the Catering Sector; Envirowise: Dublin, Ireland, 2008. [Google Scholar]
  81. Kalam, M.A.; Masjuki, H.H. Emissions and deposit characteristics of a small diesel engine when operated on preheated crude palm oil. Biomass Bioenergy 2004, 27, 289–297. [Google Scholar] [CrossRef]
  82. Spin off Accademico SEA Tuscia. Cost-Benefit on the Direct Collection of Exhausted Oil; University of Tuscia: Viterbo, Italy, 2010. [Google Scholar]
  83. Toop, G.; Alberici, S.; Spoettle, M.; Steen, H.v.; Weddige, U. Trends in the UCO Market; ECOFYS UK Ltd.: London, UK, 2014. [Google Scholar]
  84. Dovì, V.; Friedler, F.; Huisingh, D.; Klemeš, J. Cleaner Energy for Sustainable Future. J. Clean. Prod. 2009, 17, 889–895. [Google Scholar] [CrossRef]
  85. Caldeira, C.; Quinteiro, P.; Castanheira, E.; Boulay, A.M.; Dias, A.C.; Arroja, L.; Freire, F. Water footprint profile of crop-based vegetable oils and waste cooking oil: Comparing two water scarcity footprint methods. J. Clean. Prod. 2018, 195, 1190–1202. [Google Scholar] [CrossRef]
  86. Madrigal, A. GARAGE INVENTION TURNS RESTAURANTS INTO POWER PLANTS. Available online: https://www.wired.com/2009/01/vegawatt/ (accessed on 4 February 2019).
  87. Uy, D.V.; An, N.D.; Nam, T.T. Introduction to a Fuel Continuous Mixer for Marine Diesel Engines’ Application. J. Ship. Ocean Eng. 2015, 5, 159–165. [Google Scholar] [CrossRef] [Green Version]
  88. Babu, A.K.; Devaradjane, G. Vegetable oils and their derivatives as fuels for CI engines: An overview. In Proceedings of the SAE 2003 World Congress & Exhibition; SAE International: Detroit, MI, USA, 2003; p. 14. [Google Scholar]
  89. Girard, P.; Fallot, A. Review of existing and emerging technologies for the production of biofuels in developing countries. Energy Sustain. Dev. 2006, 10, 92–108. [Google Scholar] [CrossRef]
  90. Sangeeta, S.M.; Pande, M.; Rani, M.; Gakhar, R.; Sharma, M.; Rani, J.; Bhaskarwar, A.N. Alternative fuels: An overview of current trends and scope for future. Renew. Sustain. Energy Rev. 2014, 32, 697–712. [Google Scholar] [CrossRef]
  91. Bari, S.; Lim, T.H.; Yu, C.W. Effects of preheating of crude palm oil (CPO) on injection system, performance and emission of a diesel engine. Renew. Energy 2002, 27, 339–351. [Google Scholar] [CrossRef]
  92. Cheenkachorn, K.; Udornthep, I. A Development of Four-stroke Engine Oil Using Palm Oil as a Base Stock. In Proceedings of the International Conference on “Sustainable Energy and Environment”, Bangkok, Thailand, 8–30 November 2006; Volume 026, pp. 24–27. [Google Scholar]
  93. Basinger, M.; Reding, T.; Williams, C.; Lackner, K.S.; Modi, V. Compression ignition engine modifications for straight plant oil fueling in remote contexts: Modification design and short-run testing. Fuel 2010, 89, 2925–2938. [Google Scholar] [CrossRef]
  94. Borugadda, V.B.; Goud, V.V. Physicochemical and Rheological Characterization of Waste Cooking Oil Epoxide and Their Blends. Waste Biomass Valoriz. 2016, 7, 23–30. [Google Scholar] [CrossRef]
  95. Kumari, R.; Nirmala, N.; Joshi, C.; Dawn, S.S. Calorific Value Measurements and Optimization of Waste Cooking Oil Bio-Diesel, Crude Plastic Oil and Their Blends for the Synthesis of Low Cost High Energy Fuels. Natl. J. Chembiosis 2014, 5, 17–21. [Google Scholar]
  96. Alptekin, E.; Canakci, M. Characterization of the key fuel properties of methyl ester-diesel fuel blends. Fuel 2009, 88, 75–80. [Google Scholar] [CrossRef]
  97. Almeida, S.D.; Rodrigues, C.; Nascimento, M.V.G.; Vieira, L.d.S.R.; Fleury, G. Performance of a diesel generator fuelled with palm oil [Fuel 81 (2003) 2097–2102]. Fuel 2004, 83, 1113. [Google Scholar] [CrossRef]
  98. Sharon, H.; Jai Shiva Ram, P.; Jenis Fernando, K.; Murali, S.; Muthusamy, R. Fueling a stationary direct injection diesel engine with diesel-used palm oil-butanol blends - An experimental study. Energy Convers. Manag. 2013, 73, 95–105. [Google Scholar] [CrossRef]
  99. OLADE Sistema de Información Energética de Latinoamerica y El Caribe. Available online: http://sier.olade.org (accessed on 8 April 2019).
  100. FAO. OECD-FAO Agricultural Outlook, 2014–2023; FAO: Roma, Italy, 2015; Volume 52, ISBN 9789264231900. [Google Scholar]
  101. Sheinbaum Pardo, C.; Calderón Irazoque, A.; Ramírez Suárez, M. Potential of biodiesel from waste cooking oil inMexico. Biomass Bioenergy 2013, 56, 230–238. [Google Scholar] [CrossRef]
  102. INEC. Análisis de Resultados Definitivos Censo de Población y Vivienda Galápagos 2015; INEC: Quito, Ecuador, 2015. [Google Scholar]
  103. MAE. Informe Anual 2017, Visitantes a las Áreas Protegidas de Galápagos; MAE: Quito, Ecuador, 2017. [Google Scholar]
  104. OECD; FAO. OECD-FAO Agricultural Outlook 2016–2025: Special Focus on Sub-Sharan Africa; OECD: Paris, France, 2016. [Google Scholar]
  105. Montes, N.; Millar, I.; Provoste, R.; Martínez, N.; Fernández, D.; Morales, G. Absorción de aceite en alimentos fritos. Rev. Chil. Nutr. 2016, 43, 87–91. [Google Scholar] [CrossRef] [Green Version]
  106. Filho, S.C.S.; Silva, T.A.F.; Miranda, A.C.; Fernandes, M.P.B.; Felício, H.H.; Calarge, F.A.; Santana, J.C.C.; Tambourgi, E.B. The Potential of Biodiesel Production from Frying Oil Used in the Restaurants of São Paulo city, Brazil. Chem. Eng. Trans. 2014, 37, 577–582. [Google Scholar] [CrossRef]
  107. Jeong, G.-T.; Oh, Y.-T.; Park, D.-H. Emission Profile of Rapeseed Methyl Ester and Its Blend in a Diesel Engine. Appl. Biochem. Biotechnol. 2006, 129, 165–178. [Google Scholar] [CrossRef]
  108. Ulusoy, Y.; Yu, A. Investigation of performance and emission characteristics of waste cooking oil as biodiesel in a diesel engine. Petroleum Sci. 2018, 2, 396–404. [Google Scholar] [CrossRef] [Green Version]
  109. Mahfouz, A.; Gad, M.S.; El Fatih, A.; Emara, A. Comparative study of combustion characteristics and exhaust emissions of waste cooking-diesel oil blends. Ain Shams Eng. J. 2018, 9, 3123–3134. [Google Scholar] [CrossRef]
  110. Mannu, A.; Vlahopoulou, G.; Urgeghe, P.; Ferro, M.; Caro, A.D.; Taras, A.; Garroni, S.; Rourke, J.P.; Cabizza, R.; Petretto, G.L. Variation of the Chemical Composition of Waste Cooking Oils upon Bentonite Filtration. Resources 2019, 8, 108. [Google Scholar] [CrossRef] [Green Version]
  111. Zainal, B.S.; Ahmad, M.A.; Danaee, M.; Jamadon, N.; Mohd, N.S.; Ibrahim, S. Integrated System Technology of POME Treatment for Biohydrogen and Biomethane Production in Malaysia. Appl. Sci. 2020, 10, 951. [Google Scholar] [CrossRef] [Green Version]
  112. Ramirez, N.; Silva, A.; Garzón, E. Caracterización y Manejo de Subproductos del Beneficio del Fruto de Palma de Aceite; Centro de Investigación en Palma de Aceite: Bogotá, Colombia, 2011. [Google Scholar]
  113. Glynn, P.W.; Feingold, J.S.; Baker, A.; Banks, S.; Baums, I.B.; Cole, J.; Colgan, M.W.; Fong, P.; Glynn, P.J.; Keith, I.; et al. State of corals and coral reefs of the Galápagos Islands (Ecuador): Past, present and future ☆. Mar. Pollut. Bull. 2018, 133, 717–733. [Google Scholar] [CrossRef]
Figure 1. Refined palm oil (RPO) based electricity system boundaries.
Applsci 10 03806 g001
Figure 2. Waste cooking oil (WCO) based electricity system boundaries.
Applsci 10 03806 g002
Figure 3. (A) WCO received in containers, (B) WCO filtration, (C) Emission testing.
Applsci 10 03806 g003
Figure 4. Collection circuits drafted for Santa Cruz Island: (A) South circuit, (B) North Circuit.
Applsci 10 03806 g004
Figure 5. Contribution analysis per process for RPO-based electricity generation. Abbreviations are presented in Table 11.
Applsci 10 03806 g005
Figure 6. Contribution analysis per process for WCO-based electricity generation. Abbreviations are presented in Table 11.
Applsci 10 03806 g006
Figure 7. Comparison of the characterization results of WCO- vs. RPO-based electricity generation in Galápagos. Abbreviations are presented in Table 11.
Applsci 10 03806 g007
Table 1. Electricity generation by source in Galápagos.
Energy by Source (kWh)Fuel Used Per Island (L)
IslandDieselWindSolarJatrophaTotalDiesel Jatropha Oil
San Cristobal9,924,3343,864,39317,250 13,805,9772,929,824
Santa Cruz27,732,05438,2671,194,922 28,965,2437,532,996
Isabela 4,411,835 4,411,8351,340,016
Floreana208,015 311248,698259,82574,94418,367
Total42,276,2383,902,6601,215,28448,69847,442,87911,877,78018,367
Source: (Ministry of Electricity and Renewable Energy of Ecuador (MEER), 2015).
Table 2. Emissions from the generation of 1 MWh using diesel, Waste Cooking Oil (WCO), and Refined Palm Oil (RPO).
Fuel TypeCOCO2Hydrocarbons
kg/MWhkg/MWhkg/MWh
Diesel10.977322.07628.8
RPO23.63483.8586.30
WCO13.48499.1437.40
Table 3. Plantation characteristics.
Characteristic No.
FFB yield (t ha year)18
Plant density (ha)142
Plantation lifetime (years)25
Total area (ha)2800
Source: In situ surveys.
Table 4. Inputs and outputs in the agricultural production of 1 FFB t.
Inputs/OutputsUnitAmount
Inputs
Urea kg7.6
Ammonium sulphate kg1.4
Triple superphosphatekg9.5 × 10−1
Di ammonium phosphate kg2.2 × 10−1
Potassium sulphate kg3.0 × 10−2
NPK (15–15–15) compound kg5.2
Potassium chloride kg1.4 × 101
Transport tkm8.2
CO2 kg1.1 × 103
Glyphosate kg4.1 × 10−1
Metsulfuron kg6.9 × 10−1
Benfuracarb kg6.1 × 10−2
Gasoline l2.0 × 10−1
Output
Carbon dioxide (air)kg1.0 × 10
Ammonia (air)kg7.6 × 10
Nitrate (air)kg1.3
Dinitrogen monoxide (air)kg8.5 × 10−2
Nitrogen monoxide (air)kg8.5 × 10−3
Glyphosate (air)kg1.4 × 10−2
Metsulfuron-methyl (air)kg2.3 × 10−3
Nitrate (groundwater)kg1.3
Cadmium (groundwater)mg3.8 × 10−1
Copper (groundwater) mg2.3 × 10
Zinc (groundwater) mg4.4 × 10
Lead (groundwater) mg2.0 × 10−1
Chromium (groundwater) mg1.7 × 102
Phosphate (river) kg8.3 × 10−3
Glyphosate (river) kg3.2 × 10−4
Metsulfuron-methyl (river) kg8.1 × 106
Glyphosate (groundwater) kg4.4 × 10−2
Metsulfuron-methyl (groundwater) kg5.3 × 10−3
Glyphosate (soil)kg5.9 × 10−1
Metsulfuron (soil) kg5.9 × 10−1
Cadmium (soil) mg6.8
Copper (soil) mg4.8 × 102
Zinc (soil) mg2.5 × 102
Lead (soil) mg2.5 × 10
Chromium (soil) mg7.5 × 102
Nickel (soil) mg1.4 × 102
FFB t1
Table 5. Inputs and outputs for the extraction of 1 t of crude palm oil.
Inputs/OutputsUnitAmount
Input
Water t5.4
FFB t5.1
Lubricating oil kg2.7 × 10−3
Energy, from diesel kWh1.4
Transport, truck tkm3.1 × 10
Electricity, continental (EC) kWh1.4
Electricity, co-generation biomasskWh1.3 × 102
Heat and power co-generation unit, building construction p4.4 × 10−6
Heat and power co-generation unit, components p1.7 × 10−5
Heat and power co-generation unit, component constructionp1.7 × 10−5
Output
Carbon dioxide, biogenic (air)kg3.2
Methane (air) kg1.5 × 10
Nitrogen oxides (air)kg2.0
Particulates, <2.5 um (air) kg1.0
Carbon monoxide, biogenic (air) kg1.5 × 10
Methane, biogenic (air) kg9.8 × 10−3
Non-methane volatile organic compounds (NMVOC), (air) kg1.3 × 10−2
Sulfur dioxide (air) kg5.6 × 10−2
Dinitrogen monoxide (air) kg5.1 × 10−2
Acetaldehyde (air) kg1.3 × 10−3
Hydrocarbons, aliphatic, alkanes, unspecified (air) kg2.0 × 10−2
Hydrocarbons, aliphatic, unsaturated (air) kg7.0 × 10−2
Arsenic (air) kg2.2 × 10−5
Benzopyrene, methyl (air) kg1.1 × 10−5
Benzene (air) kg2.0 × 10−2
Bromine (air) kg1.3 × 10−3
Calcium (air) kg1.3 × 10
Cadmium (air)kg1.5 × 10−5
Chlorine (air) kg4.0 × 10−3
Chromium IV (air) kg9.0 × 10−7
Copper (air) kg4.9 × 10−4
Dioxin (air) kg7.0 × 1010
Ethyl benzoate (air) kg6.7 × 10−4
Fluoride (air) kg1.1 × 10−3
Formaldehyde (air) kg2.9 × 10−3
Benzene, hexachloride (air) kg1.6 × 10−10
Mercury (air) kg5.9 × 10−8
Potassium (air) kg5.3 × 10−1
Magnesium (air) kg3.8 × 10−3
Manganese (air) kg3.4 × 10−5
Sodium (air) kg2.9 × 10−2
Ammonia (air) kg3.9 × 10−2
Nickel (air) kg1.3 × 10−4
Phosphorus (air) kg6.7 × 10−3
Polycyclic aromatic hydrocarbons (air) kg2.4 × 10−4
Lead (air) kg5.6 × 10−4
Phenol, pentachloro- (air) kg1.8 × 10−7
Toluene (air) kg6.7 × 10−3
m-Xylene (air) kg2.7 × 10−3
Zinc (air) kg6.7 × 10−3
Chromium (air) kg9.0 × 10−5
Nitrogen, total (to freshwater) t1.0 × 10−2
Oils, biogenic (to freshwater) t6.1 × 10−2
BOD, biological oxygen demand (to freshwater) t3.1 × 10−1
COD, chemical oxygen demand (to freshwater) kg6.7 × 10−1
Crude palm oilt1
Table 6. Inputs and outputs for producing 1 t of RPO.
Inputs/OutputsUnitAmount
Input
Water L1.5 × 102
CPO kg1.0 × 103
Bleaching earth kg8.0
Phosphoric acid kg9.6 × 10−1
Citric acid kg7.7 × 10−1
Sodium hydroxidekg3.4 × 10−1
Electricity EC grid kWh1.6 × 10
Transport, truck < 10 t, EURO1 tkm2.1 × 102
Output
RPO t1
Fatty acids kg7.0 × 10
Water vapor m36.3 × 10
Wastewater from vegetable oil refinery m38.7 × 10
Table 7. Inputs and outputs to produce 1 MWh from RPO.
Inputs/OutputsUnitAmount
Input
RPOkg3.5 × 102
Lubricating oil kg1.9
Transport, truck < 10 t EURO1 tkm1.4 × 102
Marine transport 350 t ship tkm4.2 × 102
Heat and power co-generation unit, 50 kW electrical, components p7.7 × 10−4
Sodium hypochlorite kg1.1 × 10−5
Water kg1.8 × 102
Outputs
Carbon monoxide, biogenic kg2.3 × 10
Carbon dioxide, biogenic kg4.8 × 102
Hydrocarbons kg8.6 × 10
ElectricityMWh1
Table 8. Comparison of the physical and chemical properties of refined palm oil (RPO), Waste Cooking Oil (WCO), and diesel.
PropertiesRPOWCODiesel
Viscosity (eSt) (40 °C)39–4331–502.5–4.5
Density (15 °C) (kg/m3)860–920910–943820–860
Heating value (MJ/kg)36.5–40.132.2–41.843.0–46.0
Cetane number42–4936–3745–56
Flash point (40 °C)267–304>250>52.0
Iodine value35–6698–128
Sources [88,89,90,91,92][93,94,95][81,96,97,98]
Table 9. Inputs and outputs to produce 1 MWh from WCO.
Inputs/OutputsUnitAmount
Input
WaterL9.8
Transport, truck < 10 ttkm8.0
Electricity grid GalápagoskWh4.6 × 10
Steel, low-alloyed steel productionp6.4 × 10−2
Pump, 40 W productionp2.2 × 10−2
Sodium hypochloritekg1.1 × 10−5
Output
WastewaterL1.2 × 102
Clean WCOt1
Table 10. Inputs and outputs to produce 1 MWh from WCO.
Inputs/OutputsUnitAmount
Input
Lubricating oil kg1.9 × 10
Transport, truck < 10 t, EURO1 tkm3
Marine transport 350 t ship tkm1.9 × 10
Heat and power co-generation unit, 50 kW electrical, components p7.7 × 10−4
Sodium hypochlorite kg1.1 × 10−5
Water kg1.8 × 102
WCOkg3.5 × 102
Output
Carbon monoxide, biogenic kg1.3 × 10
Carbon dioxide, biogenic kg4.9 × 102
Hydrocarbonskg8.6 × 10
ElectricityMWh1
Table 11. Main impact categorization results per 1 MWh derived from WCO and RPO.
Impact CategoryAbbreviationUnitMWh RPOMWh WCO
Marine sediment ecotox. MSEkg 1,4–DB eq1.6 × 1022.7 × 10
Photochemical oxidationPOPkg C2H4 eq7.6 × 10−13.7 × 10⁻¹
Land competitionLCm2a1.0 × 1022.3 × 10−1
Terrestrial ecotoxicity TETkg 1,4–DB eq2.1 × 10−13.3 × 10⁻³
Marine aquatic ecotox. METkg 1,4–DB eq1.4 × 1022.5 × 10
Human toxicity HTPkg 1,4–DB eq1.7 × 1027.7
Ozone layer depletion ODPkg CFC–11eq1.6 × 10−51.7 × 10⁻⁶
Global warming GWPkg CO2 eq4.5 × 1022.4 × 10
EutrophicationEPkg PO4–eq7.91.6 × 10−2
AcidificationAPkg SO2 eq3.61.1 × 10−1
Abiotic depletionADPkg Sb eq1.72.3 × 10−1

