Article

From the Extraction of Currently Fulfilled Requirements to Value Curves: A Case Study in the Field of Harvesting Machines for Shell Fruits and Lessons Learnt in Engineering Design

Faculty of Science and Technology, Free University of Bozen/Bolzano, Piazza Università 5, I-39100 Bolzano (BZ), Italy
*
Author to whom correspondence should be addressed.
Appl. Sci. 2020, 10(11), 3809; https://doi.org/10.3390/app10113809
Submission received: 25 April 2020 / Revised: 27 May 2020 / Accepted: 28 May 2020 / Published: 30 May 2020

Abstract

:
The market for agricultural machinery is characterized by products with a high degree of maturity in the product life cycle. Consequently, current improvements in new machinery are predominantly incremental and new projects basically use solutions that are already consolidated. This makes this domain appropriate for benchmarking existing systems and envisioning new value propositions. The present paper deals primarily with the former and uses the value curves as a means to structure the comparison among different families of technical systems; in particular, harvesting machines for shell fruits from the ground surface, e.g., chestnuts, walnuts, and hazelnuts, were investigated here. The process of building value curves requires the identification of currently fulfilled requirements. Despite the attention paid by engineering design research to requirements, a structured process is lacking to extract relevant information and create value curves or other representations useful for benchmarking. The present paper approaches this problem and presents how the authors have individuated relevant knowledge for characterizing different categories of harvesting machines. Namely, after an extensive search of the scientific literature and patents, a critical review of existing machines, aimed at individuating their functioning principles, architecture, and attitude in fulfilling specific design requirements, was performed. Then, existing machines were classified in 8 main categories, and their strengths and weaknesses were identified with reference to 11 competing factors. The consequent construction of value curves enabled the identification of possible points of intervention by hypothesizing possible future evolutions of such machinery, both in a structural and in a value-based perspective. Limitations about the repeatability of the followed approach and possible repercussions on design research are discussed.

1. Introduction

Requirements’ elicitation and collection, here intended as the individuation of needs and demands to be satisfied in an engineering design process, are critical for successful product development [1], as verified in industrial [2,3], research [4,5], and educational contexts [6]. Requirements’ elicitation represents a critical activity in structured design tasks and advanced design courses [7].
The task of eliciting and managing requirements is, however, featured by difficulties emerging in many circumstances. It is well established that designers are seldom in charge of defining product requirements and competing factors independently [8]. Indeed, many strategies include the involvement of potential users or customers in this design activity in order to capture the so-called voice-of-the-customer [9]. The role of users is further emphasized when user-centered design strategies are at the backbone of the product development cycles [10]. Additionally, when potential users are not directly involved in co-design tasks, their role is emphasized by the abundance of cases in which persona models are employed in requirements’ elicitation [11,12]. The task of requirements’ elicitation is severely affected when complex systems are in play and many stakeholders can have different views or interests [13]. Besides this, in multidisciplinary groups, people might use different methods and approaches to elicit requirements [12]. Differences in methods to collect engineering requirements are also remarked upon across different countries [14]. A further issue lies in the mutating nature and relevance of requirements during the design process, which might benefit from the capability of anticipating changes in requirements’ definition or formulation [15,16].
Based on the outcomes of requirements’ elicitation, follow-up processes are intended to make decisions that steer and affect the upcoming design phases [17]. A diffused problem is featured by the emergence of large numbers of requirements that cannot be fulfilled simultaneously [2]. In many cases, the issue is made more severe by the presence of redundant requirements [18,19], which leads to useless negotiations and refinements to define an appropriate product specification [20,21]. Moreover, especially in the frequent case of starting from already existing solutions to be enhanced and modified [22], it is of paramount importance to avail tools for monitoring and benchmarking what is currently offered within an industry or a range of products with similar functionalities [23,24]. Otherwise said, the clarification of the requirements currently fulfilled by a product family, along with the performances thereof, represents an important task in terms of both benchmarking and individuating the best chances for successful new product development.
The need to test the capabilities of state-of-the-art methods for requirements’ benchmarking, which have the potential to unlock innovation, has led the authors to individuate the agriculture sector as a field of study. The agriculture sector is particularly featured by the need to integrate established design tools to foster innovation initiatives [25], whilst structured design studies in this field are still scarce [26,27]. The aspects that follow have represented further triggers for the authors’ choice of experimenting with innovation-oriented design tools in agriculture, although the problems presented below are not directly addressed in the present paper:
  • The agriculture sector features fundamental issues in terms of embracing new knowledge and introducing research-driven innovation [28]. Similarly, limited knowledge of people operating in the field is seen as a fundamental barrier to the diffusion of innovation and to technology development [29,30]. Additionally, when a reluctance to change does not take place, farmers might identify risks that are inadequately counteracted by policy makers and that do not enable the successful introduction of new technologies [31].
  • While innovation activities are recognized as being particularly valuable in the agriculture sector, the adoption of new technologies is considerably uneven across different countries [32]. Likewise, low innovation levels and unbalances among different regions are a catalyst of rural poverty [33].
  • Innovation in agriculture is attributed paramount importance because of the simultaneous needs to increase productivity and safeguard the environment, (e.g., [34]).

2. Proposed Benchmarking Method and Objectives of the Paper

Therefore, the agriculture domain has been identified as a paradigmatic field where the application of structured methods might benefit innovation. In this regard, the previous section has highlighted the importance of benchmarking requirements to steer new product development initiatives, their correct formulation, and the avoidance of redundant indications. The present paper primarily deals with these design-related challenges and presents a benchmarking procedure that is deemed beneficial when the designers/users are largely unaware of or lack considerable expertise in the topic they are going to tackle. Because of this “unawareness” condition, which mirrors authors’ expertise at the beginning of the presented work, the procedure starts from an information gathering process. From a methodological viewpoint, the procedure swivels on value curves.
Value curves (or strategy canvas) proposed within the blue ocean strategy (BOS) [35] are a valuable tool to visualize the main competing factors for a given industry and their level of fulfilment for each alternative proposition. Among other potential advantages, the chance of displaying competing factors and performances in a diagram supposedly help individuate redundancies; at least, it undoubtedly urges designers to limit the set of illustrated requirements to essential ones. This graphical representation has proven to be successful for diagnosing companies’ current strengths and weaknesses in value delivery (e.g., in [36]). Value curves are a valuable support both a) when firms are aware of their competitive status and are willing to project their strategic moves, and b) when such awareness is not present, and the competition has to be analyzed [37]. Applications of the value curves include critical situations for requirements’ elicitation, such as cases in which multiple stakeholders are involved [38] and user-centered design is adopted [39,40]. Their use has recently surfaced in the agricultural domain too [41,42], but the whole benchmarking procedure has not been described and the specific category of agricultural systems leveraged here (see Section 3) has not been involved.
Figure 1 shows an illustrative example of value curves in which it is possible to notice:
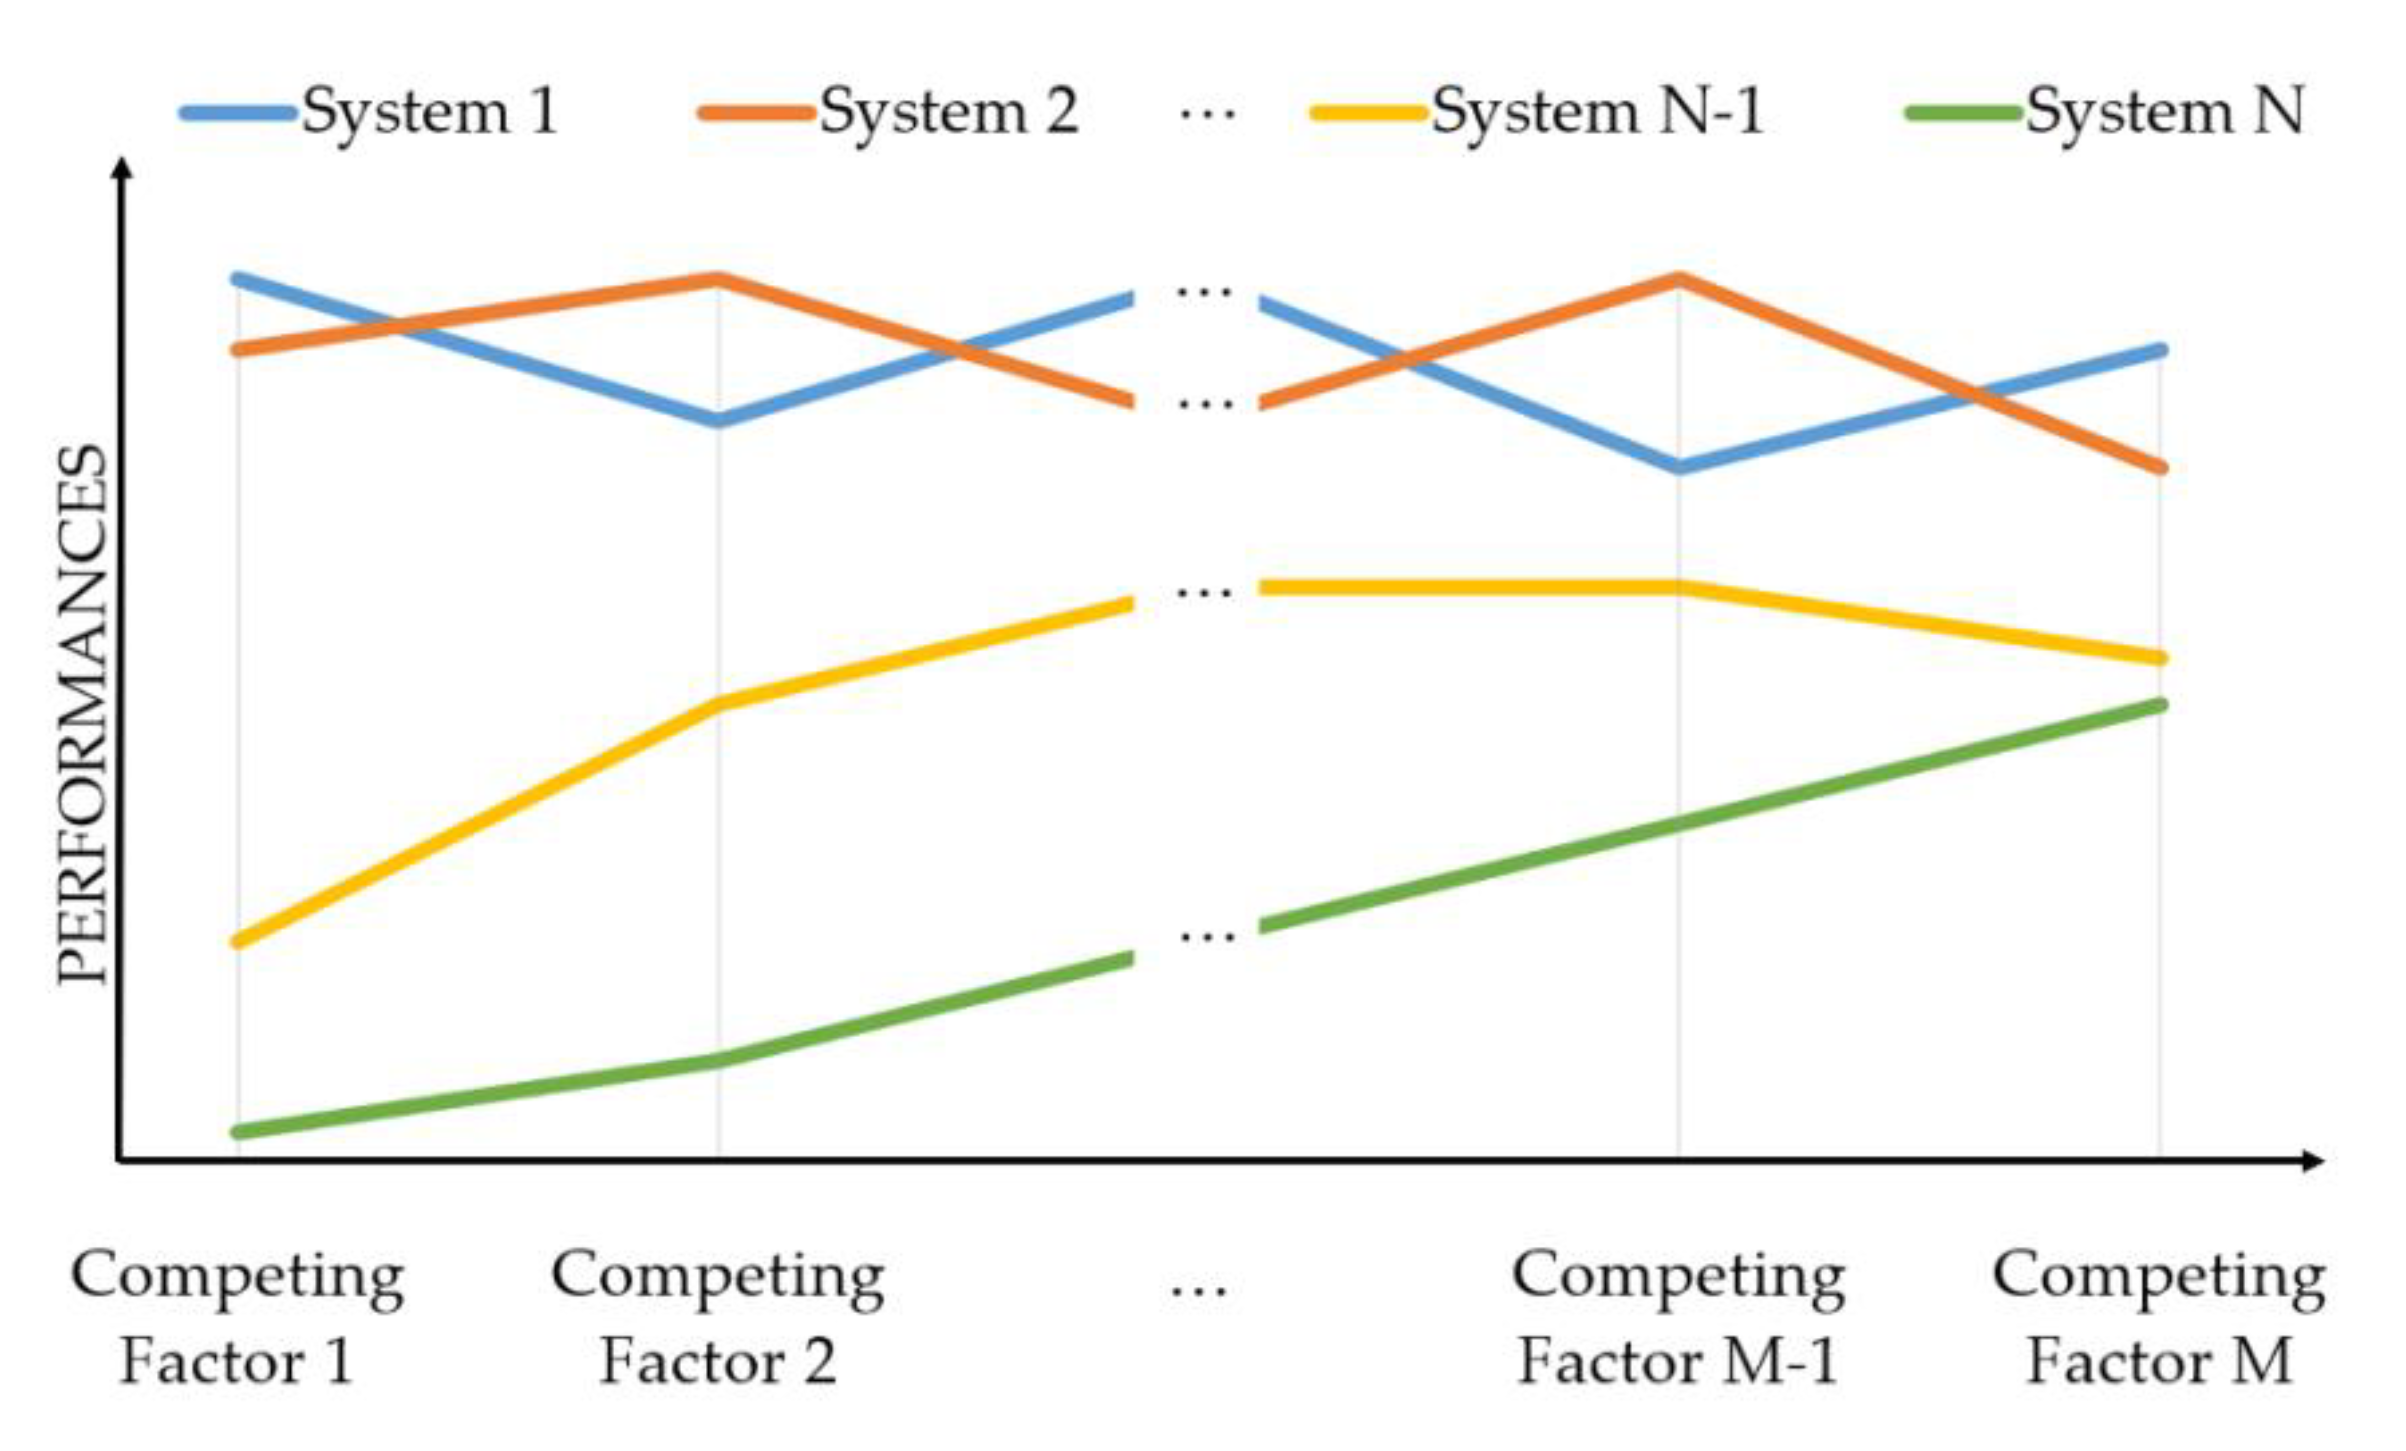
  • N (competing) systems comprehensively representing the existing solutions (or families/categories of solutions) pertaining to the domain of interest, such as an industry (e.g., kitchen furniture), a branch of services (e.g., healthcare), or an overall goal (e.g., travelling);
  • M competing factors being representative of the advantages/benefits that the use (or in some cases the ownership) of a technical system may engender, which are shown in succession on the horizontal axis; and
  • The level of performances that each competing technical system satisfies for each competing factor, shown on the vertical axis.
Each system/existing solution corresponds to a single curve in the diagram; the ordinates feature the level of fulfillment of each system with respect to competing factors on abscissas.
Nevertheless, supposedly because of the unsystematic methods shown in the BOS [43], the use of value curves has not made inroads in the design domain despite their possible support to benchmark requirements after those are elicited. In addition, value curves are predominantly used to show preconceived descriptions of current competitive environments to justify strategic moves. In other words, the employment of value curves seldom follows the structured analysis of current products in terms of requirements and the level of fulfilment thereof.
In this respect, the attribution of a performance level to a competing factor mirrors the formal definition of an operational design requirement according to [18,44]. In compliance with this notice and in light of the non-shared terminology in the literature of this field, the terms that follow will be used hereinafter.
  • A (user) need is an explicit expression of interest for a benefit to be enjoyed by means of using or owning a product or a system.
  • A competing factor is a parameter through which a system can be evaluated, which features specific benefits and advantages for one or more stakeholders of the product under consideration; in other (scientific) contexts, a competing factor would be referred to as a “metric”.
  • A requirement is the combination of a competing factor and the corresponding performance level or the degree of fulfilment (either qualitative or quantitative) a specific system has achieved. If interpreted in a design perspective, a so-defined requirement is a target to reach in order to comply with a design specification.
  • An attribute is a property or a feature of a product or a system, which is ascribable to the attempt or necessity of bringing a specific benefit; new attributes are therefore proxies of the introduction of new competing factors in value curves.
Given these definitions, the following conditions apply to enable an effective interpretation of value curves considering different competing technical systems.
  • Competing factors are defined in a way that is consistent with user needs and expectations, i.e., they are an expression of a benefit, e.g., “cheapness” instead of “cost”. This means that, with reference to Figure 1, the system 1 outperforms the system N for the first competing factor, and, as such, it is preferable in terms of the benefit underlying the first competing factor. Still, the system 1, if compared to the system N, has been designed in a way that it has fulfilled a more challenging requirement in the perspective of the first competing factors.
  • The competing factors presented in a value curves diagram are mutually independent, as they are intended to show how different systems have fulfilled requirements differently. Indeed, requirements are, in their turn, independent and non-redundant still according to the expected properties of design specifications [18,44].
The present paper shows a case study in which values curves are built upon a structured search for information concerning a specific industrial domain, where the main target was the individuation of currently fulfilled requirements. A characterization of currently available products in terms of competitive factors and the determination of possible contradictions to be solved in subsequent design phases are inferred based on the value curves. Therefore, the lessons learnt concern the utility of using value curves as a graphical tool to deduce similarities and differences between competing technical systems, as well as their potential for individuating unfulfilled requirements that might feature future design endeavors.
The structured search is organized as illustrated in Figure 2. The definition of the industrial domain of the study, in terms of the main functionalities of the technical systems under consideration has to provide, is presented in Section 3. The search method aimed at collecting relevant documents is presented in Section 4. The competing systems pertaining to the industrial domain of the study, their classification (in terms of their belonging to a family of solutions), and their main characteristics are shown in Section 5. In Section 6, the main competing factors that characterize these systems, i.e., the attributes that these systems and/or their subsystems should have, the benefits that they should provide, and the problems that they should solve (or actually cannot solve), are discussed based on the information available on patents and scientific papers. The identification of the performance level that characterizes each competing factor for each competing system is presented in Section 7. The creation of the value curves is presented in Section 8 along with implications for the technical systems under consideration. The rest of the article includes Section 9, where methodological remarks are made, and Section 10, where conclusions are drawn.

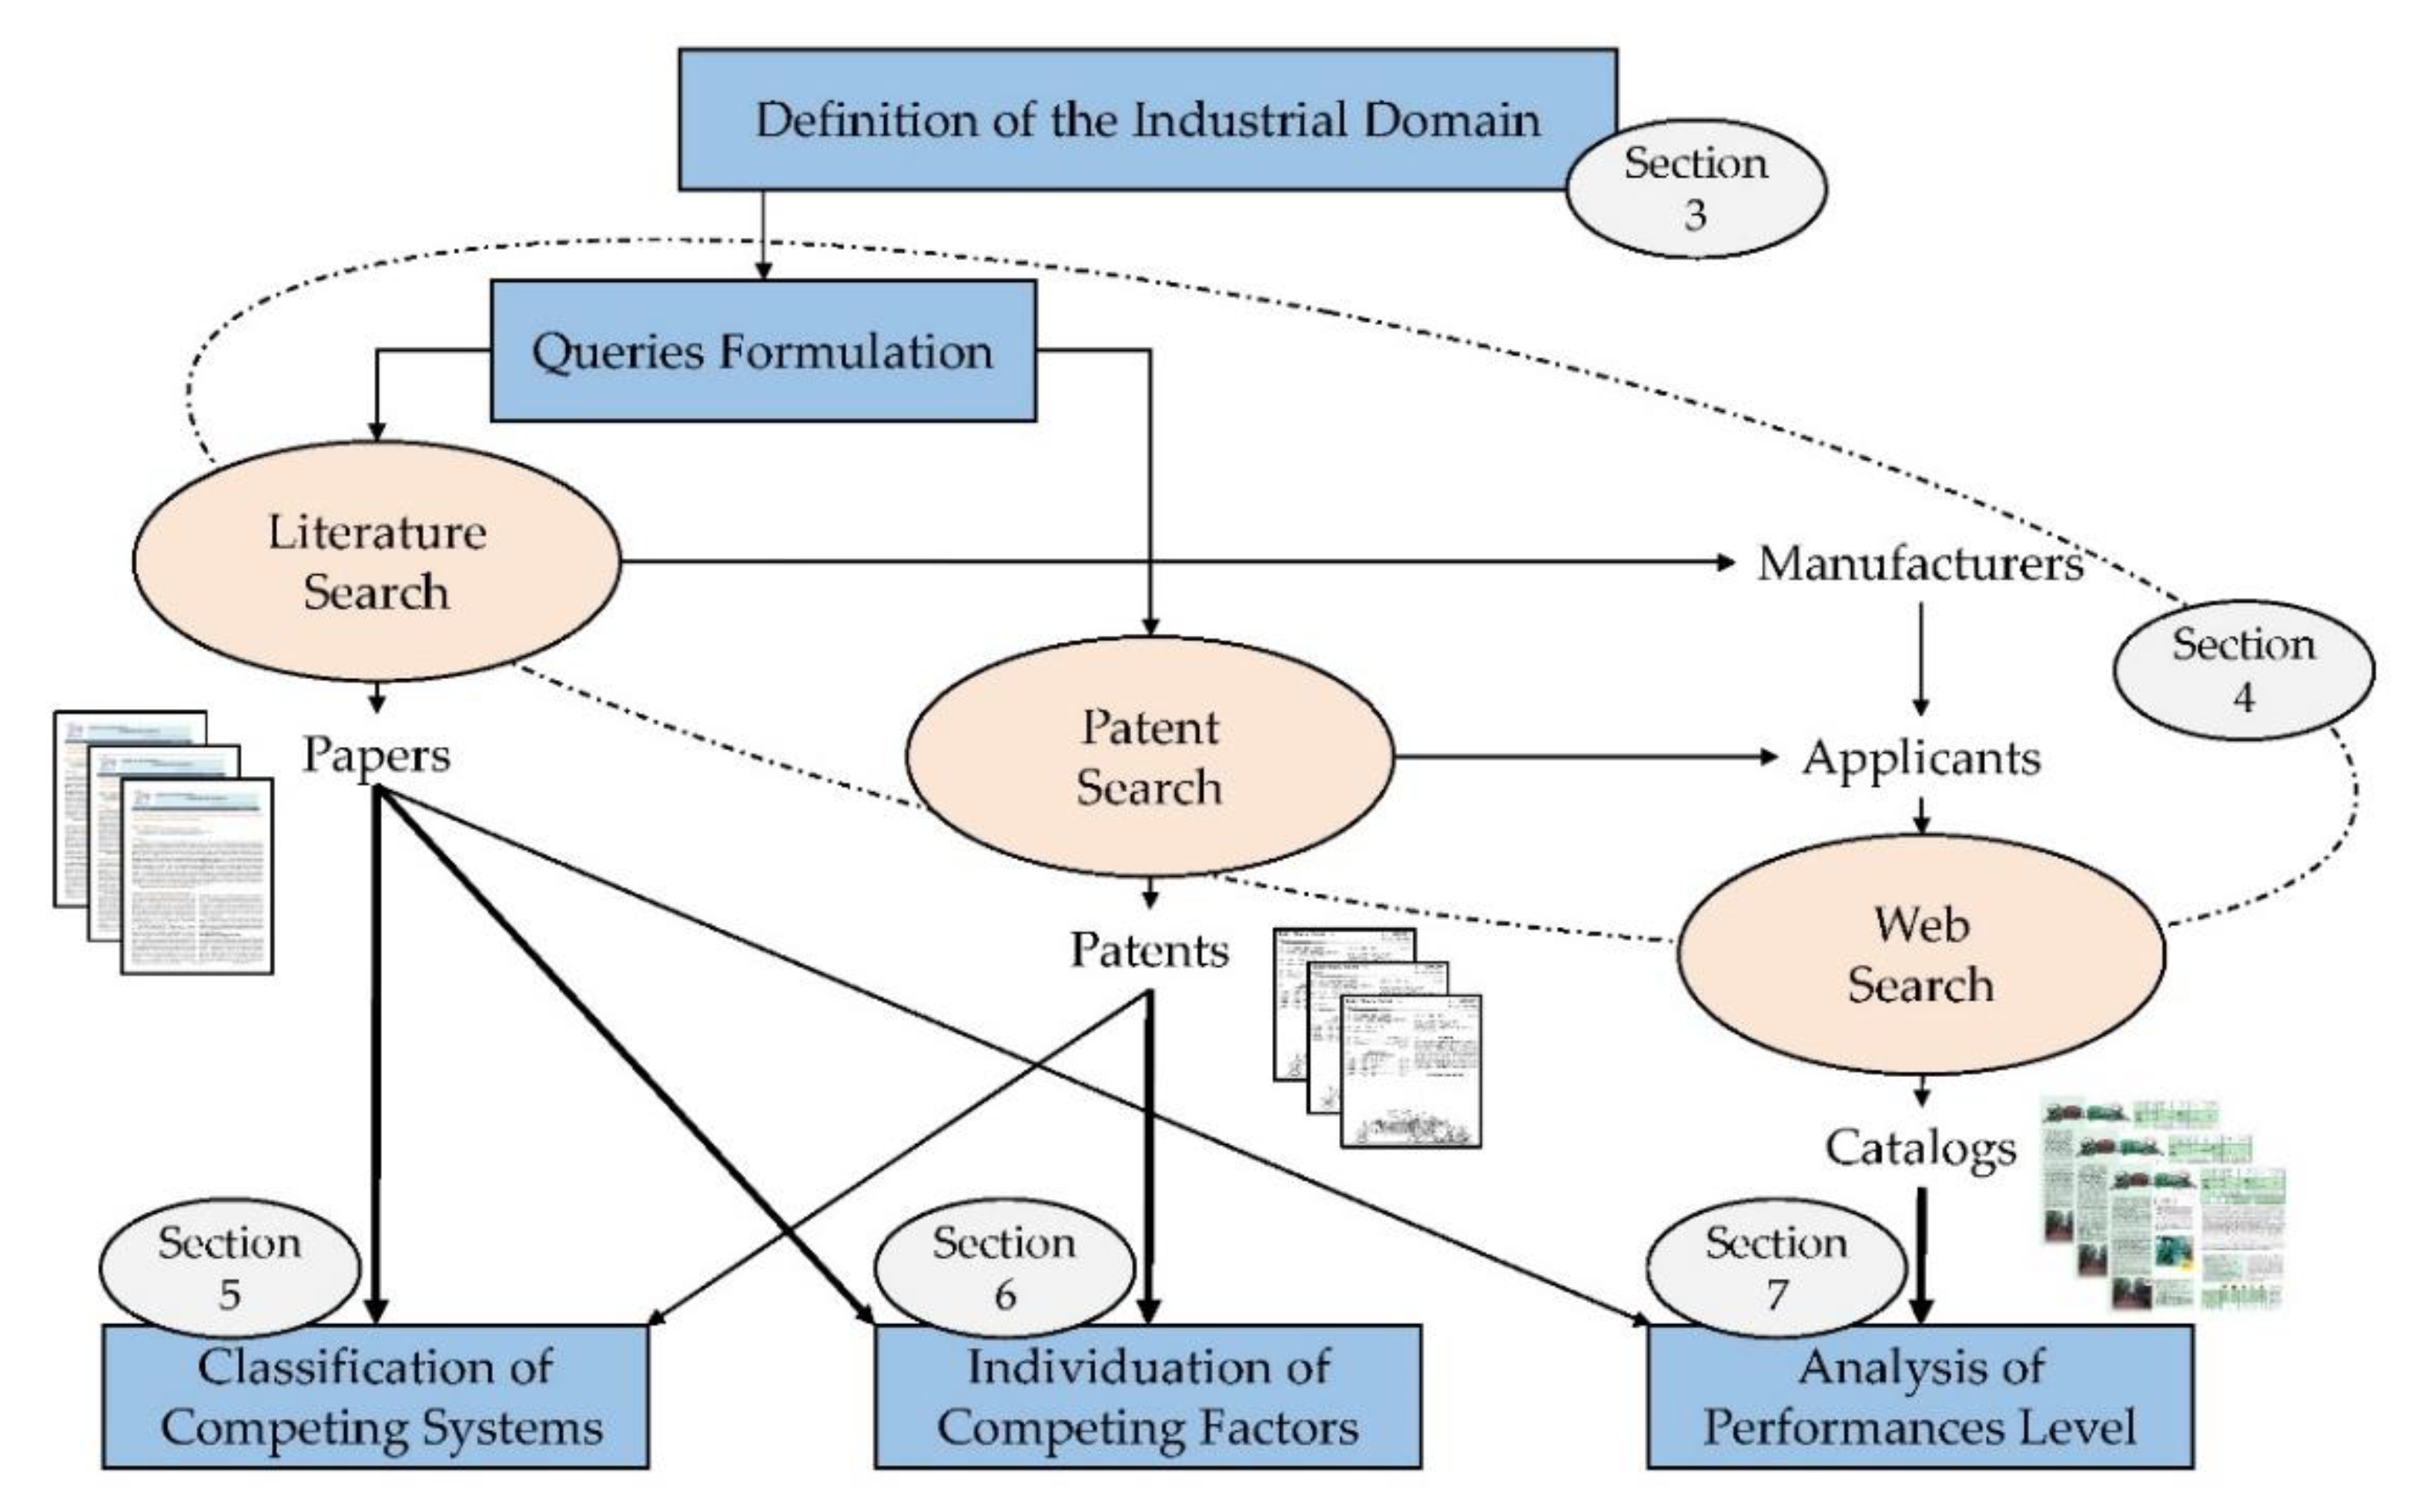
3. Definition of the Industrial Domain and Presentation of the Case Study

The specific domain of the case study presented in this paper relates to technical systems for harvesting from the ground surface the shell fruits naturally abscised from trees (e.g., chestnuts, hazelnuts, and walnuts, having an average size ranging from 15 to 40 mm and a maximum mass of 20 g per fruit [45,46,47]), named “harvesting machines” hereinafter.
Harvesting machines are employed at the end of the cultivation/production process, so they are entrusted with the task of intervening on agricultural products that are earmarked for the final consumer, hence when they have the greatest added value. The primary technical function to be implemented, i.e., gathering fruits, is not trivial [48], as the economic value of the product has to be preserved by minimizing product losses and maintaining, at the same time, organoleptic characteristics (integrity) and the degree of appreciation to the consumer [49]. This includes eliminating or separating many of the foreign and non-edible materials that can be unwillingly gathered (soil, leaves, stems, roots), which is a critical capability in harvesting machines [50]. Still with the aim of keeping a high-quality level of the harvested fruits, another crucial operation is the correct execution of storing operations [51], which are seen as inseparable from the harvesting process as a whole. Contextually, the separated foreign materials have to follow a different flow [52], and some of them need restoring in correct waste management practices.
To sum up, the execution of the task of “shell fruit harvesting” is constituted by three main functions (see Figure 3):
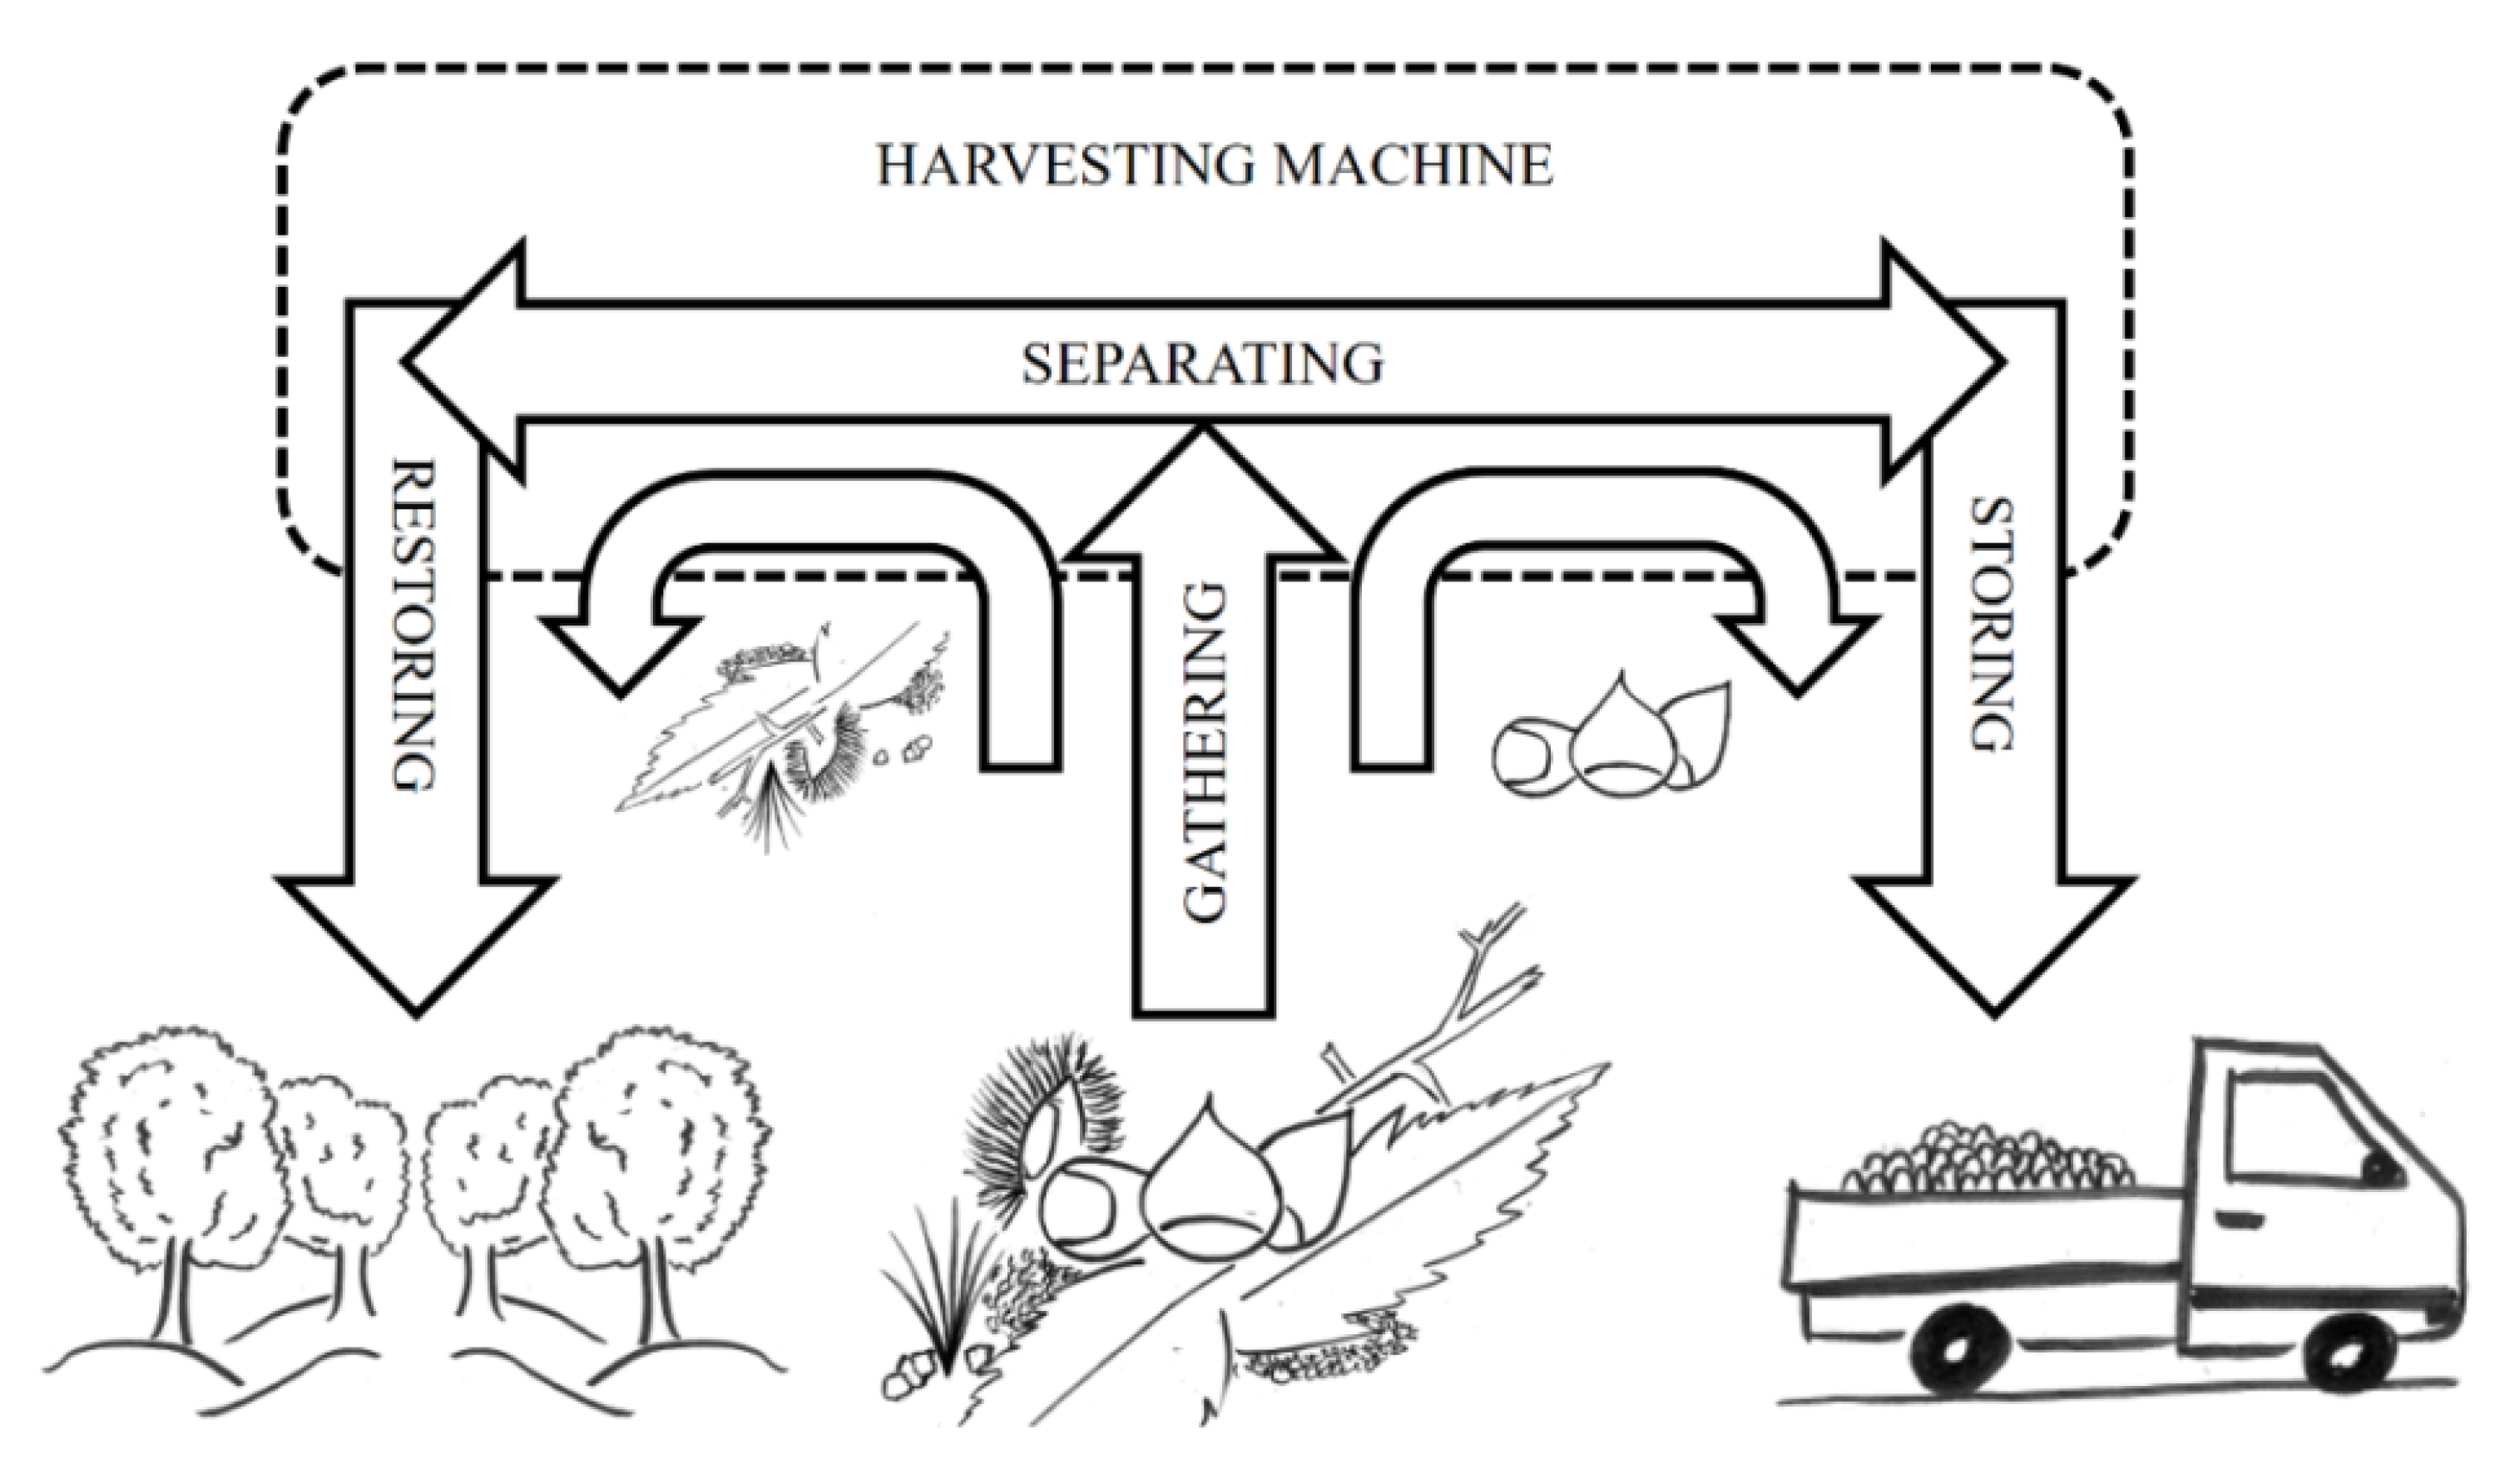
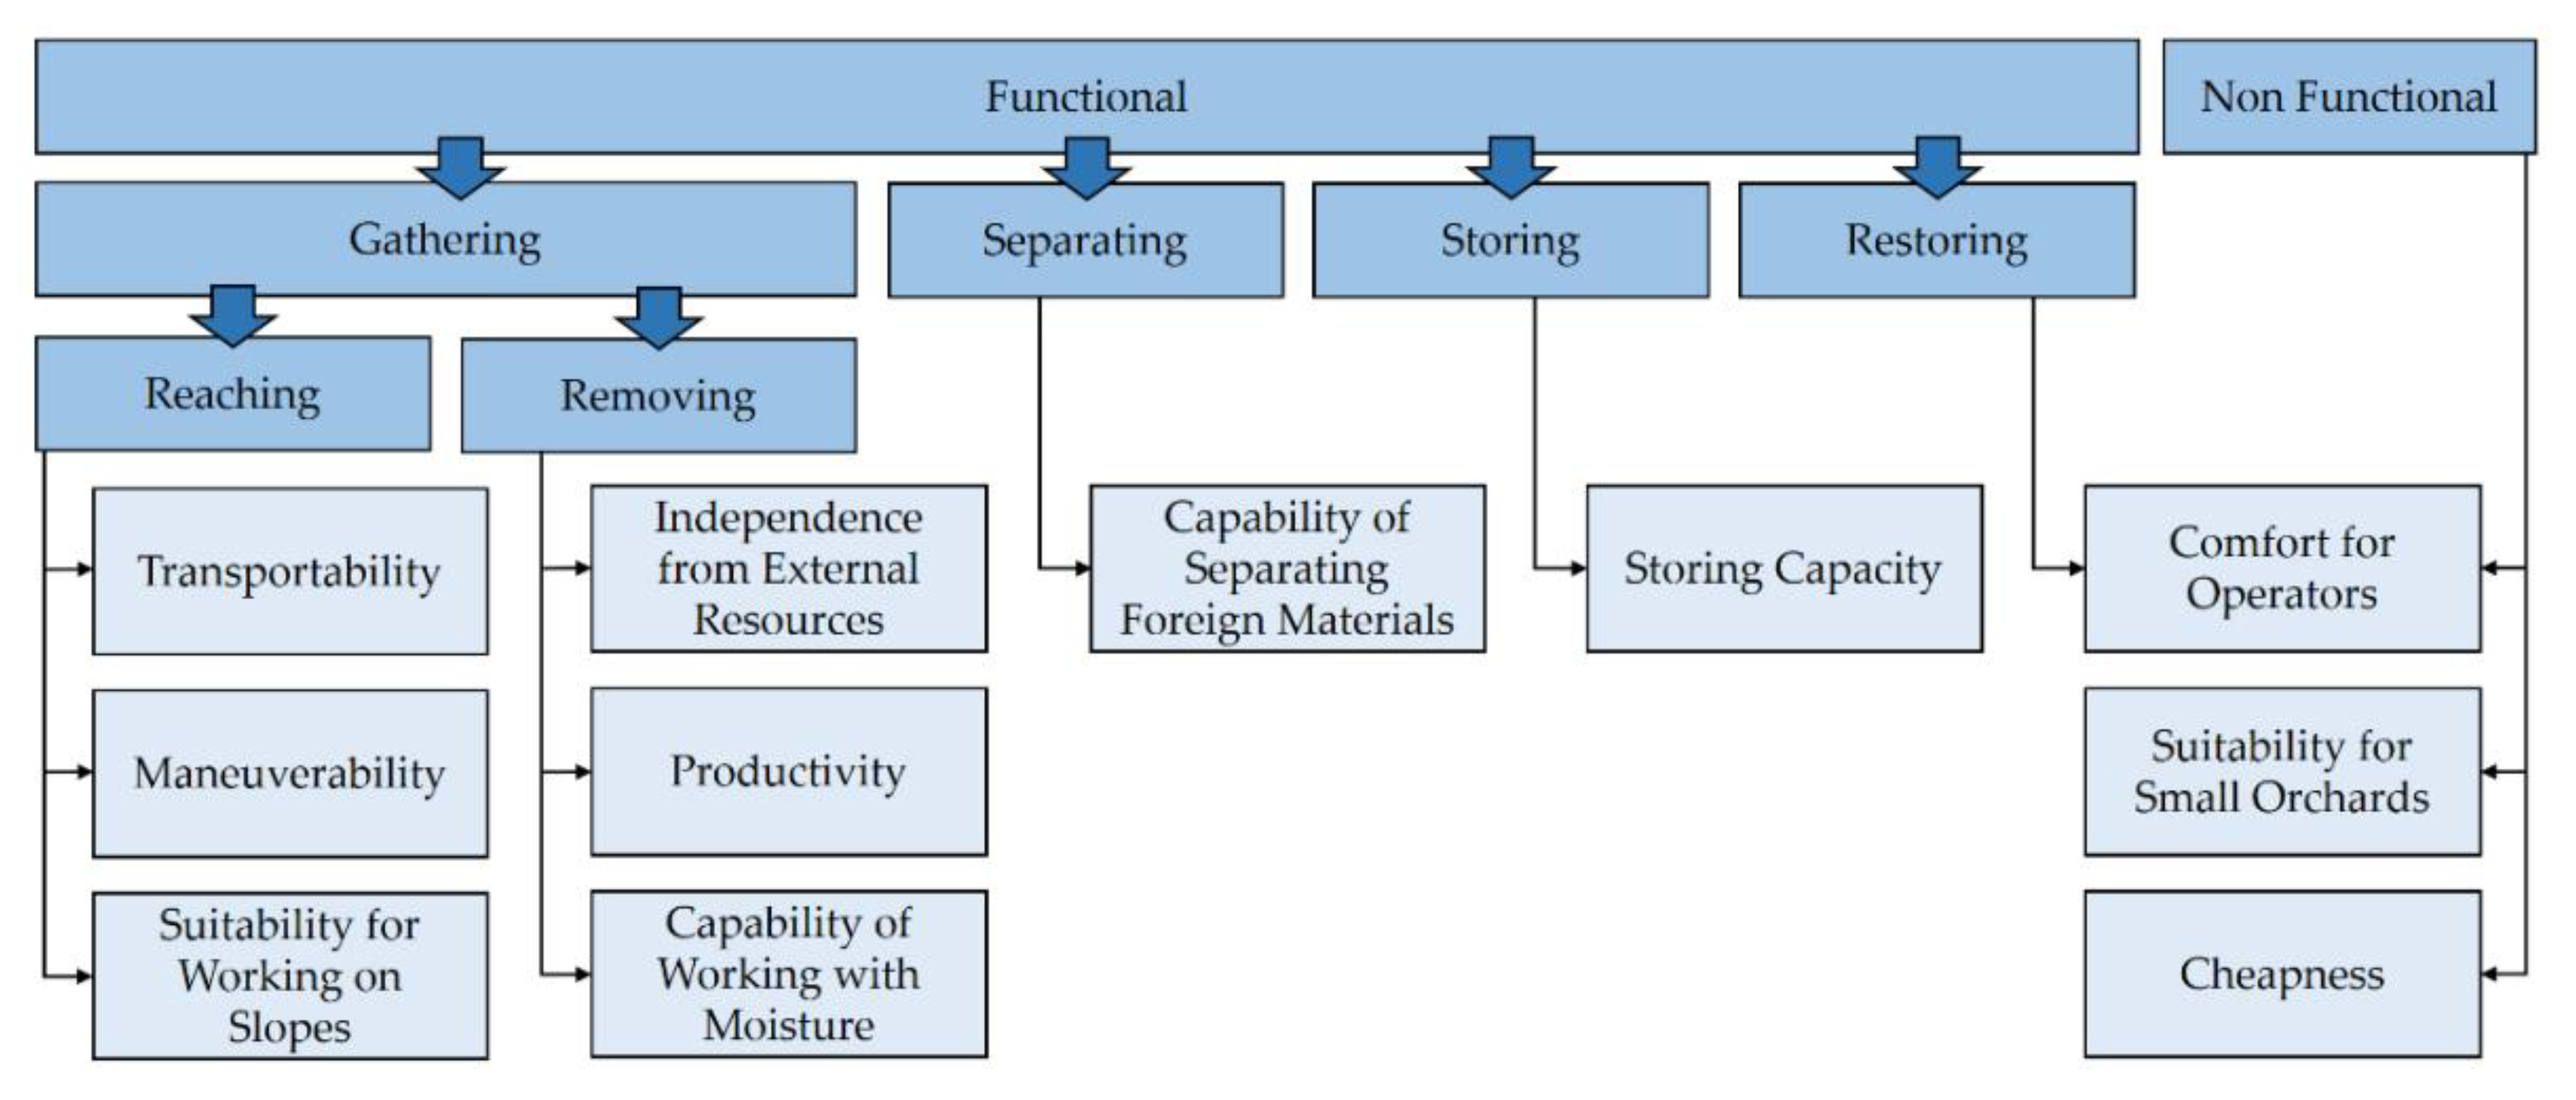
  • Gathering (the shell fruits from the ground) → system for (1) reaching and (2) removing the shell fruits from the orchard ground; it is worth noting that reaching the shell fruits can imply also an approaching movement of the whole machine;
  • Separating (the shell fruits from other elements) → system for the removal of the shell fruits from the foreign materials; and
  • Storing/restoring (shell fruits/other elements) → system for managing the material flows inside the machine and/or going outside of the machine.
It is worth noting that, although these three functions are necessary to complete the harvesting process, only the functions of “gathering and storing” are sufficient to connote a machine as a harvesting machine for shell fruits. Indeed, the functions of separating (the shell fruits) and restoring (the foreign materials) can be performed by different machines in different instances. However, modern solutions tend to integrate all these functions in a single machine [53] and the corresponding capabilities can be thought as critical competing factors, which are then to be included in the value curves diagram.

4. Collection of Relevant Documents

In line with the objective of searching for useful information to build the value curves in this specific industrial domain, the collection of documents containing relevant information about the existing harvesting machines was carried out in this section. More precisely, as shown in Figure 2, in order to collect relevant scientific papers, a literature search was conducted on the Scopus scientific database. In addition, with the aim of gathering pertinent patents, an advanced search was performed on the Esp@cenet patent database.
For the examined case study, the scientific literature often refers to commercial machines designed and manufactured by specific companies. Therefore, on the one hand, the manufacturers mentioned in the literature have facilitated patent searches since it was possible to use those names in the corresponding search field. On the other hand, through the patent search it was possible to extend this list of leading manufacturers. Furthermore, the latter’s websites were accessed to investigate their online catalogues (see Figure 2). Those included detailed datasheets of commercialized technical solutions and the declared performance thereof. This information was critical to establish the level of fulfilment for each competing factor and competing system, which is necessary for building the value curves (see Section 7).
The process of formulating suitable search queries was iterative. The first query was formulated by describing the general procedure of shell fruit harvesting (i.e., collecting shell fruits from the ground) in an abstract way. The process was conceptually modelled as a subject–action–object triad, in line with the so-called “SAO” methodology [54,55], to extract relevant search terms.
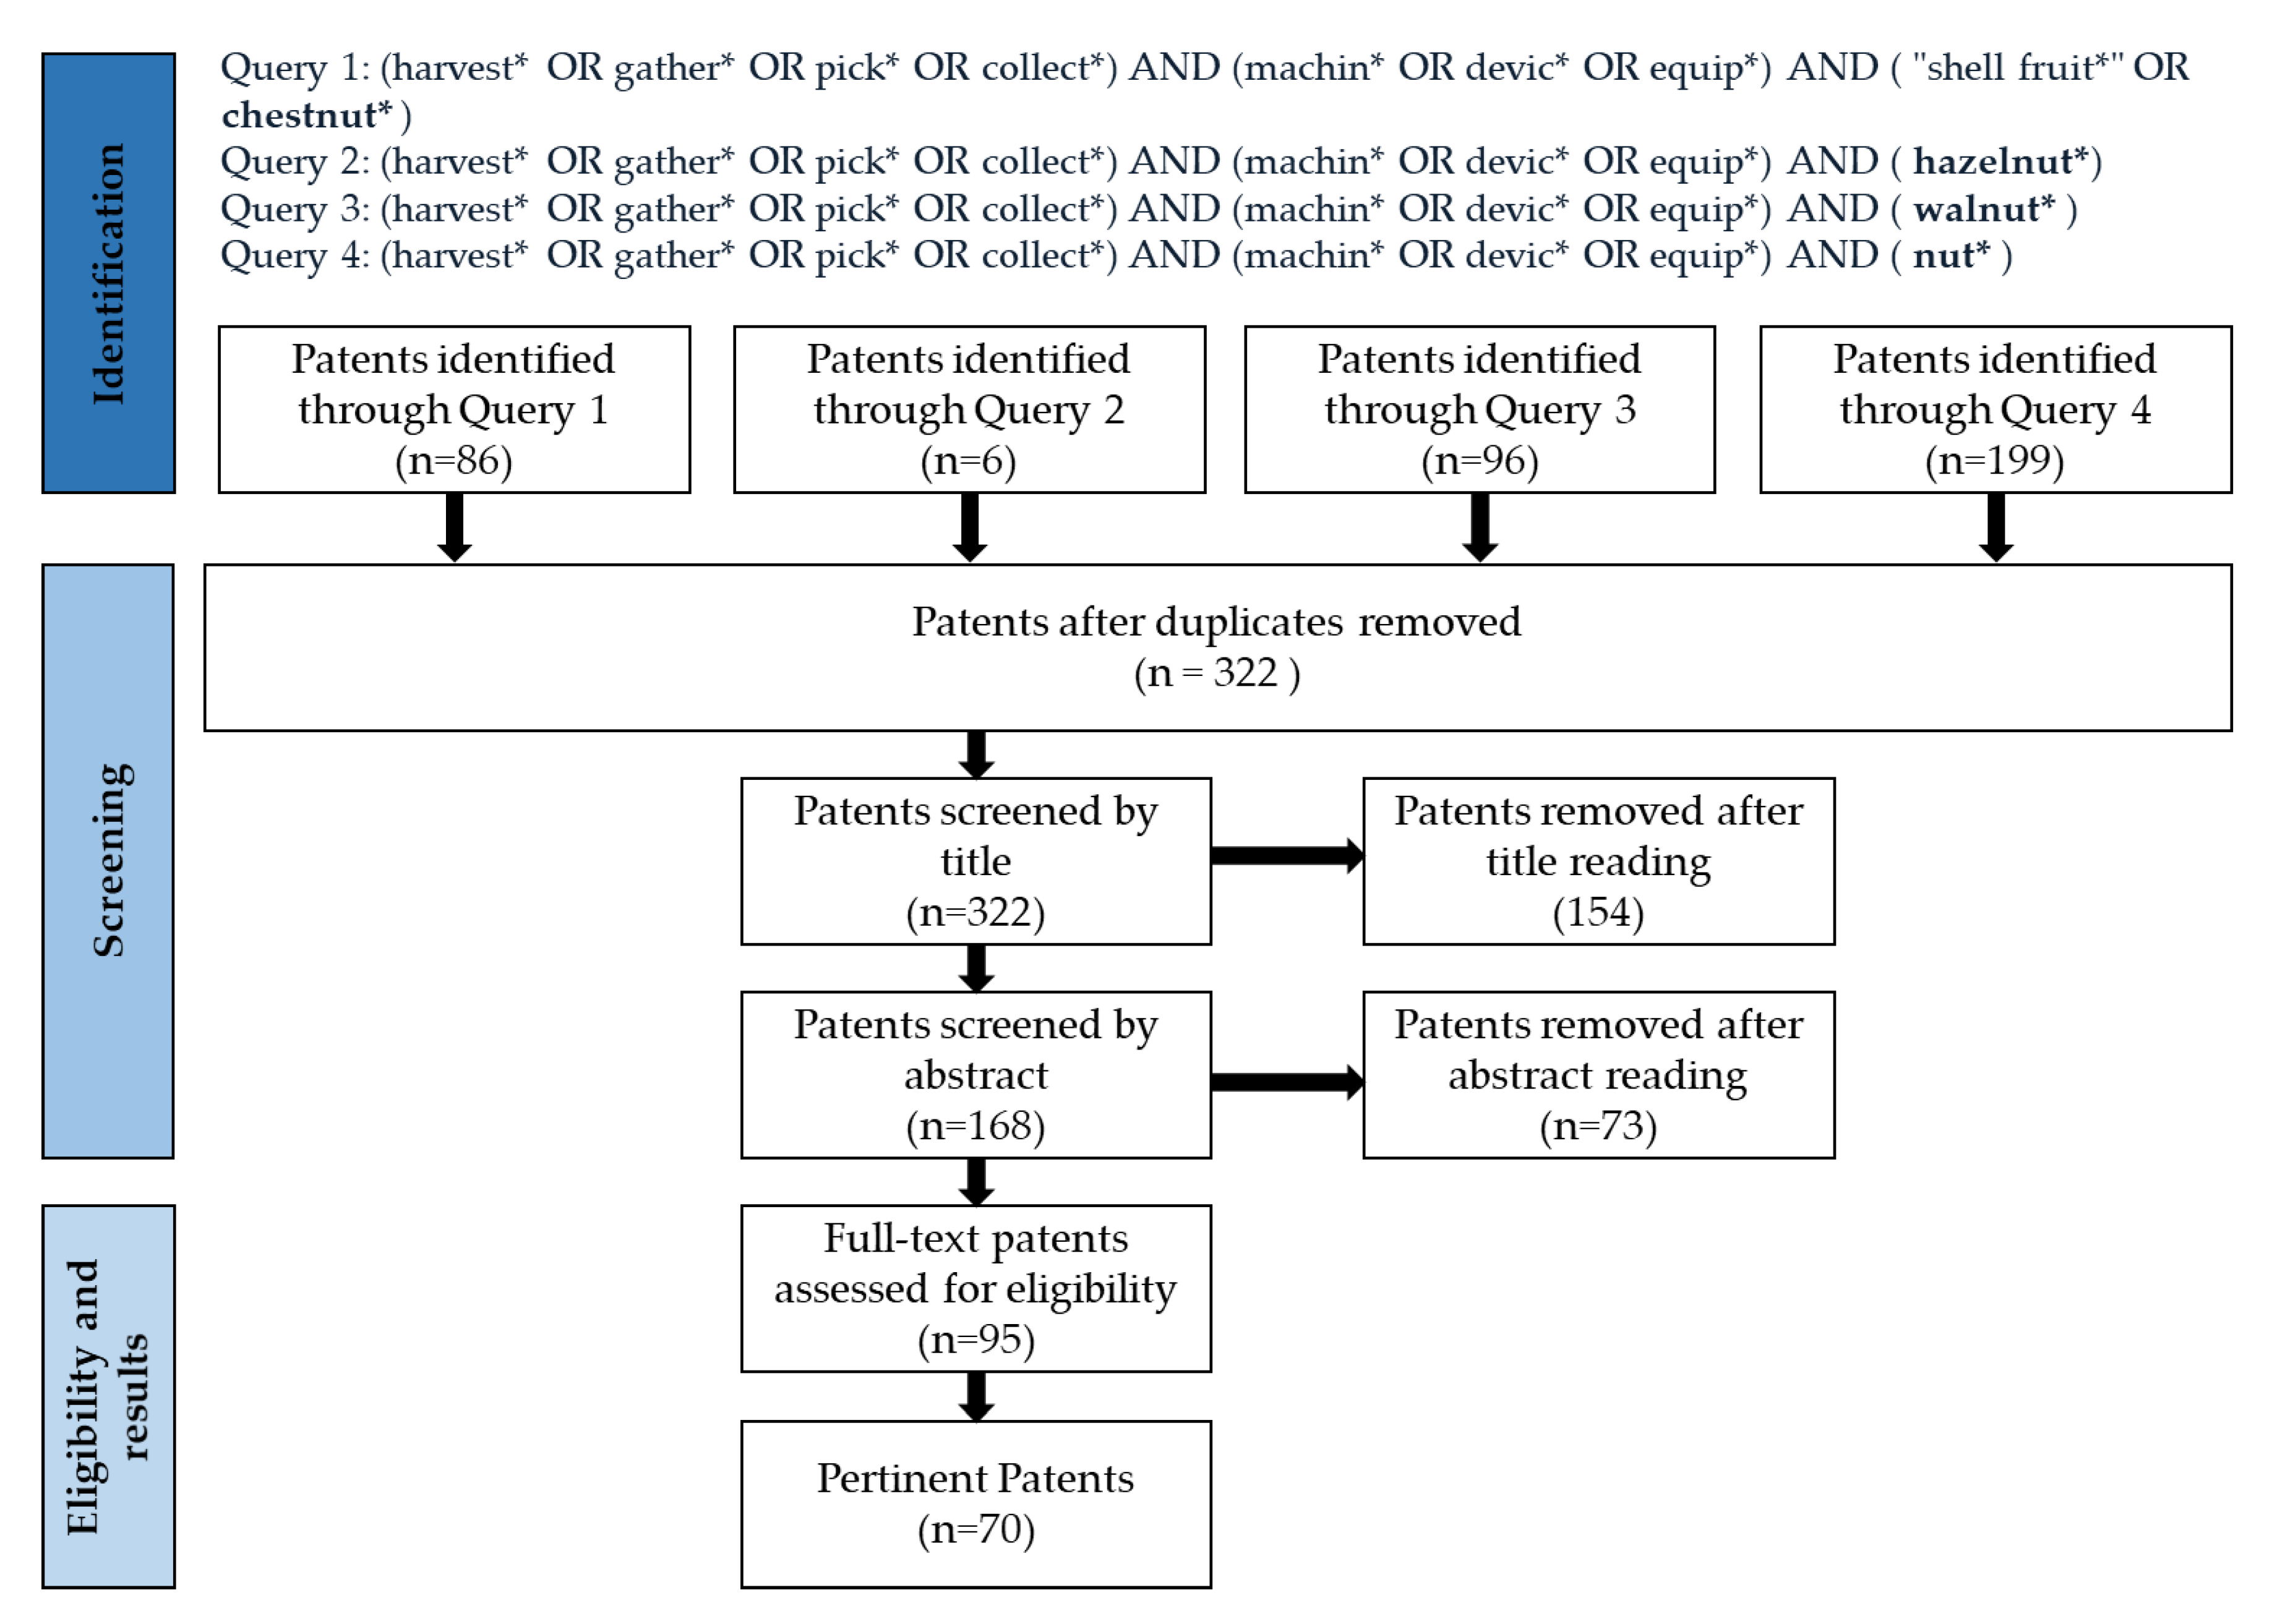
  • The action is the main function, in this case: “harvest”, “gather”, “pick”, and “collect”.
  • The subject is the technical system that performs the function, in this case: “machines”, “devices”, and “equipment”.
  • The object is the element that undergoes the function, in this case: “shell fruits”, “chestnuts”, “hazelnuts”, and “walnuts”.
As common in information retrieval tasks, the search terms were combined through logical operators (AND, OR) and used for search refinements. Markedly, the results of the first search round allowed further refining of the queries, thus improving the steps that follow. Indeed, by analyzing the titles of the papers/patents that emerged from the first search, it was possible to refine the queries excluding noise, e.g., results that dealt with water chestnuts/walnuts (it is an aquatic vegetable), here considered out of the scope. In addition, as aforementioned, the individuation and introduction of new leading manufacturers in the query formulation improved the quality of the results.
Overall, on the one hand, the analysis of the scientific literature enabled the individuation of a shared classification of the treated harvesting machines. Moreover, much information regarding the products’ characteristics (e.g., in terms of the suitability of the machines in specific conditions) and performances (e.g., in terms of quantifiable experimental results) was collected. Clearly, those characteristics and performances are ascribable to the relevant requirements of the harvesting machines. On the other hand, patents were particularly useful to establish the relations between faced problems and proposed solutions. The extraction of these typologies of information from scientific articles and patents will be more apparent below. Likewise, this circumstance is featured by the width of lines extending from papers and patents in Figure 2.

5. Classification of Competing Technical Systems

The information presented in this section explains the rationale behind the subdivision of harvesting machines into comparable technical systems. All of them can be consequently considered as representative of a single value curve.
An introduction to technical aspects of machines for harvesting shell fruits is presented in [56]. Analogously, the evolution of the harvesting techniques for hazelnuts and chestnuts is described in [57] and [58], respectively. All the scholars agree in classifying the harvesting machines based on the functioning principle exploited for removing the shell fruits from the orchard ground (belonging to the first of the three main functions above illustrated), i.e., (1) “vacuum” or (2) “mechanical” [56,57,58,59]. The vacuum machines create airflows capable of sucking the shell fruits into the machine thanks to the thus-created drag forces on each shell fruit, directed toward the suction inlet. Instead, mechanical machines move shell fruits inside them by exploiting a direct contact of the shell fruits with properly shaped solid bodies (e.g., brushes or rakes) that materially gather, grasp, or embed the shell fruits. It is worth noting that mechanical machines can exploit air flows, and vacuum machines can benefit from mechanical movements (as long as these do not perform the main function of removing the fruits from the ground). Indeed, it is common that mechanical solutions help the preparation of the shell fruits to be collected by vacuum tubes and that air flows facilitate the separation of the lighter elements collected mechanically.
A further classification is based on the way the machine is moved within the orchard [56,57,58,59] (belonging again to the first of the three main functions above illustrated), and four categories can be individuated.
  • When such a machine is towed by a tractor, it is referred to as “trailed” (or “pulled”).
  • When a harvesting machine is instead “rigidly connected” to a tractor (e.g., through the front/rear three-point hitch), it is usually called (tractor-) “mounted”. In both the described cases (i.e., 1 and 2), the harvesting machine is configured as a farm implement, i.e., a machine that is not independent because it has to be necessarily interfaced with an agricultural motor machine to be moved and powered.
  • Additionally, when the machine is moved directly (and exclusively) by the operator, e.g., if it is shaped like a backpack, a cart, or a rake, it can be called “portable”. This category is mostly neglected by the scientific literature, probably because this type of machines achieves the lowest productivity; nevertheless, as illustrated in the following sections, it is mentioned in many patents and, therefore, it was included in this study.
  • Finally, when the moving system is integrated in the harvesting machine, this is called “self-propelled”.
Table 1 shows an explanatory solution (picked up from patents) for each of the eight categories (2 × 4) that emerged from the factorial combination of the two illustrated functioning principles. According to this classification, each category is indicated in this document using a label. The first letter (X/•) indicates the functioning principle exploited for removing the shell fruits from the orchard ground (V for vacuum, M for mechanical). The second letter or group of two letters after the slash symbol (•/XX) indicates the way the machine is moved in the orchard (P for portable, T for trailed, M for mounted, SP for self-propelled).

6. Individuation of Competing Factors

The present section provides an overview of the main challenges that harvesting machines for shell fruits face, which is aimed at explaining relevant concepts and justifications to the building of value curves. The descriptions below feature the process of augmenting the level of knowledge in the reference subject as new information is acquired, still targeting the need to represent it through value curves.

6.1. General Information Emerged by the Literature

In the developed countries, manual harvesting of hazelnuts has been almost completely replaced by mechanical harvesting since the 1980s [59]. Almost simultaneously, hazelnut-harvesting machines were adapted to be exploited also for the harvesting of walnuts [60] and chestnuts [56], even if with a lower market penetration [58]. The mechanization of this field operation has increased roughly 10-fold the harvesting rate per operator (in terms of kilograms of harvested product per hour) [59], bringing many advantages in terms of costs saving and consequent competitiveness of the harvested products. Another effect of the increased harvesting speed is a general improvement of the product quality. Indeed, speeding up the harvesting operation reduces the time during which the product is on the ground, thus preventing it from being exposed to rainfalls [58,61]. Finally, no deterioration of product quality happens if these shell fruits are harvested through machines instead of manually [62,63]. As highlighted in Section 3, from an abstract perspective, the general goal of a harvesting machine for shell fruits is to pick up a volume of shell fruits from the ground of an orchard and collect them in specific containers for subsequent transportation. This operation has to be performed in a predefined timespan to be profitable; to this regard, technical-economic considerations can be found in [64], where the hourly cost of this machinery was estimated, and in [65], where the labor requirements, work efficiency, and total costs were determined in different contexts. Over the years, designers and craftsmen have developed machines that perform these functions by exploiting different functioning principles and with different architectures to better meet different market demands (mainly due to an extreme variety of field conditions). Indeed, an orchard of shell fruits may have different land conformations (depending if it is settled in flat areas or in mountainous regions), dimensions, productivity, accessibility, and soil conditions (grass height/distribution and level of cleanliness, i.e., quantity of foreign materials on the ground). In addition, since the harvesting of the shell fruits in the boreal hemisphere takes place mainly in autumn, rain and moisture are additional factors these machines have to deal with.

6.2. Technical Information Emerged by the Literature

According to the literature, the machines’ productivity is the most investigated requirement. However, many boundary conditions affect the productivity, the affordability, and the suitability of each type of machine. The mechanical solutions are the most performed in flat areas [64], but they are not suitable for mountainous areas and/or irregular yields [58], unless they are portable. Instead, vacuum machines are generally more versatile, maneuverable, and suitable for small orchards [58,66,67]. These characteristics, along with a greater attention in mechanizing harvesting by owners of small orchards, make vacuum machines the most widespread on the market [56,59]. The diffusion of these machines is also pushed by the fact that most of the orchards have irregular shapes and are settled in sloping areas [64,66]. On the other hand, the maximum productivity of the vacuum harvesters can be obtained only when the soil is covered by natural grass prepared with accurate shredding [60]. Instead, the mechanical harvesters can achieve good results both on bare ground and on ground covered with grass, even when grass is overgrown [61]. Moreover, vacuum harvesters tend to raise a lot of dust [68] and their functioning may be compromised by foreign materials and moisture [66,68]. From all the articles, the general architecture of the machine (i.e., self-propelled, trailed, mounted, or portable) has a great influence on the general handling of the machine. Here, the use of smaller machines (e.g., harvesters mounted on small tractors) can partially compensate the mechanical method for removing the shell fruits from the ground.

6.3. Technical Information Emerged by Patents

At the end of an advanced search on Esp@cenet, where more than 300 patents were screened by means of their titles and mosaic pictures, 70 patents (covering a period spanning from 1950 up to 2019; see the histogram in Appendix A) were considered relevant to this study. The complete list is presented in Appendix A. Details about the search and selection process to determine relevant patents are documented through the PRISMA diagram shown in Figure 4.
Each patent was classified according to the eight categories described in Section 5. In addition, when a patent did not refer to a machine as a whole but to a sub-system (and hence it could fit several categories), this was classified as “other devices” (ODs). It is interesting to notice that the majority of the inventions are related to mechanical solutions (53 patents) rather than vacuum solutions (12 patents). In addition, it is worth remarking that, in the last 20 years, about half of the inventions refer to mechanical/portable solutions (12 out of 25 patents). Moreover, considering the whole selected patent dataset, the most explored solutions are the portable and the self-propelled machines (in total 22 patents each), followed by trailed systems (12 patents) and mounted machines (9 patents).
This attention to portable machines is mainly due to two factors:
(a)
They are less complex than other categories and, therefore, easier to prototype and test even by inventors that do not operate in large companies; and
(b)
They are aimed at owners of small orchards that are becoming increasingly more mechanized in recent years.
The investigation of patents’ content has given rise to many connections between problems and related solutions. In particular, many patents propose solutions for limiting the collection of foreign material (during gathering) or improving the capability of the machines to separate the shell fruits from the foreign materials (after gathering). Both of these kinds of solutions try to obtain the same useful result, i.e., to obtain a clean product (limited amount of foreign materials among the stored fruits) without compromising the productivity of the machine. In addition, the capability of preventing the suction of foreign material by vacuum solutions is considered as the main solution to ensure their proper functioning.
Other types of explored solutions are those aimed at improving the productivity of the machines by increasing the gathering area without worsening the other performances. This is often achieved through mechanisms (integrated in the machines) that prearrange the shell fruits to be therefore harvested efficiently. Further inventions propose solutions for improving the adaptability of the mounted architectures to different soil conditions. Others target the improvement of the vacuum machines’ ergonomics by limiting the production of dust or noise.

6.4. Formulation of the Competing Factors Based on the Gathered Information

In light of the considerations that emerged after analyzing the industrial domain through the literature and patents, it was possible to formulate the main competing factors that characterize and differentiate existing solutions. In compliance with the indications provided in Section 2, along with the objectives of introducing value curves, the considered competing factors have to be non-redundant and defined in a positive way, i.e., the higher the corresponding level, the better. Specifically, to avoid overlapping competing factors, a process leading to the identification of independent benefits was performed. The individuation of the main (and distinct) functionalities of harvesting machines has benefitted this process, as shown in Figure 5. Here, extracted competing factors are shown in light blue boxes. In addition, one can infer that some competing factors relate to non-functional characteristics of the machines; more details follow.
To perform the function of gathering, the machines have to first reach the shell fruits and, then, remove them from the ground. In order to reach the shell fruits, it is necessary that the machine is easily transportable, because before reaching the fruits, the machine should reach (or be moved to) the orchard from where it is usually stored. Therefore, a first competing factor is the transportability.
To reach the shell fruits in all the spots in which they have fallen on the ground, the machine has to be maneuverable to avoid obstacles like stones and trees. Then, a competing factor is the maneuverability, in terms of the simplicity to perform movements for gathering shell fruits.
Moreover, since many orchards are in mountainous areas, it is often useful that these machines are able to harvest on steep slopes. As a consequence, the machines’ suitability for working on slopes is considered a competing factor.
As partially discussed in Section 4, mechanical/portable machines require just an operator. An energy resource, such as fuel or electricity, can be required by vacuum/portable machines and self-propelled architectures to operate. With regard to trailed/mounted architectures, a farm tractor is required in addition to the energy resource. Therefore, the capability of a machine to be independent by external sources can be considered a competing factor.
The machines’ productivity, in terms of the mass of shell fruits collected per hour per operator, is a competing factor. In addition, a recurring theme in both the literature and patents is the inability of vacuum machines to be productive in the presence of moisture. Thereby, the machine’s capability of working correctly in presence of moisture can be considered an additional competing factor.
The collection of clean material is desirable because it can both avoid the need to purchase additional sieving machinery and save time in the subsequent processing of the harvested fruits. Therefore, the capability of separating foreign materials, in terms of the capability to obtain the shell fruits without the presence of foreign materials, is another competing factor.
The greater the capacity of a machine to contain the harvested fruits, the fewer interruptions will be required to empty it, and the higher the overall working efficiency of this field operation. Then, the storing capacity is a competing factor.
With regard to the restoring operation, no explicit useful function has emerged as a competitive factor. However, a benefit that can be enjoyed in this phase is the attenuation of a function harmful for the operator ascribable to vacuum machines, i.e., the creation of dust in the environment. The capability to reintroduce foreign materials without generating dust leads to the achievement of a more abstract competitive factor, namely the comfort for operators. To this regard, other ergonomic aspects can be considered as well, for instance, the weight to be moved, the generated noise, and the protection against the rain. In any case, comfort can be considered as an overall factor, which encompasses multiple facets.
Cheapness is considered as an additional competing factor. Moreover, the machines’ suitability for small orchards, in terms of cost-effectiveness for low volumes of harvested product, has been designated as an additional competing factor, since these properties are not ascribable to other competing factors. Indeed, the economic aspects are often based on the total harvested volume and, contextually, there is a growing demand for the mechanization of field operations in small orchards.

7. Performances of Competing Systems

The literature and the collected patents provide a good overview of the main pros and cons of each category of harvesting machines. Nevertheless, the performances of these machines are seldom available with sufficient detail for the correct construction of value curves able to benchmark each system across competing factors. Therefore, a further analysis was needed to achieve comprehensive data, which was mainly found in the catalogues of previously identified main players, as inferable from Figure 2. In Table 2, a summary is made of 15 manufacturers investigated here (first column), the references to their official website (second column), the categories of machines they produce, and the number of the variants they commercialize (third column). The fourth column reports if the corresponding company has filed patent applications related to these machines.
Information about 84 different machines was collected in order to create the value curves presented in the following section. Table 3 reports the specific harvesting machines that were analyzed, along with the eight categories they belong to.
The information most widely shown by catalogues is the mass of each machine (in kg) and its productivity (in kg·h−1). Unsurprisingly, self-propelled solutions have proved to be the most productive and heavy and, therefore, the least maneuverable. For the same productivity level, V/SP machines are on average lighter than M/SP machines (average mass 3500 kg vs. 2300 kg). It should be underlined that the maximum productivity achievable by a vacuum harvester (about 1700 kg·h−1, Facma Cimina 380S) is lower than the harvesting capacity of some mechanical harvesters (e.g., 2500 kg·h−1, Facma Semek 1000). In addition, while on the market there are M/SP machines of small sizes (e.g., Bosco F120; mass 600 kg; productivity 180 kg·h−1), the minimum size for a V/SP machine points to Facma Cimina 160S (mass 1500 kg; productivity 500 kg·h−1).
With regard to the trailed architecture, there is a substantial difference between mechanical and vacuum solutions in terms of mass and productivity. Indeed, the M/T solutions are produced by US companies, such as Flory and Weiss McNair, which predominantly meet the needs of very large crops. Therefore, these latter companies manufacture more productive (> 2200 kg·h−1) and much heavier solutions (> 2200 kg) than the V/T competitors (> 1500 kg·h−1; < 600 kg), which are generally aimed at small/medium orchards.
M/M architectures show a similar productivity to V/M solutions (around 600 kg·h−1), but the latter are typically lighter (450 kg vs. 600 kg).
It is interesting to notice that the productivity of vacuum machines has a very variable range and this depends on the soil conditions during the harvesting operation. Indeed, for dry and prearranged soils, vacuum machines can ensure a clean product to the extent of 95–98% (i.e., with only the 2–5% in mass of foreign material on the total amount of collected material). Conversely, the productivity of vacuum machines is approximately halved, and the rate of clean shell fruits is lowered to 70% in conditions of moisture and/or a high presence of foreign material on the ground.

8. Creation and Interpretation of the Value Curves

8.1. Finalization of Values Curves through the Assignment of Performance Levels

The categories of machines defined in Section 5, the competing factors identified in Section 6, and the information of the related performance gathered in Section 7 were summarized, as shown in the value curves depicted in Figure 6. More precisely, the performances observed for each competing factor and for each family of machines were consistently transformed in a 1–5 ordered scale. The level of performances was attributed by directly comparing the quantitative performances where available (e.g., the unit price for cheapness, the productivity, the storing capacity) and by considering all the information available from the literature, patents, and web searches when it came to qualitative requirements. The 1–5 scale was introduced to enable comparisons across all the requirements, including the quantitative ones that are inherently featured by different units of measurements. The value 5 (1) of the scale was assigned to the system that presents the highest (lowest) performance and to those with a similar level of fulfillment for each competing factor.
In addition, as a rule of thumb, the competing factors were ordered in a way to minimize the number of intersections between the lines and, thus, achieve a clearer display of the results.
At this point, it is necessary to highlight that since each value curve is representative of a machine category and not of a single machine, each curve should show a variability. Indeed, for instance, there are self-propelled solutions that have lower productivity than some mounted ones. However, these peculiar cases are unrepresentative of the large majority of machines belonging to the corresponding category. Therefore, the indication of variability was not included in the diagram. Each line represents the characteristic requirements of a machines’ category and this can be compared with the requirements fulfilled by other categories.
The bulleted list that follows aims at explaining, for each competing factor, how each family of machines was associated with a 1 to 5 level of performance. The results are graphically shown in Figure 6.
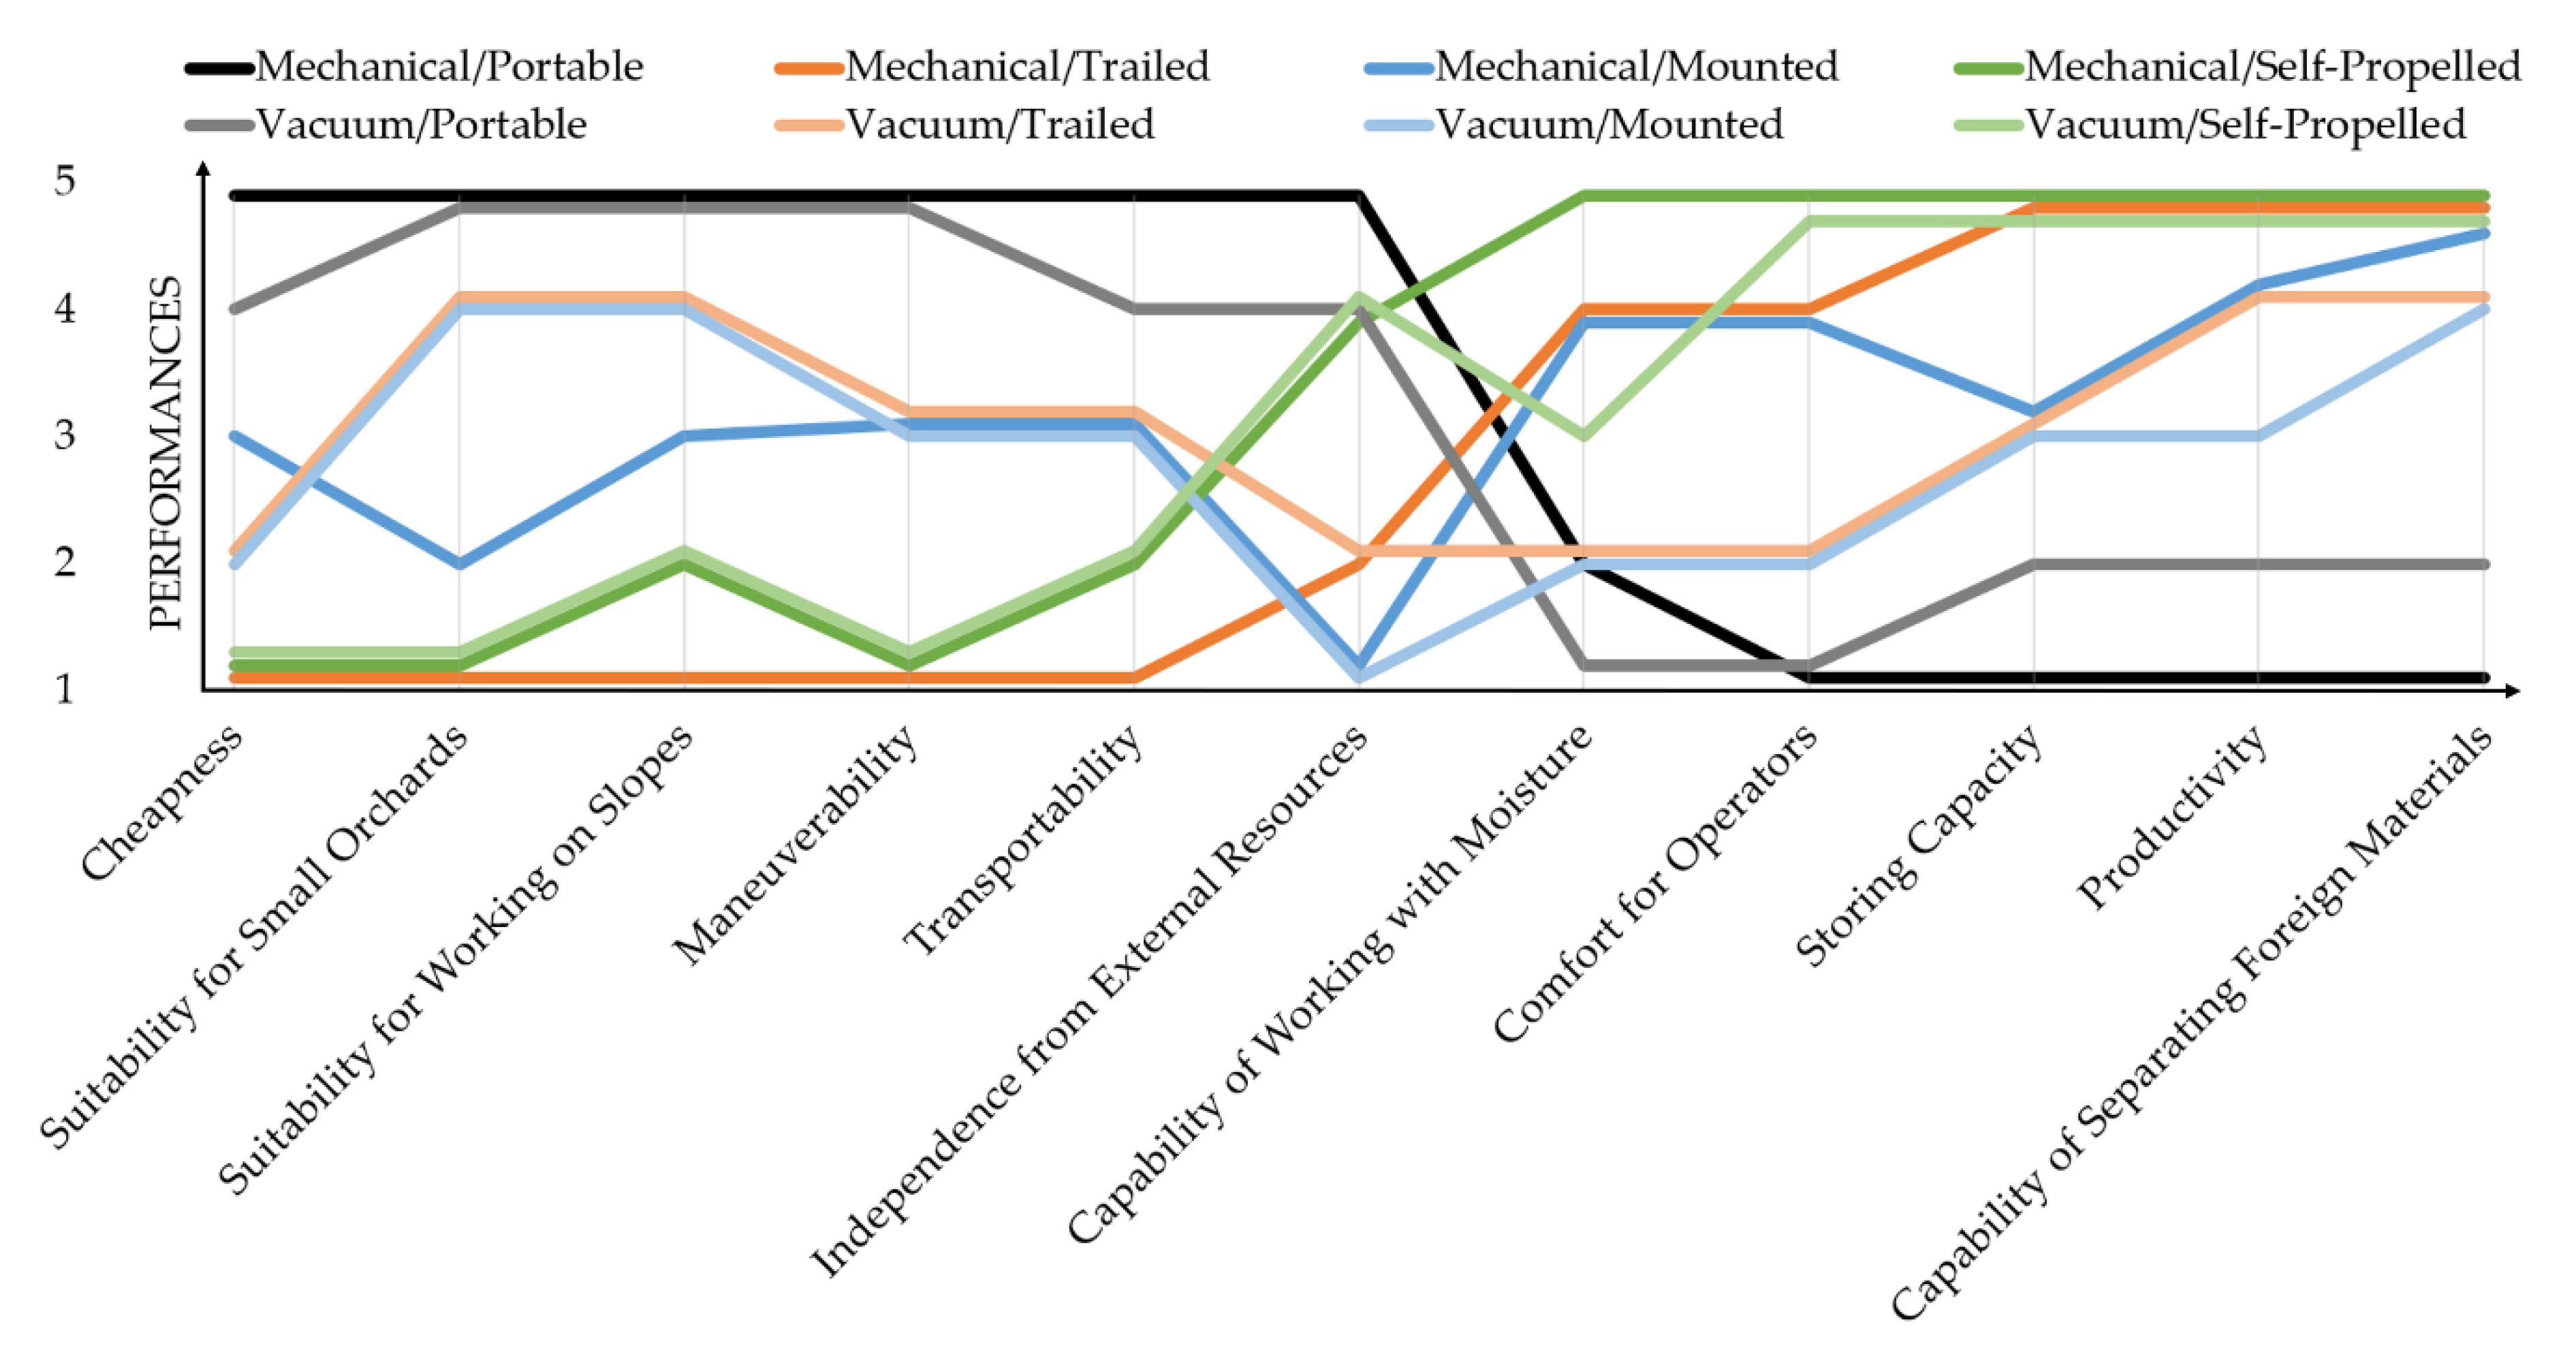
  • Cheapness: M/P machines are the cheapest (price < 400 €) (level 5). V/P machines follow that are slightly more expensive because they need an engine (price around 600–1300 €) (level 4). M/M machines belong to another price category ranging from 5000 € to 18,000 € (level 3). V/T and V/M machines reach slightly higher prices (around 8000–20,000 €) (level 2). M/T and self-propelled machines are the most expensive machines and their prices range from 22,000 € and can even exceed 60,000 € (level 1).
  • Suitability for small orchards: The performances for this competing factor have been qualitatively attributed based on the most common characteristics of small orchards, e.g., mountainous areas and irregular ground, and the conditions traditionally faced by people operating in small orchards. Indeed, the high versatility of portable solutions makes them the most suitable machines for small orchards (level 5). The least appropriate machines are, conversely, the least versatile self-propelled and M/T (level 1). The V/T and V/M (level 4) are preferable than M/M (level 2) since the former are more appropriate for irregular ground.
  • Suitability for working on slopes: Lighter machines were considered the most appropriate for working on slopes; therefore, portable machines achieve the best level of performance (level 5). The worst performance was assigned to M/T (level 1) since these machines are designed for working in flat areas, they are heavy, and they have no traction system of their own. Self-propelled machines (level 2) can work in sloping ground but not with the same effectiveness as mounted or trailed machines. In turn, V/T and V/M (level 4) have a better versatility in sloping ground than M/M (level 3) because the fruits have to be reached with a tube and not with the whole machine.
  • Maneuverability: Additionally, in this case, the portable machines (level 5) exhibit the highest level of maneuverability since they can be easily moved around obstacles. SP and M/T machines (level 1) are the least flexible, heaviest, and bulkiest machines and, therefore, they have the lowest level of maneuverability. The mounted machines and the V/T (level 3) present approximately the same level of maneuverability since they have a similar size and, in both cases, the steering angle depends on the tractor.
  • Transportability: As far as transportability is concerned, M/P machines are the best ones (level 5) because they are the smallest and lightest. V/P machines have obtained a lower performance (level 4) because they are generally bulkier and heavier than M/Ps. V/T, V/M, and M/M machines (level 3) were considered at the same level of transportability because they all need a tractor to be moved and have a comparable overall size. However, the above machines are considered to be more transportable than self-propelled machines (level 2) because they can be transported easily even on trucks or vans, while the high dimensions and weights of self-propelled machines make their transportability more difficult. Due to their great weight and the need to be moved with a tractor, M/T machines present the worst transportability performance (level 1).
  • Independence from external resources: M/P machines require only an operator and, therefore, they exhibit the best performance (level 5) in terms of independence from external resources, such as multiple operators, tractors, and/or fuel. In most cases, V/P and self-propelled machines require an operator but they need fuel, so they have been assigned a lower level of performance (level 4). In the case of trailed machines (level 2), in addition to multiple operators and fuel, they also require a tractor. However, the tractor exploited for trailed machines does not have to carry the whole load, as in the case of mounted machines (level 1). For this reason, the mounted machines achieved the worst level of performance for the competing factor under consideration.
  • Capability of working with moisture: Vacuum machines are particularly sensitive to moisture. In particular, V/P machines (level 1) are the least performing because maintenance operations are frequent in moisture conditions. In addition, the operator may have difficulties in moving on a slippery ground with the portable machine. For this reason, the M/P machine does not achieve a high performance (level 2). The same level of performance was assigned to V/T and V/M machines. As for the former, the operators still have to move by handling a pipe on a slippery ground. As for the latter, the suction of foreign humid materials drastically compromises their performance. V/SP machines (level 3) often have foreign material management systems that allow them to partially overcome the problem of moisture. Therefore, these machines outperform the previously mentioned ones. Due to the best management of foreign materials, the M/SP machines (level 5) can be considered the least sensitive to the problems deriving from working with moisture. For this reason, M/T and M/M machines (level 4) were given a lower performance level than M/SP.
  • Comfort of operators: Portable machines have the lowest level of comfort (level 1) because they have to be entirely moved by the operators and, in addition, they expose the operators to weather events. V/T and V/M machines (level 2) have the same problems, but, generally, the weight to be handled is much lower because the crop is stored on the tractor or on the trailer. The weight to be handled manually is avoided in the case of M/T and M/M machines (level 4). However, these machines do not protect the operator from atmospheric agents, dust, and/or noise, as self-propelled machines (level 5) often do. Therefore, the SP machines are deemed the most comfortable for operators.
  • Storing capacity: M/P machines (level 1) generally have a storage capacity of about 5–10 L while V/P machines (level 2) can reach up to 20–30 L. V/T and mounted machines (level 3) have a storage volume generally greater than 200 L. M/T and Self-propelled machines (level 5) can also exceed 400 L.
  • Productivity: As mentioned in the previous section, the maximum productivity is achieved by self-propelled machines (level 5). However, comparable productivity levels are achieved by M/T (level 5). On the other side of the spectrum, portable machines have the worst performance. Indeed, portable machines generally have productivity levels 80–90 times lower than the self-propelled ones. Among portable machines, it is possible to discern a better productivity of V/P machines (level 2) compared to M/P machines (level 1). It is also possible to remark that M/M and V/T machines (level 4) have on average a similar productivity, which generally outperforms V/M machines (level 3).

8.2. Interpretation of Value Curves from the Viewpoint of Technical Systems

The interpretation of the value curves follows: the reasons are focused on the good and bad performances of different machines’ categories in terms of the studied competing factors. Otherwise, while the information presented in the bullet list above is oriented to the requirements, the discussion below is articulated in the perspective of families of harvesting machines.
In Figure 6, it is possible to notice the high performances of the portable solutions (black and grey lines) in terms of cheapness (level 4/5), transportability (level 4/5), maneuverability (level 5), and their suitability for small and mountainous orchards (level 5). However, portable machines present the lowest capability of separating foreign materials from the shell fruits (level 1/2) and the lowest attitude of working with moisture (level 1/2). In addition, portable solutions are the least productive (level 1/2), comfortable for operators (level 1), and they provide the lower storing capacity (level 1/2). Within the portable solutions, the vacuum machines (V/P; grey line in Figure 6) present the best performances in terms of productivity (level 2 vs. 1) and capability of separating foreign materials (level 2 vs. 1), while the mechanical solutions are generally cheaper (level 5 vs. 4), more transportable (level 5 vs. 4), and less sensitive to the moisture (level 2 vs. 1) than the other vacuum machines. In addition, M/P machines (black line in Figure 6) are the most independent from external resources, e.g., fuel (level 5).
Self-propelled machines (green lines in Figure 6) are the most productive (level 5) and comfortable (level 5) but are also the most expensive (level 1) and heavy (level 1), and their maneuverability is the lowest (level 1). However, many variants are present in the market (see Table 3) and, therefore, their performances have a larger variability than other categories; hence, some exceptions to the indications of the overall pros and cons of machines’ categories can be found. These solutions are the most appropriate for large and flat orchards. The trailed architecture presents very different performances for the two categories of M/T and V/T machines (represented by dark and light orange lines in Figure 6, respectively). This is mainly because only the US companies Weiss McNair and Flory manufacture mechanical/trailed machines (see Table 2 and Table 3) and their target is to achieve a level of productivity similar to self-propelled machines. For this reason, the M/T profile is more similar to the self-propelled ones. The V/T and the V/M architectures present similar performances (represented by light orange and light blue lines in Figure 6, respectively). Small differences emerge as for the independence from external resources (level 2 vs. 1; the mounted architecture requires a farm tractor to bear all the weight) and the productivity (level 4 vs. 3). Both these solutions represent a compromise between portable and self-propelled machines. This can be explained by the fact that, with these machines, a tractor moves the machine in the orchard while the operator, thanks to long and flexible hand-held pipes, picks up the shell fruits while walking nearby. This makes these harvesting machines highly versatile and productive. However, the low capability of working with moisture is the main problem of these machines: the moist particles of soil sucked in, indeed, progressively stick to the blades of the suction fan, forcing the machine to be cleaned periodically. The M/M machines (dark blue line in Figure 6) present the best compromise between productivity (level 4) and cost (level 3). These solutions are less suitable for working on slopes than V/M or V/T machines (level 3 vs. 4) since the tractor has to pick the shell fruits, i.e., to pass over to collect them, and, therefore, the use of these machines forces the preparation of the fruit trees in areas accessible by the tractor. In addition, M/M solutions are more comfortable for the operator than V/M or V/T machines (level 4 vs. 1/2), since the operator does not have to move the suction pipe: he can control the machine while sitting on the tractor, thus reducing the operator’s exposition to dust.

9. Discussions and Lessons Learnt

The proposed approach to build value curves can be exploited by designers intended to shed light on the current situation of an industrial domain and thus identify innovation chances, which includes the possible adoption of BOS methods. The graphical result shown in Figure 6 describes the relations between complex systems in a compact way and, therefore, it can be exploited in design and co-design contexts. However, the followed process to build the value curves cannot be considered repeatable in any circumstances—the present paper has to be considered a case study to approach the construction of value curves in a structured way, from which some lessons learnt are worth stressing. In addition, while value curves are mostly used to explain the rationale behind business strategies, their use for benchmarking technical systems in design, which requires major rigor, is not a standard process yet. An additional challenge was to harmonize the various terms used within the BOS, i.e., competing factors and competing systems with those commonly used in design, e.g., requirements, attributes, needs, benefits, functions, and technical systems. By the way, those, in turn, are not completely shared in the design field either, as demonstrated by continuous efforts to build sound taxonomies of attributes and requirements [84,85].
The authors claim that value curves were proven to be effective to compare technical systems, at least in the treated case study, by summarizing information from dispersed sources. An overview of the main advantages and disadvantages of the various categories of technical systems could be inferred from a literature search, but a comprehensive comparison of all the main categories of harvesting machines was lacking at the time of the presented study. In the specific case study, the relevant scientific literature often refers to applied research and, therefore, it mentions existing machines and their manufacturers. This has proved to be very useful both for the patent and the web search. Probably, for other industrial sectors, where the literature could be based on more theoretical research, the literature search may not be as effective as in this case. Overall, while the authors, based on their experience, believe that different sources of information are critical for the creation of value curves, the process of extracting information and reusing it for subsequent searches might differ from that of Figure 2. Comparative studies are necessary to evaluate the variability of the required information search processes. According to the authors’ perception, the following conditions might be critical:
  • The size of and variety within the considered industrial domain;
  • The level of competition within the same industrial domain;
  • The degree of maturity of the existing technical solutions;
  • The cooperation with academic partners in experimental research, which might lead to a larger or smaller number of relevant scientific publications describing applied research; and
  • The ability of the systems under investigation to fulfil technical/functional or emotional/hedonic requirements predominantly (see also the discussion below on qualitative and quantitative competing factors, which, somehow, mirrors this argument).
When it comes to the possibility of using the value curves (as those shown in Figure 6) for design and innovation scopes, the common follow-up is the use of the four action framework, i.e., the evaluation of chances to eliminate, raise, reduce, and create competing factors or their attainment level.
In the present case, it is straightforward that the requirements placed on the right and those placed on the left are satisfied by different categories of technical systems. Thanks to this graphical representation, it is possible to point out potential contradictions between groups of requirements and families of existing solutions. This can lead to the definition of the requirements for the development of new machines, envisaging hybridizations (similarly to the NetJets example in [35]) between systems that meet different requirements, e.g., designing a more maneuverable vacuum/self-propelled by hybridizing it with a vacuum/(trailed or portable). Otherwise, with reference to the four-action framework, performances of different competing factors would be alternatively raised and reduced. Clearly, this process might be characterized by the following circumstances:
  • The design team aims at a radical innovation;
  • The contextual fulfilment of requirements in the left- and right-hand side of the curves has to make sense in terms of targeting a specific group of stakeholders and/or working conditions;
  • The design team is aware that the hybridization of requirements does not necessarily lead to the hybridization of structures; and
  • The hybridization process might trigger contradictions, as aforementioned, and TRIZ (i.e., the Theory of Inventive Problem Solving [86]) can represent a good candidate to handle this kind of problem, given its nature of working with conflicting requirements.
Yet, the value curves are diffusedly used to spot disruptively new value propositions, and this might represent a chance for technical systems beyond business differentiation strategies.
On the one hand, one of the means to achieve a substantial differentiation with respect to existing systems is the definition of new product attributes through the create action. Therefore, it is appropriate to investigate which attributes are currently overlooked by the systems under investigation. In this respect, the authors’ future work intends to consider aspects that have been partially neglected in the gathered sources and that are deemed critical to the design of successful products [87,88], e.g., environmental sustainability, which is increasingly seen as a trigger for innovation [89,90]. It is worth noting that many of the competing factors compared within the value curves are ascribable to quantitative parameters or they are the result of considering multiple quantitative measures contextually. When it comes to sustainability or other quality factors that are not directly measurable, a larger extent of subjectivity in establishing the performance level might be present. From a different viewpoint, papers and catalogs might be prone to reporting quantitative indications of technical performances, whilst qualitative aspects might be lacking because of assessment or evaluation obstacles, i.e., the superiority of a new system in terms of a specific competing factor cannot be easily proven. This aspect is worth investigating by repeating the process of value curve creation for different families of technical systems and, markedly, those for which emotional aspects are more emphasized, e.g., consumer goods instead of working instruments.
On the other hand, a designer can verify the effects, in terms of value, of introducing technically disruptive changes to the existing systems, somehow mirroring a proactive technology-push strategy [8]. This might take place by envisioning which requirements would be modified, whether new benefits would be satisfied, and, then, comparing a brand-new value curve to existing ones, to determine to which extent a new value proposition would differ from existing ones. Otherwise, the value curves can be used proactively (i.e., in establishing new targets, such as sustainability in the example above) or as a means to verify the impact of technology-push innovation in the current context. Here, the acquired knowledge of harvesting machines can be used as a case in point for the verification of the potential effects of digitalization, which might have significant repercussions in terms of user experience [91,92]. In fact, it can be noted that, in the described context of harvesting machines, digitalization is somehow absent, whereas the effects of the use of data or the Internet of Things, increasingly making inroads in agriculture [93,94,95], are worth investigating. An additional technological/organizational paradigm shift that is increasingly focused on and that has not surfaced in the field of harvesting machines is the servitization or the introduction of product service systems [96]. Here, the embracement of the servitization trend in the agricultural domain at large is less evident than the adoption of digital technologies, e.g., LiDAR (i.e., Light Detection And Ranging [97,98]); a few explicit examples are reported in [99,100]. However, the exchanges of services and labor among players in the agricultural context are established over decades and have likely not attracted academic research.
Value curves and their creation process are plainly not immune from limitations and shortcomings. For instance, the value curves shown in this paper refer to families of machines, and each family satisfies each competing factor with a certain variability. Even if this variability could be easily mapped for measurable performances, a possible representation of the latter would worsen the readability and, consequently, the usability of the graph. Although the authors believe that a reasonable process was followed, and this was supported by the presence of a shared taxonomy for the investigated systems, a certain degree of subjectivity and arbitrariness is present in all the process steps and, in particular, with regard to the items that follow:
  • The determination of the boundaries of the “right” system to be investigated, e.g., the exclusion of harvesting machines for water chestnuts;
  • The definition of the “right” level of abstraction for benefits and corresponding competing factors, here supported by the reasoning process described in Figure 5; and
  • The attribution of performance levels, especially in light of the need to make the scale uniform for all competing factors. This might be affected also by the different conditions and circumstances of use of harvesting machines for shell fruits that have given rise to performances and experimental results, which were subsequently used by the authors to determine levels for the competing factors. It is straightforward that these nuances cannot be taken in due consideration when a benchmarking tool is used, and the domain of investigation is quite large. Nevertheless, the use of an ordered scale (1–5) as an approximation of quantitative measures supposedly lessens the effect of overlooking diverging use and experimental conditions.
A further limitation of value curves is the possibility to depict an instantaneous picture of the ongoing situation only, while there is no chance of understanding changes or inferring trends. A methodological development could be featured by dynamic value curves, where the transformation of fulfilled competing factors and performance levels could be observed. As the complete data, which the authors are fully available to share, include the publication and issue years of the gathered documents, those can support future work intended to monitor the evolution of value curves over time. This might support a more insightful understanding of the evolution of harvesting machines for shell fruits. For instance, a potential interesting point to be investigated concerns the reasons for the limited interest for M/P machines from the 1960s to the 2000s (see Appendix A), while those devices have been predominantly focused on at the beginning and the end of the considered time interval (from the 1950s onwards).

10. Conclusions

In this paper, value curves were created through a structured information search and targeted the presentation of design requirements in a non-redundant way. The management of knowledge to summarize the relation between competing systems and the requirements they fulfil was shown step by step, applied to the harvesting machines for shell fruits. The use of a structured approach based on (1) a logical decomposition of the harvesting operation, (2) the generation of corresponding suitable search terms (pushed by the “SAO” methodology), and (3) the use of logical operators, allowed the collection of pertinent scientific articles and patents, which led to the identification of 84 machines. From these sources, it was possible to identify 8 categories of machines and 11 competing factors that characterize the requirements thereof. The attribution of a performance value (from 1 to 5) to each of the 11 competing factors was then graphically displayed through value curves, useful to perform synoptic comparisons. It emerged that the main differences between the individuated families of machines are mainly ascribable to the way they are moved in the orchard to approach the shell fruits. Indeed, this has important implications on the general handling of the machine, more than on the collection performance. In addition, the handling-related categories pertain to a series of choices of general architecture instead of specific solutions, so there is a limited margin for improvement. The locus of possible future improvement is instead the subsystem for the collection of the shell fruits. Even if the excellent characteristics of the vacuum machines justify their economic success and make them the most suitable for any type of orchard, the analysis has also shown that there is a major limitation in their operation: in the presence of moisture, the suction system undergoes a fouling phenomenon. Any future efforts by manufacturers should therefore focus on improving this subsystem, thus overcoming the remarked limitations.
From a methodological point of view, the discussion section points out which are the potential keys of reading of the presented value curves, along with their limitations. To test the convergence of value curves’ interpretation, future work intends to involve experts in the field and ask them which conclusions they would draw from the curves themselves. Moreover, the involvement of experienced users could target the agreement on human-related requirements, e.g., comfort, the identification of tacit competing factors the literature has not elicited, and the identification of unmet needs and corresponding product attributes to steer a user-centered (co-)design process [101]. However, the latter could be affected by the circumstance that users and consumers hardly support the individuation of keys to breakthrough innovation [8], which somehow conflicts with the conventional reasons for employing value curves.
Any research group interested in repeating the present work could help evaluate the convergence of the followed process and the outputs in terms of value curves’ description (listed competing systems, chosen competing factors, fulfilled requirements). Given the benchmarking scope of value curves, convergence between multiple scholars’ or designers’ teams could trigger their diffusion also in the educational field. Here, based on the authors’ experience, many design and product development modules require students to acquire knowledge of the products and systems under investigation before creative design activities are carried out. Hence, value curves could be useful to collect the necessary information and schematize it prior to making decisions on design requirements and specifications for the subsequent product development phases. Still within design, an additional contribution of the present paper might be represented by the proposal, which is conducive to the construction of the value curves, to clarify some terms diffusedly used as synonyms, e.g., needs, requirements, attributes, benefits.

Author Contributions

The authors contributed equally to each part of this work. All authors have read and agreed to the published version of the manuscript.

Funding

The present study is supported by the project “fine-tuning new and smart ECO-design guidelines” (“few sECOnds”), funded by the Free University of Bozen/Bolzano (RTD 2019 call). The publication of this work is supported by the Open Access Publishing Fund of the Free University of Bozen/Bolzano.

Conflicts of Interest

The authors declare no conflict of interest. The funders had no role in the design of the study; in the collection, analyses, or interpretation of data; in the writing of the manuscript, or in the decision to publish the results.

Appendix A

List of the pertinent patents emerged by the search carried out on Esp@cenet. The patents and patent applications were classified based on the typologies of machines: the labels for these categories have the same meaning as in Table 2. To save space, the table is arranged in two groups of columns having the same meaning.
The table is followed by a histogram showing the number of patents ordered according to their publication decade and characterized in terms of the category of harvesting machine they feature.
Publication NumberPublication YearProduct CategoryPublication NumberPublication YearProduct Category
ITAN20150004 (U1)2013M/PUS3728850 (A)1971M/SP
ITRO20140004 (U1)2016M/PUS2005229576 (A1)2005M/SP
EP2945474 (B1)2019M/PFR2702923 (A1)1993M/SP
ITUB201586616 (U1)2019M/PITGE20130111 (A1)2015M/SP
CN209030627 (U)2019M/PITTO20110326 (A1)2012M/SP
CN208908618 (U)2019M/PITVT20100001 (A1)2011M/SP
CN109429728 (A)2019M/PIT1311260 (B1)2002M/SP
CN108156958 (A)2018M/PIT1260582 (B)1993M/SP
CN107409637 (A)2017M/PUS4364222 (A)1982M/SP
CN104982157 (A)2015M/PUS3862538 (A)1975M/SP
WO2013064660 (A1)2013M/PUS3488932 (A)1970M/SP
CN201123256 (Y)2008M/PUS3107475 (A)1963M/SP
ES2051164 (A2)1994M/PUS3105344 (A)1963M/SP
US3744225 (A)1973M/PUS3105343 (A)1963M/SP
US2835099 (A)1958M/PUS2780904 (A)1957M/SP
US2810252 (A)1957M/PUS2679133 (A)1954M/SP
US2792683 (A)1957M/PUS2594776 (A)1952M/SP
US2694284 (A)1954M/PUS2514945 (A)1950M/SP
US2690044 (A)1954M/PEP0862847 (B1)1999V/P
US2540857 (A)1951M/PUS3808785 (A)1974V/P
US5001893 (A)1991M/TITTO20120154 (U1)2014V/T
US5373688 (A)1994M/TTR201405959 (A2)2015V/T
US2534405 (A)1950M/TUS4322940 (A)1982V/T
IT1259922 (B)1993M/TFR2590112 (B3)1987V/M
US3407581 (A)1968M/TES8704315 (A1)1987V/M
US3387442 (A)1968M/TFR2352485 (B1)1977V/M
US3261152 (A)1966M/TUS3611688 (A)1971V/SP
US2639573 (A)1953M/TUS2978859 (A)1961V/SP
US2508454 (A)1950M/TUS2593625 (A)1952V/SP
CN207678313 (U)2018M/MUS2502810 (A)1950V/SP
ITRM20130059 (U1)2014M/MEP3226676 (B1)2018OD
CN103262712 (B)2013M/MAU2014202410 (A1)2014OD
RU2076567 (C1)1997M/MITTO20100696 (A1)2012OD
US3675405 (A)1972M/MIT1259922 (B)1996OD
US2928225 (A)1960M/MIT1249080 (B)1995OD
Applsci 10 03809 i009

References

  1. Song, Y.W.; Herzog, M.; Bender, B. Understanding the initial requirements definition in early design phases. In Proceedings of the Design Society: International Conference on Engineering Design, Delft, The Netherlands, 5–8 August 2019; Cambridge University Press: Cambridge, UK, 2019; Volume 1, pp. 3751–3760. [Google Scholar] [CrossRef] [Green Version]
  2. Fernandes, J.; Henriques, E.; Silva, A.; Moss, M.A. Requirements change in complex technical systems: An empirical study of root causes. Res. Eng. Des. 2015, 26, 37–55. [Google Scholar] [CrossRef]
  3. Peruzzini, M.; Marilungo, E.; Germani, M. Structured requirements elicitation for product-service system. Int. J. Agil. Syst. Manag. 2015, 8, 189–218. [Google Scholar] [CrossRef]
  4. Bietresato, M.; Mazzetto, F. Increasing the safety of agricultural machinery operating on sloping grounds by performing static and dynamic tests of stability on a new-concept facility. Int. J. Saf. Secur. Eng. 2018, 8, 77–89. [Google Scholar] [CrossRef]
  5. Bietresato, M.; Mazzetto, F. Definition of the Layout for a New Facility to Test the Static and Dynamic Stability of Agricultural Vehicles Operating on Sloping Grounds. Appl. Sci. 2019, 9, 4135. [Google Scholar] [CrossRef] [Green Version]
  6. Morkos, B.; Joshi, S.; Summers, J.D. Investigating the impact of requirements elicitation and evolution on course performance in a pre-capstone design course. J. Eng. Des. 2019, 30, 155–179. [Google Scholar] [CrossRef]
  7. Cascini, G.; Graziosi, S.; Montagna, F.; Rotini, F. On the Factors Affecting Design Education Within a Multi-Disciplinary Class. J. Integr. Des. Process. Sci. 2017, 21, 21–44. [Google Scholar] [CrossRef]
  8. Bacciotti, D.; Borgianni, Y.; Cascini, G.; Rotini, F. Product Planning techniques: Investigating the differences between research trajectories and industry expectations. Res. Eng. Des. 2016, 27, 367–389. [Google Scholar] [CrossRef] [Green Version]
  9. Durugbo, C.; Riedel, J.C. Viewpoint–participation–technique: A model of participative requirements elicitation. Concurr. Eng. 2013, 21, 3–12. [Google Scholar] [CrossRef]
  10. Martin, J.L.; Clark, D.J.; Morgan, S.P.; Crowe, J.A.; Murphy, E. A user-centred approach to requirements elicitation in medical device development: A case study from an industry perspective. Appl. Ergon. 2012, 43, 184–190. [Google Scholar] [CrossRef]
  11. Blanco, E.; Pourroy, F.; Arikoglu, S. Role of personas and scenarios in creating shared understanding of functional requirements: An empirical study. In Design Computing and Cognition; Springer: Dordrecht, The Netherlands, 2014; Volume 12, pp. 61–78. [Google Scholar] [CrossRef] [Green Version]
  12. Barré, J.; Buisine, S.; Aoussat, A. Persona logical thinking: Improving requirements elicitation for multidisciplinary teams. CoDesign 2018, 14, 218–237. [Google Scholar] [CrossRef]
  13. Bertoni, M.; Bertoni, A.; Isaksson, O. Evoke: A value-driven concept selection method for early system design. J. Syst. Sci. Syst. Eng. 2018, 27, 46–77. [Google Scholar] [CrossRef]
  14. Prudhomme, G.; Pourroy, F.; Summers, J.D. Enriching requirement-activities in design through french-US instruction comparison. In Proceedings of the DS 75-8: 19th International Conference on Engineering Design (ICED13), Design for Harmonies, Design Education, Seoul, Korea, 19–22 August 2013; Volume 8, pp. 115–124. [Google Scholar]
  15. Morkos, B.; Shankar, P.; Summers, J.D. Predicting requirement change propagation, using higher order design structure matrices: An industry case study. J. Eng. Des. 2012, 23, 905–926. [Google Scholar] [CrossRef] [Green Version]
  16. Borgianni, Y.; Rotini, F. Towards the fine-tuning of a predictive Kano model for supporting product and service design. Total Qual. Manag. Bus. Excell. 2015, 26, 263–283. [Google Scholar] [CrossRef]
  17. Chakrabarti, A.; Morgenstern, S.; Knaab, H. Identification and application of requirements and their impact on the design process: A protocol study. Res. Eng. Des. 2004, 15, 22–39. [Google Scholar] [CrossRef]
  18. Becattini, N.; Cascini, G.; Rotini, F. Requirements Checklists: Benchmarking the Comprehensiveness of the Design Specification. In Proceedings of the 20th International Conference on Engineering Design (ICED 15), Milan, Italy, 27–30 July 2015; Volume 1, pp. 1–10. [Google Scholar]
  19. Fiorineschi, L.; Becattini, N.; Borgianni, Y.; Rotini, F. Testing a New Structured Tool for Supporting Requirements’ Formulation and Decomposition. Appl. Sci. 2020, 10, 3259. [Google Scholar] [CrossRef]
  20. Eastman, C.M. Recent developments in representation in the science of design. Des. Stud. 1982, 3, 45–52. [Google Scholar] [CrossRef]
  21. Ouertani, M.Z.; Gzara, L. Tracking product specification dependencies in collaborative design for conflict management. Comput.-Aided Des. 2008, 40, 828–837. [Google Scholar] [CrossRef] [Green Version]
  22. Joskowicz, L. Mechanism comparison and classification for design. Res. Eng. Des. 1990, 1, 149–166. [Google Scholar] [CrossRef]
  23. Thevenot, H.J.; Simpson, T.W. Guidelines to minimize variation when estimating product line commonality through product family dissection. Des. Stud. 2007, 28, 175–194. [Google Scholar] [CrossRef]
  24. Simpson, T.W.; Bobuk, A.; Slingerland, L.A.; Brennan, S.; Logan, D.; Reichard, K. From user requirements to commonality specifications: An integrated approach to product family design. Res. Eng. Des. 2012, 23, 141–153. [Google Scholar] [CrossRef]
  25. Berthet, E.T.; Hickey, G.M.; Klerkx, L. Opening design and innovation processes in agriculture: Insights from design and management sciences and future directions. Agric. Syst. 2018, 165, 111–115. [Google Scholar] [CrossRef]
  26. Prost, L.; Berthet, E.T.; Cerf, M.; Jeuffroy, M.H.; Labatut, J.; Meynard, J.M. Innovative design for agriculture in the move towards sustainability: Scientific challenges. Res. Eng. Des. 2017, 28, 119–129. [Google Scholar] [CrossRef] [Green Version]
  27. Murray, C.; Doak, J.; McNeil, K.; Oms, P. Participatory Design Methods When Working in Remote Locations: The Case of Red Puna in North West Argentina. Des. J. 2020, 23, 239–262. [Google Scholar] [CrossRef]
  28. Bayissa, D.D. Scrutinizing Factors Impeding Research-Farmer Relationship in the Context of the Agriculture Innovation System. Am. J. Bus. Manag. 2015, 4, 180–189. [Google Scholar] [CrossRef]
  29. Gokhberg, L.; Kuzminov, I.; Chulok, A.; Thurner, T. The future of Russia’s agriculture and food industry between global opportunities and technological restrictions. Int. J. Agric. Sustain. 2017, 15, 457–466. [Google Scholar] [CrossRef]
  30. Minh, T.T. Unpacking the systemic problems and blocking mechanisms of a regional agricultural innovation system: An integrated regional-functional-structural analysis. Agric. Syst. 2019, 173, 268–280. [Google Scholar] [CrossRef]
  31. Ohikere, J.Z.; Arudi, I.S. Challenges to the transfer of agricultural technologies in Nigeria. NISEB J. 2019, 11, 29–35. [Google Scholar]
  32. Kozhevnikova, T.M.; Yurina, E.A. Innovation activity as a major factor in development of agriculture. GISAP. Econ. Jurisprud. Manag. 2013, 1, 30–33. [Google Scholar]
  33. Lyons, T.S.; Miller, S.R.; Mann, J.T. A new role for land grant universities in the rural innovation ecosystem? J. Reg. Anal. Policy 2018, 48, 3775. [Google Scholar]
  34. Läpple, D.; Renwick, A.; Thorne, F. Measuring and understanding the drivers of agricultural innovation: Evidence from Ireland. Food Policy 2015, 51, 1–8. [Google Scholar] [CrossRef]
  35. Kim, W.C.; Mauborgne, R. How to create uncontested market space and make the competition irrelevant. Harv. Bus. Rev. 2005, 4, 1–2. [Google Scholar]
  36. Sheehan, N.T.; Bruni-Bossio, V. Strategic value curve analysis: Diagnosing and improving customer value propositions. Bus. Horiz. 2015, 58, 317–324. [Google Scholar] [CrossRef]
  37. Wiesner, S.; Padrock, P.; Thoben, K.D. Extended product business model development in four manufacturing case studies. Procedia Cirp 2014, 16, 110–115. [Google Scholar] [CrossRef] [Green Version]
  38. Pérez, P.B.; González-Cruz, M.C.; Pastor-Ferrando, J.P. Analysis of construction projects by means of value curves. Int. J. Proj. Manag. 2010, 28, 719–731. [Google Scholar] [CrossRef]
  39. Love, E.; Stone, D.E.; Wilton, T. Teaching user-centered design in new product marketing. Mark. Educ. Rev. 2011, 21, 29–34. [Google Scholar] [CrossRef]
  40. Koomsap, P. Design by customer: Concept and applications. J. Intell. Manuf. 2013, 24, 295–311. [Google Scholar] [CrossRef]
  41. Wubben, E.F.M.; Düsseldorf, S.; Batterink, M.H. Finding uncontested markets for European fruit and vegetables through applying the Blue Ocean Strategy. Br. Food J. 2012, 114, 248–271. [Google Scholar] [CrossRef]
  42. Abdolshah, M.; Fazli Besheli, B.; Fazli Besheli, S.; Norouzi, A. Strategic Planning for Agriculture Section using Swot, QSPM and Blue ocean-case Study: Eshraq Agro-industry company. Int. J. Agric. Manag. Dev. 2018, 8, 149–162. [Google Scholar]
  43. Borgianni, Y.; Cardillo, A.; Cascini, G.; Rotini, F. Systematizing new value proposition through a TRIZ-based classification of functional features. Procedia Eng. 2011, 9, 103–118. [Google Scholar] [CrossRef] [Green Version]
  44. Roozenburg, N.F.M.; Eekels, J. Product Design: Fundamentals and Methods; John Wiley and sons, Inc.: Hoboken, NJ, USA, 1991. [Google Scholar]
  45. Torres, M.D.; Moreira, R.; Chenlo, F.; Morel, M.H.; Barron, C. Physicochemical and structural properties of starch isolated from fresh and dried chestnuts and chestnut flour. Food Technol. Biotechnol. 2014, 52, 135–139. [Google Scholar]
  46. Zhu, Y.; Yin, Y.; Yang, K.; Li, J.; Sang, Y.; Huang, L.; Fan, S. Construction of a high-density genetic map using specific length amplified fragment markers and identification of a quantitative trait locus for anthracnose resistance in walnut (Juglans regia L.). BMC Genom. 2015, 16, 614. [Google Scholar] [CrossRef] [PubMed] [Green Version]
  47. Milošević, T.; Milošević, N. Determination of size and shape features of hazelnuts using multivariate analysis. Acta Sci. Pol. Hortorum Cultus 2017, 16, 49–61. [Google Scholar] [CrossRef]
  48. Pascuzzi, S.; Santoro, F. Analysis of the almond harvesting and hulling mechanization process: A case study. Agriculture 2017, 7, 100. [Google Scholar] [CrossRef] [Green Version]
  49. Kårlund, A.; Moor, U.; Sandell, M.; Karjalainen, R.O. The impact of harvesting, storage and processing factors on health-promoting phytochemicals in berries and fruits. Processes 2014, 2, 596–624. [Google Scholar] [CrossRef] [Green Version]
  50. El-Emam, M.A.; Ahmed, S.F.; Sabah, M.A.; Nasif, S.; Shi, W.; Zhou, L. Design and construction of a pneumatic harvesting and cleaning machine for jojoba seeds. Eng. Agric. Environ. Food 2019, 12, 451–459. [Google Scholar] [CrossRef]
  51. Prasad, K.; Jacob, S.; Siddiqui, M.W. Fruit maturity, harvesting, and quality standards. Preharvest Modul. Postharvest Fruit Veget. Qual. 2018, 41–69. [Google Scholar] [CrossRef]
  52. Fu, L.; Al-Mallahi, A.; Peng, J.; Sun, S.; Feng, Y.; Li, R.; Dongjian, H.; Cui, Y. Harvesting technologies for Chinese jujube fruits: A review. Eng. Agric. Environ. Food 2017, 10, 171–177. [Google Scholar] [CrossRef]
  53. Peterson, T.R.; Waal, S.; Feinstein, A.; Purdy, D. Raspberry Harvesting Efficiency Improvement; California Polytechnic State University: San Luis Obispo, CA, USA, 2018. [Google Scholar]
  54. Litvin, S. New TRIZ-Based Tool—Function-Oriented Search (FOS). In Proceedings of theTRIZ Future Conference, Firenze, Italy, 3–5 November 2004; pp. 505–508. [Google Scholar] [CrossRef]
  55. Russo, D.; Carrara, P.; Facoetti, G. Technical problem identification for supervised state of the art. IFAC-PapersOnLine 2018, 51, 1341–1346. [Google Scholar] [CrossRef]
  56. Monarca, D.; Cecchini, M.; Biondi, P.; Colopardi, F.; Guerrieri, M. Machines for shell fruits harvesting: Technical and economic aspects. Acta Hortic. 2012, 940, 171–178. [Google Scholar] [CrossRef]
  57. Monarca, D.; Cecchini, M.; Guerrieri, M.; Santi, M.; Colopardi, F. The evolution of the hazelnut harvesting technique. Acta Hortic. 2009, 845, 353–358. [Google Scholar] [CrossRef]
  58. Monarca, D.; Cecchini, M.; Colantoni, A.; Menghini, G.; Moscetti, R.; Massantini, R. The evolution of the chestnut harvesting technique. Acta Hortic. 2014, 1043, 219–225. [Google Scholar] [CrossRef]
  59. Monarca, D.; Cecchini, M.; Antonelli, D. Innovations in harvesting machines. Acta Hortic. 2005, 686, 343–350. [Google Scholar] [CrossRef]
  60. Monarca, D.; Cecchini, M.; Antonelli, D. Modern machines for walnut harvesting. Acta Hortic. 2005, 705, 505–513. [Google Scholar] [CrossRef]
  61. Fanigliulo, R.; Tomasone, R. Operative performance and work quality of a hazelnut pick-up machine. Acta Hortic. 2009, 845, 425–430. [Google Scholar] [CrossRef]
  62. Monarca, D.; Cecchini, M.; Antonelli, D.; Mordacchini Alfani, M.L.; Salcini, M.C.; Massantini, R. Mechanical harvesting and quality of “Marroni” chestnut. Acta Hortic. 2005, 682, 1193–1198. [Google Scholar] [CrossRef]
  63. Monarca, D.; Cecchini, M.; Antonelli, D. The influence of mechanical harvesting on the quality of chestnuts: Experiences in the Monti Cimini Area. Acta Hortic. 2003, 599, 611–616. [Google Scholar] [CrossRef]
  64. Bernardi, B.; Stillitano, T.; De Luca, A.I.; Abenavoli, L.M.; Zimbalatti, G.; Benalia, S.; Tous, J. The assessment of hazelnut mechanical harvesting productivity. Agron. Res. 2017, 15, 1491–1497. [Google Scholar] [CrossRef]
  65. Yildiz, T. Labor requirements and work efficiencies of hazelnut harvesting using traditional and mechanical pick-up methods. TURKISH J. Agric. For. 2016, 40, 301–310. [Google Scholar] [CrossRef]
  66. Berruto, R.; Ghiotti, G. Chestnut harvester for mountainous areas. Acta Hortic. 1999, 494, 101–106. [Google Scholar] [CrossRef]
  67. De Kleine, M.E.; Guyer, D.E. Design, Development, and Evaluation of a Single-Stage Combined Chestnut Harvesting and Material Separation Concept. Appl. Eng. Agric. 2013, 29, 823–829. [Google Scholar] [CrossRef]
  68. Colorio, G.; Tomasone, R.; Cedrola, C.; Pagano, M. Overall mechanization of hazelnut orchards in Southern Italy. Acta Hortic. 2009, 845, 419–424. [Google Scholar] [CrossRef]
  69. Asquini. Mechanical Buildings 2011. Available online: http://www.asquini.org/en/costruzioni_meccaniche.php (accessed on 20 March 2020).
  70. Bonaddio, M. Raccoglitore Nocciole, Olive, Castagne, Ghiande e noci 2016. Available online: https://www.bonaddio.it/raccoglitore-nocciole-olive-castagne-ghiande-noci/ (accessed on 20 March 2020).
  71. Bosco. Macchine Raccolta da Terra 2016. Available online: https://www.bosco-v.it/macchine-raccolta-da-terra/ (accessed on 20 March 2020).
  72. Chianchia. Macchine lavorazione frutta a guscio n.d. Available online: https://www.chianchia.it/negozio/index.php?id_category=28&controller=category&id_lang=1 (accessed on 20 March 2020).
  73. Cifarelli. Aspiratore V1200E 2020. Available online: https://www.cifarelli.it/index.php/Prodotto?l=1&p=9 (accessed on 20 March 2020).
  74. Facma. Our Products 2020. Available online: https://www.facma.it/prodotti.asp?lang=eng (accessed on 20 March 2020).
  75. Flory Industries Products. Available online: https://www.goflory.com/index.php/products (accessed on 20 March 2020).
  76. Harvesters Machines. GF Costruzioni Macchine Agricole n.d. Available online: https://www.gf-srl.it/en/harvesters-machines/ (accessed on 20 March 2020).
  77. Giampi. Our Products 2019. Available online: https://www.giampimacchineagricole.com/en/prodotti-2/ (accessed on 20 March 2020).
  78. Hasatsan Harvesting Machinery. Products 2019. Available online: https://www.hasatsan.com.tr/en/products (accessed on 20 March 2020).
  79. Industries Garriga sl. Available online: https://www.industriesgarriga.com/productos/ (accessed on 20 March 2020).
  80. Monchiero. Macchine Specializzate per i Professionisti delle Castagne n.d. Available online: https://www.monchiero.com/raccoglicastagne/ (accessed on 20 March 2020).
  81. Rivmec. Hazelnut Harvester 2019. Available online: https://rivmec.com/en/macchina-raccolta-nocciole/ (accessed on 20 March 2020).
  82. Valier. Roll-in: Collecting Made Easy! n.d. Available online: https://roll-in.it/?gclid=CjwKCAiAhc7yBRAdEiwAplGxX11Z9RyFj4lfkCaVQibSH2-oIJTh-WSWjYLUpTHia9_5N5lM91fAaBoCo3YQAvD_BwE (accessed on 20 March 2020).
  83. Weiss, M. Harvesters 2020. Available online: https://www.weissmcnair.com/harvesters (accessed on 20 March 2020).
  84. Cascini, G.; Fantoni, G.; Montagna, F. Situating needs and requirements in the FBS framework. Des. Stud. 2013, 34, 636–662. [Google Scholar] [CrossRef]
  85. Stylidis, K.; Wickman, C.; Söderberg, R. Perceived quality of products: A framework and attributes ranking method. J. Eng. Des. 2020, 31, 37–67. [Google Scholar] [CrossRef] [Green Version]
  86. Altshuller, G.S. Creativity as an Exact Science: The Theory of the Solution of Inventive Problems; Gordon and Breach Science Publishers Inc.: New York, NY, USA, 1984. [Google Scholar]
  87. Dinter, B. Success factors for information logistics strategy-An empirical investigation. Decis. Support Syst. 2013, 54, 1207–1218. [Google Scholar] [CrossRef]
  88. Maccioni, L.; Borgianni, Y. A Product Success Scale for Supporting Research in Engineering Design. In Proceedings of the 2018 15th International Design Conference, Dubrovnik, Croatia, 21–24 May 2018; pp. 69–80. [Google Scholar] [CrossRef]
  89. Bertoni, M. Introducing sustainability in value models to support design decision making: A systematic review. Sustainability 2017, 9, 994. [Google Scholar] [CrossRef] [Green Version]
  90. Maccioni, L.; Borgianni, Y.; Rotini, F. Sustainability as a value-adding concept in the early design phases? Insights from stimulated ideation sessions. In Proceedings of the International Conference on Sustainable Design and Manufacturing, Bologna, Italy, 26–28 April 2017; Springer: Cham, Swizerland, 2017; pp. 888–897. [Google Scholar] [CrossRef]
  91. Hylving, L. Competing values in the era of digitalization. In Proceedings of the 2015 48th Hawaii International Conference on System Sciences, Kauai, Hawaii, 5–8 January 2015; IEEE: Piscataway, NJ, USA, 2015; pp. 4161–4170. [Google Scholar] [CrossRef]
  92. Borgianni, Y.; Rauch, E.; Maccioni, L.; Mark, B.G. User Experience Analysis in Industry 4.0—The Use of Biometric Devices in Engineering Design and Manufacturing. In Proceedings of the International Conference on Industrial Engineering and Engineering Management, Bangkok, Thailand, 16–19 December 2018; IEEE: Piscataway, NJ, USA, 2018; pp. 192–196. [Google Scholar] [CrossRef]
  93. Gondchawar, N.; Kawitkar, R.S. IoT based smart agriculture. Int. J. Adv. Res. Comput. Commun. Eng. 2016, 5, 838–842. [Google Scholar] [CrossRef]
  94. Suma, N.; Samson, S.R.; Saranya, S.; Shanmugapriya, G.; Subhashri, R. IOT based smart agriculture monitoring system. Int. J. Recent Innov. Trends Comput. Commun. 2017, 5, 177–181. [Google Scholar]
  95. Symeonaki, E.; Arvanitis, K.; Piromalis, D. A Context-Aware Middleware Cloud Approach for Integrating Precision Farming Facilities into the IoT toward Agriculture 4.0. Appl. Sci. 2020, 10, 813. [Google Scholar] [CrossRef] [Green Version]
  96. Annarelli, A.; Battistella, C.; Nonino, F. Product service system: A conceptual framework from a systematic review. J. Clean. Prod. 2016, 139, 1011–1032. [Google Scholar] [CrossRef]
  97. Bietresato, M.; Vidoni, R.; Gasparetto, A.; Mazzetto, F. Design and first tests of a vision system on a tele-operated vehicle for monitoring the canopy vigour status in orchards. In Proceedings of the 1st Conference on Proximal Sensing Supporting Precision Agriculture—Held at Near Surface Geoscience, Turin, Italy, 6–10 September 2015. [Google Scholar] [CrossRef]
  98. Bietresato, M.; Carabin, G.; Vidoni, R.; Gasparetto, A.; Mazzetto, F. Evaluation of a LiDAR-based 3D-stereoscopic vision system for crop-monitoring applications. Comput. Electron. Agric. 2016, 124, 1–13. [Google Scholar] [CrossRef]
  99. Devisscher, T.; Mont, O. An analysis of a product service system in Bolivia: Coffee in Yungas. Int. J. Innov. Sustain. Dev. 2008, 3, 262–284. [Google Scholar] [CrossRef]
  100. Ziout, A.; Azab, A. Industrial product service system: A case study from the agriculture sector. Procedia CIRP 2015, 33, 64–69. [Google Scholar] [CrossRef]
  101. Wilkinson, C.R.; De Angeli, A. Applying user centred and participatory design approaches to commercial product development. Des. Stud. 2014, 35, 614–631. [Google Scholar] [CrossRef]
Figure 1. Illustrative example of value curves.
Applsci 10 03809 g001
Figure 2. Structure of the information search performed in the present paper to allow for the building of value curves.
Applsci 10 03809 g002
Figure 3. Intermediate steps related to machine functions required to harvest shell fruits from an orchard and collect them in a truck.
Applsci 10 03809 g003
Figure 4. Search, screening, and selection results of the process to individuate relevant patents in the field of harvesting machines for shell fruits.
Applsci 10 03809 g004
Figure 5. Competing factors and their classification.
Applsci 10 03809 g005
Figure 6. Value curves for the eight categories of harvesting machines for shell fruits.
Applsci 10 03809 g006
Table 1. Visual illustration of the eight categories of harvesting machines for shell fruits based on the two indicated functioning principles as classification keys.
Movement of Machines in the OrchardsRemoval the Shell Fruits from the Orchard Ground
Vacuum (V/•)Mechanical (M/•)
Portable
(•/P)
Applsci 10 03809 i001 Applsci 10 03809 i002
US3808785 (A)EP2945474 (B1)
Trailed
(•/T)
Applsci 10 03809 i003
US4322940 (A)
Applsci 10 03809 i004
US5001893 (A)
Mounted
(•/M)
Applsci 10 03809 i005 Applsci 10 03809 i006
FR2590112 (B3)US2928225 (A)
Self-propelled
(•/SP)
Applsci 10 03809 i007
US2502810 (A)
Applsci 10 03809 i008
FR2702923 (A1)
Table 2. Main companies/manufacturers cited in the literature and/or applicants of patents.
Company NameRef.Categories of Harvesting Machines in Production (Number of Variants)Related Patents or Patent Applications
Asquini [69]M/SP(1); V/SP(1)ITVT20100001 (A1)
Bonaddio[70]M/P(1)ITAN20150004 (U1)
Bosco[71]M/SP(5)-
Chianchia[72]M/P(1); M/M(1); V/T(2); V/M(2)IT1311260 (B1)
Cifarelli[73]V/P(1)EP0862847 (B1)
EP3226676 (B1)
Facma[74]M/M(1); M/SP(1); V/T(4); V/SP(5)ITGE20130111 (A1)
IT1249080 (B)
Flory[75]M/T(2); M/M(2); M/SP(9)US3728850 (A)
GF costruzione macchine agricole (GF Jolly)[76]M/M(4); M/SP(3)-
Giampi[77]M/M(6); M/SP(1); V/T(2); V/M(1)ITRM20130059 (U1)
Hasatsan[78]M/M(3); V/T(6)-
IND Garriga[79]M/M(2); V/T(2); V/M(1)ES2051164 (A2)
Monchiero[80]M/SP(5); V/T(1)AU2014202410 (A1)
ITTO20120154 (U1)
ITTO20110326 (A1)
ITTO20100696 (A1)
Rivmec[81]M/M(1)-
Valier[82]M/P(1)ITUB201586616 (U1)
EP2945474 (B1)
WO2013064660 (A1)
ITRO20140004 (U1)
WO2013064660 (A1)
Weiss McNair[83]M/T(4); M/SP(2)US5373688 (A)
US5001893 (A)
Table 3. Overview of the models belonging to each category, according to the scientific literature review and Internet search.
Movement of Machines in the OrchardRemoval the Shell Fruits from the Orchard Ground
VacuumMechanical
PortableCifarelli V1200EBonaddio;
Chianchia Rollblitz;
Valier Roll-in
TrailedChianchia KF501-KF601;
Facma Cimina 120T-380T;
Garriga RAG2005-MCER605;
Giampi Star 211-311;
Hasatsan H230-H2200;
Monchiero 498
Flory 490–860;
Weiss McNair 836–9810
MountedChianchia EU1000-EU200;
Garriga MCE 42;
Giampi Star 111
Chianchia K1800;
Facma MEK1800;
Flory 9610–9685;
Garriga VSide;
GF Jolly 1500–2800;
Giampi Star S.P.1400-200;
Hasatsan H130-H1800;
Rivemec SMART
Self-propelledFacma Cimina 160S-380SAsquini; Bosco;
Facma Semek 1000;
Flory 8600–8770;
Flory 33–79 Series;
GF Super Jolly 4 × 4;
Giampi Futura 1000;
Monchiero 2050–20125;
Weiss McNair 7510-Magnum

