Microwave Photonic Frequency Conversion Based on a Wavelength Swept Laser

1
Guangdong Provincial Key Laboratory of Optical Fiber Sensing and Communications, Institute of Photonics Technology, Jinan University, Guangzhou 510632, China
2
School of Electronic and Electrical Engineering, Zhaoqing University, Zhaoqing 526061, China
*
Authors to whom correspondence should be addressed.
Appl. Sci. 2020, 10(11), 3813; https://doi.org/10.3390/app10113813
Submission received: 2 May 2020
/
Revised: 26 May 2020
/
Accepted: 26 May 2020
/
Published: 30 May 2020
(This article belongs to the Section Electrical, Electronics and Communications Engineering)
Abstract
:Microwave photonic frequency conversion, with flexible tunability and a simple structure based on a wavelength swept laser (WSL), is proposed and experimentally demonstrated. In the proposed frequency conversion system, a broadband WSL was used to generate a frequency-chirped optical carrier, which was sent to a Mach Zehnder modulator (MZM). A microwave signal, with its frequency to be converted, was applied to the MZM. The modulated signal was then sent to a dispersive device, where the waveform was compressed or expanded depending on the dispersion of the dispersive device. After photodetection, a frequency up-converted or down-converted microwave signal was generated. The tuning of the conversion frequency was achieved by adjusting the chirp rate of the optical carrier from the WSL or the dispersion of the dispersive device. The proposed approach was experimentally demonstrated. A microwave signal, with its frequency at 5 GHz, was up-converted to 5.577 GHz and down-converted to 4.936 GHz. The quality of the frequency converted microwave signal was also evaluated. The conversion performance could be further improved by introducing a WSL with a high duty cycle.
1. Introduction
The microwave frequency converter is one of the key components in microwave and millimeter-wave signal processing, including the transmitters and receivers of radio over fiber (RoF), the radar system and the reconnaissance and countermeasure systems [1,2,3,4,5]. The basic function of the microwave frequency converter is to convert the microwave signal input to the required frequency. For example, in a high-speed railway communication system, the frequencies of the signal between the mobile terminal and the receiving end of the base station are different because of the Doppler effect [4,5]. The Doppler frequency shift needs to be compensated for and the microwave frequency converter can provide much convenience in this area. Conventional frequency converters can be created by combining electrical mixers with tunable microwave sources or digital signal processing (DSP) systems [6]. However, electrical mixers exhibit the problems of electro-magnetic interference (EMI), limited isolation and limited bandwidth [7]. The DSP systems are of high cost and face the problem of the electronic bottleneck when dealing with high frequency microwave signals. To overcome the shortage of traditional frequency converters, photonic interrogations have been introduced to improve the electro-magnetic compatibility (EMC) performance.
The microwave photonic frequency converter benefits from the wideband tunability of optical local oscillation (LO). The most investigated microwave photonic frequency converters are based on external modulation. The conversion principle is similar to that of the electrical mixer. The optical LO is achieved by external modulation with a tunable Radio frequency (RF) source. The external modulation structure can be a cascaded modulation structures [6,7,8,9,10,11,12] and the integrated parallel modulator structures [13,14,15,16,17]. However, the external modulator-based frequency conversion structures require complicated bias optimization, polarization or dispersion control. Recently, researchers proposed the use of the mode-locked pulse laser as the optical source for the frequency up-conversion system [18,19,20]. Lee et al. used the hybrid mode-locked multi-section distributed feedback (MS-DFB) laser as the optical source to realize sub harmonic up-conversion without external modulators [18]. Huchard et al. used the mode-locked laser (MLL) to realize a 60 GHz up-conversion [19]. In those MLL based structures, the pulse train was used to sample the input signals. Thus, the pulse should be narrow and an ultra-high repetition frequency (45 GHz) greatly increases the costs. Besides the MLL, the wavelength swept laser (WSL) is also good candidate. The WSL is widely used in optical sensing and optical coherence tomography (OCT) [21]. The WSL is of a broadband quality and its frequency changes linearly with time [22,23,24,25,26], which makes it a perfect frequency conversion carrier when combined with the dispersion control device.
In this paper, we proposed a new all optical microwave photonic frequency conversion interrogation with flexible tunability and a simple structure based on a WSL. We used a WSL as the optical carrier to sample the input signal. By tuning the optical characteristic of the WSL or the dispersion control device, the input signal could be up-converted to higher or down-converted to lower frequency with an arbitrary conversion coefficient and without an electrical tunable RF source. We simulated the influence of the WSL on the conversion system. In the experiment, we realized the up-conversion and down-conversion by switching the sign of the chirp rate. The 5 GHz input microwave signal was up-converted to 5.577 GHz, at the highest, by adjusting the length of the single mode fiber (SMF) array. The conversion performance for 8 GHz and 16 GHz signals was also tested. The conversion spectrum had multi-longitudinal modes due to the low duty cycle of the WSL pulse. The conversion performance could be further improved by introducing a WLS with a high duty cycle.
2. Operation Principle
2.1. Frequency Conversion Principle
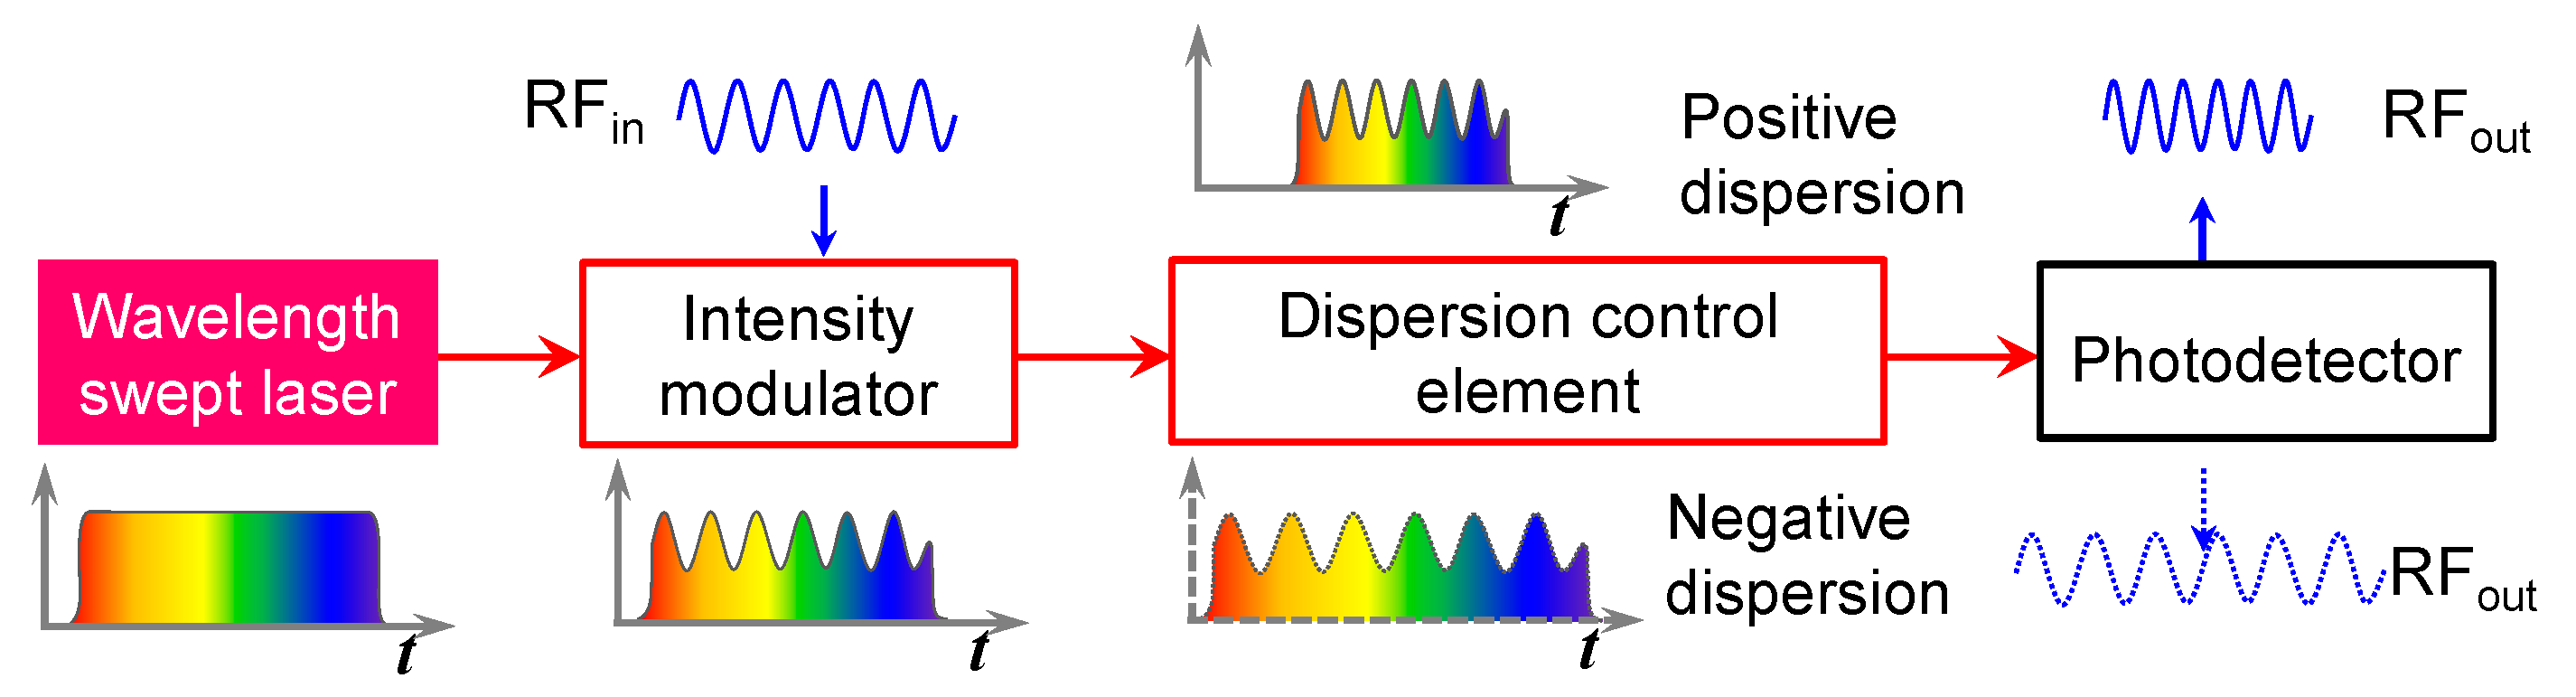
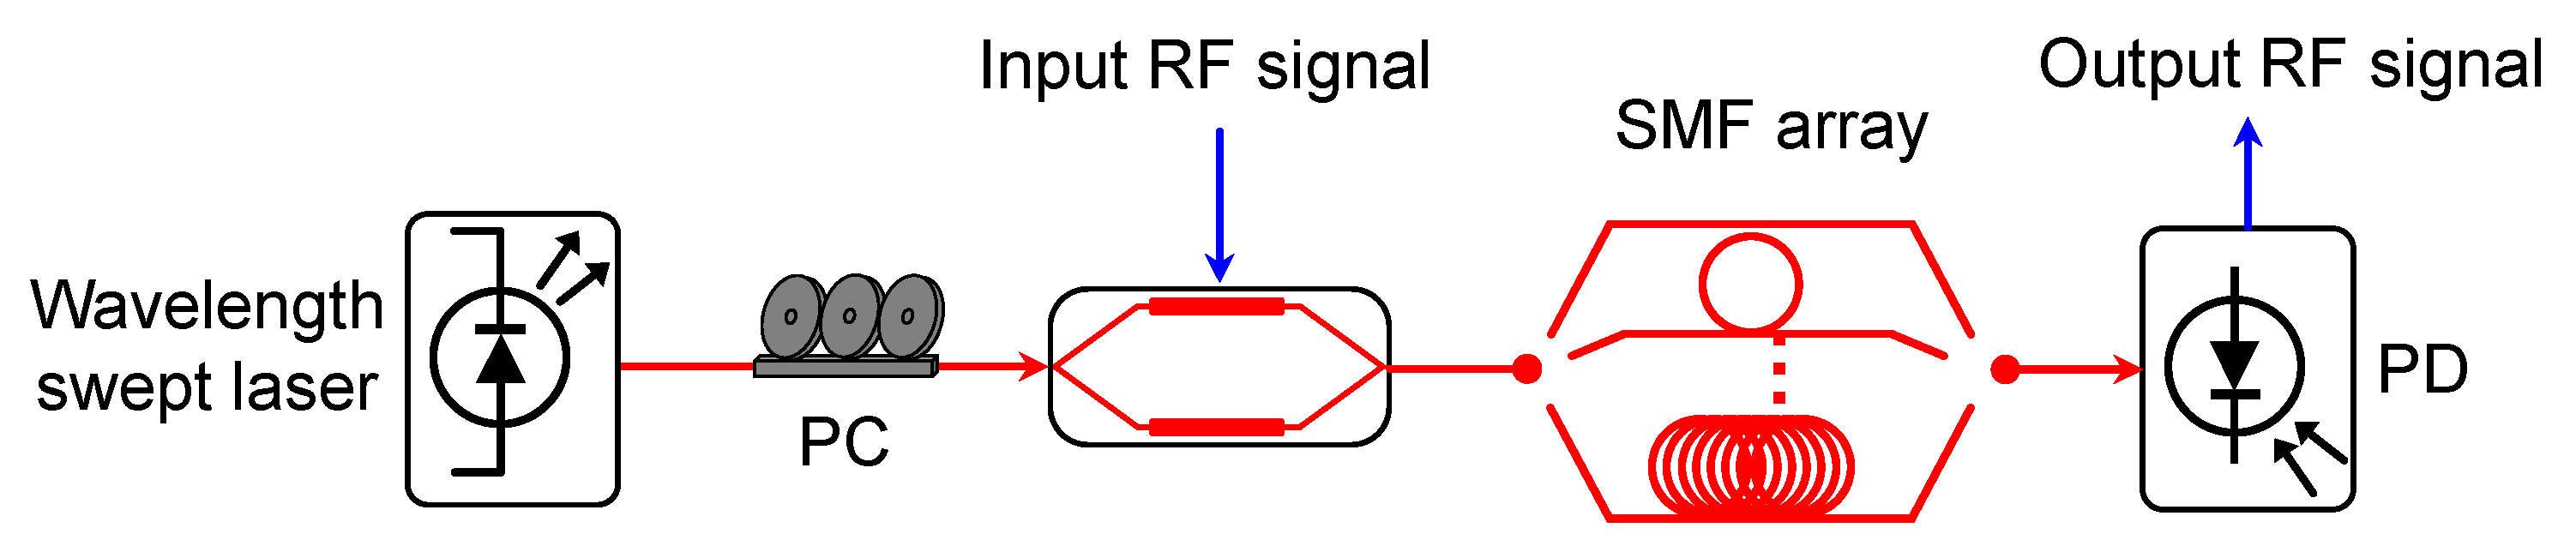
Figure 1 shows the working principle of the proposed microwave photonic frequency conversion system. A wavelength swept fiber laser (WSL) was used as the optical source. The output of the WSL was a series of long pulse trains, the wavelength of which changed linearly over time, periodically. The input microwave signal was then modulated to the WSL output by an optical intensity modulator in order to convert the microwave signal into the optical domain. During the intensity modulation process, the WSL pulse was shaped by the microwave signal, and the microwave signal voltage was converted to the optical intensity, as shown in Figure 1. The modulated optical signal was then injected into a dispersion control element (DCE). Due to the chromatic dispersion characteristic of the broadband WSL, different time delays were introduced to different wavelength components, and the pulse length of the modulated optical signal was stretched or compressed. At the output of the DCE, a photodetector (PD) was used to detect the optical intensity vibration, and the microwave signal was recovered from the optical domain. In this way, the microwave signal was also compressed or stretched, and the frequency of the loaded microwave signal drifted to a high or a low frequency. The direction of the pulse length change depended on whether the sign of the WSL chirp rate and the DCE index were the same or the opposite. When the sign of the WSL chirp rate and the DCE index were the same, the pulse was compressed and the input signal was up-converted. Otherwise, the pulse was stretched and the input signal was down-converted. The compression rate of the optical pulse depended on the time delay, which could be calculated by the dispersion of the DCE and the optical bandwidth of the WSL.
Therefore, the frequency conversion signal was achieved by changing the parameter of the WSL fiber laser and the dispersion of the DCE. For example, when using the single mode fiber (SMF) as the DCE, the dispersion could be tuned by changing the length of the SMF. The chip parameter of the WSL was also adjustable in many structures [24,25]. The mathematical analysis is given as follows; the normalized time domain signal of the WSL output can be expressed as:
where rect(x) is the rectangular function, ωc is the optical center angular frequency, r is the frequency sweeping chirp rate (frequency shift per time), Tr is the repetition period and τ is the pulse width of the WSL. The input microwave signal is:
where A is the amplitude of the signal and Ω0 is the angular frequency of the input microwave signal. After the intensity modulation, the output of the modulated optical signal Em(t) is given by:
where m is the modulation index. Taking an SMF as the DCE as an example. The dispersion element introduces extra phase to the frequency spectrum of the modulated optical signal. The spectrum of the modulated signal Ed(ω) after the dispersion effect can be expressed as:
where ω is the angular frequency, β2 is the group-velocity dispersion of the SMF (−20.39 ps2/km) and L is the length of the SMF. The time domain signal from the output of the SMF is given by:
where denotes the inverse Fourier transform. At the output of the PD, the high frequency optical components cannot be detected; thus, the photocurrent signal is given by:
where is the sensitivity of the PD. Here, we define:
as the conversion coefficient. By adjusting the product of r and L, the conversion coefficient can be tuned. When β2 and r have opposite signs, the signal is compressed. Otherwise the signal is stretched. Then, (6) yields:
In small signal modulation conditions, the A2 terms can be ignored and the constant term in brackets is the low frequency component which can be easily filtered. The electrical spectrum of the microwave signal after conversion can be expressed as:
where denotes the Fourier transform, denotes the convolution and ωr = 2π/Tr is the repetition angular frequency of the WSL. The first term (with the cosine function) in (9) can be considered as an attenuation coefficient that relates to the input microwave frequency and the conversion coefficient. The last summation term shows that the spectrum is discrete, due to the pulsed characteristic of the signal. The middle term is a Sinc function (the Fourier transform of the rectangular function) with the center frequency being κΩ0. The amplitude of the Sinc function decayed as it moved away from the center frequency. Thus, most of the spectrum energy was constrained to κΩ0 and the input signal was shifted to κΩ0 successfully. The conversion coefficient κ is the ratio of the output frequency to the input frequency. When the sign of the WSL chirp rate and β2 were the same, κ was less than 1 and the signal was down-converted. While when the sign of the WSL chirp rate and β2 were the opposite, κ was larger than 1 and the signal was up-converted. The mathematical expression of the frequency conversion spectrum is expressed in (9), but the impact of system parameters, including L, r, τ and ωr on the conversion performance, need to be optimized.
2.2. Simulations of Conversion Performance
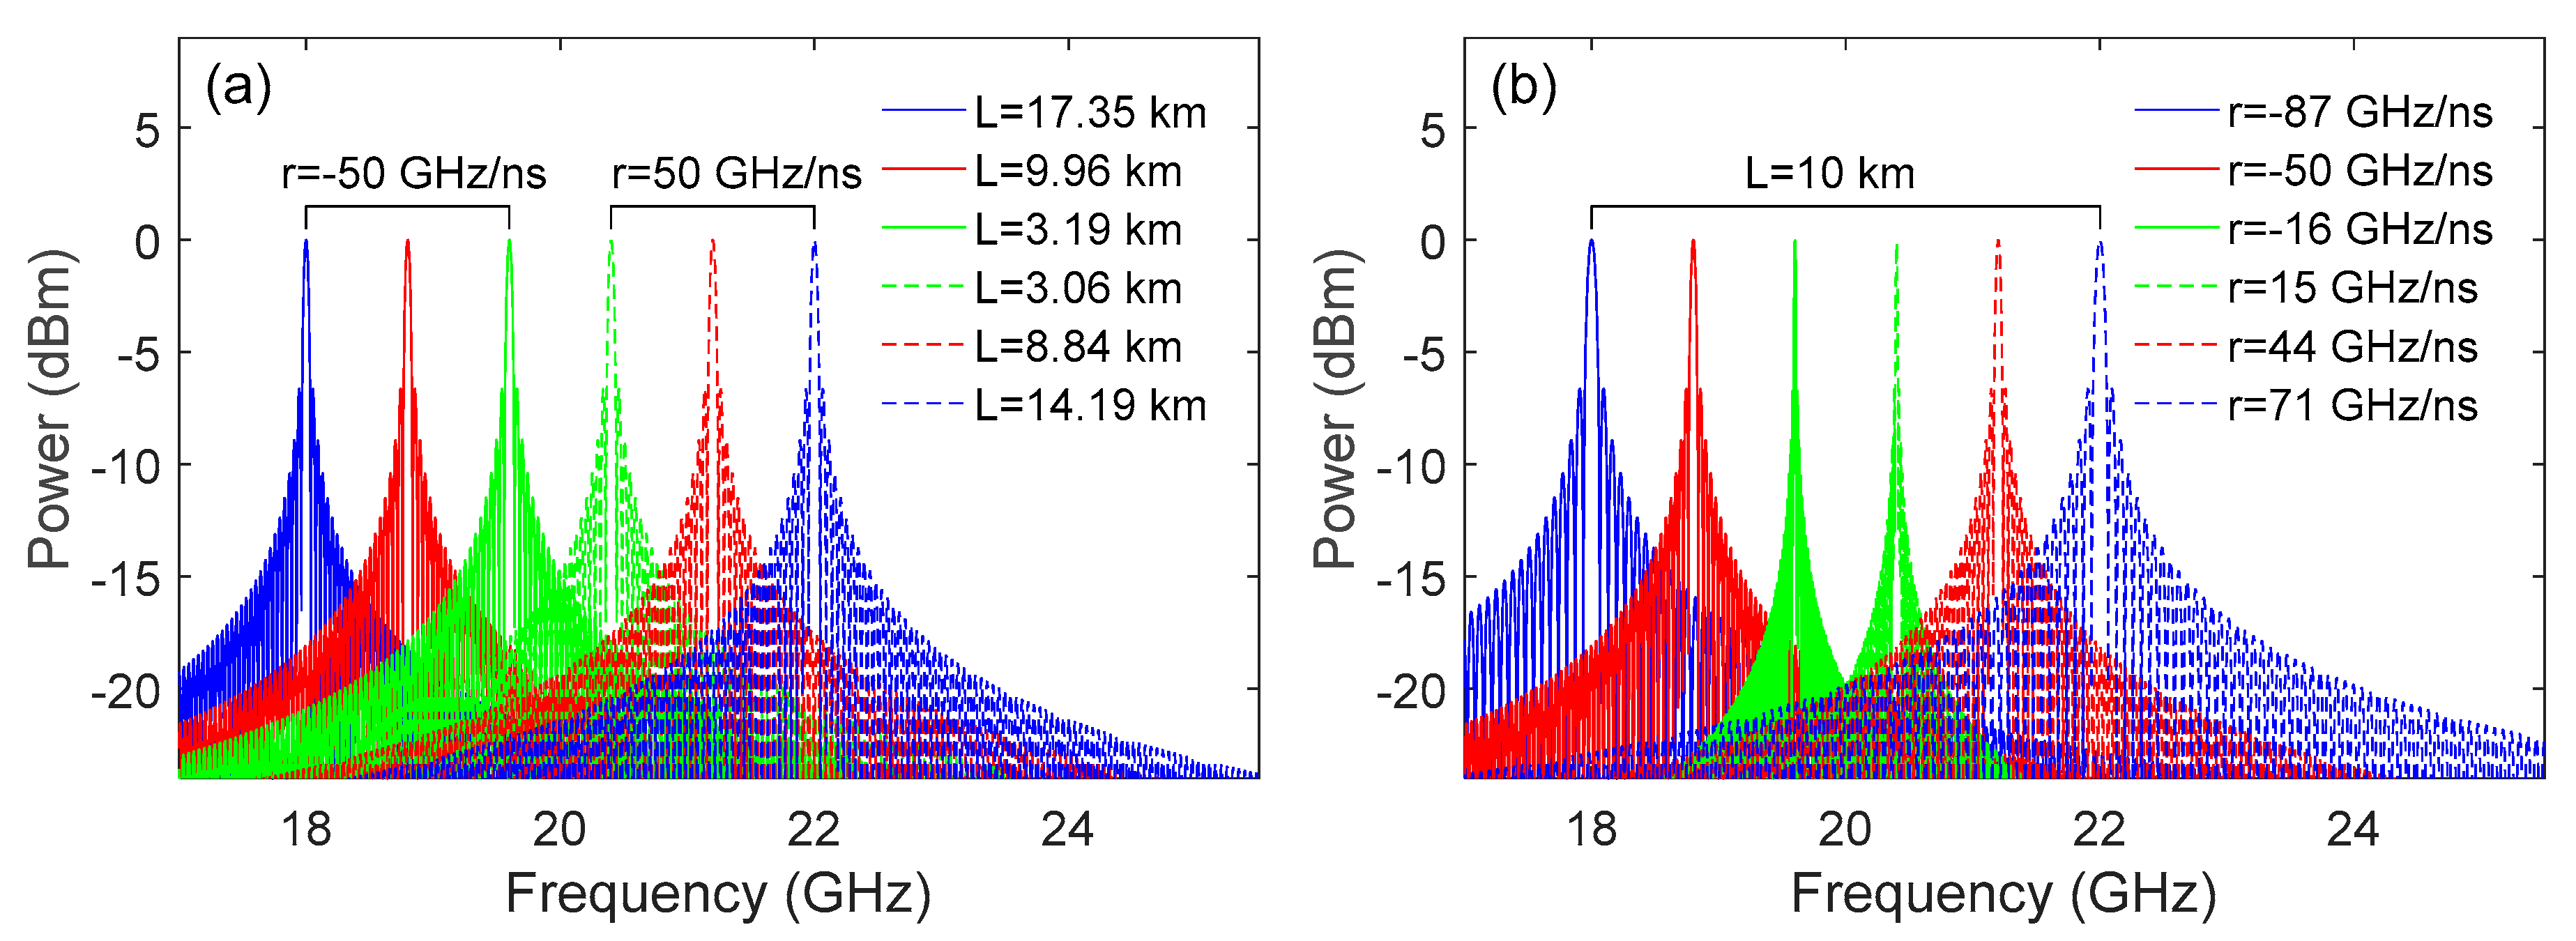
From (7), we know that the conversion coefficient can be tuned by either L or r. Here, we simulated the trend of the Sinc function in (9), when L and r were changed individually, as shown in Figure 2.
In the simulation, the input frequency was 20 GHz and the conversion coefficient κ was increasing from 0.9 to 1.1 in steps of 0.04. Figure 2a shows the trend of the Sinc function when only L changed and the absolute value of r was fixed at 50 GHz/ns. The conversion direction was achieved by switching the sign of r. The tuning of L was achieved by switching different channels of the optical fiber array. When L changed, the center frequency of the Sinc function was shifted from 18 GHz to 22 GHz and the 3-dB bandwidth remained the same. Figure 2b shows the trend of the Sinc function when L was fixed at 10 km and r was tuned from −87 GHz/ns to 71 GHz/ns. The tuning of r can be achieved by the dispersion control element or the wavelength sweeping component in the cavity of the WSL. The center frequency shift of the Sinc function was the same as when L was tuned. However, the 3-dB bandwidth was narrower when κ was closer to 1 and became larger when κ moved away from 1. Thus, the tuning of κ by changing L was more reliable compared with changing r, especially when the frequency shifting range was large. On the other hand, a smaller chirp rate r introduced a larger suppression to the sidemodes, as the summation term in (7) describes. Thus, the influence of the pulse repetition frequency ωr should also be noted.
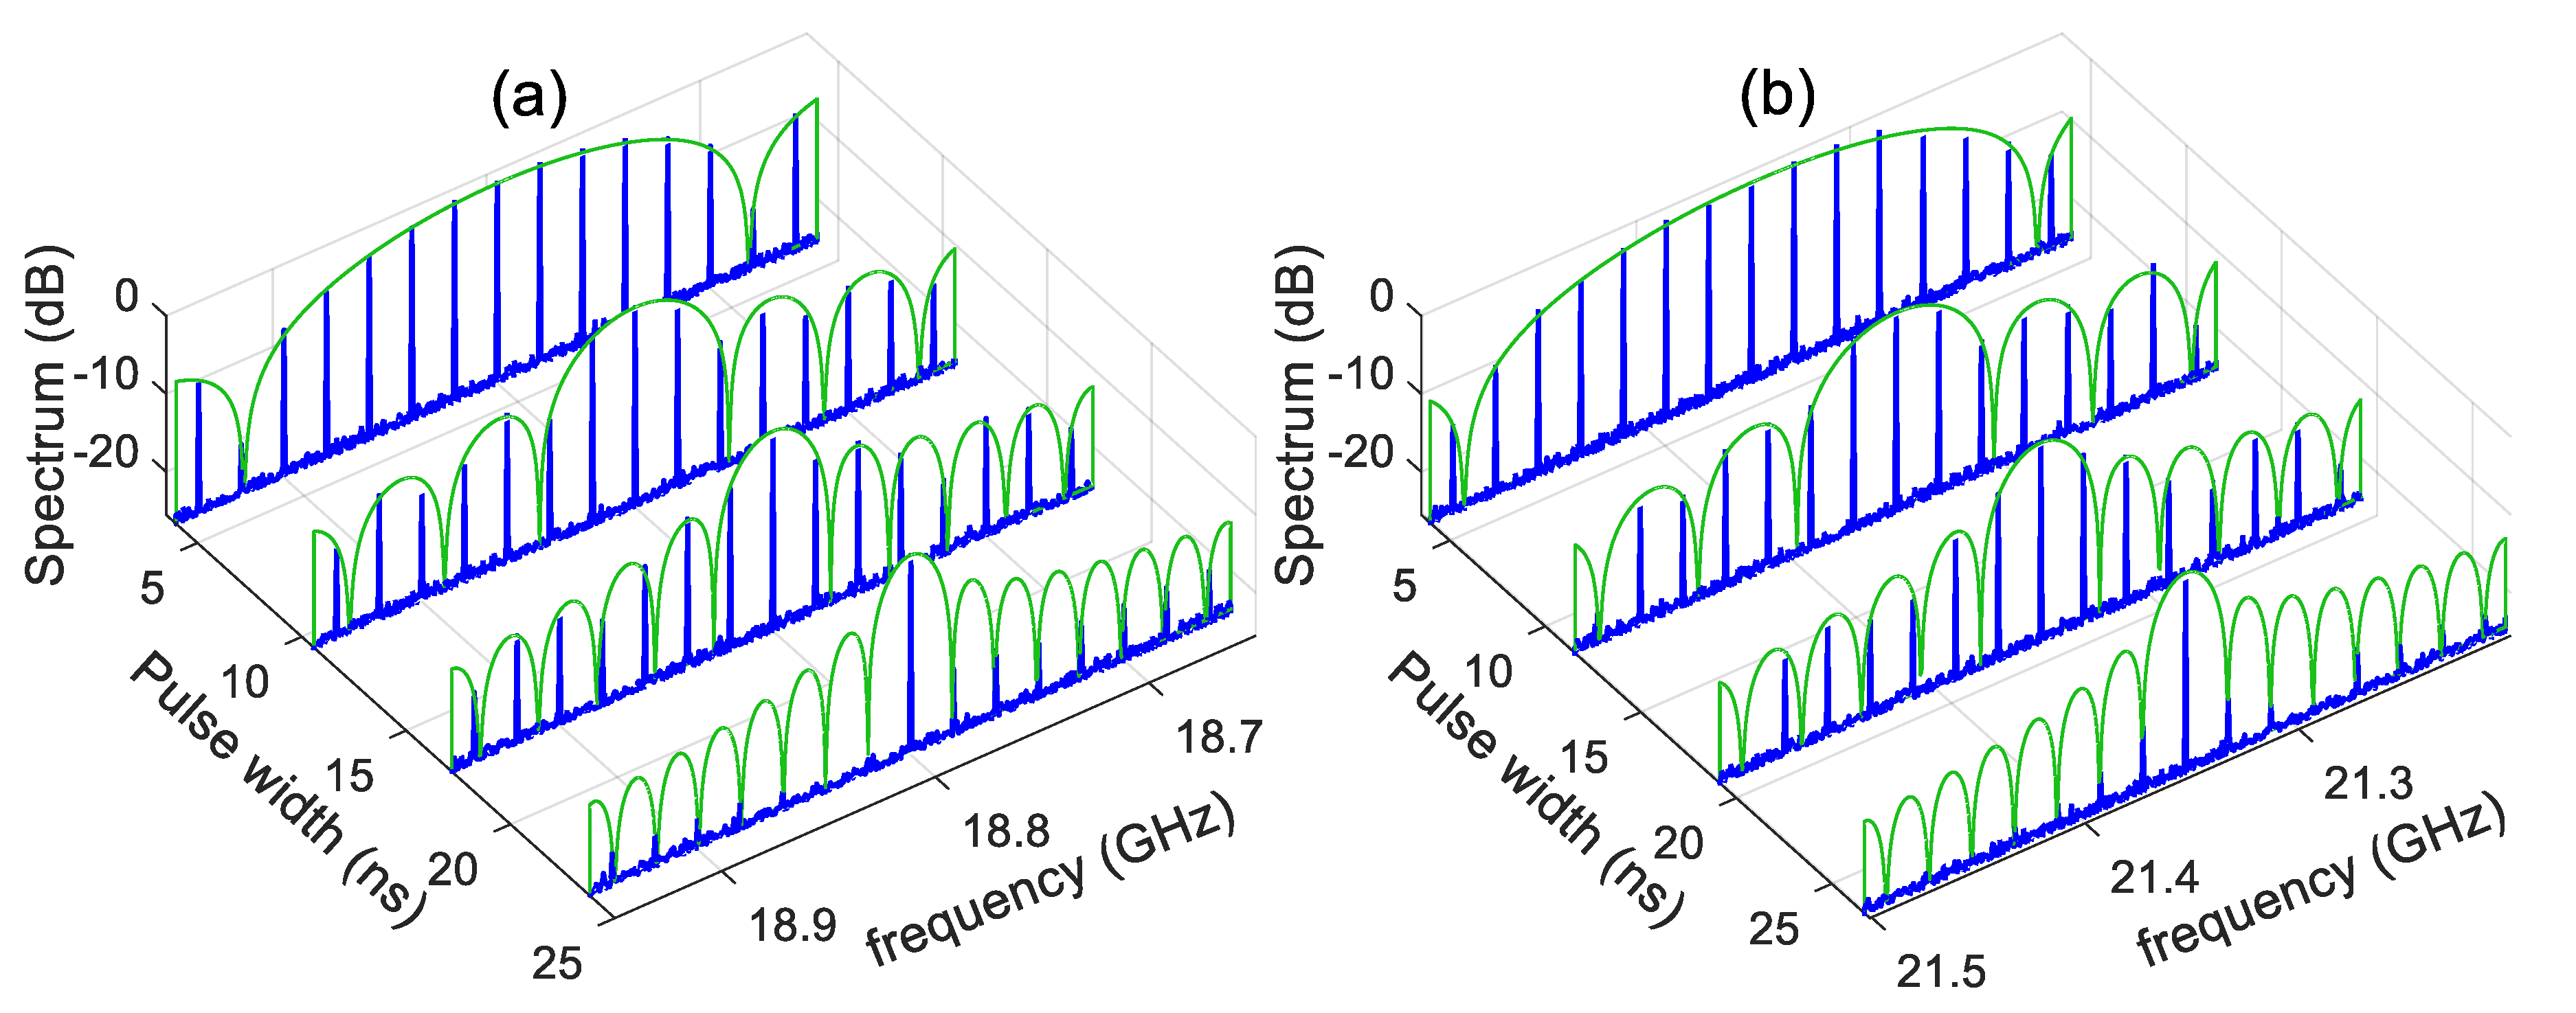
The pulse repetition frequency ωr determined the frequency shift accuracy of conversion system because of the discrete nature of the pulse signal. For the fixed repetition angular frequency ωr and conversion coefficient κ, increasing τ could have significantly narrowed the Sinc function, the sidemodes were suppressed and there was the dominant mode. Figure 3 shows the down-conversion simulation spectra (input: 20 GHz; output: 18.8 GHz) and the up-conversion simulation spectra (input: 20 GHz; output: 21.4 GHz) when ωr was set to be 20 MHz and τ was increasing.
The frequency interval of the longitudinal modes (the blue combs) was 20 MHz. As τ increased, the envelope of the Sinc function (the green curves) remained narrow. When the notch period of the Sinc function matched the repetition frequency of the WSL, the side modes could be greatly suppressed. It should be noted that τ could not be increased without limitation. When the side modes were mostly suppressed, the duty cycle (τ/Tr) of the WSL was about 95 %. If τ was too large, the adjacent pulses would have interfered with each other. Thus, by adjusting the duty cycle of the WSL, the sidemodes were suppressed. On the other hand, the pulse width τ = Δω/r was related to the chirp rate r and the bandwidth of the WSL Δω, and r will also affect κ. We use Figure 4 to deal with the influence of the chirp rate r, the bandwidth Δω and the fiber length L on the frequency conversion efficiency and accuracy.
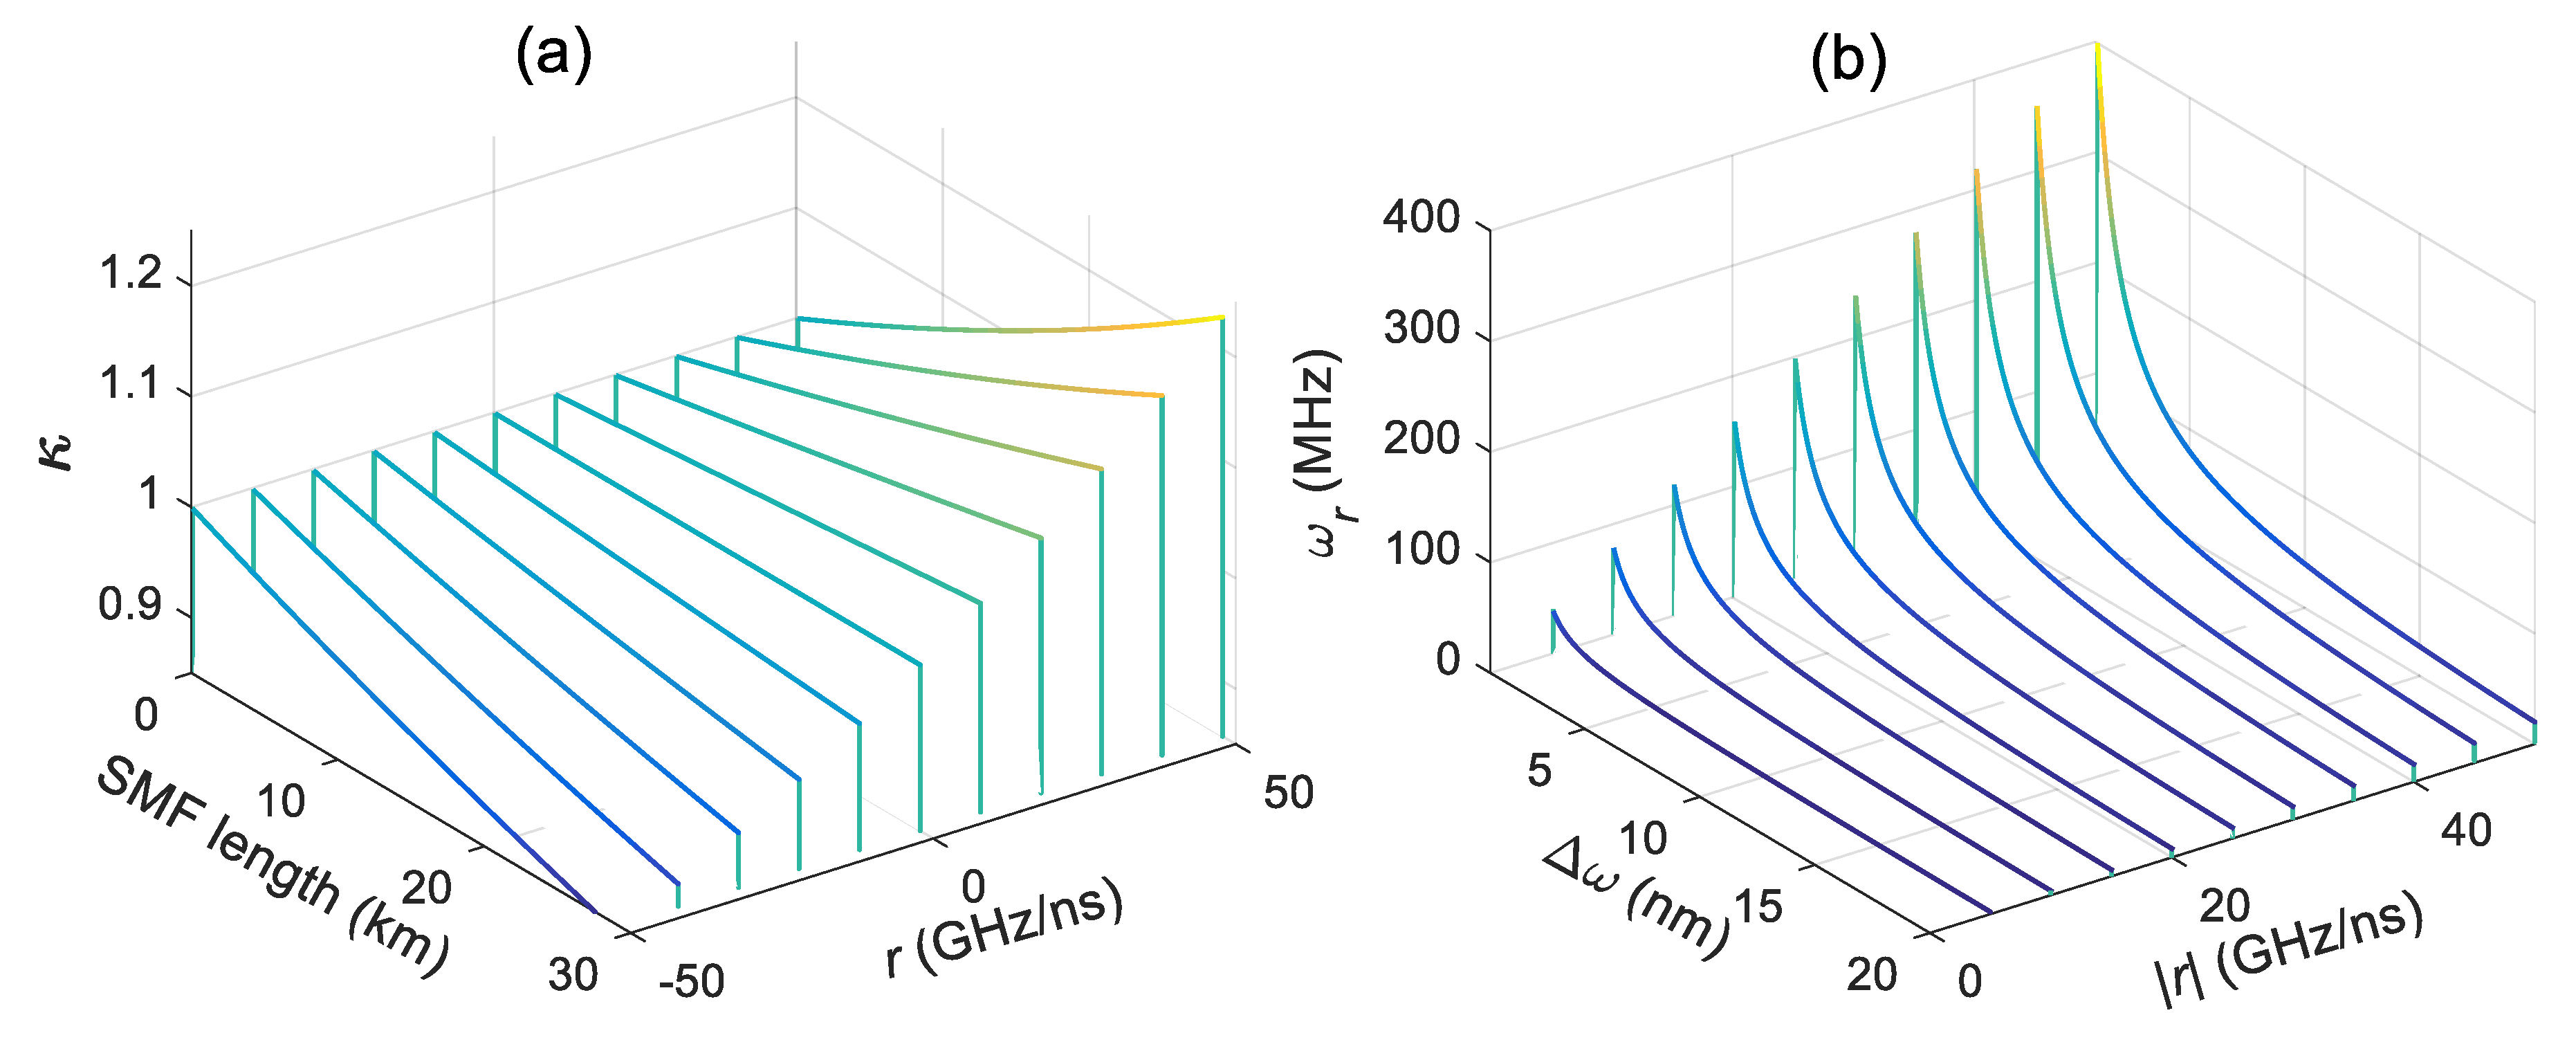
Theoretically, r and L had the same effect on κ as (7) described, but their value range was limited in practice. For example, too long an SMF introduced a significant decay of the optical loss. Figure 4a shows the influence of r and L on the conversion coefficient κ. For a fixed L, κ almost changed linearly with r at the range of −50 GHz/ns to 50 GHz/ns. For a fixed r, κ decreased linearly with L when r was negative, and increased nonlinearly with L when r was positive. Thus, the system’s up-conversion efficiency is higher than its down-conversion efficiency. Figure 4b shows the maximum value for ωr and that only one main-mode can exist at the certain Δω and r. Here, ωr can be considered as the conversion accuracy. For a fixed Δω, ωr changed linearly with r. For a fixed r, ωr dropped sharply with Δω, even when r was high (a lower r reduced κ). Combined with Figure 4a,b, to improve the efficiency of κ and reduce the frequency shift interval ωr, a large WSL bandwidth Δω and large chirp rate r should be used.
3. Experimental Results and Discussion
Based on the above simulations and discussions, we performed corresponding experiments to verify the performance of the frequency conversion system. Figure 5 shows the experimental setup of the proposed microwave photonic frequency conversion system. We built a wavelength swept laser based on positive and negative dispersion as the optical source [24] in the lab. The positive and negative dispersion components in the cavity were two chirped fiber Bragg gratings (CFBGs, Proximion) with opposite dispersion (±1321 ps/nm). After a polarization controller (PC) was used, the output of the WSL was launched into an intensity modulator (PHOTLINE, MX-LN-40, 40 GHz bandwidth). A microwave source (Hittite HMC-T2240) was used to provide microwave signal. An SMF (YOFC G625) array with a switchable length was used as the DCE. The modulated optical signal was launched into an SMF array as the switchable dispersion device. The dispersed signal was finally detected by a PD (Discoverysemi, DSC20H, 50 GHz bandwidth). The beating signals from the PD were measured using a high-speed oscilloscope (Tektronix, DSA72004B: the bandwidth was 36 GHz and the maximum sample rate was 80 GS/s) and an electrical spectrum analyzer (ESA, Keysight, N9020B, Santa Rosa, CA, USA).
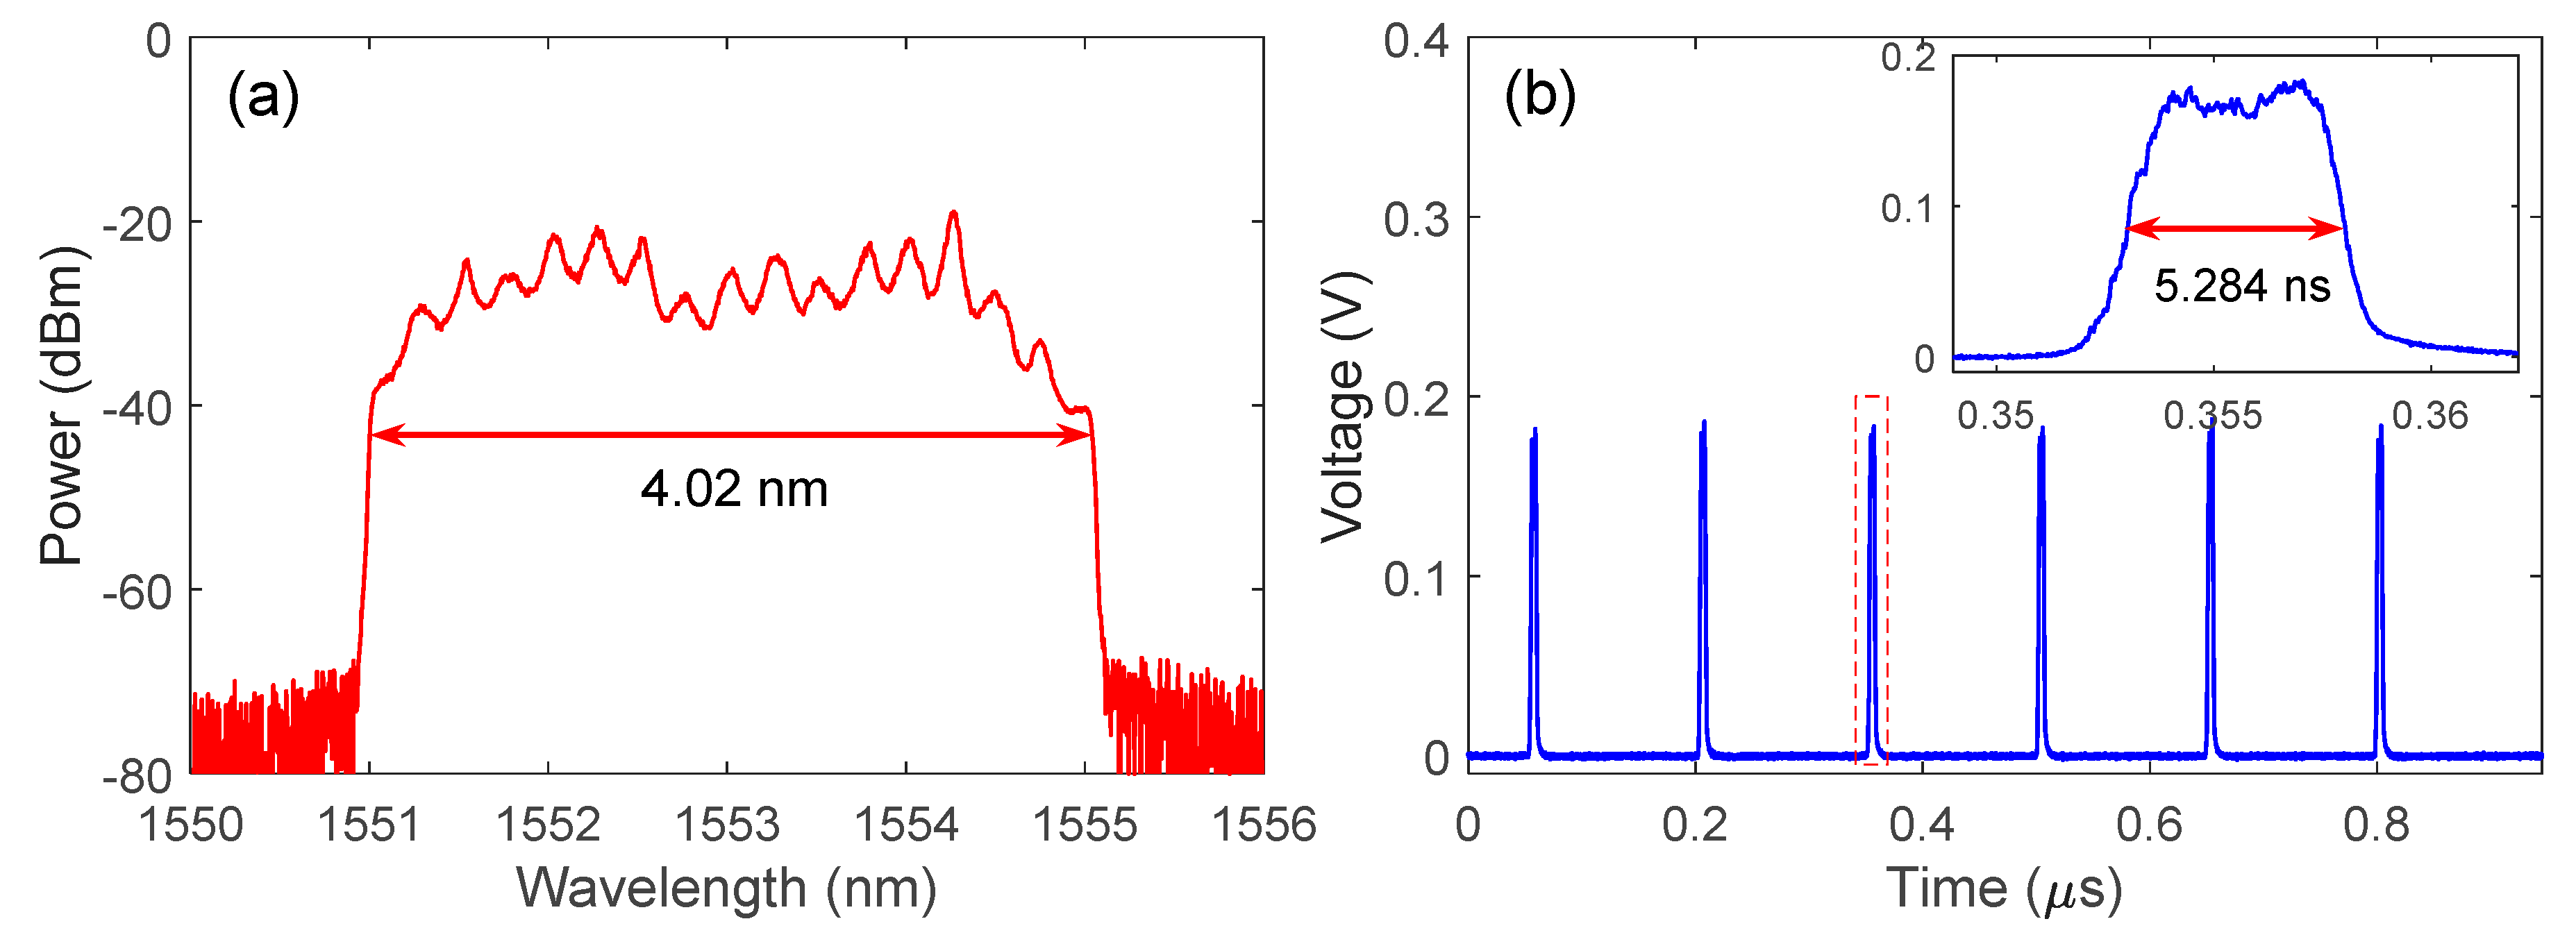
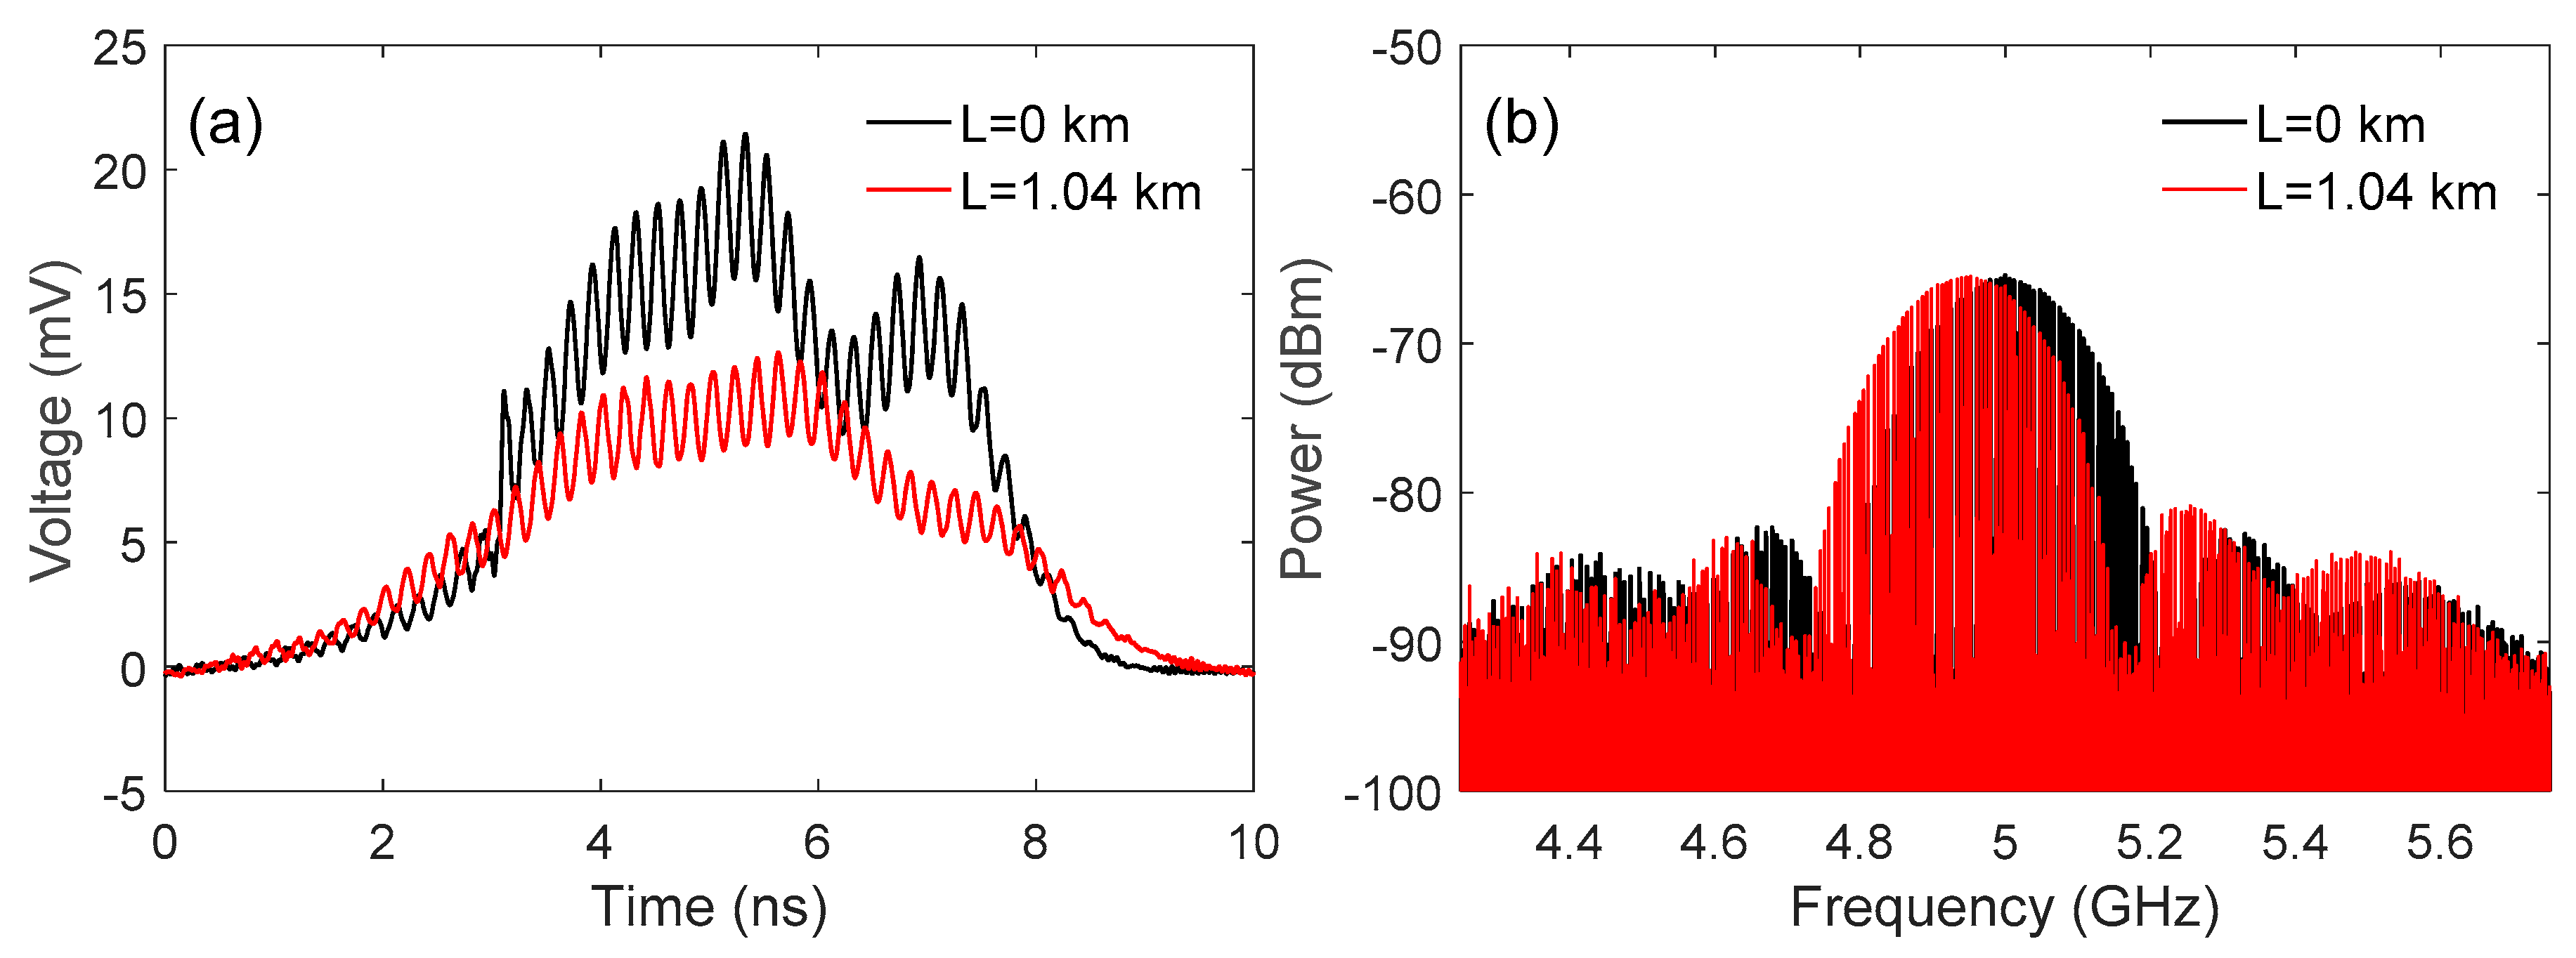
Figure 6a shows the optical spectrum of the WSL, measured by an optical spectrum analyzer (OSA, YOKOGAWA, AQ6370C, Tokyo, Japan). The center wavelength and bandwidth of the WSL were 1553 nm and 4.02 nm, respectively. Figure 6b shows the time domain WSL pulse train and the detailed waveform that was directly detected by the PD and the oscilloscope. The chirp rate of the WSL was ± 99.6 GHz/ns and the repetition frequency was 6.7 MHz. The waveform of a single pulse was approximately rectangular, with a pulse width of about 5.284 ns, as shown in the insert figure. Due to the limitations of current laboratory conditions, the duty cycle was calculated to be 3.5%, which was much lower than the simulated single mode condition. In future works, an MLL with a large duty cycle needs to be researched in order to meet the requirements of the previous part of the system simulation. Figure 7 shows the time domain pulse waveform and the electrical spectrum of the frequency down-conversion system (r = −99.6 GHz/ns), with a different SMF length when the input frequency was 5 GHz.
After the modulation step, the pulse waveform was shaped by the microwave signal, as shown in Figure 7a. The pulse waveform when L was 1.04 km was expanded, compared with when L was 0 km. Due to the optical loss of the fiber and the expanding effect, the peak voltage of the pulse declined. The electrical spectrum of the frequency conversion system was discrete and the envelope had a main-lobe and several side-lobes, as shown in Figure 7b, which accorded well with the simulations. The center frequency of the down-converted spectrum was 4.936 GHz, and the conversion coefficient was calculated to be 0.987, which also accorded well with (7). It can be seen from Figure 7 that the input signal with a frequency of 5 GHz was successfully down-converted to 4.936 GHz, and the experimental results were in line with the expected results. At the same time, the experiment also proved the effectiveness of the proposed WSL-based microwave photonic frequency converter with the function of down-conversion. Then, the chirp rate was switched to be positive and the length of the SMF was tuned. The up-conversion electrical spectrum is shown in Figure 8.
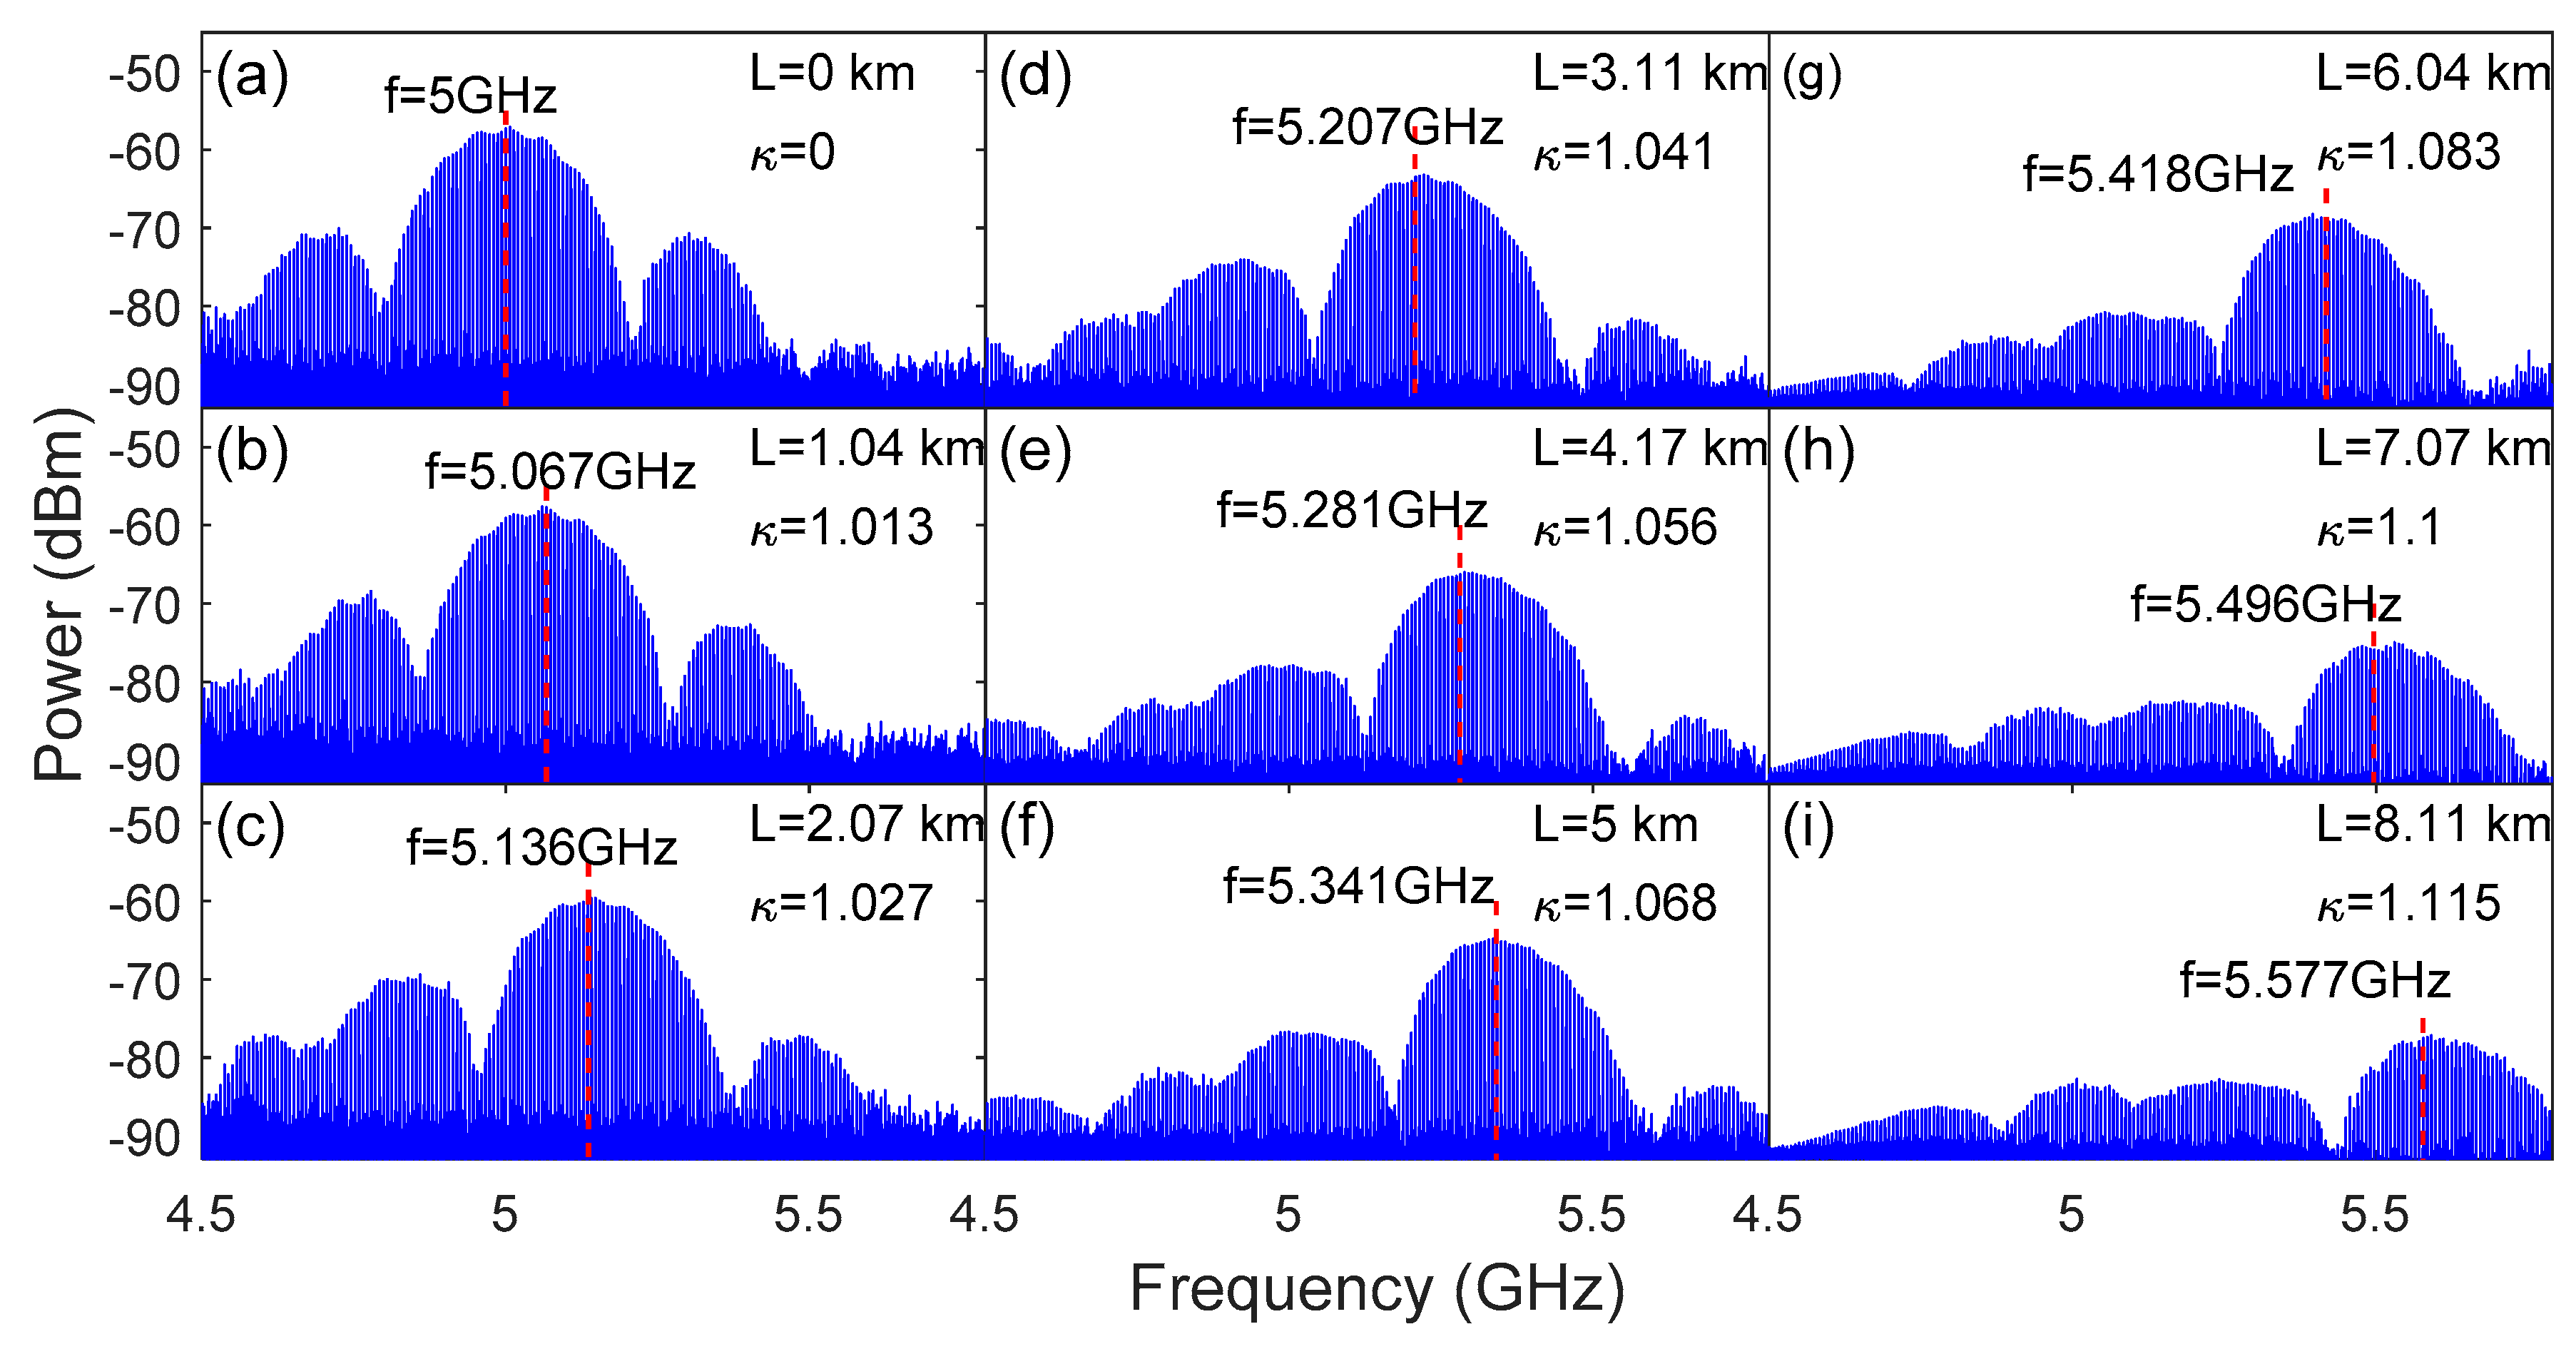
As the length of the SMF increased from 0 km to 8.11 km, the center frequency of the up-conversion spectrum moved from 5 GHz to 5.577 GHz, and there was also a certain distortion in the spectrum when the length of the SMF was long. The amplitudes of the right side-lobes were lower than those of the left side-lobes, and the amplitude difference became larger when the SMF was longer. The distortion of the spectrum may have been caused by the jitters on the rectangular pulse waveform, as shown in Figure 6b. By switching the sign of the WSL chirp rate r to a positive value, the experiment realized the conversion of the frequency converter from the down-conversion function to the up-conversion function, which proved the effectiveness of the method. The comparison of the down-conversion and the up-conversion frequencies between the simulations and the experiment results is shown in Table 1.
We can see that the experiment results of the down-conversion and up-conversion for the 5 GHz input signal consist well with the simulations. The up-conversion performance of the proposed system for a higher input frequency is shown in Figure 9.
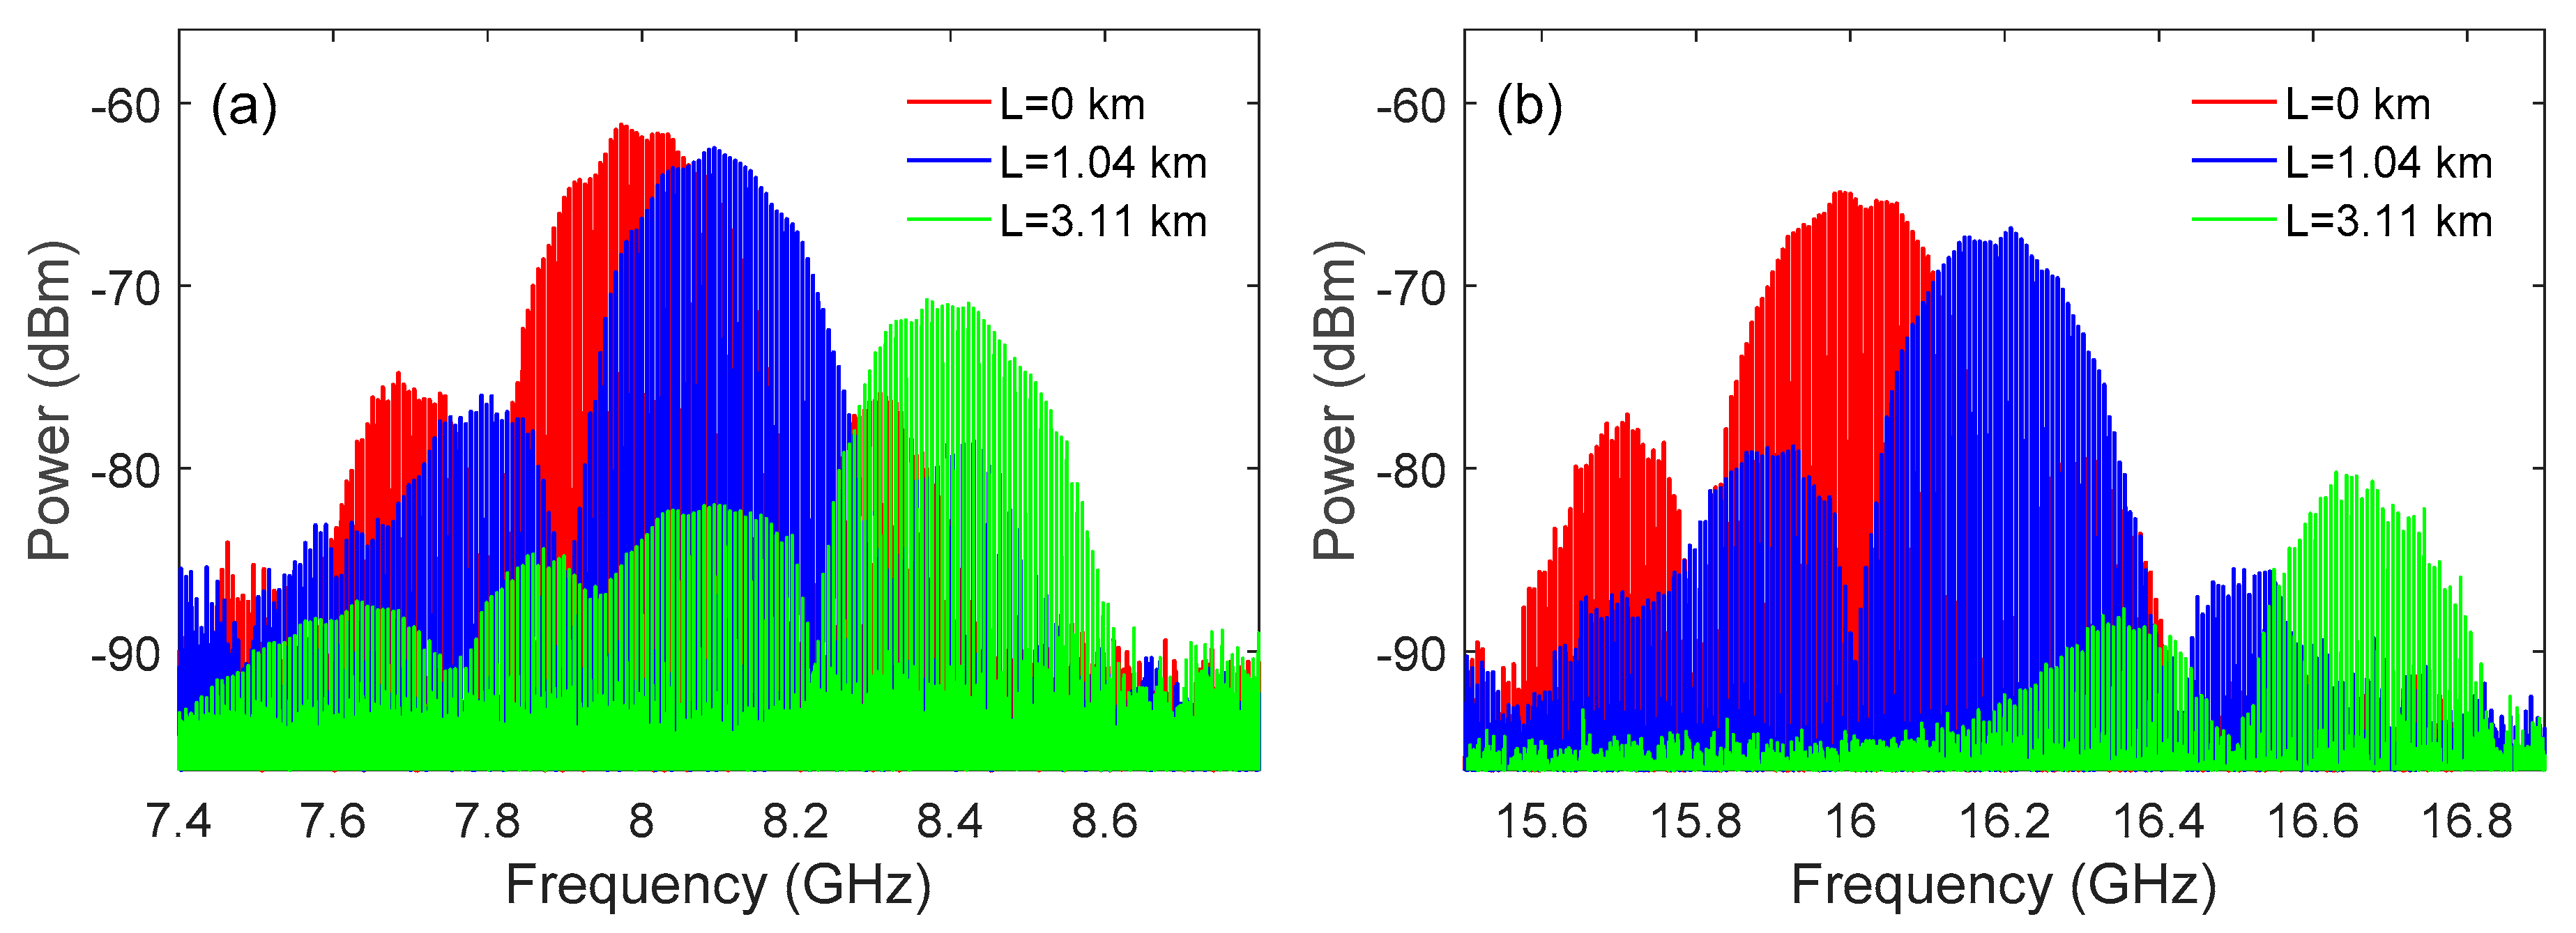
The up-conversion spectra for the 8 GHz and 16 GHz signals were similar to the spectra for the 5 GHz signal. The spectrum distortion was more serious when the frequency was higher. For higher input frequencies, the spectrum separation between the different conversion efficiencies was higher. The bandwidth of the main-lobe remained the same when the input frequency or the length of the SMF was different, for it only depended on the pulse width of the WSL. Thus, if we use a WSL with a high duty cycle, the bandwidth of the conversion spectrum will be further suppressed. The tunability results of the up-conversion system for the 5 GHz, 8 GHz and 16 GHZ input signals are summarized in Table 2.
Through the above experiments, we can see that the microwave photonic frequency converter was based on the WSL up-conversion and down-conversion. The tuning of the conversion frequency was achieved by adjusting the chirp rate r of the WSL and the dispersion of the DCE, and the switching of the up–down conversion function of the frequency converter system was achieved by changing the sign of the WSL chirp rate. The above experiments also proved the feasibility of the program.
4. Conclusions
We have proposed and experimentally demonstrated an all optical new microwave photonic conversion interrogation with flexible tunability and a simple structure based on a WSL. The frequency conversion system uses the combination of a WSL and a dispersion control device to realize the up–down conversion of the input signal. In the proposed frequency conversion system, the WSL is used as the optical carrier to sample the input signal. We simulated the influence of the WSL to the conversion system and found that the input microwave signal can be arbitrarily converted up and down by adjusting the value of the dispersion control device. As shown in the experiment, the 5 GHz microwave signal can be up-converted to 5.577GHz and down-converted to 4.936 GHz by switching the sign of the chirp rate and adjusting the length of the SMF array. The 16 GHz high frequency microwave signal can be up-converted to 16.62 GHz. The conversion spectrum has multi-longitudinal modes due to the low duty cycle of the WSL pulse. The conversion performance could be further improved by introducing a WLS with a high duty cycle.
Author Contributions
Writing—original draft preparation, investigation, validation, Y.K.; writing—review and editing, methodology, Y.C.; validation, formal analysis, L.W. and G.W.; conceptualization, methodology, X.F.; project administration and supervision, X.F. and B.-O.G. All authors have read and agreed to the published version of the manuscript.
Funding
This research was funded by the National Natural Science Foundation of China (NSFC), (No. 61771221, No.61860206002 and No. 61701193) and Basic and Applied Basic Research Foundation of Guangdong Province (2019A1515110946).
Conflicts of Interest
The authors declare no conflict of interest.
References
- Capmany, J.; Beatriz, O.; Daniel, P. A tutorial on microwave photonic filters. J. Lightwave Technol. 2006, 24, 201–229. [Google Scholar] [CrossRef]
- Minasian, R.A. Photonic signal processing of microwave signals. IEEE Trans. Microw. Theory Tech. 2006, 54, 832–846. [Google Scholar] [CrossRef]
- Yao, J.p. Microwave photonics. J. Lightwave Technol. 2009, 27, 314–335. [Google Scholar] [CrossRef]
- Yang, L.H.; Ren, G.L.; Qiu, Z.L. A novel Doppler frequency offset estimation method for DVB-T system in HST environment. IEEE Trans. Broadcast. 2012, 58, 139–143. [Google Scholar] [CrossRef]
- Hong, Y.; He, D. An improved Doppler frequency offset estimation algorithm of OFDM system under high-speed movement environment. J. Comput. 2013, 8, 3191–3195. [Google Scholar] [CrossRef]
- Shi, Y.Q.; Wang, W.S.; Bechtel, J.H. High-isolation photonic microwave mixer/link for wideband signal processing and transmission. J. Lightwave Technol. 2003, 21, 1224–1232. [Google Scholar]
- Xue, X.X.; Zheng, X.P.; Zhang, H.Y.; Zhou, B.K. Idler-free photonic microwave mixer using a broadband optical source and cascaded phase modulators. Opt. Lett. 2012, 37, 1451–1453. [Google Scholar] [CrossRef]
- Gopalakrishnan, G.K.; Burns, W.K.; Bulmer, C.H. Microwave-optical mixing in LiNbO/sub 3/modulators. IEEE Trans. Microw. Theory Tech. 1993, 41, 2383–2391. [Google Scholar] [CrossRef]
- Zhang, S.J.; Yu, J.J.; Chang, G.K. Optical millimeter-wave generation or up-conversion using external modulators. IEEE Photon. Technol. Lett. 2005, 18, 265–267. [Google Scholar]
- Wu, B.l.; Tang, Y.; Sun, J.; Jian, S.s. Photonic microwave signal mixing using Sagnac-Loop-based modulator and polarization-dependent modulation. IEEE Photon. J. 2016, 8, 1–8. [Google Scholar] [CrossRef]
- Yin, C.J.; Li, J.Q.; Li, B.Y.; Lv, Q.; Dai, J.; Yin, F.L.; Dai, Y.T.; Xu, K. Microwave photonic frequency up-convertor with frequency doubling and compensation of chromatic-dispersion-induced power fading. IEEE Photon. J. 2017, 9, 1–7. [Google Scholar] [CrossRef]
- Ma, J.L.; Wen, A.J.; Tu, Z.Y. Filter-free photonic microwave upconverter with frequency quadrupling. Appl. Opt. 2019, 58, 7915–7920. [Google Scholar] [CrossRef] [PubMed]
- Tang, Z.Z.; Pan, S.L. Image-reject mixer with large suppression of mixing spurs based on a photonic microwave phase shifter. J. Lightwave Technol. 2016, 34, 4729–4735. [Google Scholar] [CrossRef]
- Zhang, J.; Chan, E.H.W.; Wang, X.; Feng, X.; Guan, B. High conversion efficiency photonic microwave mixer with image rejection capability. IEEE Photon. J. 2016, 8, 1–11. [Google Scholar] [CrossRef]
- Gao, Y.S.; Wen, A.J.; Zhang, W.; Wang, Y.; Zhang, H.X. Photonic microwave and mm-wave mixer for multichannel fiber transmission. J. Lightwave Technol. 2017, 35, 1566–1574. [Google Scholar] [CrossRef]
- Gao, Y.S.; Wen, A.J.; Jiang, W. Fundamental/Subharmonic Photonic Microwave I/Q Up-Converter for Single Sideband and Vector Signal Generation. IEEE Trans. Microw. Theory Tech. 2018, 66, 4282–4292. [Google Scholar] [CrossRef]
- Shi, Z.; Zhu, S.; Li, M. Reconfigurable microwave photonic mixer based on dual-polarization dual-parallel Mach–Zehnder modulator. Opt. Comm. 2018, 428, 131–135. [Google Scholar] [CrossRef]
- Lee, K.H.; Choi, W.Y.; Leem, Y.A. Harmonic millimeter-wave generation and frequency up-conversion using a passively mode-locked multisection DFB laser under external optical injection. IEEE Photon. Technol. Lett. 2007, 19, 161–163. [Google Scholar] [CrossRef]
- Huchard, M.; Chanclou, P.; Charbonnier, B. 60 GHz radio signal up-conversion and transport using a directly modulated mode-locked laser. In Proceedings of the 2008 International Topical Meeting on Microwave Photonics jointly held with the 2008 Asia-Pacific Microwave Photonics Conference, Gold Coast, QLD, Australia, 9 September–3 October 2008. [Google Scholar]
- Xu, X.Y.; Wu, J.Y.; Tan, M.X. Microcomb-based photonic local oscillator for broadband microwave frequency conversion. In Proceedings of the Optical Fiber Communication Conference. Optical Society of America, San Diego, CA, USA, 3–7 March 2019. [Google Scholar]
- Turani, Z.; Fatemizadeh, E.; Blumetti, T.; Daveluy, S.; Moraes, A.F.; Chen, W. Optical radiomic signatures derived from optical coherence tomography images improve identification of melanoma. Cancer Res. 2019, 79, 2021–2030. [Google Scholar] [CrossRef] [Green Version]
- Yang, S.Q.; Li, Z.H.; Yuan, S.Z. Tunable dual-wavelength actively mode-locked fiber laser with an F-P semiconductor modulator. IEEE Photon. Technol. Lett. 2002, 14, 1494–1496. [Google Scholar] [CrossRef]
- Mei, J.W.; Xiao, X.S.; Yang, C.X. 1 μm wavelength swept fiber laser based on dispersion-tuning technique. Chinese Opt. Lett. 2015, 13, 091403. [Google Scholar]
- Tozburun, S.; Siddiqui, M.; Vakoc, B.J. A rapid, dispersion-based wavelength-stepped and wavelength-swept laser for optical coherence tomography. Opt. Express. 2014, 22, 3414. [Google Scholar] [CrossRef] [PubMed] [Green Version]
- Huber, R.; Wojtkowski, M.; Fujimoto, J.G. Fourier domain mode locking (FDML): A new laser operating regime and applications for optical coherence tomography. Opt. Express. 2006, 14, 3225–3237. [Google Scholar] [CrossRef] [PubMed]
- Li, F.; Zhang, A.Q.; Feng, X.H.; Wai, P.K.A. Frequency synchronization of Fourier domain harmonically mode locked fiber laser by monitoring the supermode noise peaks. Opt. Express. 2013, 21, 30255–30265. [Google Scholar] [CrossRef] [Green Version]
Figure 1.
The working principle of the proposed microwave photonic frequency conversion system (the red arrows are the optical path; the blue arrows are the electrical path; the curves with the gradient face color are the optical pulses; the blue curves are the microwave signals; RFin is the input radio frequency signal; RFout is the output radio frequency signal).

Figure 2.
(a) The trend of the Sinc function when κ was increasing by the tuning of L and switching the sign of r; (b) The trend of the Sinc function when κ was increasing by the tuning of r with the fixed L.
Figure 2.
(a) The trend of the Sinc function when κ was increasing by the tuning of L and switching the sign of r; (b) The trend of the Sinc function when κ was increasing by the tuning of r with the fixed L.

Figure 3.
(a) The down-conversion simulation spectra as τ arose; (b) the up-conversion simulation spectra as τ arose (the blue lines are the discrete longitudinal modes; the green curves are the envelopes of the Sinc function).
Figure 3.
(a) The down-conversion simulation spectra as τ arose; (b) the up-conversion simulation spectra as τ arose (the blue lines are the discrete longitudinal modes; the green curves are the envelopes of the Sinc function).

Figure 4.
(a) The trend of κ as L and r changed; (b) the trend of ωr as Δω and r changed.

Figure 5.
The experimental setup of the proposed microwave photonic frequency conversion system (the red curve is the optical signal; the black curve is the electrical signal).
Figure 5.
The experimental setup of the proposed microwave photonic frequency conversion system (the red curve is the optical signal; the black curve is the electrical signal).

Figure 6.
(a) The optical spectrum of the WSL; (b) the time domain signal of the WSL beating signal after the PD (the inset is the zoom-in of the pulse shape from 0.349 ns to 0.362 ns).
Figure 6.
(a) The optical spectrum of the WSL; (b) the time domain signal of the WSL beating signal after the PD (the inset is the zoom-in of the pulse shape from 0.349 ns to 0.362 ns).

Figure 7.
(a) The waveform of the pulse when the length of SMF was 0 km and 1.04 km; (b) the electrical spectrum of the frequency conversion system.
Figure 7.
(a) The waveform of the pulse when the length of SMF was 0 km and 1.04 km; (b) the electrical spectrum of the frequency conversion system.

Figure 8.
(a–i) The electrical spectrum of the up conversion when the SMF was 0 km, 1.04 km, 2.07 km, 3.11 km, 4.17 km, 5 km, 6.04 km, 7.07 km and 8.11 km.
Figure 8.
(a–i) The electrical spectrum of the up conversion when the SMF was 0 km, 1.04 km, 2.07 km, 3.11 km, 4.17 km, 5 km, 6.04 km, 7.07 km and 8.11 km.

Figure 9.
(a) The up-conversion spectrum for the 8 GHz input signal with different SMF lengths; (b) the up-conversion spectrum for the 16 GHz input signal with different SMF lengths.
Figure 9.
(a) The up-conversion spectrum for the 8 GHz input signal with different SMF lengths; (b) the up-conversion spectrum for the 16 GHz input signal with different SMF lengths.


Table 1.
The comparison of the down-conversion and up-conversion frequencies between the simulations and the experiment results.
Table 1.
The comparison of the down-conversion and up-conversion frequencies between the simulations and the experiment results.
| Conversion | Input Frequency | Output Frequency (Simulation) | Output Frequency (Experiment) |
|---|---|---|---|
| Down | 5 GHz | 4.935 GHz | 4.936 GHz |
| Up | 5 GHz | 5.067 GHz | 5.067 GHz |
Table 2.
The tunability of the up-conversion system for the 5 GHz, 8 GHz and 16 GHZ input signals in experiment.
Table 2.
The tunability of the up-conversion system for the 5 GHz, 8 GHz and 16 GHZ input signals in experiment.
| SMF Length | Up-Conversion for 5 GHz Input | Up-Conversion for 8 GHz Input | Up-Conversion for 16 GHz Input |
|---|---|---|---|
| 1.04 km | 5.067 GHz | 8.094 GHz | 16.208 GHz |
| 3.11 km | 5.207 GHz | 8.369 GHz | 16.629 GHz |
© 2020 by the authors. Licensee MDPI, Basel, Switzerland. This article is an open access article distributed under the terms and conditions of the Creative Commons Attribution (CC BY) license (http://creativecommons.org/licenses/by/4.0/).
Share and Cite
MDPI and ACS Style
Kong, Y.; Cao, Y.; Wang, L.; Wang, G.; Feng, X.; Guan, B.-O. Microwave Photonic Frequency Conversion Based on a Wavelength Swept Laser. Appl. Sci. 2020, 10, 3813. https://doi.org/10.3390/app10113813
AMA Style
Kong Y, Cao Y, Wang L, Wang G, Feng X, Guan B-O. Microwave Photonic Frequency Conversion Based on a Wavelength Swept Laser. Applied Sciences. 2020; 10(11):3813. https://doi.org/10.3390/app10113813
Chicago/Turabian StyleKong, Youxue, Yuan Cao, Lin Wang, Guangying Wang, Xinhuan Feng, and Bai-Ou Guan. 2020. "Microwave Photonic Frequency Conversion Based on a Wavelength Swept Laser" Applied Sciences 10, no. 11: 3813. https://doi.org/10.3390/app10113813
Note that from the first issue of 2016, this journal uses article numbers instead of page numbers. See further details here.