Online Estimation of Short-Circuit Fault Level in Active Distribution Network


1
School of Electrical Engineering, Shandong University, Jinan 250061, China
2
Henan Electric Power Research Institute, Zhengzhou 450000, China
3
Shenhua Guoneng Shandong Construction Group, Jinan 250001, China
4
Key Laboratory of Control of Power Transmission and Conversion (SJTU), Ministry of Education, Shanghai 200240, China
*
Author to whom correspondence should be addressed.
Appl. Sci. 2020, 10(11), 3812; https://doi.org/10.3390/app10113812
Submission received: 30 April 2020
/
Revised: 26 May 2020
/
Accepted: 28 May 2020
/
Published: 30 May 2020
(This article belongs to the Special Issue Phasor Measurement Units: Algorithms, Challenges and Perspectives)
Abstract
:The potential short-circuit current in active distribution network features time-variance with the increasing distributed generations. This feature makes the online estimation of fault level necessary. In this paper, a novel online estimation method is proposed to be implemented by either phasor measurement unit (PMU) or the measurements from protection relays. The equivalent circuit of the radial distribution network with distributed generators (DGs), e.g., wind turbines and photovoltaic cells, is derived with necessary simplifications. The natural disturbances downstream are used to evaluate the parameters of the equivalent circuit so that the potential fault level can be estimated in advance of the actual fault occurrence. A fuzzy logic identifier is presented to rank the confidence of the measurements incurred by the disturbance and to distinguish the qualified disturbance to launch the estimation. The mechanism based on multi-measurements and confidence indices was applied, to improve the accuracy. A typical distribution network in the United Kingdom (UK) with DGs was taken, as an example, to validate the proposed method under various load fluctuation. The results confirm the effectiveness of the proposed method, which is suitable for online estimation of short-circuit fault level in active distribution networks.
1. Introduction
The accurate estimation of the potential short-circuit fault level is of great importance to quantify the strength of power system [1], set the protective relaying, and select the qualified circuit breakers to trip the electrical components [2]. The higher potential fault level is equivalent to the larger short-circuit current in case of fault, the smaller system impedance, and hence the greater system strength. Traditionally such an estimation in distribution networks is only necessitated in an offline manner at the stage of grid planning. However, the networks tend to be active nowadays and referred to as active distribution network (ADN) with the increasing penetration of the distribution generators (DGs), including wind turbine generators and photovoltaic (PV) systems, etc. Such a trend largely diversifies and complicates this estimation of fault level [3]. The contribution of DGs on the short-circuit current is non-negligible anymore, while on the other hand, the intermittent renewable energy and the associated frequent operation also make the potential fault level change ceaselessly. To validate the breaking capacities of the mounted circuit breakers or monitor their risks of the possible scarce margin, it might not be proper or efficient to evaluate the fault level offline by a fixed grid configuration, as the penetration of DGs makes it difficult to select the grid configuration typical enough to represent the absolute-maximum short-circuit currents. In addition, some advanced functions, such as the adaptive protection setting [4] and even the adaptive control of DG for stability improvement, also rely on the real-time knowledge of the time-variant short-circuit current or the system strength. Consequently, the online method to evaluate the fault level in active distribution network deserves investigation.
Generally, all DGs increase the short-circuit fault level more or less [5], but their contribution depends on their forms and locations. DGs can be roughly classified into two major forms, which are inverter-based DGs (IBDGs) and rotating DGs, respectively. The typical IBDGs, e.g., PV systems or full conversion wind turbine generators, can be regarded as the controllable current sources, whose contribution to the short-circuit currents is limited by their control strategies and usually less than 1.5 times of their rated currents. However, the rotating DGs, such as doubly-fed induction generators (DFIGs), greatly enlarge the short-circuit current, as they can be modeled as voltage sources similar to those conventional synchronous generators [6]. On the other hand, it is believed that, in the low-voltage (LV) distribution networks, the short-circuit current will only be slightly increased with the penetration of DGs [7], whereas in the medium-voltage (MV) and high-voltage (HV) distribution networks, the fault level apparently differs from the traditional level if a large amount of DGs are integrated.
Previously, some analytical works have been presented regarding the short-circuit current in ADN. It is confirmed by both simulation and experiments in Reference [8,9] that the output currents of IBDGs increase in case that the grid voltages drop during fault. In Reference [1], the equivalent current sources are established for the positive and the negative sequence components, considering the inherent characteristics of IBDGs during low-voltage ride-through (LVRT). A simple equivalent circuit is proposed in Reference [10], to evaluate the short-circuit current with IBDGs. The models mentioned above are nonlinear and require the node impedance matrices as well. More importantly, they might not be practically feasible, as the structure and the operation states of ADN change frequently. Some real-time estimation methods that enable online application have drawn enough attention [11,12]. In Reference [13], the naturally occurring disturbances, such as load fluctuations, are employed to assess the supply impedance and consequently calculate the short-circuit fault current. Some similar methods are proposed for the distribution networks with DGs [14,15,16], but only the conventional models are used, which cannot distinguish the different DG forms. Moreover, the methods above are all passive and dependent on the inherent events or disturbances. The active methods, on the contrary, create the artificial disturbances on the operating condition or inject the harmonic currents with a band around the fundamental frequency [17,18]. There are also the third kind of method, namely the hybrid technique, which incorporates both the artificial (or controlled) and the natural disturbances to measure the fault current [19]. No matter which technique is applied, the existing real-time estimation methods lack the effective detection and judgement on the disturbance types. Sometimes the data from different disturbance, even though the grid configuration has already changed, are compromised with each other and disposed together. It might undermine the accuracy of real-time estimation.
With the development of the distribution level phasor measurement units (PMU), both the protection and the fault location scheme in the distribution networks considering DGs can be designed based on the synchronous phasor data [20,21,22]. The PMUs in distribution networks offer high accuracy, which is helpful to detect and measure the load fluctuations. Moreover, the proper placement of PMUs can enhance the location identification of the disturbances [23,24].
In this paper, an innovative method is proposed to estimate the short-circuit fault level in active distribution networks. The contributions of both rotating DGs and IBDGs to potential short-circuit current are taken into consideration. The proposed method is based on the online evaluation of parameters in the equivalent circuit, so that the time-varying factors are captured and the potential currents are estimated in advance of the fault occurrence. The natural disturbances are monitored to reckon the equivalent circuit. A fuzzy logic identifier is applied to effectively distinguish the useful disturbances upstream from those downstream, and meanwhile evaluate their confidence levels. The upstream and downstream disturbances are disposed in different ways. The short-circuit currents calculated on the basis of several continuous disturbances are weighted by the predefined confidence levels.
The rest of the paper is organized as follows. Section 2 describes the principle of the proposed method for short-circuit fault level estimation in ADN. In Section 3, the implementation of the proposed method is demonstrated. Meanwhile, it is validated on a typical distribution network, under different conditions of load changes. Conclusions are drawn in Section 4.
2. Short-Circuit Fault Level Estimation for Active Distribution Networks
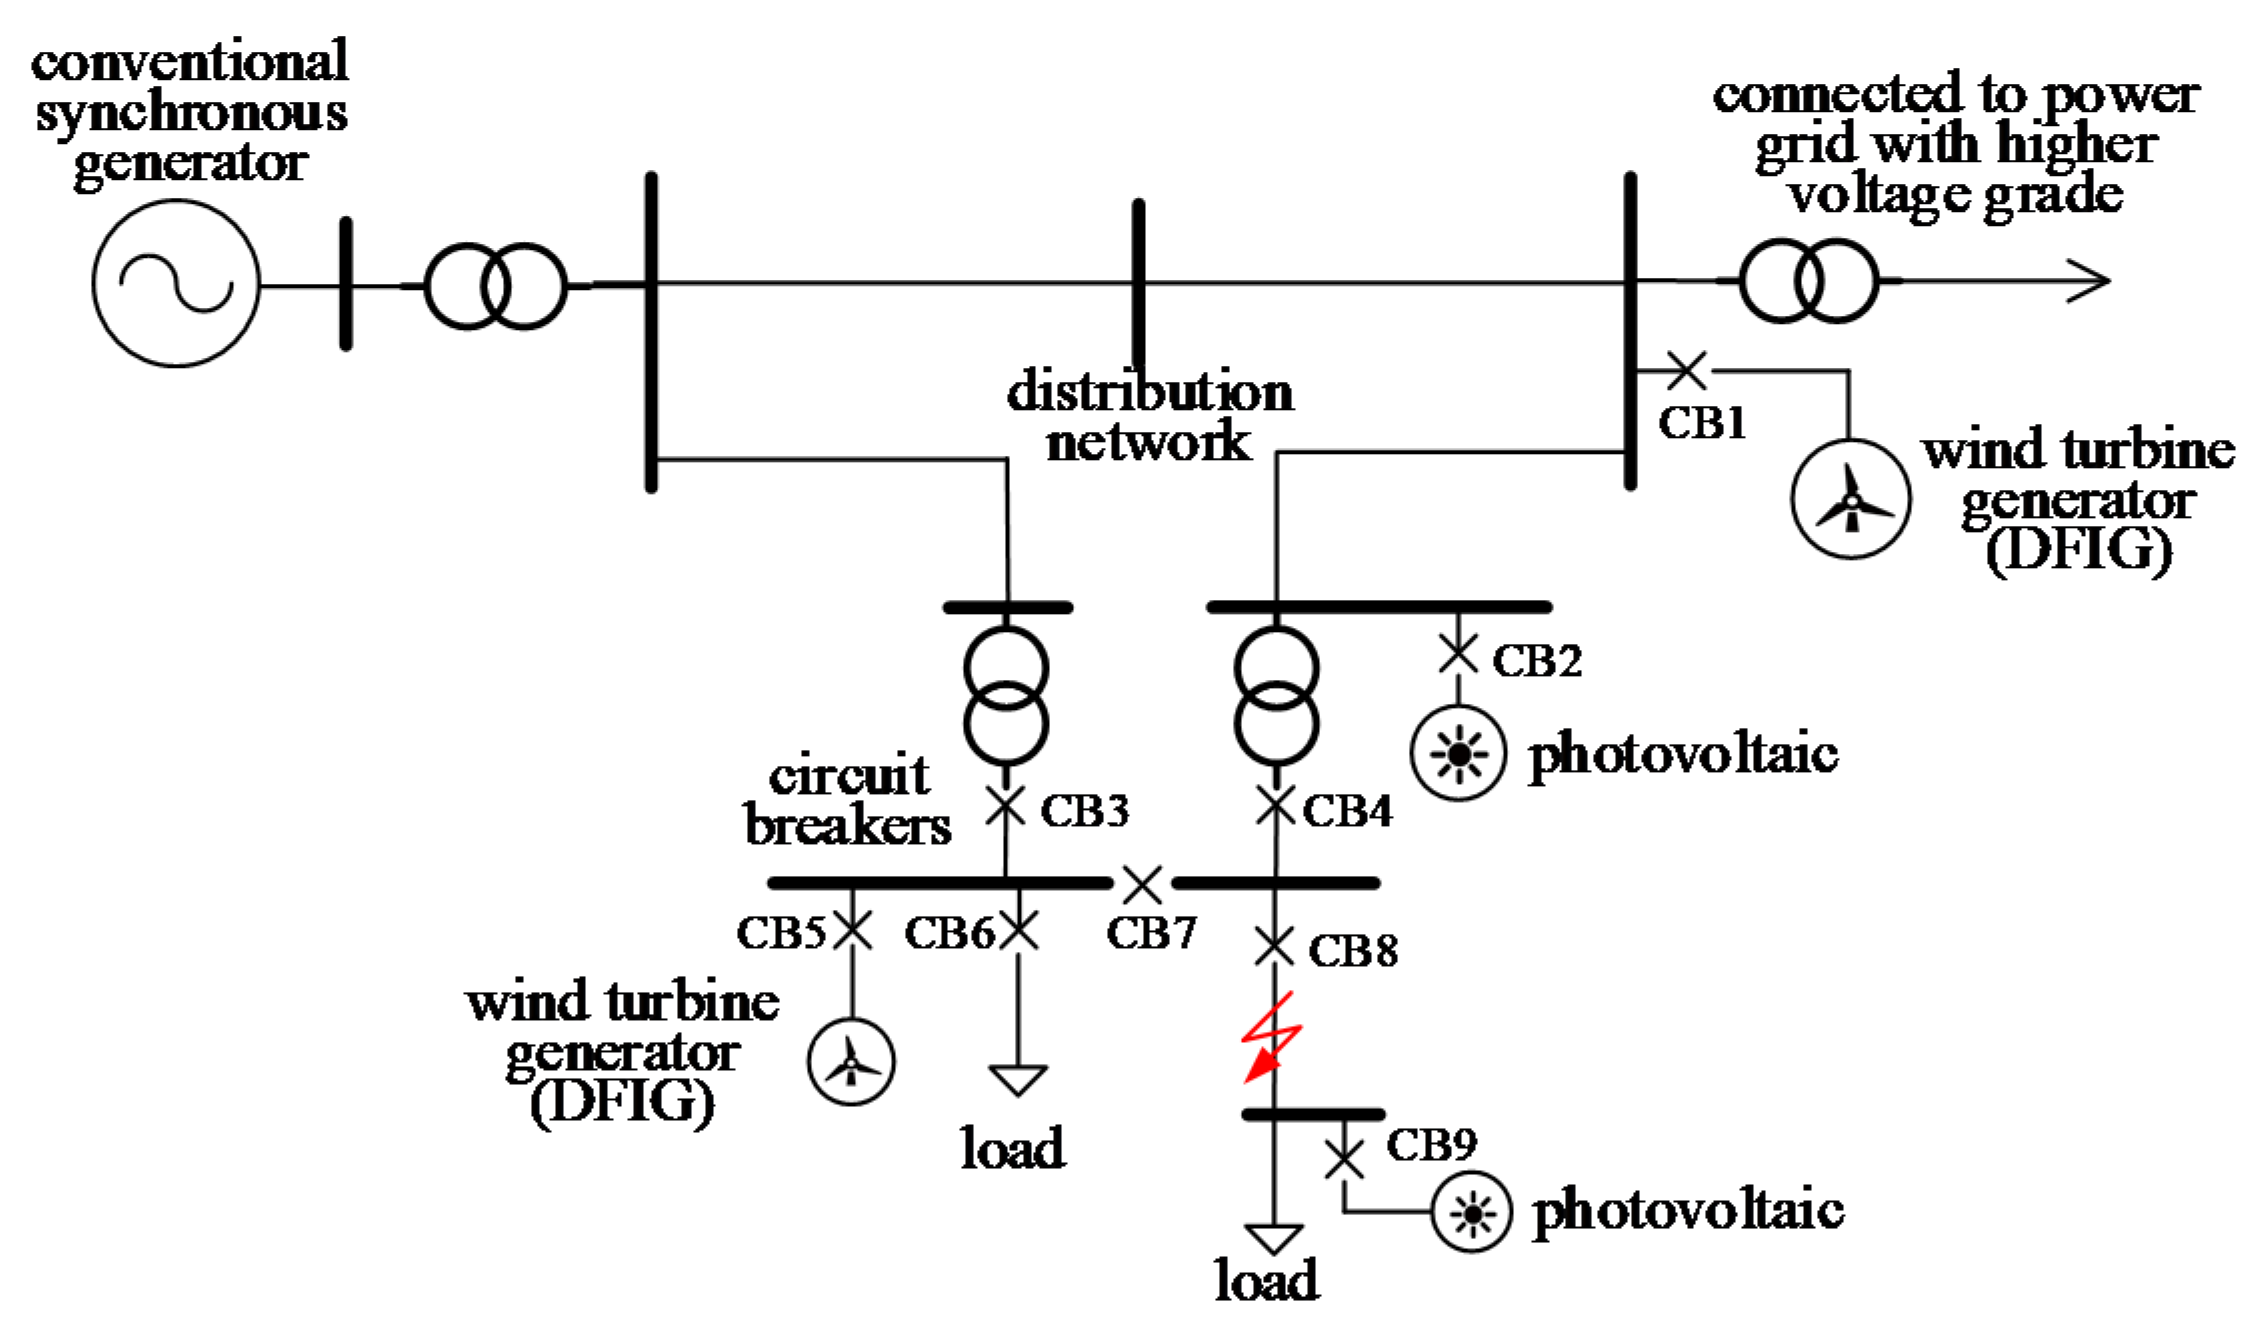
Taking a radial distribution network with DGs as an example, the network and the configuration of the circuit breaker (CB) are shown in Figure 1. Without losing generality, the IBDGs are represented by the photovoltaic generators, while the rotating DGs are represented by the DFIGs. The short-circuit fault level to be estimated was chosen as the current through CB8 if a fault occurs at the point downstream of CB8. The fault point is marked by the red symbol in the figure. The magnitude of the short-circuit current is not constant, as it changes with the network reconfiguration corresponding to the switching operation.
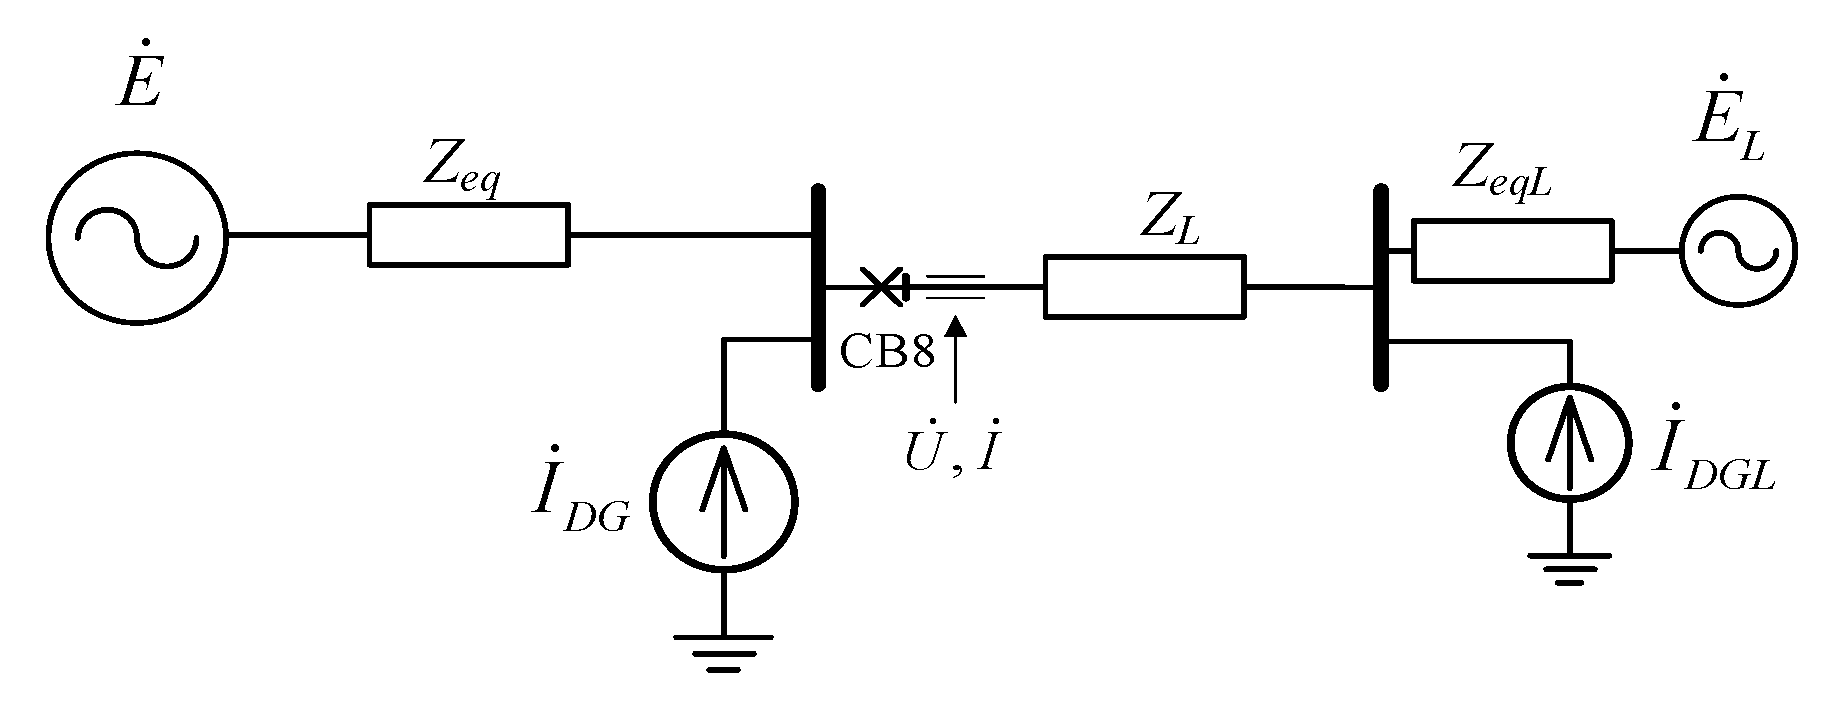
The equivalent circuit at the breaker CB8 is illustrated in Figure 2, where and , respectively, the voltage source and the impedance derived from Thevenin’s equivalence of both the upstream grid and the relevant rotating generators (including the conventional synchronous generators and the rotating DGs); is the equivalent current source modeling the upstream IBDGs, and its value is determined by the internal controls of IBDGs [5]; is the equivalent impedance of the lines connected to the feeder; and are the equivalent voltage source and current source modeling the rotating DGs and IBDGs connected to the feeder, respectively; and represents the equivalent network impedance between the downstream voltage-source-type DG and the point of interconnection.
2.1. Proposed Estimation Scheme
This paper aims to evaluate the potential fault level, which is expressed as the potential short-circuit current through the breaker. To investigate the extreme situation, three-phase short-circuit occurring exactly at the terminal of the breaker is considered. Hence, the power sources upstream rather than those downstream will contribute to the fault current through the studied breaker. Taking the breaker CB8 in Figure 1 and Figure 2 as an example, the overall current through it, if the imaginary fault really happens, consists of the contribution from the upstream rotating generators and that from the upstream IBDGs. If is known, then the former can be calculated by setting , the value of 1.0 pu (per-unit value), as the internal electromotive forces of the rotating generators are practically close to their rated values. Concerning the latter contribution, it is usually limited within a range of 1.2 to 1.5 times the rated current [25,26]. Such a multiplier is denoted as the overcurrent coefficient. Given the value of such a coefficient, the contribution from IBDGs to the fault current can be estimated, as long as their rated currents are known.
Consequently, the estimation of the potential fault level is converted to the evaluation of two unknown parameters, i.e., and , even though no actual short-circuit fault occurs. An online method deriving these parameters from the measurements after a series of disturbances is proposed in the following paragraphs. All selected disturbances come from the normal phenomena, such as load fluctuations, instead of real short-circuit faults. Certainly, the information about whether the configuration of the upstream grid changes or not should be known during the estimation procedure. Otherwise, the undiscriminating disposal of the data, even though and have already changed, is improper and might undermine the estimation accuracy. The proposed method in this paper benefits from an advanced algorithm to smartly detect, judge, and deal with various disturbances differently, thereby improving the estimation accuracy.
The parameters of and are proposed to be calculated on the basis of the voltage and current measurements after several continuous disturbances downstream to the studied circuit breaker and without re-configuration of upstream grids. In practice, the voltage at the breaker and the current through it can be measured by PMUs, taking their advantages on accurate synchronous sampling. The precision for the voltage/current amplitude and phase angle can reach 0.01% and 0.01°, respectively [27]. Alternatively, they can also be measured by protection relays. The corresponding positive sequence phasors of voltage and current are obtained as well. In this paper, the subscript ‘0’ is applied to denote the variables before disturbances, e.g., the measured voltage phasor and the current phasor , respectively. After downstream disturbances with enough identifiability, the relevant voltages and currents are recorded as a set of phasors i.e., and .
The following equations hold:
where is defined as the regulation factor to describe the IBDG output current with respect to its rated value as its output voltage changes. During the disturbance, the output power of IBDG is assumed to be constant; hence, , which can be numerically calculated.
Denote the vector , and the following matrix equation is obtained by subtracting the first equation from the other equations in Equation (1).
If and the rows of matrix are independent to each other, Equation (2) is solvable. That is to say, two independent disturbances are exactly-enough to determine the vector in theory. If , however, the vector can also be determined as a least-square solution. Considering the possible noises and modelling errors, it is better to use more than exactly-enough measurements from different disturbance to promote the confidence level in results.
Then, there are two questions to be addressed. Firstly, the direction of the disturbance needs to be identified so as to take advantage of the useful fluctuations occurring on the downstream to form the coefficient matrix in Equation (2). As discussed above, only and upstream to the studied circuit breaker are required to be estimated, so it should be guaranteed that no change happens in the power grid upstream. The proposed method can only depend on the disturbances downstream to derive the results. If the disturbance upstream is detected, the initial measurements and should be updated, indicating the upstream grid is re-configured and new or should be expected. Hence, it is important to distinguish the direction of disturbance. Secondly, the amplitudes of the voltage and the current variation in coefficient matrix in Equation (2) are also crucial for the estimation accuracy. Disturbances occur in the network time to time, while the experience shows that, as to the deviations, at least 5% are apparent enough to produce the qualified variation on the voltage and current. Moreover, there are also a series of naturally occurring disturbances, such as large motor starting-up, electric arc furnace operation, rapid load fluctuation, etc. An effective way to capture and rank the useful disturbance is also important for the proposed method. These two questions are to be discussed in the following section.
2.2. Direction Identification of Disturbance
It has been confirmed that the direction of fault on a transmission line can be distinguished on the basis of the angle difference between voltage and current phasors [28]. Similarly, the change of the voltage and current can be used for the identification of disturbance direction.
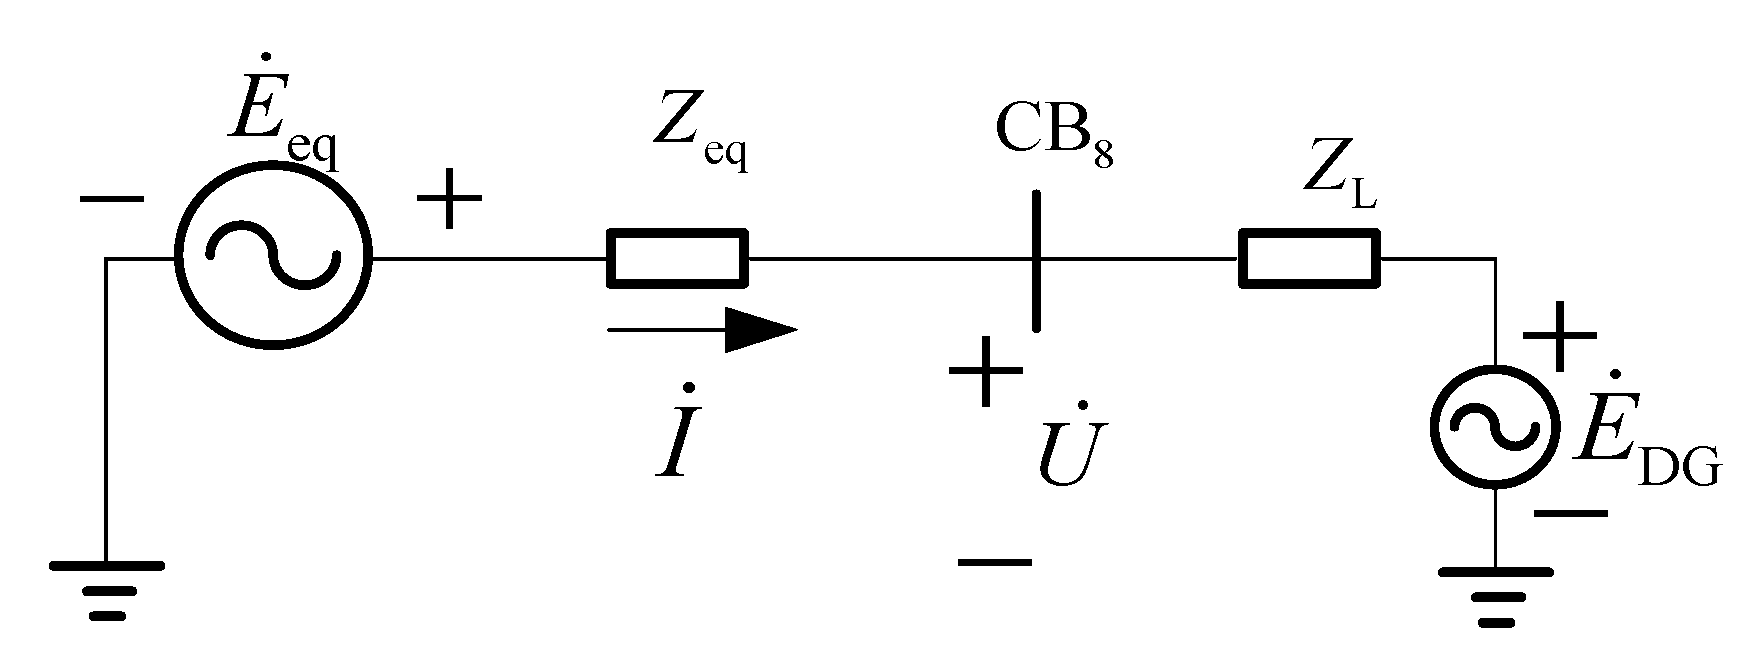
Take the simplified equivalent circuit of a general radial distribution network as an example (as shown in Figure 3). Suppose the disturbances occurs on the downstream, which is to say and are constant while changes from to . Consequently, the voltage on CB8 and the current through it change from and to and , respectively. Define the reference directions of the current and voltage phasors as indicated in Figure 3, then the following equations hold.
The following can be derived:
On the contrary, if the disturbance occurs on the upstream or grid side, the equivalent load impedance and voltage keep constant, while and vary. Then the following two equations yield.
The following holds:
Equations (5) and (8) show the relationship between the impedance and the variations of voltage and current in two different situations. In terms of the practical power systems, the real parts of and are usually greater than zero [14]. With regard to , it implies that the transfer conductance of power grid cannot be ignored. The non-zero real part of represents some active loads on the feeder. Therefore, the following index is designed to distinguish the direction of the disturbance.
Specifically it means the disturbance occurs downstream to the circuit breaker if ; otherwise, it is supposed to be the event upstream.
The application of PMUs can enhance the accuracy on the location identification of the disturbances. If there are several PMUs on the feeder, the disturbance directions obtained from each PMU can be compared with each other, and the results without consistency can be eliminated.
2.3. The Fuzzy Logic Identifier to Distinguish Useful Disturbance
There are some difficulties for the deterministic theory to distinguish the useful disturbances in the proposed method. On one hand, it is impossible to draw a distinct line between the disturbances on two different directions, as the slight fluctuations are always happening in the whole system. Therefore, the mere index might not always be always accurate enough, especially in the special situation that the value of is in a small vicinity of zero. On the other hand, the threshold is required to identify the “non-trivial” change of the voltage or current, as the desired information in the trivial fluctuation could be overshadowed by the errors. However, similarly, it is hard to find a once-for-all setting for the threshold, as the power girds with different load types have a diversity of characteristics.
In this paper, a fuzzy logic identifier is illustrated to identify the disturbance in a more adaptive manner. Fuzzy logic methods have been invented for decades, to provide alternative solutions in adaptive control [29]. Two aspects need to be identified, including the disturbance direction with respect to the studied breaker, and the deviation level of the voltage or the current. The design of a fuzzy logic identifier usually includes three steps: (1) setting the rule of the problem; (2) selecting the proper linguistic terms which can describe the input and output properly and normalize the input–output variables; and (3) defining the fuzzy logics for all fuzzy variables [30].
2.3.1. Set the Rules for Disturbance Identification
Equation (9) designs an index . By comparing its value with zero, this index represents the disturbance direction theoretically. However, if is too close to zero, the mis-judgement could be made due to the inevitable errors in potential transformer (PT) and current transformer (CT), as well as in the computation process. Therefore, a safety margin is imposed to enhance the accuracy of the disturbance direction identification. The practical criterion is formulated as Equation (10).
where is a small positive value predefined to establish the safety margin. In this paper, it is experimentally set as 0.01. Equation (10) ensures that those unclear disturbance conditions with laying in a small vicinity of zero, will be ignored. Such conditions could be simultaneous disturbances on both grid and load side, or those with slight voltage and current fluctuations.
Concerning the identification of the effective non-trivial disturbances, the relative percentages of the value changes are employed. To take consideration the operation states before and after the disturbance, the original values compromise to adopt the averages of those before and after the disturbance.
It is obvious that these two scalar positive parameters range from 0 to 2, which can be used for evaluating the severity of the disturbance.
where the function “average(x1,x2)” represents the mathematical average operation of the variables x1 and x2.
2.3.2. Linguistic and Universal Terms of Input–Output Variables
It is of great importance to represent the problem in fuzzy terms when fuzzy logic is used for problem-solving scenarios. As stated above, only the load-side disturbance which satisfies , is with useful information. Therefore, and are considered to be the input signals for the identifier. They are both positive values. Consequently, four linguistic terms, namely Zero, Small, Medium, and Large, are picked out to describe the input variables in the fuzzy system [31]:
(O, PS, PM, and PL)
O—Zero;
PS—Positive Small;
PM—Positive Medium;
PL—Positive Large.
Different from the fuzzy logic controller, whose output signal is used as the tuning parameters of the control strategy, the fuzzy logic identifier in this paper is dedicated to classify the input states. The output variable herein is namely the confidence level (CL) of a certain disturbance. It represents the reliability or the confidence of the voltage and current changes caused by such a disturbance. As the proposed method is based on the least-square solution, the confidence of the disturbance affects the estimation results. If the disturbance is more desirable, i.e., definitely occurring downstream and incurring more effective changes in voltage and current, then the corresponding results derived from it should be more reliable. To make the segmentation of CL more accurate, seven terms of nonnegative value are required:
(O, PVS, PS, PLM, PM, PML, and PL)
O—Zero;
PVS—Positive Very Small;
PS—Positive Small;
PLM—Positive Light Medium;
PM—Positive Medium;
PML—Positive Medium Large;
PL—Positive Large.
The input variables of a fuzzy logic identifier usually change within a range, which cannot be confirmed in advance. However, the fuzzy logic rules require the input signals to be dispersed in the first place. Consequently, the actual variation range shall be projected to a proper closed interval to facilitate the calculation. According to the feasible operation states and experiments, the input signals involved in the fault level estimation have the following numerical features. normally lies in the range of as the operating voltage of the power is system seldom below 0.8 pu, except in the fault. For , it can vary in a wide range of , supposing the load has a large overload capacity. Therefore, two input signals, and , are first projected to the interval of and , respectively. If the values of the input signals go beyond the corresponding lower and upper limit, they will be assigned to the values in the boundary. For example, if the relative change of voltage is greater than 0.3, the nominal input of will still be fixed as 0.2.
To make the input–output signals more uniform and simplify their transformation to linguistic terms, the universe mapping is introduced to further project the input signals to a series of dispersed numbers. It is required that the number of elements in the basic universe is more than twice the number of fuzzy linguistic terms. Therefore, the fuzzy sets can fully cover the input–output domain without losing important information. Herein, the universes and are uniformly mapping as (0, 1, 2, 3, 4, 5, 6, 7), while the universe of the output variable CL is set as (0, 1, 2, 3, 4, 5, 6, 7, 8, 9, 10, 11, 12, 13).
2.3.3. Fuzzy Logic Rules and Membership Functions
Fuzzy logic provides a computational representation of heuristic knowledge about a specific problem [32]. The purpose is to find out how the input variables influence the decisions and to quantify their values in relevance levels. Membership functions establish the profile of the variables by expressing the compatibility degree of each one with previous experiential information. Then the fuzzy logic rules can be built, and the evaluation of the input signals can be acquired via defuzzification, which consists of all variables’ interaction through stochastic techniques [32].
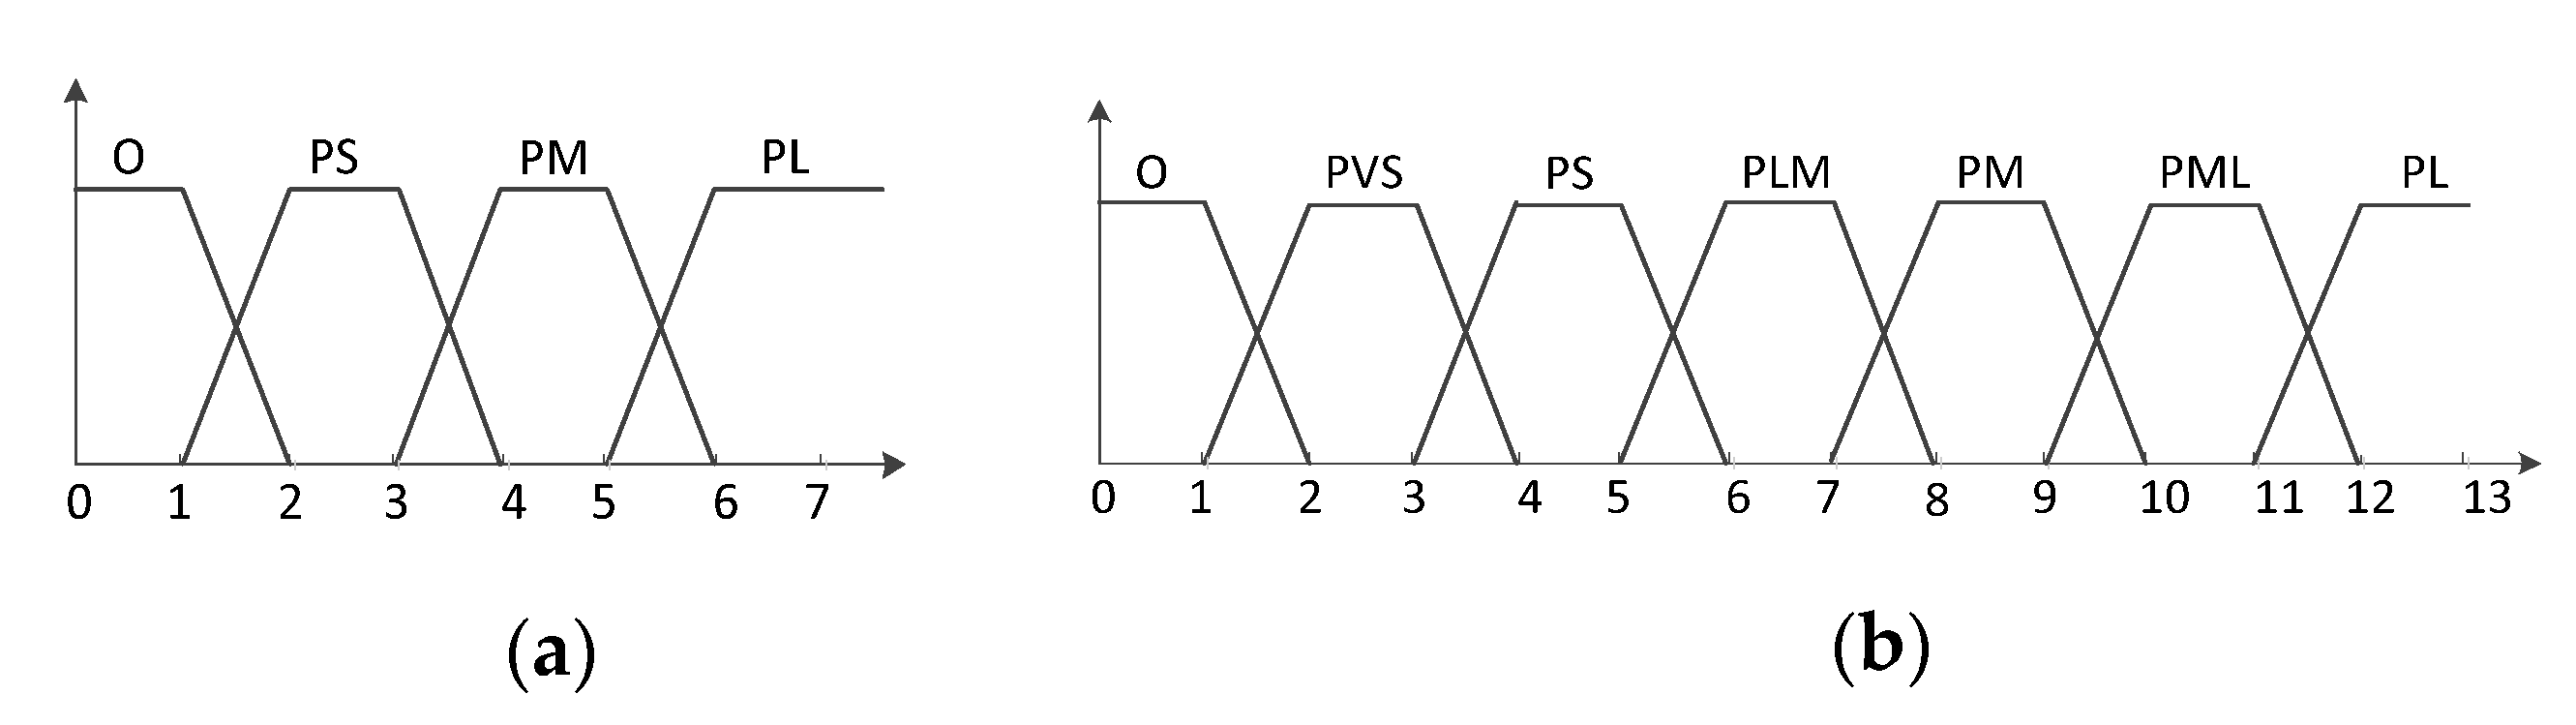
The values of the membership function are all in the interval [0, 1], where the value of 1 means that the object entirely belongs to the member of the set, while the value of 0 represents complete irrelevance. When designing the fuzzy logic identifier, the triangle and trapezoidal memberships are used in this paper. The linguistic terms of two input variables and the universes are identical. Therefore, they are allocated with the same membership function, as shown in Figure 4a.
Take the four cases in Table 1 (O, PVS, PML, and PL in bold) as the examples to explain the rules in detail. The rules are listed as follows:
IF ranges within O, and ranges within O, THEN the output is O;
IF ranges within O, and ranges within PS, THEN the output is PVS;
… …
IF ranges within PL, and ranges within PM, THEN the output is PML;
IF ranges within PL, and ranges within PL, THEN the output is PL.
As there are two input signals, each of which is with 4 possible linguistic terms, the number of the fuzzy rules is total 16. The tuning rules in detail are explicitly illustrated in Table 1. It implicates that the estimation results derived from a different disturbance will have a different confidence. Those with apparent load changes are allocated high confidence. The membership function of output variable CL is shown in Figure 4b.
3. Implementation and Simulation Results
3.1. Practical Implementation
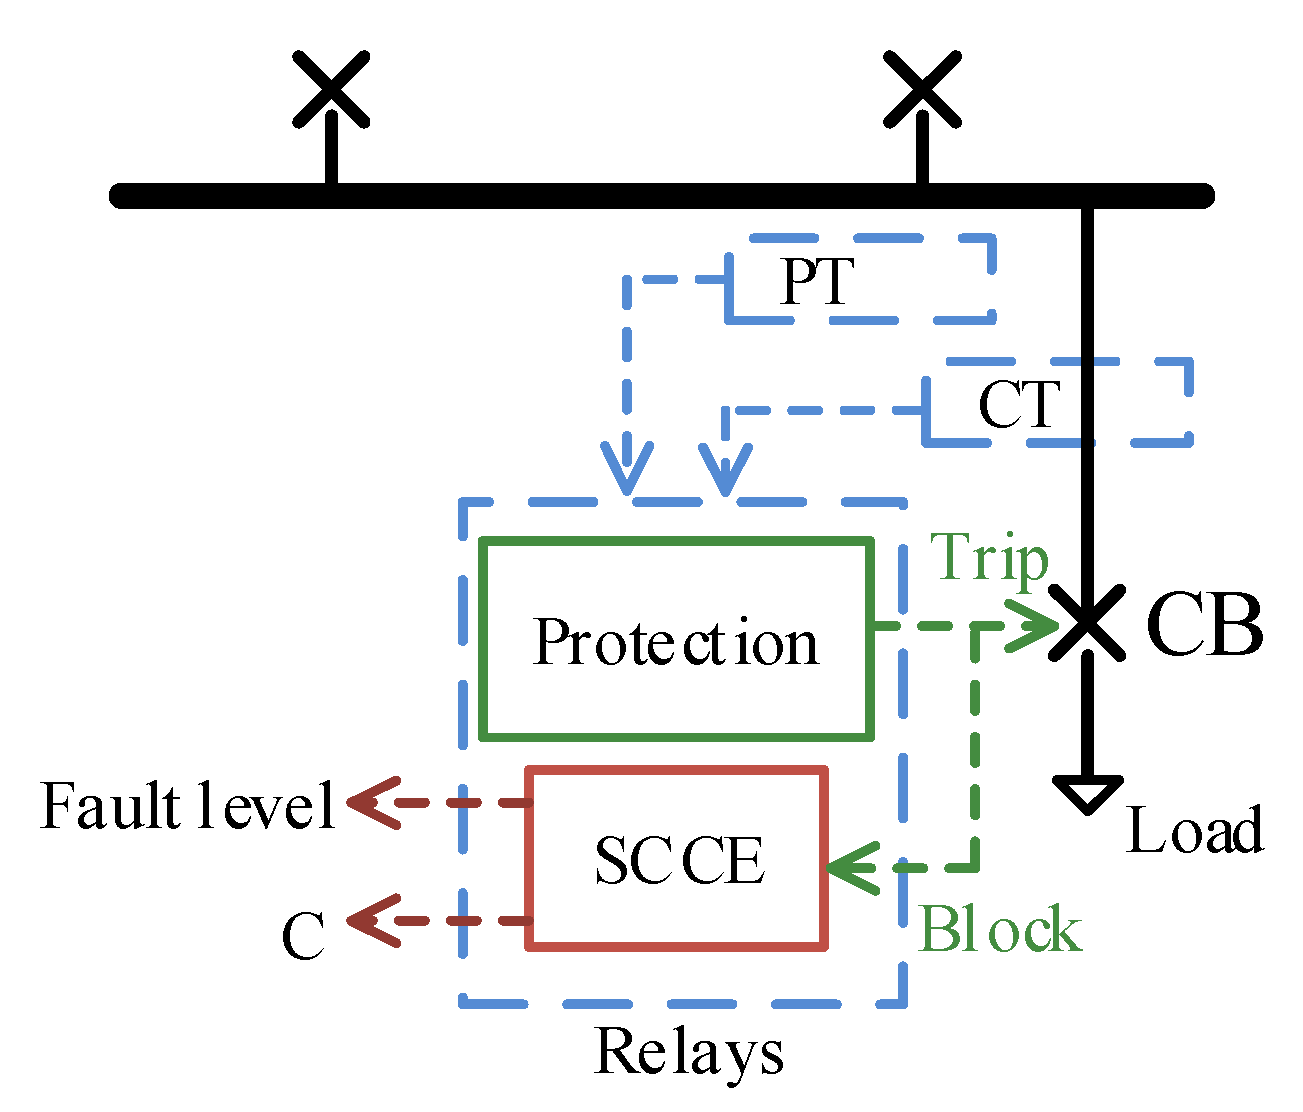
One of the advantages in the proposed method is that there are several options to implement it. It can be implemented by PMU with high measurement accuracy or by the protection relays without any extra hardware investment. In this section, the latter option is selected for demonstration. In addition, the proposed method estimates the short-circuit current before it really happens. The online procedure of the estimation guarantees the time-varying factors incurred by DGs are considered. The practical implementation of fault level estimation in the relays is shown in Figure 5, where the abbreviation “SCCE” represents the module of short-circuit current estimation. The phasor values of the positive voltage and current at the studied breaker are analyzed on the basis of the recorded data. Certainly, PMUs can alternatively be applied to provide more-accurate data and more-rapid data processing, if necessary. The values of , and are calculated for every non-trivial change. A series of consecutive disturbance downstream is employed. The confidence level of the data is derived to weight the results. If there happens a significant disturbance on the grid side, representing the change of the equivalent circuit topology upstream, the initial operation states will be updated to start a new estimation process. After the downstream disturbances occur consecutively for times, the confidence level of the recorded voltage and current through the fuzzy logic identifier are assigned to be . The short-circuit current is then estimated with Equation (2), and the corresponding confidence level of the final result is defined as follows:
This parameter can be used to evaluate the creditability of the final result.
If the fault really occurs, the module of SCCE will be blocked as soon as the tripping signal is triggered, because the fault might lead to severe errors due to the saturation of PT and CT. The SCCE also has a low voltage/current block function to prevent the equipment from outputting the results with large errors.
3.2. Test Case and Results
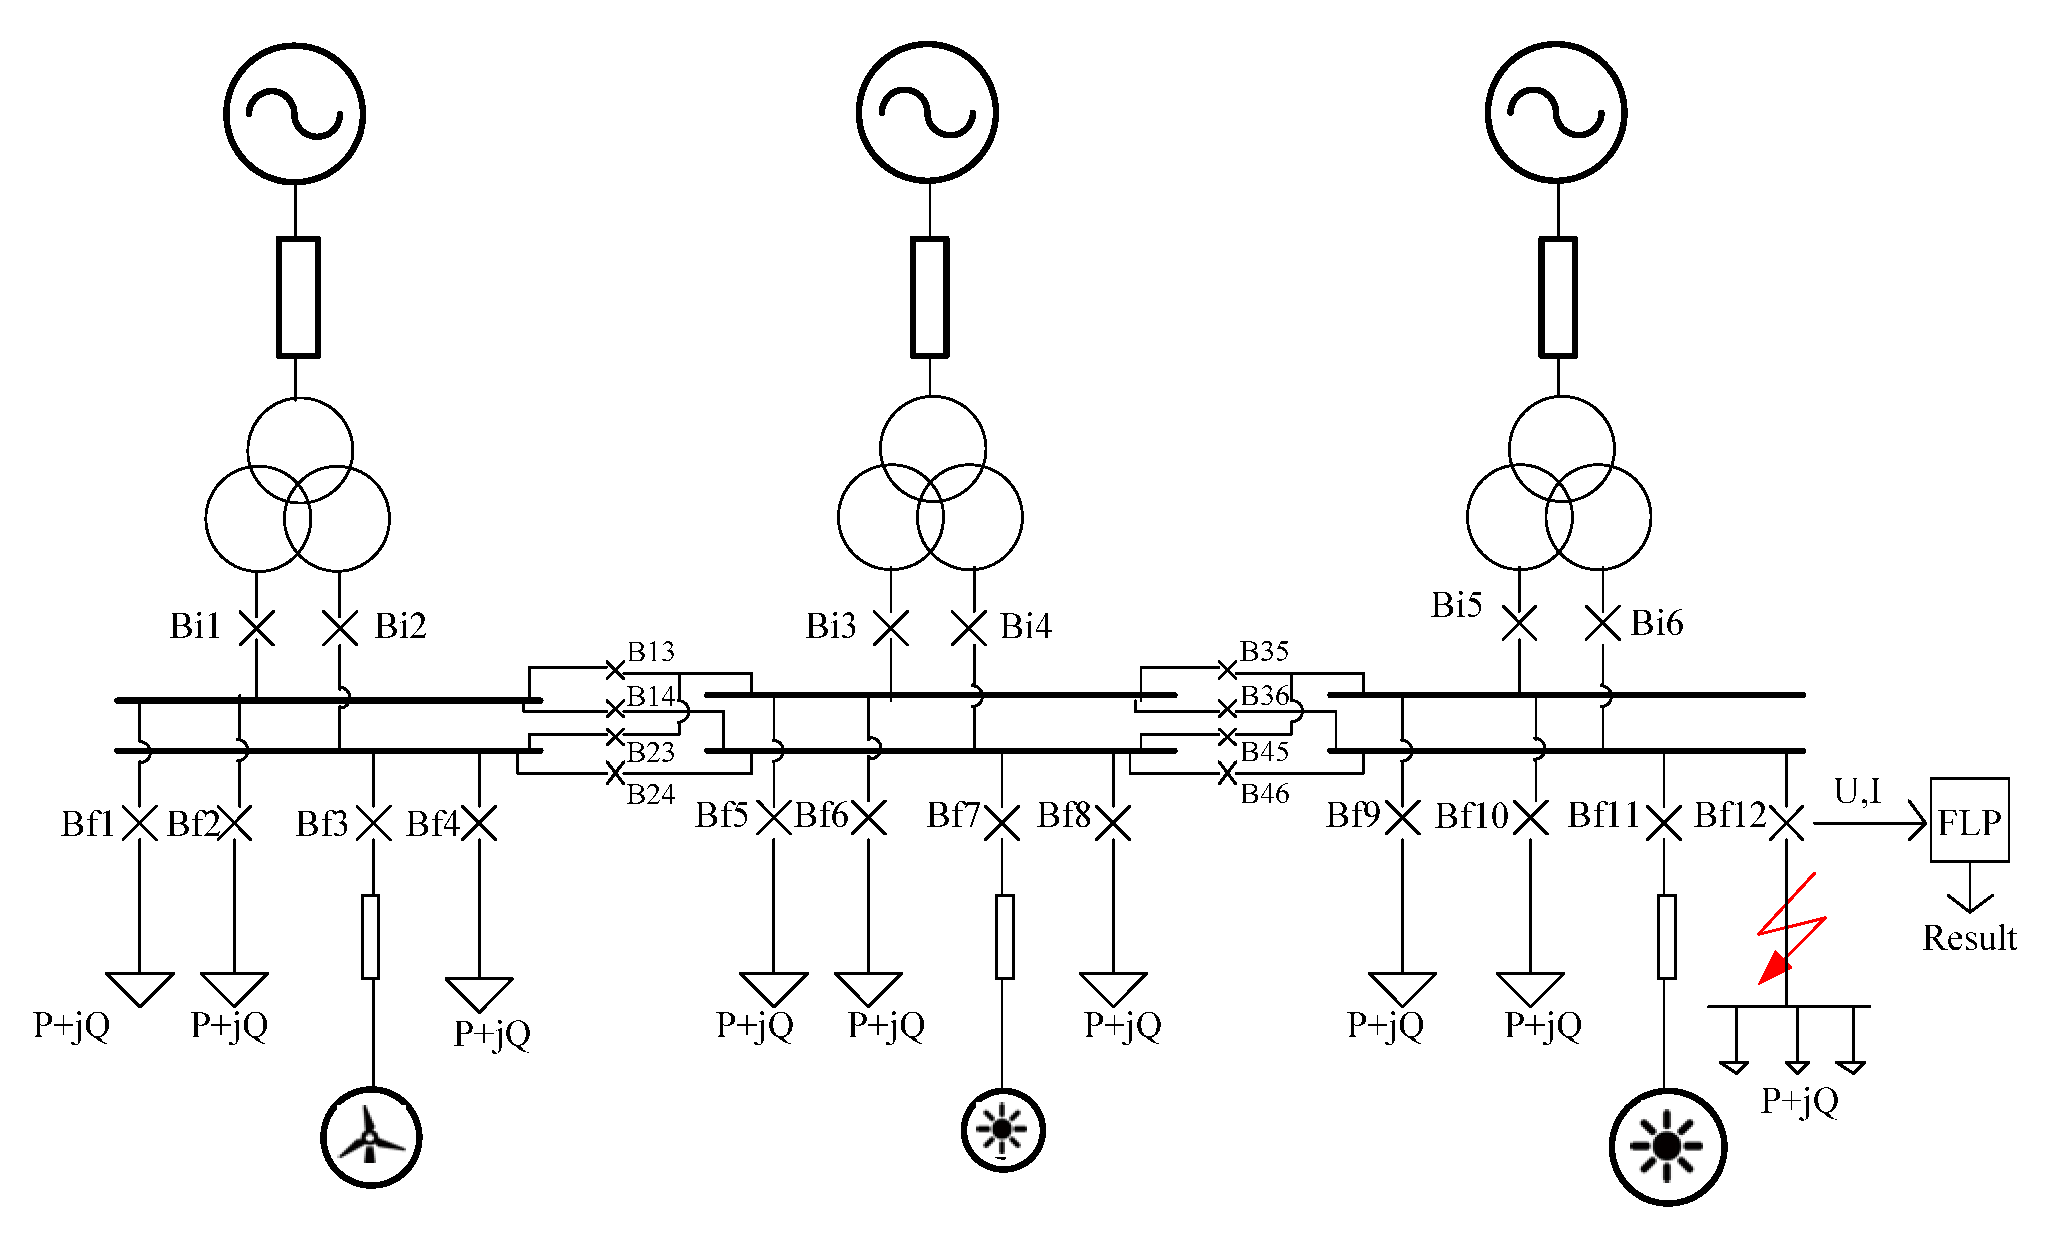
The proposed method is validated by hardware-in-loop (HIL) technology. The data processing and the proposed algorithm are implemented in hardware relays. The network and the associated disturbances are simulated in software. The network dynamics and the disturbances produced by simulation in software are converted into real signals imposed on hardware relays. Thereby, the interface between hardware and software is implemented. The network model of the test case is derived from a typical distribution network in the United Kingdom (UK). The model integrates some DGs, as illustrated in Figure 6. Meanwhile, there are three transformers with the ratios of 33 kV/11 kV/11 kV, 66 kV/11 kV/11 kV, and 132 kV/11 kV/11 kV, respectively. Six busbars are divided into three groups and connected to 12 feeders, three of which are DGs and the rest of which are loads. There are four kinds of breakers in the model. The breakers Bi1~Bi6 connect to the main power source, while Bf1~Bf12 are designed for the loads or DGs. The rest of the breakers are used for bus switching. The breaker Bf12 was chosen as the studied breaker, which is connected with different types of loads, including variable impedance load, motors, electric arc furnace, etc.
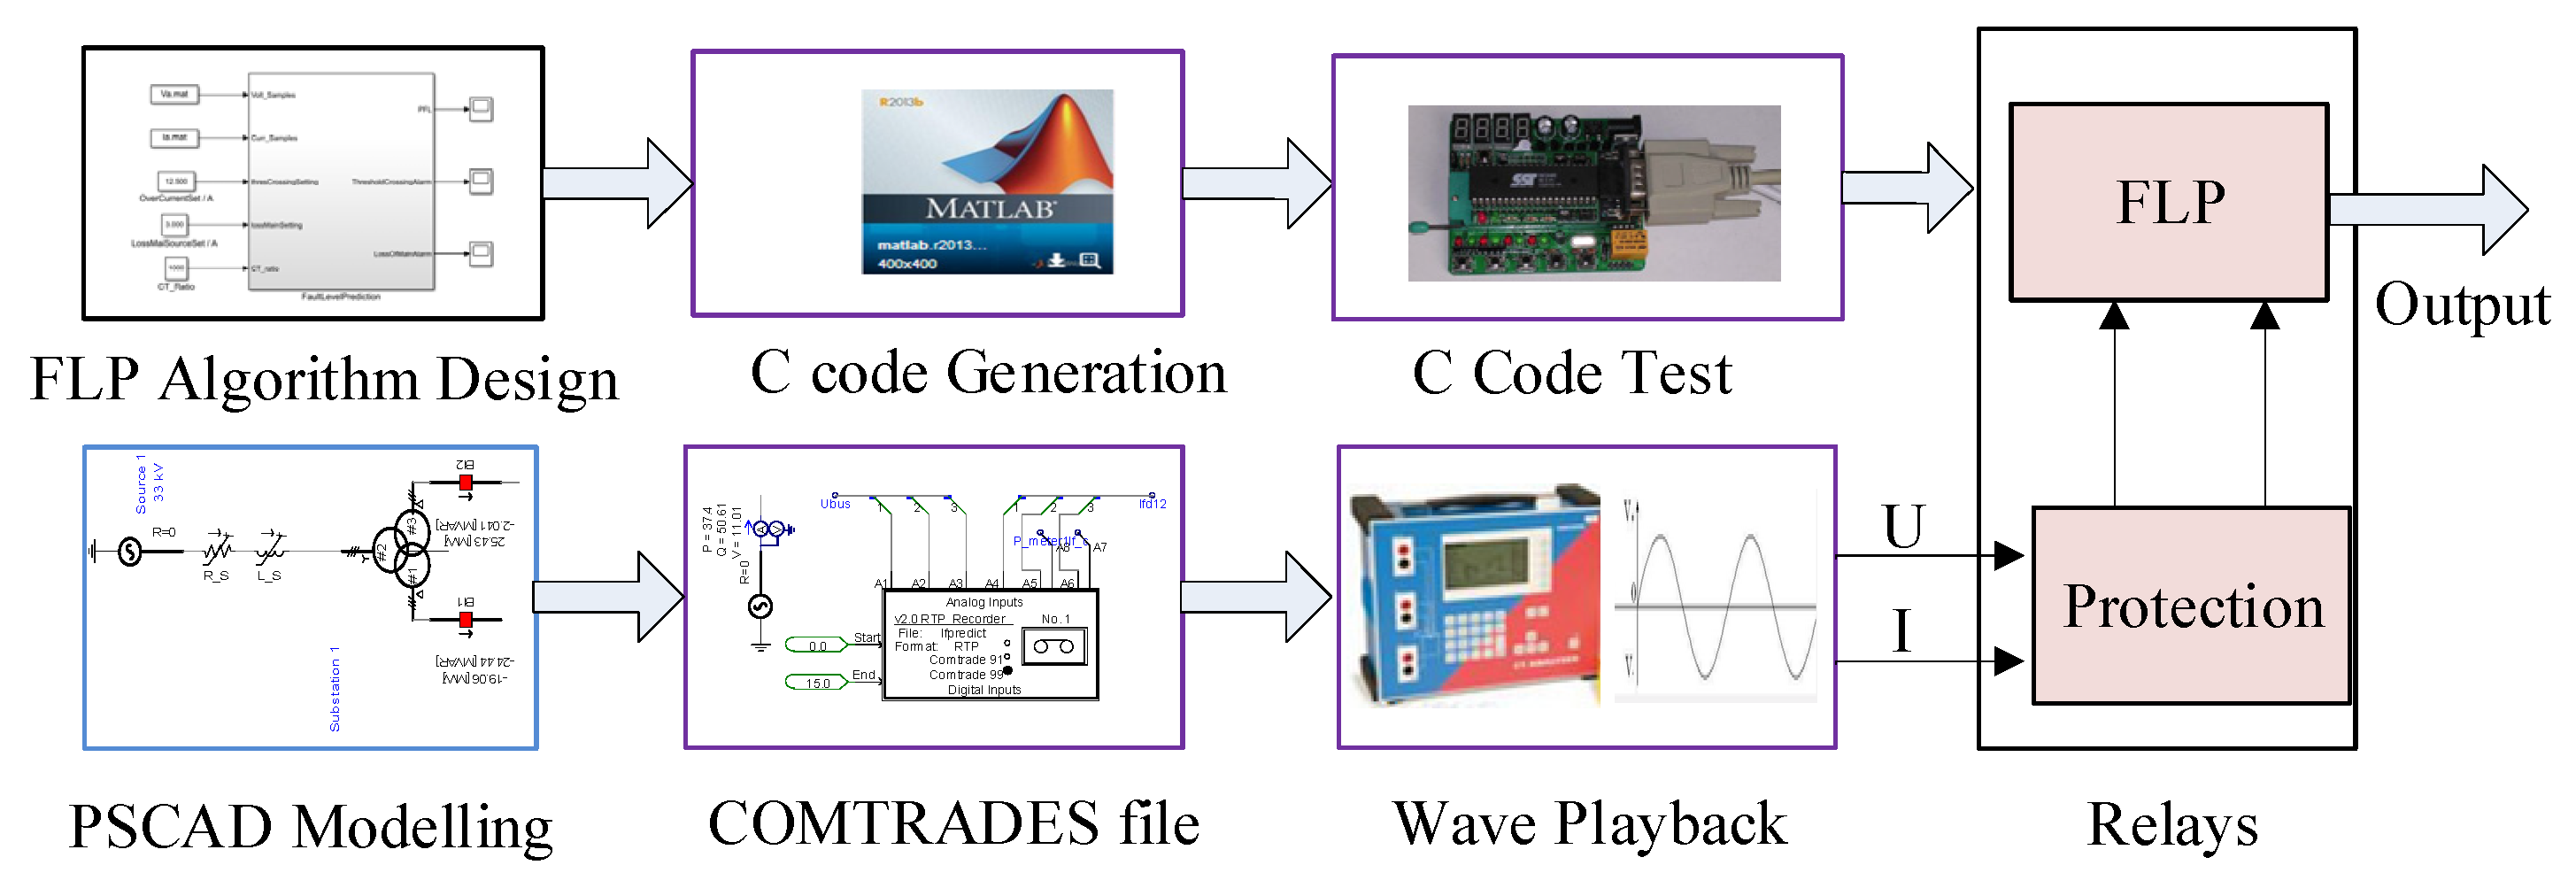
Similar to the relay testing, the proposed algorithm is coded and compiled by MATLAB C-coder module. Then it runs in a real-time hardware simulator and is implemented in relays. On the other hand, the network model is firstly constructed in PSCAD software. Then the voltage and current at the breakers are simulated and stored in the COMTRADE data files. After that, the OMICRON simulator is used to generate the real signals of voltage and current, in accordance with the COMTRADE data files. The real signals generated are imposed on the relays. Thereby, the test scheme of HIL is accomplished. The basic process of the test is shown in Figure 7.
The testing scenarios are selected in accordance with the real conditions. The switching of breakers is used to simulate the different states representing the adjustment due to intermittent DGs. The downstream disturbances are generated to simulate the motor starting-up, the normal operation of the electric furnace (using its lashing characteristics), and the sudden/smoothing load change. The fault to compare with and validate the results from the proposed method is obtained by imposing a permanent three-phase short-circuit in PSCAD.
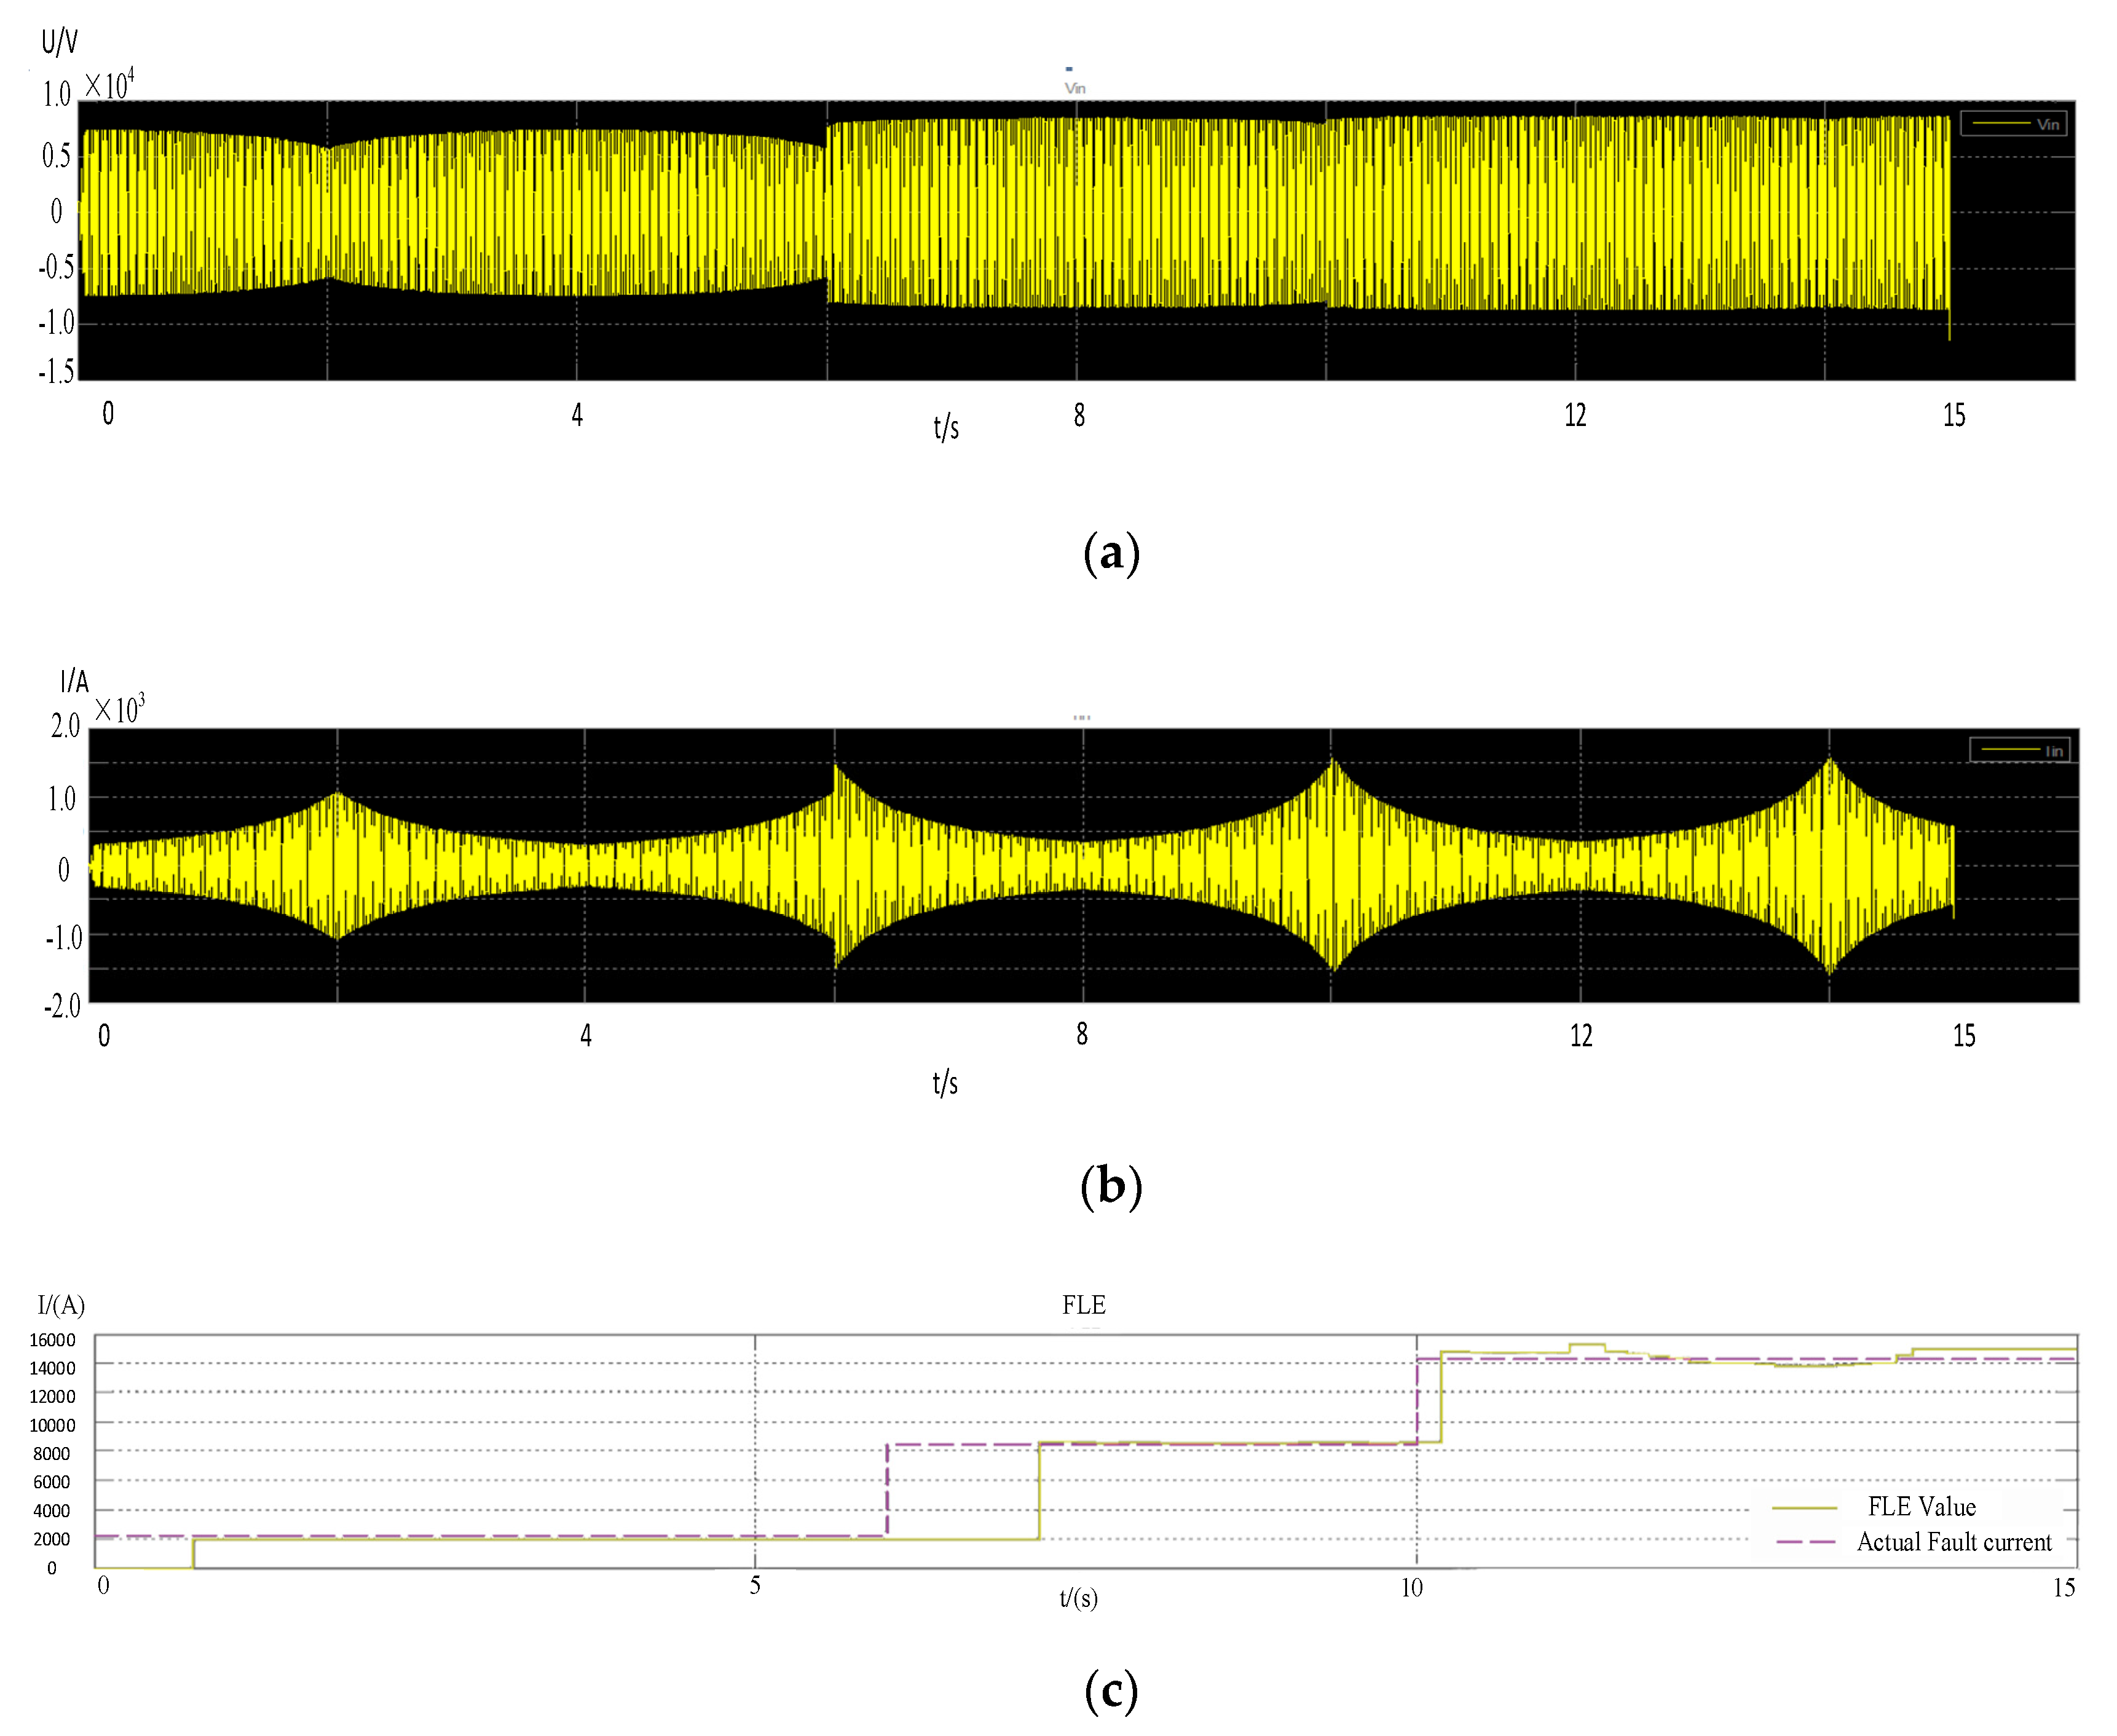
The first test is carried out as follows: (1) At the beginning, all of the main-sources are disconnected, i.e., Bi1 to Bi6 are open; (2) at 6 s, Bi1 to Bi3 are closed and half of the main-sources are connected; (3) and at 10 s, Bi4 to Bi6 are closed. The composition load downstream to the studied breaker Bf12 changes randomly. The voltage and the current at the breaker are recorded for 15 s in COMTRADE files. They are shown in Figure 8a,b respectively. The fault currents obtained by the simulation in PSCAD and by the proposed method of fault level estimation (FLE) are both shown in Figure 8c. They are depicted by the dashed and the solid line, respectively. Because the switching operation on the grid side forms different states, the fault current changes dramatically at 6 s and 10 s. The changes are clearly shown in Figure 8c, with the purple dashed line. Because it needs to detect a series of non-trivial load fluctuation to launch the fault level estimation, there is a short delay for results to be updated. However, as soon as the load fluctuation is detected, the predicted estimation result is given and shown in Figure 8c, with the solid yellow line. The errors between the actual short-circuit current and the estimated result are trivial, which validates the feasibility of the proposed method.
The other eight disturbances caused by different types of load fluctuations on the feeder are applied to the system. The proposed method is validated in each case. The results are quite similar to Figure 8c, so they are not depicted. The overall numerical results, including confidence level, are given in Table 2. It can be concluded from the table that the errors between the predicted fault level and the truth value are less than 5%. In addition, it can also be observed that both the accuracy and the confidence increase with the magnitudes of disturbance increasing. The proposed method in this paper is mainly designed to online monitor the breaking capacities of the circuit breakers and disclose the potential risks if the fault level goes beyond or reaches the breaking limit. The existence of such risks usually means that the circuit breakers should be replaced or upgraded. This kind of estimation is desirable for power-grid planning, which normally does not require extreme accuracy. Hence, the results in Table 2 are accurate enough. Certainly, the estimation accuracy is critical to the performance of the algorithm. If the disturbances are too small, the estimation errors might be large, as measurement errors always exist. On the other hand, if the disturbances are large enough, the estimation errors could be decreased. However, the latter scenarios occur less frequently than the former ones in the practical distribution networks, so the chances to activate the proposed method are also reduced in the latter scenarios. Therefore, there should be a compromise between the accuracy and the time efficiency. The choice of the disturbances to produce the results with errors less than 5% is determined on the basis of trial-and-error on a number of simulations for different kinds of disturbances. This threshold ensures a sound performance, balancing the accuracy and the acceptable time intervals, to produce the results.
4. Conclusions
In this paper, a method was proposed to evaluate the fault level represented by the short-circuit current through the breakers in the distribution networks with DGs. The merits of the proposed method can be summarized as follows.
- Different from the conventional offline analysis, the proposed method ensures online estimation of the potential short-circuit fault level. It is adaptive to the present situation in the distribution power networks with more and more DGs, which make the fault current change frequently. Meanwhile, the proposed method is relatively easy to be implemented by either PMUs or the measurements from the protection relaying.
- The feasibility of the proposed method depends on the accurate recording of the desirable information. An identification method to detect the disturbance direction helps to distinguish the wanted disturbance. The fuzzy logics are applied to classify the voltage and current changes incurred by the disturbance. Only the qualified disturbances will launch the estimation. The fuzzy logics overcome the difficulty in choosing the deterministic thresholds.
In addition, the least-square solutions with weighted confidence derived from fuzzy logic identifier help to decrease the estimation errors. The usage of the confidence index in the algorithm takes full advantage of all possible disturbances and disposes with them in the different weights. The results derived from the large disturbance are more accurate, with a larger confidence, as the measurement errors (in percentage) can be reduced. The smaller the disturbances are, the less accuracy and confidence are delivered. However, the small disturbances, which may occur more frequently in the practical distribution networks, are also needed so as to decrease the time intervals to launch the estimation. Therefore, the performance of the algorithm should be balanced between the accuracy and the efficiency.
The algorithm is successfully embedded into the protective relay, to implement the proposed method in practice. A distribution power network is used to validate the proposed method. The results proved the effectiveness and the accuracy of the presented method. Meanwhile, it is true that PMUs can alternatively provide more accurate data and more rapid data processing for the proposed method, if necessary.
Author Contributions
Conceptualization, X.W. and F.S.; methodology, F.S.; validation, P.W.; formal analysis, Y.W.; writing—original draft preparation, F.S.; writing—review and editing, X.W.; supervision, Y.W.; funding acquisition, F.S. All authors have read and agreed to the published version of the manuscript.
Funding
This research was funded by Key Laboratory of Control of Power Transmission and Conversion (SJTU) Ministry of Education (2016AA13) and the National Nature Science Foundation of China (514770929).
Conflicts of Interest
The authors declare no conflict of interest.
References
- Wang, Q.; Zhou, N.; Ye, L. Fault analysis for distribution networks with current-controlled three-phase inverter-interfaced distributed generators. IEEE Trans. Power Deliv. 2015, 30, 1532–1542. [Google Scholar] [CrossRef]
- Williamson, G.E.; Jenkins, N.; Cornfield, G.C. Use of naturally occurring system disturbances to estimate the fault current contribution of induction motors. IEE Proc. Gener. Transm. Distrib. 1996, 143, 243–248. [Google Scholar] [CrossRef]
- Ratnadeep, K.S.; Bhosale, Y.N.; Kulkarni, S. Fault level analysis of power distribution system. In Proceedings of the International Conference on Energy Efficient Technologies for Sustainability, Nagercoil, India, 10–12 April 2013. [Google Scholar] [CrossRef]
- Hussain, B.; Sharkh, S.M.; Hussain, S.; Abusara, M.A. An adaptive relaying scheme for fuse saving in distribution networks with distributed generation. IEEE Trans. Power Deliv. 2013, 28, 669–677. [Google Scholar] [CrossRef]
- Rajaei, N.; Salama, M.M.A. Management of fault current contribution of synchronous DGs using inverter-based DGs. IEEE Trans. Smart Grid 2015, 6, 3073–3081. [Google Scholar] [CrossRef]
- Pan, W.; Liu, M.; Zhao, K.; Zhang, Y.; Liu, T. A Practical Short-Circuit Current Calculation Method for DFIG-Based Wind Farm Considering Voltage Distribution. IEEE Access 2019, 7, 31774–31781. [Google Scholar] [CrossRef]
- Subramanian, S.; Keerthana, J.; Murali, V. Analysis on Fault Current Contribution by Different Types of DGs and Relay Coordination in Non-Autonomous Micro-Grids. In Proceedings of the 2019 National Power Electronics Conference (NPEC), Tiruchirappalli, India, 13–15 December 2019; pp. 1–6. [Google Scholar] [CrossRef]
- Mozina, C.J. Impact of smart grids and green power generation on distribution systems. IEEE Trans. Ind. Appl. 2013, 49, 1079–1090. [Google Scholar] [CrossRef]
- Courtney, J.; McDonnell, A. Impact on Distribution System Protection with the Integration of EG on the Distribution Network. In Proceedings of the 2019 54th International Universities Power Engineering Conference (UPEC), Bucharest, Romania, 3–6 September 2019; pp. 1–5. [Google Scholar] [CrossRef]
- Boonyapakdee, N.; Konghirun, M.; Sangswang, A. Separated Phase–Current Controls Using Inverter-Based DGs to Mitigate Effects of Fault Current Contribution from Synchronous DGs on Recloser–Fuse. Appl. Sci. 2019, 9, 4311. [Google Scholar] [CrossRef] [Green Version]
- Chell, C.J. Fault level assessment: Experience in distribution systems. In Proceedings of the IEE Colloquium on Fault Level Assessment—Guessing with Greater Precision, London, UK, 30 January 1996. [Google Scholar]
- Ibrahim, E.S.; Idres, M. On-line fault level measurement. Electr. Mach. Power Syst. 1998, 26, 207–217. [Google Scholar] [CrossRef]
- Cornfield, G.C. Estimating system fault level from naturally occurring disturbances. In Proceedings of the IEE Colloquium on Fault Level Assessment—Guessing with Greater Precision, London, UK, 30 January 1996. [Google Scholar]
- Ha, H.; Subramanian, S. Predicting the prospective fault level on distribution grids and its impact on protective relaying. In Proceedings of the 2017 70th Annual Conference for Protective Relay Engineers (CPRE), College Station, TX, USA, 3–6 April 2017; pp. 1–4. [Google Scholar] [CrossRef]
- O. R. Ltd. Fault Level Overview. Available online: https://www.outramresearch.co.uk/fault-level-monitoring/ (accessed on 25 May 2020).
- Conner, S.; Cruden, A. An automatic transient detection system which can be incorporated into an algorithm to accurately determine the fault level in networks with DG. In Proceedings of the 47th International Universities Power Engineering Conference, Uxbridge, UK, 4–7 September 2012. [Google Scholar] [CrossRef]
- Berry, J.; Jupe, S.; Meisinger, M.; Outram, J. Implementation of an active fault level monitoring system for distributed generation integration. In Proceedings of the 22nd International Conference and Exhibition on Electricity Distribution, Stockholm, Sweden, 10–13 June 2013. [Google Scholar] [CrossRef] [Green Version]
- Ibrahim, E.S. Experimental measurements of fault level for Sceco West, Kingdom of Saudi Arabia. Eng. Sci. 2004, 15, 83–102. [Google Scholar] [CrossRef]
- Rylander, M.R.; Grady, W.M.; Mansoor, A.; Gorgette, F. Passive Agent System Impedance Monitoring Station and Method. U.S. Patent No. 8,456,176, 4 June 2013. [Google Scholar]
- Sharma, N.K.; Samantaray, S.R. PMU Assisted Integrated Impedance Angle-Based Microgrid Protection Scheme. IEEE Trans. Power Deliv. 2020, 35, 183–193. [Google Scholar] [CrossRef]
- Zhang, F.; Mu, L.; Guo, W. An Integrated Wide-Area Protection Scheme for Active Distribution Networks Based on Fault Components Principle. IEEE Trans. Smart Grid 2019, 10, 392–402. [Google Scholar] [CrossRef]
- Wang, X.; Zhang, H.; Shi, F.; Wu, Q.; Terzija, V.; Xie, W.; Fang, C. Location of Single Phase to Ground Faults in Distribution Networks Based on Synchronous Transients Energy Analysis. IEEE Trans. Smart Grid 2020, 11, 774–785. [Google Scholar] [CrossRef] [Green Version]
- Farajollahi, M.; Shahsavari, A.; Stewart, E.M.; Mohsenian-Rad, H. Locating the Source of Events in Power Distribution Systems Using Micro-PMU Data. IEEE Trans. Power Syst. 2018, 33, 6343–6354. [Google Scholar] [CrossRef] [Green Version]
- Gholami, M.; Abbaspour, A.; Moeini-Aghtaie, M.; Fotuhi-Firuzabad, M.; Lehtonen, M. Detecting the Location of Short-Circuit Faults in Active Distribution Network Using PMU-Based State Estimation. IEEE Trans. Smart Grid 2020, 11, 1396–1406. [Google Scholar] [CrossRef]
- Yang, S.; Tong, X.Q.; Liu, J.; Zhang, X.Q. Short-circuit current calculation of distribution network with distributed generation. Power Syst. Technol. 2015, 39, 1977–1982. [Google Scholar] [CrossRef]
- Akmal, M.; Al-Naemi, F.; Iqbal, N.; Al-Tarabsheh, A.; Meegahapola, L. Impact of Distributed PV Generation on Relay Coordination and Power Quality. In Proceedings of the 2019 IEEE Milan PowerTech, Milan, Italy, 23–27 June 2019; pp. 1–6. [Google Scholar] [CrossRef]
- Von Meier, A.; Stewart, E.; McEachern, A.; Andersen, M.; Mehrmanesh, L. Precision Micro-Synchrophasors for Distribution Systems: A Summary of Applications. IEEE Trans. Smart Grid 2017, 8, 2926–2936. [Google Scholar] [CrossRef]
- Pradhan, A.K.; Routray, A.; Gudipalli, S.M. Fault direction estimation in radial distribution system using phase change in sequence current. IEEE Trans. Power Deliv. 2007, 22, 2065–2071. [Google Scholar] [CrossRef]
- Mohanty, P.K.; Sahu, B.K.; Pati, T.K.; Panda, S.; Kar, S.K. Design and analysis of fuzzy PID controller with derivative filter for AGC in multi-area interconnected power system. IET Gener. Transm. Distrib. 2016, 10, 3764–3776. [Google Scholar] [CrossRef]
- Shokouhandeh, H.; Jazaeri, M. Robust design of fuzzy-based power system stabiliser considering uncertainties of loading conditions and transmission line parameters. IET Gener. Transm. Distrib. 2019, 13, 4287–4300. [Google Scholar] [CrossRef]
- Zhang, H.; Shi, F.; Liu, Y. Enhancing optimal excitation control by adaptive fuzzy logic rules. Int. J. Electr. Power Energy Syst. 2014, 63, 226–235. [Google Scholar] [CrossRef]
- Sun, S.; Fu, J.; Wei, L.; Li, A. Multi-Objective Optimal Dispatching for a Grid-Connected Micro-Grid Considering Wind Power Forecasting Probability. IEEE Access 2020, 8, 46981–46997. [Google Scholar] [CrossRef]
Figure 1.
The structure of a general radial distribution network.

Figure 2.
The equivalent circuit of the distribution network in question.

Figure 3.
The equivalent circuit for direction identification of disturbance.

Figure 4.
Membership function of the input–output variables: (a) membership function of the input; and (b) membership function of the output.
Figure 4.
Membership function of the input–output variables: (a) membership function of the input; and (b) membership function of the output.

Figure 5.
The diagram of implementing the proposed method.

Figure 6.
The configuration of the network model to validate the proposed method.

Figure 7.
The testing process of the proposed method.

Figure 8.
The simulation results: (a) the instantaneous voltage at Bf12, (b) the instantaneous current at Bf12, and (c) the actual fault current and the fault level estimation (FLE) value.
Figure 8.
The simulation results: (a) the instantaneous voltage at Bf12, (b) the instantaneous current at Bf12, and (c) the actual fault current and the fault level estimation (FLE) value.


Table 1.
The fuzzy logic rules for forming the CL.
| O | PS | PM | PL | ||
|---|---|---|---|---|---|
| O | O | PVS | PS | PLM | |
| PS | PVS | PS | PLM | PM | |
| PM | PS | PLM | PM | PML | |
| PL | PLM | PM | PML | PL | |
Table 2.
Test results for different scenarios.
| Load Type | Magnitudes of ∆U and ∆I in Percentage | Errors between Actual and Fault Current Estimation | Confidence |
|---|---|---|---|
| Motor load | 2% | 4.46% | 30.8% |
| 3% | 4.00% | 33.3% | |
| 5% | 3.07% | 38.5% | |
| 10% | 2.82% | 53.9% | |
| Electric arc furnace | 2% | 5.00% | 23.1% |
| 3% | 4.60% | 38.5% | |
| 5% | 3.66% | 46.2% | |
| 10% | 2.58% | 61.5% |
© 2020 by the authors. Licensee MDPI, Basel, Switzerland. This article is an open access article distributed under the terms and conditions of the Creative Commons Attribution (CC BY) license (http://creativecommons.org/licenses/by/4.0/).
Share and Cite
MDPI and ACS Style
Wang, X.; Wang, P.; Wang, Y.; Shi, F. Online Estimation of Short-Circuit Fault Level in Active Distribution Network. Appl. Sci. 2020, 10, 3812. https://doi.org/10.3390/app10113812
AMA Style
Wang X, Wang P, Wang Y, Shi F. Online Estimation of Short-Circuit Fault Level in Active Distribution Network. Applied Sciences. 2020; 10(11):3812. https://doi.org/10.3390/app10113812
Chicago/Turabian StyleWang, Xiaohui, Peng Wang, Yunbo Wang, and Fang Shi. 2020. "Online Estimation of Short-Circuit Fault Level in Active Distribution Network" Applied Sciences 10, no. 11: 3812. https://doi.org/10.3390/app10113812
Note that from the first issue of 2016, this journal uses article numbers instead of page numbers. See further details here.