Article

Non-Destructive and Micro-Invasive Techniques for Characterizing the Ancient Roman Mosaic Fragments

by
Rodica Mariana Ion
1,2,*,
Bulat A. Bakirov
3,4,
Sergey E. Kichanov
3,
Denis P. Kozlenko
3,
Alexander V. Belushkin
3,4,5,
Cristiana Radulescu
6,7,*,
Ioana Daniela Dulama
6,
Ioan Alin Bucurica
6,
Anca Irina Gheboianu
6,
Raluca Maria Stirbescu
6,
Sofia Teodorescu
6,
Lorena Iancu
1,2,
Madalina Elena David
1,2 and
Ramona Marina Grigorescu
2
1
Doctoral School of Engineering Sciences, Valahia University of Targoviste, 130105 Targoviste, Romania
2
National Institute for Research and Development in Chemistry and Petrochemistry—ICECHIM, Evaluation and Conservation of Cultural Heritage Research Group, 060021 Bucharest, Romania
3
Joint Institute for Nuclear Research, 141980 Dubna, Russia
4
Kazan (Volga Region) Federal University, Insitute of Physics, Departament of Nuclear-Physical Materials Science, 420008 Kazan, Russia
5
Dubna State University, Faculty of Natural and Engineering Science, 141980 Dubna, Russia
6
Institute of Multidisciplinary Research for Science and Technology, Valahia University of Targoviste, 130004 Targoviste, Romania
7
Faculty of Sciences and Arts, Valahia University of Targoviste, 130004 Targoviste, Romania
*
Authors to whom correspondence should be addressed.
Appl. Sci. 2020, 10(11), 3781; https://doi.org/10.3390/app10113781
Submission received: 4 May 2020 / Revised: 25 May 2020 / Accepted: 27 May 2020 / Published: 29 May 2020
(This article belongs to the Section Applied Physics General)

Abstract

:

Featured Application

This article may serve as a database for other research into mosaics and, also, as a guide for what methods may be applied.

Abstract

The color characteristics, vibration spectra, phase and mineral composition, internal structural organization of several fragments of the ancient Roman mosaics from the Roman Mosaic Museum, Constanta, Romania were studied by non-destructive (Chromatic analysis, Neutron Diffraction, Neutron Tomography) and micro-invasive techniques (Optical Microscopy, X-ray Diffraction, Field Emission Scanning Electron Microscopy–Energy Dispersive X-ray Spectroscopy, Raman Spectroscopy, Wavelength Dispersion X-ray Fluorescence). These investigations were performed in order to characterize the original Roman mosaic fragments. The major and minor phase components of the studied mosaic fragments were determined, the crystal structure of the main phases was analyzed, and their three-dimension spatial arrangement was reconstructed. The similar composition of the major phases of all mosaic fragments can indicate a generic recipe for making mosaic elements, but minor phases were presumably added for coloring of mosaic pieces. Some degradation areas inside the volume of the mosaic fragments were found by means of neutron diffraction and neutron tomography methods. These degradation areas are probably related to the formation of iron hydroxides during chemical interactions of mosaic fragments with the sea and urban polluted atmosphere.

Graphical Abstract

1. Introduction

One of the most important tasks of archeology and other history-related sciences is the comprehensive study of cultural heritage items. A mosaic, as part of the universal cultural heritage, is an ancient art, where small pieces of various materials like glass and stones were used to create patterns and images. The first mosaic tiles were found in Mesopotamia in the time of the earliest dynasties of ancient Egypt [1,2,3,4]. The mosaic decorated the temples that were dedicated to the Greek deities; more than that, the origin of the word “mosaic” comes from the “mouseion” or a better-known transcription “the muse” [5]. In the fourth century BC, the Greek mosaics represented the artistic assembly of small pieces of marble, ceramic, glass, enamel or other materials, of different colors, glued together with mortar or mastic, forming geometrical figures, flowers, images with zoomorphic or anthropomorphic representations [6,7].
The ancient Roman mosaics were made of river stones, marble or rare jasmine and onyx semiprecious gems and were used in plating Roman baths, columns and villa ceiling decorations with a domination of the black and white combination [4,7,8]. It should be noted that the evolution of Roman mosaic technology is still not clear and more studies are needed to fully comprehend the technological practices and to determine the best restoration and conservation techniques to be applied. As a bright representative of the cultural heritage of the Roman and Byzantine era, a well-preserved mosaic fragment in the historical center of Constanta, Romania can be taken into consideration. Those large area fragments, which were discovered in 1959, are believed to date somewhere back in the reign of the Emperor Constantine the Great (306-337 AD), in which the Tomis Fortress was built [9]. The Roman Mosaic Museum in Constanta is covering an area of approximately 2000 m2, and it fell into ruin at the end of the 6th century following an earthquake [9,10,11]. Nowadays, more and more scientific research methods [12,13,14,15] are being used to study the physical and chemical properties of mosaic elements in order to expand the knowledge about mosaic production technologies, the origin of compound materials, and the degree of preservation of decorative elements.
The building had been affected not only by the destruction of time and the time it was under land but also by the works made, in the modern period, for the arrangement of the port by the Romanian architect Anghel Saligny. The campaigns dedicated to the complex from the Roman era lasted for five years, until 1965.
The imposing construction took place in antiquity on three terraces, cut in the slope of the cliff and leveled for ensuring the stability of the construction. It was located right on the quays of the old Tomitan port, from which it is located where he opened his first suite of rooms. It comprised eleven vaulted rooms used as warehouses for the goods brought by the commercial ships that docked in the port. Access to the next two terraces was made with the help of massive limestone steps.
The second level was similar to the first. It also had eleven vaulted rooms used for the same purpose as the first. The configuration of the third level, however, is totally different from the other two. Here, we are dealing with a huge, uncompartmented and sumptuous room. Its decor is luxurious, and the improvised grandstand on its northeast side shows that he had a different and special destination.
Inside the hall, the northeast wall has a rhythmic succession of pillars embedded in it. It looks like there were fifteen such pillars delimiting fourteen fields. The walls were covered with marble, and the pillars had marble slabs at the top that mimicked the shape and decoration of some capitals. Their decorative motifs were predominantly vegetal. The northeast wall was pierced by another entrance from the current Ovidius Square, later closed and used as a niche, in which was probably exposed the bust of an emperor.
Another peculiarity of the hall is formed by the few steps that made up a small platform attached to the same wall and also covered with marble. It was probably used as a tribune for the speakers who held speeches here.
The mosaic carpet stretched over the entire surface of the room. The portion that was placed on the terrace cut into the seafront was best kept, and the part above the eleven rooms on the lower level collapsed along with their vaults, catching underneath the goods that were stored there. Some of the pieces that collapsed could be recovered.
The materials used are marble and natural stone, of different colors: white, red, green-blue, black and cream. They are arranged in straight rows, especially in the border and in serpentine lines in the case of more complex motifs. They are placed on a bed of lime mortar mixed with a lot of crushed brick.
A mosaic is a pictorial work elaborated with a set of tesserae joined between them by lime [13] or other binders to form geometric or figurative decorative compositions. Tessera is an individual piece of cubic form, made of calcareous rocks, glass or ceramic material [14]. In Ancient Rome, the used tesserae were made of calcareous rocks obtained from local sources of natural stone, with additions of crushed brick, tile and pottery in order to create some colored shades: black, red, white, blue and yellow [16].
In recent years, more attention by archaeologists and cultural scientists is given to physical methods based on neutron diffraction and neutron tomography methods, which provide a non-destructive probe of structural organization of objects with high sensitivity to light elements, a notable difference in contrast between different elements, and high penetration ability [17,18]. Presently, the neutron methods are highly demanded tools with a growing range of applications in industry, archeology and geophysics [17,19,20,21,22].
In this study, the results of pilot studies of the chemical and structural composition of some decorative elements of ancient Roman mosaics from the Roman Mosaic Museum, Constanta, Romania was reported. This research aimed for a comprehensive study of decorative elements using both classical research methods and modern experimental approaches like neutron structural non-destructive diagnostics.

2. Materials and Methods
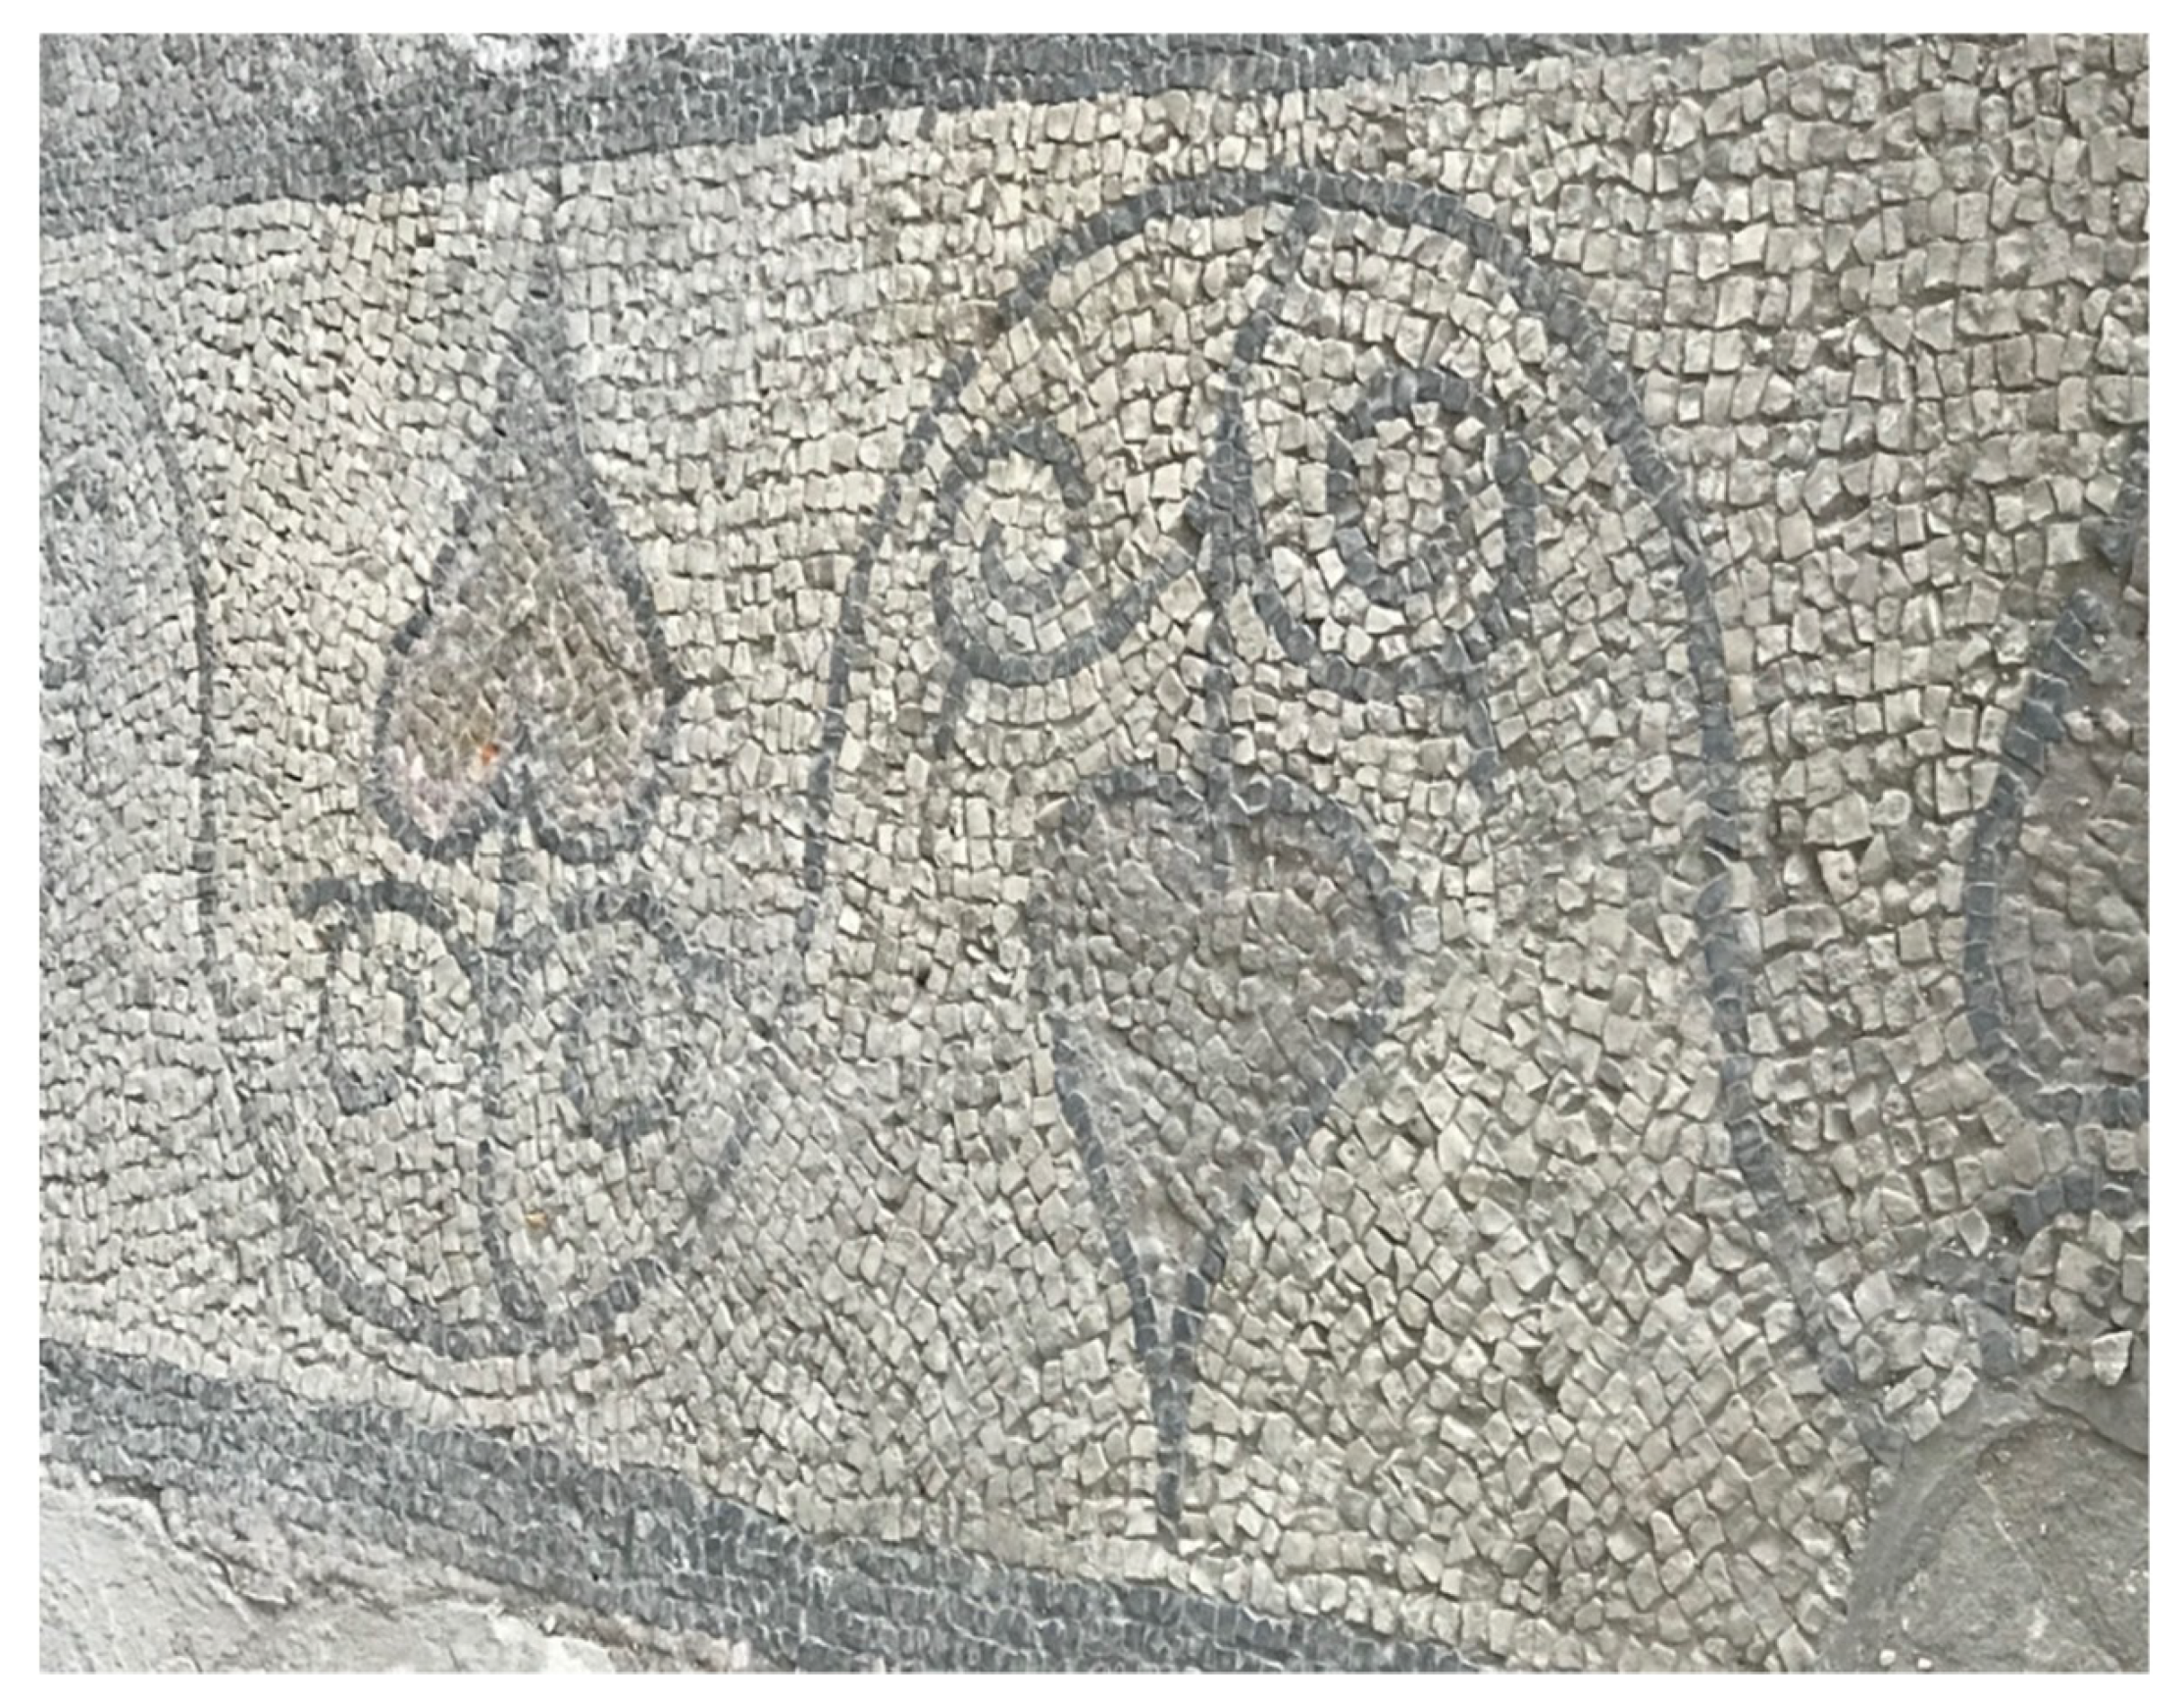
2.1. Samples

For our joint research, a set of the elements of mosaic from the Mosaic Museum of Constanta, Romania, was selected, Figure 1. Most of the collected samples had different voids or gaps, cracks and scratches on the surfaces, and internal degradation tracks that need to be investigated. The distribution of the phase composition in the volume of these samples was also interesting to us. The photos, optical microscopy images and a short description of the studied samples are presented in Table 1.

2.2. Experimental Methods

Optical microscopy was performed with a Primo Star microscope (Primo Star, Carl Zeiss AG, Oberkochen, Germany) in transmitted light. The device is equipped with 4 Plan-ACHROMAT dry objectives (4×, 10×, 40× and 100×) and with a digital video camera (Axiocam 105) for a real-time data acquisition. The optical microscopy images, achieved with the 40× objective, are presented in Table 1.
X-ray diffraction (XRD) data were recorded with an Ultima IV diffractometer (Rigaku, Woodlands, TX, United States of America) using a Cu Kα radiation (λ = 1.54 Å). In this experiment, the accelerating voltage of the generator radiation was set at 40 kV and the emission current at 300 mA. The XRD patterns were recorded in Bragg–Brentano beam geometry over 2θ = 10° to 100° continuously at a scan rate of 1 degree/min. The XRD patterns were processed using PDXL2.2 software and the ICDD database PDF4 + 2019.
Wavelength Dispersion X-ray Fluorescence (WDXRF) was performed using a Supermini200 spectrometer (Rigaku, Woodlands, TX, United States of America). It is equipped with a Pd X-ray tube (200 W), two detectors (e.g., PC and SC) and 3 analyzer crystals (e.g., LiF, PET and RX25—with automatic exchange). Supermini 200 allows WDXRF analyses with 0.1-1 ppmlimit of detection and 0.5% precision.
Field Emission Scanning Electron Microscopy with Energy Dispersive Spectroscopy (FE-SEM-EDS) results were obtained using a SU-70 microscope (Hitachi, Ibaraki, Japan) coupled with an UltraDry detector (Thermo Fisher Scientific, Waltham, Massachusetts, United States of America). The SEM images (magnification x3k) were obtained under 5 kV accelerating voltage and 15–19 mm working distance range, meanwhile the EDS data (EDS spectra and elemental composition) were obtained under 10 kV accelerating voltage [23,24,25] using the Phi-Rho-Z correction method available in NSS software (Version 3.0).
Raman spectroscopy was performed using a portable analyzer (Xantus-2, Rigaku, Woodlands, TX, United States of America) equipped with 785 and 1064 nm stabilized laser, providing high sensitivity. For measurements, a resolution of 4 cm−1 with a laser power of 252 mW was used. The data were collected and processed with the Opus (Version 7.0) software (Opus, Bruker Optik GmbH, Ettlingen, Germany). In additional, the Raman spectra at ambient temperature were collected using a LabRAM HR spectrometer (Horiba Gr, Montpellier, France) with a wavelength excitation of 633 nm emitted from a He-Ne laser, 1800 grating, confocal hole of 100 μm, and × 50 objective. Several Raman spectra were obtained from different local points of the surface of the mosaic samples. Typical spectral acquisition times were 12 min; the measurement range was from 100 to 1800 cm−1.
Chromatic parameters of the ancient Roman mosaics were recorded with a Konica Minolta CR-410 colorimeter (Japan). CIELab colorimetric measurements were performed to verify the color features of the samples. The chromatic coordinates were calculated according to the Commission Internationale d’Eclairage (CIELab method) [26], starting from diffusive reflectance spectra acquired with a Konica Minolta camera instrument. The total color differences, ΔEx final, were calculated using the following Equation (1):
Δ E x   f i n a l = ( Δ L x 2 + Δ a x 2 + Δ b x 2 ) 1 / 2
where ΔL is the difference in lightness, Δa is the chromatic deviation of the a coordinates (red and green color), and Δb is the chromatic deviation of the b coordinates (yellow and blue color).
The crystal structure and phase composition of the mosaic samples were performed by neutron diffraction experiments using the DN-6 neutron diffractometer [27], operated at the IBR-2 high-flux pulsed reactor (Frank Laboratory for Neutron Physics, Joint Institute for Nuclear Research, Dubna, Russia). The neutron powder diffraction patterns were collected at the scattering angle of 2θ = 90°. The measurement time of one neutron diffraction pattern was 30 min. The neutron diffraction patterns were analyzed by the profile matching mode using the FULLPROF software [28].
The neutron tomography experiments were performed at the neutron radiography and tomography facility [29] of the IBR-2 high-flux pulsed reactor. A set of neutron radiography images was collected by a detector system based on high sensitivity camera with a Hamamatsu CCD chip. The tomography experiments were performed with a rotation step of 0.5°; the total number of measured radiography projections was 360. The exposure time for one projection was 20 s and measurements were carried out during 6 h in total. The imaging data were corrected by the camera dark current image and normalized to the image of the incident neutron beam using the ImageJ software [30] the tomographic reconstruction was performed by the SYRMEP Tomo Project (STP) software [31]. Finally, a large data set containing a volume distribution of 3D pixels (voxels) were collected. The size of one voxel in our study is 52 × 52 × 52 µm. The spatial resolution capabilities of the neutron tomography facility have some restrictions on the minimum size of a resolved item up to 135 µm. The 3D volume data of voxels are the essence of the spatial distribution of values of the neutron attenuation coefficients inside the sample volume. Attenuation of the neutron beam corresponds to scattering and absorption losses inside the material. The tomography reconstruction yields the set of 538 virtual slices. VGStudio MAX 2.2 software of Volume Graphics (Heidelberg, Germany) was used for visualization and analysis of reconstructed 3D data.

3. Results and Discussion

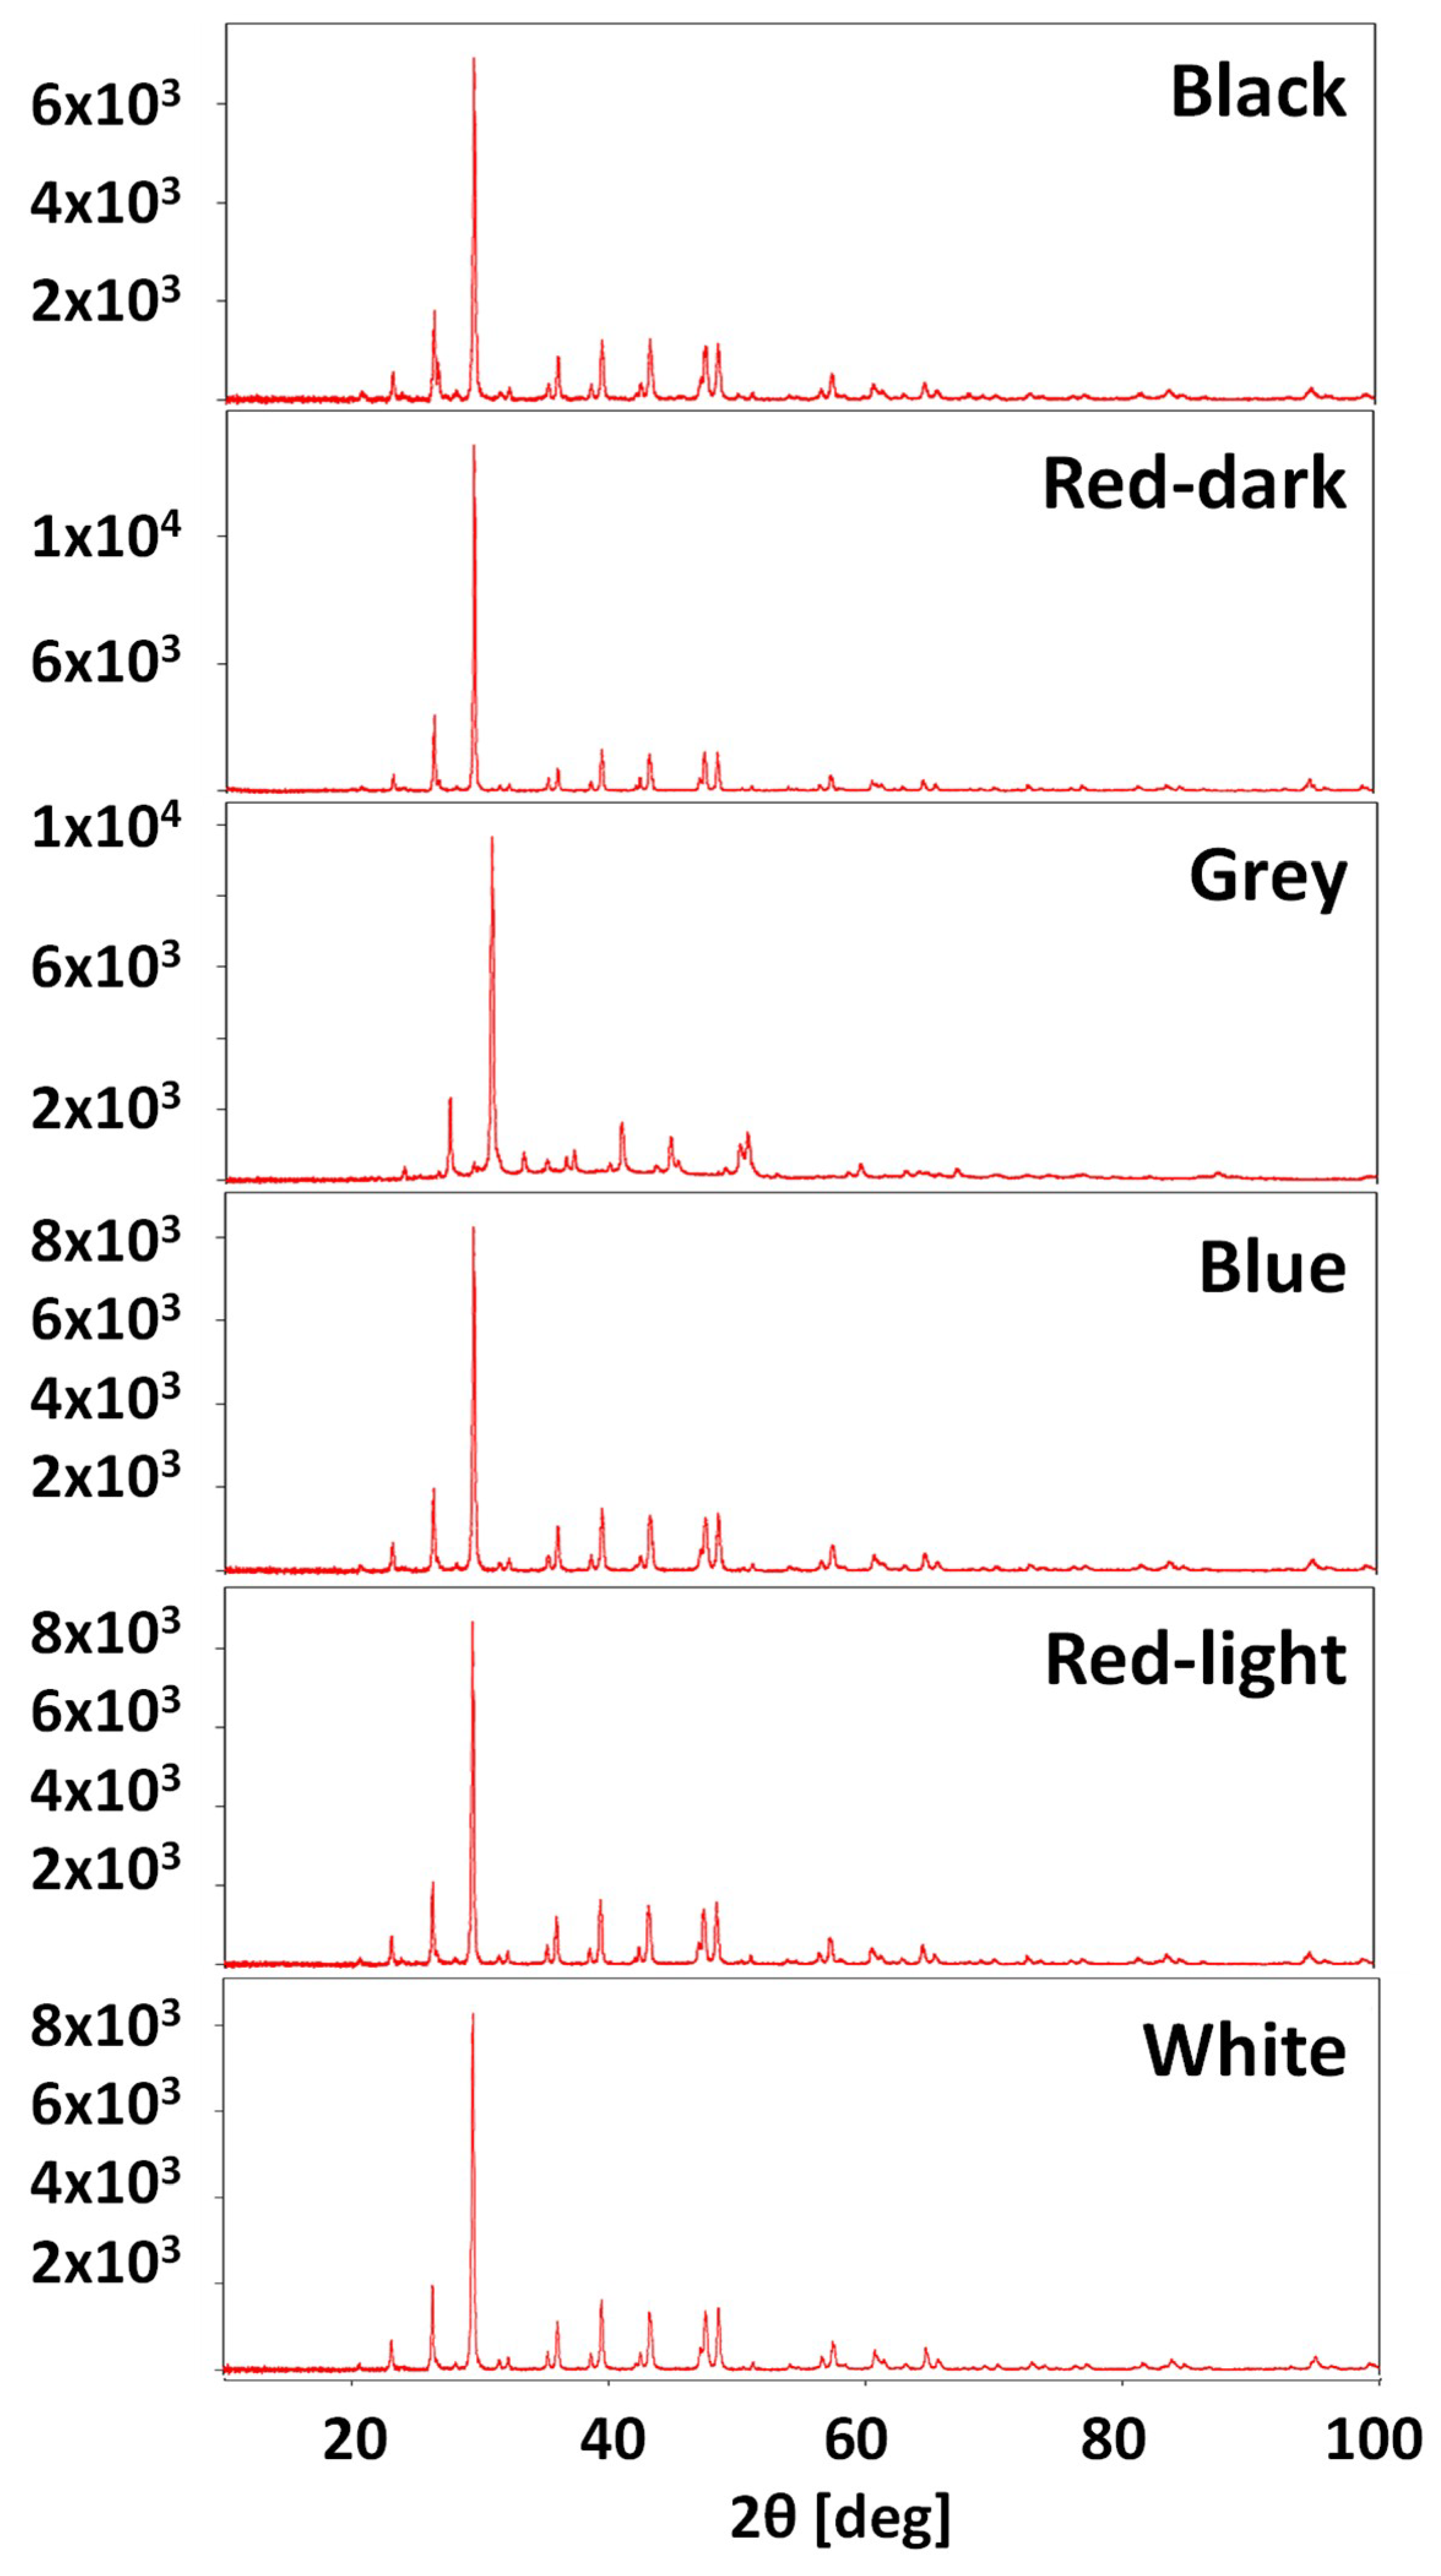
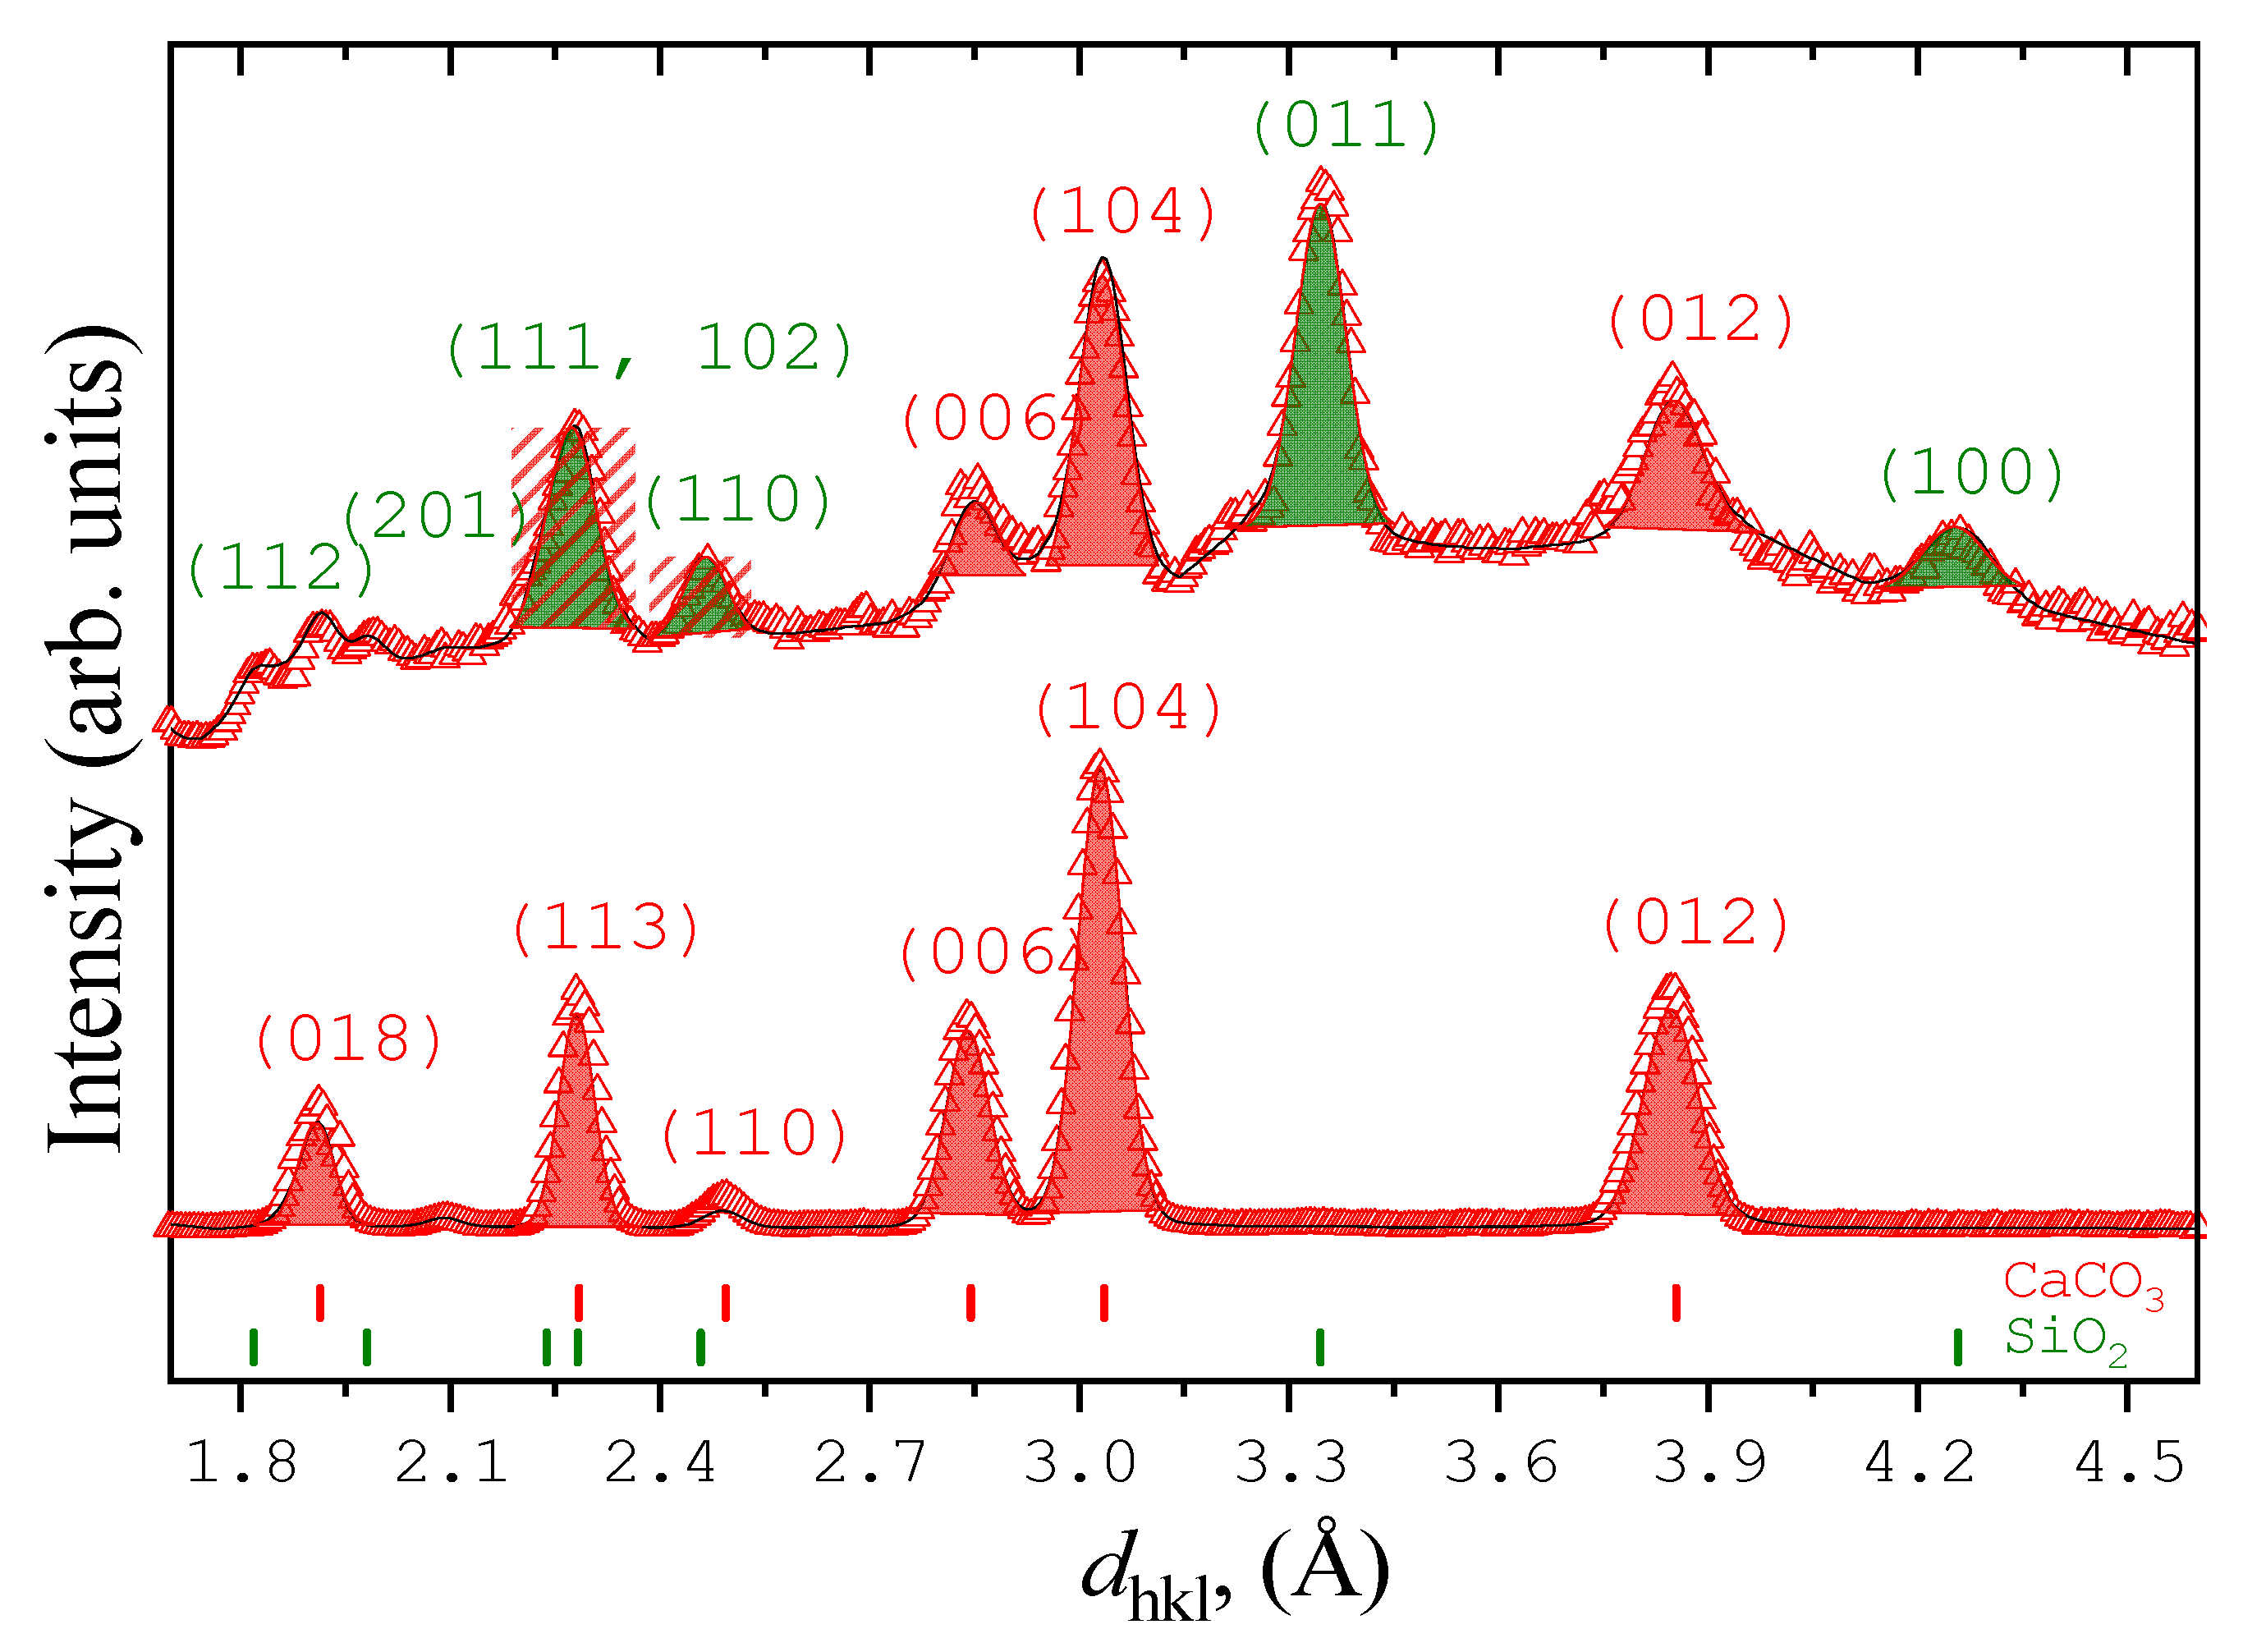
3.1. X-ray Diffraction (XRD)

The X-ray diffraction of the mosaic fragments gives similar diffraction patterns (Figure 2). The occurrence of some amorphous phases as well as crystalline minerals was observed. The dominant phases are quartz and calcite. The iron oxides like hematite, sulfates or gypsum, and clays like iron-contained aluminosilicates were also detected.

3.2. Wavelength Dispersion X-ray Fluorescence (WDXRF)

The average mineral compositions of mosaic fragments obtained from XRF analysis are presented in Table 2. The mineralogical compositions of the studied mosaic fragments are mainly representative of carbonaceous stones with a high content of calcium and consist of small particles with different compositions of Al, Na, K, Si, Ti, Fe and Ca elements.
The proportions of these elements, together with the aggregates of clays, quartz, Ca-carbonates, and sulfates were present in the studied fragments. As can be seen from Table 2, the mosaic samples mainly consist of silicates with a dominant amount of Na2O phase. The minor phases are K2O, MgO and P2O5. Besides the oxides of Si, Al, Ca, K and Na, we believe that the minor phases were added as a coloration matter [13] or as a flux of admixed material. If we digress from the content of minor phases, we can assume that Roman mosaic used one widely distributed common recipe from major oxides to produce a basial melt before minor phase adding. In other words, if the mosaic fragments belong to the Roman cultural heritage, the content of the major oxides should reflect the general Roman basial glass recipe [32,33,34,35].

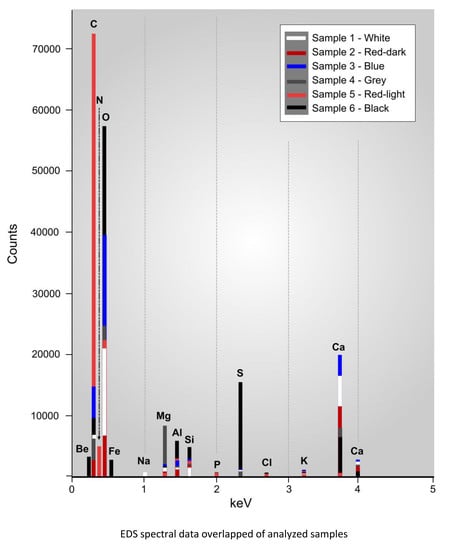
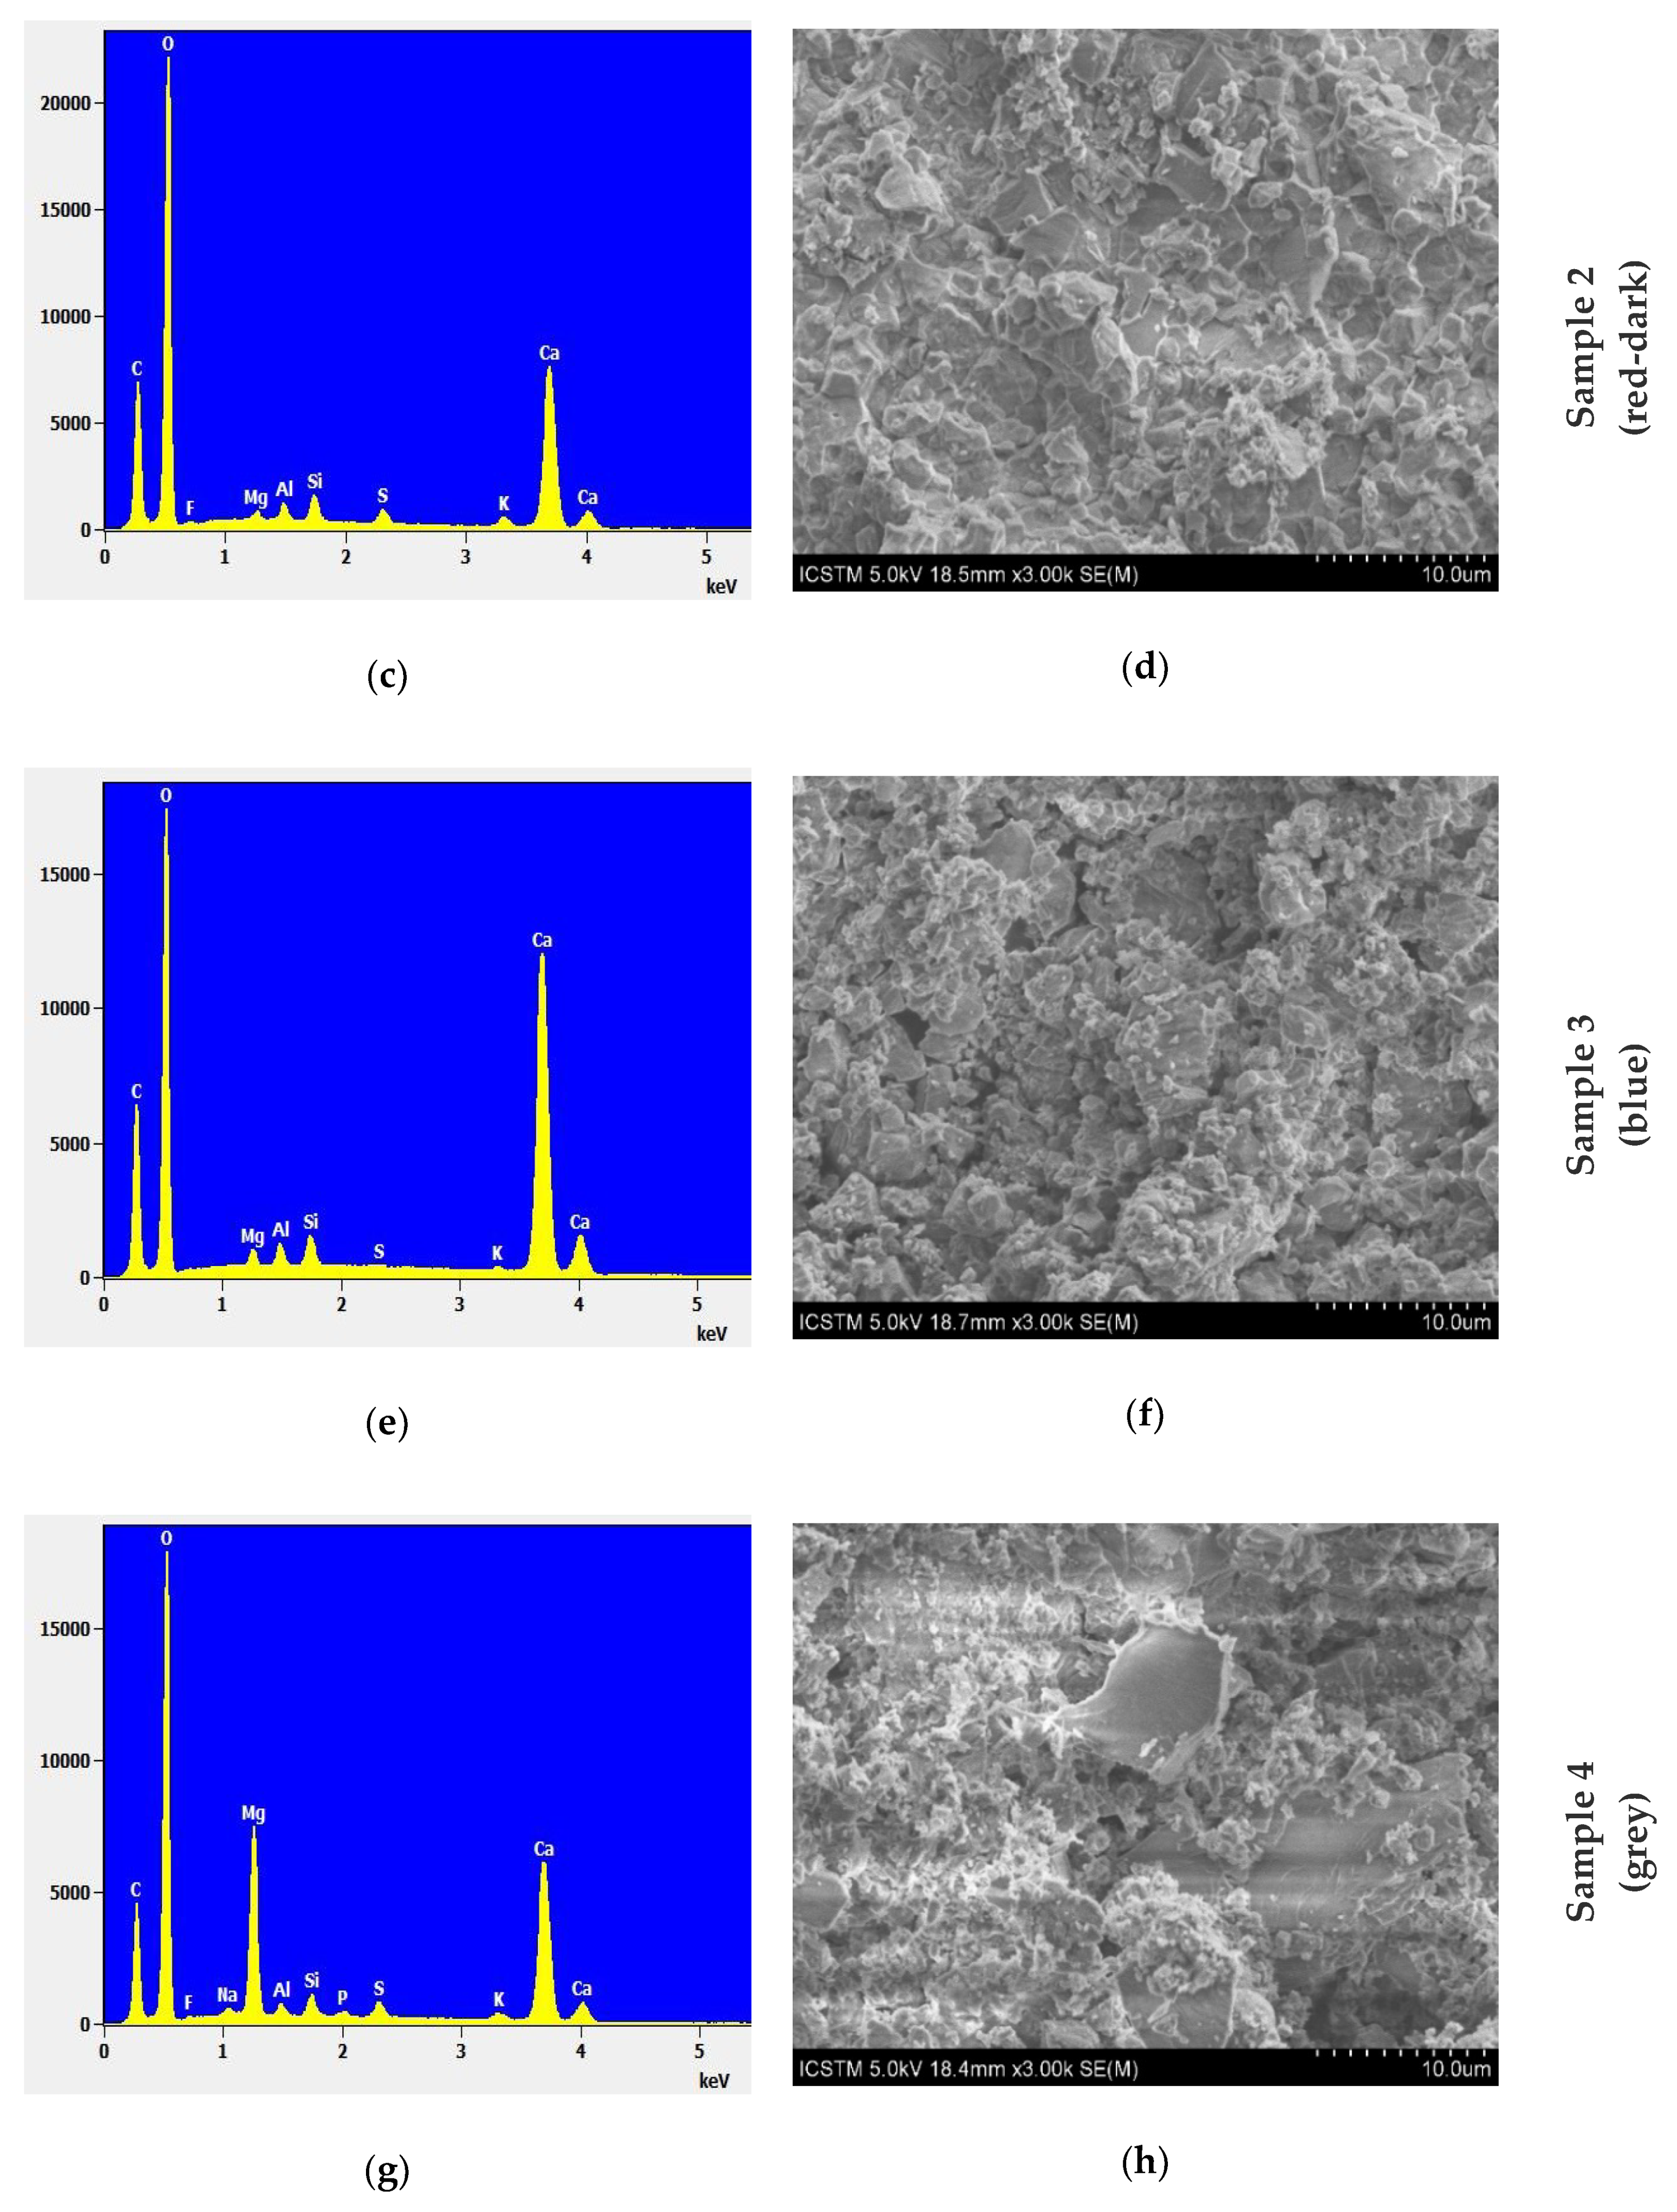
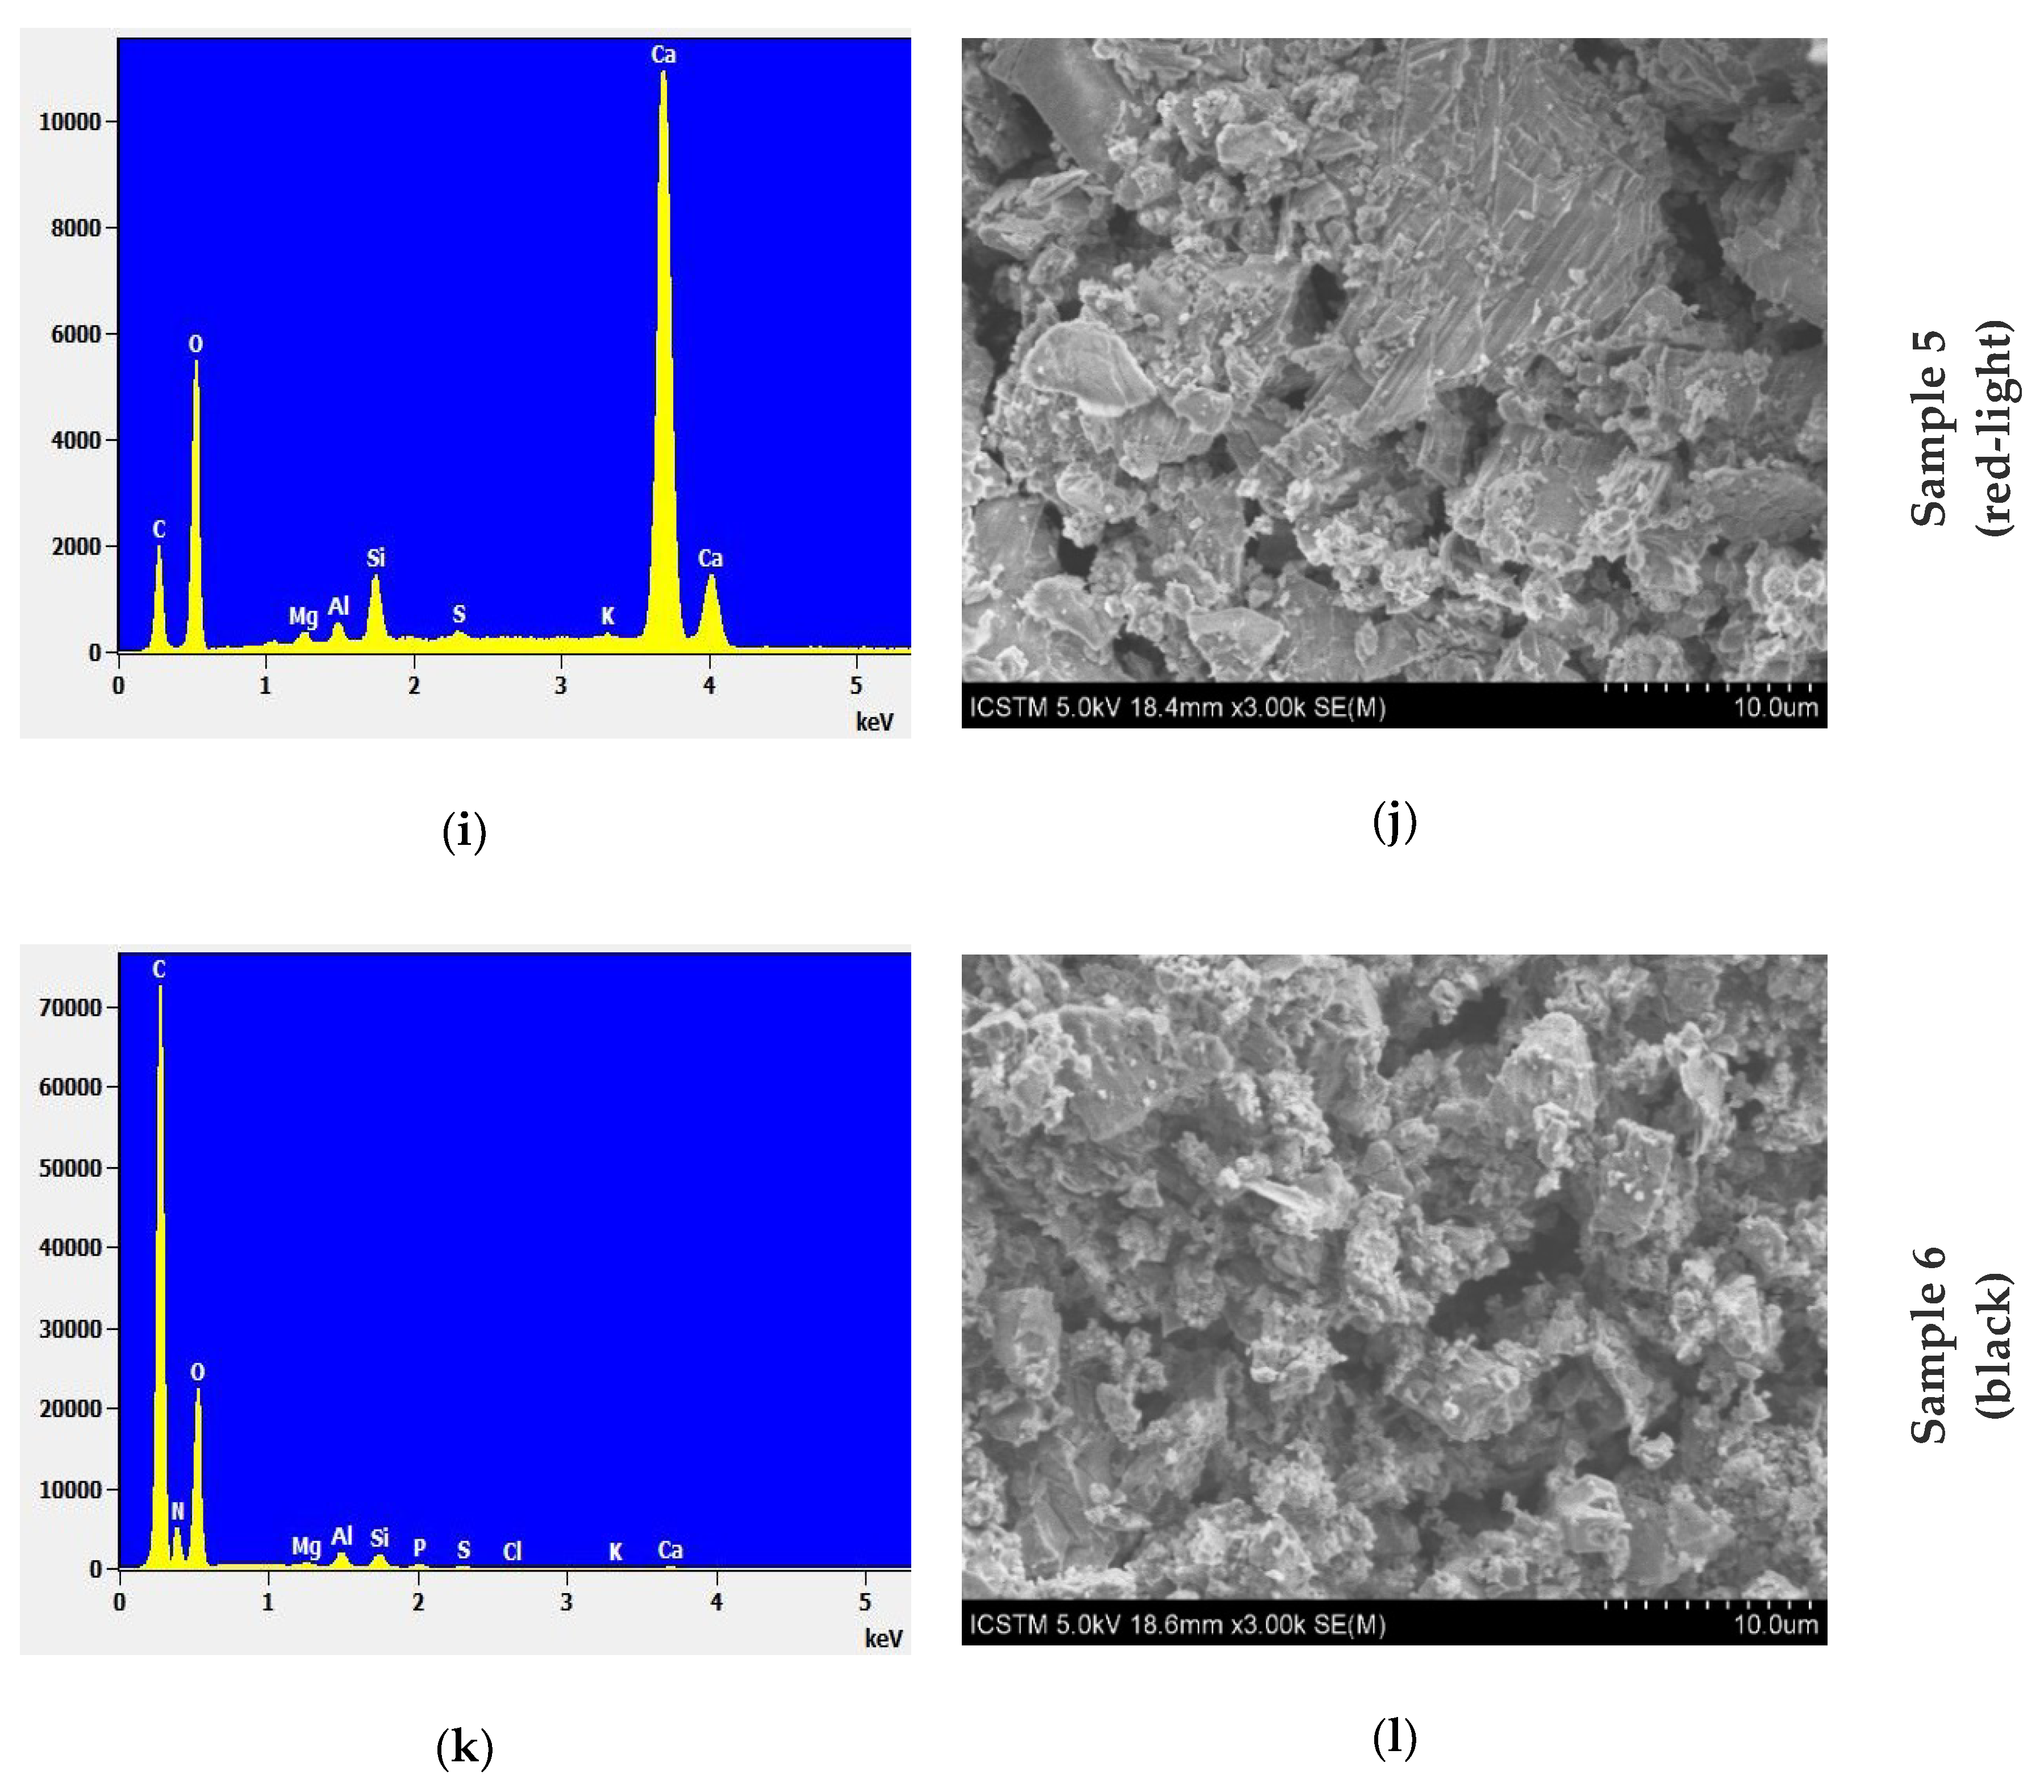
3.3. Field Emission Scanning Electron Microscopy with Energy Dispersive Spectroscopy (FE-SEM-EDS)

The morphology and grain aspect of samples (Figure 3b,d,f,h,j,l) was obtained using the secondary electron detection mode and highlights the mixture of a fine-grained base [36,37] with crystallized grains [38,39], specific to calcite structure (all samples), as well as the formation of plated (laminated) calcite crystals (sample 5) [40,41].
The energy dispersive spectroscopy (EDS) analyses of the elemental composition of the studied mosaics (Figure 3 and Table 3) revealed some proportions of Ca, O, and C and minor proportions of Si, K, Mg, and Al (in all studied samples), as well as Na (samples 1, 4 and 6), P (sample 4), S (samples 2–5), Cl (samples 1 and 6). The minor compositions of elements in mosaic fragments are similar for all studied mosaic fragments. Minor differences were observed due to the diversity of the different phase agglomerations, as previously reported [13,42]. It should be noted the extraordinarily constant chemical compositions for blue and red mosaic samples (i.e., 2, 3 and 5). The high content of Ca was detected in the white and blue mosaic samples (i.e., 1 and 3). It can be explained by a higher quantity of calcite phases in those samples. Several amounts of sulfates (samples 2–5) were detected. It is interesting that a small amount of chlorine was found in several mosaic fragments (i.e., samples 1 and 6); a possible explanation is the long contact of mosaic samples with the atmosphere, in the proximity to the Black Sea, which is chlorine rich [43].

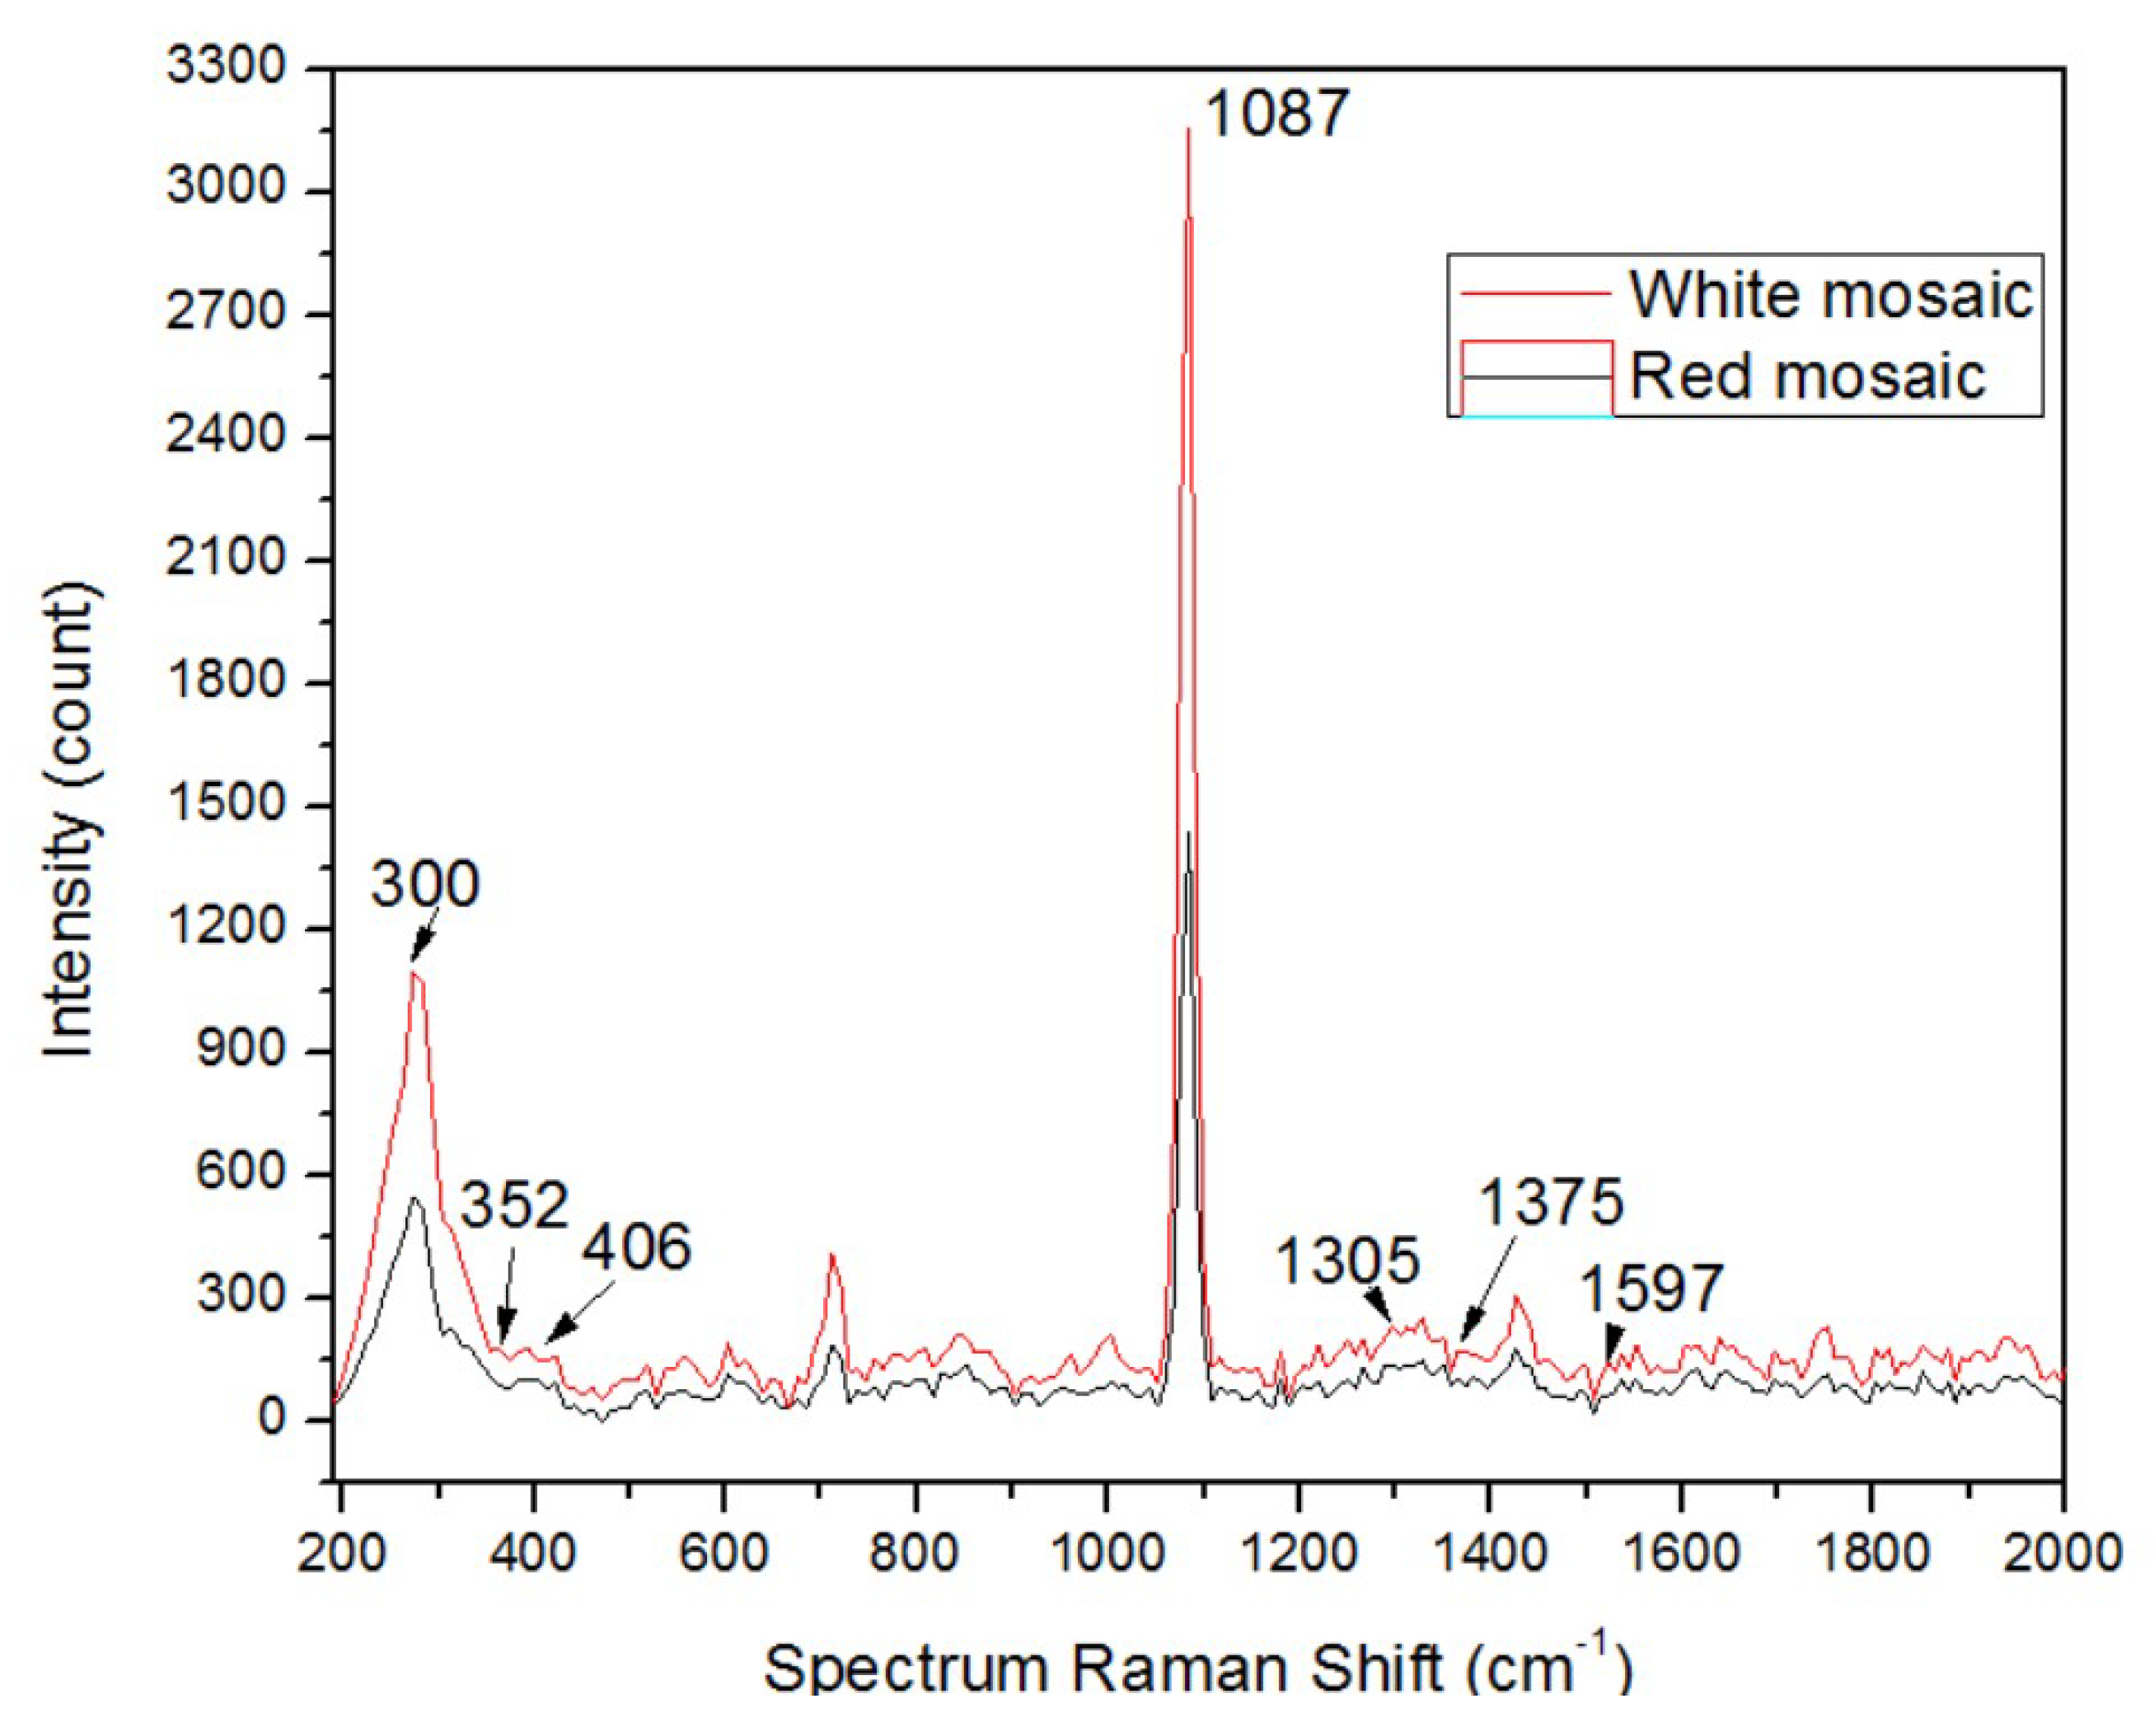
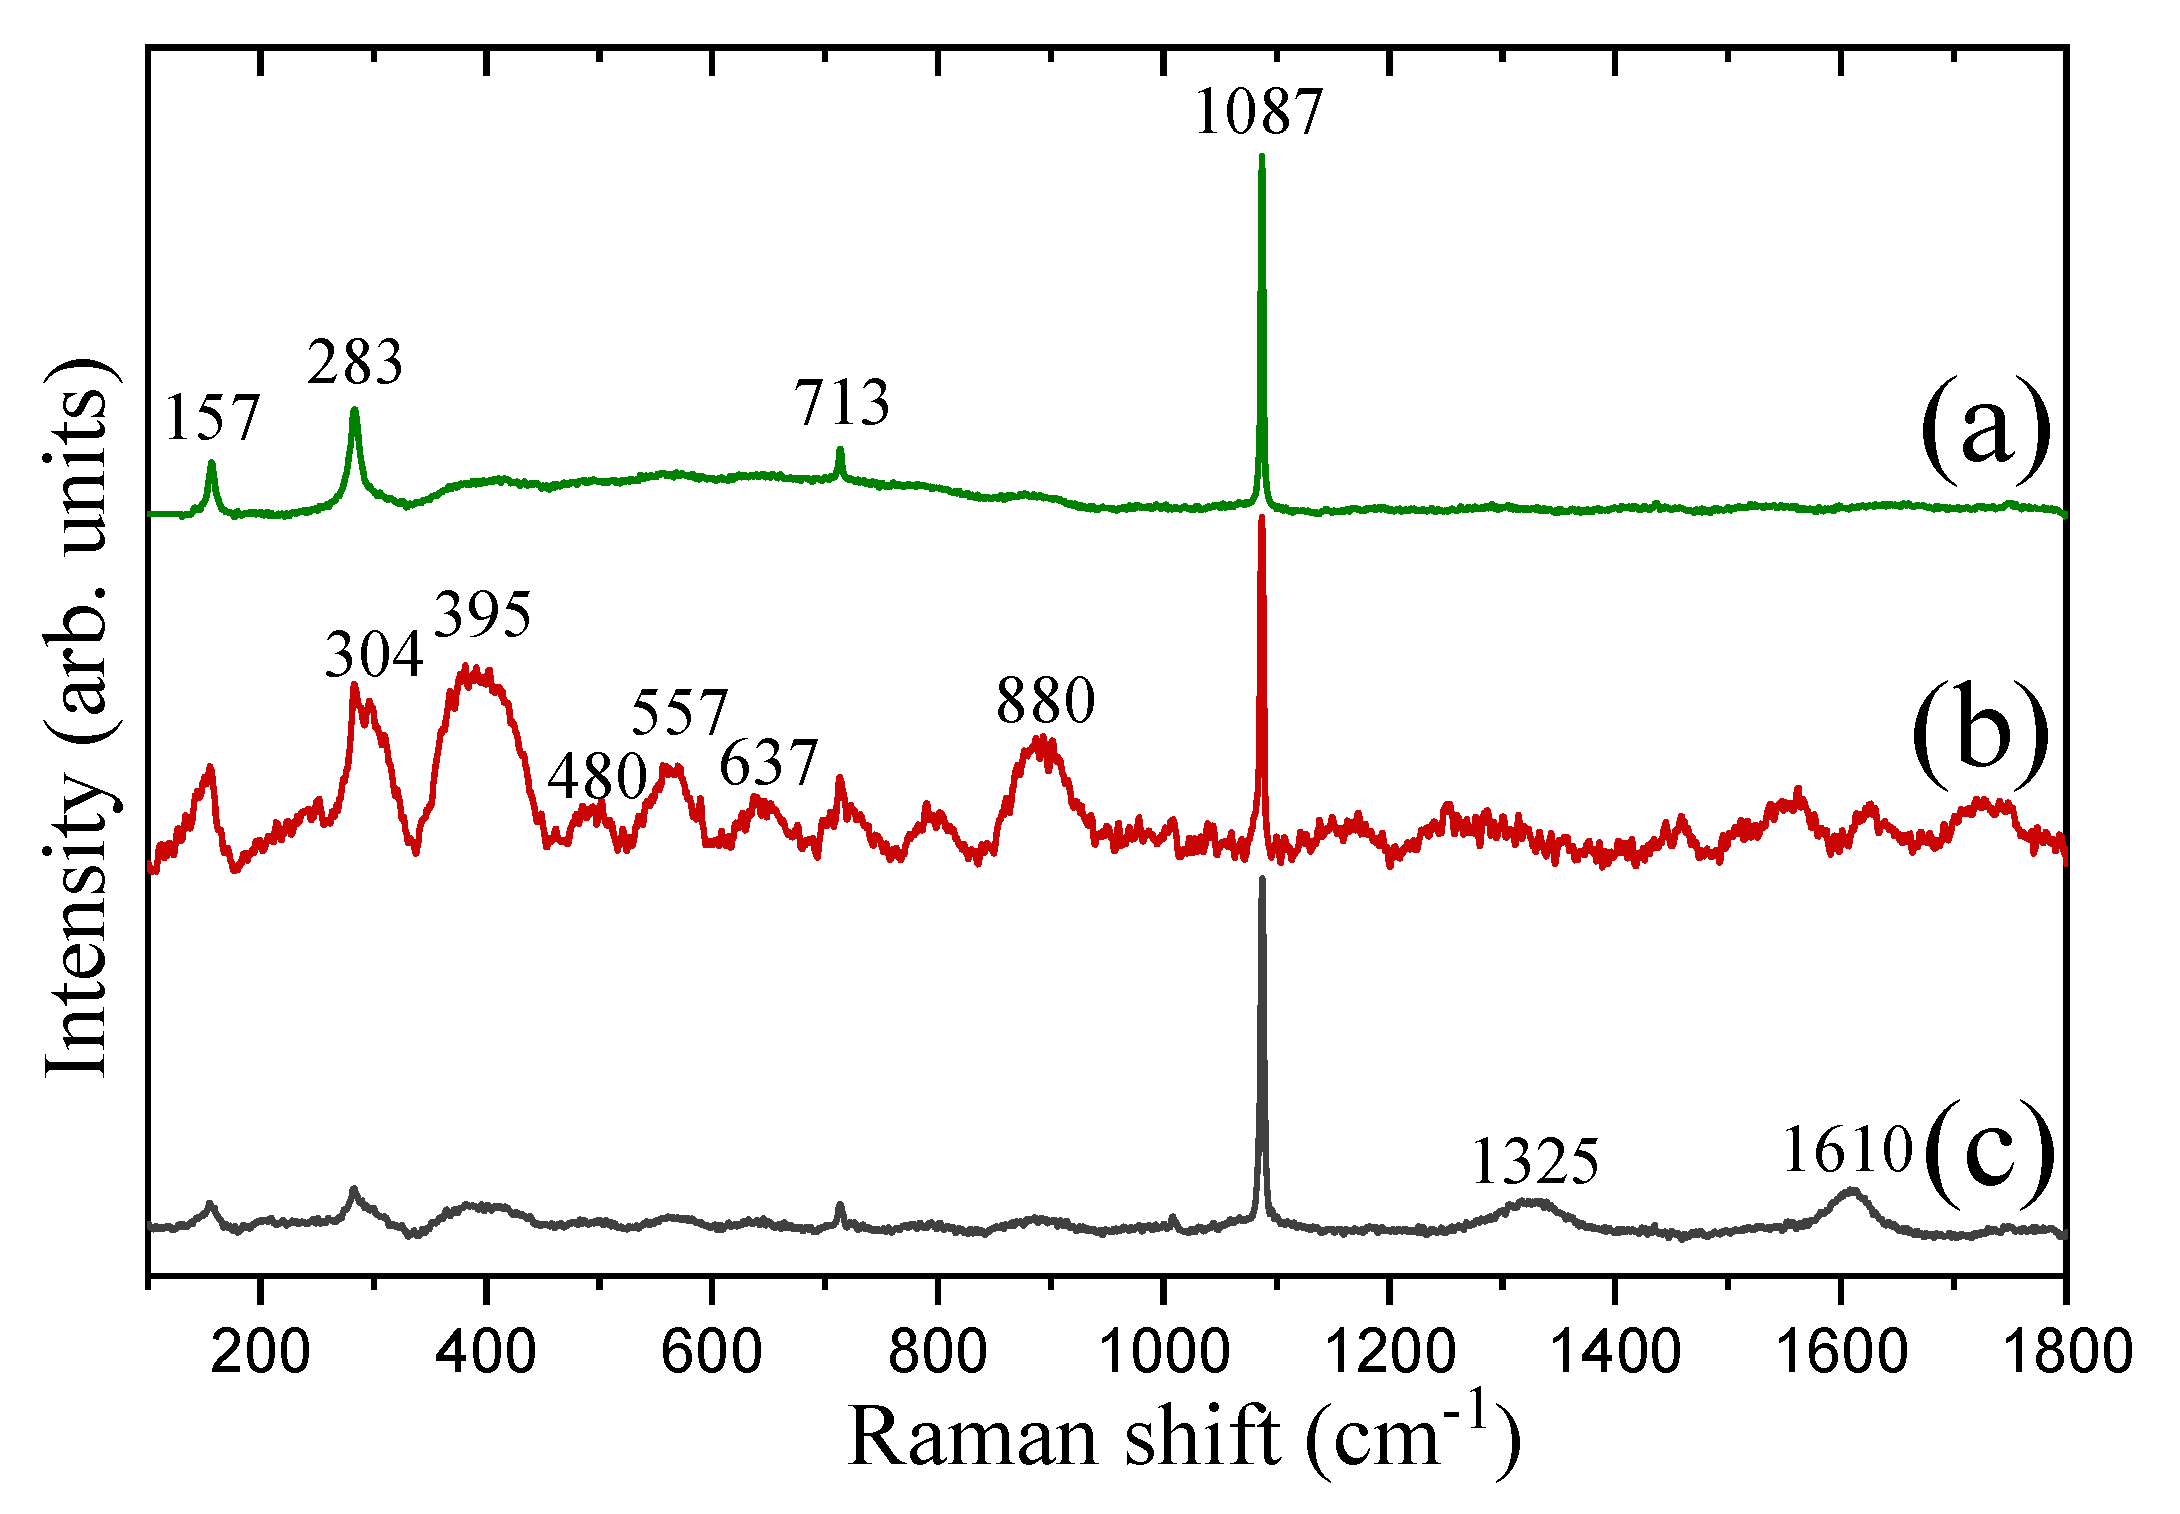
3.4. Raman Spectroscopy

For an in-depth study of mosaic samples regarding vibration spectra, Raman spectroscopy was performed. Several characteristic Raman spectra are shown in Figure 4 and Figure 5. The intensity Raman lines at 352, 462 and 1375 cm−1 can be attributed to the phase of α-quartz [44], while the most intense mode at 1087 cm−1 corresponds to calcite [45]. Several weak peaks at 300 and 406 cm−1 were assigned to hematite (Figure 5). The weak Raman peaks at 1305 and 1597 cm−1 could be attributed either to amorphous carbon, hematite or α-quartz phases [44,45,46].
The results of a more detailed scan of the surfaces of mosaic samples 5 and 6 are shown in Figure 5. Raman spectra were obtained from various local areas of mosaics fragments characterized by a red or black color.
The tentative assignments of the visible Raman lines are presented in Table 4. In addition to the phases already described above, the Raman lines associated with hydroxides and oxides of iron and manganese were observed on Raman spectra of red crystallites on the surface of mosaic sample 5. The Raman peaks in the wavenumber region of 860–940 cm−1 are related to the presence of some orthosilicates in the studied samples.
The combination of these additional phases probably indicates the presence of a mixture of natural pigments; “yellow ochre” and “red ochre” were used as paint for mosaic glasses [14,15,46]. The black layer of sample 6 is characterized by two additional peaks at 1325 and 1610 cm−1 (Figure 4 and Figure 5 and Table 4). They are associated with a pure carbon phase [14]. It can indicate the presence of “soots” that were used as colorant for black mosaic sample [47].

3.5. The Chromatic Parameter Measurements

The chromatic parameters were recorded using a special colorimeter. From the experimental data, the color features of the mosaic samples were calculated [26]. The obtained chromatic parameters are listed in Table 5.
The color parameters (i.e., H, C, and ΔE) determine the tendency to yellow hues (b) and green hues (a). However, the chromatic parameters a (red/green) and ΔE (total color change) appear as decisive factors affecting the color variations over time, as the greatest changes took place in these parameters. This indicates that the color parameters such as a (red/green), b (yellow/blue), H and L have greater weight than ΔE and C to distinguish these samples based on the pigments. Hue angle (h) derived from a and b color space, and therefore, is a more practical parameter in reflecting the pigments [48]. However, it should be noted that chromatics relate only to the surface of studied mosaic fragments. The color of the surface may be imperfect due to the interaction of the fragments of mosaic with the air or water vapor from atmosphere, which is a reason for the surface degradation and color changing of the mosaic stone from Roman Mosaic building. Most mosaic fragments with dark colored crusts were identified [49,50]; these crusts can be biochemical and physical responses to diverse anthropogenic activities. It should be noted that the present chromatic data can be used together with experimental structural data obtained from the entire volume of the samples using high penetration methods as neutron diffraction or X-ray diffraction.

3.6. Neutron Diffraction

The typical neutron diffraction patterns of the mosaic samples 5 and 6 are shown in Figure 6. The neutron diffraction peaks corresponded to two dominant phases of mosaics fragments: calcite CaCO3 and α-quartz SiO2. The complex shape of the background of the diffraction pattern of sample 5 indicates the presence of a large number of amorphous phases probably clays aluminosilicates phases. The calculated unit cell parameters of calcite are a = 4.978 (2) Å, c = 17.064 (4) Å and a = 4.974 (7) Å, c = 17.026 (1) Å for samples 5 and 6, respectively. A small difference in the c parameters of the unit cell of the calcite phases can be explained by the presence of a small amount of impurities in the rock samples of the studied mosaic fragments. If only a single calcite phase is observed for sample 6, then diffraction peaks corresponding to the quartz phase are also observed for sample 5. The lattice parameters of trigonal phase of quartz are a = 4.913 (1) Å, b = 4.913 (1) Å, c = 5.409 (2) Å. The calculated ratio between calcite and quartz phases for sample 5 is 45:55.

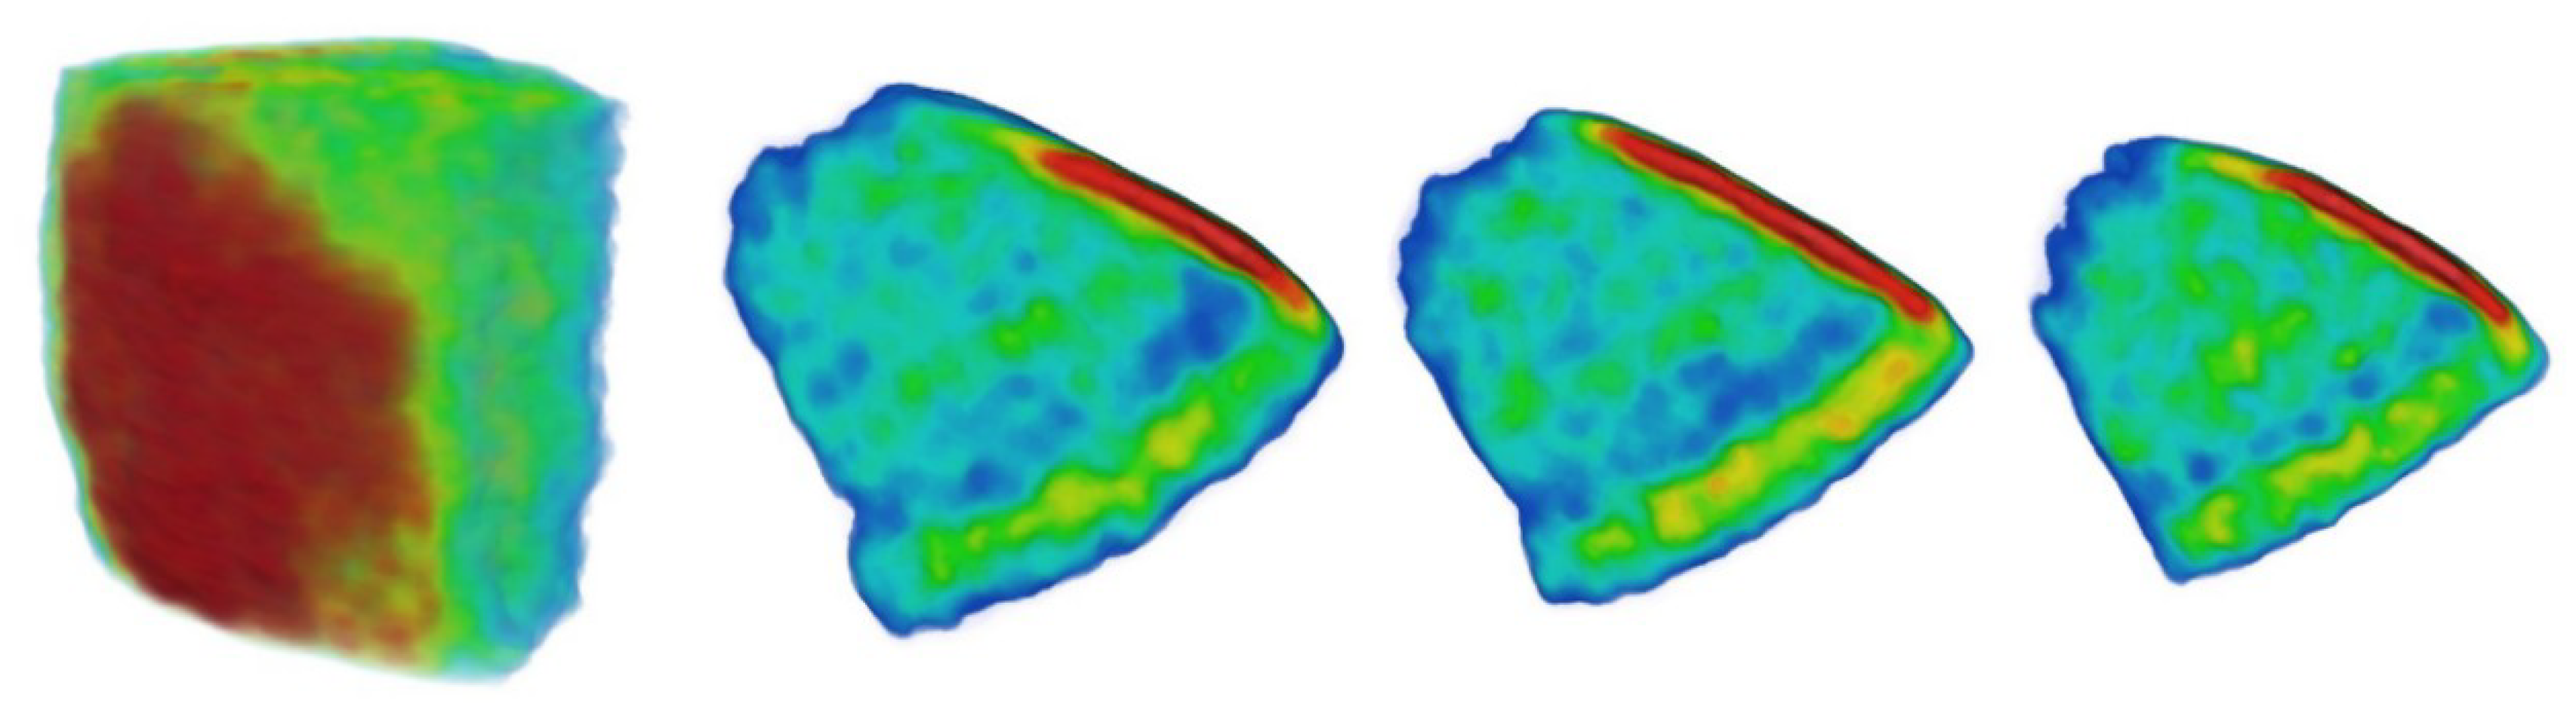
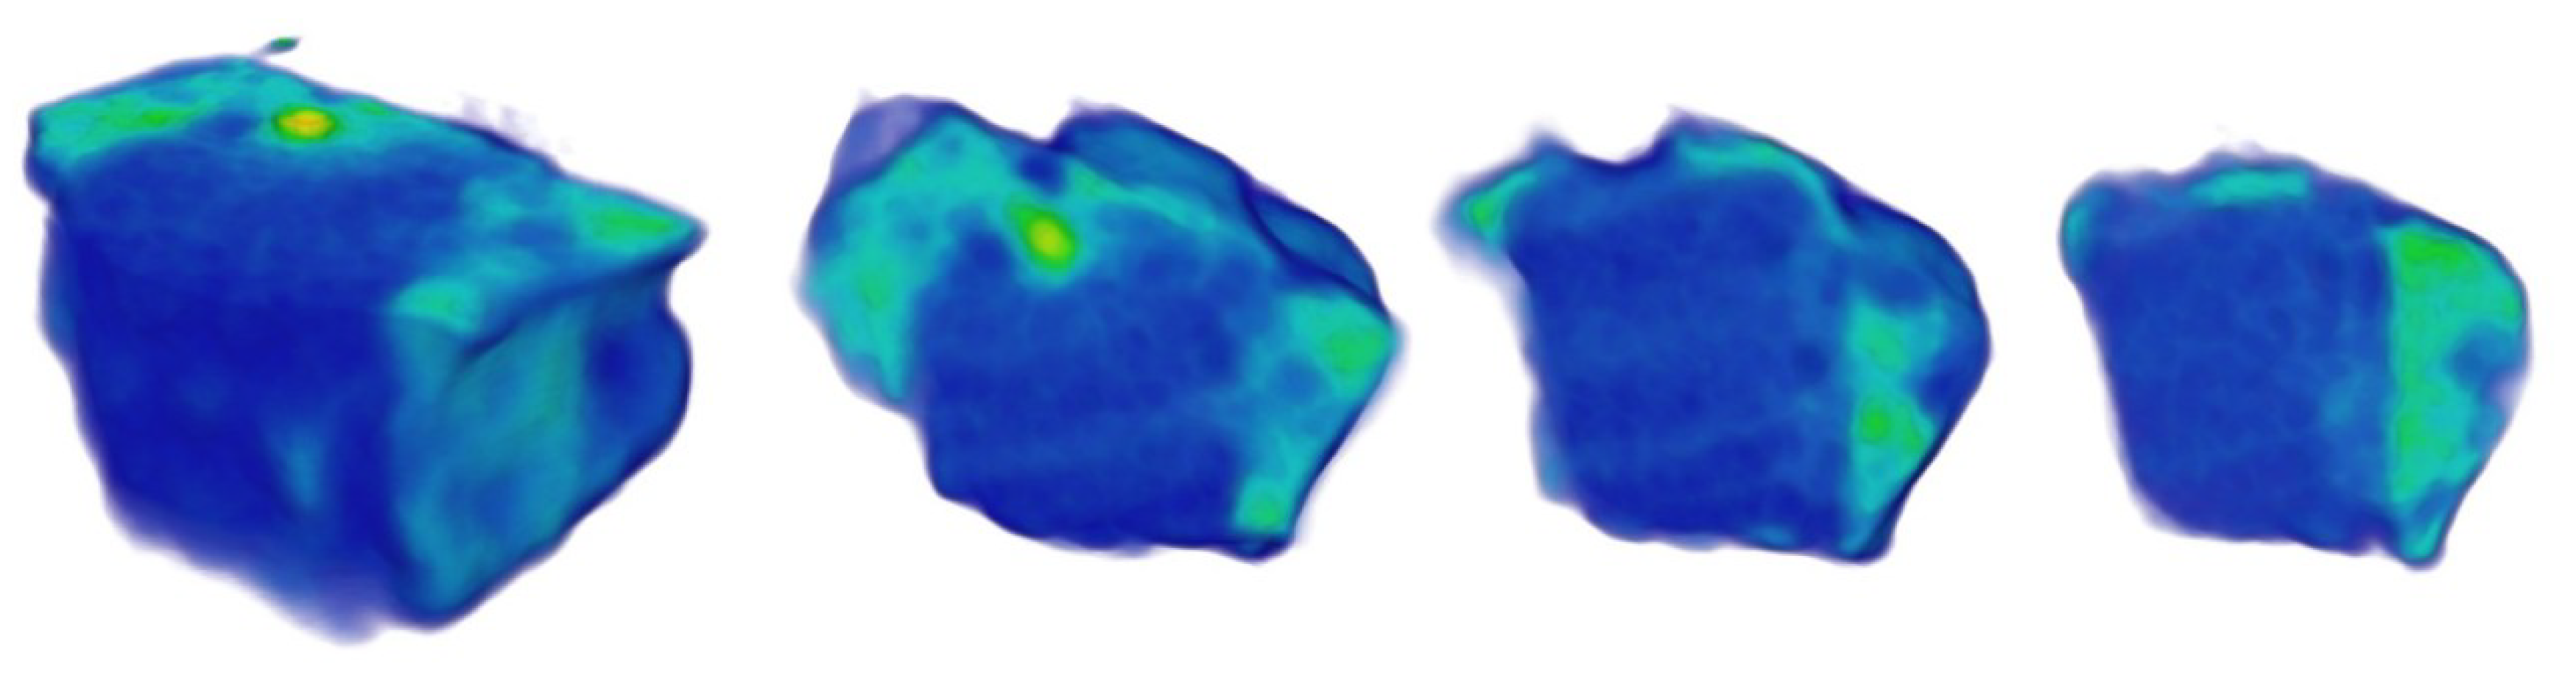
3.7. Neutron Tomography

While neutron and X-ray diffraction was used to identify the phase composition of the studied mosaic stones, the spatial distribution of the phases was analyzed by neutron tomography. The several tomography transverse slices of reconstructed tree-dimension models of sample 5 and sample 6 are presented in Figure 7 and Figure 8, respectively. A voxels distribution on the gray-level scale reflects a spatial distribution of values of the neutron absorption coefficients inside the studied mosaic fragments [51]. The attenuation of the neutron beam corresponds to the scattering and absorption losses inside the volume of the investigated samples [17,51]. The attenuation coefficient of a neutron beam with an average neutron wavelength of λ~2 Å for calcite is Σ = 0.17 cm−1; this is slightly larger than the relevant parameters for quartz (Σ = 0.11 cm−1) [18]. Therefore, a spatial distribution of major phases is visible in the neutron tomography experiments (Figure 7). Interestingly, an area of high neutron beam attenuation was found on the surface of sample 5. This surface area can be attributed to some paint or decorated layer, which is possibly related to some hydrates or amorphous aluminosilicates that have been detected in neutron diffraction by the effect on the background shape (Figure 7).
The volume of the mosaic sample 5 is formed by 2,762,838 voxels, which corresponds to the volume of 388 mm−1. The total three-dimension (3D) reconstructed volume of the sample 5 was divided into three separate volumes corresponding to the calcite, quartz and high absorption “paint” components. The quartz comprises 1,504,705 voxels or 211.6 (3) mm3, the calcite phases consist of 1,217,788 voxels or 171.2 (3) mm3, the “paint” layer formed by 40,345 voxels or 5.6 (3) mm3. The volume ratio of the calcite and quartz phases is 0.81, which is well consistent with neutron diffraction data.
The 3D imaging data of volume corresponding to the mosaic sample 6 are shown in Figure 8. In addition to the main phase of calcite, the well-distinguishable areas characterized by a high neutron attenuation coefficient are visible. According to neutron diffraction data, it can be assumed that these are residues of clay or corrosions based on silicates and iron hydrates. The presence of hydrogen, with a high incoherent neutron scattering length in these compounds, determines the high radiographic contrast between these grains and the main calcite matrix. The observed hydrogen-contained areas do not exceed a size of 5−7 mm. The average size of the visible grains is 6.1 (1) mm. Their volumes are formed 114,023 voxels or 16.1 mm3. The grains occupy 7.1(3) % of total sample 6 volume (2,344,550 voxels of 330 mm3).
For this research, quite complex objects of cultural heritage as the fragments of ancient mosaics were studied. The samples contain the main components, such as calcite and quartz, the colorant phases, the phases of decorative elements, the phases of clay, etc. For a comprehensive analysis of the samples, various methods were used. For color characteristics spectroscopy, phase analysis attracted X-ray diffraction. It is known, the experimental data on the chemical and mineral composition obtained from the surface of massive object may differ dramatically from the distribution of chemical components in its volume. In this case, the use of non-destructive methods with high penetration into the bulk objects looks justified. The neutron diffraction method provides information about the phase composition of the studied object and neutron radiography and tomography allows the obtaining of the pattern of the spatial distribution of internal components. The fundamental difference in the nature of neutron interactions with matter compared to X-rays provides additional benefits including sensitivity to light elements, a notable difference in contrast between neighboring elements. All these features make neutron methods a highly growing tool in archaeology science applications.
However, it seems that the main value of this study was precisely in the coordinated diverse research of the mosaic fragments. Additionally, the capabilities of various methods were demonstrated and these will provide a basis for future work on the classification and notification of numerous mosaics remains from other cultural centers.

4. Conclusions

It is the first time this historical edifice (built in 4th Century AD) has been studied through some representative fragments (i.e., tesserae). In this work, using a large number of natural science methods of complementary research, we examined a set of decorative fragments of mosaic from Constanta Mosaic Museum, Romania, as one of the representatives of cultural heritage of the ancient Roman and Byzantine Empire. Non-destructive (Chromatic analysis, Neutron Diffraction, Neutron Tomography) and micro-invasive (Optical Microscopy, X-ray Diffraction, Field Emission Scanning Electron Microscopy–Energy Dispersive X-ray Spectroscopy, Raman Spectroscopy) methods were used to study in detail the color, structural features of the surfaces, as well as the chemical composition of mosaic fragments. The physical and chemical processes, like hydration or dehydration and additional phases forming, during the preservation of mosaic fragments in the marine and urban atmosphere, are discussed. X-ray and neutron diffraction were used to study the phase and mineral composition of mosaic fragments and to obtain the unit cell parameters of the main phase components. Neutron tomography was attracted to reconstruct the 3D spatial distribution of major phases, to identify areas of corrosion and structural degradation, and layers of paint on the studied mosaic fragments. The volumetric calculations based on the experimental tomography data were performed.
Comprehensive studies of cultural heritage items (i.e., tesserae) can demonstrate the possibilities of joint non-destructive control examination, both in terms of historical restoring of the manufacturing technology of ancient Roman and Byzantine mosaics, and the effects of structural and chemical degradation of valuable materials.

Author Contributions

Conceptualization, R.M.I. and S.E.K.; methodology, R.M.I., S.E.K. and C.R.; software, I.A.B., B.A.B. and D.P.K.; validation, R.M.I., S.E.K., C.R., and A.V.B.; formal analysis, I.A.B.; investigation, I.A.B., I.D.D., A.I.G., L.I., R.M.G., M.E.D., R.M.S., and S.T.; resources, R.M.I., S.E.K. and C.R.; writing—original draft preparation, R.M.I., S.E.K., C.R., I.A.B. and I.D.D.; writing—review and editing, R.M.I., S.E.K. and C.R.; visualization, I.A.B. and I.D.D.; supervision, R.M.I. and C.R.; project administration, R.M.I., S.E.K. and C.R.; funding acquisition, R.M.I., S.E.K. and C.R. All authors have read and agreed to the published version of the manuscript.

Funding

This research was funded by Bilateral Project 04−4−1121−2015/2020, between Valahia University of Targoviste and Joint Institute for Nuclear Research, Dubna, Moscow Region; Protocol 4755−4−2018/2020 “Micro−structural and compositional characterization of supports and coating layers on different substrates applied in biomaterials, photoelectrochemicals catalysis and cultural heritage and by the project 51PCCDI/2018, financed by Romanian National Authority for Scientific Research (UEFISCDI) “New diagnosis and treatment technologies for the preservation and revitalization of archaeological components of the national cultural heritage”.

Conflicts of Interest

The authors declare no conflict of interest.

References

  1. Pedersen, O. Archives and Libraries in the Ancient Near East, 1500–300 B.C.; Bethesda: Rockville, MD, USA, 2006; p. 205. [Google Scholar]
  2. Fischer, P. Mosaic, History and Technique; McGraw-Hill: New York, NY, USA, 1971; p. 152. [Google Scholar]
  3. Von Saldern, A. Mosaic glass from Hasanlu, Marlik, and Tell Al-Rimah. J. Glass Stud. 1966, 8, 9–25. [Google Scholar]
  4. Verita, M. Technology and deterioration of vitreous mosaic tesserae. Stud. Conserv. 2000, 45, 65–76. [Google Scholar] [CrossRef]
  5. Redslob, G. Ueber den Ausdruck “Mosaïk”. Z. Dtsch. Morgenländischen Ges. 1860, 14, 663–678. [Google Scholar]
  6. Farneti, M. Technical-Historical Glossary of Mosaic Art: With an Historical Survey of Mosaic Art; Longo Editore: Ravenna, Italy, 1993; p. 236. [Google Scholar]
  7. Dunbabin, K.M.D. Mosaics of the Greek and Roman World; Cambridge University Press: Cambridge, UK, 1999; p. 357. [Google Scholar]
  8. Waywell, S. Roman Mosaics in Greece. Am. J. Archaeol. 1979, 83, 293–321. [Google Scholar] [CrossRef]
  9. Radulescu, C.; Stihi, C.; Ion, R.M.; Dulama, I.D.; Stanescu, S.G.; Stirbescu, R.M.; Teodorescu, S.; Gurgu, I.V.; Let, D.D.; Olteanu, L.; et al. Seasonal Variability in the Composition of Particulate Matter and the Microclimate in Cultural Heritage Areas. Atmosphere 2019, 10, 595. [Google Scholar] [CrossRef] [Green Version]
  10. Minchev, A. Ancient Theatres and Theatre Art of the Bulgarian Black Sea Coast and Thracian Hinterland. In Ancient Theatre and Performance Culture around the Black Sea; Braund, D., Hall, E., Wyles, R., Eds.; Cambridge University Press: Cambridge, UK, 2019; pp. 218–219. [Google Scholar]
  11. Bosneagu, R.; Voinea, V.; Ion, A. A First Approach to Navigation and Trade on the West—Pontic Coast, from Its Beginnings to the Roman Antiquity. J. Soc. Sci. Humanit. 2015, 1, 288–296. [Google Scholar]
  12. Brems, D.; Degryse, P.; Hasendoncks, F.; Gimeno, D.; Silvestri, A.; Vassilieva, E.; Luypaers, S.; Honings, J. Western Mediterranean sand deposits as raw material for Roman glass production. J. Archaeol. Sci. 2012, 39, 2897–2907. [Google Scholar] [CrossRef]
  13. Izzo, F.; Arizzi, A.; Cappelletti, P.; Cultrone, G.; De Bonis, A.; Germinario, C.; Graziano, S.; Grifa, C.; Guarino, V.; Mercurio, M.; et al. The art of building in the Roman period (89 B.C.—79 A.D.): Mortars, plasters and mosaic floors from ancient Stabiae (Naples, Italy). Constr. Build. Mater. 2016, 117, 129–143. [Google Scholar] [CrossRef]
  14. Ricciardi, P.; Colomban, P.; Tournié, A.; Macchiarola, M.; Ayed, N. A Non-Invasive Study of Roman Age Mosaic Glass Tesserae by Means of Raman Spectroscopy. J. Archaeol. Sci. 2009, 36, 2551–2559. [Google Scholar] [CrossRef]
  15. Boschetti, C.; Corradi, A.; Baraldi, P. Raman characterization of painted mortar in Republican Roman mosaics. J. Raman Spectrosc. 2008, 39, 1085–1090. [Google Scholar] [CrossRef]
  16. Witts, P. Mosaics in Roman Britain: Stories in Stone, 1st ed.; Tempus: Stroud, UK, 2005; p. 35. [Google Scholar]
  17. Treimer, W. Neutron Tomography. In Neutron Imaging and Applications; Bilheux, H.Z., McGreevy, R., Anderson, I.S., Eds.; Springer: Boston, MA, USA, 2009; pp. 81–108. [Google Scholar]
  18. Kardjilov, N.; Festa, G. (Eds.) Neutron Methods for Archaeology and Cultural Heritage; Springer: Basel, Switzerland, 2016; p. 350. [Google Scholar]
  19. Kardjilov, N.; Hilger, A.; Manke, I.; Strobl, M.; Treimer, W.; Banhart, J. Industrial Applications at the New Cold Neutron Radiography and Tomography Facility of the HMI. Nucl. Instrum. Methods Phys. Res. A 2005, 542, 16–21. [Google Scholar] [CrossRef]
  20. Gorini, G. Ancient Charm: A Research Project for Neutron-Based Investigation of Cultural-Heritage Objects. Il Nuovo Cim. C 2007, 30, 47–58. [Google Scholar]
  21. Filabozzi, A.; Andreani, C.; Pascale, M.; Gorini, G.; Pietropaolo, A.; Perelli-Cippo, E.; Senesi, R.; Tardocchi, M.; Kockelmann, W. Texture and structure studies on marbles from Villa Adriana via neutron diffraction technique. J. Neutron Res. 2006, 14, 55–58. [Google Scholar] [CrossRef] [Green Version]
  22. Czubek, J.A.; Drozdowicz, K.; Gabańska, B.; Igielski, A.; Krynicka, E.; Woźnicka, U. Thermal neutron macroscopic absorption cross section measurement applied for geophysics. Prog. Nucl. Energy 1996, 30, 295–303. [Google Scholar] [CrossRef]
  23. Bintintan, A.; Gligor, M.; Radulescu, C.; Dulama, I.D.; Olteanu, R.L.; Teodorescu, S.; Stirbescu, R.M.; Bucurica, I.A. Multielemental and Chemical Characterization of Eneolithic Petresti Painted Pottery from the Alba Iulia-Lumea Noua Archaeological Site, Romania. Anal. Lett. 2019, 52, 2348–2364. [Google Scholar] [CrossRef]
  24. Bintintan, A.; Gligor, M.; Dulama, I.D.; Radulescu, C.; Stihi, C.; Ion, R.M.; Teodorescu, S.; Stirbescu, R.M.; Bucurica, I.A.; Pehoiu, G. Analysis and Structural Investigations on Early Eneolithic Foeni Painted Pottery from Alba Iulia-Lumea Noua Archaeological Site. Rom. J. Phys. 2019, 64, 903. [Google Scholar]
  25. Bintintan, A.; Gligor, M.; Dulama, I.D.; Teodorescu, S.; Stirbescu, R.M.; Radulescu, C. ATR-FTIR and SEM-EDS Analyses of Lumea Nouă Painted Pottery from Alba Iulia-Lumea Nouă Neolithic Site. Rev. Chim. Buchar. 2017, 68, 847–852. [Google Scholar] [CrossRef]
  26. David, M.E.; Ion, R.M.; Andrei, E.R.; Grigorescu, R.M.; Iancu, L.; Filipescu, M.I. Superhydrophobic Coatings based on Cellulose Acetate for Pinewood Preservation. J. Sci. Arts 2020, 20, 171–182. [Google Scholar]
  27. Kozlenko, D.; Kichanov, S.; Lukin, E.; Savenko, B. The DN-6 Neutron Diffractometer for High-Pressure Research at Half a Megabar Scale. Crystals 2018, 8, 331. [Google Scholar] [CrossRef] [Green Version]
  28. Rodriguez-Carvajal, J. Recent Advances in Magnetic Structure Determination by Neutron Powder Diffraction. Phys. B 1993, 192, 55–69. [Google Scholar] [CrossRef]
  29. Kozlenko, D.P.; Kichanov, S.E.; Lukin, E.V.; Rutkauskas, A.V.; Belushkin, A.V.; Bokuchava, G.D.; Savenko, B.N. Neutron radiography and tomography facility at IBR-2 reactor. Phys. Part. Nucl. Lett. 2016, 13, 346–351. [Google Scholar] [CrossRef]
  30. Schneider, C.; Rasband, W.; Eliceiri, K. NIH Image to ImageJ: 25 years of image analysis. Nat. Methods 2012, 9, 671–675. [Google Scholar] [CrossRef] [PubMed]
  31. Brun, F.; Massimi, L.; Fratini, M.; Dreossi, D.; Billè, F.; Accardo, A.; Pugliese, R.; Cedola, A. SYRMEP Tomo Project: A graphical user interface for customizing CT reconstruction workflows. Adv. Struct. Chem. Imaging 2017, 3, 1–9. [Google Scholar] [CrossRef] [Green Version]
  32. Morillas, H.; Vázquez, P.; Maguregui, M.; Marcaida, I.; Silva, L. Composition and porosity study of original and restoration materials included in a coastal historical construction. Constr. Build. Mater. 2018, 178, 384–392. [Google Scholar] [CrossRef]
  33. Morillas, H.; García-Florentino, C.; Marcaida, I.; Maguregui, M.; Arana, G.; Silva, L.; Madariaga, J. In-situ analytical study of bricks exposed to marine environment using hand-held X-ray fluorescence spectrometry and related laboratory techniques. Spectrochim. Acta B 2018, 146, 28–35. [Google Scholar] [CrossRef]
  34. Patrón, D.; Lyamani, H.; Titos, G.; Casquero-Vera, J.; Cardell, C.; Močnik, G.; Arboledas, L.; Olmo, F. Monumental heritage exposure to urban black carbon pollution. Atmos. Environ. 2017, 170, 22–32. [Google Scholar] [CrossRef]
  35. Arjonilla, P.; Dominguez-Vidal, A.; Gómez, E.; Domene, R.; Lluveras, A.; Cañada, M.; Colombini, M. Characterization of organic materials in the decoration of ornamental structures in the Alhambra monumental ensemble using gas-chromatography/mass spectrometry (GC/MS). Microchem. J. 2018, 140, 14–23. [Google Scholar] [CrossRef]
  36. Ion, R.M.; Tincu, S.; Grigorescu, R.M.; Radulescu, C.; Teodorescu, S.; Dulama, I.D.; Stirbescu, R.M.; Bucurica, I.A.; Minca, I.; Ion, M.L.; et al. Investigations of the new gate tower from Corvins’ Castle. IOP Conf. Ser. Mater. Sci. Eng. 2019, 572, 012088. [Google Scholar] [CrossRef]
  37. Ion, R.M.; Iancu, L.; Vasilievici, G.; Grigore, M.E.; Andrei, R.E.; Radu, G.I.; Grigorescu, R.M.; Teodorescu, S.; Bucurica, I.A.; Ion, M.L.; et al. Ion-Substituted Carbonated Hydroxyapatite Coatings for Model Stone Samples. Coatings 2019, 9, 231. [Google Scholar] [CrossRef] [Green Version]
  38. Ion, R.M.; Tincu, S.; Ion, N.; Bucurica, I.A.; Teodorescu, S.; Dulama, I.D.; Stirbescu, R.M.; Gheboianu, A.I.; Radulescu, C.; Ion, M.L.; et al. Archaeometric Studies of Mural Paints from Matia Loggia (Corvins’ Castle). Rom. Rep. Phys. 2019, 71, 804. [Google Scholar]
  39. Ion, R.M.; Iancu, L.; Grigorescu, R.M.; Tincu, S.; Vasilievici, G.; Ion, N.; Bucurica, I.A.; Teodorescu, S.; Dulama, I.D.; Stirbescu, R.M.; et al. Arhaeometric Investigations on Ceramic Materials from Hunedoara—The Court Area. J. Sci. Arts 2018, 2, 471–480. [Google Scholar]
  40. Oliveira, M.L.S.; Tutikian, B.F.; Milanes, C.; Silva, L.F.O. Atmospheric contaminations and bad conservation effects in Roman mosaics and mortars of Italica. J. Clean. Prod. 2020, 248, 119250. [Google Scholar]
  41. Hamarneh, C.; Abu-Jaber, N. Mosaic pavement mortar production in Gerasa in the Byzantine period. Archaeol. Res. Asia 2017, 9, 22–33. [Google Scholar] [CrossRef]
  42. Galli, S.; Mastelloni, M.; Ponterio, R.; Sabatino, G.; Triscari, M. Raman and scanning electron microscopy and energy-dispersive x-ray techniques for the characterization of colouring and opaquening agents in Roman mosaic glass tesserae. J. Raman Spectrosc. 2004, 35, 622–627. [Google Scholar] [CrossRef]
  43. Forchhammer, G. On the Composition of Sea-Water in the Different Parts of the Ocean. Philos. Trans. R. Soc. Lond. 1865, 155, 203–262. [Google Scholar]
  44. Buzgar, N.; Apopei, A.; Buzatu, A. Characterization and source of Cucuteni black pigment (Romania): Vibrational spectrometry and XRD study. J. Archaeol. Sci. 2013, 40, 2128–2135. [Google Scholar]
  45. Hernanz, A.; Gavira-Vallejo, J.; Ruiz, J.; Edwards, H. A Comprehensive Micro-Raman Spectroscopic Study of Prehistoric Rock Paintings from the Sierra de las Cuerdas, Cuenca, Spain. J. Raman Spectrosc. 2008, 39, 972–984. [Google Scholar]
  46. Lafuente, B.; Downs, R.T.; Yang, H.; Stone, N. The power of databases: The RRUFF project. In Highlights in Mineralogical Crystallography; Armbruster, T., Danisi, R.M., Eds.; W. De Gruyter: Berlin, Germany, 2015; pp. 1–30. [Google Scholar]
  47. Goler, S.; Hagadorn, A.; Ratzan, D.M.; Bagnall, R.; Cacciola, A.; McInerney, J.; Yardleya, J.T. Using Raman spectroscopy to estimate the dates of carbon-based inks from Ancient Egypt. J. Cult. Herit. 2019, 38, 106–117. [Google Scholar] [CrossRef]
  48. Gulrajani, M.L. (Ed.) Colour Measurement: Principles, Advances and Industrial Applications; Woodhead Publishing: Philadelphia, PA, USA, 2010; p. 62. [Google Scholar]
  49. Bikiaris, D.; Sister, D.; Sotiropoulou, S.; Katsibiri, O.; Pavlidou, E.; Moutsatsou, A.P.; Chryssoulakis, Y. Ochre-differentiation through micro-Raman and micro-FTIR spectroscopies: Application on wall paintings at Meteora and Mount Athos, Greece. Spectrochim. Acta A 2000, 56, 3–18. [Google Scholar] [CrossRef]
  50. Alberghina, M.F.; Barraco, R.; Basile, S.; Brai, M.; Pellegrino, L.; Prestileo, F.; Schiavone, S.; Tranchina, L. Mosaic floors of roman Villa del Casale: Principal component analysis on spectrophotometric and colorimetric data. J. Cult. Herit. 2014, 15, 92–97. [Google Scholar] [CrossRef]
  51. Otsu, N. A Threshold Selection Method from Gray-Level Histograms. IEEE Trans. Syst. Man Cybern. 1979, 9, 62–66. [Google Scholar]
Figure 1. Photo of Roman Mosaic from Constanta (Romania)—the presented surface is 2 × 3.5 m2.
Applsci 10 03781 g001
Figure 2. Characteristic XRD pattern for mosaic fragments.
Applsci 10 03781 g002
Figure 3. The EDS patterns of the mosaic samples—the main elements composition are labeled (a,c,e,g,i,k); FE-SEM images of the mosaic samples recorded at Vacc = 5 kV, WD = 18.4–18.7 mm, ×3000 magnification (b,d,f,h,j,l).
Applsci 10 03781 g003aApplsci 10 03781 g003bApplsci 10 03781 g003c
Figure 4. Raman spectra obtained from surfaces of samples 1 and 2 and corresponding to calcite and quartz phases. The tentative assignment of Raman lines is present in Table 4.
Applsci 10 03781 g004
Figure 5. Raman spectra obtained from different points of samples 5(a) and 6(b,c). The Raman wavenumbers of the most intense Raman peaks are indicated. A not-homogeneous composition in different point of samples 5 and 6 is observed. The tentative assignment of Raman lines is present in Table 4.
Applsci 10 03781 g005
Figure 6. Neutron diffraction patterns of the mosaic fragments sample 5 (top) and sample 6 (bottom). The experimental points and calculated profile are shown. The Miller indices of major phases are labeled. Ticks below represent calculated positions of the Bragg peaks of the calcite and quartz phases. The corresponding diffraction peaks are marked.
Applsci 10 03781 g006
Figure 7. The reconstructed 3D model and several virtual slices of the mosaic fragment sample 5. It is assumed that the green areas correspond to the calcite phase, while the red regions are quartz areas. The rainbow-like coloring shows neutron absorption degree from low (blue) to high (red).
Applsci 10 03781 g007
Figure 8. The reconstructed 3D model and several virtual slices of the mosaic fragment sample 6. It is assumed the blue areas correspond to calcite phase; the green-yellow regions are hydrates or other hydrogen-contained areas inside the mosaic fragment. The rainbow-like coloring shows neutron absorption degree from low (blue) to high (green).
Applsci 10 03781 g008
Table 1. The sample labeling: photos, optical microscopy images, and color of the studied mosaic fragments.
SamplePhotoOptical Microscopy *Color
1 Applsci 10 03781 i001 Applsci 10 03781 i002White
2 Applsci 10 03781 i003 Applsci 10 03781 i004Red-dark
3 Applsci 10 03781 i005 Applsci 10 03781 i006Blue
4 Applsci 10 03781 i007 Applsci 10 03781 i008Grey
5 Applsci 10 03781 i009 Applsci 10 03781 i010Red-light
6 Applsci 10 03781 i011 Applsci 10 03781 i012Black and white
* Optical microscopy images were recorded at 40× magnification.
Table 2. Mineral composition of the mosaic fragments1 determined by WDXRF, expressed in mass% ± S.D.%, normalized to 100%.
ComponentSample 1Sample 2Sample 3Sample 4Sample 5Sample 6
Na2Ond 20.724 ± 0.067nd 21.186 ± 0.135nd 21.146 ± 0.107
MgO1.097 ± 0.2481.485 ± 0.1221.752 ± 0.15425.119 ± 1.2802.709 ± 0.2243.444 ± 0.213
Al2O30.986 ± 0.0721.461 ± 0.0921.803 ± 0.0647.149 ± 0.5943.959 ± 0.0724.891 ± 0.283
SiO22.915 ± 0.0494.806 ± 0.0394.462 ± 0.05813.780 ± 0.79911.436 ± 0.87213.403 ± 0.902
P2O50.269 ± 0.0210.398 ± 0.0260.243 ± 0.0220.680 ± 0.0380.221 ± 0.0280.217 ± 0.021
SO30.362 ± 0.0230.412 ± 0.0180.459 ± 0.0221.290 ± 0.0890.376 ± 0.0200.542 ± 0.026
Cl0.058 ± 0.0040.177 ± 0.0080.027 ± 0.0030.075 ± 0.0050.033 ± 0.00340.346 ± 0.009
K2O0.385 ± 0.0270.491 ± 0.0320.552 ± 0.0341.698 ± 0.0770.874 ± 0.0641.127 ± 0.038
CaO93.375 ± 4.03689.219 ± 3.65789.937 ± 3.06145.437 ± 2.06778.740 ± 2.96672.602 ± 2.591
MnOnd 2nd 2nd 2nd 2nd 20.097 ± 0.041
Fe2O30.499 ± 0.0420.783 ± 0.0390.661 ± 0.0420.346 ± 0.0281.627 ± 0.0851.701 ± 0.038
CuOnd 2nd 2nd 2nd 2nd 20.049 ± 0.002
SrO0.055 ± -0.0050.046 ± 0.0040.104 ± 0.0113.192 ± 0.6410.025 ± 0.0020.435 ± 0.040
1 WDXRF data obtained by EZ Scan analysis, in vacuum, for sample type oxide powder, the pellets (1.5 g sample mixed with 2 g BOREOX—FLUXANA) being covered with Myler foil (6 μm thickness). Total scanning time of the sample: 30 min. 2 Component which was not detected in sample (<LOD).
Table 3. The major and minor elements determined by FE-SEM-EDS in the studied mosaics fragments, expressed in wt.% ± S.D.%, normalized to 100 wt.%.
Element 1Sample 1
(White)
Sample 2
(Red-Dark)
Sample 3
(Blue)
Sample 4
(Grey)
Sample 5
(Red-Light)
Sample 6
(Black)
C5.64 ± 0.069.26 ± 0.067.15 ± 0.058.07 ± 0.0712.57 ± 0.088.15 ± 0.08
O39.06 ± 0.2452.22 ± 0.2943.44 ± 0.2447.66 ± 0.2645.56 ± 0.2945.09 ± 0.26
Fnd 2<LOD 3nd 2<LOD 30.79 ± 0.14<lod 3
Na0.15 ± 0.02nd 2nd 20.43 ± 0.02nd 20.42 ± 0.02
Mg0.36 ± 0.020.41 ± 0.030.53 ± 0.028.25 ± 0.050.63 ± 0.030.93 ± 0.02
Al0.39 ± 0.020.83 ± 0.030.71 ± 0.030.58 ± 0.031.07 ± 0.041.92 ± 0.04
Si0.38 ± 0.031.44 ± 0.031.14 ± 0.031.20 ± 0.042.67 ± 0.044.99 ± 0.05
Pnd 2nd 2nd 20.42 ± 0.04nd 2nd 2
Snd 21.24 ± 0.020.18 ± 0.031.25 ± 0.020.65 ± 0.04nd 2
Cl0.21 ± 0.02nd 2nd 2nd 2nd 20.52 ± 0.03
K0.23 ± 0.031.28 ± 0.070.34 ± 0.060.95 ± 0.030.48 ± 0.070.92 ± 0.08
Ca53.56 ± 0.2733.32 ± 0.2046.50 ± 0.2331.20 ± 0.2035.59 ± 0.2237.06 ± 0.22
1 The detection and quantification were done with K-lines, for all elements; 2 nd—element which was not detected in sample; 3 element which was detected in sample and appear in EDS pattern (Figure 2c,g,k), but the concentration is less than the limit of detection (LOD ≈ 0.01 wt.%).
Table 4. The tentative assignment of the observed Raman lines to the different mineral phases of the mosaics fragments.
Mineral PhaseRaman Characteristic Peaks [cm−1]
Calcite157, 283, 713, 1087
Quartz352, 462, 1375
Goethite304, 395, 480, 557
Hematite304, 395
Manganite395, 557, 637
Orthosilicates395, 557, 880
Carbon1325, 1610
Table 5. The chromatic parameters of the mosaic fragments.
ElementSample 1Sample 2Sample 3Sample 4Sample 5Sample 6
Lx87.0186.6184.9785.6378.6189.88
ax−0.390.62−0.97−0.572−1.08
bx12.117.45.707.379.617.20
ΔLx−11.86−0.4−2.04−1.38−20.27−8.99
Δax1.922.941.341.754.311.23
Δbx1.65−3.05−4.75−3.08−0.87−3.25
ΔEx12.130.8412.621.5820.719.64
Cx 112.117.425.787.399.817.28
ΔCx-−4.69−6.33−4.73−2.29−4.82
H 291.8485.2199.6694.4278.2498.53
ΔH-6.637.822.58−13.66.69
1 Cx = chroma degree; when C is smaller than 10, is a monochromatic color; when is greater than 10, is a chromatic color; 2 H = hue degree.

