A Novel Indoor Localization Method Based on Image Retrieval and Dead Reckoning

School of Electronic Information and Electrical Engineering, Shanghai Jiao Tong University, Shanghai 200240, China
*
Author to whom correspondence should be addressed.
Appl. Sci. 2020, 10(11), 3803; https://doi.org/10.3390/app10113803
Submission received: 27 April 2020
/
Revised: 24 May 2020
/
Accepted: 26 May 2020
/
Published: 29 May 2020
(This article belongs to the Special Issue Recent Advances in Indoor Localization Systems and Technologies)
Abstract
:Indoor pedestrian localization measurement is a hot topic and is widely used in indoor navigation and unmanned devices. PDR (Pedestrian Dead Reckoning) is a low-cost and independent indoor localization method, estimating position of pedestrians independently and continuously. PDR fuses the accelerometer, gyroscope and magnetometer to calculate relative distance from starting point, which is mainly composed of three modules: step detection, stride length estimation and heading calculation. However, PDR is affected by cumulative error and can only work in two-dimensional planes, which makes it limited in practical applications. In this paper, a novel localization method V-PDR is presented, which combines VPR (Visual Place Recognition) and PDR in a loosely coupled way. When there is error between the localization result of PDR and VPR, the algorithm will correct the localization of PDR, which significantly reduces the cumulative error. In addition, VPR recognizes scenes on different floors to correct floor localization due to vertical movement, which extends application scene of PDR from two-dimensional planes to three-dimensional spaces. Extensive experiments were conducted in our laboratory building to verify the performance of the proposed method. The results demonstrate that the proposed method outperforms general PDR method in accuracy and can work in three-dimensional space.
1. Introduction
Location information and location-based services are always hot topics. At present, GNSS (Global Navigation Satellite System)-based positioning methods are still dominant for outdoor environments. However, in complex indoor environments, the satellite signals received by users is so weak that the GNSS-based positioning method will fail, which makes people turn to other effective techniques to obtain accurate the information of indoor location.
Commonly, indoor positioning methods include RFID (Radio Frequency Identification), Bluetooth, IR (Infrared Ray), geomagnetism, WLAN (Wireless Local Area Network) and visual recognition [1]. In principle, indoor localization methods can be divided into five categories: triangulation, sensing, recognition, fingerprint and DR (dead reckoning) [2]. In these methods, RFID, Bluetooth, IR and WLAN require deploying additional equipment, resulting in an increased cost. These methods require special equipment to be laid and have special signal receiving equipment, which has a higher requirement on the scene. Meanwhile, magnetic-based positioning method is vulnerable to interference, which affects the positioning accuracy. Compared with other methods, DR does not rely on external environments and additional equipment, which can gain high accuracy in a short time. It achieves low-cost and independent localization through processing outputs of inertial sensors. With the development of MEMS (Micro Electro Mechanical System) technology, we pay more attention to DR. However, limited by cumulative error of gyroscopes, the positioning error will gradually increase when working continuously for long periods. Furthermore, DR can only work in a two-dimensional plane without additional information, which means that DR has trouble in dealing with pedestrians going up- and downstairs.
To reduce the cumulative error and extend application scenarios, we need to find an algorithm that can help PDR correct its cumulative error to increase its accuracy. There are many studies focused on the problem of cumulative error in PDR. A smartPDR using mobile phones has been proposed, which uses accelerometers, magnetometers and gyroscopes in mobile phones, proposing an indoor positioning model that can detect downstairs, headings, etc. for localization [3]. Another algorithm combines GNSS and PDR for positioning and navigation and uses GNSS for positioning correction [4]. In [5], a combination of GPS and dead reckoning is used to explore the trajectory of animal movement to help understand ecology. Thong [6] combined WI-FI and PDR and used the Gaussian process to estimate and construct the RSS fingerprints by K-nearest weight. In [7], RFID, PDR and magnetic matching are combined for positioning, where RSS technology and a floor map are used. In addition, some research focuses on PDR working in the three-dimensional environment. The air pressure is combined with the PDR system to solve the upstairs and downstairs problems. The air pressure of the sensor on the hand will change regularly with the swing of the hand. PDR can be realized by processing the air pressure signal [8]. Wang et al. [9] fused the magnetic signals and the PDR by Kalman filter and the PF scheme. The locations are obtained by the weighted mean of particles. It reduces the effect of heavy magnetic distortions. These works have achieved great results in the indoor location.
These researches provide us with a wide range of ways for improving PDR. Following their research, we aim to combine a more determined method with PDR, which might work better. Visual information is easy to obtain with low cost sensors and is easily identified by humans. The visual information includes common RGB pictures, including depth RGBD pictures, binocular camera pictures and other pictures. RGB images might be the simplest and lowest cost visual information. In addition, computer vision now delivers amazing results in a variety of areas, including image recognition and image classification, which are beneficial for indoor location. We believe that the combination of visual signal and PDR will be one of the solutions for indoor positioning. Therefore, it is meaningful to combine computer vision with PDR, which may better solve the problem of PDR position correction and work in a three-dimensional environment.
Visual position recognition is one of the visual methods that may be used to correct PDR. VPR is the task of identifying a place through a visual image of it. VPR is suitable to fill the gaps of positioning errors because of its high robustness and convenience of requiring no additional deployment. The principle of VPR is matching feature descriptors of the query image and other labeled images to find the most similar one. Then, from the label of the most similar image, we can get the location of the query image. Traditional visual place recognition algorithms use local or global feature method, such as SIFT [10], SURF [11], CenSurE [12], Gist [13] and ADMM-RS [14] to get the descriptors of images. However, each local and global descriptor loses some information of the image [15], which may result in a wrong match. Beside, the calculation of these traditional methods will cost a lot of computing resources and are too slow to use, which do not suit the real-time location. With the development of deep learning technology, CNNs (Convolutional Neural Networks) are used to extract feature descriptors from images and have made some improvements in recognition tasks [16,17,18]. CNNs can obtain the deep information in the images, so that they can focus on the deeper differences in the images, and thus can achieve better visual positioning effect. In VPR, CNN performs better than the traditional method and costs less time. In our method, CNN is used to build a real-time visual position recognition module.
In this paper, a novel and improved indoor localization method is proposed, which can effectively reduce accumulative errors derived from PDR and works well in a three-dimensional space by fusing vision information. Especially, we train a CNN architecture for indoor visual place recognition tasks and use it to aid PDR to gain better performance in indoor positioning. We use the VPR system to get a starting point for PDR, while the place coordinates are obtained from VPR to modify the localization results from PDR. The improved fusion indoor localization method has much less computing complexity than VPR system and makes PDR more flexible and accurate.
The main contributions of this article are: (1) A new method called V-PDR is proposed for indoor localization which combines the VPR and PDR. With the system, we can obtain the absolute position rather than the relative position. (2) V-PDR improves the localization accuracy and solves the problem that PDR cannot work properly in three-dimensional space by combining vision and inertial sensors.
The rest parts of this paper is arranged as follows. Section 2 is the related works for pedestrian dead reckoning. In Section 3, our PDR system is illustrated. Our design for the fusion indoor localization method is introduced in Section 4, which include our VPR network design and fusion method. Details of experiments implemented in our lab for testing our method and the results are listed in Section 5. Finally, the conclusions are drawn in the last section.
2. Related Works
2.1. PDR Improvements with Visual Information
Recently, many works have been done to improve PDR with visual information. These visual signals include 2D images, depth images, binocular cameras, etc. Some use a camera and PDR combined for localization and tracking, designing a new visual detection and tracking system [19]. For wearable devices, Roggen et al. [20] used optical flow and PDR to help get the trajectory of movement. They also used the previous vision to build a visual circuit, which can be used on maps without priors. They focused on an algorithm to combine two localization result to get the right result, which increases the confidence in positioning results [21]. In addition, Yan et al. [22] used target detection to get the 3D positions of pedestrians, which assists PDR to achieve good positioning. Some works [23] use the matching between 3D and 2D for position correcting, where visibility and co-visibility information is adopted. The visual position corrects the PDR positioning error, which achieves good results. In [24], the authors proposed helping indoor positioning by combining sign recognition and DR positioning They focused on correcting PDR movements by visual information, thereby reducing cumulative errors. Meanwhile, we directly use visual position recognition to obtain the exact positioning results to assist the correction of PDR.
2.2. Visual Position Recognition
In recent years, with the development of deep learning technology, position recognition based on computer vision has made great breakthroughs. The visual place recognition technology is not limited by application scenarios, and can intuitively provide users their locations. Chen et al. [25] used pre-trained CNNs that are trained for objection detection to realize a position recognition task. Krizhevsky et al. [26] obtained better performance using ImageNet to extract features from images than methods of SIFT features in recognizing locations. Arandjelovic et al. [27] designed a new CNN architecture to train a place recognition task in an end-to-end manner; their method outperforms existing feature descriptors. Chen et al. [28] considered place recognition as a classification task and built a massive specific dataset for VPR. Most of the currently used VPRs are applied to outdoor scenes; however, indoor scenes have many feature points, and the features are more homogeneous. Therefore, we need to make special designs for VPR in this regard to adapt to indoor positioning.
3. Pedestrian Dead Reckoning
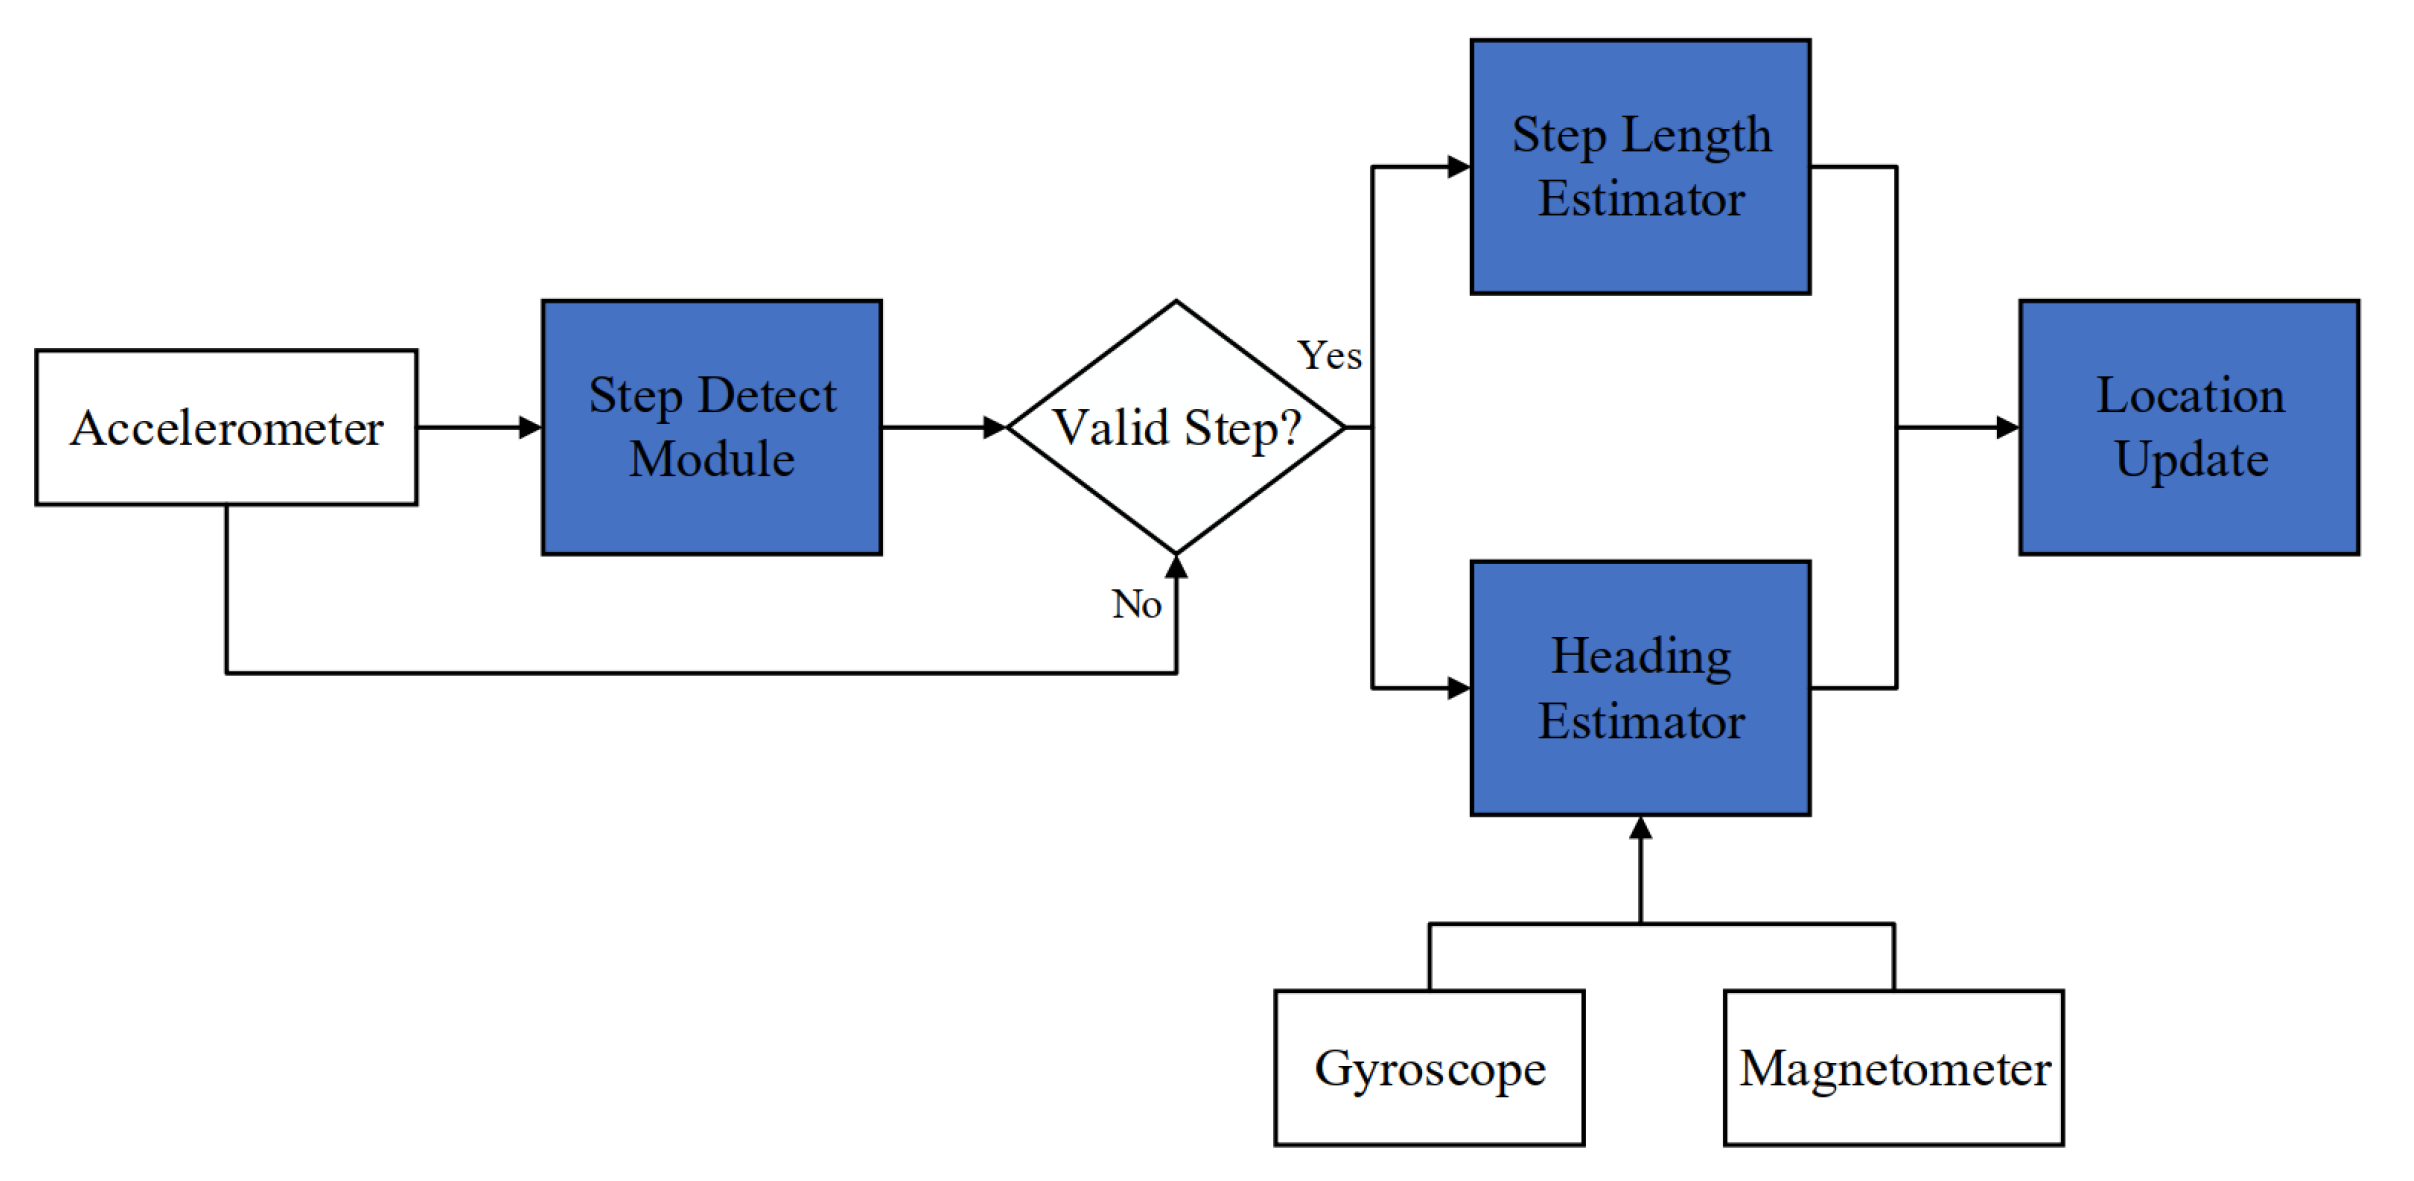
Pedestrian dead reckoning (PDR) is an independent positioning system that estimates locations of pedestrians using accelerometer, magnetometer and gyroscope. It consists of four modules: step detection, stride length estimation, heading calculation and location update. The workflow of PDR is shown in Figure 1.
After filtered to reduce noise and aligned over time, the sensor data are assigned to different modules. The step detection module makes a judgement of whether a step occurs according to the acceleration values. If a step does occur, the system runs the stride length estimation module and heading calculation module to estimate the step length and heading angle at this step. Then, a new location update process is performed. The specific location update method is demonstrated as the following equations:
where x and y are the coordinates of pedestrians, is the stride length and is the heading. The subscript denotes step k. We can derive that, under the condition that the initial position is known, locations can be estimated continuously according to Equation (1). The principles of step detection, stride length estimation and heading calculation are illustrated in the next sections.
3.1. Step Detection
Step detection is one of the three basic modules of PDR system. Only when determining the occurrence of one step does the system use the stride length estimation and heading calculation modules. Therefore, the step detection module plays an important role in PDR system. Usually, we determine whether a step occurs or not by detecting the periodicity of two-peaks oscillation of accelerations in the process of walking [29]. There are some common step detection methods: zero-crossing detection [30], peak detection [31] and autocorrelation [32]. To gain high robustness, we choose improved zero-crossing detection, which uses the amplitude of accelerations to make the judgement, as our step detection method. The amplitude of accelerations can be calculated by triaxial outputs of the accelerometer:
Then, we decide whether the step occurs according to the values of the interval between acceleration amplitude and the threshold and the time interval of two undetermined steps. The specific criteria are obtained by analyzing the waveform of accelerations, as shown in Figure 2.
- The peak value of acceleration amplitude is greater than the threshold, and the valley value is less than the threshold during the period of step k.
- The difference between the peak value of acceleration amplitude and the threshold in step k is within the restricted range. In addition, the difference between the threshold and the valley value of acceleration amplitude in step k is within the restricted range.
- The duration of step k is within the restricted range, which can be determined by the walking frequency.
With the restricted conditions above, the step detect module can eliminate the error steps introduced by perturbation of acceleration and gain a high accuracy in step counter.
3.2. Stride Length Estimation
In PDR system, the stride length estimation module takes the responsibility of estimating the step length of each step during the walking process. In a real scenario, the stride length of pedestrians varies from person to person and is also affected by stride frequency. Studies on stride length estimation mainly include empirical models related to pedestrian’s height [33], linear models related to walking frequency [34,35] and so on. Considering the influence of walking speed on step length, we establish a linear model related to step frequency and acceleration to estimate the step length. The linear model is shown in Equation (3).
where represents the step length, is the walking frequency and is the variance of accelerations. , , and are coefficients associated with pedestrians. is random noise. The parameters in this model are determined by fitting and analyzing the data collected offline. We measured the interrelationship between the stride frequency and stride length of different people, and fit the data using the data of a large number of people. Note that the fitting is a nearly linear experimental value and can be applied to most people.
3.3. Heading Calculation
The heading calculation module is the most important part of PDR. The inherent defect of PDR algorithm is the cumulative error, which is largely caused by the cumulative error of integrating the angular velocity measured by the gyroscope. In the actual walking process, accompanied by swings, the postures of the sensors do not always represent the forward direction of the pedestrian, which, if not corrected, would introduce additional error into the heading calculation. To solve this problem, PDR algorithm integrates the outputs of gyroscope, accelerometer and magnetometer to determine the posture of sensors and to correct the heading of pedestrians. Kalman filtering [36] and particle filtering [37] are often used in the PDR system as the fused heading calculation algorithms. In this paper, we propose a recursively weighted fusion heading calculation algorithm with small computation. Firstly, the gyroscope is used to get three postures, which are named as angle of pitch, angle of yaw and angle of roll. Then, the acceleration is used to correct the pitch angle and the roll angle, and the magnetometer outputs are used to correct the yaw angle, which is the heading of the pedestrian. The values of correction parameters in this algorithm are directly related to the accuracy of the sensors.
Our algorithm uses quaternions to settle the attitude of AHRS (Attitude and Heading Reference System) and get the attitude information of the sensors. According to the mechanism of PDR, the angular rate and the attitude quaternion at step are known, thus the updated attitude quaternion at step k can be obtained by solving the gradient of the attitude quaternion (Equation (4)).
The attitude angles can be calculated using Equation (5).
where is the yaw angle, is the pitch angle and is the roll angle.
In the navigation coordinate system, the gravity is a constant value, and, if the attitude matrix calculated by angular rate is accurate, it should be equal to the acceleration in the carrier coordinate system when projected onto it. Therefore, the inaccurate calculation of attitude matrix would inevitably lead to inconsistency of the outputs in the two coordinate systems. Thus, the gradient descent method can be adopted to minimize this inconsistency. When the loss function is zero, the error of the rotation matrix has been eliminated and an accurate attitude quaternion is obtained. The loss function of the attitude correction process is defined in Equation (6).
Thus, to solve this problem, we get Equation (7)
where is the Jacobian matrix of quaternions and is the error function.
The quaternion iteration equation represented by acceleration is shown in Equation (9).
Similar to the attitude correction by accelerations, we also adopt gradient descent method to achieve the purpose of correcting yaw angle of the attitude by minimizing the error between the yaw angle calculated by magnetic values and the yaw angle calculated by angular rates. Likewise, the loss function is defined in Equation (10).
The quaternion iteration equation represented by magnetic values is shown in Equation (11).
After correction of the fused attitude algorithm, the heading calculation module calculates a relatively accurate attitude of sensors and outputs accurate heading information to the location update module. All the necessary data for location update are obtained, thus the location update module can locate pedestrians continuously using Equation (1).
3.4. The Uncertainty of PDR
We test edour PDR system to estimate the performance of the PDR system. In the experiment, we tested the basic pedometer and positioning performance of the algorithm by holding a smartphone and walking clockwise along the pedestrian walkway back to the location near the starting point. The test results are shown in Figure 3.
In Figure 3, the red curve represents the actual route of pedestrian walking, while the black curve represents the pedestrian walking trajectory calculated by the PDR algorithm. The pedestrian walked for totally 55 m with 82 steps while the result of PDR is 81 steps. The distance between the end point of pedestrian position estimated by PDR and the end point of actual pedestrian position is 1.24 m, thus the positioning error is about 2.3% of the travel distance. The detailed results are shown in Table 1.
Due to the short walking distance of pedestrians and the accumulated error of inertial sensors during walking, it is foreseeable that, as the walking distance continues to increase, the positioning error of pedestrian dead reckoning will also gradually increase. In a short distance (about 50 m), the error is within 3%. This means that, in short-distance operations, we can regard the PDR algorithm results as correct. We need to find a way not to modify the PDR all the time, but only to modify the location after the PDR has been running for a long time.
4. Vision-Aided PDR System Design
In this section, we introduce our vision-aided PDR (V-PDR) system. Our system is dividid into two parts: one is the visual place recognition model and the other is focusing VPR with PDR. The architecture of the proposed V-PDR system is exhibited in Figure 4.
4.1. Visual Place Recognition
The main task of VPR is to find a similar image in the image dataset search by comparing the images with the stored database to find out where the image is located. The algorithm diagram is shown in Figure 5. The main steps of visual place recognition are:
- Extract features from the location image in the original map library, and establish a feature vector dataset.
- Extract the feature vector of the image to be predicted in the same way.
- Compare the feature vectors in the dataset and the feature of the image to be predicted by the method and select the location corresponding to the most similar feature vector as the predicted value.
To assist PDR system to get better positioning performance, in this paper, we train a VPR network for indoor scenes. The following subsections present the structure of our VPR network, training process, ranking search algorithm and the results of place recognition.
4.1.1. Design of VPR Network and Training
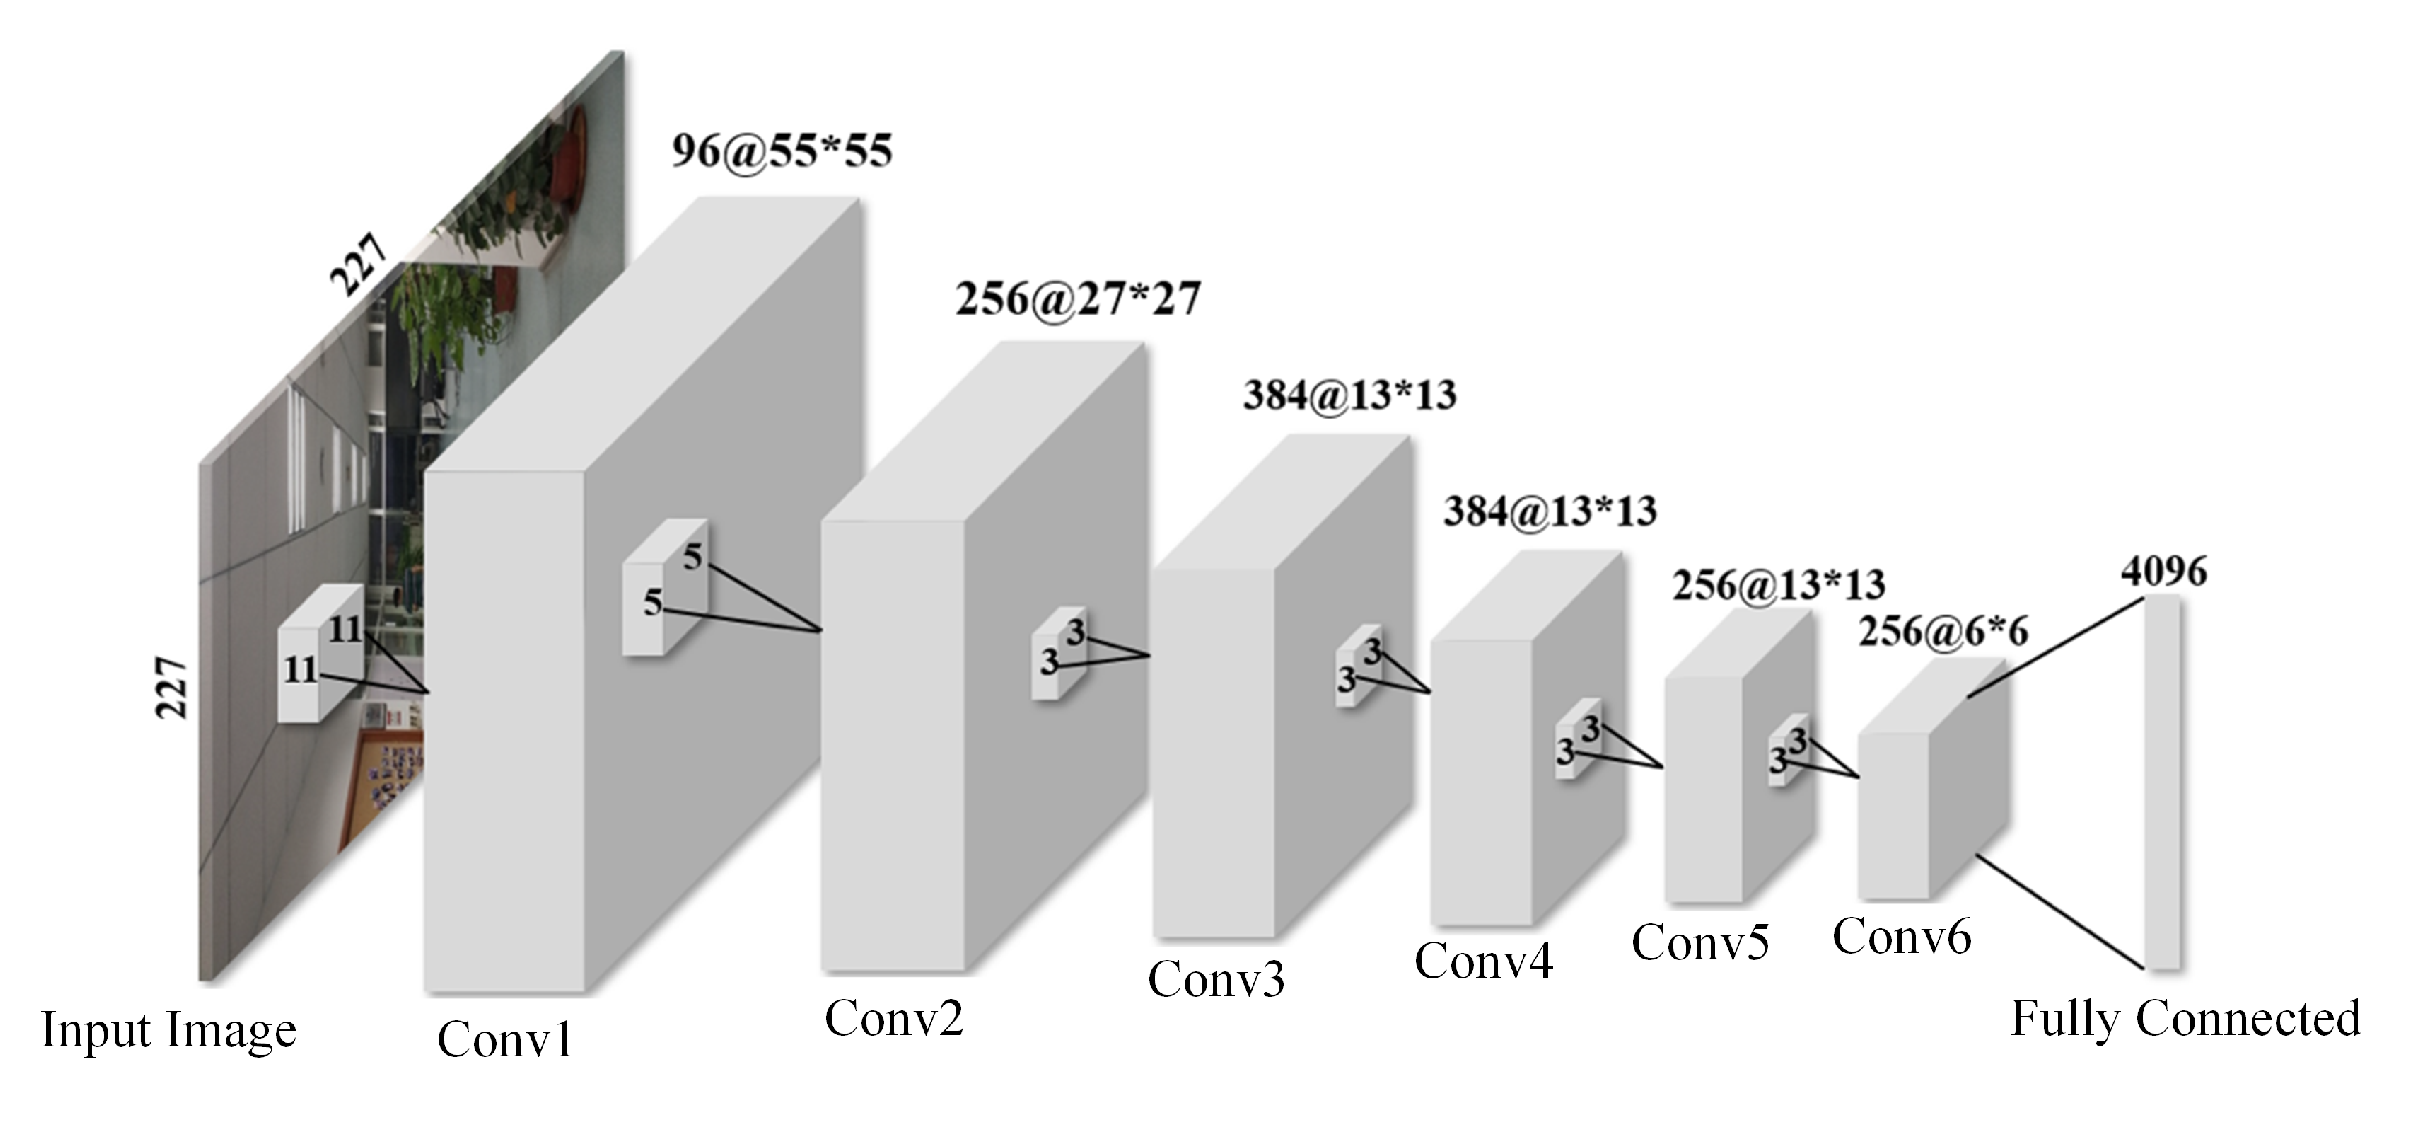
Considering the real-time positioning and the simplicity of the device, it is not possible to use too complicated neural networks for the VPR here. The construction of a VPR network consists of two parts: design of structure and training of parameters. For the purpose of learning deep visual features to make exact matching, six convolution layers are used to learn enough deep features, and these features are combined by the fully connected layer. The activation function ReLu follows the convolution layer, and the max-pooling is selected. The structure of our CNN architecture is shown in Figure 6.
A classification model is not used here because classification models need to fine tune to the different datasets in other places, which is impossible in practical use. Thus, we use metric learning as our VPR backbone network to train our VPR model. In the training process, RGB images with three-dimensional location labels of any size are resized i to . Small blocks with size of are extracted from the resized images and then flipped horizontally to increase total data amounts, which helps to overcome overfitting. The parameters are trained by hard triplet loss gradient descent method and back propagation mechanism. The triplet loss function can be expressed as Equation (12).
where the first item is the Euclidean distance between the positive and the anchor and the second item is the Euclidean distance between the negative and the anchor. serves as a margin parameter. means the max distance between negative and positive queries. The purpose is to make the feature vectors of the same places more similar and make the distance between feature vectors in different places as large as possible.
Note that, because this is not a classification model but an encoder that encodes the image into the feature vectors, it can be used directly without modification for other scenes. In any scenario, this neural network can encode images into 4096-dimensional vectors. Vectors encoded by the same neural network will have the same feature extraction method, thus the encoding of similar images will be similar, and the encoding difference of different images will also be very large. Thus, when this network is used in other scenarios, no secondary training is required.
4.1.2. Ranking Search
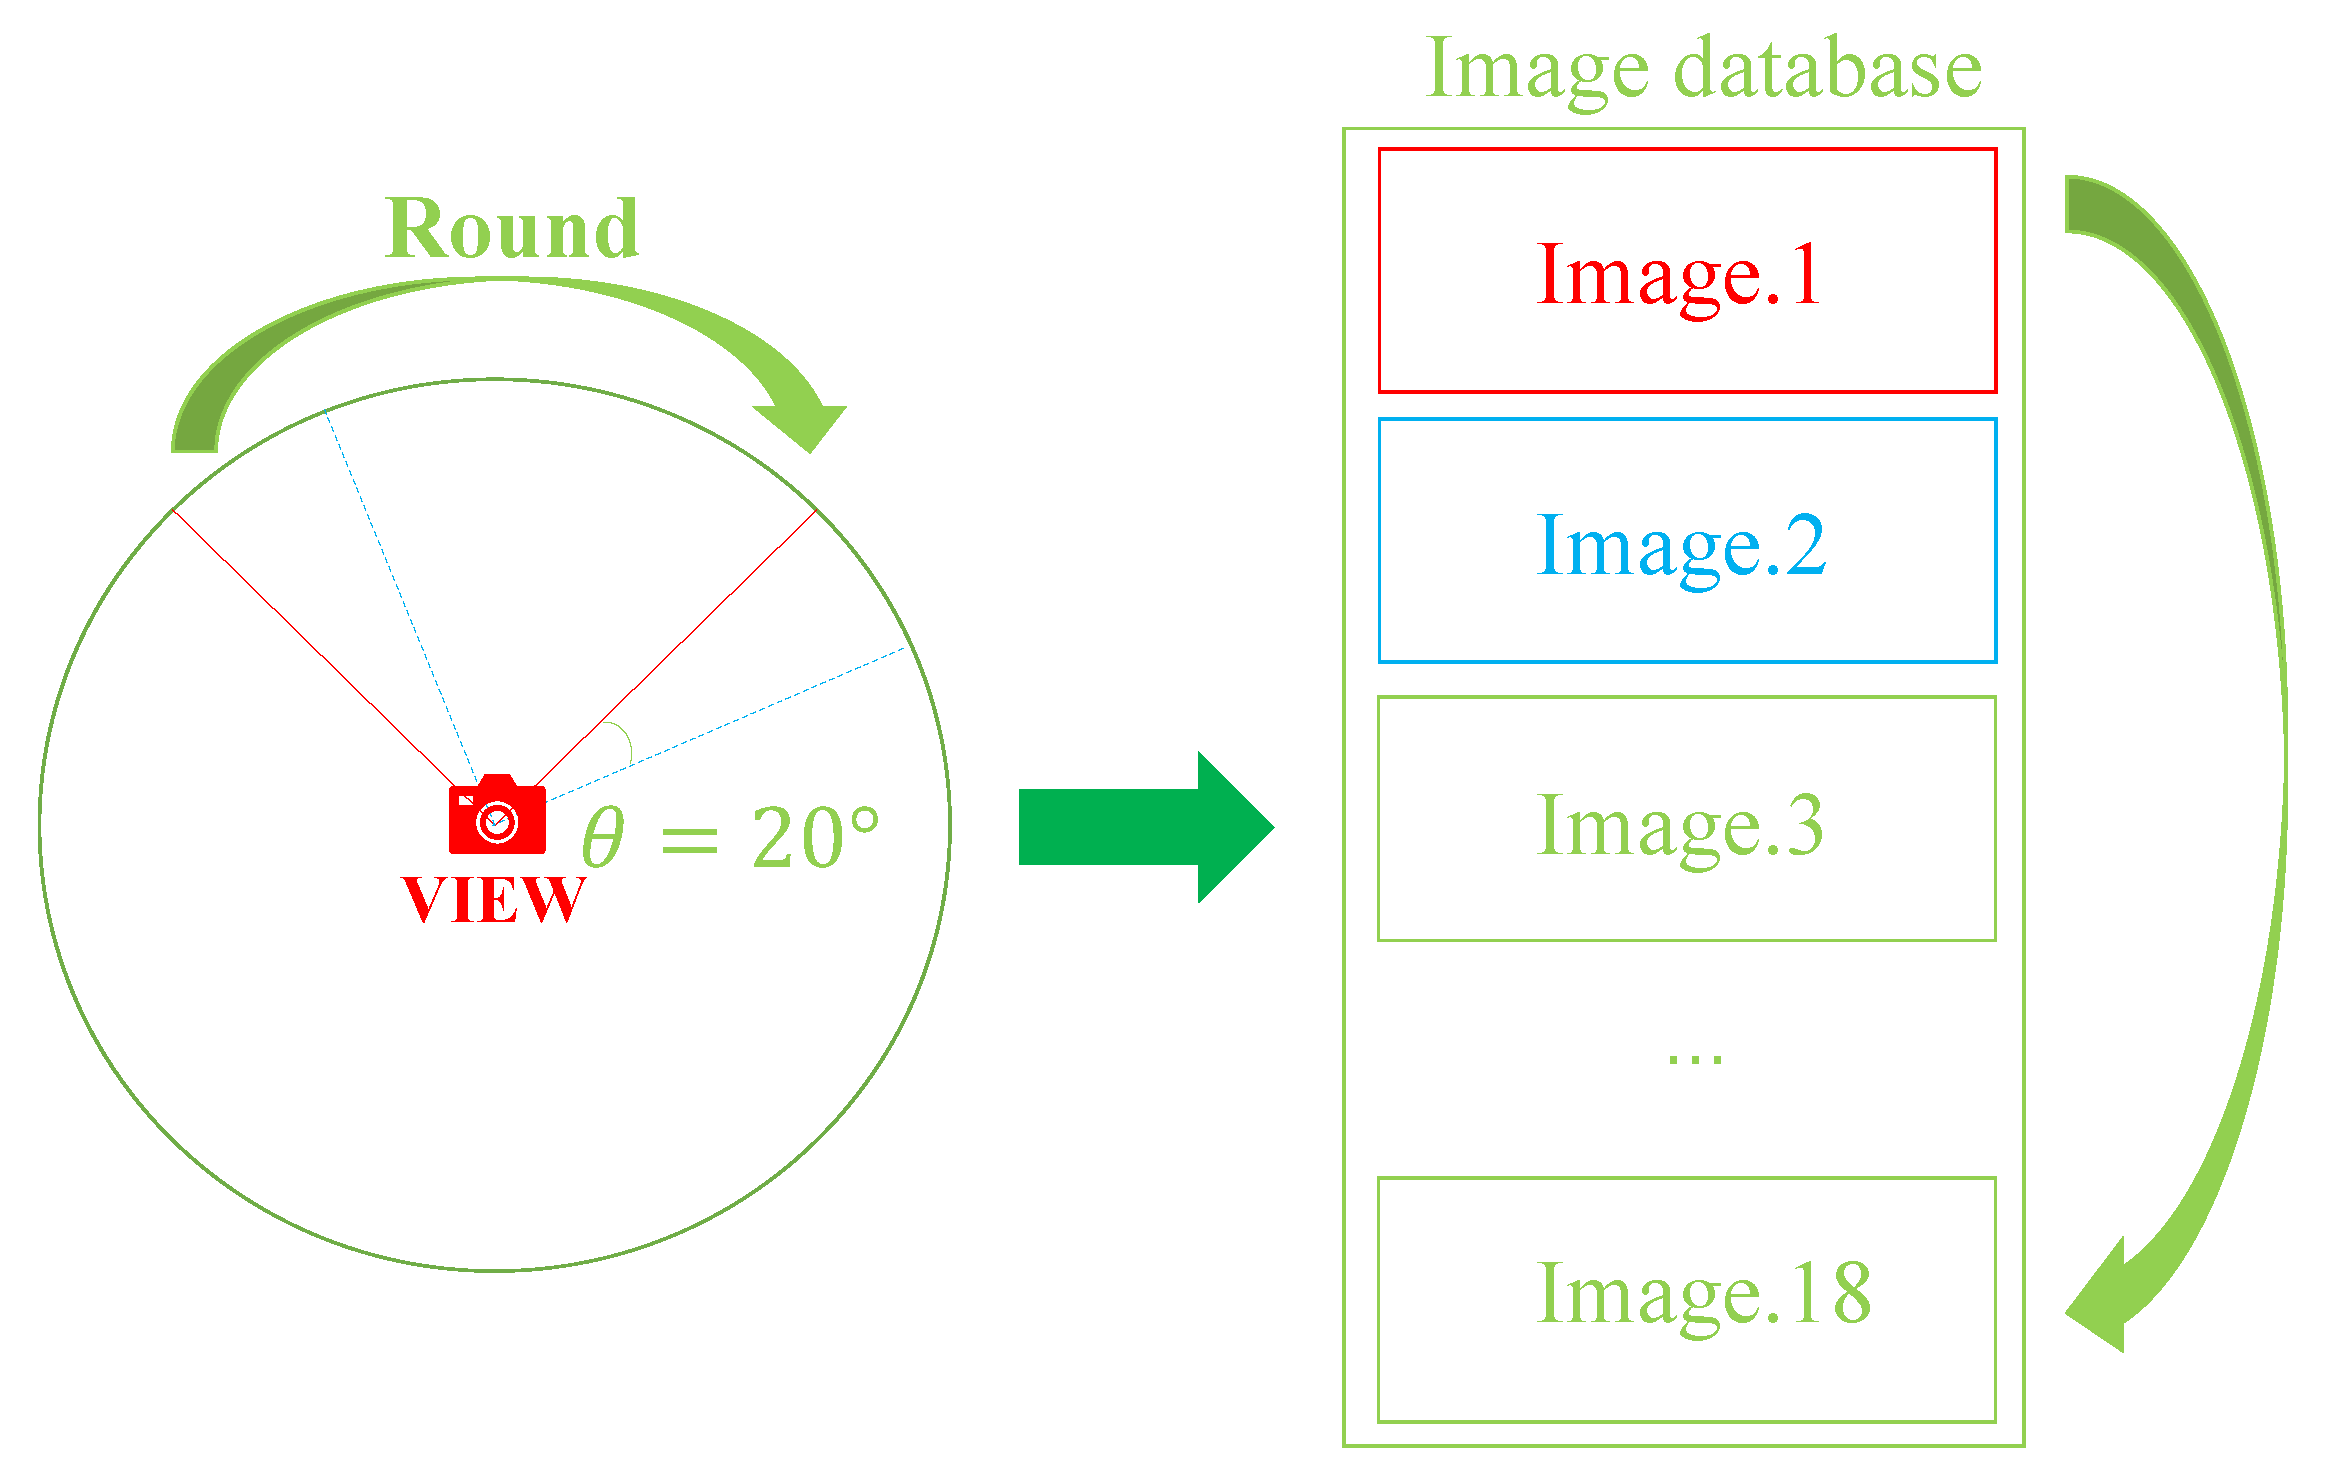
To find the most similar location, because the same location can be viewed from different perspectives, our database needs to store images of different perspectives for the same location for searching [38]. Here, photos are stored every 20 degrees for a location, with a total of 18 images in one location. The image acquisition method is shown in Figure 7.
Every time a photos is searched, its encoding o is compared with the images in the database. For the same place, the similarity in a certain direction is the greatest, and the side angle is similar to the picture to be compared, but it is lower than the opposite angle. In this way, if there are multiple pictures of the same location and different angles in the search list in Recall@10 (R@10 denotes the top ten database candidates), then it can increase the certainty of the exact location and angle in this way, which reduces accidental location errors. According to this method, the positioning recognition rate of the image can be enhanced.
4.1.3. Location of VPR
From the input image with size of , images are extracted with size of , flipped horizontally and then inputted into the trained network to get 4096-dimensional feature vectors. Before VPR is used, it is necessary to build an image vector dataset. When obtaining the images used for testing V-PDR, we extracted these images into the feature vector dataset. The vector dataset consists of the feature vectors of images and their labels. The labels are built for where the image is obtained. The images with the highest similarity are found by comparing the Euclidean distances between feature vectors and vector dataset. The location of the image is obtained by weighing the recognition results of these inputs. If the location of Recall@1 is not searched in the image from other angles in Recall@10, such locations are ignored. The most probable location is the VPR result. As for heading direction, the VPR direction is the most probable heading direction.
4.2. Vision-Aided PDR Fusing
In the case where the PDR positioning result is accurate in a short period and there is a cumulative error in long-term use, we can trust the PDR positioning information and only correct the position by VPR after the person has walked for a while. Since PDR and VPR are two independent systems, the purpose of fusion is to use VPR positioning results to provide absolute position reference information for PDR, without involving the exchange of internal information between the two systems. Therefore, loose coupling is adopted to achieve the fusion positioning of PDR and VPR.
The architecture of the proposed V-PDR system is exhibited in Figure 4. The system consists of three parts: data obtain and process, location and fusion. The first part is a layer of raw data acquisition and processing. In this part, input images shot by cameras on the smartphone cannot be used directly. Since these images are too large, it would take a long time to process them in neural networks directly. Besides, the images would be affected by the ambient light, thus other preprocessing is needed. These images are sent to the VPR system after some operations: resizing, translating and reversing. In this way, the images are suitable for neural network processing and some environmental impacts are reduced. The data of sensors acquired by accelerometer, gyroscope and magnetometer in the smartphone are passed to PDR system after being filtered. The second part is called location, which means using the input data to finish positioning. Obviously, it is the most important part of V-PDR. The algorithm for location by PDR and VPR is shown in Section 3 and Section 4.1, respectively. Fusion is the third part and optimization and improvement of positioning results are achieved in this stage.
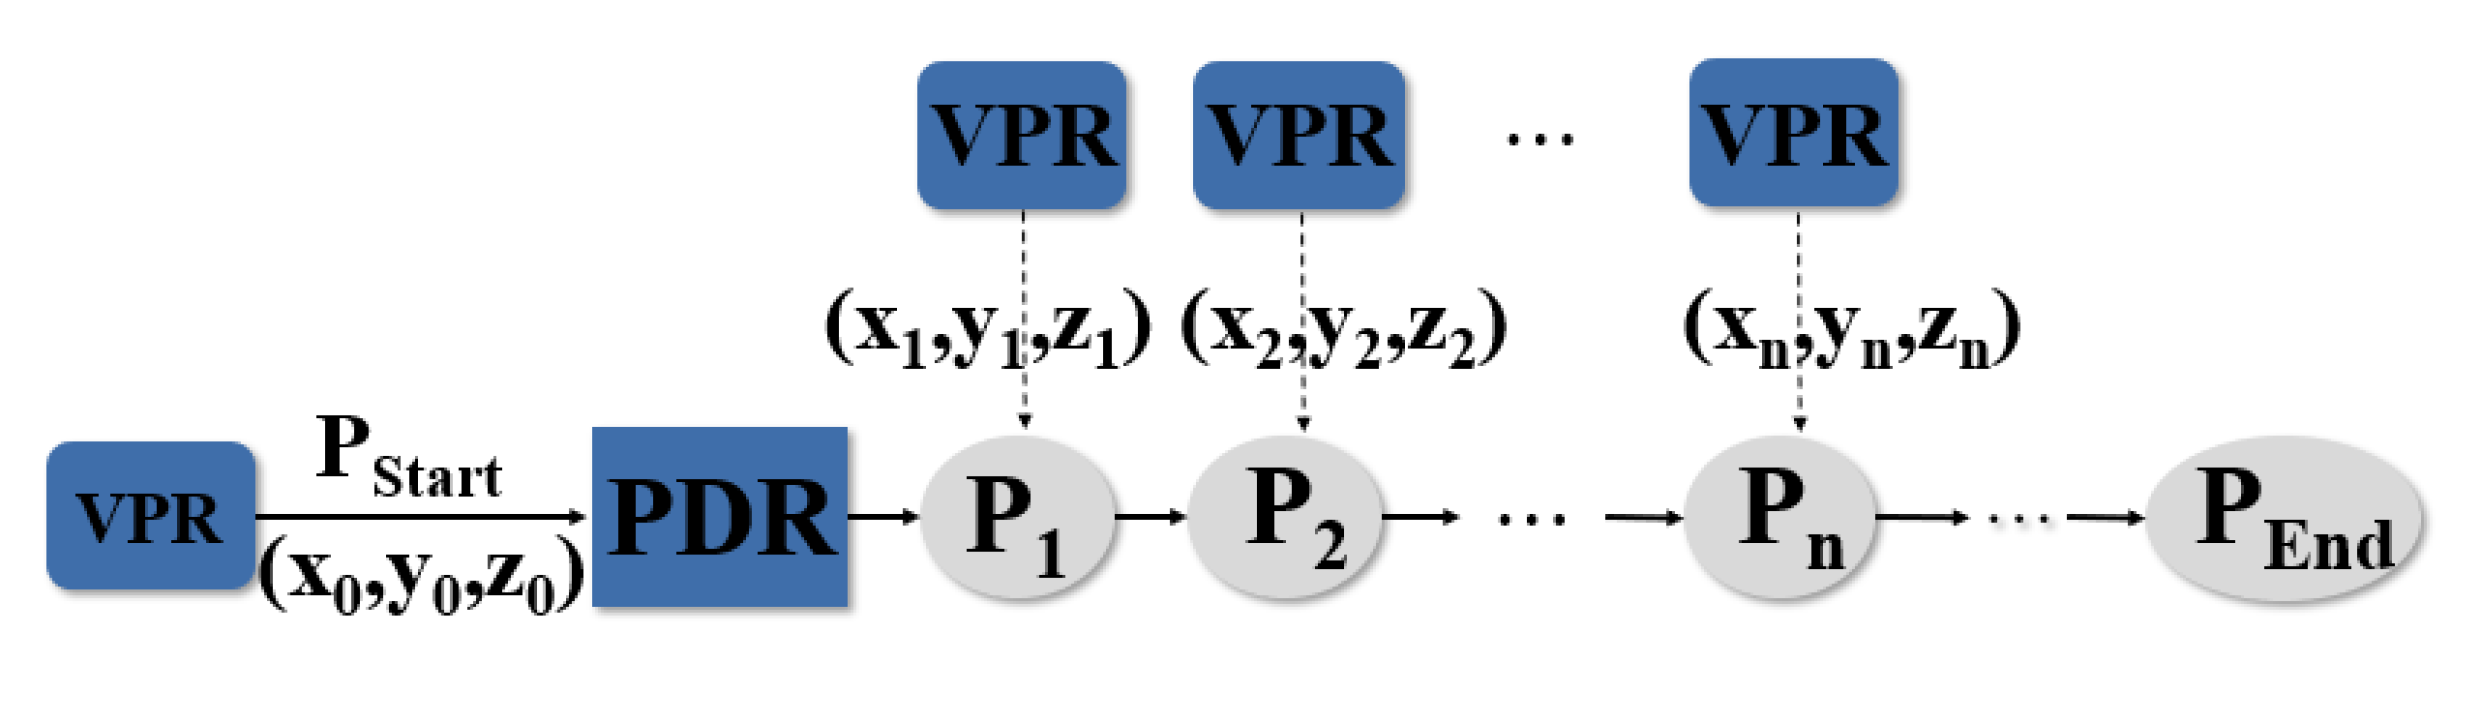
When positioning, the VPR system and the PDR system independently produce positioning results. The PDR position result is , while the VPR position result is . Due to the PDR making no correction to changes in floors, the weighted average of the positions obtained is:
where and obey the rules:
The weight selection method related to the positioning errors of the PDR and VPR systems determines the weighting factors in the weighted average fusion algorithm by analyzing the positioning errors of the PDR and VPR systems. Subsystems with larger positioning errors have lower reliability and have less weight in the fusion system; subsystems with smaller positioning errors have higher reliability and have greater weight in the fusion system. In the indoor environment, the positioning error of PDR is about 3%. The positioning error of VPR is related to the construction of the local dataset. The distance between each location is about 1 m, and the positioning error of VPR is within 0.5 m. Therefore, the value of the weight in the weighted average algorithm is determined by the positioning performance of PDR and VPR.
where is the PDR position result at K and is the start or the last correction location. It corrects the location only when the distance between the estimated result of PDR at time k and the last correction point is between the thresholds and or the positioning result of VPR at time k changes in height compared to the positioning result at time .
where the thresholds and are related to the positioning accuracy corrected by experiment.
As mentioned above, when working for long periods, the accumulative error leads to a decrease in positioning accuracy of PDR system. It is difficult for PDR to make reasonable estimates when spatial position changes. Focusing on these problems, we propose a solution by means of using VPR network to correct the localization results of PDR. VPR is called every 5 m or after going around a corner. The detailed fusion algorithm is shown in Algorithm 1.
where means the predicted location at time t, means the location and direction predicted by VPR and the location predicted by PDR is . is the setting threshold, obtained by correcting the median of Recall@1 in the test dataset. p is the probability of the top VPR location and and are the setting location values. The values of and were obtained through experiments. The function is shown above.
| Algorithm 1 Measure the location at time t |
| Require: Picture in the facing direction |
| = |
| while do |
| Turn right for 20 degrees and get new picture |
| = |
| end while |
| while do |
| Get a new picture in the facing direction |
| = |
| if then |
| end if |
| end while |
| return |
First, the starting point of PDR is determined by VPR. If the probability , the starting point is . If not, then turn right for 20 degrees until . When the VPR performs well, it locates the position while turning around. If it does not perform well, it moves 0.5 m in a random direction for new positioning and infer the positioning at this step based on the relationship between the previous positioning and the movement calculated by PDR. Then, it repeats the steps above until the initial positioning is obtained. Then, PDR enters working state and starts to continuously update locations of pedestrians.
In the process, the pedestrian pauses to take images of a place, and VPR processes these images to get reasonable location coordinate to correct the location estimated by PDR. When the confidence of the positioning given by VPR is higher than the threshold , and the positioning result is within the distance between the previous correct positioning result and the PDR detection, we confirm that the positioning of VPR is accurate. Then, we judge the difference between PDR and VPR positioning. If the distance between results of VPR and PDR is between thresholds and , the PDR positioning result is chosen to be the location. If not, the location is corrected to the VPR location, as the PDR has a large offset. When the confidence of VPR positioning is less than the threshold , or the distance between new positioning result and previous correct positioning result is more than the PDR detection distance, we regard the VPR result as incorrect and then locate the new place only by PDR. In the V-PDR, we determined the value of thresholds and through extensive experiments. The threshold was set as 0.6. After the correction, more accurate locations are estimated by V-PDR. There is no special requirement for selecting correction points, but VPR should be used after pedestrians crossing floors. The whole localization process of V-PDR is shown in Figure 8.
For location identification across floors, a new decision mechanism needs to be added here. The VPR location labels include the location in one floor and which floor it is. Besides, areas where floor transitions may occur are labeled. Note that the floor change here involves the floor change of stairs and elevators. A simple PDR system cannot judge the change of floors, thus the VPR positioning result is used for floor prediction. In addition, the scenes of the stairwell and the elevator doorway on each floor are probably similar; thus, the VPR cannot be identified only once. When entering the area where the floor may change, a new judgment mechanism is added. VPR judgment is performed here multiple times. Only when three consecutive floors are on the same floor does it judged that the floor has changed. With the above algorithm, the V-PDR can be used to solve the accumulative error due to PDR not being able work in a three-dimensional environment.
When there is a large error in PDR or VPR, it can be corrected by posterior. Only when is the PDR corrected. This is already a correction process for outliers to ensure that the system positioning is not affected when the error is too large. Especially when abnormal conditions occur, to obtain reliable positioning results, the posterior needs to be processed in the subsequent positioning. Three consecutive VPR positioning distances and PDR measured distances are judged to determine whether there is an error.
Through Equation (17), whether outliers appear can be judged. If a positioning error occurs, the VPR is called multiple times in a short period during the operation. If Equation (17) holds, the positioning is corrected to the current positioning. With this method, rare errors are corrected. Note that all this is based on the fact that our PDR and VPR accuracy is high enough.
5. Experiments and Results
The proposed fusion positioning system was tested in typical indoor scenarios. To verify the advantages of the proposed V-PDR algorithm compared with the traditional PDR algorithm in indoor positioning and to verify the feasibility of the V-PDR algorithm in three-dimensional space, the experiment was divided into two parts. The first was to verify the effectiveness of our proposed VPR model in indoor positioning. The second was to verify the advantage of the proposed V-PDR model compared to the traditional PDR model, which included comparing the positioning results between the V-PDR and PDR algorithms during driving and verifying that our V-PDR algorithm works properly in a cross-floor environment.
5.1. VPR Test Result
Our network training process was performed on an GTX1080Ti GPU. The margin parameter was set to 0.2. We trained the model for 40 epochs, the learning rate was for the first 15 epochs, and was reduced by 90% every 15 epochs. The training was carried out on the Indoor Scene Recognition dataset [39], which contains 67 indoor categories and a total of 15,620 images. All images are in jpg format and there are at least 100 images per category in the dataset. It took about 8 h for training.
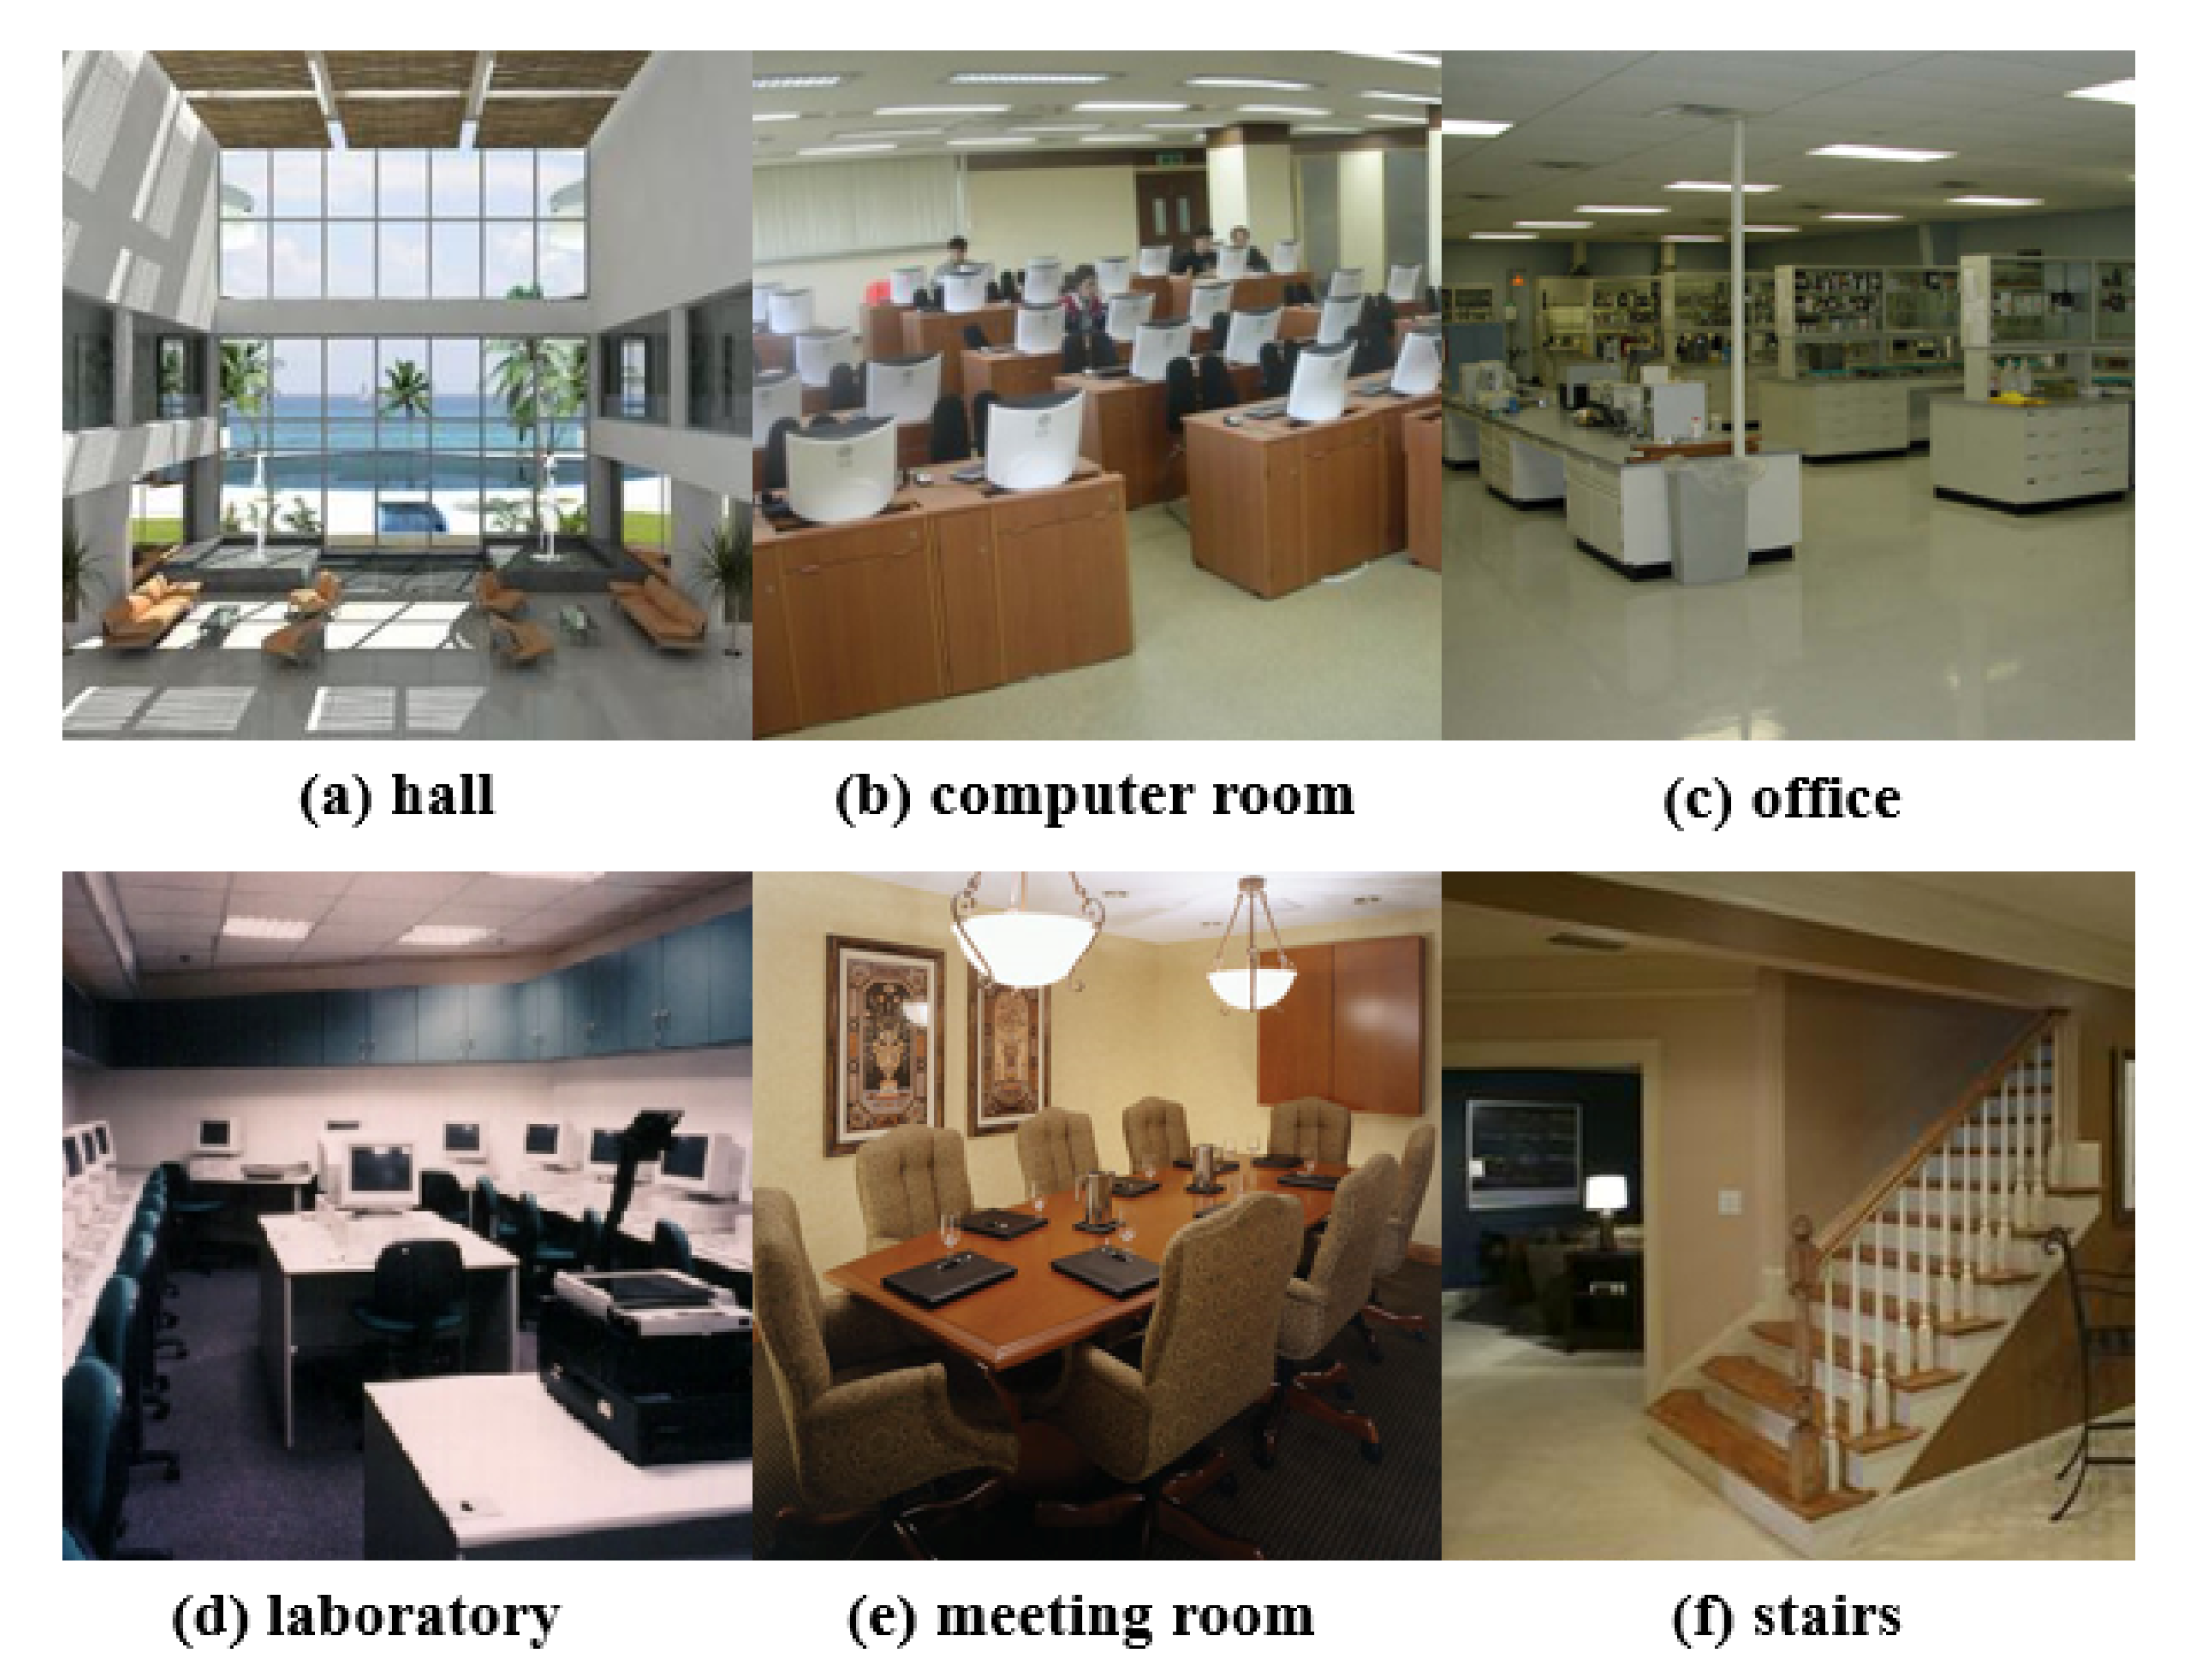
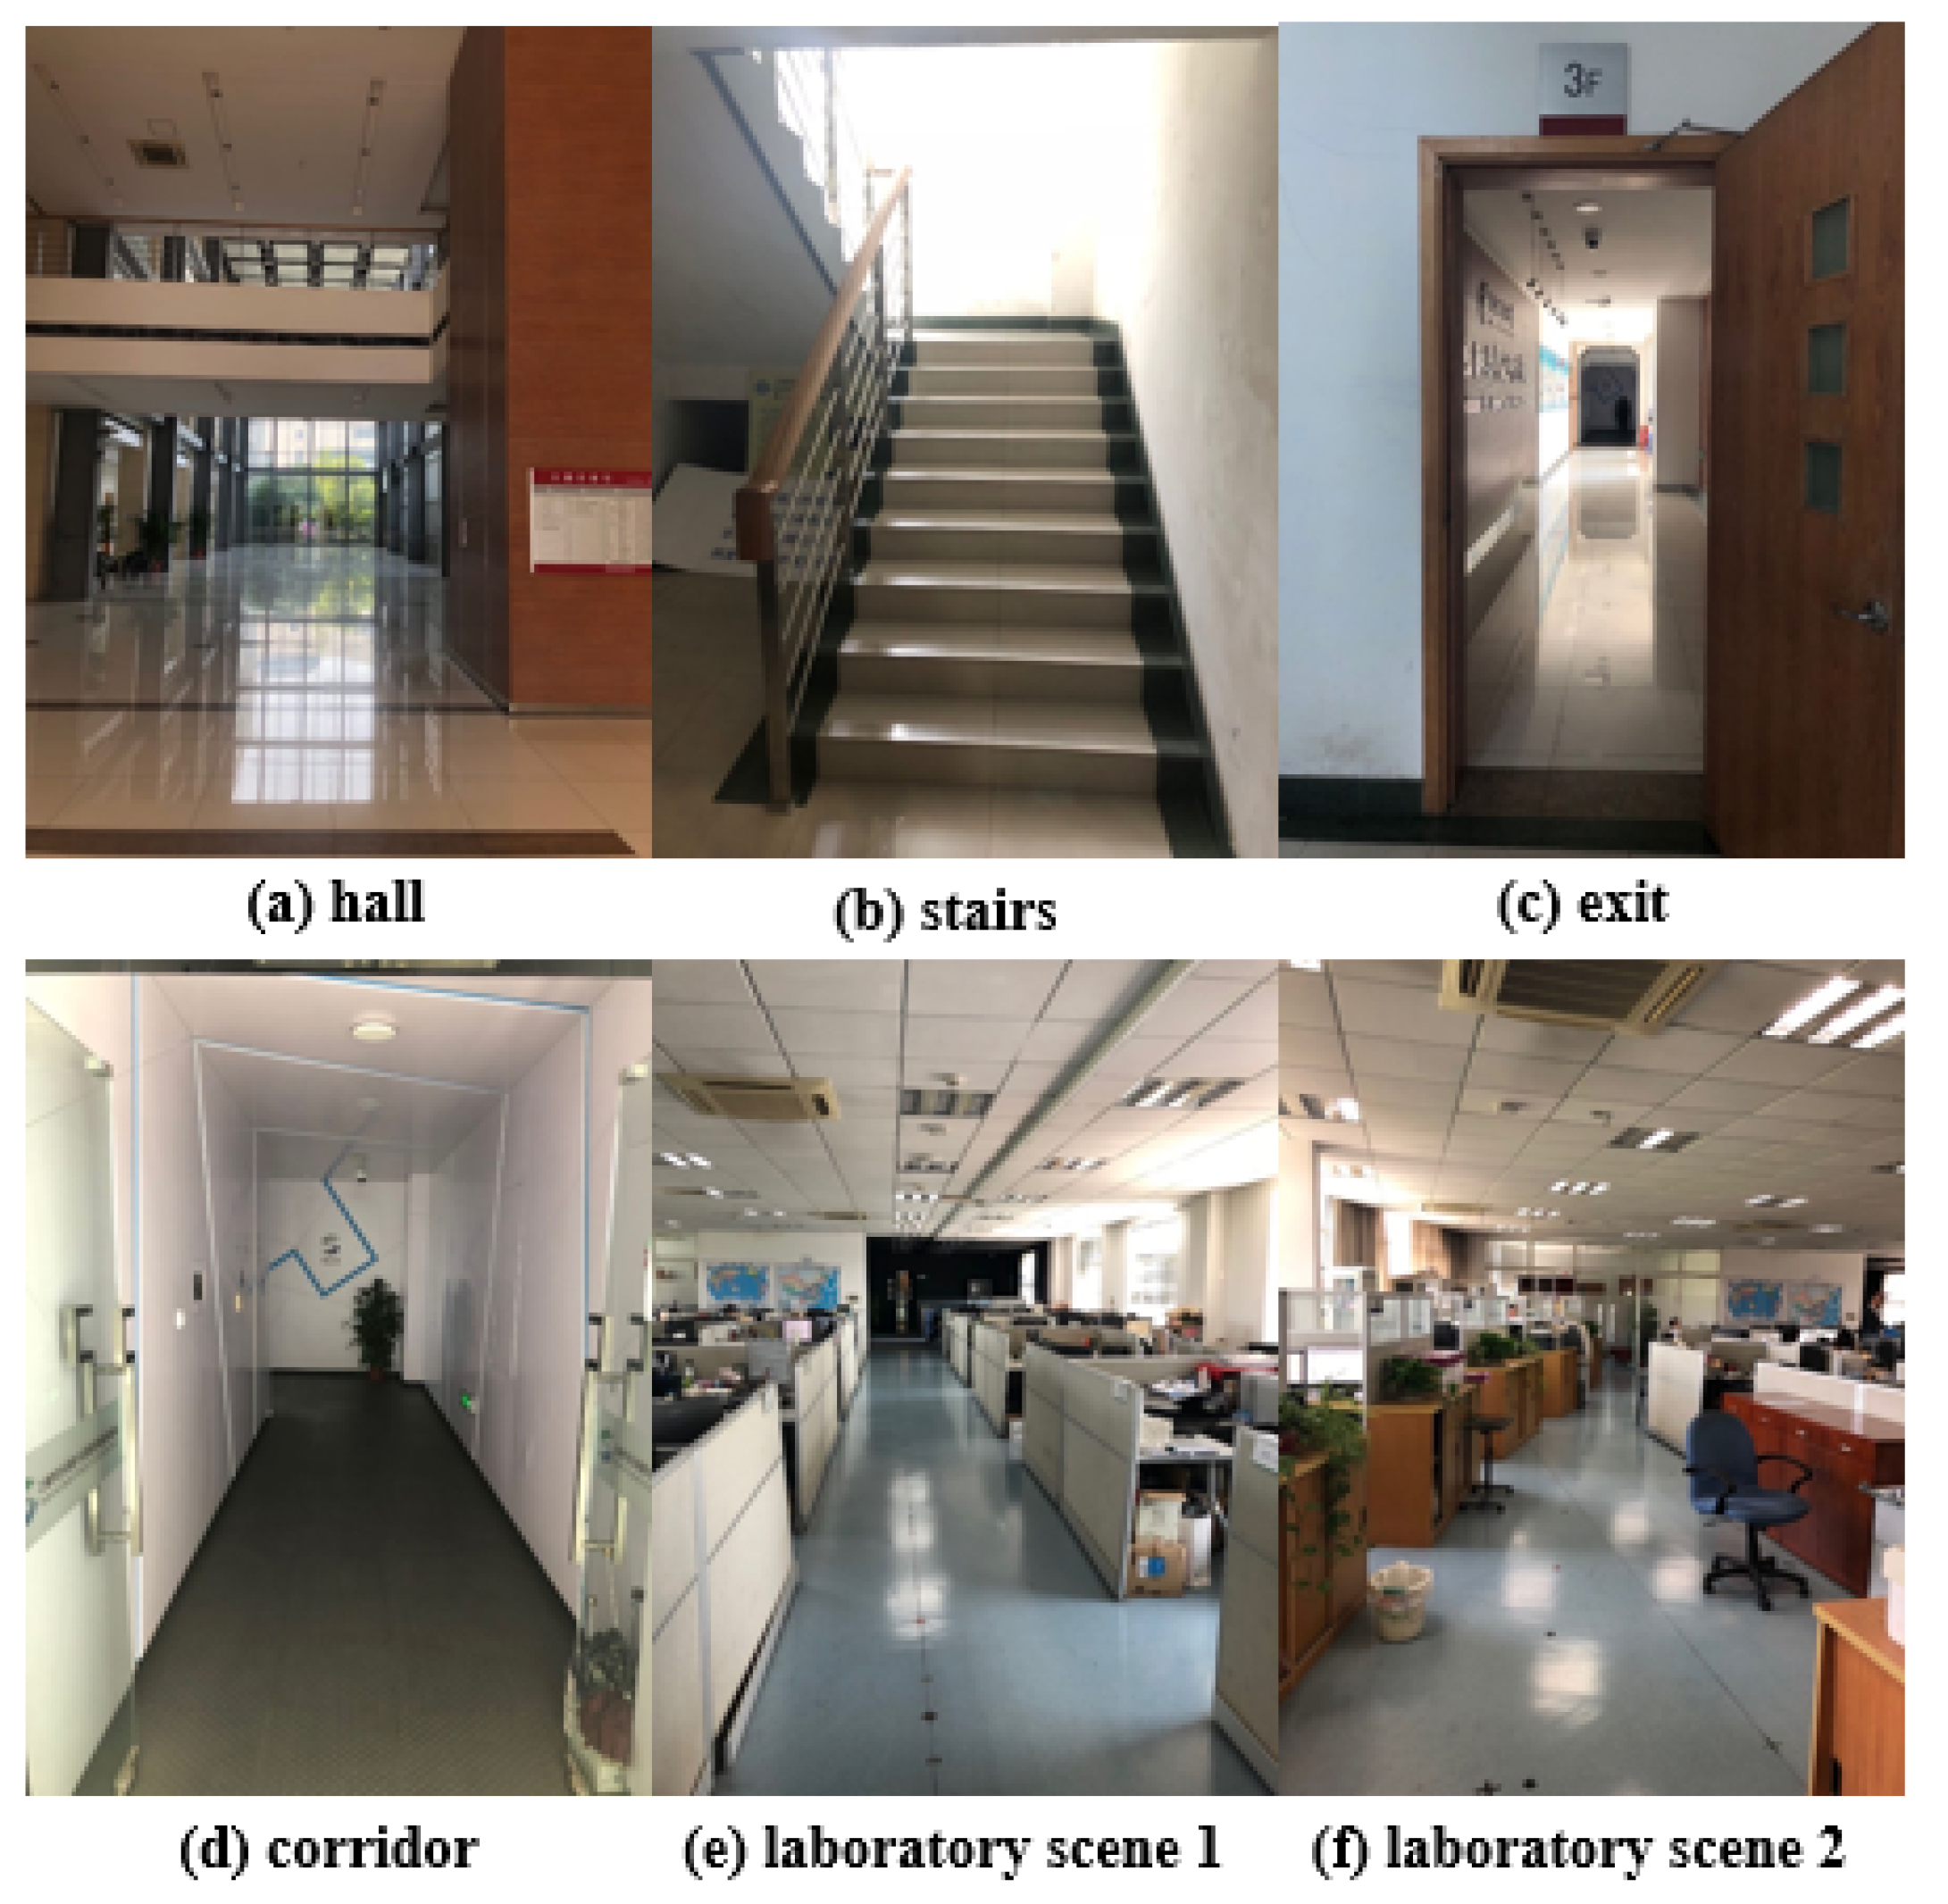
After the network was trained, it was necessary to test the model to see if the trained model is accurate enough to adapt to the V-PDR algorithm. We made two tests, respectively, on a subset of the training dataset and a dataset of our laboratory. In the experiment, we set the doorway as the origin, and east and north as the x-axis and y-axis. Note that, in actual use, since the location does not need to know the actual height but only the actual floor information, the 3D location information can be directly used as the label. In addition, we set the floor as the z-axis. Then, every location was set to a point with its location coding (x, y, z). Every 1 m we set a point. In every point, we obtained 18 images every 20 degrees. Note that, each image of one degree in different point was in the same direction. Overall, we obtained a dataset consisting of 36 locations and 648 images. In this way, the vector dataset was composed of the vectors and their labels, which consisted of location and direction. Sample images of the Indoor Scene Recognition and our laboratory datasets are shown in Figure 9 and Figure 10, respectively.
Finally, we performed VPR model test experiments on indoor datasets and photos collected in our laboratory. First, images were extracted into the vector. After that, we compared the vector similarity in the vector dataset to check whether the predictions are correct. We used the Recall@1 to show the accuracy. As for indoor datasets, we used the test dataset for testing. For our laboratory dataset, a subset of the images we obtained was used for testing.
The VPR model obtains a result of a Recall@1 (@1 denotes one of top database candidates) of 80% on the Indoor Scene Recognition dataset and a recall@1 of near 92% on our laboratory. Note that the scenes in the Indoor Scene Recognition dataset are more complex than those in our laboratory. Some scenes are very similar, thus it performs worse than it in our laboratory. Performing VPR positioning once takes about 1.3 s. Since the VPR is only called occasionally, the speed is acceptable.
Analyzing the results in our laboratory dataset, we can find that good positioning results can be achieved for most images. However, for a few locations with incorrect positioning, it can be found that most of their positioning errors are due to the low similarity of all the images, even as low as 20%, resulting in inaccurate positioning. Such positioning errors can be repaired in subsequent V-PDR without affecting the overall positioning. Through testing, we found that our VPR model can identify the location well. This VPR is effective enough for our V-PDR algorithm. It is used as an intermittent auxiliary positioning and can be well adapted to actual use.
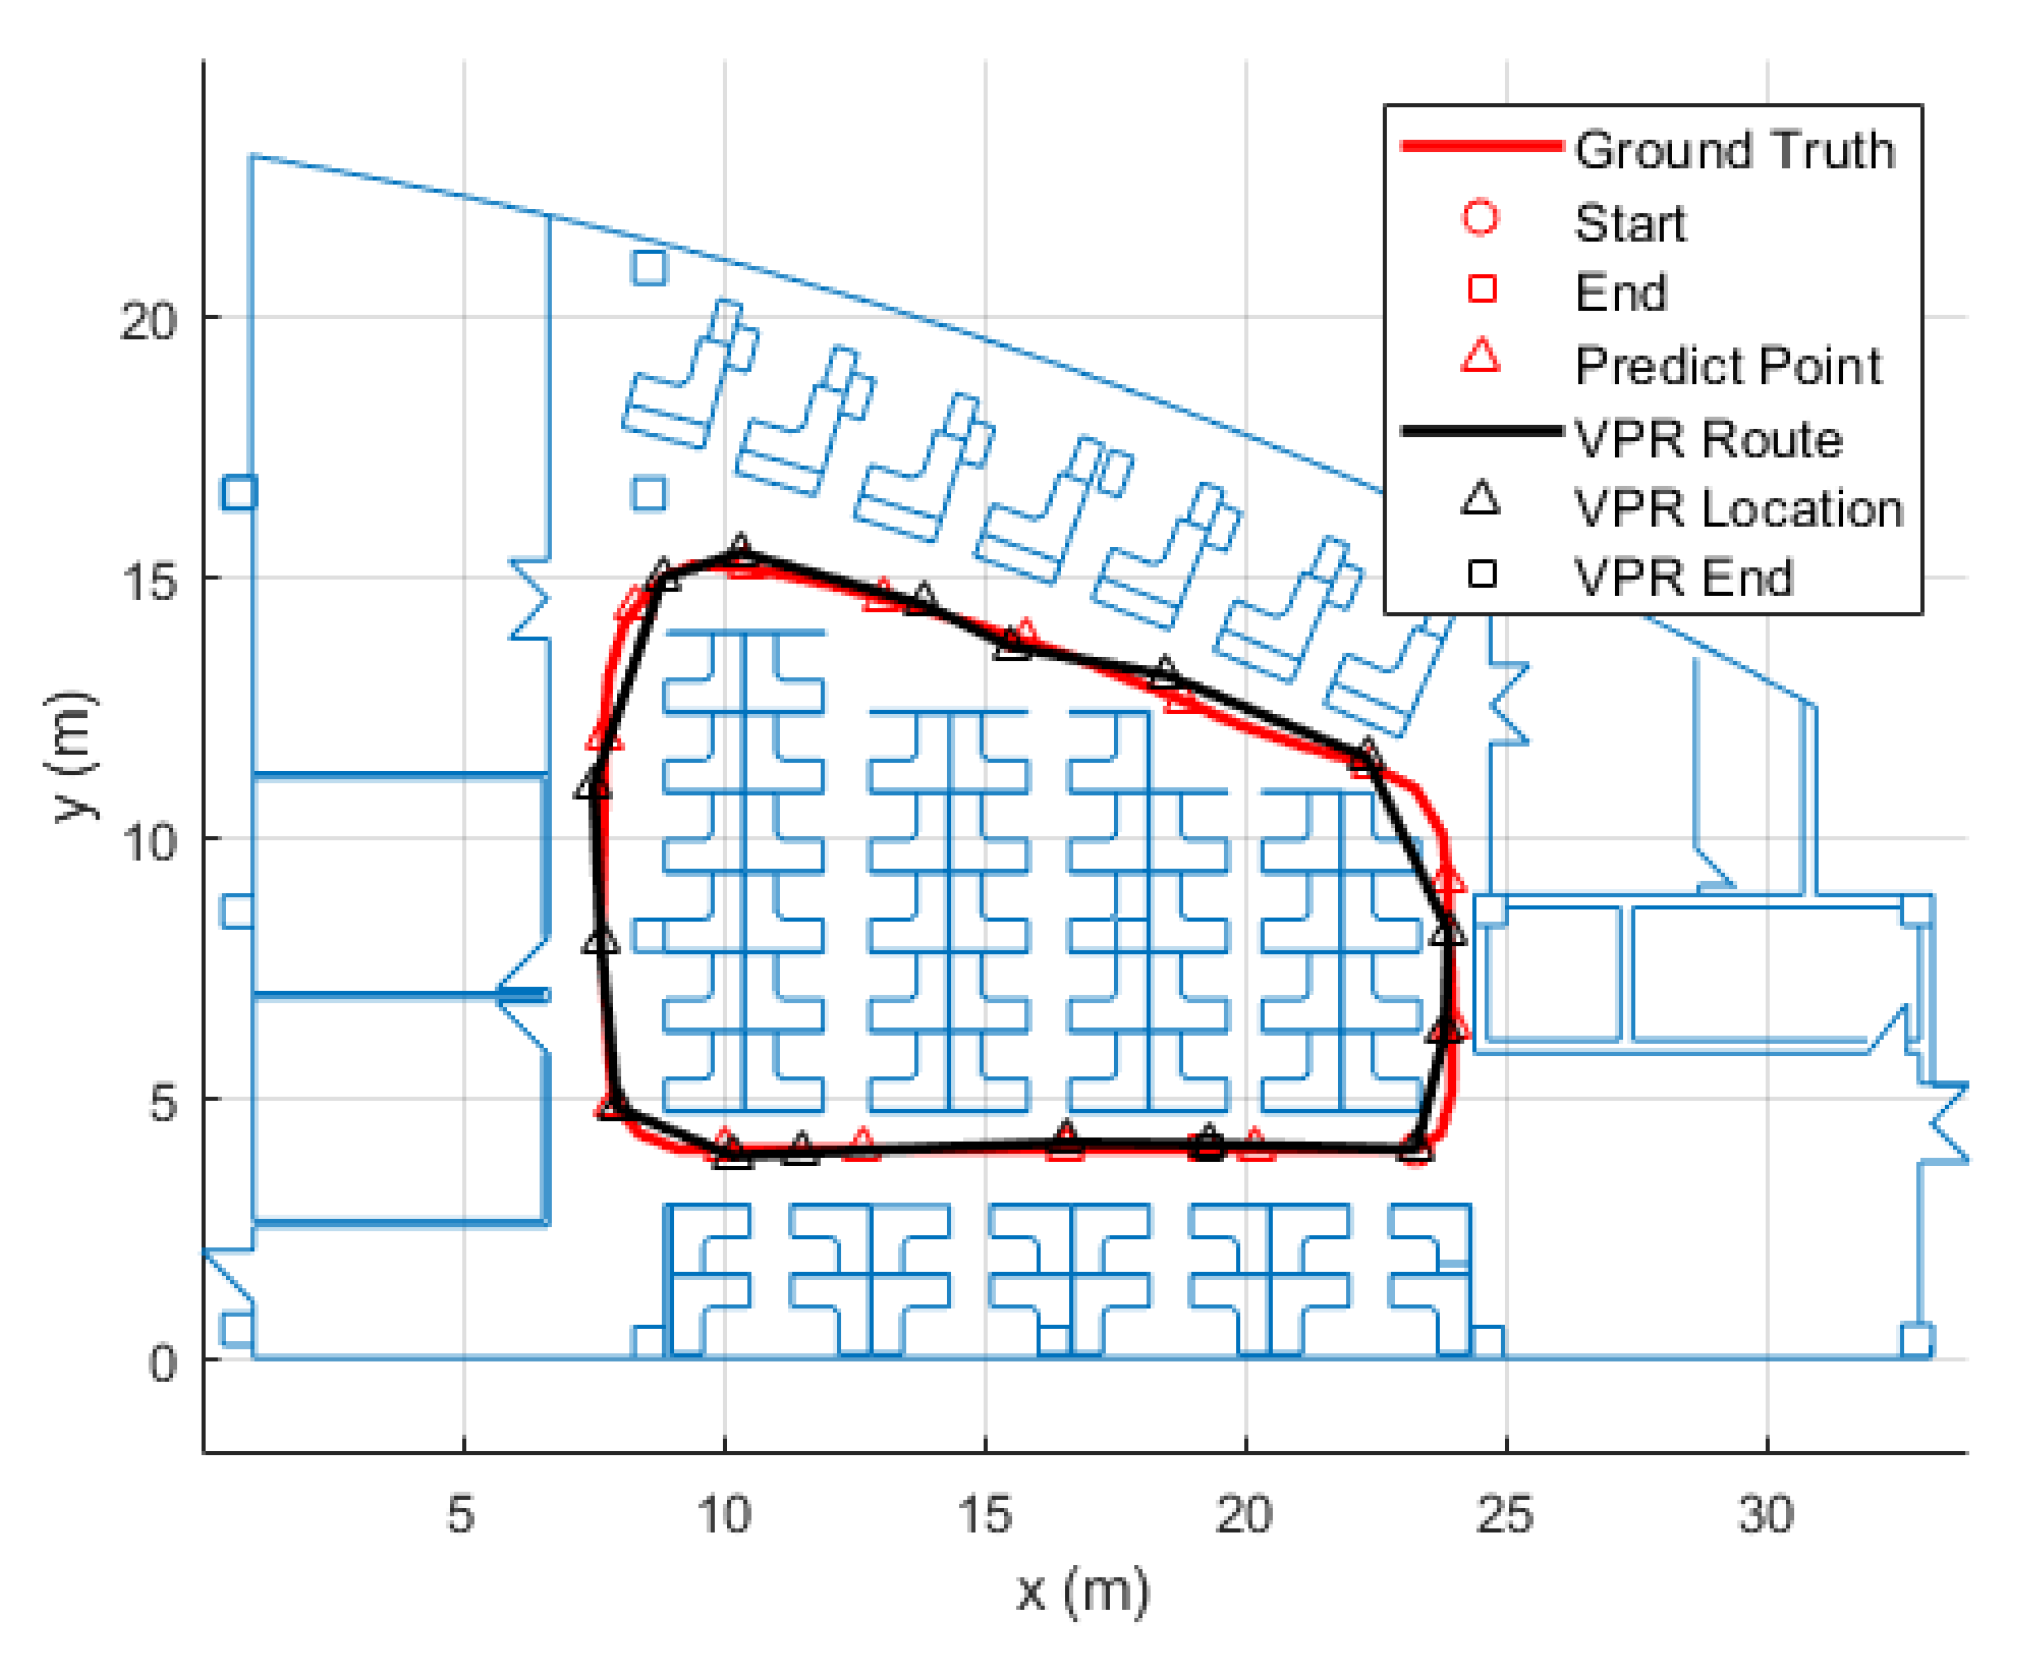
In addition, we performed an experiment to show the error between VPR route and the ground truth to show the VPR problems. We walked around our laboratory. For VPR positioning, in the experiment, the VPR worked for about 3 m walking, and the location is where the image is most similar. The positioning line is regarded as a walking path. The results are shown in Figure 11.
In Figure 11, the ground truth is shown in red while the VPR route is in black. The red triangle is where we used the VPR to locate while the black triangle is the location predicted by the VPR. We can observe that the VPR works well as the location predicted is not far from the ground truth. The average VPR location error is about 0.45. Since the images dataset is discrete, there are some errors in the VPR location. Therefore, VPR can only obtain approximate positioning results but not completely accurate positioning results. In addition, VPR predicts a point, and a continuous walking path cannot be obtained. It cannot be correctly positioned in the place without the images. In summary, it is difficult for VPR to perform independent and accurate positioning, and other algorithms are required to correct the VPR.
5.2. V-PDR Testing Result
We performed our V-PDR experiments, which were divided into two parts. One was to show the ability of V-PDR to correct PDR cumulative errors, and the other was to test the ability of V-PDR to work in a three-dimensional environment. Experiments were conducted in our laboratory building and the ground truth was obtained by laboratory engineering drawings and high-precision measurement tools. The accuracy comparison test was conducted on the third floor and the total length of the route was about 64 m. The three-dimensional localization ability test of V-PDR was executed from the first floor to the third floor and the total length of this test route was about 120 m, not including the climbing process. The experiments were performed on an Android phone. We wrote a software application on a mobile phone for VPR and PDR. Every step, we took a photo with the mobile phone, the photo was transported to the cloud server for VPR localization and the software processed the data of PDR and VPR our algorithm.
The first experiment was performed on the third floor of our laboratory. We tested PDR and V-PPR with the same phone. We randomly specified a location as the starting point, and then randomly moved. After walking for a period of time, we obtained the relative motion path of the PDR. The V-PDR was tested through the same path to obtain the absolute position path of the V-PDR at the same time. Then, the paths were compared with the high-precision measurement path to analyze the results of our algorithm. The comparison results include maximum error, mean error, and 95% situation error. Maximum is the maximum location error distance in the experiment and the mean error is the average error for the path. The 95% situation error is the least 95% error in the experiment, which shows the effect for most locations.
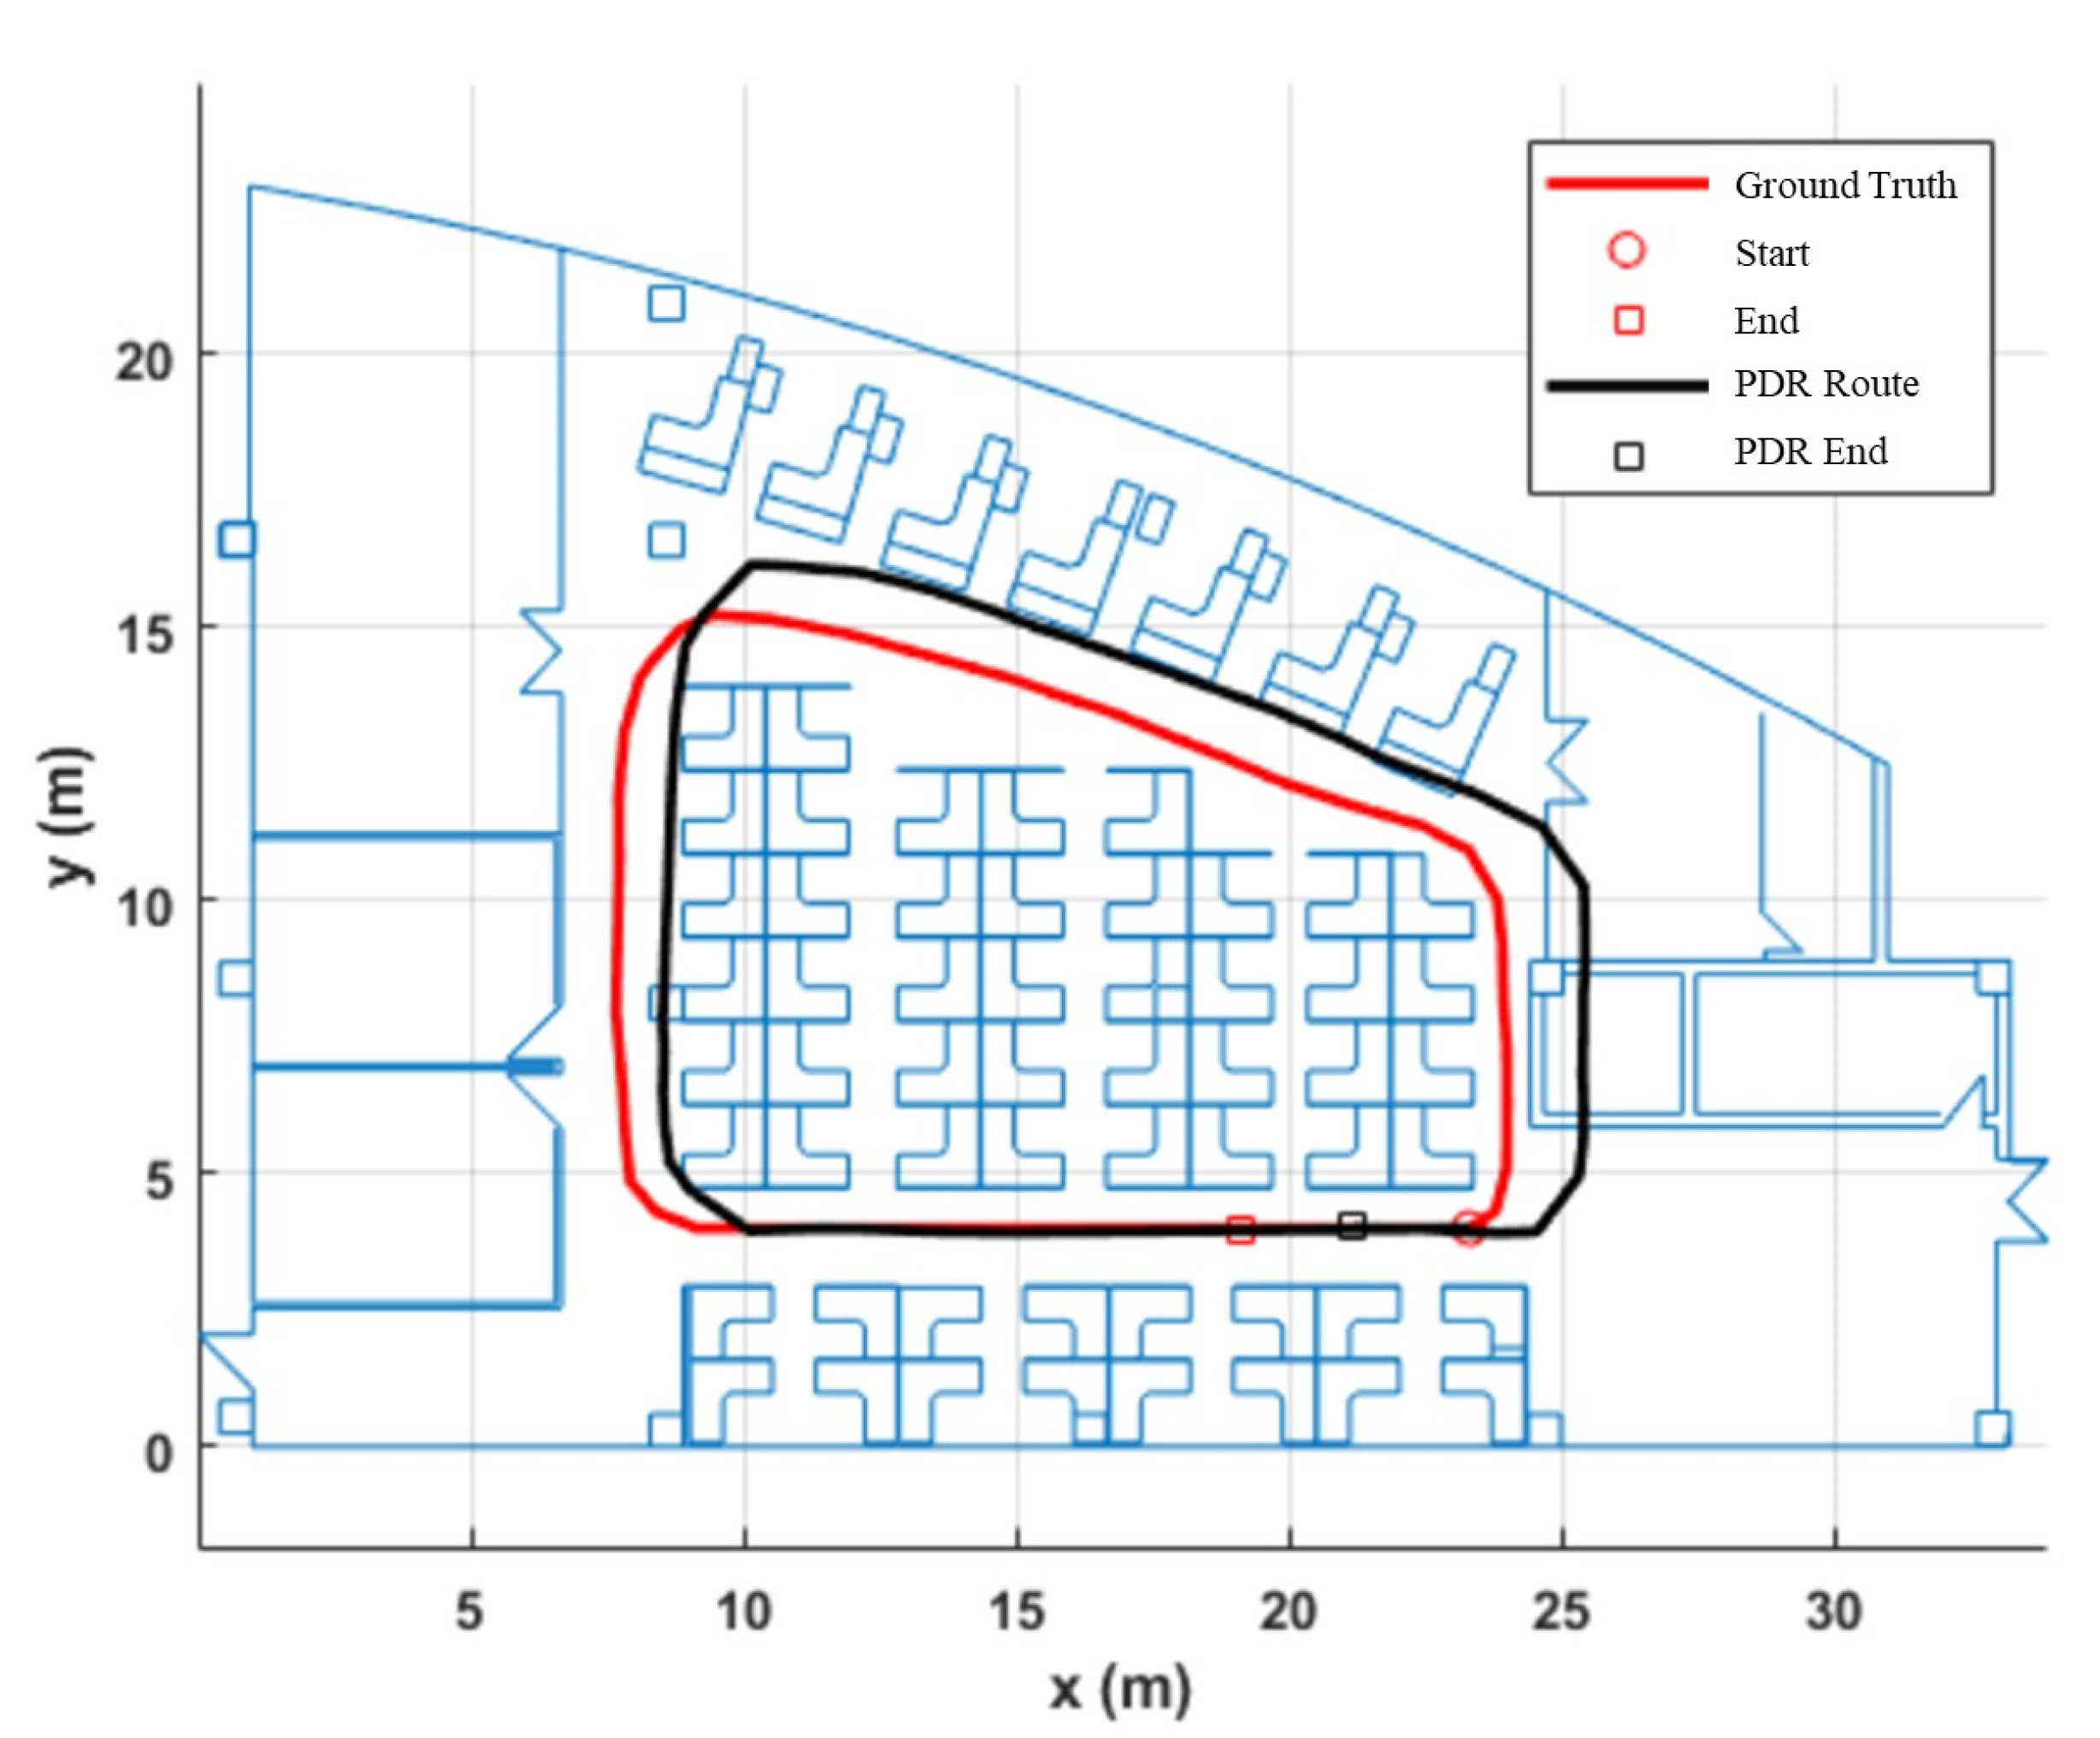
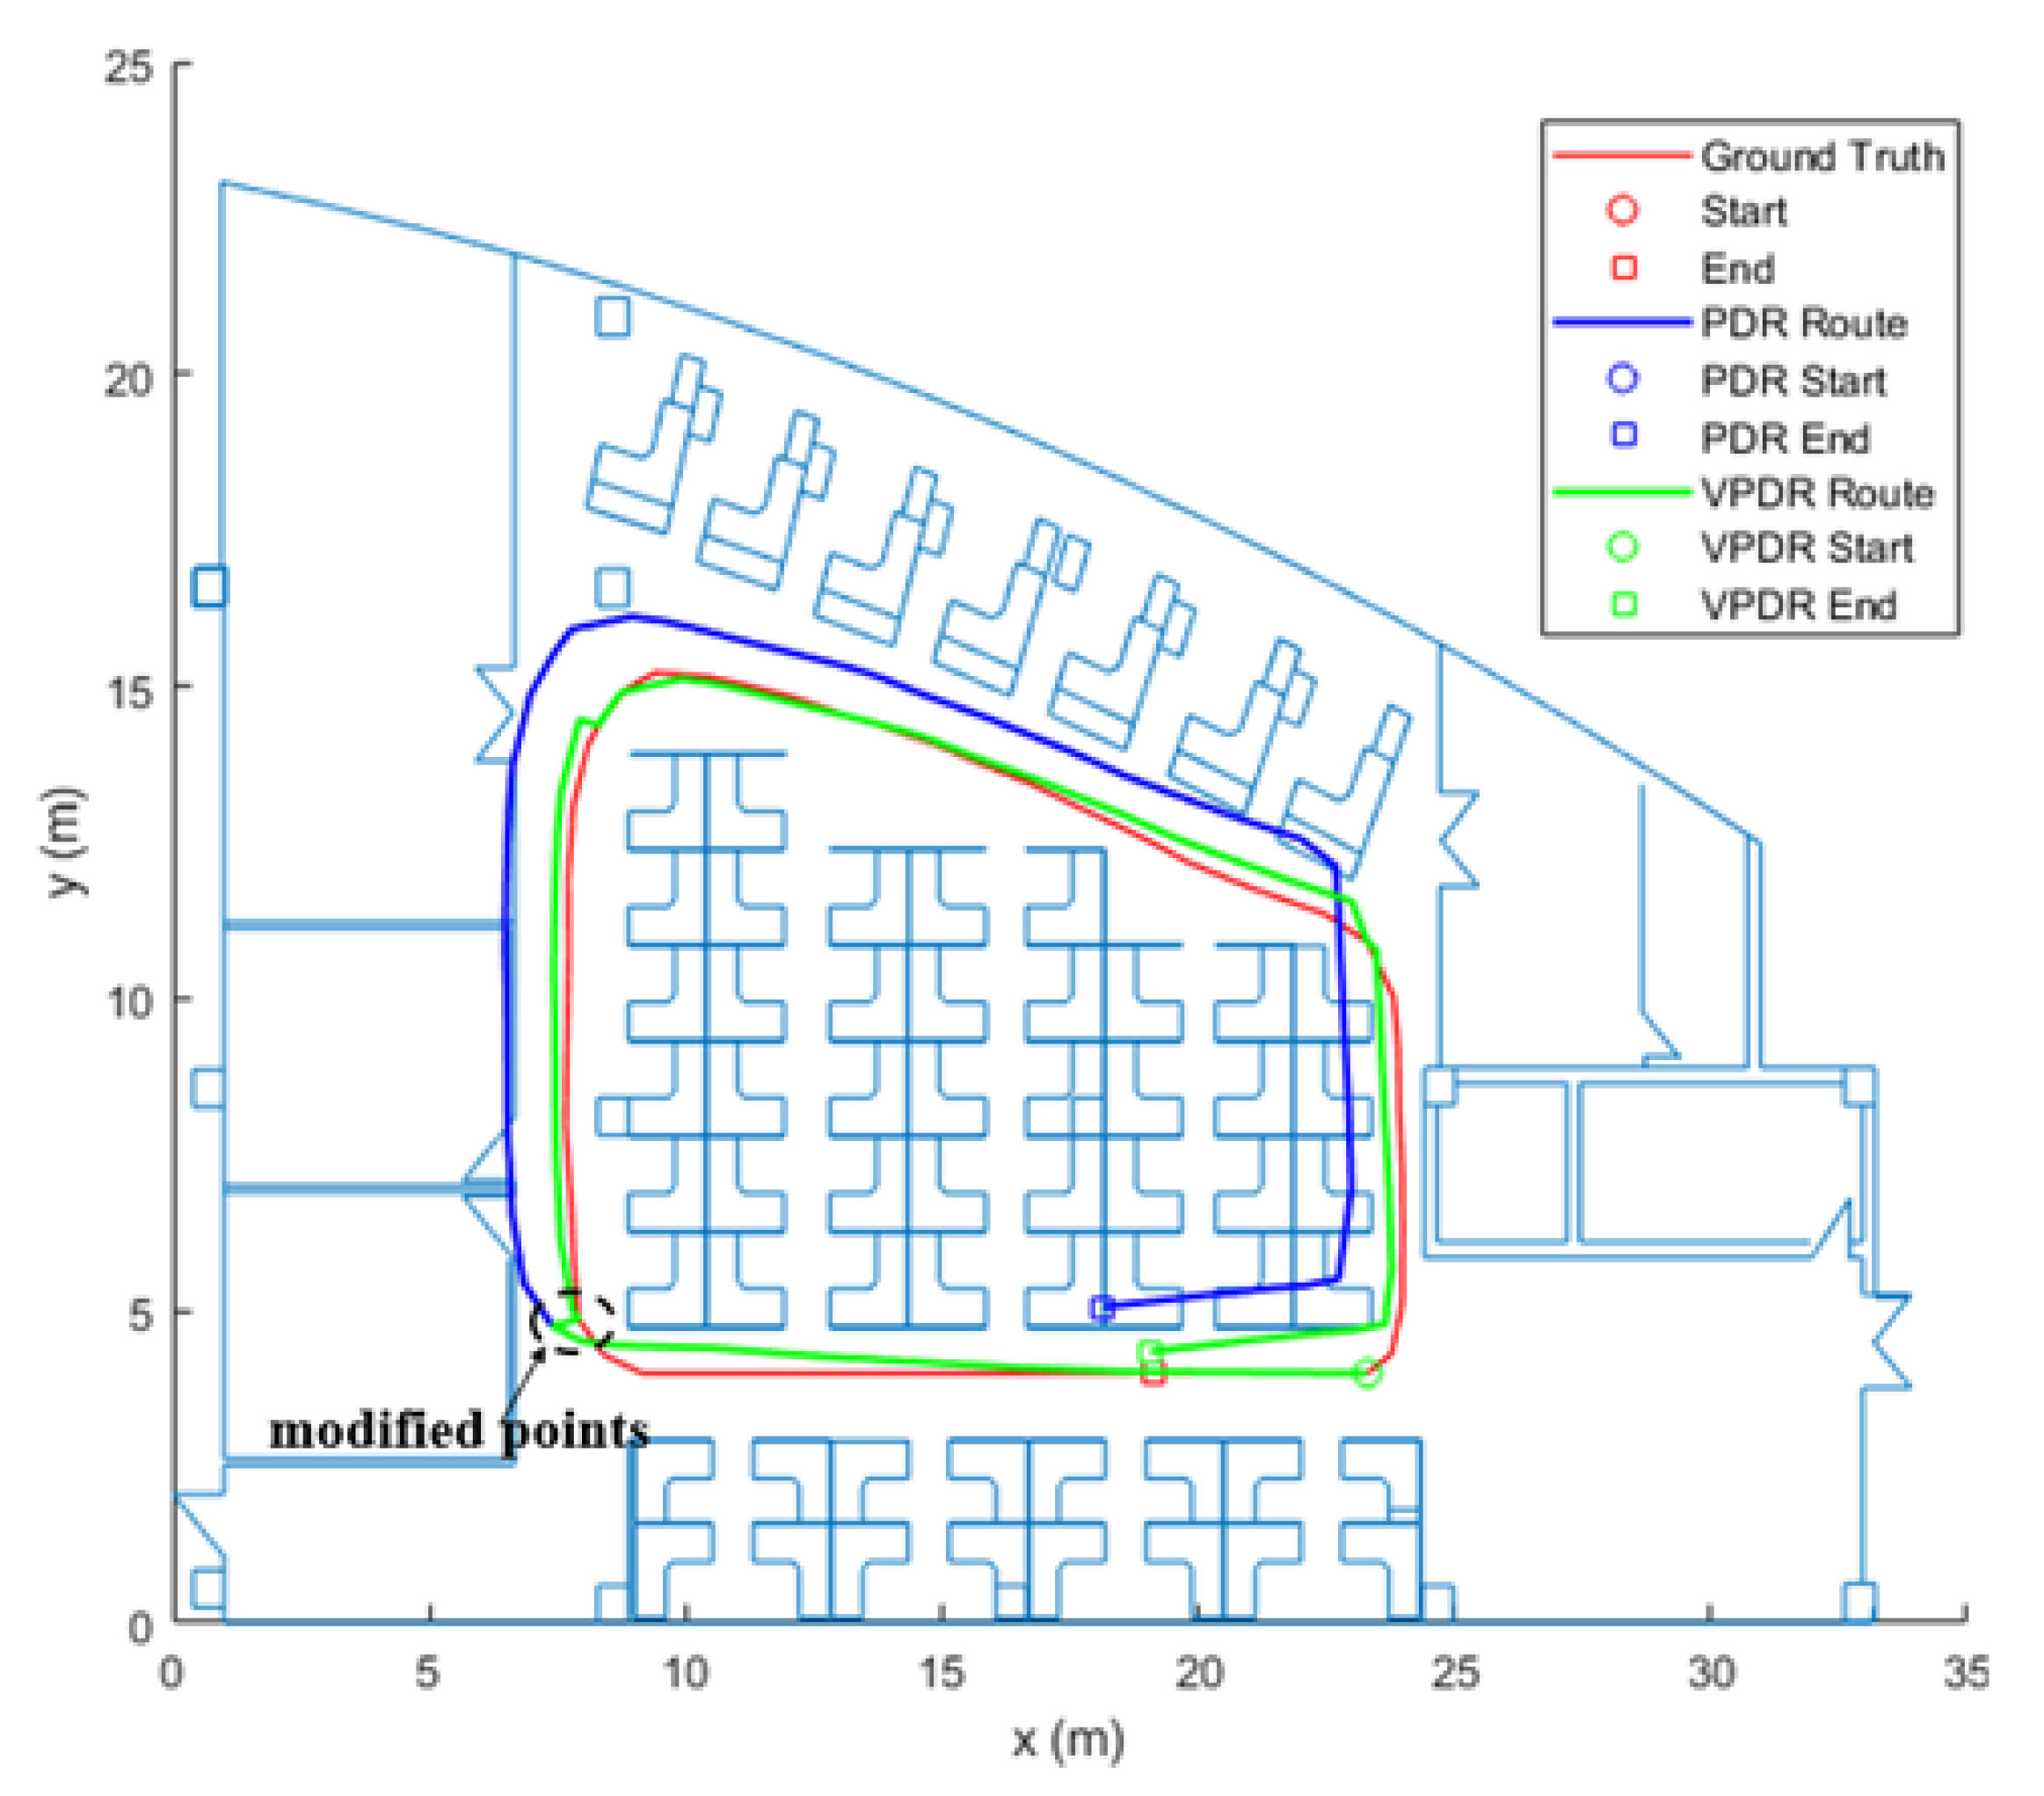
The results of the first experiment conducted in the third floor are shown in Figure 12. The red curve is our ground truth. The blue and green curves represent the PDR trajectory and the V-PDR trajectory, respectively. The pedestrian departs from the start point and circles clockwise along the corridor to the end point. Obviously, the trajectory of PDR is quite far away from the ground truth, especially when the pedestrian turns corners. This bias denotes the accumulative localization errors of PDR, which is mainly caused by three reasons: step detection errors, stride length estimation errors and heading calculation errors. By contrast, in the V-PDR test, the results of PDR are successfully corrected by VPR at the turns, which makes the estimated pedestrian trajectory closer to the ground truth. The improvement of localization performance can be proved more intuitively from the estimated end positions of PDR and V-PDR.
The end point of PDR is 1.43 m away from the actual end point, while the distance in V-PDR method is 0.35 m. The statistics of calculated errors of PDR and V-PDR are listed in Table 2. Due to the small scale of the neural network, it is fast to generate a vector and to find the similarity through matrix operations.
From the mean error column, we know that a 51.2% improvement in localization accuracy was achieved by V-PDR compared with PDR. Through this experiment, it can be seen that our method is effective in reducing cumulative errors of PDR and improving localization accuracy.
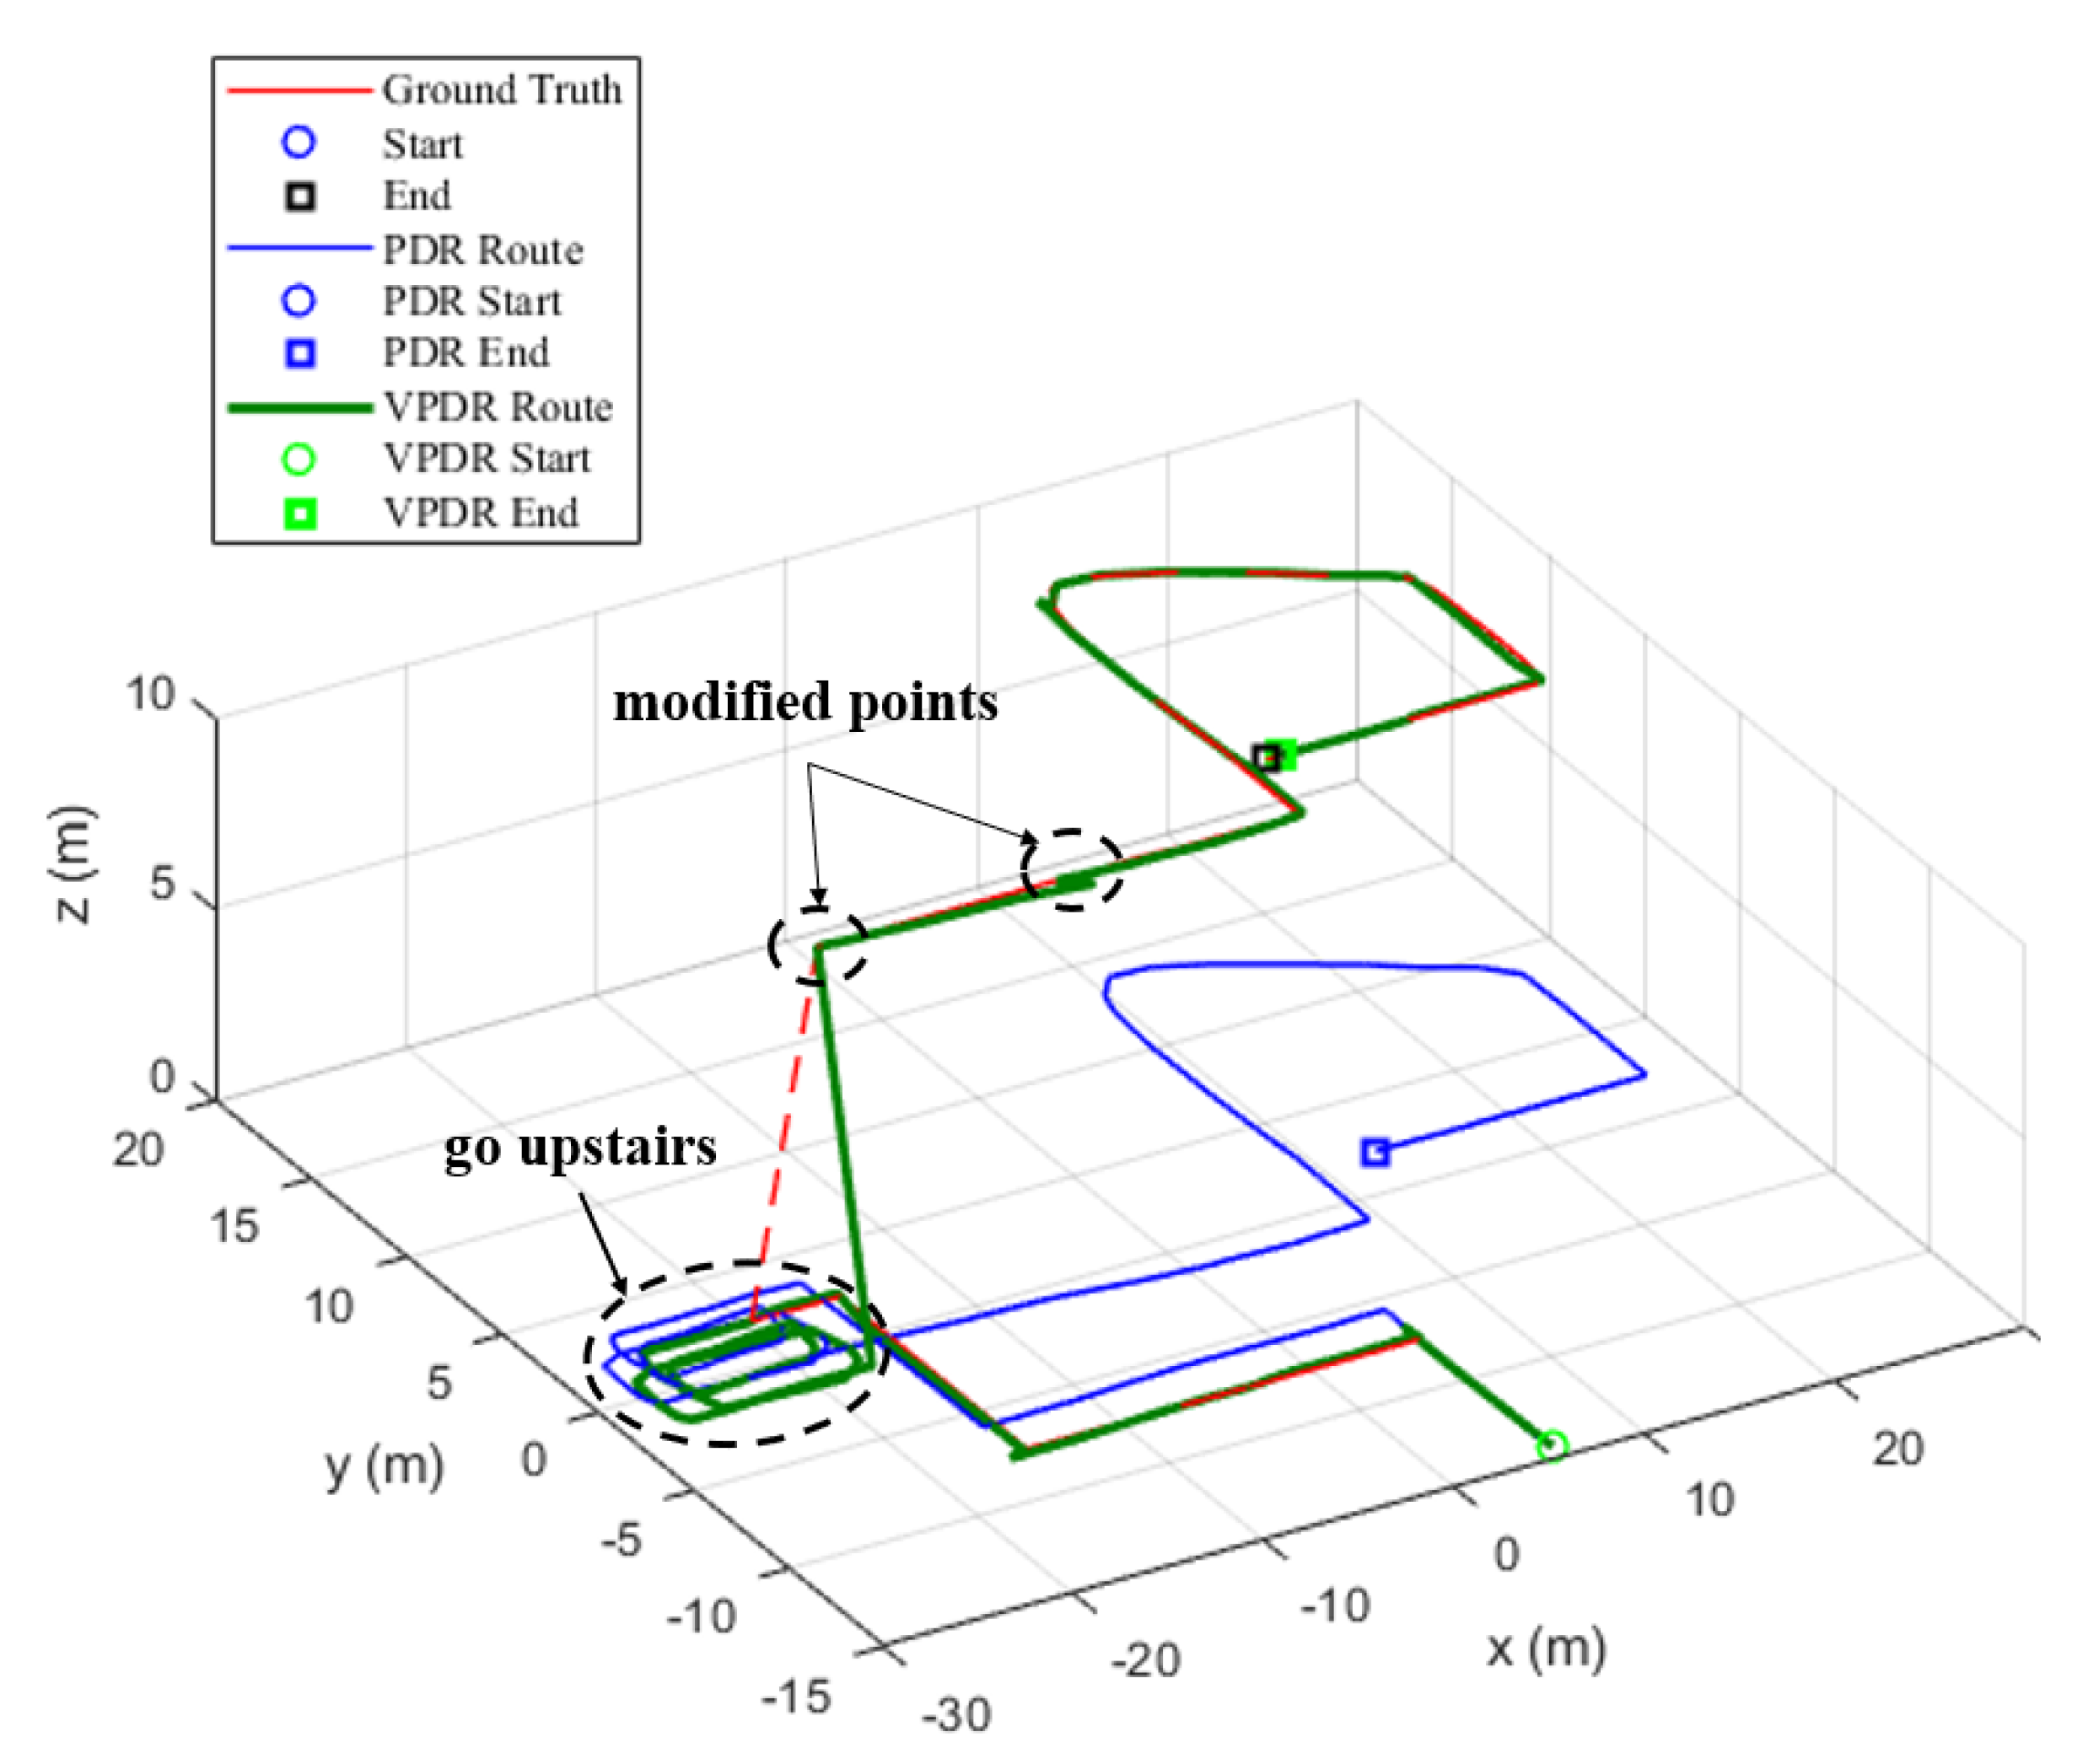
The second experiment was carried out on the first floor to the third floor. The experimental setting was similar to the first experiment. The difference was that there were up and down movements in the elevator in the second experiment. The other settings were the same.
The results of the cross-floor experiment are shown in Figure 13. Again, the blue curve represents the trajectory of PDR, the green curve represents the trajectory of V-PDR and the red curve is the ground truth. The pedestrian walks along the ground truth shown in Figure 9 and goes upstairs from the first floor to the third floor. Our method makes some corrections at the stairwell exit and around the corner on the first and third floors. The results show that, after walking upstairs, the trajectory of PDR is still on the first floor, while the trajectory of V-PDR is on the correct (third) floor. The end point of PDR is 42.64 m away from the actual end point, while the distance in V-PDR system is merely 0.79 m. These comparisons demonstrate that our method outperforms PDR in a three-dimensional space. More detailed error information is shown in Table 3.
The localization errors listed in Table 3 were calculated by projecting the trajectories into the horizontal plane. Comparing the average localization errors, V-PDR gains an 89.2% improvement in localization accuracy under the test containing stairs.
For the cost of the setup period, due to the accuracy of the VPR, it can be successfully located within three-dimension VPR. In most special cases, the local identification cannot be accurately performed, and the location may need to be changed to successfully locate. In this case, it may take a long time for the setup. However, the cost is acceptable for accurate positioning. A simple PDR algorithm can only obtain the relative position between two positions but not the exact position. With the assistance of VPR, the exact position can be obtained, which improves the positioning of the PDR. In the future, more improvements can be added to the setup, such as the use of panoramic images for positioning. This can obtain richer visual information and more accurate positioning.
Although our system uses a mobile phone to take pictures, which is complicated for personal use, this algorithm is to explore the fusion of PDR and vision. After wearable cameras and other devices are put into use, or used on a humanoid robot, users will no longer need to take pictures, which makes a lot of sense in actual use.
It can be indicated from above experiments that our indoor localization method successfully improves the localization accuracy by reducing accumulative errors of PDR and makes good performance in the cross-floor test.
There are many advantages of the proposed V-PDR compared with the standalone VPR system. Since VPDR can obtain a continuous walking path, VPR can only obtain discrete positioning points. The two method cannot be directly compared by experiments. However, we can analyze it from the experimental results of V-PDR. First, V-PDR can obtain continuous paths, and the amount of information obtained is greater than VPR. In addition, PDR has a correction effect on the inaccurate value of VPR, and V-PDR positioning is more accurate. Finally, V-PDR does not need to call the VPR network in real time, where it takes less calculation and time than VPR.
6. Conclusions
In this paper, we propose a novel indoor localization method to improve the localization accuracy and solve the problem that PDR cannot work properly in three-dimensional space by combining vision and inertial sensors. It was proved by experiments that our V-PDR method successfully reduces accumulated errors of PDR and improves the localization accuracy. In addition, it extends application scene of PDR to a three-dimensional space, which can still provide accurate localization service when pedestrians are moving across floors.
Author Contributions
J.Q. conceived and designed the experiments. J.Q. and Y.C. performed the experiments and analyzed the data. R.Y. contributed the experimental environment and analysis tools. P.L. provided critical comments to the paper. J.Q. wrote the paper. All authors have read and agreed to the published version of the manuscript.
Funding
This work was supported in part by the National Natural Science Foundation of China under Grants 61903246.
Conflicts of Interest
Jiuchao Qian mainly focuses on indoor localization technologies, video analysis, signal processing, deep learning, ubiquitous computing, and artificial intelligence.
Abbreviations
The following abbreviations are used in this manuscript:
| PDR | Pedestrian Dead Reckoning |
| VPR | Visual Place Recognition |
| GNSS | Global Navigation Satellite System |
| RFID | Radio Frequency Identification |
| IR | Infrared Ray |
| WLAN | Wireless Local Area Network |
| MEMS | Micro Electro Mechanical System |
| CNN | Convolutional Neural Network |
References
- Liu, P.; Liu, D.; Qian, J. A Survey of Indoor Positioning Technology and Application. Navig. Position. Timing 2017, 4. [Google Scholar] [CrossRef]
- Fallah, N.; Apostolopoulos, I.; Bekris, K. Indoor Human Navigation Systems: A Survey. Interact. Comput. 2013, 25, 21–33. [Google Scholar]
- Kang, W.; Han, Y. Smartpdr: Smartphone-based pedestrian dead reckoning for indoor localization. IEEE Sens. J. 2015, 5, 2906–2916. [Google Scholar] [CrossRef]
- Hsu, L.T.; Gu, Y.; Huang, Y.; Kamijo, S. Urban pedestrian navigation using smartphone-based dead reckoning and 3-d map-aided gnss. Sens. J. IEEE 2016, 5, 1281–1293. [Google Scholar] [CrossRef]
- Bidder, O.R.; Walker, J.; Jones, M.W.; Holton, M.D.; Urge, P.; Scantlebury, D.; Wilson, R.P. Step by step: Reconstruction of terrestrial animal movement paths by dead-reckoning. Mov. Ecol. 2015, 3, 23. [Google Scholar] [CrossRef] [PubMed] [Green Version]
- Thong, H.; Filippo, S.; Vinh, T. A Hybrid Algorithm Based on WiFi for Robust and Effective Indoor Positioning. In Proceedings of the 19th International Symposium on Communications and Information Technologies (ISCIT), Ho Chi Minh City, Vietnam, 25–27 September 2019; pp. 416–421. [Google Scholar]
- Wu, J.; Zhu, M.; Xiao, B.; Qiu, Y. The Improved Fingerprint-Based Indoor Localization with RFID/PDR/MM Technologies. In Proceedings of the 2018 IEEE 24th International Conference on Parallel and Distributed Systems (ICPADS), Singapore, 11–13 December 2018; pp. 878–885. [Google Scholar] [CrossRef]
- Katsuhiko, K.; Keisuke, I.; Tsubasa, T. Step Recognition Method Using Air Pressure Sensor. In Proceedings of the International Conference on Indoor Positioning and Indoor Navigation (IPIN), Pisa, Italy, 30 September–3 October 2019; pp. 1–8. [Google Scholar]
- Wang, G.; Wang, X.; Nie, J.; Lin, L. Magnetic-Based Indoor Localization Using Smartphone via a Fusion Algorithm. IEEE Sens. J. 2019, 19, 6477–6485. [Google Scholar] [CrossRef]
- Lowe, D.G. Object Recognition from Local Scale-Invariant Features. In Proceedings of the Seventh IEEE International Conference on Computer Vision, Kerkyra, Greece, 20–27 September 1999; Volume 2, pp. 1150–1157. [Google Scholar]
- Bay, H. Surf: Speeded up robust features. In European Conference on Computer Vision; Springer: Berlin/Heidelberg, Germany, 2006; Volume 110, pp. 404–417. [Google Scholar]
- Agrawal, M.; Konolige, K.; Blas, M.R. CenSurE: Center Surround Extremas for Realtime Feature Detection and Matching. In European Conference on Computer Vision; Proceedings, Part IV. DBLP; Springer: Berlin/Heidelberg, Germany, 2008. [Google Scholar]
- Oliva, A. Building the gist of a scene: The role of global image features in recognition. Prog. Brain Res. 2006, 155, 23–36. [Google Scholar] [PubMed]
- Wen, F.; Ying, R.; Gong, Z.; Liu, P. Efficient Algorithms for Maximum Consensus Robust Fitting. IEEE Trans. Robot. 2020, 36, 92–106. [Google Scholar] [CrossRef]
- Lowry, S.; Sunderhauf, N.; Newman, P.; Leonard, J.J.; Milford, M.J. Visual place recognition: A survey. IEEE Trans. Robot. 2016, 32, 1–19. [Google Scholar] [CrossRef] [Green Version]
- Zhou, B.; Lapedriza, A.; Xiao, J.; Torralba, A.; Oliva, A. Learning deep features for scene recognition using places database. Adv. Neural Inf. Process. Syst. 2014, 1, 487–495. [Google Scholar]
- Xiao, J.; Hays, J.; Ehinger, K.A.; Oliva, A.; Torralba, A. SUN database: Large-scale scene recognition from abbey to zoo. In Proceedings of the Twenty-Third IEEE Conference on Computer Vision and Pattern Recognition, CVPR 2010, San Francisco, CA, USA, 13–18 June 2010; pp. 3485–3492. [Google Scholar] [CrossRef]
- Razavian, A.S.; Azizpour, H.; Sullivan, J.; Carlsson, S. CNN Features Off-the-Shelf: An Astounding Baseline for Recognition. In Proceedings of the 2014 IEEE Conference on Computer Vision and Pattern Recognition Workshops, Columbus, OH, USA, 23–28 June 2014; pp. 512–519. [Google Scholar]
- Li, D.; Lu, Y.; Xu, J.; Ma, Q.; Liu, Z. iPAC: Integrate Pedestrian Dead Reckoning and Computer Vision for Indoor Localization and Tracking. IEEE Access 2019, 183514–183523. [Google Scholar] [CrossRef]
- Roggen, D.; Jenny, R.; Hamette, P.D.L.; Tröster, G. Mapping by Seeing—Wearable Vision-Based Dead-Reckoning, and Closing the Loop. In Smart Sensing and Context, Second European Conference, Eurossc, Kendal, England, October; Springer: Berlin/Heidelberg, Germany, 2007. [Google Scholar]
- Fu, W.; Peng, A.; Tang, B.; Zheng, L. Inertial sensor aided visual indoor positioning. In Proceedings of the International Conference on Electronics Technology (ICET), Chengdu, China, 23–27 May 2018; pp. 106–110. [Google Scholar]
- Yan, J.; He, G.; Basiri, A.; Hancock, C. 3D Passive-Vision-Aided Pedestrian Dead Reckoning for Indoor Positioning. IEEE Trans. Instrum. Meas. 2020, 1370–1386. [Google Scholar] [CrossRef]
- Yan, Z.; Xianwei, Z.; Ruizhi, C.; Hanjiang, X.; Sheng, G. Image-based localization aided indoor pedestrian trajectory estimation using smartphones. Sensors 2018, 18, 258. [Google Scholar]
- Fusco, G.; Coughlan, J.M. Indoor localization using computer vision and visual-inertial odometry. In International Conference on Computers Helping People with Special Needs; Springer: Cham, Switzerland, 2018. [Google Scholar]
- Chen, Z.; Lam, O.; Jacobson, A.; Milford, M. Convolutional Neural Network-based Place Recognition. arXiv 2014, arXiv:1411.1509. [Google Scholar]
- Krizhevsky, A.; Sutskever, I.; Hinton, G.E. ImageNet Classification with Deep Convolutional Neural Networks. Neural information processing systems. In Proceedings of the Advances in Neural Information Processing Systems 25, Lake Tahoe, NV, USA, 3–6 December 2012; pp. 1106–1114. [Google Scholar]
- Arandjelovic, R.; Gronat, P.; Torii, A.; Pajdla, T.; Sivic, J. NetVLAD: CNN Architecture for Weakly Supervised Place Recognition. Computer vision and pattern recognition. IEEE Trans. Pattern Anal. Mach. Intell. 2018, 40, 1437–1451. [Google Scholar] [CrossRef] [PubMed] [Green Version]
- Chen, Z.; Jacobson, A.; Sunderhauf, N.; Upcroft, B.; Liu, L.; Shen, C. Deep learning features at scale for visual place recognition. In Proceedings of the 2017 IEEE International Conference on Robotics and Automation (ICRA), Singapore, 29 May–3 June 2017; pp. 3223–3230. [Google Scholar]
- Harle, R. A Survey of Indoor Inertial Positioning Systems for Pedestrians. IEEE Commun. Surv. Tutor. 2013, 15, 1281–1293. [Google Scholar] [CrossRef]
- Beauregard, S. A Helmet-Mounted Pedestrian Dead Reckoning System. In Proceedings of the 3rd International Forum on Applied Wearable Computing 2006, Bremen, Germany, 15–16 March 2006; pp. 1–11. [Google Scholar]
- Tom, J. A Personal Dead Reckoning Module. In Proceedings of the 10th International Technical Meeting of the Satellite Division of The Institute of Navigation (ION GPS 1997), Kansas City, MO, USA, 16–19 September 1997; pp. 47–51. [Google Scholar]
- Ying, H.; Silex, C.; Schnitzer, A.; Leonhardt, S.; Schiek, M. Automatic Step Detection in the Accelerometer Signal. In Wearable and Implantable Body Sensor Networks; Springer: Berlin/Heidelberg, Germany, 2007. [Google Scholar]
- Nozawa, M.; Hagiwara, Y.; Choi, Y. Indoor human navigation system on smartphones using view-based navigation. In Proceedings of the 2012 12th International Conference on Control, Automation and Systems, JeJu Island, Korea, 17–21 October 2012; pp. 1916–1919. [Google Scholar]
- Robert, R.; Thomas, J. Dead Reckoning Navigational System Using Accelerometer to Measure Foot Impacts. U.S. Patent 5,583,776, 10 December 1996. [Google Scholar]
- Qian, J.; Pei, L.; Zou, D.; Liu, P. Optical Flow-Based Gait Modeling Algorithm for Pedestrian Navigation Using Smartphone Sensors. IEEE Sens. J. 2015, 12, 6797–6804. [Google Scholar] [CrossRef]
- Kim, J.W.; Jang, H.J.; Hwang, D.; Park, C. A Step, Stride and Heading Determination for the Pedestrian Navigation System. J. Glob. Position. Syst. 2004, 3, 273–279. [Google Scholar] [CrossRef] [Green Version]
- Qian, J.; Pei, L.; Ma, J.; Ying, R.; Liu, P. Vector graph assisted pedestrian dead reckoning using an unconstrained smartphone. Sensors 2015, 3, 5032–5057. [Google Scholar] [CrossRef] [PubMed] [Green Version]
- Wang, T.; Huang, H.; Lin, J.; Hu, C.; Zeng, K.; Sun, M. Omnidirectional CNN for Visual Place Recognition and Navigation. In Proceedings of the 2018 IEEE International Conference on Robotics and Automation (ICRA), Brisbane, Australia, 21–25 May 2018; pp. 2341–2348. [Google Scholar] [CrossRef] [Green Version]
- Quattoni, A.; Torralba, A. Recognizing indoor scenes computer vision and pattern recognition. In Proceedings of the IEEE Conference on Computer Vision and Pattern Recognition, Miami, FL, USA, 20–25 June 2009; pp. 413–420. [Google Scholar]
Figure 1.
The workflow of PDR.

Figure 2.
The waveform of accelerations.

Figure 3.
The test result of PDR.

Figure 4.
The system architecture of vision-aided PDR (V-PDR).

Figure 5.
Visual Place Recognition Algorithm Diagram.

Figure 6.
Visual place recognition network structure.

Figure 7.
Image Acquisition Method.

Figure 8.
Fusion flow chart of V-PDR system.

Figure 9.
Sample images in Indoor Scene Recognition dataset.

Figure 10.
Sample images of our Laboratory.

Figure 11.
The test result of VPR.

Figure 12.
Estimated trajectories of PDR and V-PDR.

Figure 13.
Estimated trajectories of PDR and V-PDR in cross-floor experiment.


Table 1.
The result of PDR.
| Localization Method | Maximum Error (m) | Mean Error (m) | 95% Situation Error (m) | Step Counting Accuracy |
|---|---|---|---|---|
| PDR | 1.52 | 0.91 | 1.43 | 98.8% |
Table 2.
Localization errors of PDR and V-PDR on the third floor.
| Localization Method | Maximum Error (m) | Mean Error (m) | 95% Situation Error (m) |
|---|---|---|---|
| PDR | 1.74 | 1.04 | 1.66 |
| V-PDR | 0.91 | 0.44 | 0.81 |
Table 3.
Localization Errors of PDR and V-PDR in Cross-floor Experiment.
| Localization Method | Maximum Error (m) | Mean Error (m) | 95% Situation Error (m) |
|---|---|---|---|
| PDR | 14.96 | 4.29 | 10.30 |
| V-PDR | 1.68 | 0.46 | 0.90 |
© 2020 by the authors. Licensee MDPI, Basel, Switzerland. This article is an open access article distributed under the terms and conditions of the Creative Commons Attribution (CC BY) license (http://creativecommons.org/licenses/by/4.0/).
Share and Cite
MDPI and ACS Style
Qian, J.; Cheng, Y.; Ying, R.; Liu, P. A Novel Indoor Localization Method Based on Image Retrieval and Dead Reckoning. Appl. Sci. 2020, 10, 3803. https://doi.org/10.3390/app10113803
AMA Style
Qian J, Cheng Y, Ying R, Liu P. A Novel Indoor Localization Method Based on Image Retrieval and Dead Reckoning. Applied Sciences. 2020; 10(11):3803. https://doi.org/10.3390/app10113803
Chicago/Turabian StyleQian, Jiuchao, Yuhao Cheng, Rendong Ying, and Peilin Liu. 2020. "A Novel Indoor Localization Method Based on Image Retrieval and Dead Reckoning" Applied Sciences 10, no. 11: 3803. https://doi.org/10.3390/app10113803
Note that from the first issue of 2016, this journal uses article numbers instead of page numbers. See further details here.