Climate Change and Species Invasion Drive Decadal Variation in Fish Fauna in the Min River, China


1
Department of Oceanography, National Sun Yat-Sen University, Kaohsiung 804, Taiwan
2
Henry Fok College of Biology and Agriculture, Shaoguan University, Shaoguan 512005, China
3
College of Fisheries, Ocean University of China, Qingdao 266003, China
4
Key Laboratory of Atmospheric Environment and Processes in the Boundary Layer Over the Low-Latitude Plateau Region, School of Earth Science, Yunnan University, Kunming 650091, China
*
Author to whom correspondence should be addressed.
Water 2020, 12(6), 1558; https://doi.org/10.3390/w12061558
Submission received: 25 April 2020
/
Revised: 20 May 2020
/
Accepted: 27 May 2020
/
Published: 29 May 2020
(This article belongs to the Section Biodiversity and Functionality of Aquatic Ecosystems)
Abstract
:Freshwater fishes are threatened by increasing environmental changes and human disturbances. The Min River, the largest river in Southeastern China, contains unique fish fauna for the Oriental realm. Due to environmental changes brought by forty years of economic growth, fish numbers have dramatically declined. The average taxonomic distinctness in the 1970s was significantly higher than that in 2015, while no significant differences were found in the variation in taxonomic distinctness between the two periods. Due to the river network and habitat diversity, fish fauna composition showed significant spatial differences but lower variation than the decadal variation. Precipitation was determined to be the most influential factor in determining the spatial pattern of fish fauna, followed by temperature. Species introduced for aquaculture have invaded the endemic fish community after escape and should be reconsidered in the trade-offs between economic development and ecological protection.
1. Introduction
Globally, freshwater fishes are among the most fragile fauna types due to the synergistic effects of climate change [1], species invasion [2], overfishing [3], hydropower [4], and navigation [5]. Climate change can act on hydrologic regimes, water temperatures, dissolved oxygen content, and pollutant toxicity [6,7]. For habitats, these variations could make eutrophication and stratification relatively stronger and more complicated in lentic areas and alter habitat availability and quality in lotic areas [1]. For species, the increased temperature could speed up species metabolic rates and slow down species maximum consumption rates [8], thus strongly affecting physiological components (including growth, metabolism, and reproduction) and behavior (including foraging and escaping, migration, and species interaction); e.g., species with low growth rates are easier at risk of being preyed on during the juvenile stage [9].
The introduction of exotic fish species primarily occurs from aquaculture or ornamental use, as well as unintentional release. The successful establishment of population and consequent spread could result in aftereffects such as occupying the niche of native species, reconfiguring modern biodiversity and disrupting ecosystem stability [10]; e.g., carps, trouts, tilapias, mosquitofish Gambusia affinis, and redfin perch Perca fluviatilis have greatly changed the originally native community composition and led to fauna homogenization worldwide [2,11]. Specifically, in developing megadiverse countries, the demands of economic development and nascent control of species trades have resulted a high number of invasions by nonnative species and associated negative impacts [12].
The current pattern of China’s freshwater fish fauna was shaped in the late Tertiary to early Quaternary during the uplift of the Qinghai–Tibetan Plateau and global climate cooling [13] and has been dynamic under these events over past centuries [3]. Specifically, in the recent period of rapid economic development, fish fauna have sustained a dramatic change characterized by native species loss and population decline under substantial anthropogenic forces and climate change [14]. For example, one of the world’s largest freshwater fishes, Psephurus gladius, in the Yangtze River has been declared extinct [15]; a small number of native species widely translocated to new watersheds have resulted in faunal homogenization [16]; in Southern China approximately 20% of finfishes intense aquaculture production was from introduced species, and these species even dominate present fish communities, e.g., Oreochromis spp., Oxyeleotris marmoratus, and Cichasoma managuense [17].
The Min River plays an important role in social, environmental, and economic development in Southeastern China. In the last four decades since the reform and opening up of China, the Min River basin has undergone dramatic changes as the government has encouraged rapid industrialization, urbanization and water utilization along the river (e.g., two of China’s largest pulp and paper mills and the biggest hydroelectric power plant in Eastern China), accompanied by serious local and regional environmental problems, such as agricultural and industrial pollutants, large residential and infrastructure projects, overcut forests, and overexploitation of water resources [18]. Fish fauna in the Min River, characterized by its unique species composition, are divided into separate subregions of the middle-lower Yangtze plain region in China [3]. Although research on the Min River fishes began in the early 20th century [19,20], only one systematic investigation was conducted in 1975–1979, and 174 species (including estuarine species) were recorded [21]. Since that time, no comprehensive reports have focused on fish fauna, their current status, and variations remain unclear. In this study, we identified the current species and their distribution based on our recent survey and then quantified the variations in spatial pattern and decadal composition; the environmental variables (including climate change, population, and species invasion) and their associations with faunal variation were further discussed.
2. Materials and Methods
2.1. Study Area
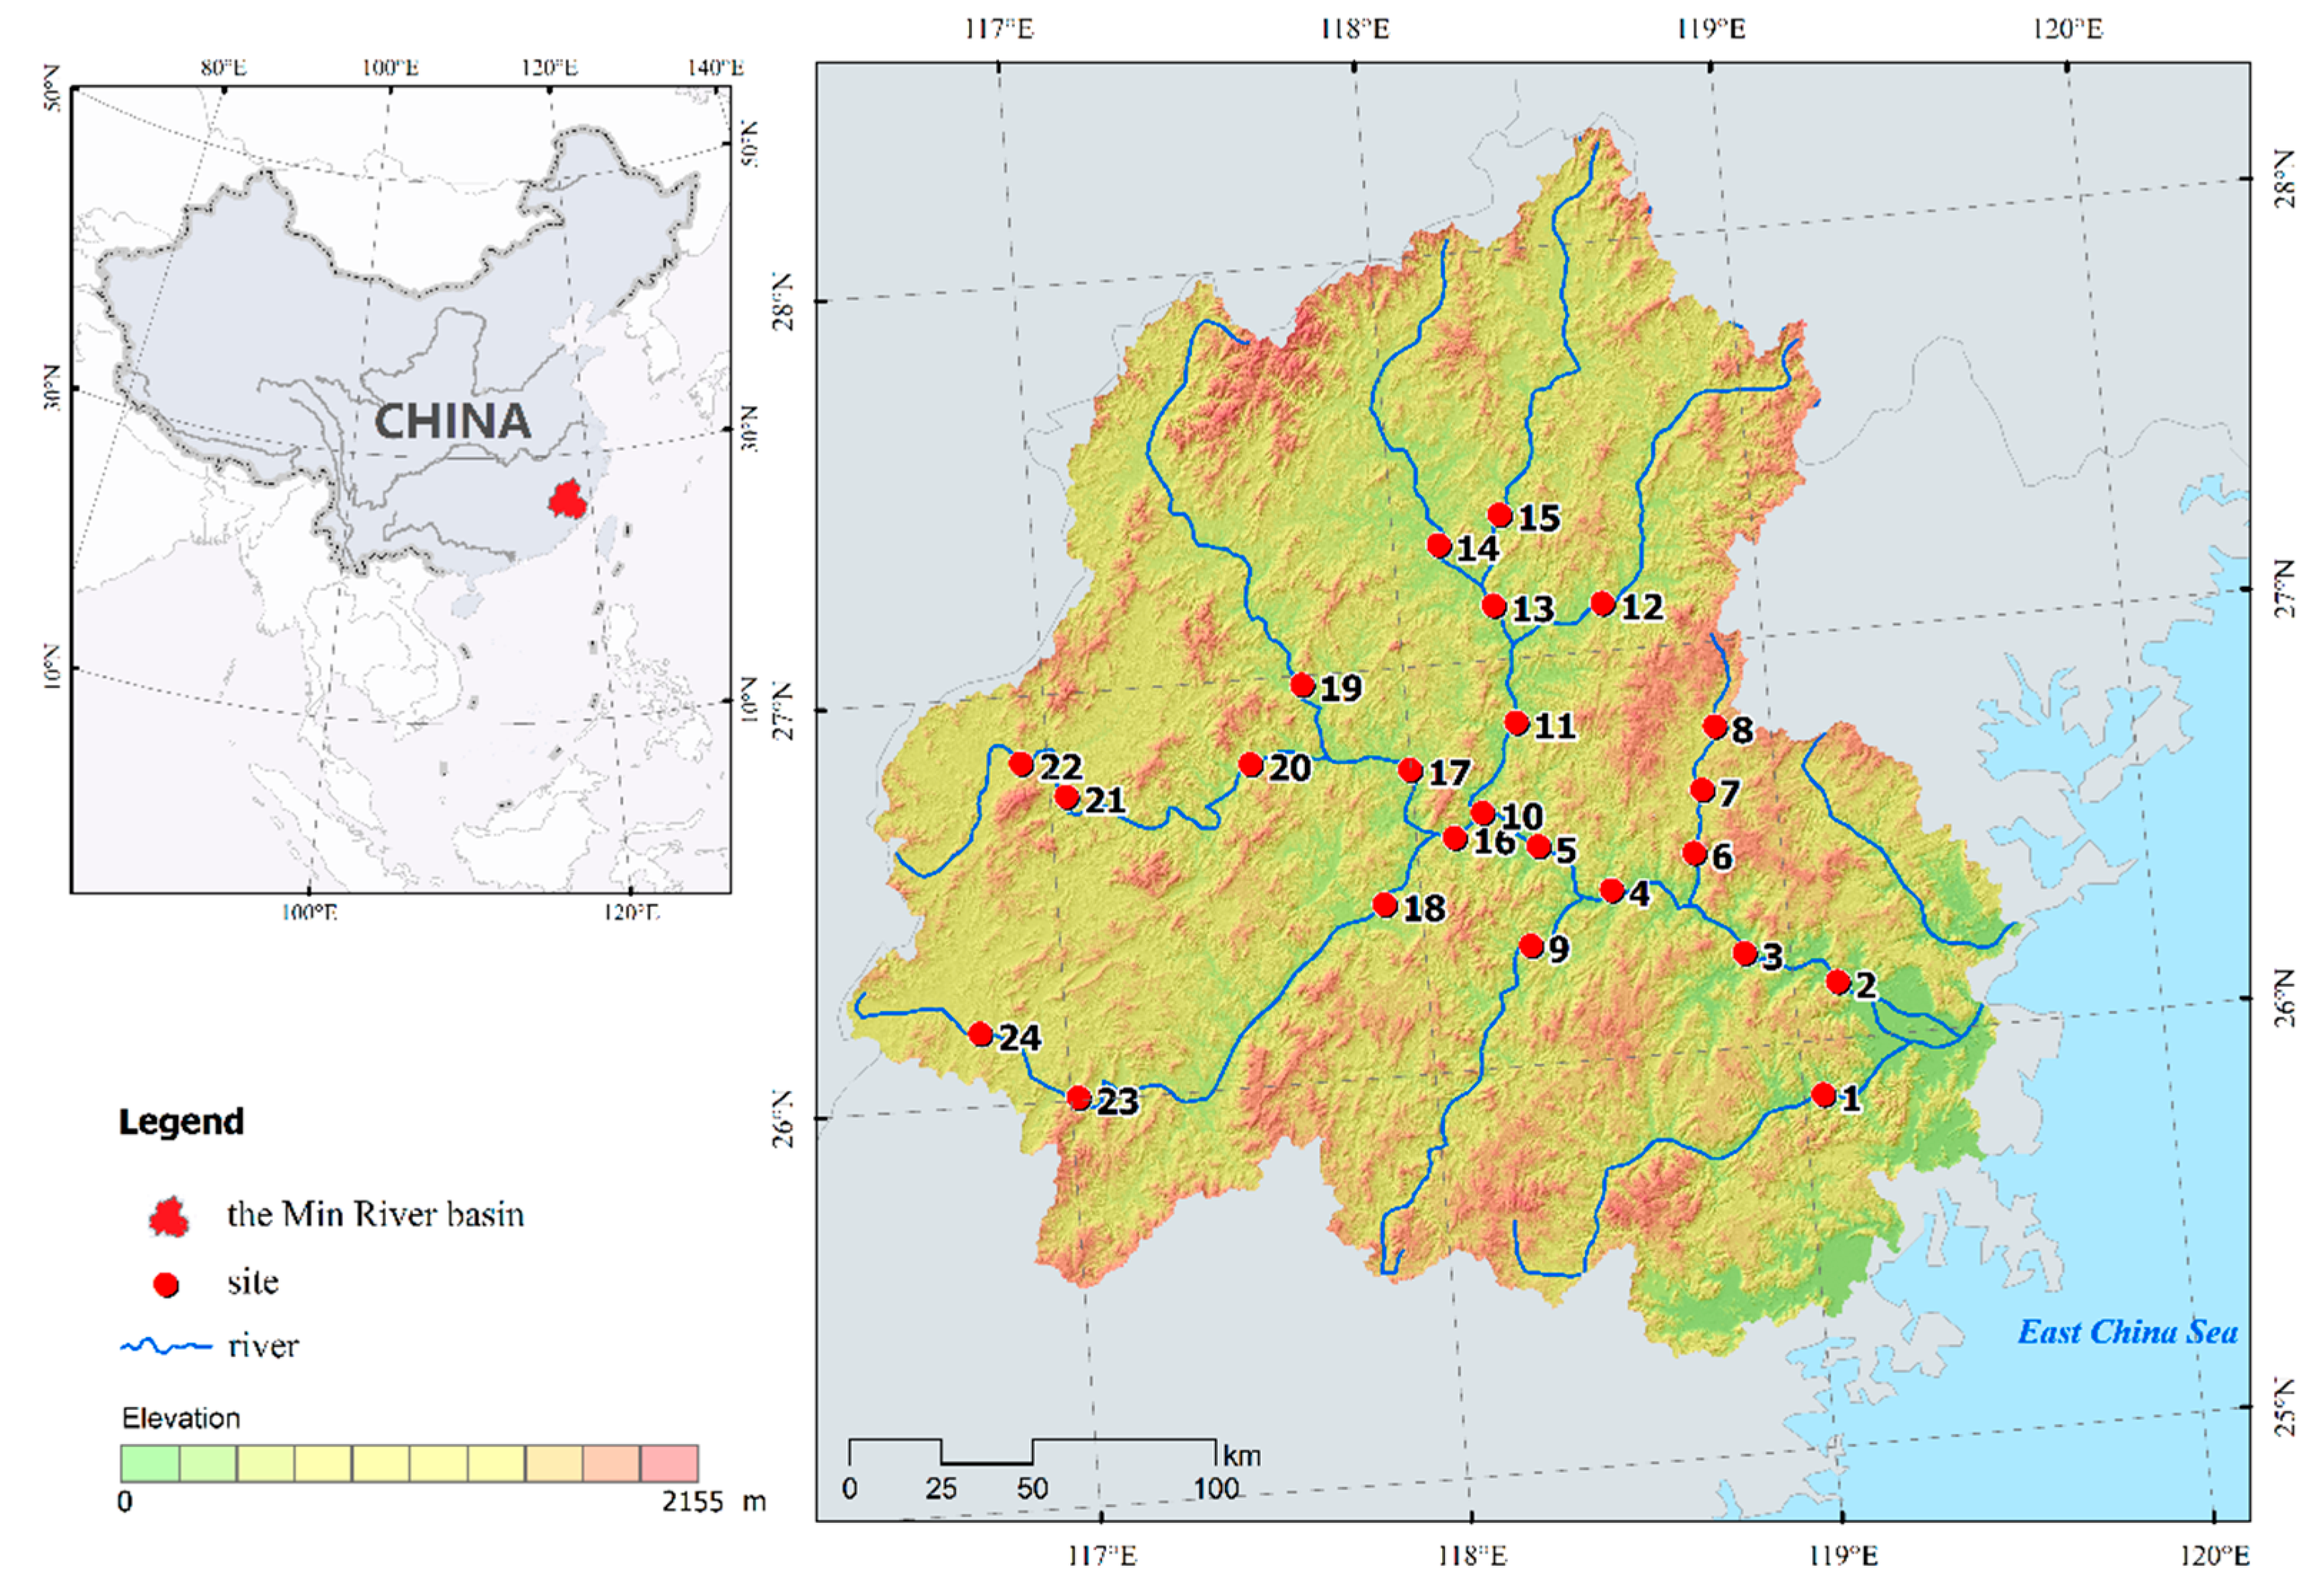
The Min River, located between 116°30′–119°30′ E and 25°20′–28°25′ N, is one of the 10 largest rivers in China and the largest river (in terms of both length and annual discharge) in Fujian Province [22]. Originating from its headwaters in the Wuyi Mountains at 2115 m elevation, the river flows southeastwards 559 km with an annual discharge of 6.21 × 10¹⁰ m3 covering a catchment area of 60,992 km2 [22] before entering the East China Sea. Approximately 65% of the residents are farmers, engaging in agriculture-related activities, e.g., planting tea and fruit trees, aquaculture, and husbandry.
2.2. Field Sampling
During May 2015, a total of 24 sites throughout the Min River basin were surveyed in this study. To maximally represent the spatial distribution pattern, fish sampling sites were determined before and after each node and reservoir of the river network (Figure 1). Fishes were collected using a backpack electrofishing unit (CWB-2000 P, Yufengda, China; 12-V import, 250-V export) by wading in two passes. All electrofishing passes were conducted using a uniform sampling effort by the same four persons, with approximately 30 min of sampling time for each 50-m segment according to the local fisher’s knowledge. Fish were identified to species, counted, and returned to the sampling sites if alive. Voucher specimens were stored in a 10% formaldehyde solution for further feeding habit identification in the laboratory. Habitat variables including sampling water depth and substrate type (muddy, sandy, pebble, stone, and grass) were recorded. Fishers near the sampling sites were also queried for information on fish ecological traits based on their local knowledge.
2.3. Data Collection
Fish data from the 1970s survey only included species presence/absence [21], and fish data in 2015 included both presence and abundance data. Records on species locality were identified to construct a species distributional data matrix (species-site). The presence/absence data were scored ‘1′ for the presence of a species in an area and ‘0’ for its absence. The compiled data were revised following www.fishbase.org to avoid invalid species, synonyms, and homonyms. An aggregate data matrix on species taxonomy was compiled with order, family, and genus as columns and species as rows. Biological traits (including feeding habits, reproduction and threats) of species were derived from www.fishbase.org. Species habitats (including velocity, temperature, and bottom type) were measured in situ and recorded.
Climatic variables such as temperature and precipitation in 1979 and 2015 were derived from the “China surface climatological data daily data set (V3.0)” downloaded from the China meteorological data service network (http://data.cma.gov.cn). Geostatistical spatial analyses were used to generate the inverse distance weight interpolation (IDW) map and describe the spatial variability in the mean annual temperature and precipitation at each site. All spatial analyses were performed in ArcGIS 10.2 (ESRI, Redlands, CA, United States). Populations at the county scale in 1979 and 2015 were derived from the China Population Statistics Yearbook [23,24].
2.4. Data Analysis
Based on the species presence/absence data from historical records and current surveys, the species richness as the total number of freshwater fish species at each site was determined. The distribution data matrix and the taxonomy data matrix were combined to quantify taxonomic diversity, including the average taxonomic distinctness (Δ+) and variation in taxonomic distinctness (Λ+). Δ+ measures the mean taxonomic distance between all pairs of species in one assemblage [25], and Λ+ reflects the unevenness in the taxonomic tree for a given sample [26]. A paired-samples t-test was used to test the differences in the diversities between pairs of sites differently distributed in space and between the same site at two different sample times.
Based on respective species occurrence and distribution data, the spatial compositional similarity between each pair of sites was determined by pairwise beta diversity using Jaccard’s index J = a/(a + b + c), where a is the number of shared species, and b and c are the numbers of unshared species at the two sampling sites [27]. The same index was also used to compare the fish composition at the same site between two different periods.
The differences in temperature, precipitation, and human population at the corresponding sites between the two surveys were grouped as independent variables. The variations in fish diversity indexes were considered dependent variables. To minimize the errors caused by the differences in the units of measurement for the variables, the raw data were standardized by the z-score method, and the differences were determined in percent. Multiple linear regressions were used to determine the relationship between species diversity and external variables, and variable interpretation with p < 0.05 indicated significant effects. The calculations were performed in the R statistical and programming environment (R core team, version 3.4.3, R Foundation for Statistical Computing, Vienna, Austria, 2017).
3. Results
3.1. Decadal Changes in Species and Taxonomic Diversity
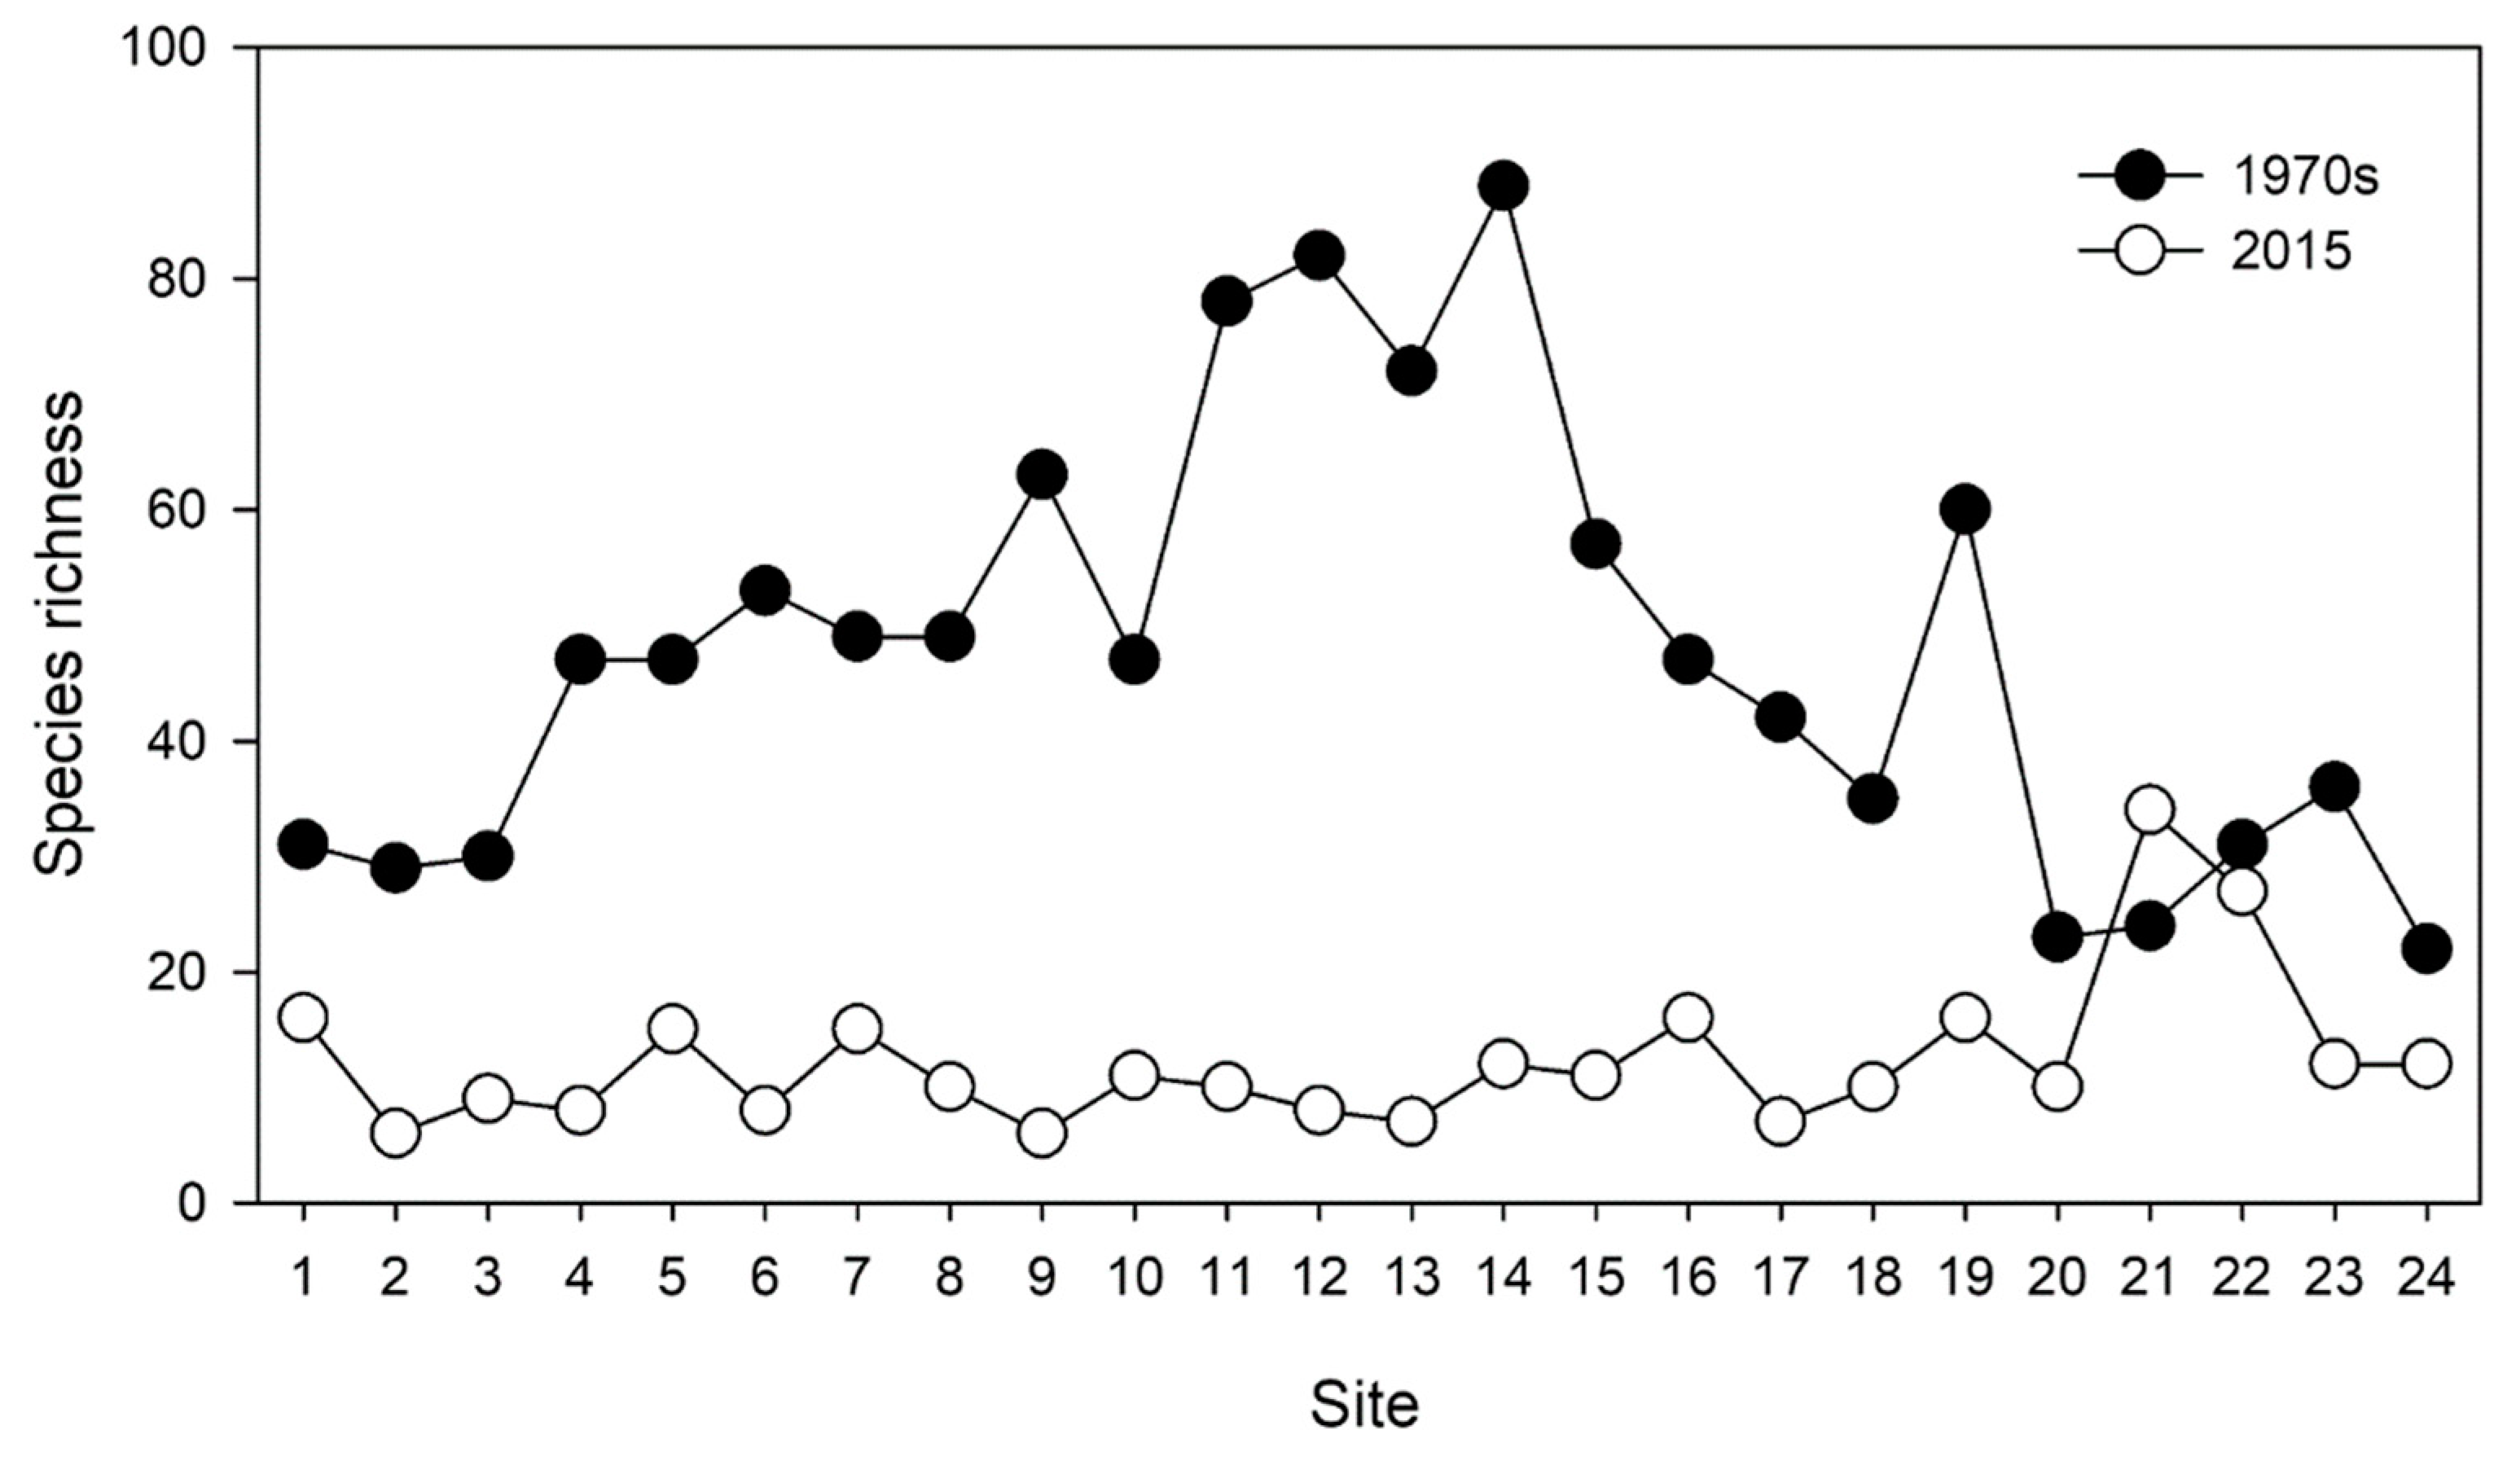
Based on the survey in the 1970s, 128 freshwater fish species belonging to 79 genera, 23 families, and 9 orders were recorded. In 2015, the diversity declined to 80 freshwater fish species belonging to 55 genera, 16 families, and 5 orders. Spatially, in the 1970s, the mean value of all the sampling sites was 47.58 ± 3.85, with the highest value at site 14 with 88 species, which was 4 times that at site 24 with 22 species. In 2015, the mean value was 12.33 ± 1.33, with the highest value at site 21 with 34 species, nearly 6 times that at sites 2 and 9 with 6 species (Figure 2). A paired t-test showed significant differences in fish diversity between the two periods (p < 0.01).
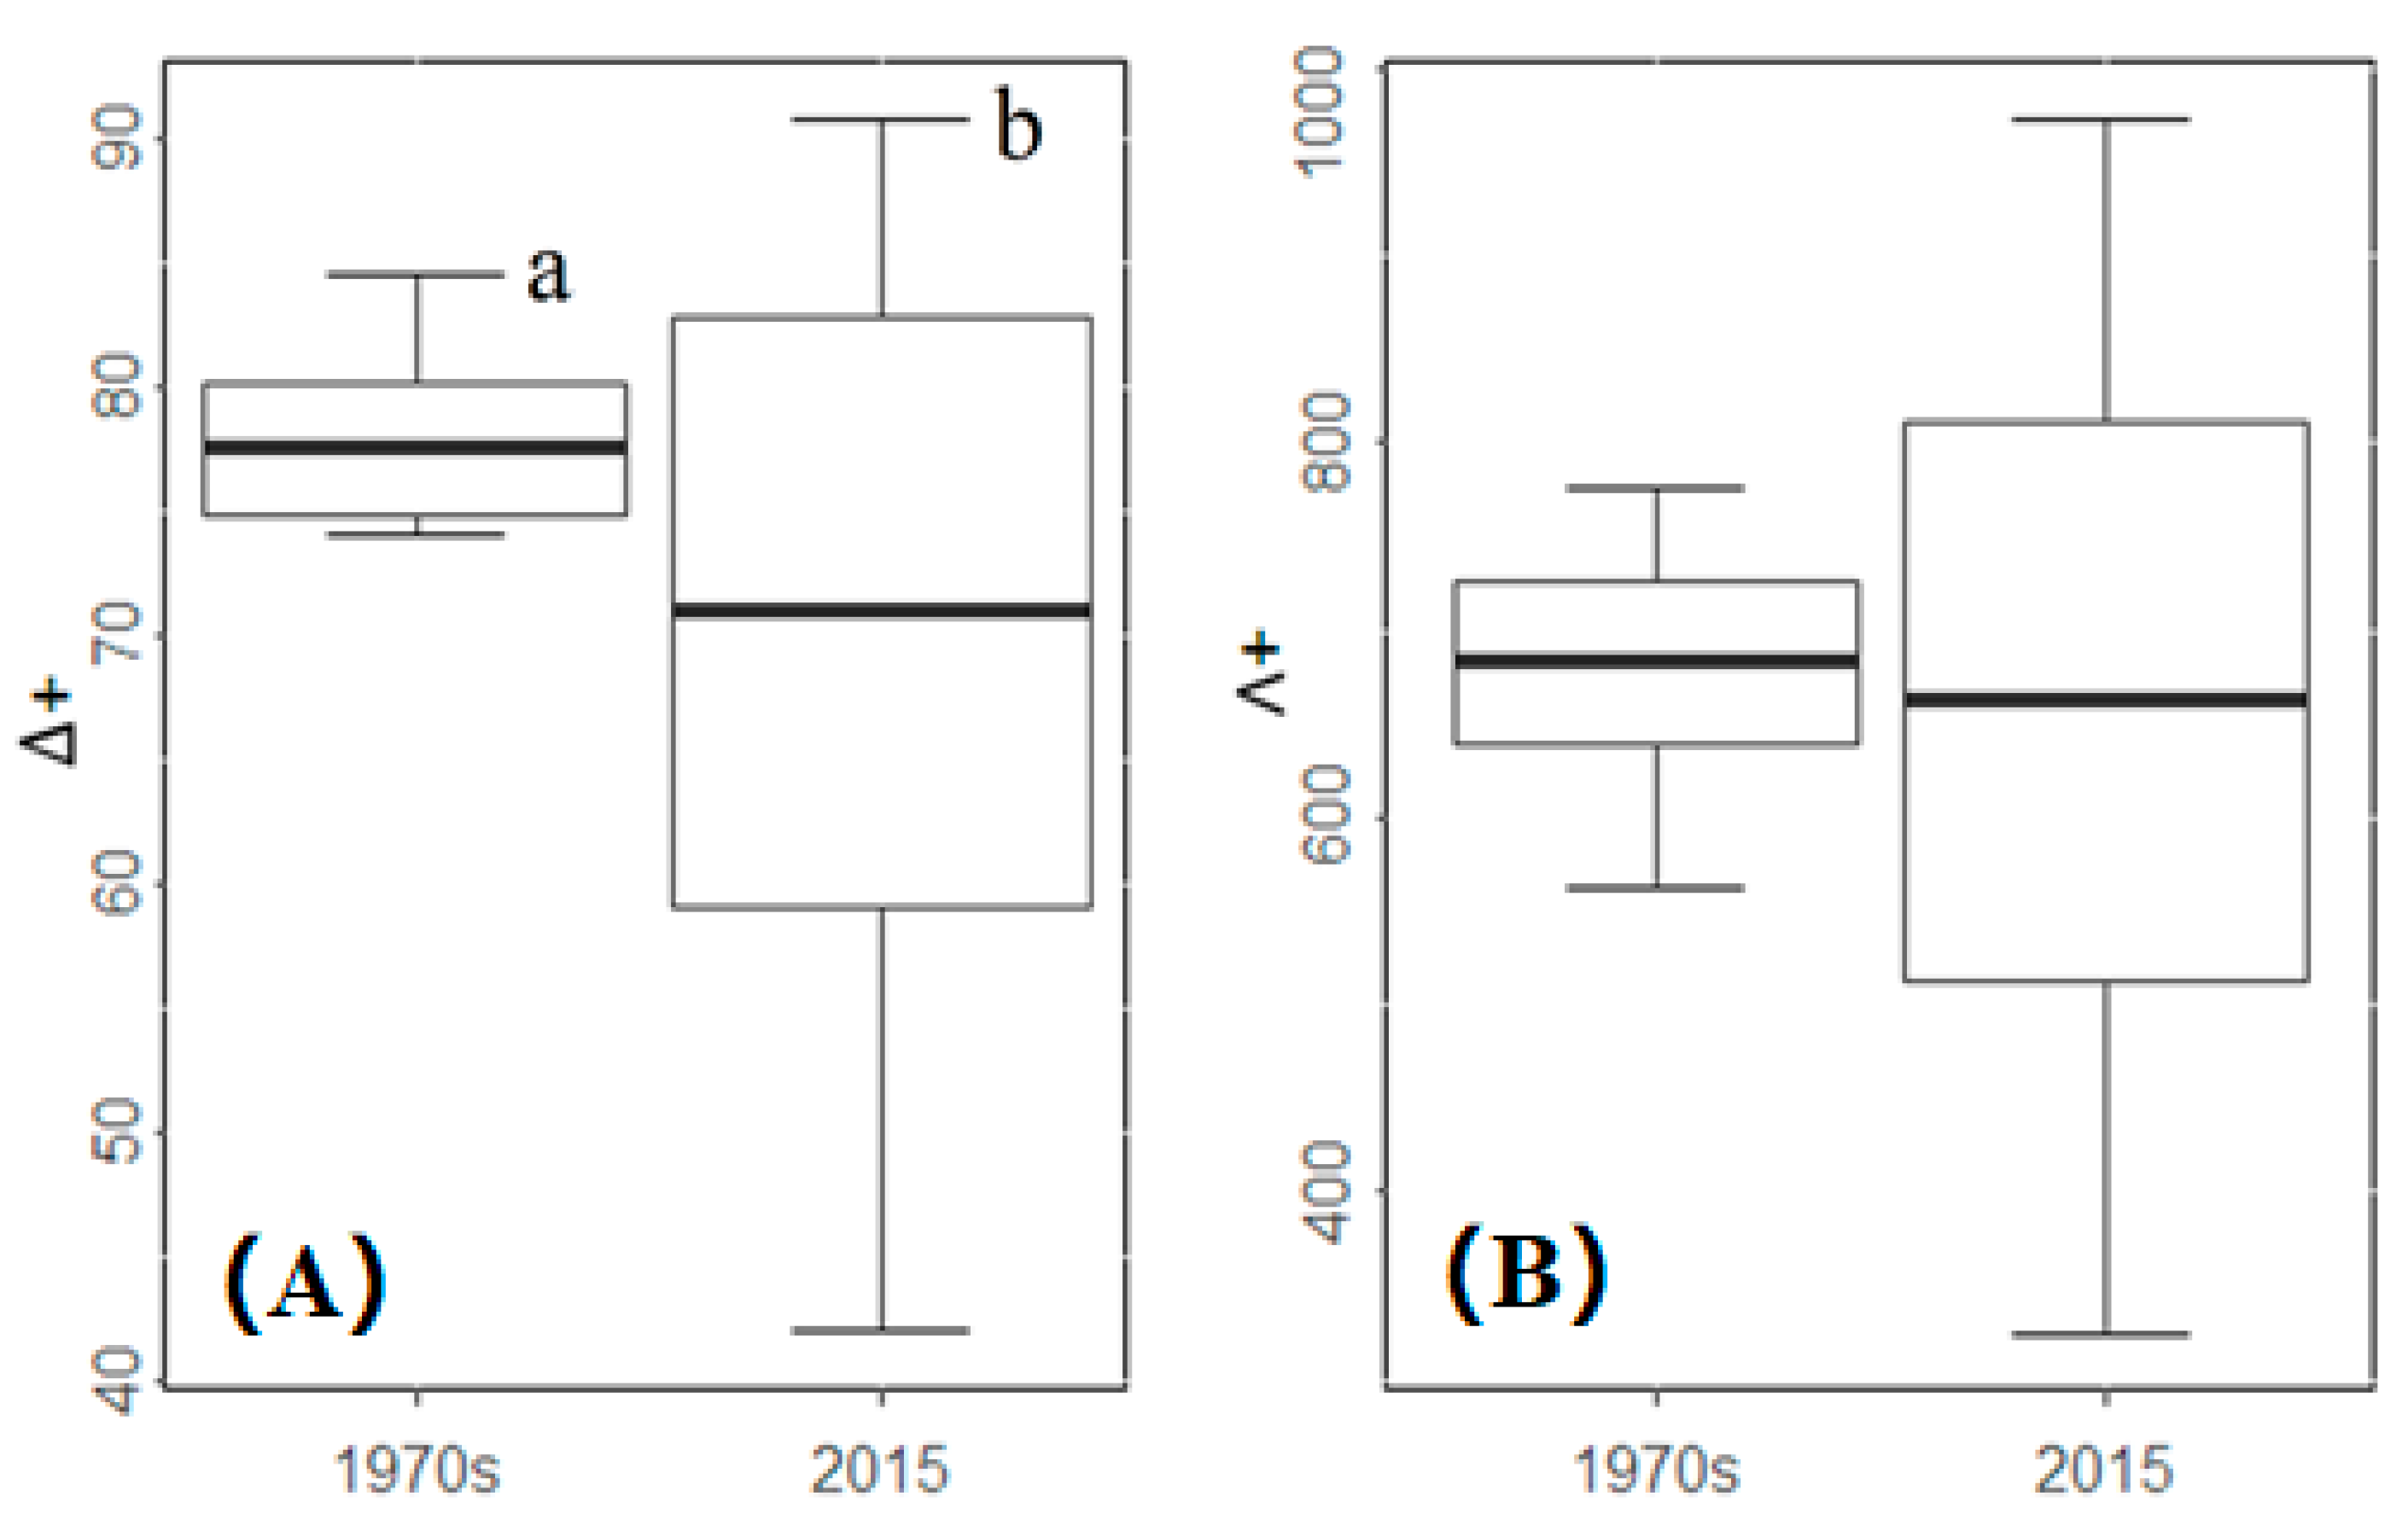
The average taxonomic distinctness (Δ+) in the 1970s was 77.44, which was significantly higher than that in 2015 (70.95). The variation in taxonomic distinctness (Λ+) in the 1970s was 682.00, with no significant differences from that in 2015, with a mean value of 661.81. The t-test showed a significant difference in Δ+ (p < 0.05) between the two periods but not in Λ+ (p = 0.268). Spatially, Δ+ varied from 74.00 at site 11 to 84.47 at site 23 in the 1970s and from 42.01 at site 19 to 90.72 at site 11 in 2015 (Figure 3). Λ+ varied from 565.15 at site 23 to 775.23 at site 18 in the 1970s and from 326.40 at site 11 to 971.65 at site 4 in 2015 (Figure 3).
3.2. Spatial and Temporal Patterns
Based on the river network and habitat diversity, fish showed spatial differences in faunal composition (Table 1). In the 1970s, sites 4, 5, 10, and 16 had the same species composition, and each site had the highest similarity with the average value of all the remaining sites, with a value of 0.63. Site 18 had the largest differentiation in species composition from the mean value of all the remaining sites with a similarity of 0.41, close to the values of sites 1, 19, and 22.
In 2015, species composition greatly varied; the highest similarity appeared between sites 3 and 10 at 0.57, and the lowest value of 0.04 existed between sites 7 and 15, sites 11 and 19, and sites 16 and 20. Site 18 had the most similar species composition with that of the other sites, but only with a similarity value of 0.25, while site 24 showed the most differentiation with a similarity value of 0.14.
At the basin scale, the similarity of fish composition between 1970s and 2015 was 0.332. The similarities between the same sites in two survey periods were also quantified to compare the variation in species composition. The similarity indexes were generally lower, ranging from 0.051 at site 3 to 0.296 at site 20 with an average of 0.158.
3.3. Species Invasion
Compared with the fauna in the 1970s, in addition to the significant loss of native species in the Min River, 11 new species were recorded in the 2015 survey (Table 2). Among these species, the grass carp Ctenopharyngodon idella and Wuchang bream Megalobrama amblycephala were introduced and promoted enthusiastically for aquaculture directly into natural water systems. The Mozambique tilapia Oreochromis mossambicus, Hemibagrus macropterus, and Lepomis gulosus were introduced into China for aquaculture and possibly escaped into natural water. Except for undocumented impacts caused by Hemibagrus macropterus at the small aquaculture scale, the threat of the other four species to the native species was underestimated given their strong adaptability to the environment and competitiveness with native species. The species Sinibotia superciliaris is native to the upper Yangtze River, China, and was unintentionally introduced into the Min River; however, its impacts seemed to be limited due to its less-aggressive nature in terms of food and living space.
Additionally, there may be some species that were not sampled, as well as possible species misidentification. For example, Vanmanenia gymnetrus was first reported as a new species in 1980 in the Jiulong River, close to the Min River [28]; according to historical records from other monographs [29], the species Macrognathus aculeatus, Sinibrama wui, Tachysurus adiposalis and Xenocypris davidi are native to the Min River.
3.4. Climatic and Anthropogenic Impacts
Climate change could act on fish diversity by directly adjusting water temperature and discharge. Compared with 1970s, precipitation in Min River basin in 2015 declined 19.86%; temperature varied positively or negatively with spatial differences, felling by 6.87% overall. Corresponding to economic development and city planning, population increases and migration have also changed biodiversity and ecosystems. In the four decades the total population in the Min River basin increased 1.73%, with extremely increase in the downstream area, e.g., 58.80 in site 4 and 5. Considering the effects of these variables, a multiple regression was used to determine the species diversity variation as y = 5.20X1 + 13.82X2 + 0.03X3 − 89.63, where y is the species diversity, X1 is the temperature, X2 is the precipitation, and X3 is the population. Among these variables, precipitation showed the most significant effect (p < 0.001), followed by temperature (p < 0.05). In addition, no significant effect was found by population (p > 0.05).
4. Discussion
4.1. Species and Taxonomic Diversity
Globally, China has some of the most abundant freshwater fishes with approximately 1000 species [3]. The Yangtze, Yellow, and Pearl Rivers are the most famous rivers in China, accounting for almost one third of the national territorial area. In Southeastern China, the Min River is the largest river and possesses abundant and unique fish fauna [3] due to complex environments (i.e., local microhabitats caused by deeper water, slower flows, and smaller substrate particles) as an independent water system, and the endangered species Chinese sturgeon Acipenser sinensis and Chinese sucker Myxocyprinus asiaticus are present in this river. Species richness (i.e., species number per unit) is the simplest measure of biodiversity. According to historical records, fish in the Min River are highly diverse in terms of species composition, with nearly 15% of the total species and 25% of the total genera in China [3]. In the 2015 survey (40 years after the first systematic survey), the fish fauna in the Min River showed serious homogenization with a 36% and 30% decline in species and genera, respectively.
Beyond species richness, taxonomic diversity has been used to track evolutionary and taxonomic relatedness and genetic relationships among different organisms in a sample [30,31]. Generally, species richness patterns tend to coincide across taxonomic groups [32]. In the Min River, average taxonomic distinctness (Δ+) dropped 10%, far less than the variation in species richness with significant difference. In contrast to Δ+, a decline of 3% in variation in taxonomic distinctness (Λ+) suggested no significant variation between the two periods. Fish fauna of the Min River belong to the Oriental realm, characterized by the dominance of Cyprinidae. The temporal decrease in Δ+ suggested that the total phylogenetic distances of all species decreased into a taxonomic simplification, especially in a genus with only one species, e.g., the disappearance of sturgeon contributed a large part of Δ+ decline. Despite the clear decrease in richness and Δ+, the stability of Δ+ indicated that most species lost were from the genus/family level, retaining some species, and the removal of these species did not cut the branches to make the taxonomic tree uneven and narrow the phylogenetic variation. This is also evidence of the self-balancing ability of the fish community by maintaining species in different taxonomic units with distinguishable evolutionary and ecological demands, using resources to the best of their ability [33].
4.2. Fauna Dissimilarity in Space and Time
Rivers are spatially organized into hierarchic dendritic networks, and the spatial domain of an ecosystem plays an important role in structuring species distributions, population dynamics and the evolution and pattern of dispersal [34,35]. Confined into the dendritic connectivity structure of river networks, fishes must directly move along watercourses to arrive at suitable habitats [36,37], finally resulting in different distributional patterns corresponding to the types of river connectivity, such as longitudinal, lateral, and hydrological connectivity. In addition, intermittent small-scale geologic events and human activities further shape the diversity. The Min River is a mountain river, characterized by deep valleys and dense streams in the upper reach, mainly meandering canyons in the middle reach, and open surface and slow flow velocity in the lower reach, and the complicated geomorphy contributed the basin special fish spatial patterns. In comparison to the mainstem, sites 21 and 22 in the tributaries showed the highest diversity, and high similarities existed among the sites in the upper part of different tributaries. The scarcity of gradient variation along the river network could be attributed to the synergistic effects of (1) the formation of microhabitats under rural activities of local residents, i.e., low-head dams, timber cutting, and agriculture [38]; (2) hydrologic alteration under climate change [39]; and (3) the relatively weak swimming ability of most species in the Min River [29].
Temporally, the extent of the differences among all the sites greatly expanded over the four decades. For all the fish assemblages, the average distance among all the sites based on the Jaccard coefficient significantly differed between the two periods (p < 0.01), and this expansion could be attributed to intensive human activities and increased climate variation.
4.3. External Variables Associated with Fish Diversity
Fish species vary in their physiological tolerances, life-history strategies, population expansion and extinction probabilities, and dispersal ability [40]. In addition to stable factors, such as latitude, longitude, and altitude, determining species dispersal is important as species are currently experiencing difficulties adapting to environmental dynamics such as warming [41], floods or drought [42], hypoxia [43], and pollution [44]. In aquatic ecosystems, river discharge determines the living space for aquatic species as an ecological rule “species–discharge” relationship [45]. In the Min River, precipitation (representing river discharge) was the most influential factor in explaining the variation in fish diversity, similar to the results of reports on fishes in the lower Ohio-upper Mississippi [45] and China [3].
Water temperature is recognized as one of the most important factors determining fish dispersal by directly affecting body metabolism and behaviors, development, growth and breeding [46]. In the Min River, because of the lack of data on water temperature, air temperature was used as a proxy to test the effects of temperature on fish distribution. The results showed that temperature had a significant impact on fish diversity. Furthermore, source and small tributaries were more sensitive to temperature variation than to other factors, and this feature could support the greater dissimilarities between the same sites in two periods than in the sites in lower parts of the branches and mainstem. There is concern that most species in small streams are highly specialized to local microhabitats [33] and would be vulnerable to climate change, representing a challenge to conservation in upper streams, i.e., a decline in or loss of the cold water species Elopichthys bambusa, Elopichthys bambusa, Ochetobius elongates, Phoxinus variegatus, and Squaliobarbus curriculus.
Multiple human disturbances have been considered the major drivers of the current biodiversity crisis [47]. For example, low dams separate the populations of Sinibrama macrops in the Jianyang and Shaowu Rivers into two phylogenetic populations; a high dam isolates the population at Gutian from the remaining areas of the river [48]. Due to the difficulty of obtaining direct data on hydrologic alteration, habitat indexes, overfishing, and eutrophication, only population data were selected to test the effects of human disturbances in this study, and no significant effect of population on the fish diversity of the Min River was found. In fact, under economic development, city centralization has resulted in a large population from small villages or towns, which has minimized the impacts of disturbances to streams.
In addition, human-mediated exotic species introduction warrants attention. Half a century of exotic species introduction and native species extirpation has greatly affected historical patterns, causing a decline in taxonomic dissimilarity and biotic homogenization [2]. The establishment of nonnative species may be affected by both environmental conditions (i.e., water temperature, depth, and current velocity) and internal characteristics (i.e., physiological plasticity, feeding habits, and reproductive strategies) [49]. The primary purpose of species introduction is aquaculture, as well as aquarium trade, and the target species are selected according to their biological traits, such as rapid growth, strong immunity, and high fecundity. When aquaculture species escape unintentionally, they show a high probability of successfully establishing populations and threatening native and endemic species [50], especially in relatively isolated waters, such as has occurred with the icefish Neosalanx taihuensis in lakes [51]. The grass carp C. idella is one of the four major Chinese carp species. It was strongly promoted for breeding throughout China (even in Tibet and Yunnan with high fish endemicity) from its native range in the Yangtze River. The Wuchang bream M. amblycephala is also a popular edible species for residents in the middle reaches of the Yangtze River. It was introduced into most water systems in Southern China [17]. Strong adaptability and high ecological plasticity help C. idella and M. amblycephla quickly dominate local fauna, dramatically occupying the ecological niches of native species, especially species with ecological traits similar to the two species; i.e., a 40% decrease in Cyprinidae between the two periods occurred. Another species, L. gulosus, recently showed high invasion ability in many places [52,53], in addition to the Min River, and caused a dramatic loss of loaches.
In the context of increasing climate change and human activity, fish diversity is under unprecedented threats. The Min River basin is one of the key areas of China’s economic development, and the future of freshwater fishes in this basin is threatened. Multiple efforts such as official guidance, public awareness and scientific research are urgently needed and encouraged.
Author Contributions
Conceptualization, W.D. and B.K.; methodology, B.K.; software, L.L. and X.H.; validation, T.-Y.L. and B.K.; formal analysis, L.L. and X.H.; data curation, W.D.; writing—original draft preparation, T.-Y.L., W.D. and B.K.; writing—review and editing, B.K.; project administration, L.L.; funding acquisition, B.K. All authors have read and agreed to the published version of the manuscript.
Funding
This research was funded by the National Natural Science Foundation of China, grant number No. 41976091.
Acknowledgments
This research was supported by the National Natural Science Foundation of China (No. 41976091) and Fundamental Research Funds for the Central Universities (201964002).
Conflicts of Interest
The authors declare no conflict of interest.
References
- Ficke, A.D.; Myrick, C.A.; Hansen, L.J. Potential impacts of global climate change on freshwater fisheries. Rev. Fish Biol. Fish. 2007, 17, 581–613. [Google Scholar] [CrossRef]
- Vitule, J.R.; Occhi, T.V.; Kang, B.; Matsuzaki, S.I.; Bezerra, L.A.; Daga, V.S.; Faria, L.; Frehse, F.D.A.; Walter, F.; Padial, A.A. Intra-country introductions unraveling global hotspots of alien fish species. Biodivers. Conserv. 2019, 28, 3037–3043. [Google Scholar] [CrossRef]
- Kang, B.; Deng, J.M.; Wu, Y.F.; Chen, L.Q.; Zhang, J.; Qiu, H.; Lu, Y.Y.; He, D.M. Mapping China’s freshwater fishes: Diversity and biogeography. Fish Fish. 2014, 15, 209–230. [Google Scholar] [CrossRef]
- Winemiller, K.O.; McIntyre, P.B.; Castello, L.; FluetChouinard, E.; Giarrizzo, T.; Nam, S.; Baird, I.G.; Darwall, W.; Lujan, N.K.; Harrison, I.; et al. Balancing hydropower and biodiversity in the Amazon, Congo, and Mekong. Science 2016, 351, 128–129. [Google Scholar] [CrossRef] [Green Version]
- Wolter, C.; Arlinghaus, R. Navigation impacts on freshwater fish assemblages: The ecological relevance of swimming performance. Rev. Fish Biol. Fish. 2003, 13, 68–89. [Google Scholar] [CrossRef]
- Radinger, J.; Essl, F.; Hölker, F.; Horký, P.; Slavík, O.; Wolter, C. The future distribution of river fish: The complex interplay of climate and land use changes, species dispersal and movement barriers. Glob. Chang. Biol. 2017, 23, 4970–4986. [Google Scholar] [CrossRef]
- Rodriguez-Dominguez, A.; Connell, S.D.; Leung, J.Y.S.; Nagelkerken, I. Adaptive responses of fishes to climate change: Feedback between physiology and behaviour. Sci. Total Environ. 2019, 692, 1242–1249. [Google Scholar] [CrossRef]
- Parmesan, C. Ecological and Evolutionary Responses to Recent Climate Change. Annu. Rev. Ecol. Evol. Syst. 2006, 37, 637–669. [Google Scholar] [CrossRef] [Green Version]
- Biro, P.A.; Post, J.R.; Booth, D.J. Mechanisms for climate-induced mortality of fish populations in whole-lake experiments. Proc. Natl. Acad. Sci. USA 2007, 104, 9715–9719. [Google Scholar] [CrossRef] [Green Version]
- Olden, J.D.; Poff, N.L.; Douglas, M.R.; Douglas, M.E.; Fausch, K.D. Ecological and evolutionary consequences of biotic homogenization. Trends Ecol. Evol. 2004, 19, 18–24. [Google Scholar] [CrossRef]
- Villéger, S.; Blanchet, S.; Beauchard, O.; Oberdorff, T.; Brosse, S. Homogenization patterns of the world’s freshwater fish faunas. Proc. Natl. Acad. Sci. USA 2011, 108, 18003–18008. [Google Scholar] [CrossRef] [PubMed] [Green Version]
- Frehse, F.A.; Braga, R.R.; Nocera, G.A.; Vitule, J.R.S. Non-native species and invasion biology in a megadiverse country: Scientometric analysis and ecological interactions in Brazil. Biol. Invasions 2016, 18, 3713. [Google Scholar] [CrossRef]
- Zakaria-Ismail, M. Zoogeography and biodiversity of the freshwater fishes of Southeast Asia. Hydrobiologia 1994, 285, 41–48. [Google Scholar] [CrossRef]
- Chen, Y.; Qu, X.; Xiong, F.Y.; Liu, Y.; Wang, L.Z.; Hughes, R.M. Challenges to saving China’s freshwater biodiversity: Fishery exploitation and landscape pressures. Ambio 2020, 49, 926–938. [Google Scholar] [CrossRef]
- Zhang, H.; Jarić, I.; Roberts, D.L.; He, Y.F.; Du, H.; Wu, J.; Wang, C.; Wei, Q. Extinction of one of the world’s largest freshwater fishes: Lessons for conserving the endangered Yangtze fauna. Sci. Total Environ. 2020, 710, 136242. [Google Scholar] [CrossRef]
- Liu, C.L.; He, D.K.; Chen, Y.F.; Olden, J.D. Species invasions threaten the antiquity of China’s freshwater fish fauna. Divers. Distrib. 2017, 23, 556–566. [Google Scholar] [CrossRef]
- Xiong, W.; Sui, X.Y.; Liang, S.H.; Che, Y.F. Non-native freshwater fish species in China. Rev. Fish Biol. Fish. 2015, 25, 651–687. [Google Scholar] [CrossRef]
- Wang, G.Y.; Innes, J.L.; Hajjar, R.; Zhang, X.P.; Wang, J.X. Public Awareness and Perceptions of Watershed Management in the Min River Area, Fujian, China. Soc. Natur. Resour. 2013, 26, 586–604. [Google Scholar] [CrossRef]
- Wu, H.W. Notes on the fishes from the Coast of Foochow region and Ming River. Contributions from the Biological Laboratory of the Science Society of China Nanking. Zool. Ser. 1931, 7, 1–64. [Google Scholar]
- Nichols, J.T.; Tyler, R. The Freshwater Fishes of China; American Museum of Natural History: New York, NY, USA, 1943; p. 322. [Google Scholar]
- Anonymous. List and Distribution of Fishes in Minjiang River. Fujian Fish. 1987, 1987, 42–48. [Google Scholar]
- Fujian Chorography Compilation Committee. Fujian Chorography; Fangzi Publishing: Fuzhou, China, 2002. [Google Scholar]
- National Bureau of Statistics. China Population Statistics Yearbook; China Statistics Press: Beijing, China, 1988. [Google Scholar]
- National Bureau of Statistics. China Population Statistics Yearbook; China Statistics Press: Beijing, China, 2015. [Google Scholar]
- Clarke, K.R.; Warwick, R.M. A taxonomic distinctness index and its statistical properties. J. Appl. Ecol. 1998, 35, 523–531. [Google Scholar] [CrossRef]
- Clarke, K.R.; Warwick, R.M. A further biodiversity index applicable to species lists: Variation in taxonomic distinctness. Mar. Ecol. Prog. Ser. 2001, 216, 265–278. [Google Scholar] [CrossRef]
- Rahel, F.J. Homogenization, differentiation, and the widespread alteration of fish faunas. In Community Ecology of Stream Fishes: Concepts, Approaches, and Techniques; American Fisheries Society, Symposium: Bethesda, MD, USA, 2010; Volume 73, pp. 311–326. [Google Scholar]
- Chen, Y.Y. Systematic studies on the fishes of the family Homalopteridae of China II. Classification of the fishes of the subfamily Gastromyzoninae. Acta Hydrobiol. Sin. 1980, 7, 95–120. [Google Scholar]
- Fishes of Fujian Province Editorial Subcommittee. The Fishes of Fujian Province (Part I); Fujian Science and Technology Press: Fuzhou, China, 1984. [Google Scholar]
- Margules, C.R.; Pressey, R.L. Systematic conservation planning. Nature 2000, 405, 243–253. [Google Scholar]
- Strecker, A.L.; Olden, J.D.; Whittier, J.B.; Paukert, C.P. Defining conservation priorities for freshwater fishes according to taxonomic, functional, and phylogenetic diversity. Ecol. Appl. 2011, 21, 3002–3013. [Google Scholar] [CrossRef] [Green Version]
- Heino, J. The relationship between species richness and taxonomic distinctness in freshwater organisms. Limnol. Oceanogr. 2005, 50, 978–986. [Google Scholar] [CrossRef]
- Kang, B.; Huang, X.X.; Yan, Y.Z.; Yan, Y.R.; Lin, H.D. Continental-scale analysis of taxonomic and functional fish diversity in the Yangtze river. Glob. Ecol. Conserv. 2018, 15, e00442. [Google Scholar] [CrossRef]
- Brown, B.L.; Swan, C.M. Dendritic network structure constrains metacommunity properties in riverine ecosystems. J. Anim. Ecol. 2010, 79, 571–580. [Google Scholar]
- Tonkin, J.D.; Heino, J.; Altermatt, F. Metacommunities in river networks: The importance of network structure and connectivity on patterns and processes. Freshw. Biol. 2018, 63, 1–5. [Google Scholar] [CrossRef] [Green Version]
- Landeiro, V.L.; Magnusson, W.E.; Melo, A.S.; Espírito-Santo, H.M.; Bini, L.M. Spatial eigenfunction analyses in stream networks: Do watercourse and overland distances produce different results? Freshw. Biol. 2011, 56, 1184–1192. [Google Scholar] [CrossRef]
- Dias, M.S.; Cornu, J.F.; Oberdorff, T.; Lasso, C.A.; Tedesco, P.A. Natural fragmentation in river networks as a driver of speciation for freshwater fishes. Ecography 2013, 36, 683–689. [Google Scholar]
- Liu, Y.; Wang, Y.R.; Zhu, Q.; Li, Y.R.; Kang, B.; Chu, L.; Yan, Y.Z. Effects of low-head dams on fish assemblages in subtropical streams: Context dependence on species category and data type. River Res. Appl. 2019, 35, 396–404. [Google Scholar]
- Yang, Y.C.E.; Cai, X.; Herricks, E.E. Identification of hydrologic indicators related to fish diversity and abundance: A data mining approach for fish community analysis. Water Resour. Res. 2008, 44, W04412. [Google Scholar]
- Chevalier, M.; Comte, L.; Laffaille, P.; Grenouillet, G. Interactions between species attributes explain population dynamics in stream fishes under changing climate. Ecosphere 2018, 9, e02061. [Google Scholar] [CrossRef] [Green Version]
- Daufresne, M.; Boët, P. Climate change impacts on structure and diversity of fish communities in rivers. Glob. Chang. Biol. 2007, 13, 2467–2478. [Google Scholar]
- Piniewski, M.; Prudhomme, C.; Acreman, M.C.; Tyle, L.; Oglęcki, P.; Okruszko, T. Responses of fish and invertebrates to floods and droughts in Europe. Ecohydrology 2016, 10, e1793. [Google Scholar]
- Hughes, B.B.; Levey, M.D.; Fountain, M.C.; Carlisle, A.B.; Chavez, F.P.; Gleason, M.G. Climate mediates hypoxic stress on fish diversity and nursery function at the land–sea interface. Proc. Natl. Acad. Sci. USA 2015, 112, 8025–8030. [Google Scholar]
- Bassem, S.M. Water pollution and aquatic biodiversity. Biodivers. Int. J. 2020, 4, 10–16. [Google Scholar]
- Xenopoulos, M.A.; Lodge, D.M. Going with the flow: Using species-discharge relationships for forecast losses in fish biodiversity. Ecology 2006, 87, 1907–1914. [Google Scholar]
- Buisson, L.; Thuiller, W.; Lek, S.; Lim, P.; Grenouillet, G. Climate change hastens the turnover of stream fish assemblages. Glob. Chang. Biol. 2008, 14, 2232–2248. [Google Scholar] [CrossRef]
- Vörösmarty, C.J.; Mclntyre, P.B.; Gessner, M.O.; Dudgeon, D.; Prusevich, A.; Green, P.; Glidden, S.; Bunn, S.E.; Sullivan, C.A.; Liermann, C.R.; et al. Global threats to human water security and river biodiversity. Nature 2010, 467, 555–561. [Google Scholar] [CrossRef]
- Zhao, L.J.; Chenoweth, E.L.; Li, J.; Liu, Q.G. Effects of dam structures on genetic diversity of freshwater fish Sinibrama macrops in Min River, China. Biochem. Syst. Ecol. 2016, 68, 216–222. [Google Scholar]
- Kang, B.; Deng, J.M.; Huang, X.X.; Chen, L.Q.; Feng, Y. Explaining freshwater fish biogeography: History versus environment versus species personality. Rev. Fish Biol. Fish. 2013, 23, 523–536. [Google Scholar] [CrossRef]
- Vitule, J.R.S.; Skóra, F.; Abilhoa, V. Homogenization of freshwater fish faunas after the elimination of a natural barrier by a dam in Neotropics. Divers. Distrib. 2012, 18, 111–120. [Google Scholar]
- Kang, B.; Deng, J.M.; Wang, Z.M.; Zhang, J. Transplantation of Icefish (Salangidae) in China: Glory or Disaster? Rev. Aquac. 2015, 7, 13–27. [Google Scholar] [CrossRef]
- Li, S.; Chen, J.K.; Wang, X.M. Global distribution, entry routes, mechanisms and consequences of invasive freshwater fish. Biodivers. Sci. 2016, 24, 672–685. [Google Scholar]
- Wan, A.; Zhang, X.K.; Liu, Z.G.; Wang, H.L.; Chen, M.M.; Zhou, S.; Yu, D.P. Morphological characteristics of the green sunfish (Lepomis cyanellus) in Heigou creek, Ta-Pieh Mountains. Acta Hydrobiol. Sin. 2017, 41, 194–200. [Google Scholar]
Figure 1.
Map of freshwater fish sampling sites in the Min River, the biggest river in Southeastern China.
Figure 1.
Map of freshwater fish sampling sites in the Min River, the biggest river in Southeastern China.

Figure 2.
Species richness at various sites in space of the Min River at two different periods: the 1970s and 2015.
Figure 2.
Species richness at various sites in space of the Min River at two different periods: the 1970s and 2015.

Figure 3.
Values (minimum, mean ± SD, maximum) and divergence (different letters means significant differences) of the taxonomic diversity of fishes in the Min River between the 1970s and 2015. (A) average taxonomic distinctness (Δ+); (B) the variation in taxonomic distinctness (Λ+). Different lowercase letter means significant difference.


Table 1.
Jaccard’s similarities index of fish fauna composition in the Min River. Italic numbers in bottom-left were similarities between paired sites in 1970s; numbers in upper-right were similarities between paired sites in 2015; numbers in black grids were similarities between the same sites in two periods.
| Site | 1 | 2 | 3 | 4 | 5 | 6 | 7 | 8 | 9 | 10 | 11 | 12 | 13 | 14 | 15 | 16 | 17 | 18 | 19 | 20 | 21 | 22 | 23 | 24 |
|---|---|---|---|---|---|---|---|---|---|---|---|---|---|---|---|---|---|---|---|---|---|---|---|---|
| 1 | 0.26 | 0.26 | 0.23 | 0.13 | 0.32 | 0.08 | 0.10 | 0.33 | 0.33 | 0.12 | 0.12 | 0.18 | 0.19 | 0.20 | 0.16 | 0.10 | 0.14 | 0.33 | 0.26 | 0.22 | 0.24 | 0.25 | 0.15 | 0.15 |
| 2 | 0.51 | 0.16 | 0.42 | 0.23 | 0.35 | 0.23 | 0.21 | 0.20 | 0.27 | 0.19 | 0.13 | 0.14 | 0.25 | 0.11 | 0.12 | 0.14 | 0.25 | 0.20 | 0.20 | 0.13 | 0.11 | 0.09 | 0.11 | 0.05 |
| 3 | 0.58 | 0.56 | 0.05 | 0.36 | 0.37 | 0.19 | 0.37 | 0.11 | 0.21 | 0.57 | 0.11 | 0.12 | 0.13 | 0.05 | 0.05 | 0.23 | 0.13 | 0.11 | 0.23 | 0.05 | 0.13 | 0.06 | 0.21 | 0.05 |
| 4 | 0.40 | 0.47 | 0.46 | 0.16 | 0.32 | 0.20 | 0.47 | 0.11 | 0.14 | 0.40 | 0.05 | 0.06 | 0.13 | 0.10 | 0.05 | 0.24 | 0.21 | 0.11 | 0.24 | 0.05 | 0.16 | 0.12 | 0.10 | 0.05 |
| 5 | 0.40 | 0.47 | 0.46 | 1.00 | 0.19 | 0.14 | 0.23 | 0.23 | 0.21 | 0.22 | 0.08 | 0.14 | 0.20 | 0.12 | 0.22 | 0.10 | 0.20 | 0.29 | 0.43 | 0.17 | 0.21 | 0.16 | 0.26 | 0.12 |
| 6 | 0.41 | 0.42 | 0.57 | 0.89 | 0.89 | 0.13 | 0.25 | 0.11 | 0.14 | 0.24 | 0.11 | 0.13 | 0.31 | 0.16 | 0.17 | 0.44 | 0.21 | 0.18 | 0.08 | 0.11 | 0.22 | 0.16 | 0.10 | 0.10 |
| 7 | 0.39 | 0.45 | 0.45 | 0.96 | 0.96 | 0.86 | 0.18 | 0.08 | 0.10 | 0.47 | 0.04 | 0.09 | 0.14 | 0.07 | 0.04 | 0.43 | 0.14 | 0.08 | 0.22 | 0.04 | 0.31 | 0.10 | 0.12 | 0.04 |
| 8 | 0.39 | 0.45 | 0.45 | 0.96 | 0.96 | 0.86 | 1.00 | 0.13 | 0.38 | 0.05 | 0.16 | 0.18 | 0.27 | 0.26 | 0.28 | 0.08 | 0.19 | 0.38 | 0.17 | 0.29 | 0.21 | 0.22 | 0.20 | 0.14 |
| 9 | 0.37 | 0.38 | 0.42 | 0.75 | 0.75 | 0.76 | 0.73 | 0.73 | 0.09 | 0.12 | 0.20 | 0.14 | 0.36 | 0.18 | 0.27 | 0.09 | 0.25 | 0.38 | 0.14 | 0.29 | 0.14 | 0.13 | 0.18 | 0.18 |
| 10 | 0.40 | 0.47 | 0.46 | 1.00 | 1.00 | 0.89 | 0.96 | 0.96 | 0.75 | 0.13 | 0.15 | 0.11 | 0.11 | 0.04 | 0.04 | 0.32 | 0.05 | 0.05 | 0.16 | 0.05 | 0.18 | 0.11 | 0.14 | 0.04 |
| 11 | 0.29 | 0.31 | 0.33 | 0.61 | 0.61 | 0.60 | 0.61 | 0.61 | 0.66 | 0.61 | 0.08 | 0.25 | 0.27 | 0.33 | 0.15 | 0.08 | 0.12 | 0.16 | 0.04 | 0.38 | 0.10 | 0.11 | 0.14 | 0.09 |
| 12 | 0.26 | 0.30 | 0.33 | 0.58 | 0.58 | 0.59 | 0.58 | 0.58 | 0.58 | 0.58 | 0.80 | 0.07 | 0.21 | 0.29 | 0.11 | 0.08 | 0.13 | 0.18 | 0.08 | 0.18 | 0.13 | 0.09 | 0.22 | 0.10 |
| 13 | 0.30 | 0.32 | 0.35 | 0.66 | 0.66 | 0.65 | 0.66 | 0.66 | 0.59 | 0.66 | 0.90 | 0.88 | 0.09 | 0.31 | 0.25 | 0.14 | 0.23 | 0.27 | 0.09 | 0.27 | 0.19 | 0.16 | 0.24 | 0.24 |
| 14 | 0.30 | 0.28 | 0.33 | 0.54 | 0.54 | 0.59 | 0.53 | 0.53 | 0.55 | 0.54 | 0.57 | 0.64 | 0.62 | 0.10 | 0.32 | 0.07 | 0.31 | 0.33 | 0.11 | 0.33 | 0.17 | 0.24 | 0.18 | 0.18 |
| 15 | 0.34 | 0.42 | 0.41 | 0.83 | 0.83 | 0.78 | 0.80 | 0.80 | 0.67 | 0.83 | 0.61 | 0.62 | 0.68 | 0.53 | 0.11 | 0.07 | 0.25 | 0.44 | 0.26 | 0.35 | 0.15 | 0.25 | 0.19 | 0.25 |
| 16 | 0.40 | 0.47 | 0.46 | 1.00 | 1.00 | 0.89 | 0.96 | 0.96 | 0.75 | 1.00 | 0.61 | 0.58 | 0.66 | 0.54 | 0.83 | 0.23 | 0.14 | 0.12 | 0.17 | 0.04 | 0.30 | 0.13 | 0.11 | 0.07 |
| 17 | 0.42 | 0.46 | 0.51 | 0.49 | 0.49 | 0.52 | 0.48 | 0.48 | 0.49 | 0.49 | 0.44 | 0.42 | 0.47 | 0.42 | 0.42 | 0.49 | 0.13 | 0.36 | 0.19 | 0.27 | 0.10 | 0.13 | 0.17 | 0.11 |
| 18 | 0.48 | 0.50 | 0.43 | 0.38 | 0.38 | 0.34 | 0.37 | 0.37 | 0.43 | 0.38 | 0.44 | 0.31 | 0.35 | 0.29 | 0.32 | 0.38 | 0.39 | 0.18 | 0.33 | 0.38 | 0.21 | 0.30 | 0.20 | 0.33 |
| 19 | 0.33 | 0.34 | 0.44 | 0.42 | 0.42 | 0.47 | 0.41 | 0.41 | 0.58 | 0.42 | 0.52 | 0.45 | 0.46 | 0.43 | 0.47 | 0.42 | 0.46 | 0.47 | 0.22 | 0.17 | 0.21 | 0.18 | 0.20 | 0.15 |
| 20 | 0.56 | 0.64 | 0.57 | 0.38 | 0.38 | 0.34 | 0.37 | 0.37 | 0.29 | 0.38 | 0.24 | 0.26 | 0.28 | 0.23 | 0.34 | 0.38 | 0.46 | 0.50 | 0.33 | 0.30 | 0.10 | 0.26 | 0.20 | 0.20 |
| 21 | 0.58 | 0.57 | 0.56 | 0.40 | 0.40 | 0.36 | 0.39 | 0.39 | 0.31 | 0.40 | 0.27 | 0.29 | 0.31 | 0.27 | 0.36 | 0.40 | 0.45 | 0.53 | 0.37 | 0.75 | 0.25 | 0.34 | 0.14 | 0.17 |
| 22 | 0.52 | 0.48 | 0.50 | 0.38 | 0.38 | 0.37 | 0.39 | 0.39 | 0.32 | 0.38 | 0.34 | 0.34 | 0.38 | 0.30 | 0.38 | 0.38 | 0.42 | 0.51 | 0.37 | 0.60 | 0.58 | 0.28 | 0.17 | 0.32 |
| 23 | 0.47 | 0.52 | 0.55 | 0.52 | 0.52 | 0.49 | 0.50 | 0.50 | 0.46 | 0.52 | 0.36 | 0.41 | 0.41 | 0.35 | 0.46 | 0.52 | 0.43 | 0.38 | 0.40 | 0.53 | 0.51 | 0.44 | 0.19 | 0.18 |
| 24 | 0.62 | 0.61 | 0.64 | 0.42 | 0.42 | 0.40 | 0.40 | 0.40 | 0.34 | 0.42 | 0.26 | 0.26 | 0.30 | 0.26 | 0.37 | 0.42 | 0.47 | 0.51 | 0.35 | 0.81 | 0.78 | 0.62 | 0.58 | 0.09 |
Table 2.
Biological and ecological traits of invasive species into the Min River. Feeding habits and reproduction data were derived from www.fishbase.org; habitat data was measured and recorded in situ.
Table 2.
Biological and ecological traits of invasive species into the Min River. Feeding habits and reproduction data were derived from www.fishbase.org; habitat data was measured and recorded in situ.
| Species | English Name | Origin | Habitat | Feeding Habits | Reproduction | Threat |
|---|---|---|---|---|---|---|
| Ctenopharyngodon idella (Valenciennes, 1844) | Grass carp | Yangtze, China | Preferring standing water bodies with vegetation. Wide temperature 0–38 °C, hypoxia-tolerance. | Herbivorous, feeding on higher aquatic plants and submerged grasses, also detritus, insects and other invertebrates. | High fecundity | A pest because of the damages to submerged vegetation |
| Megalobrama amblycephala Yih, 1955 | Wuchang bream | Yangtze, China | Preferring standing water bodies with vegetation. Temperate 10–20 °C. | Herbivorous, feeding on higher aquatic plants and submerged grasses, also zooplankton. | High fecundity | Not evaluated |
| Oreochromis mossambicus (Peters, 1852) | Mozambique tilapia | Africa | Thriving in standing water. Extended temperature 8–42 °C, hypoxia-tolerance. | Omnivorous with high plasticity, mainly feeding on algae and phytoplankton, also zooplankton, small insects, and shrimps. | High fecundity | A most successful and vagile invader |
| Hemibagrus macropterus Bleeker, 1870 | Chinese catfish | Yangtze, Pearl, China | Preferring running water with pebbly bottom. | Carnivorous, mainly feeding on benthic invertebrates. | Adhesive egg | Not evaluated |
| Lepomis gulosus (Cuvier, 1829) | Warmouth | North America | Adapting to multiple habitat types. Wide temperature 1–38 °C. | Ominivorous, mainly feeding on plankton, auqatic insects, mollsca, and small fishes. | Multiple spawning, high fecundity | A successful and vagile invader |
| Sinibotia superciliaris (Günther, 1892) | Golden Chinese loach | Yangtze, Upper Mekong, China | Preferring running water. | Carnivorous, mainly feeding on benthic invertebrates. | Single spawning | Not evaluated |
© 2020 by the authors. Licensee MDPI, Basel, Switzerland. This article is an open access article distributed under the terms and conditions of the Creative Commons Attribution (CC BY) license (http://creativecommons.org/licenses/by/4.0/).
Share and Cite
MDPI and ACS Style
Deng, W.; Lin, L.; Huang, X.; Liao, T.-Y.; Kang, B. Climate Change and Species Invasion Drive Decadal Variation in Fish Fauna in the Min River, China. Water 2020, 12, 1558. https://doi.org/10.3390/w12061558
AMA Style
Deng W, Lin L, Huang X, Liao T-Y, Kang B. Climate Change and Species Invasion Drive Decadal Variation in Fish Fauna in the Min River, China. Water. 2020; 12(6):1558. https://doi.org/10.3390/w12061558
Chicago/Turabian StyleDeng, Weide, Li Lin, Xiaoxia Huang, Te-Yu Liao, and Bin Kang. 2020. "Climate Change and Species Invasion Drive Decadal Variation in Fish Fauna in the Min River, China" Water 12, no. 6: 1558. https://doi.org/10.3390/w12061558
Note that from the first issue of 2016, this journal uses article numbers instead of page numbers. See further details here.