Development Trends and Frontiers of Ocean Big Data Research Based on CiteSpace

1
College of Information Science and Engineering, Ocean University of China, Qingdao 266100, China
2
Pilot National Laboratory for Marine Science and Technology, College of Information Science and Engineering, Ocean University of China, Qingdao 266100, China
*
Authors to whom correspondence should be addressed.
Water 2020, 12(6), 1560; https://doi.org/10.3390/w12061560
Submission received: 7 April 2020
/
Revised: 24 May 2020
/
Accepted: 25 May 2020
/
Published: 29 May 2020
(This article belongs to the Section Oceans and Coastal Zones)
Abstract
:Modern socio-economic development and climate prediction depend greatly on the application of ocean big data. With the accelerated development of ocean observation methods and the continuous improvement of the big data science, the challenges of multiple data sources and data diversity have emerged in the ocean field. As a result, the current data magnitude has reached the terabyte scale. Currently, the traditional theoretical foundation and technical methods have their inherent limitations and demerits that cannot satisfied the temporal and spatial attributes of the current ocean big data. Numerous scholars and countries were involved in ocean big data research. To explore the focus and current status, and determine the topics of research on bursts and acquisition of trend related to ocean big data, 400 articles between 1990 and 2019 were collected from the “Web of Science.” Combined with visualization software CiteSpace, bibliometrics method and literature combing technology, the pivotal literature related to ocean big data, including significant level countries, institutions, authors, journals and keywords were recognized. A synthetical analysis has revealed research hot spots and research frontiers. The purpose of this study is to provide researchers and practitioners in the field of ocean big data with the main research domains and research hotspots, and orientation for further research.
1. Introduction
The oceans are the cradle of human survival and constitute the largest ecological cycle system in our nature. The oceans contain nearly 500,000 species of animals and 13,500 plants [1]. The ocean with abundant water resources has even influenced the global climate cycle. The gradual decrease in the storage of land mineral resources, continuous expansion of the urban population and severe traffic congestion have made humans aware that the ocean will be the “second territory” for human sustainable development. That is why the development of marine science and technology has received global attention.
A great number of available ocean observation and survey methods, such as offshore mapping; island surveillance; underwater detection; oil and gas platform environment monitoring; and satellite remote sensing monitoring, comprise a very large ocean observation monitoring system. This system has accumulated a large amount of ocean science data [2]. Followed the development of ocean information technology, the investigation and development of dynamic oceans, ocean ecology and ocean resources, and the integrated management of offshore oceans, the temperature and salinity depth measurement technology will fully show that it has broad application prospects. It can be seen that the research on the performance of marine sensors has also been a hot topic in recent years. The surface and underwater platform technologies of the United States, Norway, Canada, Japan and other maritime international powers are generally in a leading position. Their technology is becoming mature and a series of products have been formed. Corresponding environmental ocean monitoring specifications and standards have been formulated. Coastal countries have realized business operations. The sensor technology mainly includes dynamic elements, biochemical elements and target detection elements. Ocean satellite remote sensing can collect nearly 70% of the atmospheric environmental parameters of the ocean. These atmospheric parameters are of great significance for the development and utilization of the marine environment and analysis of ocean exploration data [3]. A large number of applications will bring more data. The quality of ocean big data is the foundation of ocean information management. Unfortunately, ocean data unification is difficult to standardize [4]. Accompanied by the updating of ocean data acquisition technology and the increase of acquisition methods, the management of ocean data presents a multi-dimensional characteristic; meanwhile, ocean data is a typical spatial data, which presents the characteristics of spatial correlation and heterogeneity in the spatial domain [5].
For decades, numerous documents and researchers appeared in the field of ocean big data, which is developing rapidly. During the scientific and technical design phase, the world’s largest global ocean observing system, which is composed of the Intergovernmental Oceanographic Commission, the World Meteorological Organization, the Council of the International Federation of Science and the United Nations Environment Program, divided it into five modules [6]. Ocean big data have then been widely sought in five modules—climate cycle, health characteristics of the ocean environment, biological resources, various ocean activities and products and services modules. At present, there is a large number of articles and much in the way of overview literature in this field, whereas there are still few literature reviews that analyze the developmental trend of the whole ocean big data field from the perspective of the entire literature review. In addition, few of the articles combine visualization software with a literature review to study the development of the ocean big data field. Our article aims to grasp the current key points and present situation and research the developments trend and research prospects related to ocean big data articles; we combined bibliometric visualization tools to get an instant overview of the research in the ocean data research.
Thanks to information development and technological advancement, a variety of visualization tools, such as Gephi, CiteSpace and SCI2 can be used for analysis. A complex system is often defined as a system composed of a large number of interconnected parts that as a whole exhibits one or more properties that are not obvious from the properties of the individual parts. Gephi, as general complex network software, is often used in complex system. However, some complex network analysis tools (Citespace and SCI2) developed for bibliometrics fields could not be neglected for other purposes, because of some of their advantages. Compared with complex software (Gephi), bibliometrics software (CiteSpace and SCI2) are used to article analysis owing to their powerful data processing and visualization functions [7]. CiteSpace software provides more emphasis on layout algorithms and co-occurring networks can simultaneously represent time, frequency and intermediary centrality. Therefore, because of its simple operation, powerful functions and high objectivity, CiteSpace software developed by Professor Chen Chaomei was selected as the scientific map drawing tool for this study. We use CiteSpace software to identify the current development status, trends and frontiers of ocean big data research; to discover core technologies and their co-citations; and to find key literature in the field of ocean big data research from 1990 to 2019.
Our research aims to analyze the research on the applications of ocean big data over the time cycle and the data based on online databases. The optimum solution is to combine the visualization technologies. Hence, we utilize scientific knowledge mapping software, scientific literature measurement method and information visualization technology to make a quantitative analysis of articles related to ocean big data from 1980 to 2019.This review includes trends in literature output, countries and institutions and individuals who have made outstanding contributions in the ocean big data research. The purpose of this paper is to make a visual analysis of the application of big data technology in the Marine field, so as to better provide assistance for future scholars who are involved in researching big data of the ocean.
2. Materials and Methods
2.1. Data Collection
To guarantee the accuracy and comprehensiveness of the data source, the ISI Web of science data base provides normalized indexing tool for the dependability of ocean big data analysis [8]. Moreover, the standard for research discovery and analytics determines the quality of the visualization map analysis, and the precise records and back files identify hidden patterns, gaining insight into emerging research trends [9]. In the process of document collection, it is critical to control the limitation of the search documents. Broader search criteria will bring more worthless articles, which will pollute the collection results, whereas too fine an indexing will filter out relevant literature and reduce the coverage of the documents. Based on the above conclusions, the search purviews are “topic: (ocean big data)”. Search criteria are as follows: language = (English) and document types = (article or review or conference papers). The time interval was set to 1990–2019. Based on the above retrieval method, after careful screening of the article contents, 400 articles were selected, and the output file format of the rename was “download_*.txt” [9]. Appendix A provides the detailed process and constraints for selecting references on ocean big data.
2.2. Research Method
With the considerable progress of social network analysis and graph visualization of scientific knowledge in bibliometrics, scholars select statistical metrology visualization software for scientific knowledge visualization analysis [7]. CiteSpace software is a freely available Java application for visualizing and analyzing trends and patterns in scientific literature, developed by Dr. Chen Chaomei at Drexel University, United States. CiteSpace not only provides various functions to facilitate the understanding and interpretation of network patterns and historical patterns, including identifying the fast-growth topical areas; finding citation hotspots in the land of publications; and decomposing a network into clusters, automatic clusters with terms from citing articles, geospatial patterns of collaboration and unique areas of international collaboration. CiteSpace also supports structural and temporal analyses of a variety of networks derived from scientific publications, including collaboration networks, author co-citation networks and document co-citation networks.
Here, CiteSpace software was selected as the knowledge graph visualized analysis for ocean big data research [9,10]. We visualized the raw data with CiteSpace (5.6.R4) to obtain a visual knowledge map. The main steps are as follows:
Firstly, we set up a new project named “OBD WOS,” and imported 400 studies with full records and cited references into the CiteSpace visualization software in plain text format, and deduplicated the redundant data.
Secondly, we set the parameters: contains the time interval is set from 1990 to 2019, and the time slice of one year. The topics for analysis come from the title, abstract, author’s name and key words of the article. The types of node selected are country, institution, author, cited journal, reference, cited author and keyword; we selected the top 10 of the most cited items for each slice. Meanwhile, we selected the top 20% for selecting criteria, pathfinder and pruning section network pruning mode and cluster view-static mode, and showed the merged network visualization.
Thirdly, we ran CiteSpace and acquired the data network authors, institutions and countries with large numbers of publications, widely cited references and authoritative authors and journals in the research field, and the keywords that have appeared two or more times.
Finally, we learnt the relevant networks and data, and elucidated the frontiers, focus topics, development trends and contact trajectories of ocean big data field.
3. Results
3.1. Publishing Outputs Overall Characteristics
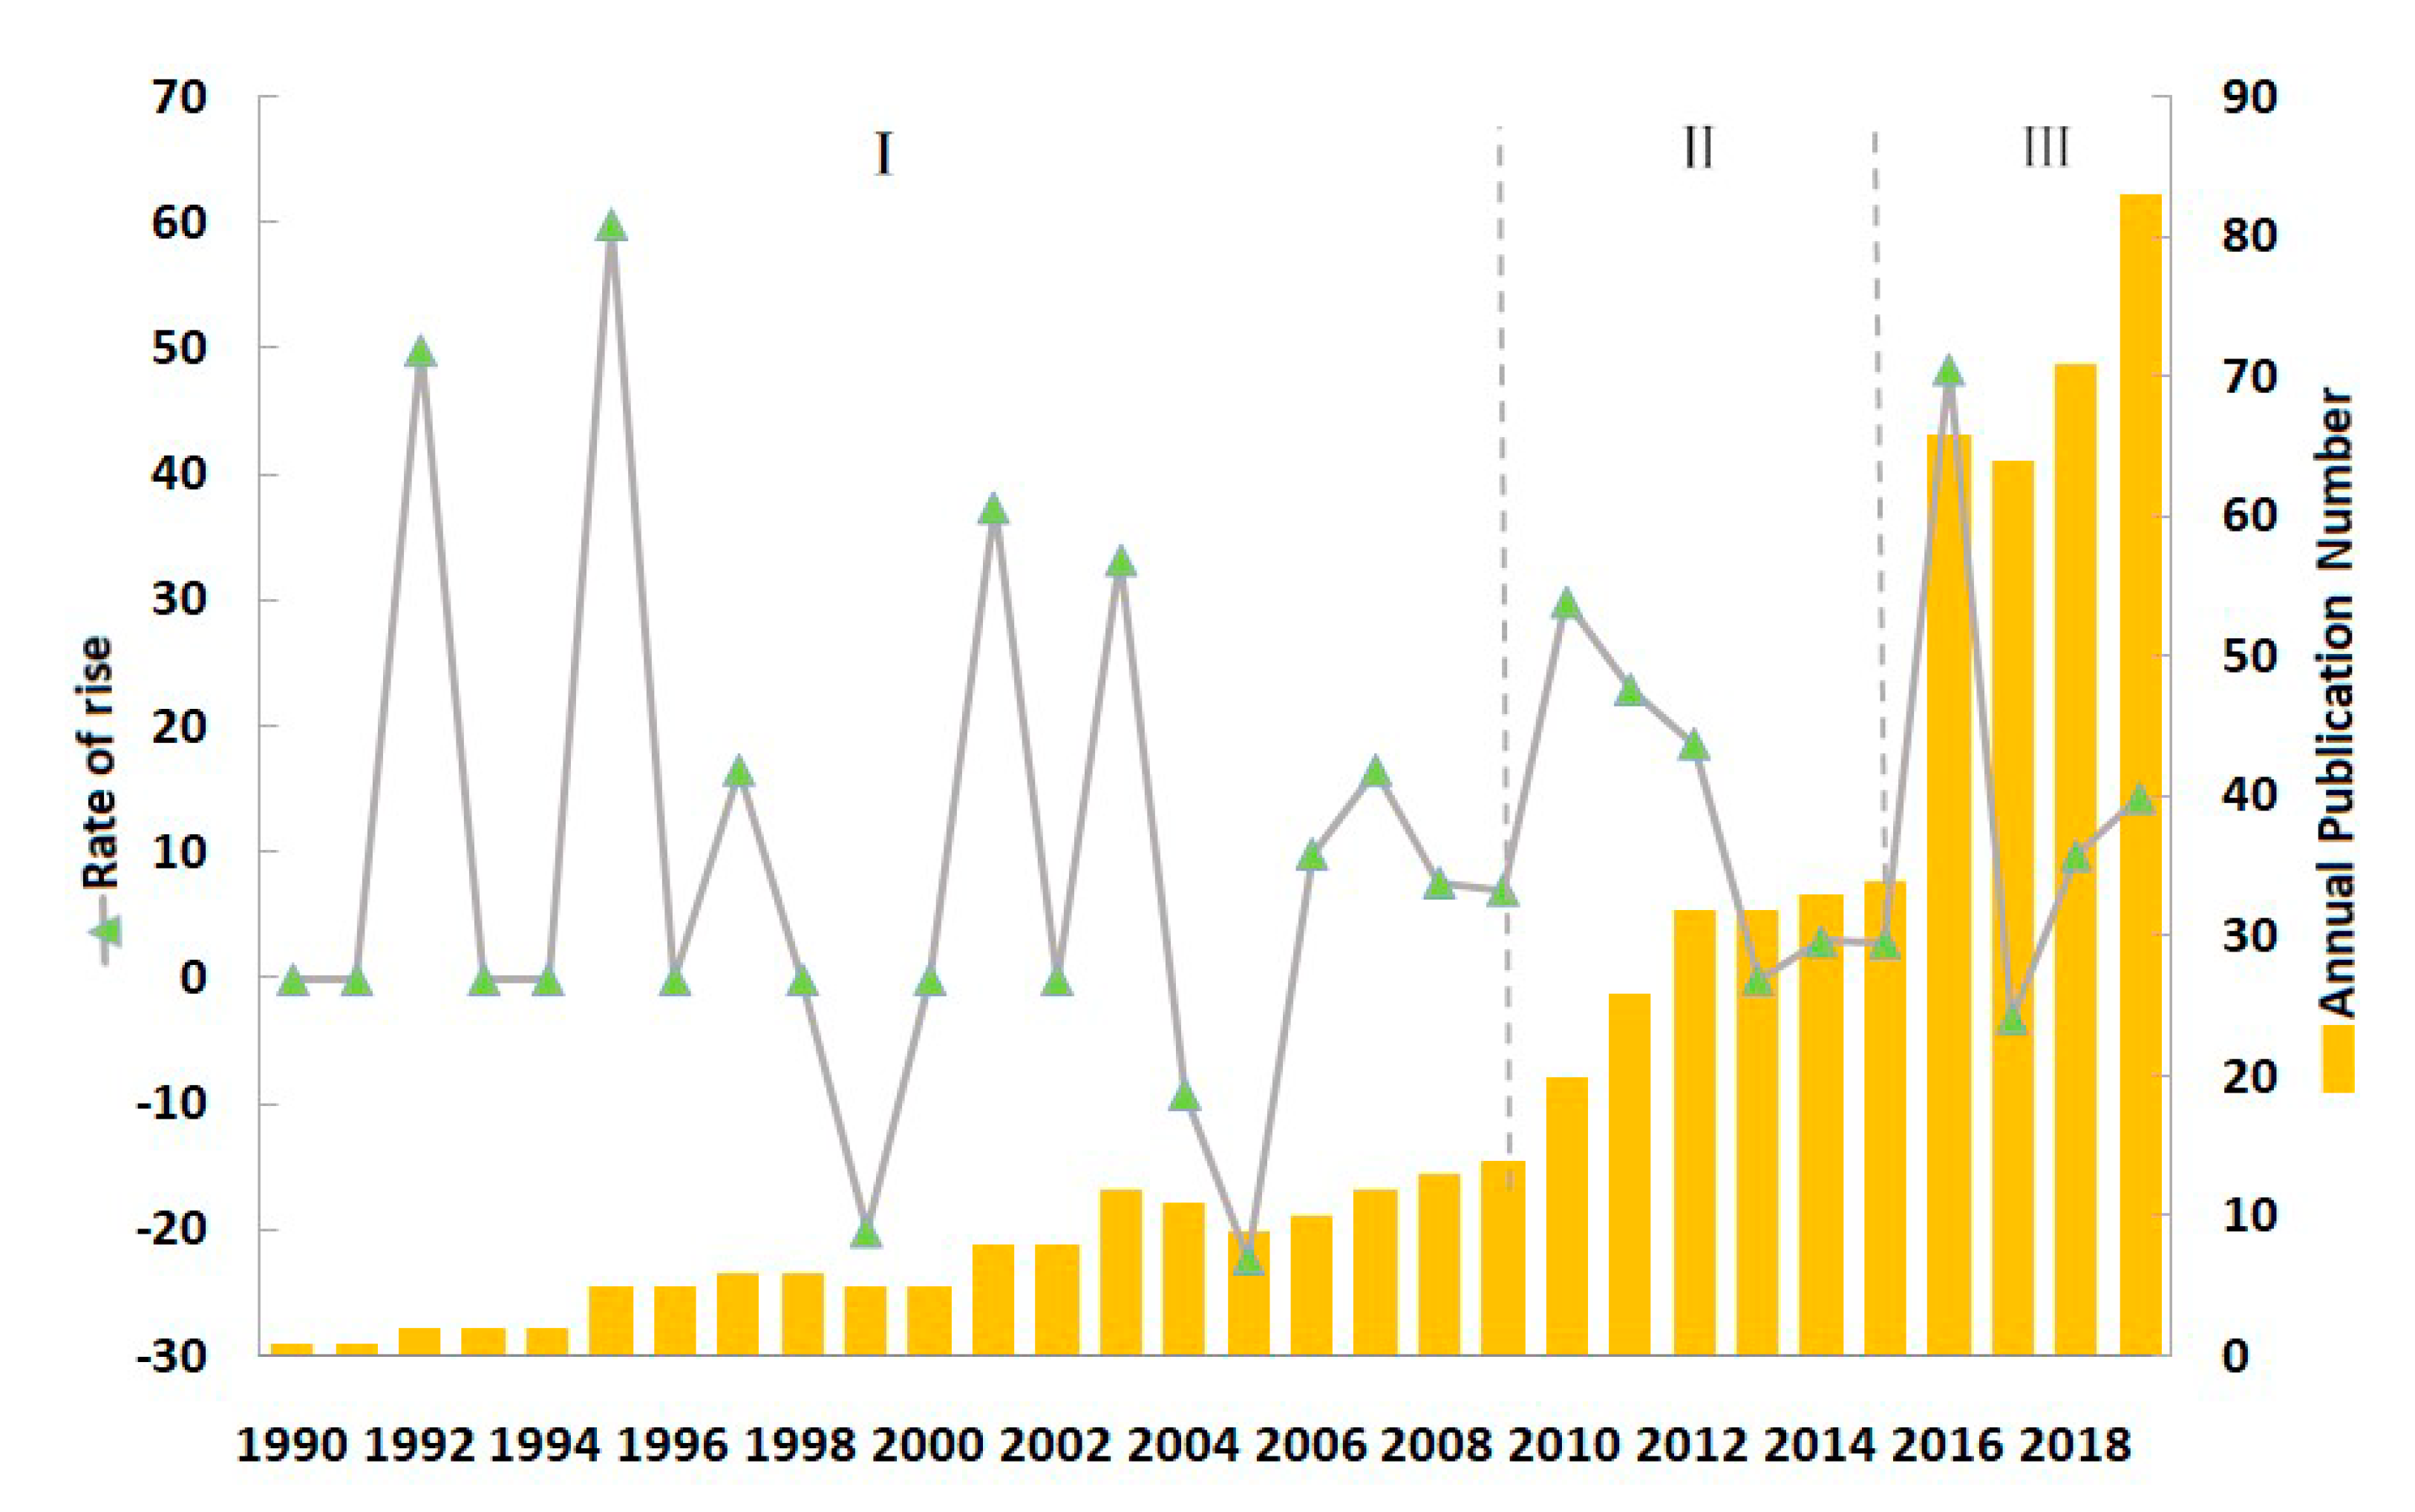
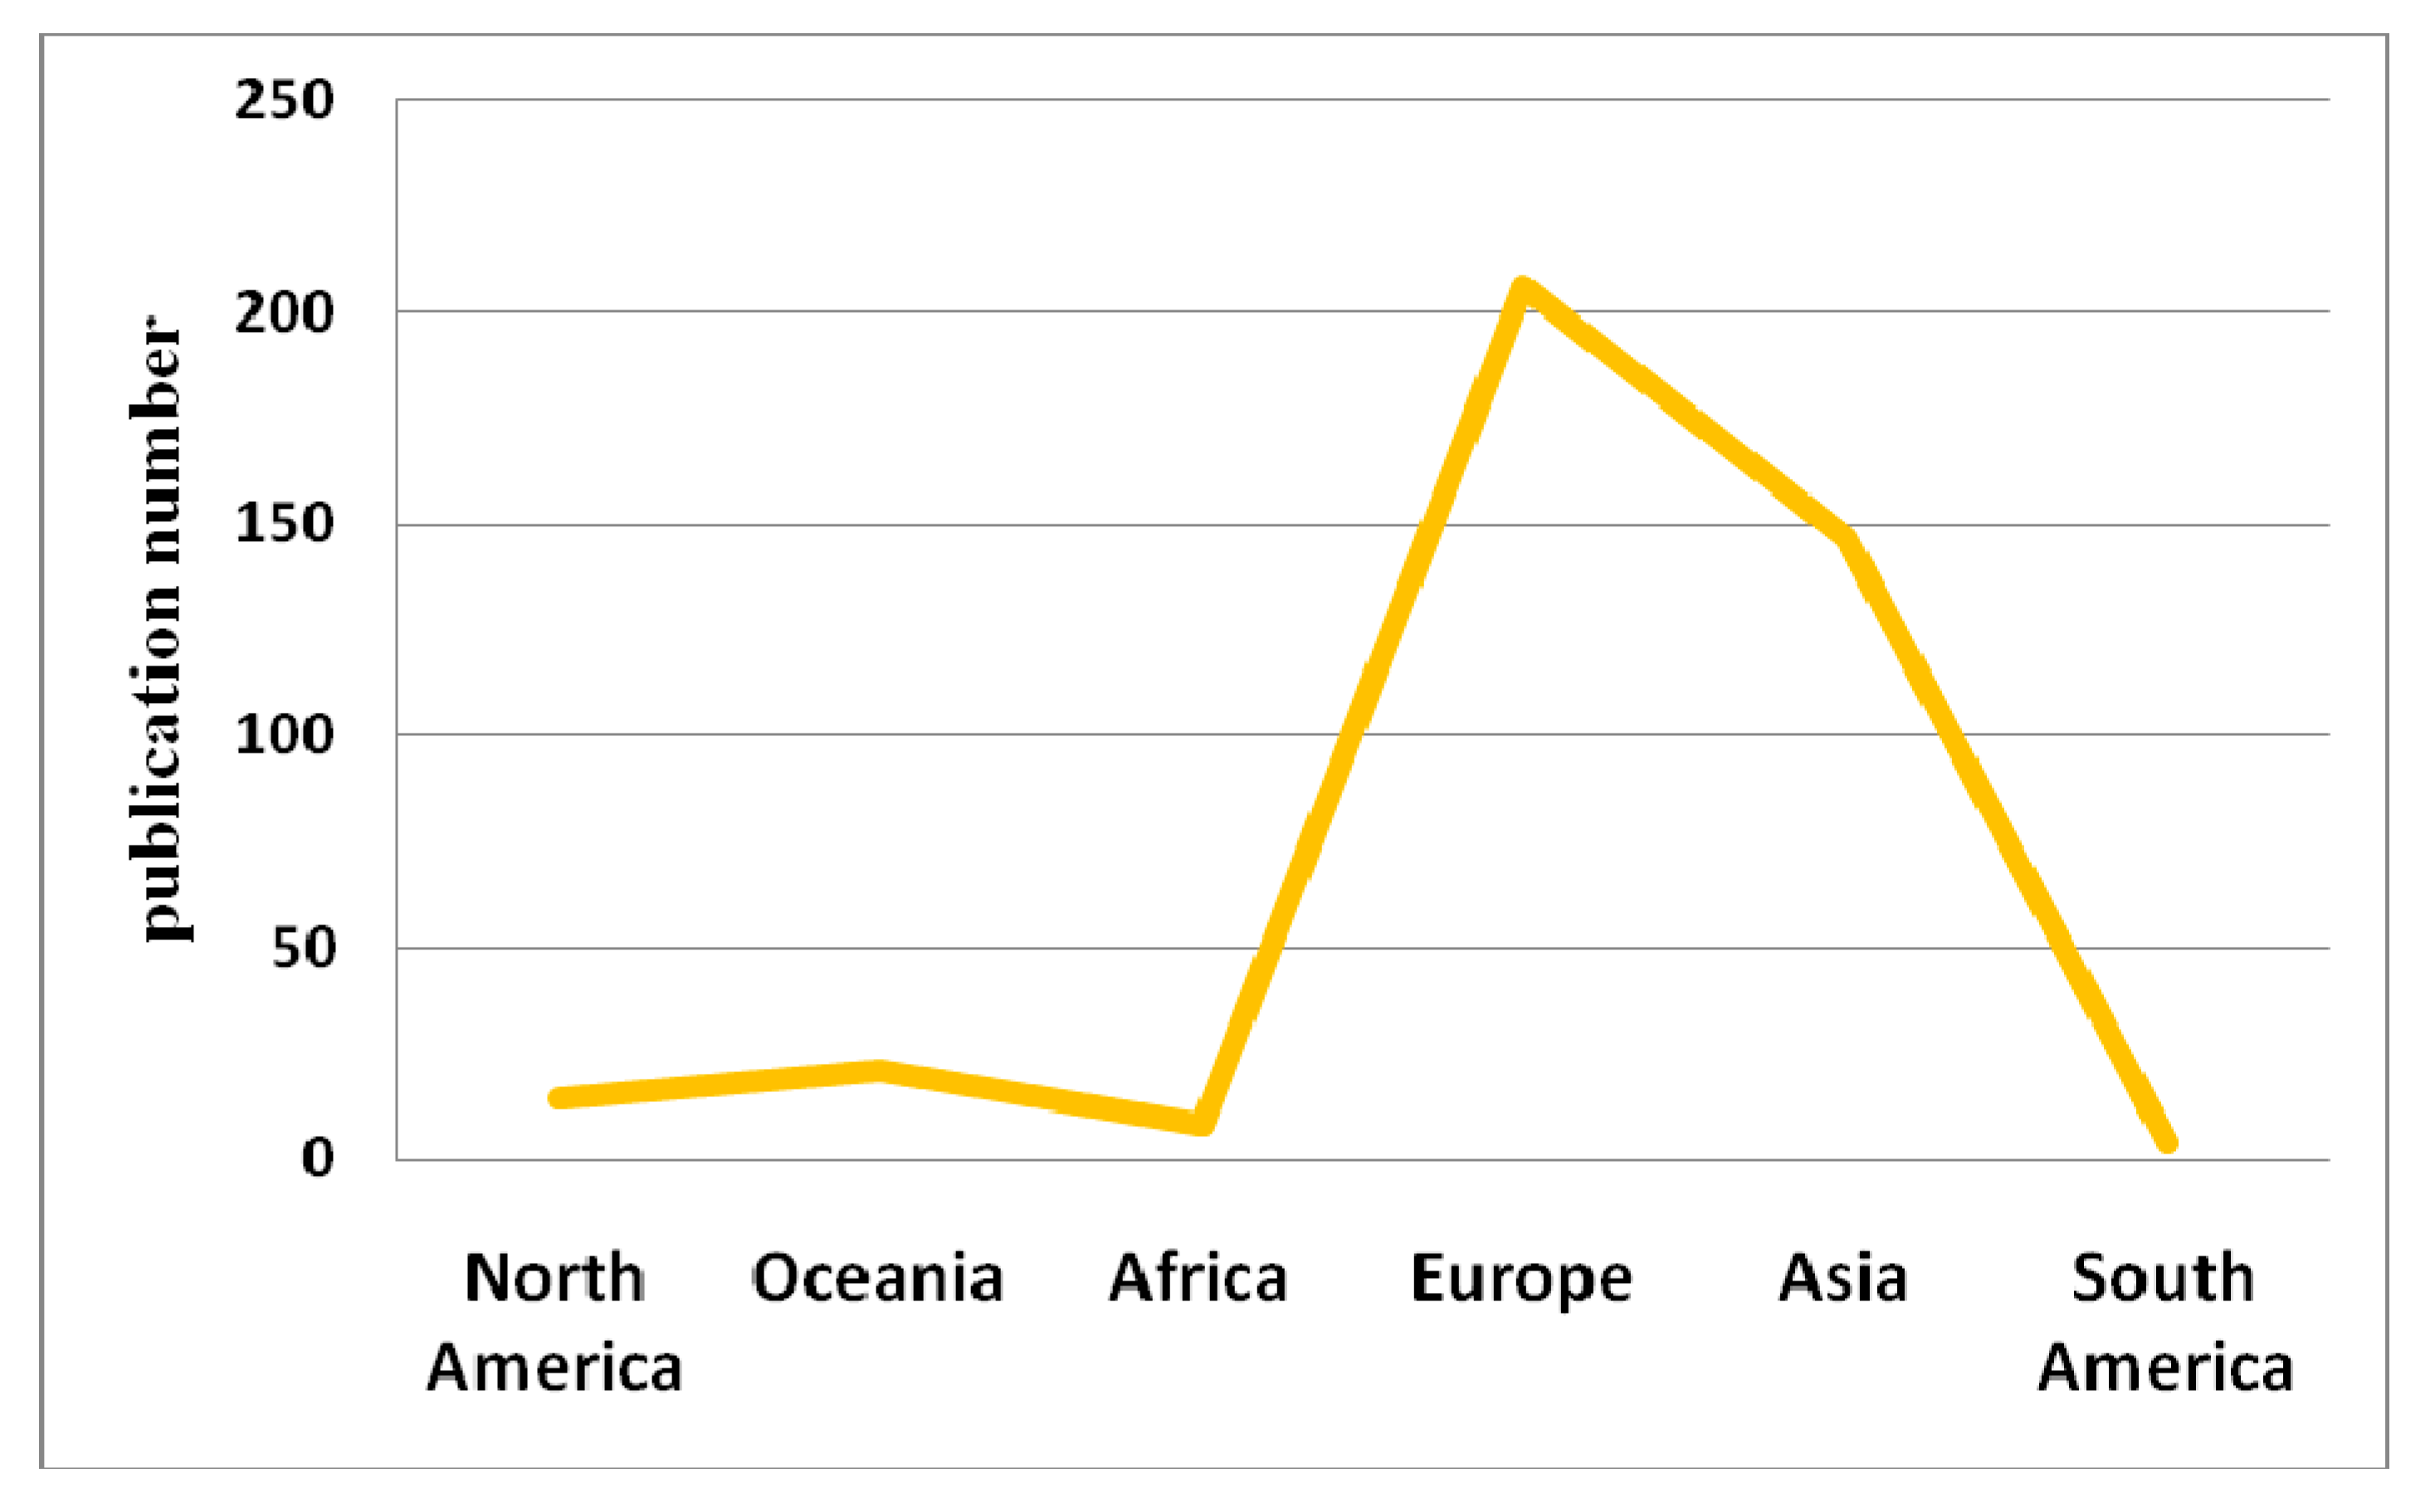
This paper formed a basic comprehension of ocean big data on the basis of demonstration classification visualization map and annual distribution statistics. As illustration in Figure 1, the applied research can be divided into three stages. The incipient progress stage was from 1990 to 2009 space; ocean big data development reality was still in the initial development stage; the number of documents to be published was less than 10 every year in this 19-year period. The next stage was from 2009 to 2015 when annually published issues steadily increased in number. By contrast, during the third phase of the last five years, the circulation of the publications increased exponentially each year; a five-year period published accounts for 53% of three decades of article printing output. According to the published count of multifarious regional statistics (Figure 2), most of the applied research was achieved in North America (United States of America) and Asia (mostly in China). The development of ocean big data has always received most attention in the Oceania and North America plate, whereas the document attention in Africa and South America areas is relatively slight and makes research development slower compared to other countries.
3.2. Collaboration Network Analysis
Collaboration analysis can contribute to the collaborative network to learn more about different countries, organizations and authors, who are making the biggest contribution in the ocean big data field [11].
3.2.1. Country Collaboration Network Analysis
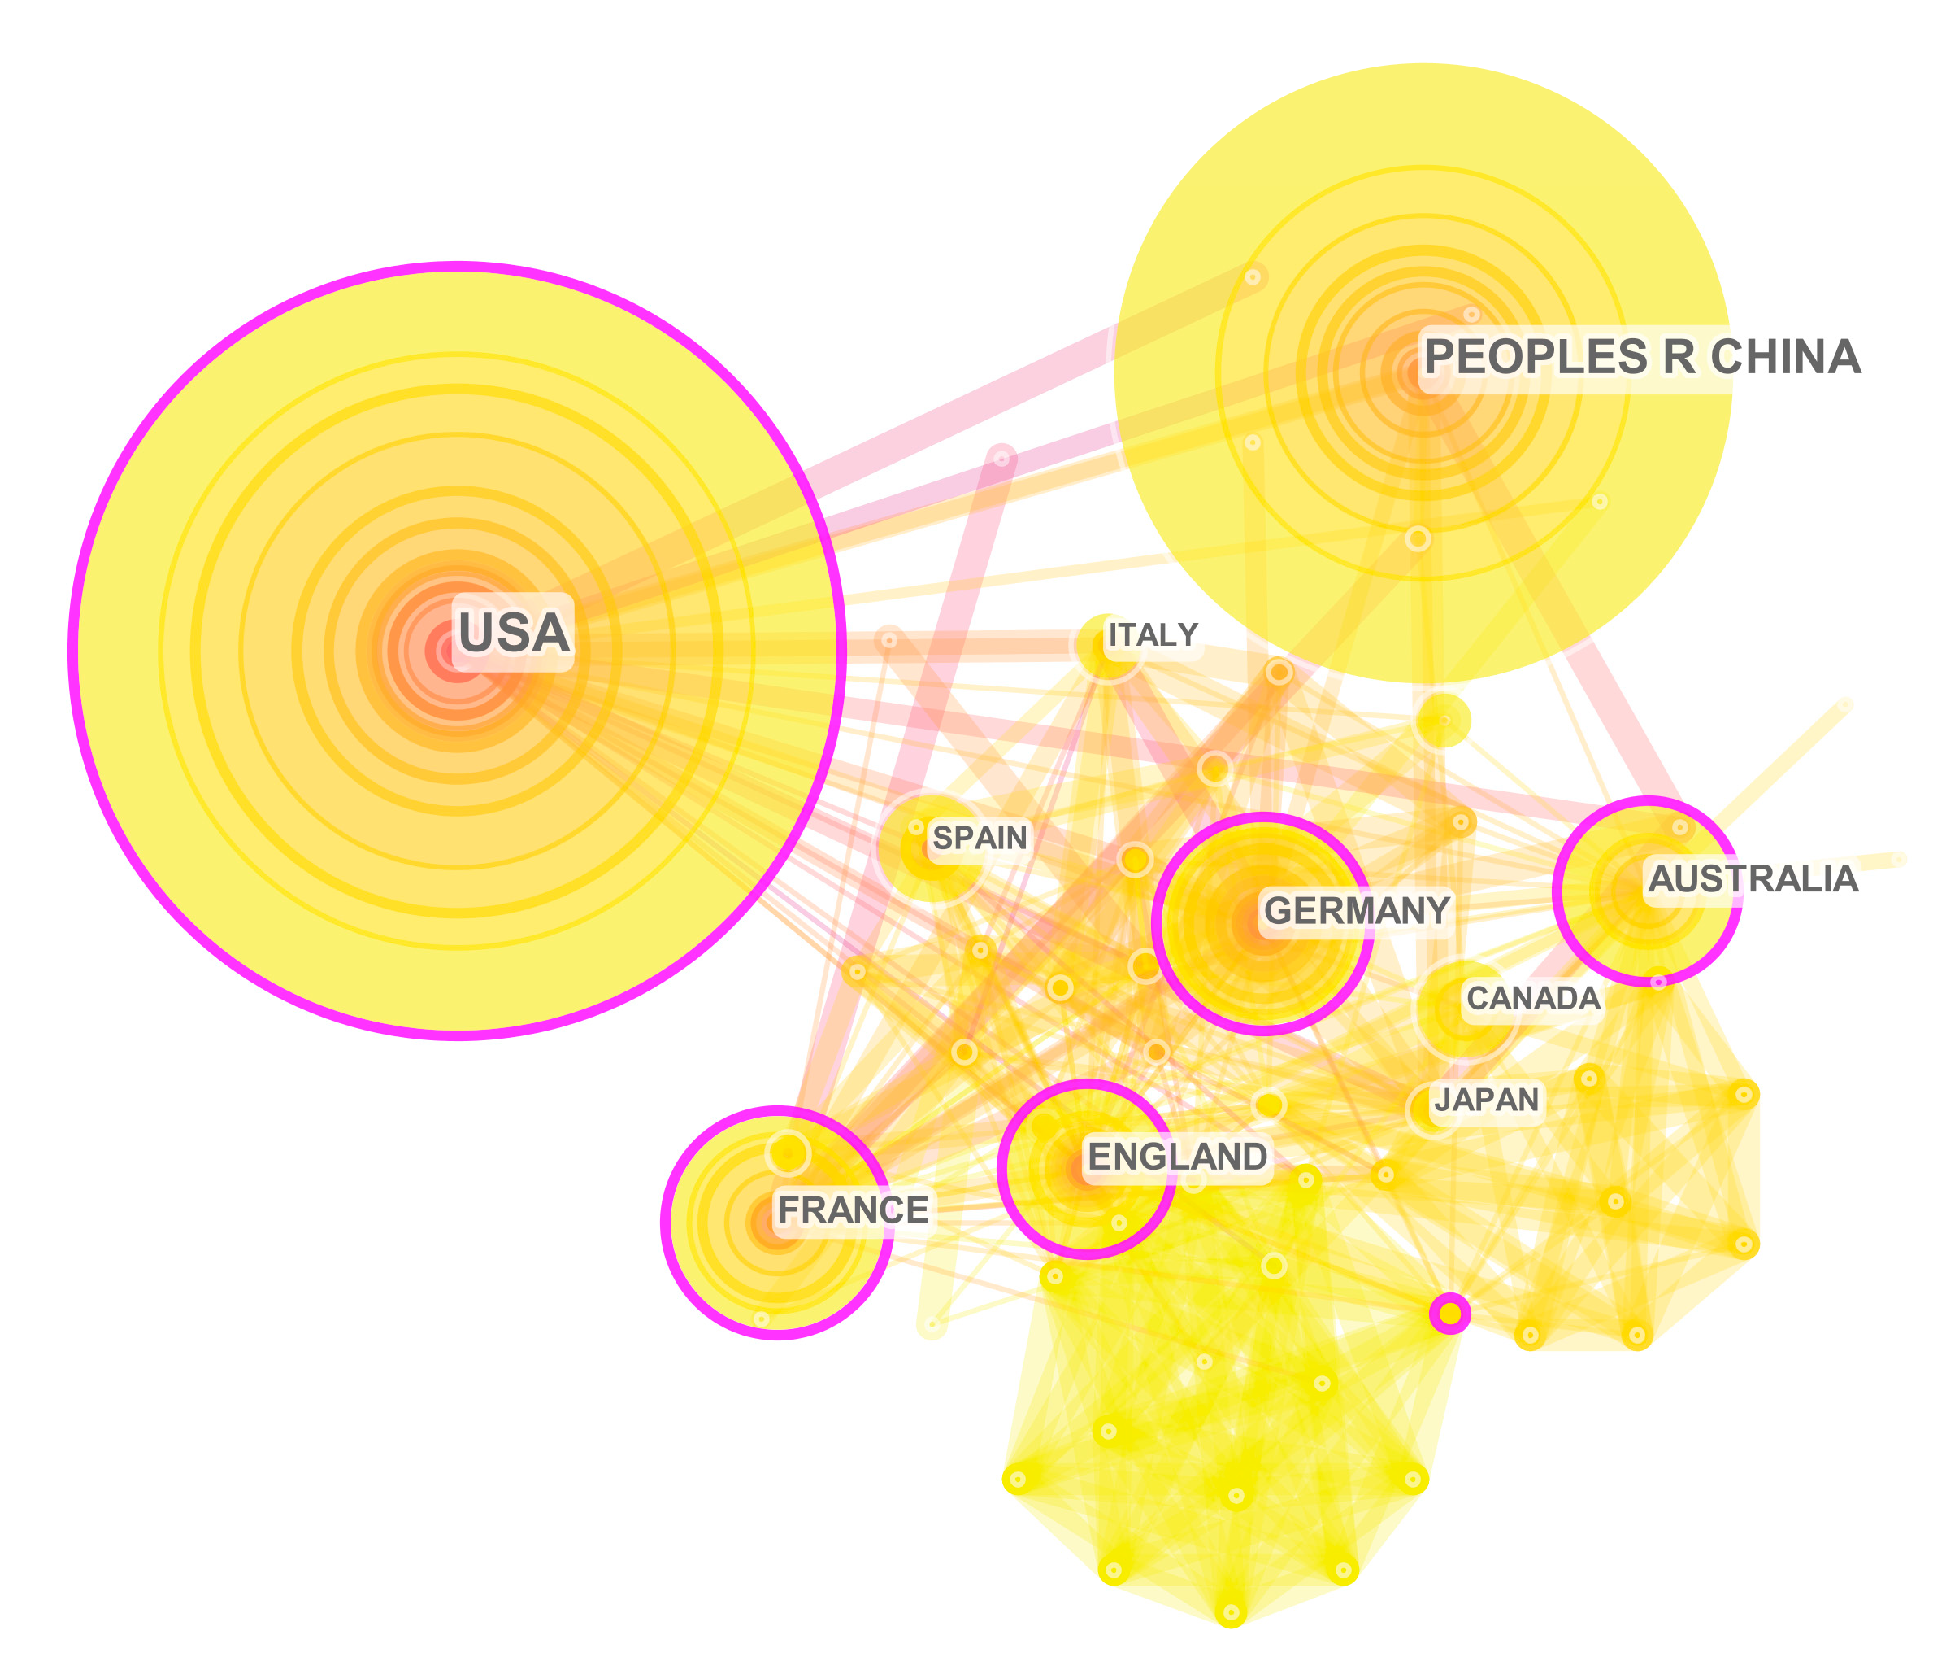
We selected the parameter “Country” in the CiteSpace analysis software, and the co-occurrence network maps of the countries in which ocean big data research areas are shown in Figure 3. The nodes appear different sizes in the graph. The nodes present different countries which are cited in the document and are identified by kinds of colors and sizes. The larger the node, the larger the amount of paper it sends, and vice versa. Nodes will have different sized purple rings around themselves; the thicker the lines, the higher the centrality [12].
As illustrated in Figure 3, the United States, England, Australia, France and Germany are five nodes with purple rings; these five nations play a pivotal role in collaborate cooperation between prolific countries on ocean big data research. The 67 nodes represent countries covering nearly all the major continents: 52.94% in Europe (Germany, England, France and so on), 26.47% in Asia (PR China, Japan, India and so on), 8.82% in Africa (South Africa, Morocco, Algeria), 5.89% in North America (Canada and the United States) and 5.88% in Oceania and South America (Australia, Columbia).
Table 1 demonstrates the top ten prolific countries classified by volume and centrality of publication. United States published 100 papers, followed by China (79), France (33), Germany (31), England (30), Australia (25), Spain (18), Italy (15), Canada (14) and Japan (14).
In conclusion, the countries with high degrees of centrality occupy pivotal points in the field of ocean big data research. China has spent an enormous amount of time and enthusiasm on increasing its number of publications, but the impacts of their articles have not surpassed some prolific countries like France, Germany and Australia in terms of centrality. China is facing a relatively low-level publication centrality, different ways of language expression, interdisciplinary academic fields and various perspectives—all are reasons why China publishes lack of centrality in the field of ocean big data. Hence, regarding the above weak links, improving the accuracy of language among scholars and strengthening international academic communication are efficient paths to promoting China’s centrality position in the ocean big data research field.
3.2.2. Institution Collaboration Network Analysis
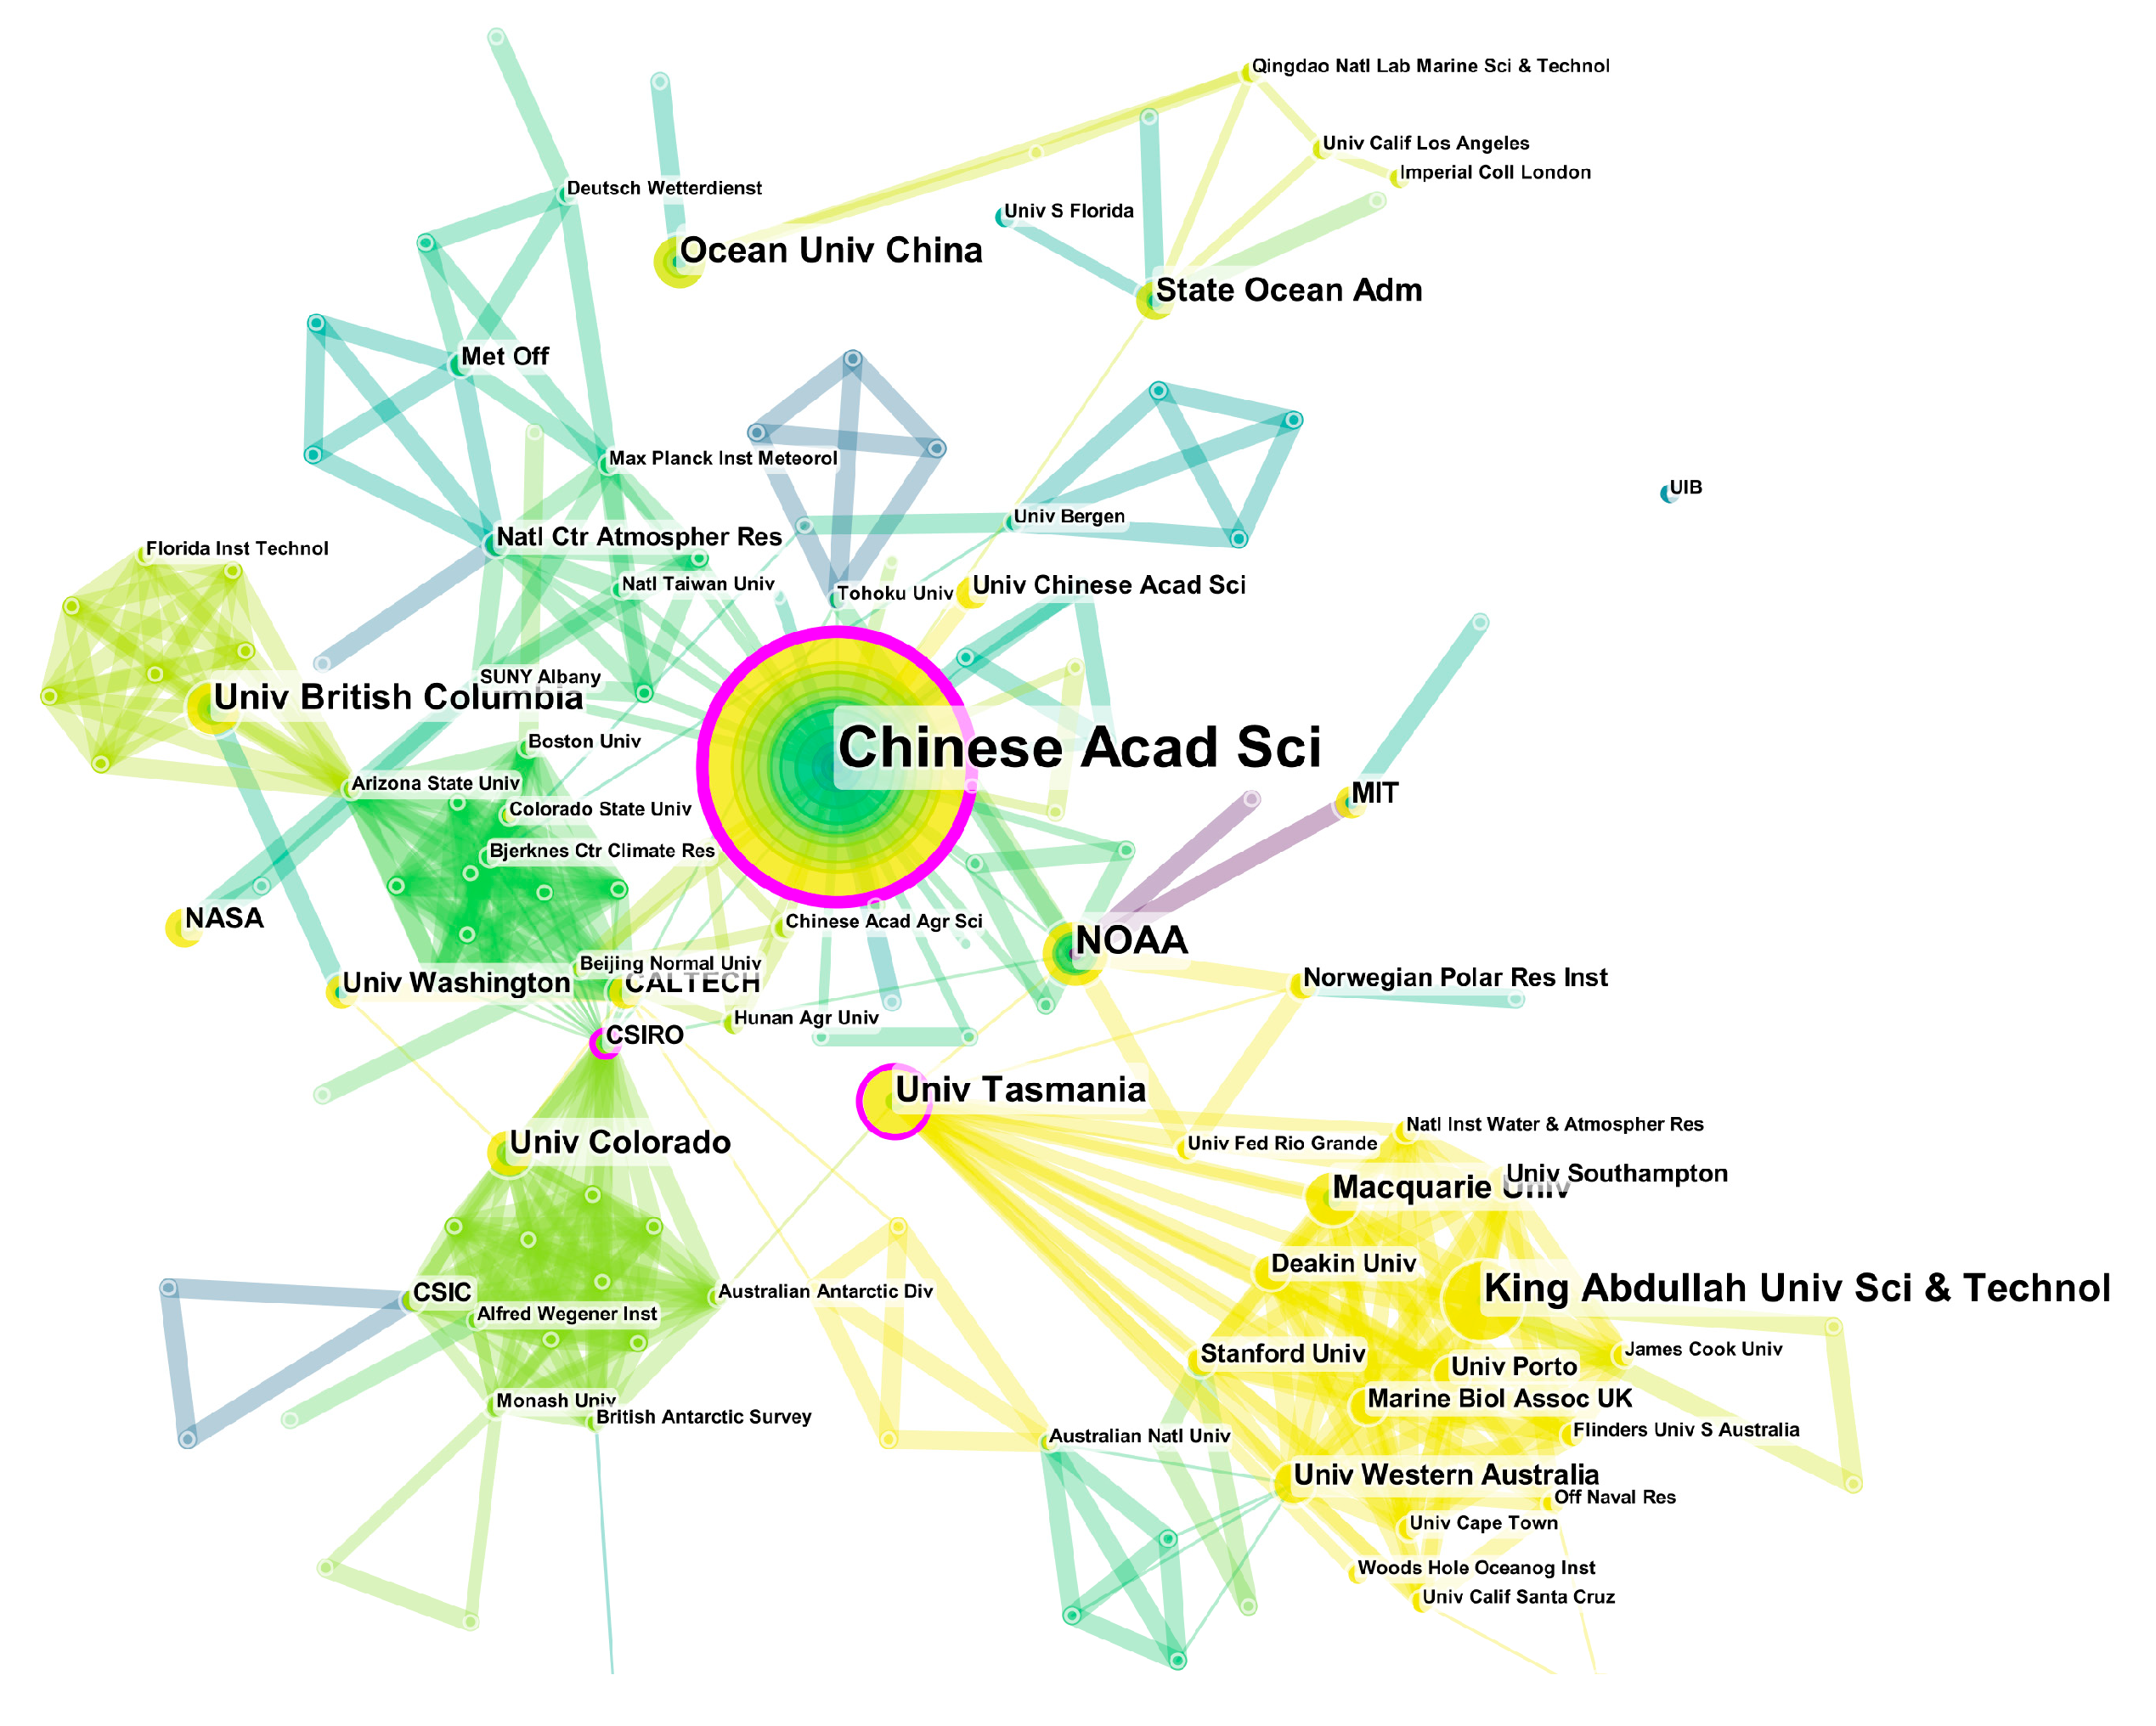
Figure 4 shows the academic collaborations between different institutions of ocean big data research, utilizing the uniform operating strategies as the network of national cooperation. The largest sub-network contains 26 various institutions. The University of the Chinese Academy of Sciences takes the absolute top position in the whole collaboration network, and the Ocean University of China is an important representative of China’s significant progress in this field. However, the other sporadic organizations have little cooperation with other institutions, which represents the lack of cooperation among different organizations. Even so, we continue to expect the partnership between those institutions in the future. We also found that within a network of 90 organizations, universities and institutions accounted for 90%; by contrast, administrative institutions and enterprises accounted for just 10%.
Table 2 organizes the top 10 prolific institutions sorted by count and centrality of publication. University of Chinese Academy of Sciencestakes the lead in the rank with 26 documents, followed by King abdullah university of science and technology (8), National Oceanic and Atmospheric Administration (8), Ocean University of China (6), University of Tasmania (6), University of Hawaii Manoa (6), University of British Columbia (6), State Oceanic Administration (5), Australian Institute of Marine Science (5) and Macquarie University (5). Concerning the character of these institutions, besides two academic institutions, the other institutions were universities. The universities published 86 articles, occupying the majority of the total number of documents.
As noted above, on the basis of the nature of these institutions, all but two academic institutions are universities in the ocean big data research field. Hence, the core technology is basically derived from universities with strong scientific research capabilities. Besides, the two universities from China, including University of Chinese Academy of Sciences and Ocean University of China, have shown tremendous strength in scientific research in the ocean big data field. Moreover, China has outstanding research capabilities and good research productivity.
3.2.3. Author Collaboration Network Analysis
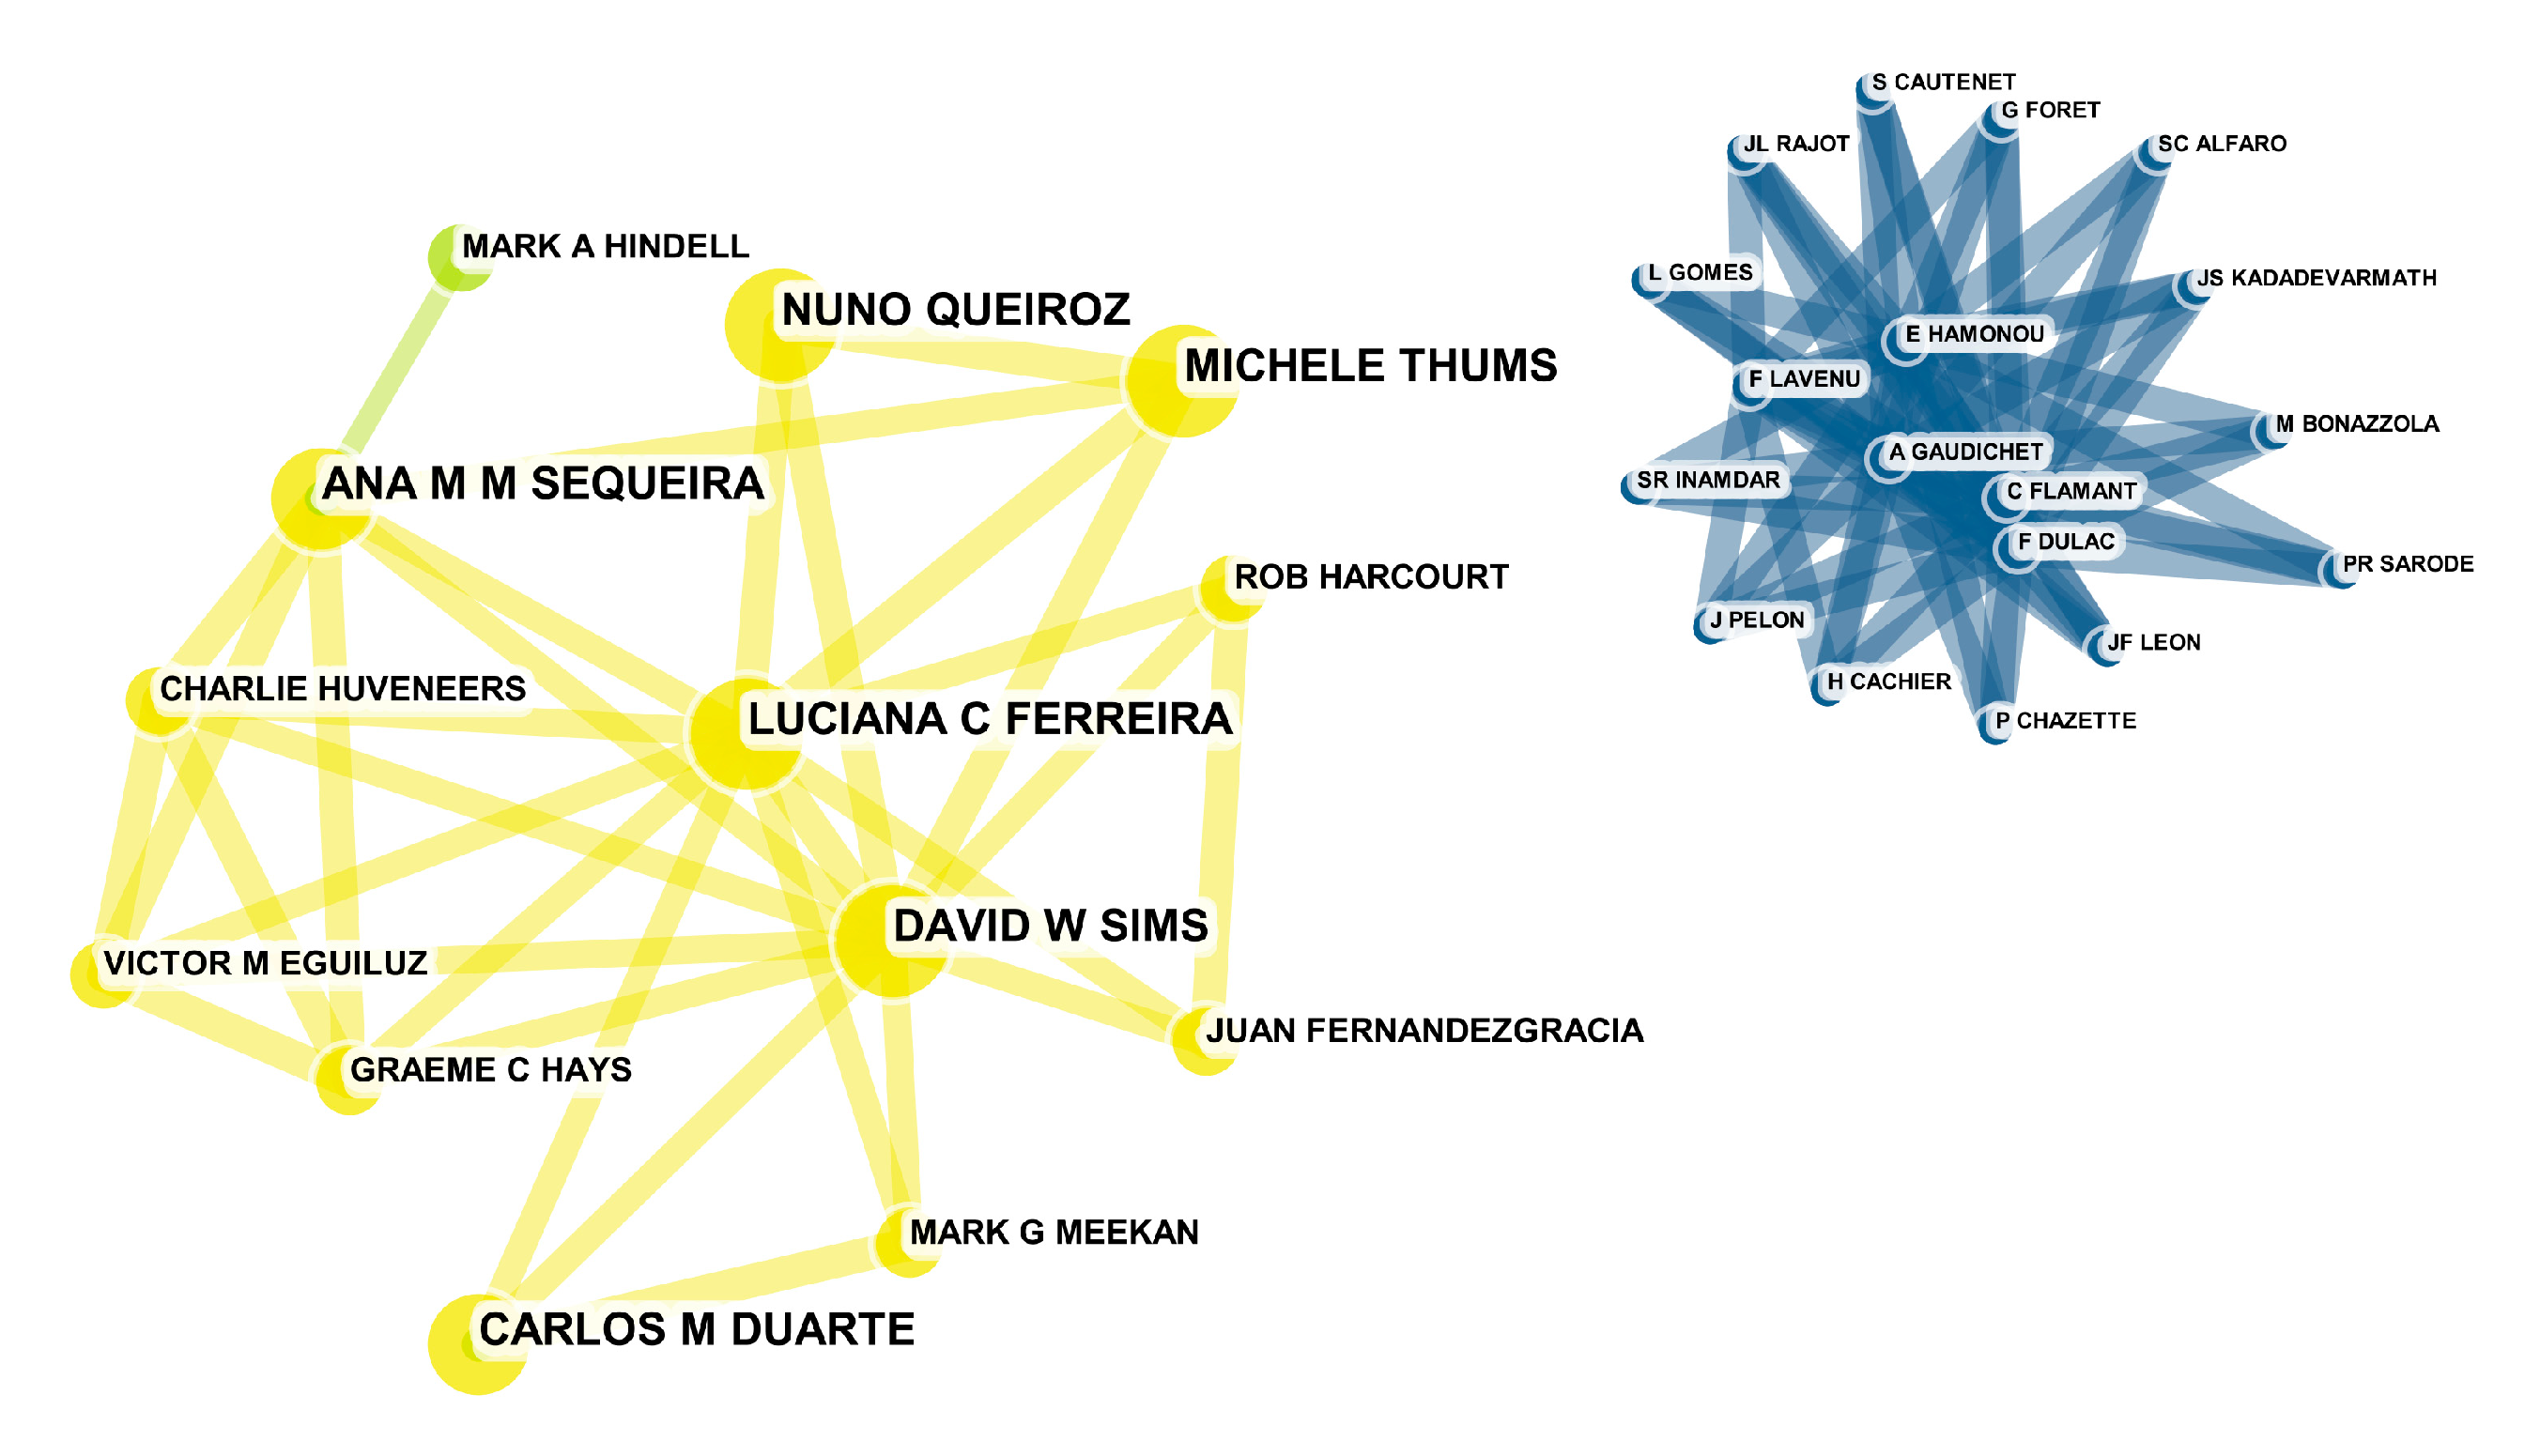
Figure 5 demonstrates the academic cooperation among similar professional authors, who are selecting the appropriate pathfinder and deleting apparently unrelated nodes. An author’s research work belongs to his or her organization, so mutual cooperation between the authors and the co-occurrence map of the organization will have more similarities. Sub-networks in graphs play an important role in analyzing mutual relations between them, which means that isolated small sub-network authors who are in the field of ocean big data lack communication with each other. In the middle of the network map, the biggest sub-network with twenty-two nodes was the biggest research team headed by Michele Thums; other team members of the team in the top ten list were David W. Sims, Nuno Queiroz, Luciana C. Ferreira, Juan Fernandezgracia, Charlie Huveneers, Rob Harcourt, Graeme C. Hays and Ana M.M. Sequeira. Mark A. Hindell was head of the second research team.
Table 3 demonstrates the top ten most prolific authors classified by volume and centrality of publication. Table 3 shows that the Michele Thums team (including David W. Sims, Nuno Queiroz, Luciana C Ferreira, Juan Fernandezgracia, Charlie Huveneers, Rob Harcourt, Graeme C. Hays and Ana M.M. Sequeira) was the most productive team, contributing nine documents in marine and freshwater biology. Mark A. Hindell contributed two articles in marine ecosystem modelling. In addition, all of the most productive authors are from Australia. Michele Thums’s team mainly engaged in the description and prediction in northern Australian marine ecosystem in the ocean megafauna movement and the development and application of the distribution of the model, including collection for the globally integrated animal movement data; establishment of western Australia’s Kimberley region distribution of the humpback whales’ belonging-degree model; and understanding the turtle (including newly hatched turtles) distribution and activity habits, and the influence of light pollution diffusion on turtles, to understand the distribution of the northwest continental shelf pygmy whales and important area.
In summary, according to the statistics of the paper, the biggest and the most prolific team members are all from Australia, and the remaining authors tended to work in small groups of collaborators in other countries. Above mentioned contents indicate that the author’s collaborative system network has few international connections and co-author communications in the ocean big data research field. Australia embodies a rich and solid marine ecosystem theory background, but because of a lack of academic exchange, they tend to slow the pace of ocean big data research development. Meanwhile, we should endeavor to increase international academic exchange and expand our friendly contacts and co-operation with scientific circles in other countries like Australia.
3.3. Co-Citation Analysis
If two or more documents contain two or more of the same authors, there is an association relationship between them [13]. The occurrence network provides the best-suited scientific tool to assess the academic levels of journals, documents and authors, and helps scholars and institutions to seek worthy information [14].
3.3.1. Journal Co-Cited Analysis
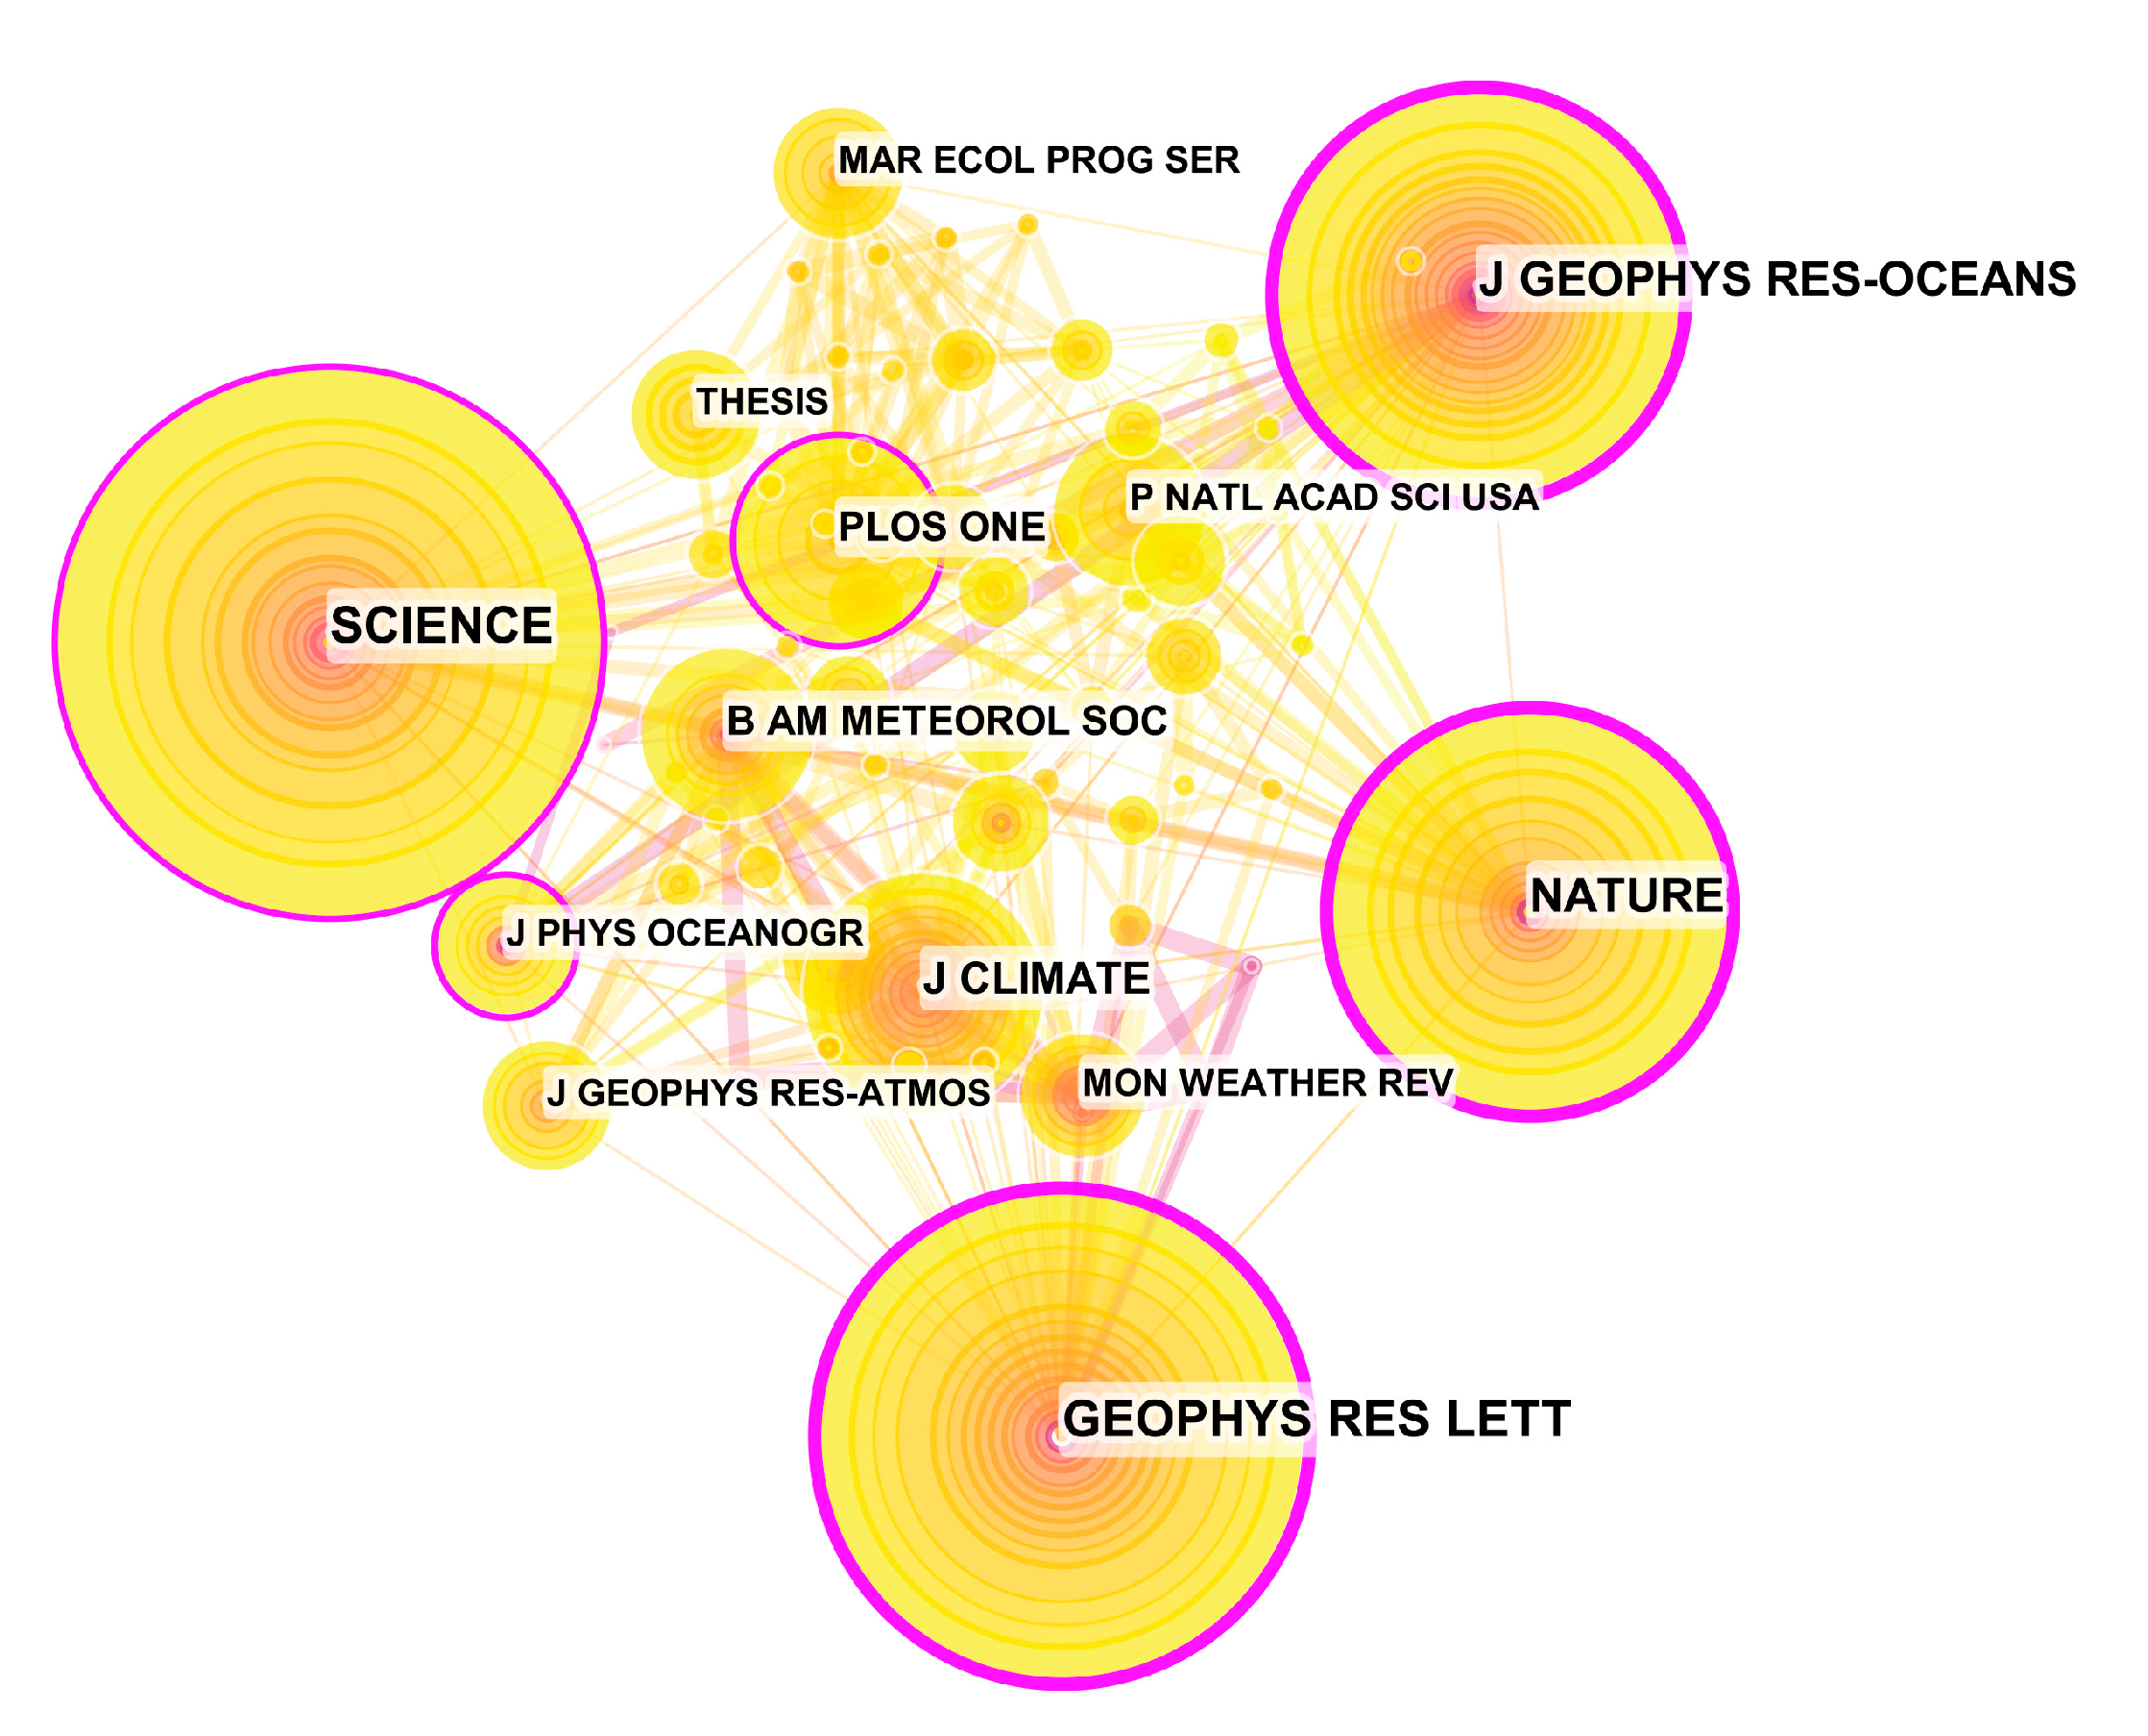
We selected the parameter “cited Journals” in the CiteSpace analysis software, and the co-citation network of the journals containing ocean big data research is plotted in Figure 6. The nodes present different journals which are co-cited in the document and were identified by kinds of colors and sizes. The bigger the node, the larger the amount of attention it receives, including 71 nodes accounting for 95% of the total number of co-cited journals.
Table 4 demonstrates the top ten prolific co-citation journals classified by volume and centrality of publication. Science journal was cited the most with 106 papers, followed by the Geophys. Res. Lett. (97), J. Geophys. Res.-Oceans (83), Nature (77), J. Climate (48), Plos One (40), B. Am. Meteorol. Soc. (35), P. Natl. Acad. Sci. USA (30), Thesis (28) and J. Phys. Oceanogr. (28). In addition, three cited journals had impact factors greater than 9; such high impact factors indicate that there are still quite a few core journals in the field of ocean big data.
Based on the above, the journal co-citation analysis was used to study the co-citation of the core journals of ocean big data science, which offered us the academic level and quality of each journal, which were studied from the perspective of the citations. Meanwhile, Science and Nature are among the best peer-reviewed journals that publish original research papers and review and analyze current research and science policy. These top ten comprehensive scientific journals can be used as reference materials for the research authority of ocean big data.
3.3.2. Authors Co-Cited Analysis
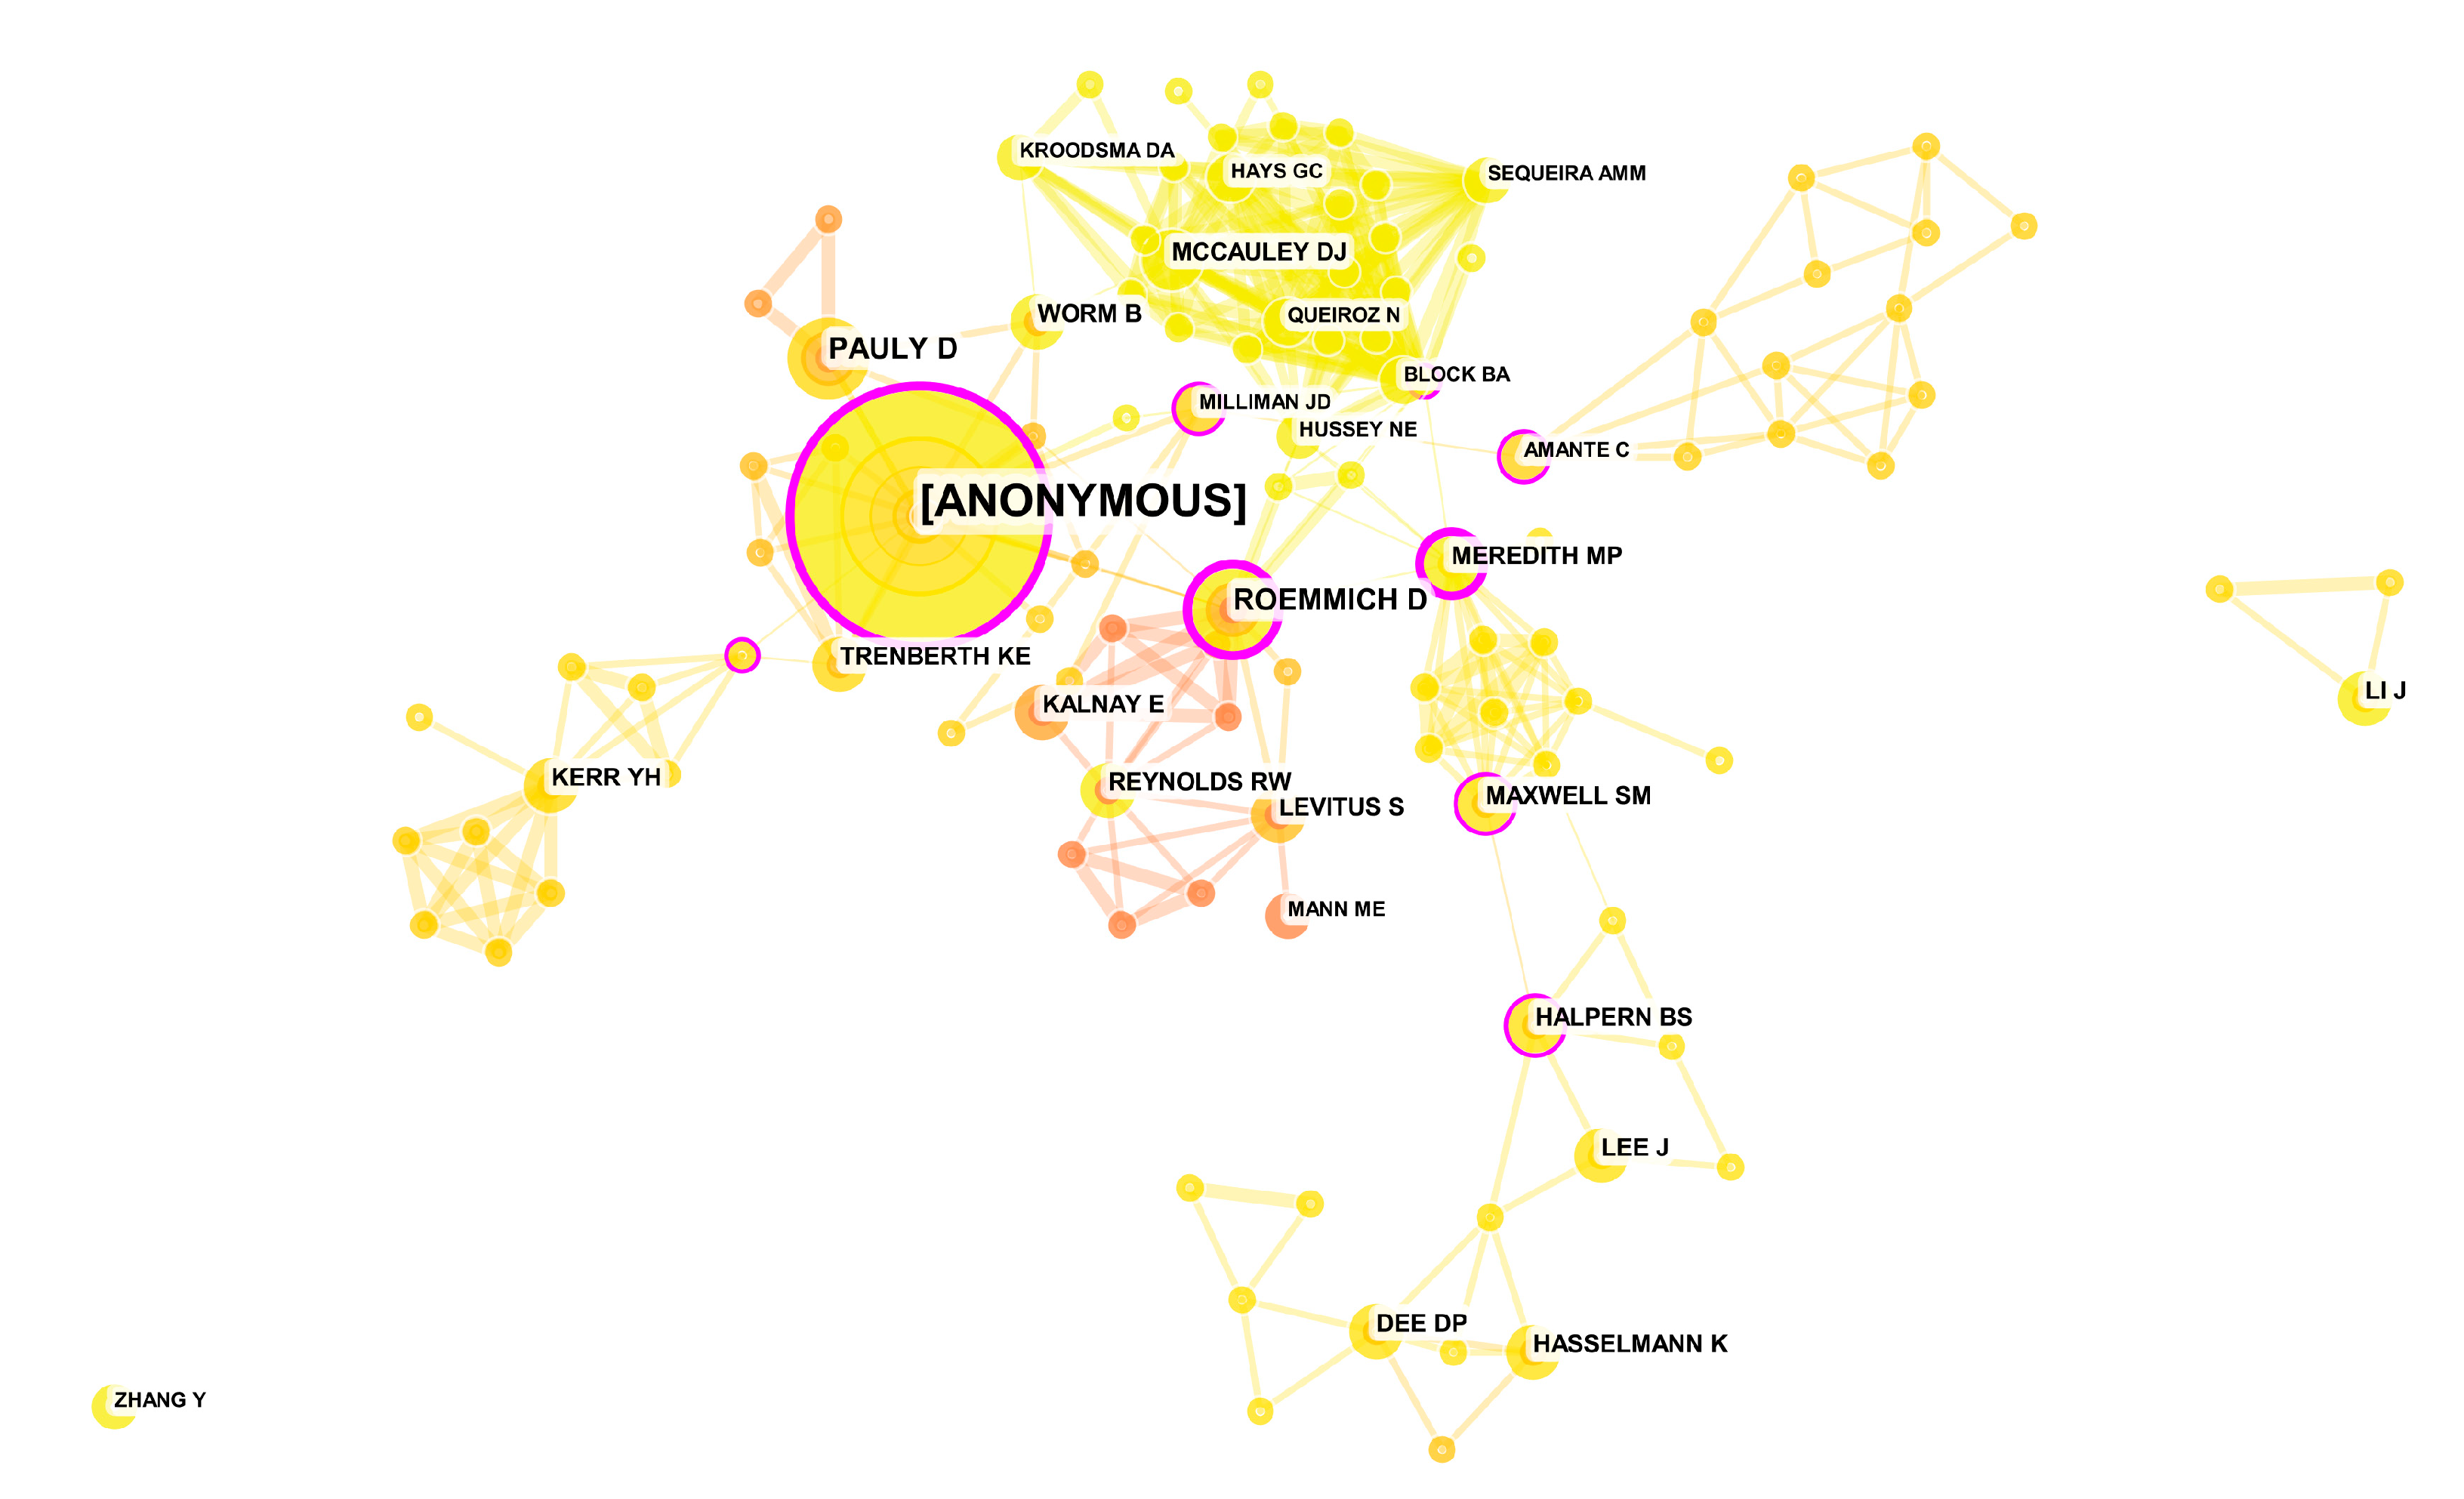
The co-cited author network provides a reference tool for identifying academic and domain-specific authors. As illustrated in Figure 7, which demonstrates selecting the appropriate pathfinder and deleting apparently unrelated nodes, there are 182 authors with co-citation, and there are 525 connections between the co-citation authors; the more counts of an author’s citation, the larger the size of the node, and the closer distance between two nodes—indicating that the frequency of the two authors will also be higher. An author who has a higher degree of co-citation occupies a pivotal point in the ocean big data field. Among them, anonymous have the highest volume citations, and their frequency of co-citation is also among the top ten.
Table 5 lists top ten prolific co-citation authors classified by citation counts and centrality of publication. As shown in Table 5, the other productive co-citation authors are Pauly D. (6), Roemmich D. (6), Maxwell S.M. (4), Kerr Y.H. (4), Reynolds R.W. (4), Kalnay E. (4), Halpern B.S. (4), LI J. (4) and Lee J. (4). The co-cited authors are engaged in the research of ocean big data from different scientific research perspectives. Pauly D., Roemmich D. and Kerr Y.H. focused on forecast model and data assimilation method research; Maxwell S.M. and Kalnay E. pursued their studies with a modern-day climate model; Reynolds R.W. and Lee J. engaged in research on the application of computer technology in ocean big data; Halpern B.S. and LI J. carried out research on human impacts on marine ecosystems. All the data indicated that these co-citation authors have made significant contributions to maintaining peace and stability in ocean big data research development.
Based on the above, from the author co-citation analysis via different perspectives, searching for research framework of the ocean big data fields makes the scholars have a better understanding of ocean big data program development, and guides in the future research planning. Meanwhile, all the co-citation author results help us to analyze objectively the intellectual property of the authoritative authors and help scholars quote numerous passages from highly competent authorities.
3.3.3. Reference Co-Citation Analysis
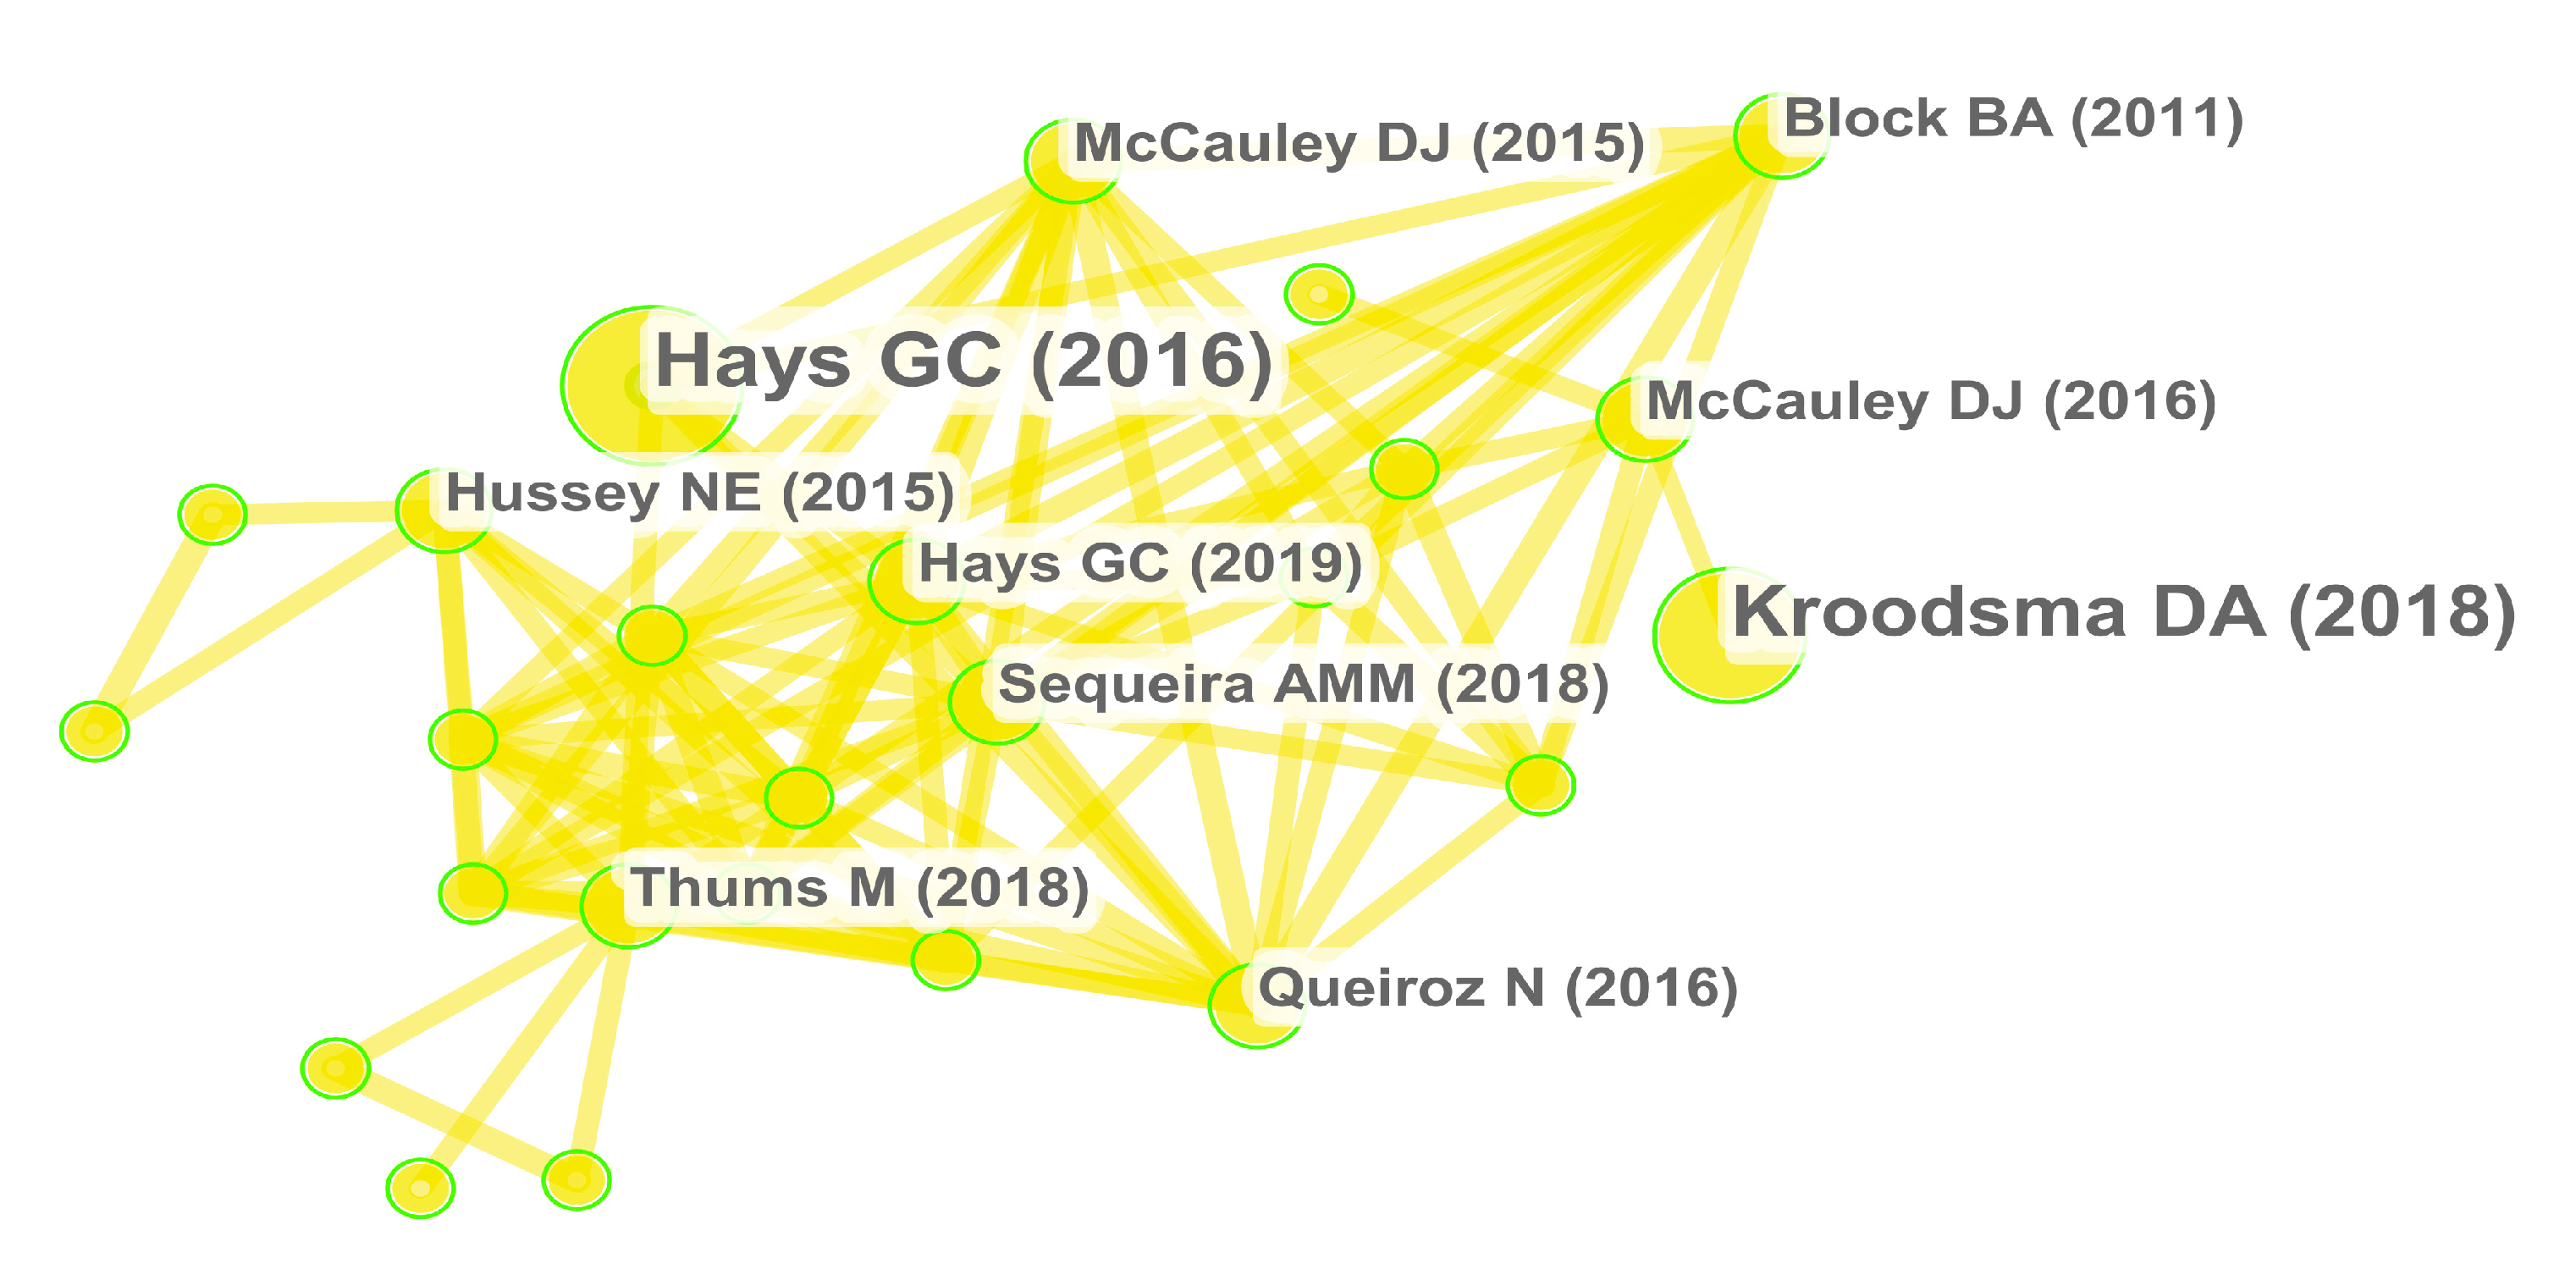
We ran the parameter “reference” in the CiteSpace analysis software, and the reference network of the documents of ocean big data research is plotted in Figure 8. The labeled author and year nodes represent a wide variety of references that have been cited more than three times. The nodes present different documents which are co-cited in the document and are identified by kinds of colors and sizes. The bigger the node, the larger the amount of focus it receives [15,16].
As shown in Figure 8, the biggest node corresponds to Hays G.C., which was reviewed cited in five records , including created spatial and geographic information science research [17], movement of marine mega fauna approaches and models based on analysis of tracks of single animals [18], analysis of animal telemetry data for movement ecology [19], introducing “big data” and artificial intelligence to improve marine resource management [20], the potential of simultaneous satellite surveillance of megafauna for near-real-time, dynamic management [21], a global mechanism to improve conservation and management of marine megafauna [22].
Table 6 lists the top 10 most productive co-citation references sorted by citation ranking count, centrality, the year of publication, author name and published details. As shown in Table 6, besides one core reference (Hays G.C., 2016) that was quoted in 5 places [23], three references (Kroodsma DA, 2018; Hampton SE, 2013; Honisch B, 2012) and six references (Hussey NE, 2015; McCauley DJ, 2016; Thums M, 2018; McCauley DJ, 2015; Queiroz N, 2016; Block BA, 2011) were frequently cited in three records and six records, respectively [24,25,26,27,28,29,30,31,32].
Based on the above, the basic framework of the ocean big data organizations has already taken shape in research fields. The literature co-citation analysis elucidated different perspectives for the ocean big data development and identified highly cited and representative articles.
3.4. Key-Word Network and Time Zone Chart Analysis
Within an article, the keywords usually describe the core content of the article. Usually, keywords also involve the cutting-edge development of related fields. If a word appears frequently in a certain period, it can be concluded that the word reflects the most significant content of the research field during that period [33].
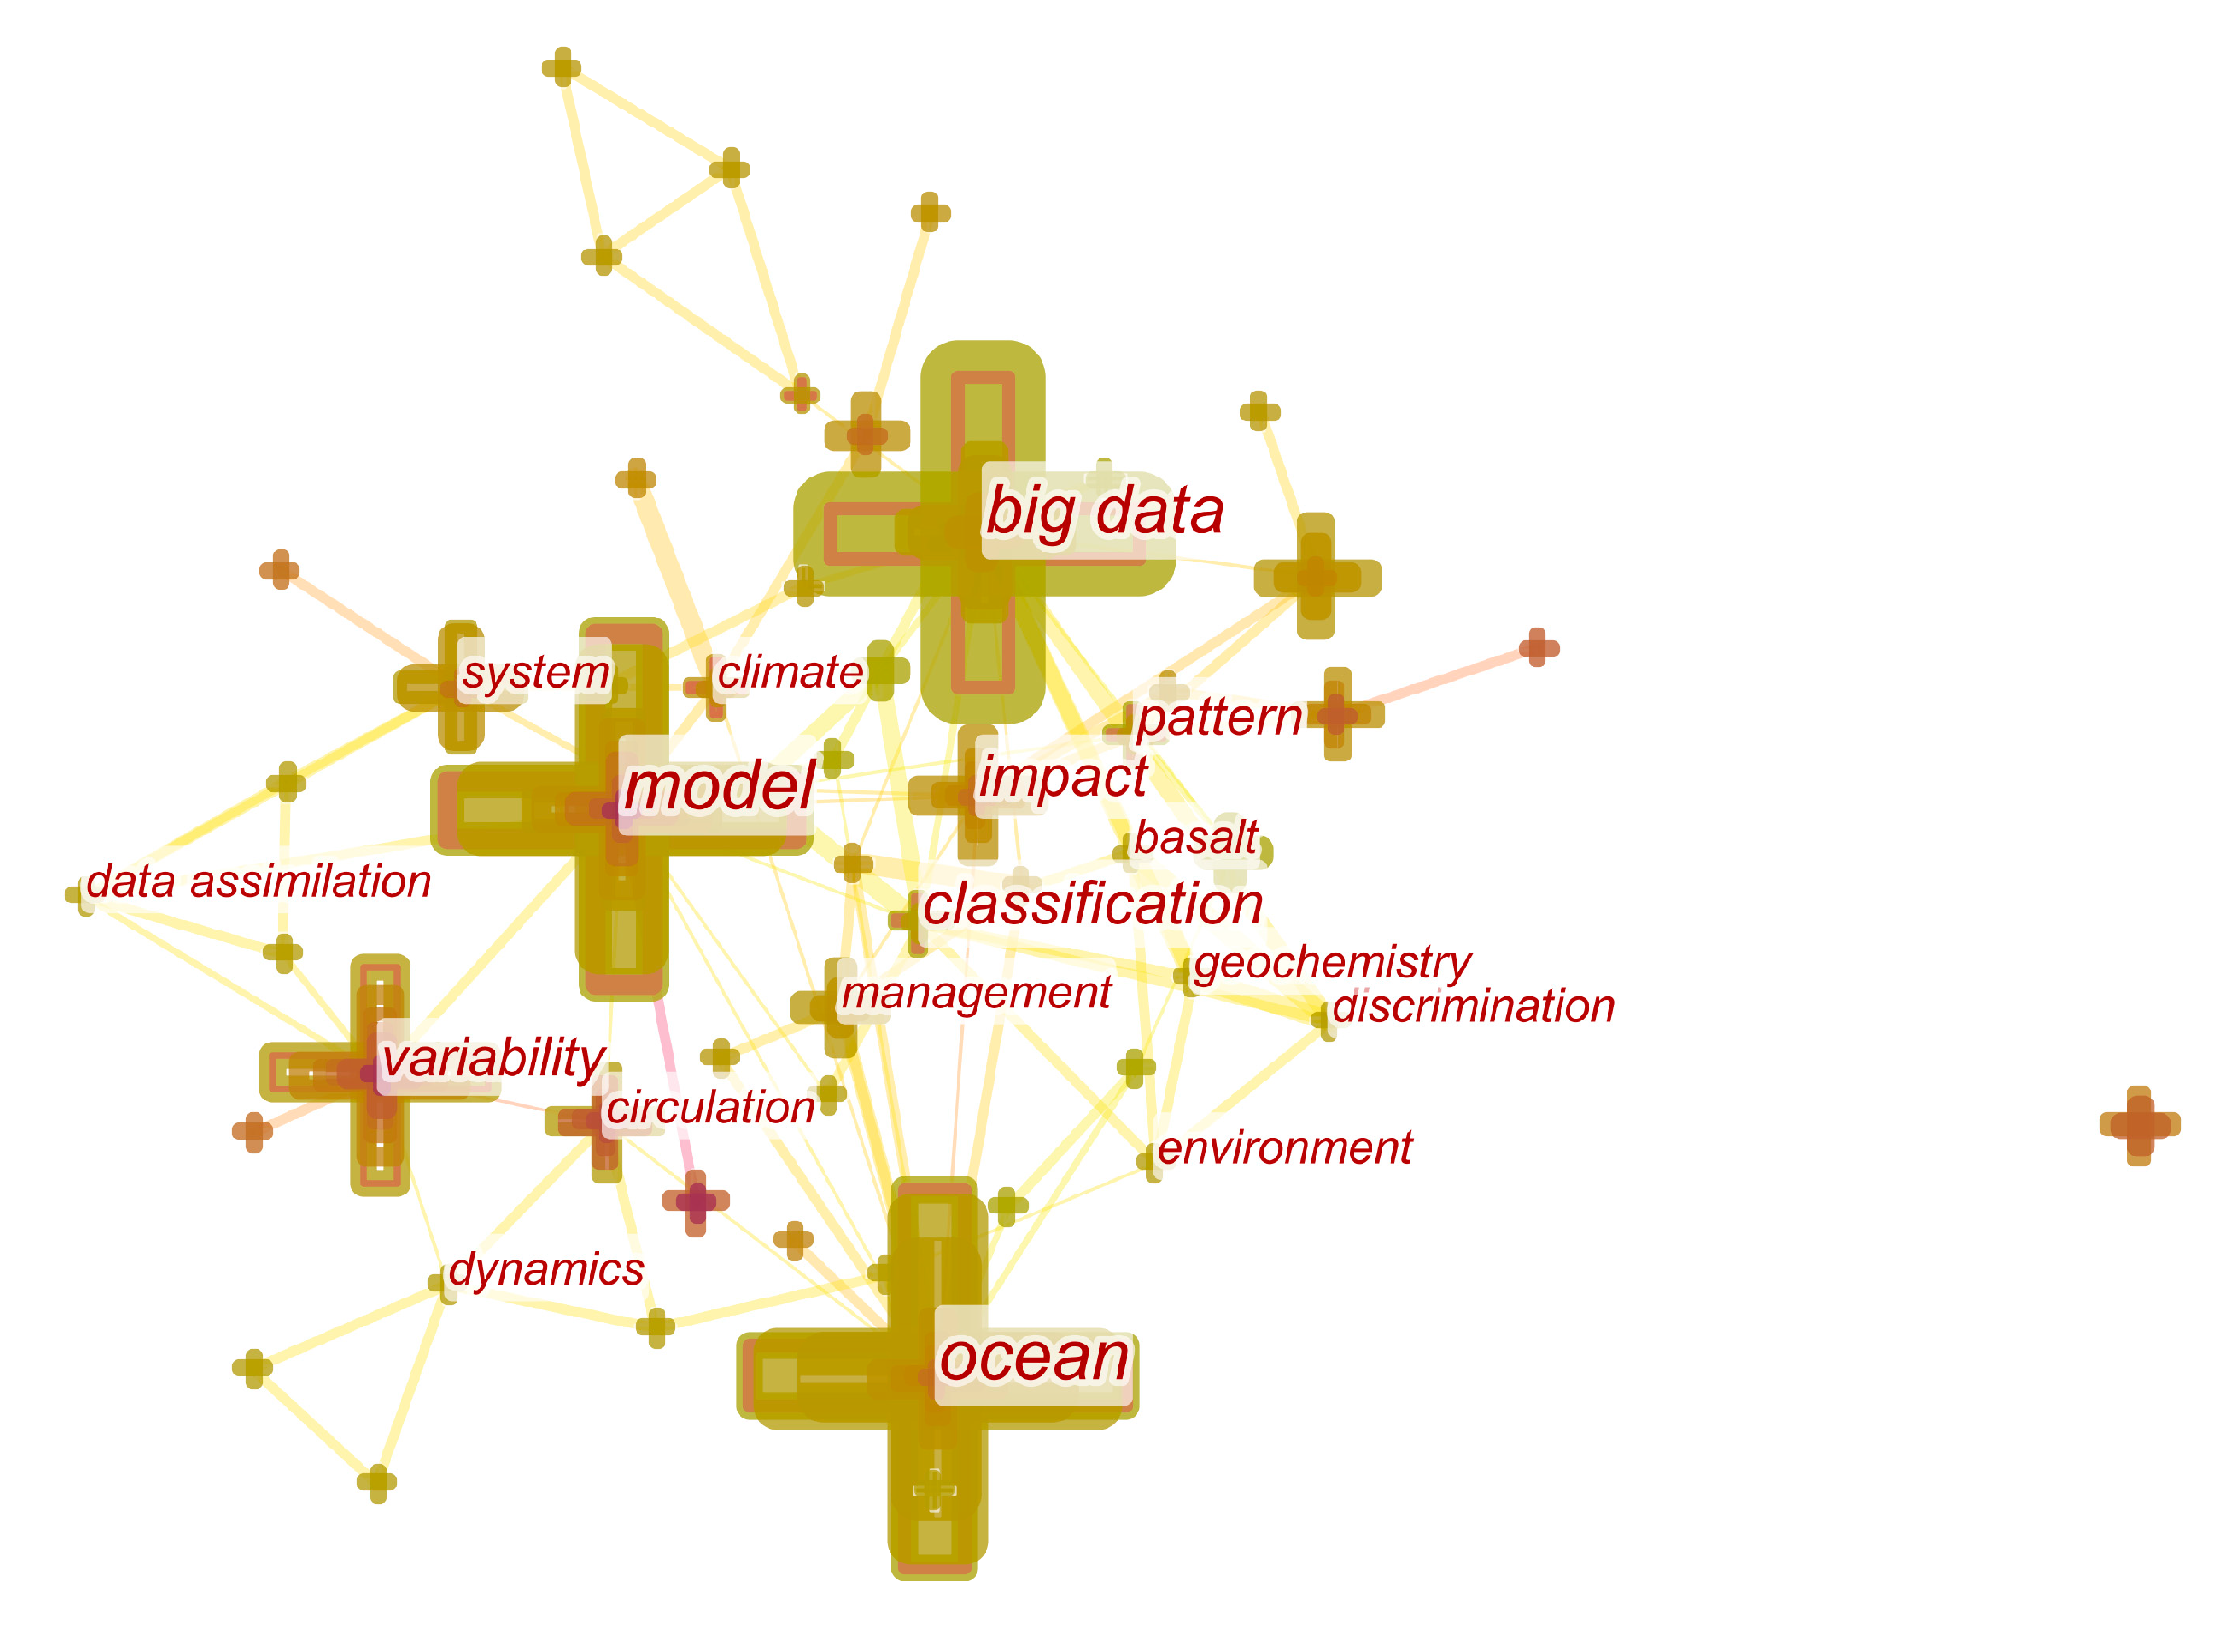
In the CiteSpace software, the statistical principles of metrology can be used to extract the frequencies of keywords or topic words involved in a paper based on an analysis of the frequency of vocabulary occurrences, and display the keywords or clustering relationships in the form of graphs.
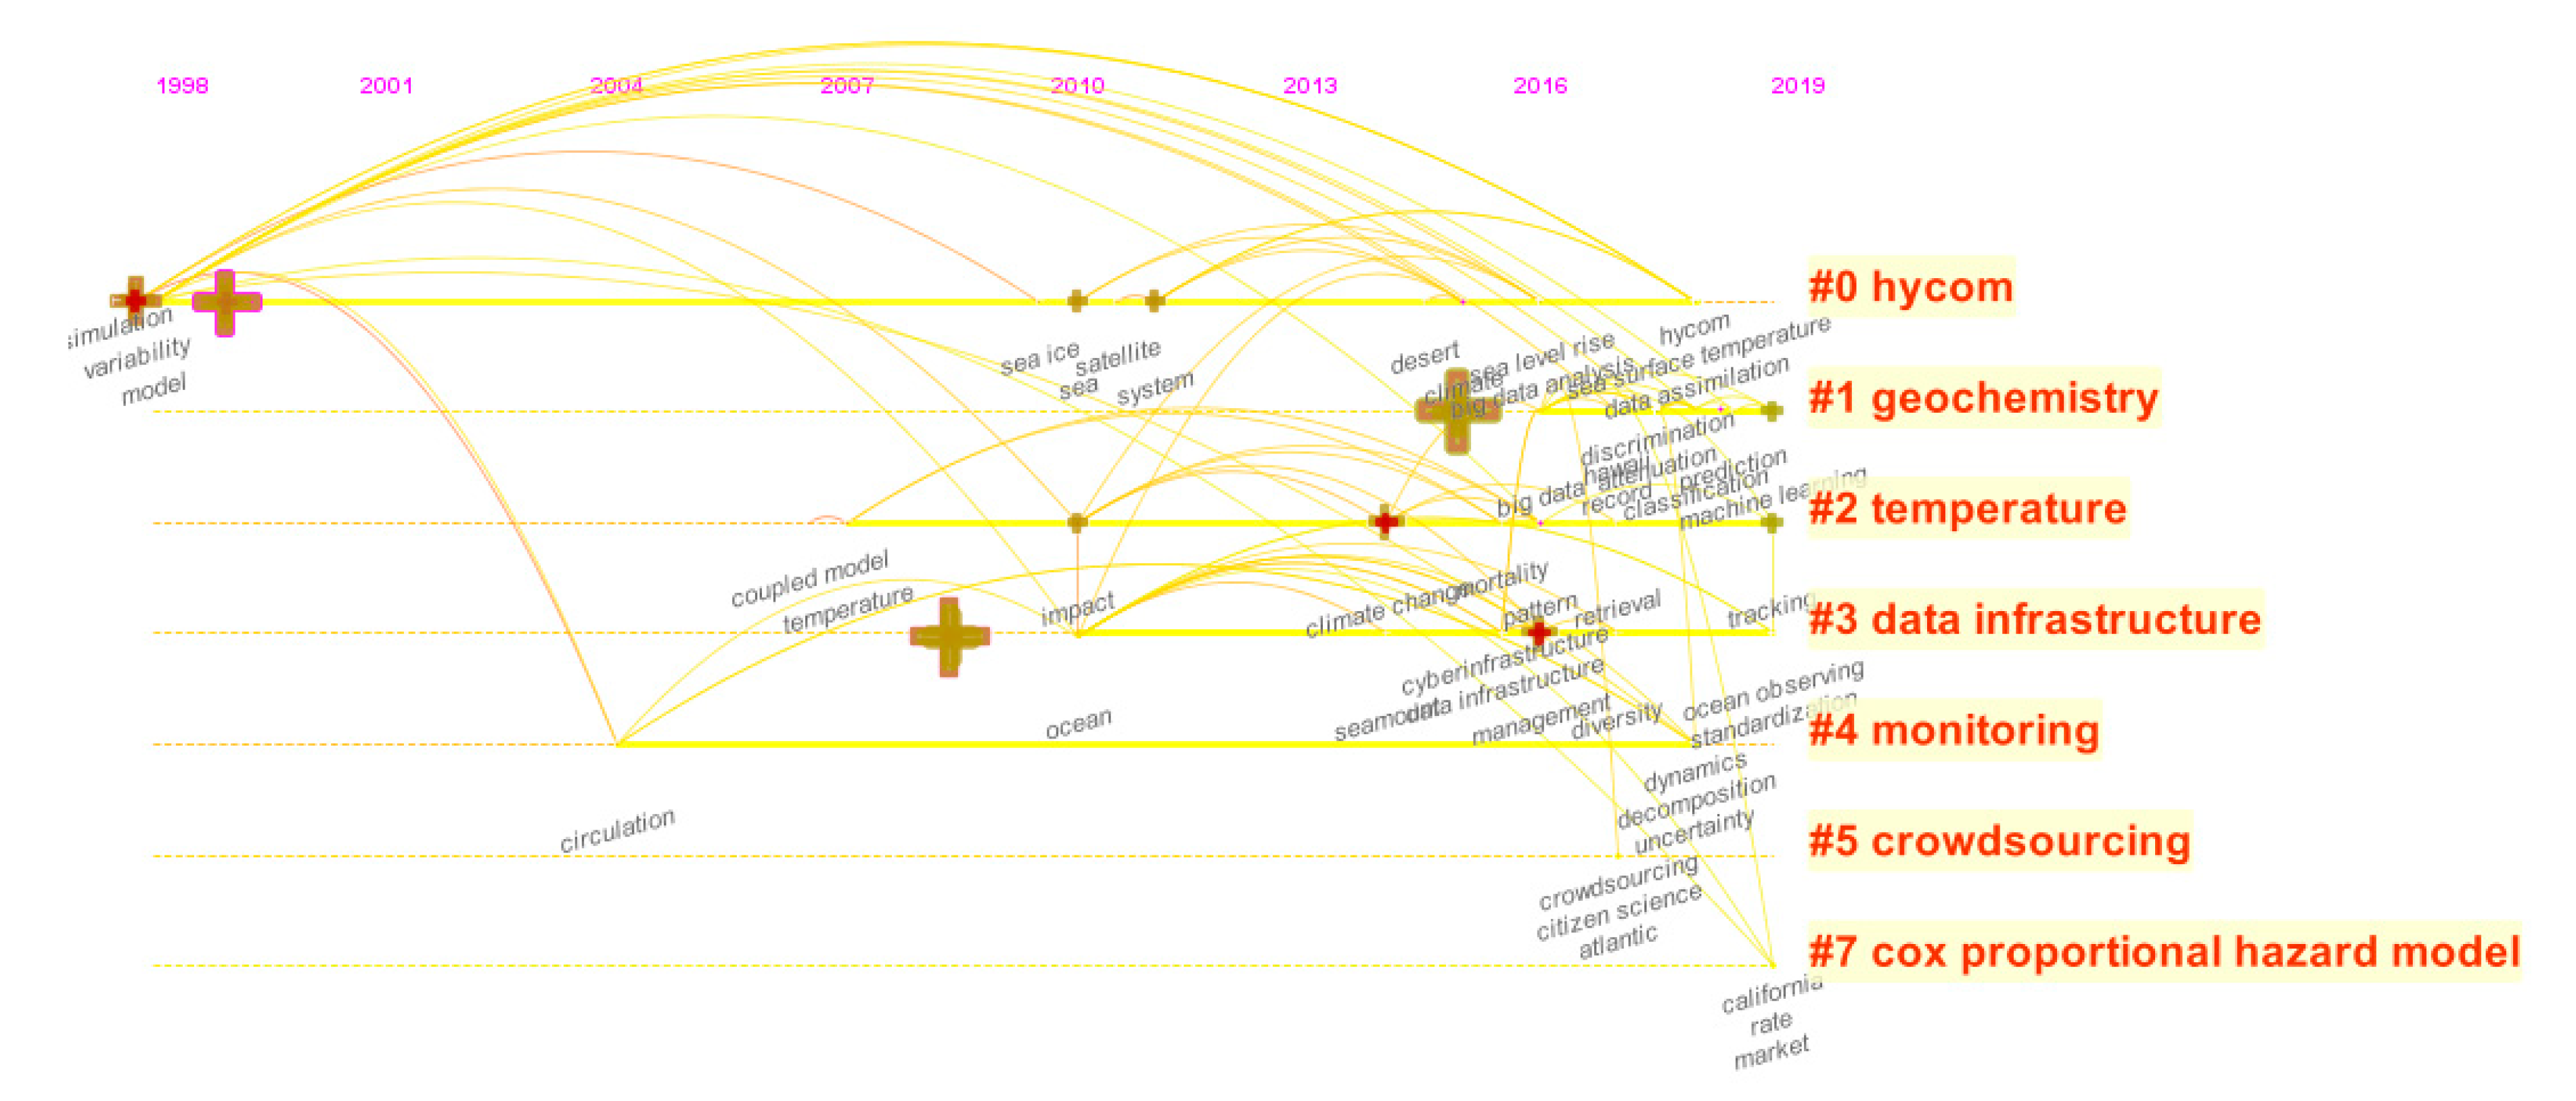
Figure 9 illustrates a network of co-keywords in the download documents. Based on the software analysis results, there are 73 keywords in total; Table 7 lists the top more frequently used words with citation ranking count, centrality, the year of occurrence and keywords in all fields, including “ocean”, “model”, “big data”, “variability” (16 times), “impact” (nine times), “system” (nine times), “circulation” (eight times), “climate change” (eight times), “temperature“ (six times) and “management.” Likewise, the words “management” and “classification” appear at the impression nodes of the map, which indicates that these words are also the main research direction in the literature. In the time zone network, the horizontal axis mainly reflects time and the vertical axis shows the name of the keyword cluster. The bigger the cross is, the higher the occurrence frequency of keyword is, manifesting that such keywords are the hotspots in the period.As show in Figure 10 , we can see that Ocean model (hycom) data infrastructure and monitoring have high centrality and are also the central keywords cited from 1998 to 2019; meanwhile, the earliest keywords in the field of ocean big data were model and variability, which appeared in 1998.
3.4.1. Keywords with the Strongest Citation Bursts Analysis
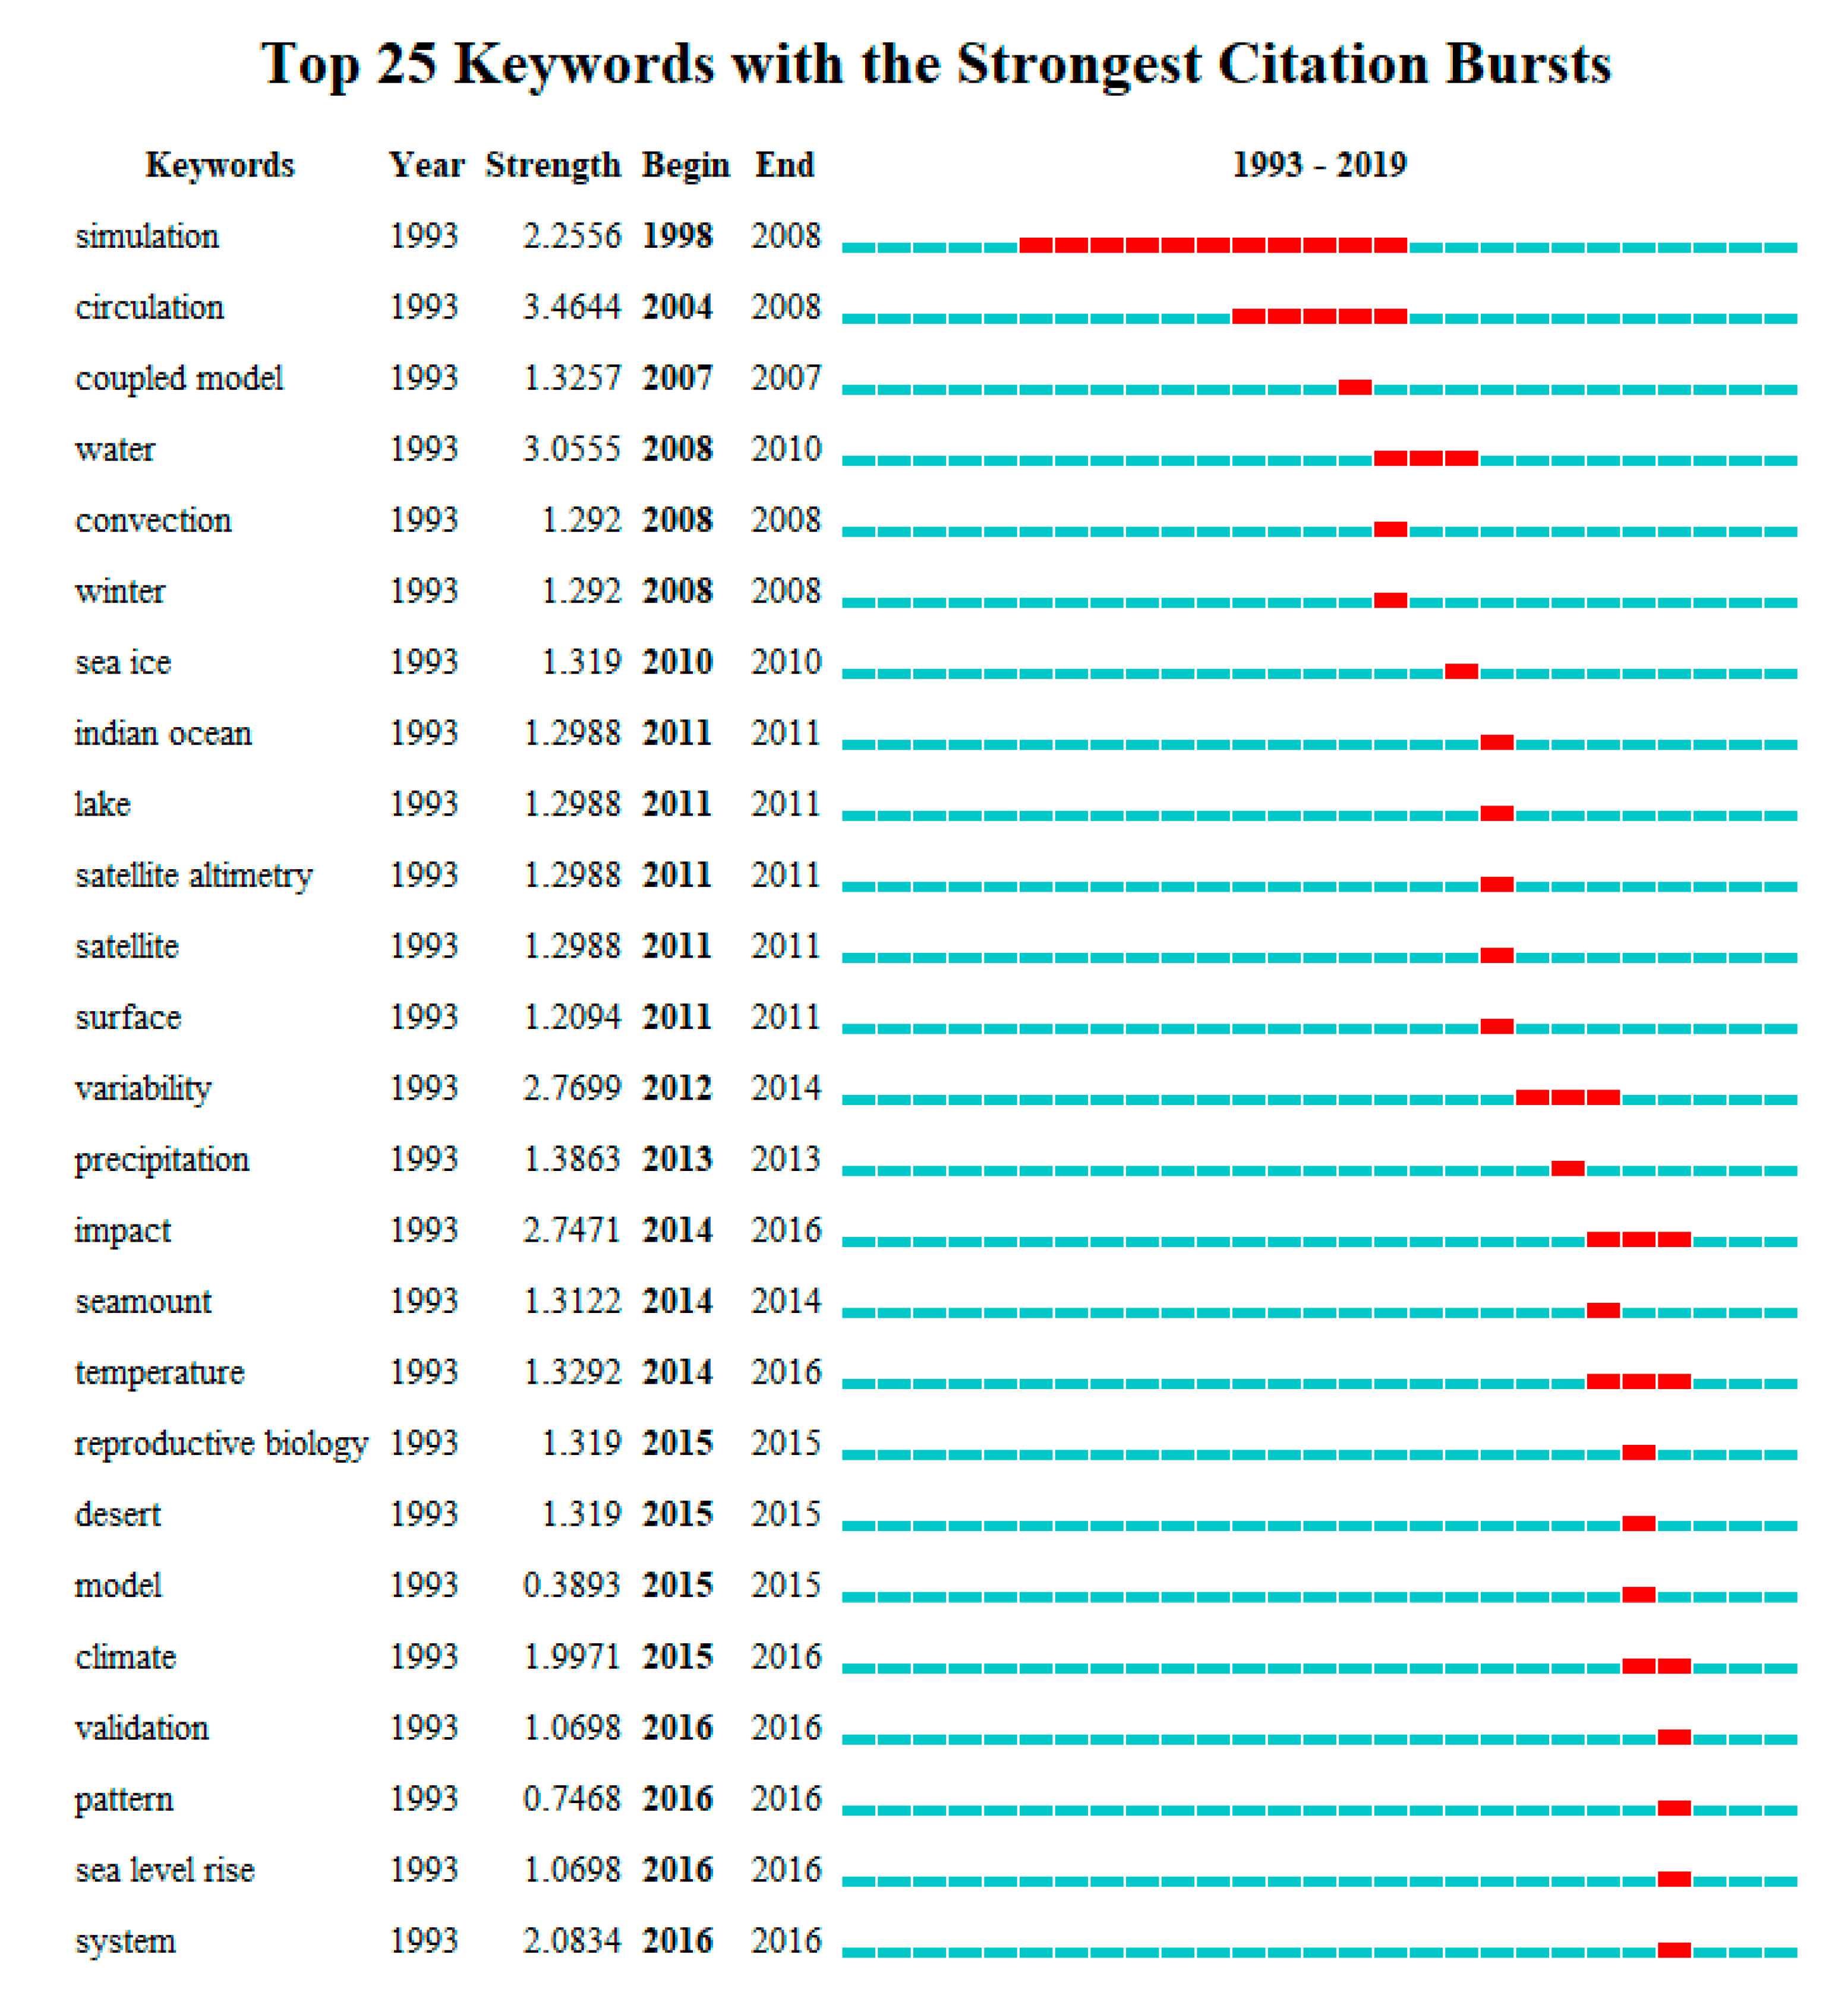
Keyword burst not only detects the focus of research on bursts, but also realizes the research frontier. As shown in Figure 11, we found the top 25 keywords with the strongest citation bursts from 1993 to 2019. The top 10 citation keywords with the strongest bursts include the five keywords: “model” (from 2015 to 2015), “variability” (from 2012 to 2014), “impact“ (from 2014 to 2016), “system” (from 2016 to 2016), “circulation” (from 2004 to 2008), “climate” (from 1993 to 2016) and “temperature” (from 2014 to 2016). The longest burst key word was “simulation”, which continued its popularity for ten years. The key words of recent concern were “validation, pattern, sea level raise, system” (started in 2016).
As mentioned above, the correlation between key words is relatively less and the duration of the outbreak is constantly shortened, which indicates that the research hot spot changes quickly, and many research branches do not carry out continuous exploration and analysis.
3.4.2. Research Trends
As shown in Figure 11, combined with analysis of the burst strength, key-word network and time zone chart, various prospective research directions in ocean big data are as follows.
Data Assimilation
Accompanied by the updating of ocean information acquisition technology and the increase of acquisition methods, the management of ocean information presents a multi-dimensional characteristic; meanwhile, ocean data is a typical spatial data, which presents the characteristics of spatial correlation and heterogeneity in the spatial domain [34]. The quality of big ocean data is the foundation of ocean information management. However, the quality of big ocean data is uneven. Therefore, credible data is of great significance for improving ocean information management [35]. The security of ocean data assimilation is also significantly different from traditional data security and data protection. Therefore, the future management of ocean information assimilation requires data transmission, storage, access security and monitoring control-standardized management [36].
Remote Sensing Applications in the Ocean Environment
Sensors are increasingly used in the marine field. Fiber optic sensors can measure seawater salinity. High-sensitivity temperature sensors based on hollow microspheres can be used to measure ocean temperature. Experiments using different hollow parameters can be used to obtain sensor parameters versus temperature. As for the effect of sensitivity [37], the study in [38] explored the function of a geostationary satellite ocean color sensor to detect the chemical properties of the chlorophyll of marine life on earth. The work in [39] noted that coastal and ocean acidification can change marine biogeochemistry and cause economic and cultural losses. Existing integrated glider peace sensor systems are used for pH ocean sampling throughout coastal waters. Floating wireless sensor networks present unique communication barriers. Compared with other designs, hemispherical antennas have the advantages of higher efficiency and a greater propagation range. The results show that a floating hemispherical antenna can be successfully deployed and used in coastal wireless sensor network applications [40]. The study in [41] mentioned that the real-time inversion of the ocean wave spectrum and elevation vascular motion sensors have important practical significance but are still in the development stage. The Kalman filtering method has the advantages of real-time estimation, reduced costs and easy implementation. To date, several algorithms for retrieving cyano phycocyanin (PC) from the ocean have proposed to use color sensors for inland waters, all of which are considered reliable models [42]. As an important means for multi-dimensional observations of the ocean, the Ocean Sensor Network (OSN) can meet the needs of large-scale multi-factor comprehensive information observations of the marine environment. However, due to the multipath effect, the signal is blocked by waves, and unintentional or malicious attack abnormalities occur frequently and inevitably, which directly reduces the accuracy of the performance positioning. Therefore, improving the positioning accuracy measurements in the presence of outliers is a key issue that needs to be urgently addressed in the remote sensing development [43]. Above all, the paper shows the functions of remote sensing in environmental monitoring and management through its developmental process and trends, along with its application in environmental ocean monitoring.
Ocean Big Data System Development
By analysis of emergent words can be concluded that the core word “system” occupies a core position in the field of big data ocean information. The world’s largest global ocean-observing system associated with it is composed of the Intergovernmental Oceanographic Commission, the World Meteorological Organization, the Council of the International Federation of Science and the United Nations Environment Program. The Global Ocean Observing System divided it into five modules during the science and technology design phase. Module 1—the climate module is used to monitor, understand and detect the impact of physical and chemical processes of the ocean’s climate cycle on chemical element carbon and climate change. Module 2—the ocean health module is mainly about the impact of ocean environmental pollution on human health, which involves the characteristics of the deterioration of the ocean environment, the variability of the natural environment and the health characteristics of the ocean environment. Module 3—the biological resources module mainly relates to changes in the ocean environment that can affect the structure of ocean biological resources. The structure of the marine biological environment and the environment in which humans live are closely related. The main purpose of the biological resource module is to develop a system to ensure the prediction of the impacts of ocean ecology and its environmental changes on ocean life. Module 4—the coastal module is mainly related to various ocean activities, such as coastal zone management, environmental protection, ports and shipping. This module can provide a unified observation framework for the coast and provide different observation standards for various countries. At the same time, different countries in each coastal zone can refer to the research models and forecast results of different countries to better understand their marine environment. Module 5—the service module. The main purpose of this module is to improve the quantity and quality of end-user products and services. Both of the systems require constant improvement; in order to better help developing countries to establish business services and product application means, these modules set out the corresponding measures for the future development of ocean information systems [44,45].
4. Discussion
We made a brief analysis of the relevant literature and reached the following conclusions. First of all, from the perspective of time development, the outbreak period was from 2015 to 2019. The number of published studies in this period was not only higher, but the studies were highly cited. Secondly, in terms of publishing sources, the United States, China, the United Kingdom and Australia are the countries that have made the greatest contributions in the field of ocean big data. These countries have the most prolific authors and institutions, and there is an academic partnership between them. However, as far as institutions and authors are concerned, only a few collaborative sub-networks have been established in this field, and the research community needs to be further developed. Co-citation analysis suggests that highly-productive institutions or authors may be less cited. For example, China ranks second in the number of publications, but does not have any highly cited papers. This may be because there are fewer opportunities to cooperate with other countries in this field, and some institutions and authors do not receive much attention as newcomers. Finally, in terms of research content, most of the research belongs to the fields of marine science and computer science. Although there is a certain research foundation between the fields, there are still many gaps in the interdisciplinary field that can be filled.
As the citation burst analysis showed in Section 3, the focus topics ranged from water and the environment to satellite varieties, and there were few new high-frequency keywords appearing in the literature in recent years. Combined with more detailed literature interpretation of the keyword analysis part, we can be say that the application of big data technology can broaden the research depth and application scope of this marine field. On the basis of the foregoing, researchers in this field need to pay more attention to the latest development of big data in computer field and the expansion of its application. In the literature focusing on method discussion, it is mentioned that technological innovation helps to improve people’s cognition of problems; treat problems from different perspectives and levels; and obtain better ways to solve problems. Technology is ultimately made to serve its applications; big data technology and marine geographic information systems combined have a foothold; the future direction of development will be the construction of multi-environment elements of the multi-level real-time decision warning system. Nowadays, the deep learning model of multi-environment modal discovery is being applied in the diverse and comprehensive ocean data warehouse to quickly and accurately find the rules and predict the further developments of things, so as to provide a basis for decision-makers.
5. Conclusions
In this article, we introduced and applied the scientific information visualization software CiteSpace. Based on 400 research articles on ocean big data technology in the web of science, we used atlas research methods for scientific knowledge to analyze marine big data information. A pioneering information system in the field and theoretical research methods were used to perform a quantitative statistical analysis, fully showing the basic situation and developmental technology of the marine big data information field, including the distributions of countries, institutions, authors, co-citation journals, co-citation authors, co-citation documents, research hotspots and frontier topics.
- A.
- This study revealed the main contributions of big ocean data research.
- Countries: America is the most prolific country, followed by China, France, Germany, England, Australia, Spain, Italy, Canada and Japan. China ranks lower in citation centrality. In the ocean big data research field, strengthening language; communication; and cultural, technological and academic exchanges are efficient paths to improve Chinese citation centrality.
- Institutions: The organizations with relatively few connections and many publications are mostly universities. The University of the Chinese Academy of Sciences and the Ocean University of China are the major marine big data research institutions in China, ranking first and fourth in rank, respectively. Almost all of the academic institutions are universities in the ocean big data research field. Therefore, the core pieces of technology are basically derived from universities with strong scientific research capabilities.
- Journals: Science had the most-cited papers, followed by the followed by Geophys. Res. Lett., J. Geophys. Res.-Oceans, Nature, J. Climate, Plos One, B. Am. Meteorol. Soc., P. Natl. Acad. Sci. USA, Thesis and J. Phys. Oceanogr. Most relevant journals have a high impact factor, which brings academic resources for the research of ocean big data. These top ten comprehensive scientific journals can be used as reference materials for the research authority of ocean big data.
- B.
- This study Defined Research Hot Spots and frontier research.
Regarding research hot topics, there are: “ocean”, “model”, “big data”, “variability”, “impact”, “system”, “circulation”, “climate change”, “temperature” and “management”. Regarding the strongest citation burst from 1990 to 2019, there are “model”, “variability”, “impact”, ”system”, “circulation”, “climate change” and “temperature”. The longest burst key word is “simulation”, which continued popularity for ten years. Regarding the latest research frontiers, there are “validation”, “pattern” and “system” in ocean big data research. Based on the description of these hot spot topics, the developing trends for future research of the ocean big data are demonstrated. In the foundation of summarizing and appraising the internal ocean big data research, this thesis put forward the coming direction of research in the future.
This paper still has some room for improvement in the future: (1) Although CiteSpace was used to conduct visual quantitative analysis of information in ocean big data research field, this study is only a preliminary work due to the booming development of the computer big data field and the ocean field. (2) As the web of science core database was only used as the basic data source, comprehensiveness of the data still deficient. Future researchers should conduct more and more in-depth correlation analysis based on the data updates.
Author Contributions
Conceptualization, J.W. and D.X.; methodology, J.W.; software, J.W.; validation, J.W., D.X. and D.J.; formal analysis, D.J.; investigation, Z.W.; resources, Z.W.; data curation, Z.W.; writing—original draft preparation, J.W.; writing—review and editing, J.W.; visualization, J.W.; supervision, Z.W.; project administration, J.W.; funding acquisition, Z.W. All authors have read and agreed to the published version of the manuscript.
Funding
This research was funded by Major scientific research platform construction project in Shandong Province, grant number 2018SDPT01 and Manufacturing big data driven whole process production operation optimization and decision technology project, grant number 2018YFB1703104.
Conflicts of Interest
no conflict of interest.
Appendix A
To guarantee the accuracy and comprehensiveness of the data source, the analysis data for this study were taken from the core database of Thomson ISI’s SCI (Web of Science in the Science Citation Index Expended Edition). For the advanced search by article, the author set the search mode to “advanced search” with the following formula: Topic = (ocean big data), Language = (English) and Main Document Types = (article or review or proceedings paper), Time Interval = (1990–2019). A total of 614 records including the authors, titles, keywords, abstracts and cited references were selected. In order to ensure the accuracy of the data, we looked up the abstracts of all the articles, excluding articles that had nothing to do with ocean big data technology, after careful desk checking, and based on CiteSpace software visual analysis in the field, after the duplicate removal operation, only 400 articles were selected after the screening.
References
- Baidu Baike. Available online: https://baike.baidu.com/item/ocean/523?fr=aladdin (accessed on 29 January 2020).
- Baidu Wenku. Available online: https://wenku.baidu.com/view/3c499b24bcd126fff7050bc9.html (accessed on 29 January 2020).
- Lu, X. China’s satellite ocean remote sensing monitoring. Ocean Forecast 2008, 25, 85–89. [Google Scholar] [CrossRef]
- Jamkhaneh, E.; Sadeghpour, B.; Yari, G. Acceptance single sampling plan with fuzzy parameter with the using of Possion distribution. WASET 2009, 49, 1017–1021. [Google Scholar]
- Goodchild, M.; Haining, R.; Wise, S. Integrating GIS and spatial data analysis: Problem and possibilities. Geogr. Inf. Syst. 2007, 6, 407–423. [Google Scholar] [CrossRef]
- Baidu Baike. Available online: https://baike.baidu.com/item/GlobalOceanObservingSystem/9476640?fr=aladdin (accessed on 30 January 2020).
- Chen, C.; Ibekwe-SanJuan, F.; Hou, J. The structure and dynamics of co-citation clusters: A multiple-perspective co-citation analysis. J. Assoc. Inf. Sci. Technol. 2010, 3, 1–33. [Google Scholar]
- Boyack, K.W.; Klavans, R.; Borner, K. Mapping the backbone of science. Scientometrics 2005, 64, 351–374. [Google Scholar] [CrossRef]
- Chen, C. CiteSpace: Detecting and visualizing emerging trends and transient patterns in scientific literature. J. Assoc. Inf. Sci. Technol. 2006, 57, 359–377. [Google Scholar] [CrossRef] [Green Version]
- Cobo, M.J.; Lopez-Herrera, A.G.; Herrera-Viedma, E.; Herrera, F. Science mapping software tools: Review, analysis, and cooperative study among tools. J. Am. Soc. Inf. Sci. Technol. 2011, 62, 1382–1402. [Google Scholar] [CrossRef]
- Glanzel, W.; Schubert, A. Analysing scientific networks through co-authorship. In Handbook of Quantitative Science and Technology Research; Springer: Amsterdam, The Netherlands, 2004; Volume 2, pp. 257–276. [Google Scholar]
- Xu, A.; Sun, Y. Research hotspots and effectiveness of repetitive transcranial magnetic stimulation in stroke rehabilitation. J. Neural. Regener. Res. 2020, 15, 2089–2097. [Google Scholar]
- Osareh, F. Bibliometrics, citation analysis and co-citation analysis: A review ofliterature. Libri 1996, 46, 149–158. [Google Scholar] [CrossRef]
- Small, H. Co-citation in the scientific literature: A new measure of the relationship between two documents. J. Am. Soc. Inf. Sci. Technol. 1973, 24, 265–269. [Google Scholar] [CrossRef]
- Hu, C.P.; Hu, J.M.; Gao, Y.; Zhang, Y.K. A journal co-citation analysis of libraryand information science in China. Scientometrics 2011, 86, 657–670. [Google Scholar] [CrossRef]
- Liao, H.; Tang, M.; Luo, L.; Li, C.; Chiclana, F.; Zeng, X.J. A bibliometric analysis and visualization of medical big data research. Sustainability 2018, 10, 166. [Google Scholar] [CrossRef] [Green Version]
- Copping, J.P.; Stewart, B.D.; McClean, C.J.; Hancock, J.; Rees, R. Does bathymetry drive coastal whale shark (Rhincodon typus) aggregations? Peerj 2018, 6, e4904. [Google Scholar] [CrossRef] [PubMed] [Green Version]
- Duarte, C.M.; Riker, P.; Srinivasan, M.; Robinson, P.W.; Gallo-Reynoso, J.P.; Costa, D.P. Sonification of Animal Tracks as an Alternative Representation of Multi-Dimensional Data: A Northern Elephant Seal Example. Front. Mar. Sci. 2018, 5, 104. [Google Scholar] [CrossRef] [Green Version]
- Harcourt, R.; Sequeira, A.M.M.; Zhang, X.; Roquet, F.; Komatsu, K.; Heupel, M.; McMahon, M.; Whoriskey, F.; Meekan, M.; Carroll, G.; et al. Animal-Borne Telemetry: An Integral Component of the Ocean Observing Toolkit. Front. Mar. Sci. 2019, 6, 1258. [Google Scholar] [CrossRef] [Green Version]
- Lowerre-Barbieri, S.K.; Catala’n, I.A.; Opdal, A.F.; Jørgensen, C. Preparing for the future: Integrating spatial ecology into ecosystem-based management. J. Mar. Sci. 2019, 76, 467. [Google Scholar] [CrossRef]
- Queiroz, N. Global spatial risk assessment of sharks under the footprint of fisheries. Nature 2019, 572, 461. [Google Scholar] [CrossRef] [Green Version]
- Sequeira, A.M.M.; Hays, G.C.; Sims, D.W.; Eguíluz, V.M.; Rodriguez, J.P.; Heupel, M.R.; Harcourt, R.; Calich, H.; Queiroz, N.; Costa, D.P.; et al. Overhauling ocean spatial planning to improve marine megafauna conservation. Front. Mar. Sci. 2019, 6, 97. [Google Scholar] [CrossRef]
- Hays, G.C.; Ferreira, L.C.; Sequeira, A.M.M.; Meekan, M.G.; Duarte, C.M.; Bailey, H.; Bailleul, F.; Bowen, W.D.; Caley, M.J.; Costa, D.P.; et al. Key Questions in Marine Megafauna Movement. Ecol. Trends Ecol. Evol. 2016, 31, 463–465. [Google Scholar] [CrossRef] [Green Version]
- Kroodsma, D.A.; Mayorga, J.; Hochberg, T.; Miller, N.A.; Boerder, K.; Ferretti, F.; Wilson, A.; Bergman, B.; White, T.D.; Block, A.B.; et al. Tracking the global footprint offisheries. Science 2018, 359, 904. [Google Scholar] [CrossRef] [Green Version]
- Hampton, S.E.; Strasser, C.A.; Tewksbury, J.J.; Gram, W.K.; Budden, A.E.; Batcheller, A.L.; Duke, C.S.; Porter, J.H. Big data and the future of ecology. Front. Ecol. Environ. 2013, 11, 156. [Google Scholar] [CrossRef] [Green Version]
- Hönisch, B.; Ridgwell, A.; Schmidt, D.N.; Thomas, E.; Gibbs, S.J.; Sluijs, A.; Zeebe, R.; Kump, L.; Martinadale, C.R.; Greene, S.E.; et al. The Geological Record of Ocean Acidificatio. Science 2012, 335, 1058. [Google Scholar] [CrossRef] [PubMed] [Green Version]
- Hussey, N.E.; Kessel, S.T.; Aarestrup, K.; Cooke, S.J.; Cowley, P.D.; Fisk, A.T.; Harcourt, R.G.; Holland, K.N.; Iverson, S.J.; Kocik, J.F.; et al. Aquatic animal telemetry: A panoramic windowinto the underwater world. Science 2015, 348. [Google Scholar] [CrossRef] [PubMed] [Green Version]
- McCauley, D.J.; Woods, P.; Sullivan, B.; Bergman, B.; Jablonicky, C.; Roan, A.; Hirshfield, M.; Boerder, K.; Worm, B. New technologies could revolutionize ocean observation. Science 2016, 351, 1148. [Google Scholar] [CrossRef] [PubMed] [Green Version]
- Thums, M.; Fernández-Gracia, J.; Sequeira, M.M.; Eguíluz, V.M.; Duarte, C.M.; Meekan, M.G. How Big Data Fast Tracked Human Mobility Research and the Lessons for Animal Movement Ecology. Front. Mar. Sci. 2018, 5. [Google Scholar] [CrossRef] [Green Version]
- McCauley, D.J.; Pinsky, M.L.; Palumbi, S.R. Marine defaunation: Animal loss in the global ocean. Science 2015, 347. [Google Scholar] [CrossRef] [Green Version]
- Queiroza, N.; Humphriesa, N.E.; Mucientes, G. Ocean-wide tracking of pelagic sharks reveals extent of overlap with longline fishing hotspots. Proc. Natl. Acad. Sci. USA 2016, 113, 1582. [Google Scholar] [CrossRef] [Green Version]
- Block, B.A.; Jonsen, I.D.; Jorgensen, S.J. Tracking apex marine predator movements in a dynamic ocean. Nature 2011, 475, 86. [Google Scholar] [CrossRef]
- Yu, D.; Xu, Z.; Pedrycz, W.; Wang, W. Information Sciences 1968–2016: Aretrospective analysis with text mining and bibliometric. Inf. Sci. 2017, 48, 619–634. [Google Scholar] [CrossRef]
- Yu, Z.; Wong, S.F. The application of computational fluid dynamics simulation technique to ocean boat anti-disturbance tracking controller. Int. J. Adv. Robot. Syst. 2019, 1, 1–10. [Google Scholar] [CrossRef]
- Chen, Y.; Tang, C.; Gu, L. Research on Deep Ocean Resources Exploration Operation Technology Based on Manned Deep Submersible. J. Mech. Eng. 2003, 39, 38–42. [Google Scholar] [CrossRef]
- Chinese Academy of Sciences. Available online: http://www.qdio.cas.cn/xwzx/tpxw/201105/t20110526_3142444.html (accessed on 29 January 2020).
- Yan, Y.; Huang, K. Monitoring the Characteristics of the Bohai Sea Ice Using High-Resolution Geostationary Ocean Color Imager (GOCI) Data. Sustainability 2019, 11, 777. [Google Scholar] [CrossRef] [Green Version]
- Li, H.; He, X.; Shanmugam, P.; Bai, Y.; Wang, D. Radiometric Sensitivity and Signal Detectability of Ocean Color Satellite Sensor under High Solar Zenith Angles. IEEE Trans. Geosci. Remote Sens. 2019, 57, 8492–8505. [Google Scholar] [CrossRef]
- Saba, G.K.; Wright-Fairbanks, E.; Chen, B.; Cai, E.-J.; Barnard, A.H.; Jones, C.P.; Branham, C.W.; Wang, K.; Miles, T. The Development and Validation of a Profiling Glider Deep ISFET-Based pH Sensor for High Resolution Observations of Coastal and Ocean Acidification. Front. Mar. Sci. 2019, 6, 664. [Google Scholar] [CrossRef]
- Zia, M.L.; Hugo, G.E. Floating Hemispherical Helical Antenna for Ocean Sensor Networks. IEEE J. Ocean. Eng. 2019, 44, 1041–1048. [Google Scholar]
- Kim, H.; Kang, H.; Kim, M.-H. Real-Time Inverse Estimation of Ocean Wave Spectra from Vessel-Motion Sensors Using Adaptive Kalman Filter. Appl. Sci. 2019, 9, 2797. [Google Scholar] [CrossRef] [Green Version]
- Riddick, C.A.L.; Hunter, P.D.; Gómez, J.A.D. Optimal Cyanobacterial Pigment Retrieval from Ocean Colour Sensors in a Highly Turbid, Optically Complex Lake. Remote Sens. 2019, 11, 1613. [Google Scholar] [CrossRef] [Green Version]
- Mei, X.; Wu, H.; Xian, J.; Chen, B.; Zhang, H.; Liu, X. ARobust, Non-CooperativeLocalizationAlgorithmin the Presence of Outlier Measurements in Ocean Sensor Networks. Sensors 2019, 19, 2708. [Google Scholar] [CrossRef] [Green Version]
- Adrián. Full integration of photo micnanoimmunosensors in portable platforms for on-line monitoring of ocean pollutants. Sens. Actuators B Chem. 2019, 297, 126758. [Google Scholar]
- Cole, R.; Kinder, J.; Yu, W. Ocean Climate Monitoring. Front. Mar. Sci. 2019, 503, 1–5. [Google Scholar] [CrossRef] [Green Version]
Figure 1.
Annual publication outputs on ISI Web of Science data for the search topic ocean big data.
Figure 1.
Annual publication outputs on ISI Web of Science data for the search topic ocean big data.

Figure 2.
Regional distribution of publication.

Figure 3.
Country collaboration network map.

Figure 4.
Institutional collaboration network map.

Figure 5.
Author collaboration network map.

Figure 6.
Journals’ co-citation network map.

Figure 7.
Author co-citation network map.

Figure 8.
References co-citation network map.

Figure 9.
Keywords co-occurrence network map.

Figure 10.
Keyword time zone line map.

Figure 11.
Top 25 keywords with strongest citation bursts.


Table 1.
Top 10 most productive countries regarding big ocean data documents.
| Ranking | Counts | Centrality | Year | Countries |
|---|---|---|---|---|
| 1 | 100 | 0.18 | 1993 | USA |
| 2 | 79 | 0.01 | 2001 | People’s Republic of China |
| 3 | 33 | 0.16 | 1998 | France |
| 4 | 31 | 0.17 | 1998 | Germany |
| 5 | 30 | 0.13 | 1997 | England |
| 6 | 25 | 0.15 | 2002 | Australia |
| 7 | 18 | 0.02 | 2002 | Spain |
| 8 | 15 | 0.01 | 1995 | Italy |
| 9 | 14 | 0.03 | 2010 | Canada |
| 10 | 14 | 0.05 | 1993 | Japan |
Table 2.
Top 10 most productive institutions regarding big ocean data documents.
| Ranking | Counts | Centrality | Year | Institution |
|---|---|---|---|---|
| 1 | 26 | 0.21 | 2006 | University of Chinese Academy of Sciences |
| 2 | 8 | 0.01 | 2015 | King abdullah university of science and technology |
| 3 | 8 | 0.10 | 1993 | National Oceanic and Atmospheric Administration |
| 4 | 6 | 0.01 | 2009 | Ocean University of China |
| 5 | 6 | 0.12 | 2017 | University of Tasmania |
| 6 | 6 | 0 | 2016 | University of Hawaii Manoa |
| 7 | 6 | 0 | 2010 | University of British Columbia |
| 8 | 5 | 0.05 | 2008 | State Oceanic Administration |
| 9 | 5 | 0.02 | 2018 | Australian Institute of Marine Science |
| 10 | 5 | 0 | 2017 | Macquarie University |
Table 3.
Top 10 most productive authors of big ocean data documents.
| Ranking | Counts | Centrality | Year | Authors | From |
|---|---|---|---|---|---|
| 1 | 3 | 0 | 2019 | Michele Thums | Australian |
| 2 | 3 | 0 | 2019 | David W. Sims | Australian |
| 3 | 3 | 0 | 2019 | Nuno Queiroz | Australian |
| 4 | 3 | 0 | 2019 | Luciana C. Ferreira | Australian |
| 5 | 2 | 0 | 2019 | Juan Fernandezgracia | Australian |
| 6 | 2 | 0 | 2019 | Charlie Huveneers | Australian |
| 7 | 2 | 0 | 2017 | Mark A. Hindell | Australian |
| 8 | 2 | 0 | 2015 | Rob Harcourt | Australian |
| 9 | 2 | 0 | 2019 | Graeme C. Hays | Australian |
| 10 | 2 | 0 | 2019 | Ana M.M. Sequeira | Australian |
Table 4.
Top 10 most cited journals of big ocean data documents.
| Ranking | Counts | Centrality | Year | Journals | Impact Factor |
|---|---|---|---|---|---|
| 1 | 106 | 0.17 | 2001 | Science | 41.037 |
| 2 | 97 | 0.36 | 1995 | Geophys. Res. Lett. | 4.578 |
| 3 | 83 | 0.28 | 1993 | J. Geophys. Res.-Oceans | 3.235 |
| 4 | 77 | 0.22 | 1994 | Nature | 43.07 |
| 5 | 48 | 0.05 | 2007 | J. Climate | 4.805 |
| 6 | 40 | 0.16 | 2005 | PLOS ONE | 2.776 |
| 7 | 35 | 0.09 | 1996 | B. Am. Meteorol. Soc. | 8.166 |
| 8 | 30 | 0.01 | 2014 | P. Natl. Acad. Sci. USA | 9.58 |
| 9 | 28 | 0.01 | 2016 | Thesis | 5.043 |
| 10 | 28 | 0.11 | 1993 | J. Phys. Oceanogr. | 3.389 |
Table 5.
Top 10 most cited authors of big ocean data documents.
| Ranking | Counts | Centrality | Year | Authors |
|---|---|---|---|---|
| 1 | 17 | 0.3 | 2014 | Anonymus |
| 2 | 6 | 0.03 | 2010 | Pauly, D. |
| 3 | 6 | 0.32 | 2007 | Roemmich, D. |
| 4 | 4 | 0.14 | 2015 | Maxwell, S.M. |
| 5 | 4 | 0.07 | 2016 | Kerr, Y.H. |
| 6 | 4 | 0.02 | 2007 | Reynolds, R.W. |
| 7 | 4 | 0 | 2007 | Kalnay, E. |
| 8 | 4 | 0.13 | 2015 | Halpern, B.S. |
| 9 | 4 | 0 | 2017 | Li, J. |
| 10 | 4 | 0 | 2017 | Lee, J. |
Table 6.
Top 10 most cited references of big ocean data documents.
| Ranking | Counts | Centrality | Year | References |
|---|---|---|---|---|
| 1 | 5 | 0 | 2016 | Hays G.C. Key Questions in Marine Megafauna Movement Ecology. Trends. Ecol. Evol. 2016, Volume 31, pp. 463, DOI 10.1016/j.tree.2016.02.015 [23] |
| 2 | 4 | 0 | 2018 | Kroodsma D.A. Tracking the global footprint of fisheries. Science 2018, Volume 359, pp. 904, DOI 10.1126/science.aao5646 [24] |
| 3 | 4 | 0 | 2013 | Hampton S.E. Big data and the future of ecology. Front. Ecol. Environ. 2013, Volume 11: pp. 156, DOI 10.1890/120103 [25] |
| 4 | 4 | 0 | 2012 | Honisch B. The Geological Record of Ocean Acidification. Science 2012, Volume 335, pp. 1058, DOI 10.1126/science.1208277 [26] |
| 5 | 3 | 0.01 | 2015 | Hussey N.E. Aquatic animal telemetry: A panoramic window into the underwater world. Science 2015, Volume 348, pp. 0, DOI 10.1126/science.1255642 [27] |
| 6 | 3 | 0.01 | 2016 | McCauley D.J. Ending hide and seek at sea. Scienece 2016, Volume 351, pp. 1148, DOI 10.1126/science.aad5686 [28] |
| 7 | 3 | 0.01 | 2018 | Thums M. How Big Data Fast Tracked Human Mobility Research and the Lessons for Animal Movement Ecology. Front. Mar. Sci. 2018, Volume 5, pp. 0, DOI 10.3389/fmars.2018.00021 [29] |
| 8 | 3 | 0 | 2015 | McCauley D.J. Marine defaunation: Animal loss in the global ocean. Scienece 2015, Volume 347, pp. 0, DOI 10.1126/science.1255641 [30] |
| 9 | 3 | 0 | 2016 | Queiroz N. Ocean-wide tracking of pelagic sharks reveals extent of overlap with longline fishing hotspots. P. Natl. Acad. Sci. USA 2015, Volume 113, pp. 1582, DOI 10.1073/pnas.1510090113 [31] |
| 10 | 3 | 0 | 2011 | Block B.A. Tracking apex marine predator movements in a dynamic ocean. Nature 2011, Volume 475, pp. 86, DOI 10.1038/nature10082 [32] |
Table 7.
Top 10—keyword co-occurrence of big ocean data documents.
| Ranking | Counts | Centrality | Year | Keywords |
|---|---|---|---|---|
| 1 | 28 | 0.3 | 2010 | ocean |
| 2 | 26 | 0.45 | 1998 | model |
| 3 | 23 | 0.27 | 2016 | big data |
| 4 | 16 | 0.1 | 1998 | variability |
| 5 | 9 | 0.09 | 2010 | impact |
| 6 | 9 | 0.06 | 2011 | system |
| 7 | 8 | 0.1 | 2004 | circulation |
| 8 | 8 | 0.07 | 2014 | climate change |
| 9 | 6 | 0.04 | 2007 | temperature |
| 10 | 6 | 0.01 | 2016 | management |
© 2020 by the authors. Licensee MDPI, Basel, Switzerland. This article is an open access article distributed under the terms and conditions of the Creative Commons Attribution (CC BY) license (http://creativecommons.org/licenses/by/4.0/).
Share and Cite
MDPI and ACS Style
Wu, J.; Jia, D.; Wei, Z.; Xin, D. Development Trends and Frontiers of Ocean Big Data Research Based on CiteSpace. Water 2020, 12, 1560. https://doi.org/10.3390/w12061560
AMA Style
Wu J, Jia D, Wei Z, Xin D. Development Trends and Frontiers of Ocean Big Data Research Based on CiteSpace. Water. 2020; 12(6):1560. https://doi.org/10.3390/w12061560
Chicago/Turabian StyleWu, Jiajing, Dongning Jia, Zhiqiang Wei, and Dou Xin. 2020. "Development Trends and Frontiers of Ocean Big Data Research Based on CiteSpace" Water 12, no. 6: 1560. https://doi.org/10.3390/w12061560
Note that from the first issue of 2016, this journal uses article numbers instead of page numbers. See further details here.