2. Systematic Assessment of Innovative Crisis Management Solutions
2.1. Building upon the DRIVER+ Trial Guidance Methodology
The trial “The Netherlands” has been prepared according to the DRIVER+ Trial Guidance Methodology [
3]. The structured approach was developed within the DRIVER+ project and consists of three phases: Preparation, execution, and evaluation. Multiple iterative tasks that include, for example, formulation of gaps and objectives, definition of evaluation plans and measures, as well as sketching and refining a realistic scenario, are part of this methodical framework. Foks-Ryznar et al. [
15] describe the process of trial preparation and execution for assessing socio-technical innovation in CM based on two practical examples.
Together with regional experts, the team of trial “The Netherlands” first identified three capability gaps in the existing CM procedures that should be improved through innovative action or technologies. Suitable solutions were then searched to encounter shortcomings in: (1) Resource planning of personnel and equipment for large-scale and long-term crisis; (2) information sharing between conventional emergency services and concerned crisis teams of external organizations; as well as (3) planning and managing of large-scale evacuation in urban areas. The trial was designed in a co-creative process with CM practitioners and technology providers. This created a testing environment as realistic as possible, but with sufficient flexibility to incorporate the selected technical tools in a way they can leverage its strength. Practitioners of the Safety Region Haaglanden applied the “six-step-approach” defined by the Trial Guidance Methodology to design a fictive scenario that dealt with the threat and impact phase of a severe flooding. Multiple pre-trial meetings were required to test, discuss, and adjust the trial design iteratively. Finally, practitioners from various disciplines have been trained using the selected technologies in a one-hour hands-on training session each before testing these tools in a challenging crisis scenario over the course of two days. To evaluate the effect of applying a certain socio-technical innovation in CM (“innovation line”), a mixed-method approach was applied considering multiple dimensions: The specific trial context, the technologies’ effect on CM in this particular setup, and their usefulness according to personal opinions of the practitioners who used them.
Regarding the trial context, semi-structured questionnaires were handed out to all participants at the end of the event. Practitioners, observers, technology providers, and trial staff were equally surveyed to take note of any potential bias caused by framework conditions. In addition, separate debriefing sessions have been conducted at the end of each day for each of these groups. A focus-group discussion was carried out the day after the trial with key participants of the trial organizer team. As this paper focuses on the part of the technologies, we will not go into details about the trial dimension part of the evaluation. However, it is worth mentioning that the combined results showed that framework conditions were assessed consistently satisfactory. No negative impact on the analysis results presented in the following sections could be identified.
To assess the technologies’ usefulness (consisting of the aspects utility and usability according to ISO 9241-11 criteria [
16]) semi-structured questionnaires were given to the practitioners after each scenario block to collect opinions quantitatively and qualitatively. The questionnaire contained five consistent variables with varying number of items for all technologies and one additional variable that varied according to the individual functions addressed by the technology:
Effectiveness (two items, e.g., “I was able to manage my tasks more easily using this solution.”);
Efficiency (two items, e.g., “I was able to complete my tasks faster using this solution.”);
Satisfaction (eight items, e.g., “Clarity of user interface.”);
Learning (two items, e.g., “It was easy to learn to use this solution.”);
Utility (three items, e.g., “It was easy to integrate this solution into my current workflows.”);
CM function support (varying number of questions, three items per function, e.g., “The feature is mature enough to be used.”)
The rating was based on a five-point bipolar Likert scale ranging from “Strongly disagree/Very poor” to “Strongly agree/Very good”. Free-text commentaries were allowed for all questions and explicitly requested through open space for suggestions for improvement or remarks. Debriefing sessions complemented the survey results with ad-hoc feedback on the technologies deployment.
Thirty-seven CM practitioners participated in the trial, overall. These were distributed according to their true professional background among 10 teams of sizes ranging from two to five participants each (cf.
Section 2.2). The participants were asked to only rate on the technologies they actively used in the trial; consequently, the results presented in
Section 3 refer to 14 responding users for module ZKI (available to all teams) and five for module KeepOperational (only deployed for AC police). The participants were characterized by a medium to high professional experience in CM. Fifty-seven percent of the ZKI users stated work experience in the assigned field of work of 5 to 10 years and 36% indicated greater than 10 years. For KeepOperational, a large majority (80%) claimed more than 10 years of professional experience, while 20% referred to 5 to 10 years.
The documented feedback as well as rating results were evaluated by the trial evaluation team on an overarching level, and in depth by the technology provider DLR through descriptive statistics using diverging stacked bar charts (cf. 3.1f).
For evaluation of the effect on CM functions (as support to individual user tasks), a data collection plan was defined: Actions taken, information shared, and decisions made within the trial have either been tracked by observers assigned to each team, or the technical means of the TTI [
5]. The TTI provides, for example, connection capabilities to enable the machine-to-machine communication and the exchange of data and information between independent software solutions and can thus keep record of the data exchange for evaluation purposes. The resulting trial data (“innovation line”) were compared against prior collected information on the as-is process (“baseline”) by the trial evaluation team in the aftermaths of the trial (evaluation phase).
2.2. Flooding of The Hague—A Tabletop Design
The Netherlands are operating a highly innovative and well-functioning flood protection system and therefore local experts consider the likelihood of a serious flooding correspondingly low. However, being situated in a low-lying delta with two-thirds of its national territory below sea-level, failure of these systems would lead to devastating consequences. The high-level expertise in flood protection and control in The Netherlands provides a beneficial test environment to assess potential innovation in handling flood risk and accompanying side effects. Accordingly, a challenging trial scenario was formulated by a multi-disciplinary working group formed by practitioners of the Safety Region Haaglanden: A north-western storm heading towards the Dutch coast brings high winds and heavy rainfall. Unfortunate coincidences led to technical failure of a lock located in The Hague, exposing the city area to a high risk of being flooded in case the storm hits the coast.
The trial was performed over two days in May 2019. The first trial day was dedicated to the flood threat that required decisions on evacuation needs for the densely populated area, as well as to develop strategies and plan resources for response according to the expected scale and duration of the event. The second day of the trial focused on the impact phase: The region being flooded, exposing the population to the risk of being trapped in high water. The transport system is severely impaired and partially comes to a complete standstill. Cascading effects occur, such as partial power failures or disruption of communication lines. The situation affects the supply of fresh drinking water and food, the function of heating systems, as well as the provision of information and instructions to the public. The progression of the circumstances requires adapting evacuation strategies and ongoing activities from the threat phase to the emerged situation to ensure fast and effective evacuation of the remaining population. Relief forces and other resources need to be coordinated to restore infrastructure and services and deployed efficiently to remain operational for a longer period.
Table 1 summarizes the trial design, which consisted of four scenario sequences (blocks) each with specific objectives of CM.
According to the scope of the scenario, the leading response organization Safety Region Haaglanden decided to scale the response to GRIP2 of the Coordinated Regional Incident Handling Procedure [
17] where action centers (ACs; tactical level) of emergency services and the Regional Operational Team (strategic level) are the core in the CM process. The trial’s physical setup was chosen according to the Dutch system [
18]. It consisted of a multidisciplinary control room of traditional security partners (police, fire service, medical services, and municipality, supported by military actors) and a separated space for additional crisis teams (CTs) of liaising organizations such as the waterboard, the local transport and power infrastructure companies, as well as international organizations. The multidisciplinary evacuation team is usually not available in this composition and was formed as adaption to the common process in result of the trial preparations.
The trial focused on tactical issues and strategic advice only, operational tasks were not included due to the tabletop setting. A tabletop setup is characterized by a simulated crisis that focuses on problem-solving via discussions and formulation of response actions, in contrast to full-scale exercises that involve also operational tasks. Overall, the trialed scenario required conventional emergency services to cooperate interdisciplinarily and with external organizations to manage the situation. Tasks corresponding with the simulated situation were distributed within a meeting of the Regional Operational Team that started each of the scenario blocks. In the following, all disciplines worked in their groups on their respective tasks (
Table 2). Decisions were made and actions taken by all involved stakeholders in a realistic but simulated information environment, provided by the TTI. The fundamentals were existing crisis management plans and standard operational procedures, legacy systems, and good practices of participants. On top of that, the practitioners were invited to use the new technologies to their favor whenever possible to solve their tasks. Besides DLR’s solution, four additional technologies have been selected to demonstrate their capabilities in the trial (the full setup including all technologies involved is documented in [
19]). Within the following strategical meeting that closed each block, conclusions were discussed based on the information gathered in the working sessions. The decisions made and advice given within this meeting determined the sessions’ results. The Regional Operational Team only used the legacy emergency management system LCMS, but was advised by the ACs/CTs who used the new technologies for disciplinary tasks.
2.3. Applying KeepOperational and ZKI in the Trial
DLR’s situational awareness system, composed of module KeepOperational and ZKI as introduced in
Section 1.2, was selected by the trial committee together with a multidisciplinary consortium of CM practitioners to contribute to:
A net-centric inter-organizational data exchange of crisis information to create a common situational picture for all stakeholders involved.
Planning and management of a large-scale evacuation under consideration of traffic information.
The ZKI module targeted the experienced shortcomings in the ability to exchange crisis-related information equally among emergency services as well as external organizations, with a focus on the impact phase of the event. Its set goal was to demonstrate the various capabilities of remote sensing-based crisis mapping services for an enhanced situational awareness by supporting internal and external actors concurrently with an up-to-date and large-scale overview of the situation. In addition to timely provided geo-services on the geographic extent of the flood, new analysis products on the affected and potentially damaged infrastructure such as 3D visualizations have been trialed.
KeepOperational was applied to retrieve information obtained from airborne reconnaissance through ZKI and combine it with the practitioners’ acquired information, such as field reports (e.g., local road blockades or reports on road congestions), to automatically adapt route suggestions accordingly. Oddo and Bolten [
20] emphasize the socioeconomic benefit of such a situation-aware routing system for informed decision making in flood management. They also draw attention to potential improvements to their setup by using high-resolution aerial image data, additional obstacle information, or real-time information on congestion points. DLR’s module KeepOperational already implements this operationally. Verifying the benefit of such an improved design for an efficient evacuation procedure was the declared goal of KeepOperational’s deployment. Even though it is capable to incorporate real-time traffic information from various sources, due to the tabletop setting, this capability was not tested in this context.
2.3.1. Preparation of DLR’s Techniques
To apply the DLR solution in the simulated environment of the trial, it was connected to the TTI by using two separate adapters, one for KeepOperational and one for the ZKI module. The adapters were developed using the Java programming language. A library provided by the DRIVER+ project could be used to connect to the TTI. The TTI itself was based on Apache Kafka, a messaging system. Connected applications can produce and consume messages on certain topics. The messages were structured using Apache AVRO [
5]. Each adapter connects with a unique identifier. KeepOperational was connected as a consumer, listening for updates regarding the flood situation. The ZKI module was connected as a producer, publishing updates of the recorded flooding to the TTI. Topics and adapter identifiers were defined during technical integration sessions with the DRIVER+ TTI team. During the trial, each adapter was also given an individual certificate to authenticate himself at the TTI to ensure security.
In a data pre-processing step, a hypothetical disaster extent layer was prepared. The simulated test data were based on a pre-calculated flood prediction and transformed according to realistic characteristics of optical airborne data acquisition and processing techniques. During this process, the spatial resolution of the original data layer was resampled from 0.2 m to 1 m to reduce complexity and the amount of data, and thus to minimize calculation and transmission times. A binary mask was derived, which contained only one class (“water”). Additionally, a minimum mapping unit of 100 square meters was applied. Finally, the mask was converted to a vector layer. The resulting information layer was ingested to the geoserver component of DLR’s EOC geoservice [
21] and published conformable to the standards of Web Map Service [
22] and Web Feature Service [
23] of the Open Geospatial Consortium. The required services for the web-based tool KeepOperational were deployed on DLR servers for the purpose of the trial. Using Docker containers, however, it could easily be deployed in other server environments. The required street network was obtained from OpenStreetMap [
24]. To be used in KeepOperational, the data were converted into an internal format by using the SUMO NETCONVERT tool [
25].
To compile simulated 2D and 3D damage assessment maps, ZKI obtained an aerial image mosaic [
26] and additional geographic data (inland water, public transport stations, road transport [
24], rail transport [
27], building data/administrative boundaries [
28], and points of interest [
27,
29,
30]) from open data sources. The flood extent was intersected with this geo-information using ESRI ArcGIS software [
31] to provide the damage assessment. The 2D GeoPDF was prepared with ArcGIS and the TerraGo Publisher extension [
32]. The software Eternix BlazeTerra [
33] was used to compose the corresponding 3D PDF. The scope of analysis, as well as the PDF output format, was chosen corresponding to ZKI’s years of experiences in rapid mapping on data availability and limited technical resources of emergency responders to use geospatial products. The final map products were uploaded to the webserver of ZKI and made available as
https-downloads.
2.3.2. Trialing ZKI and KeepOperational
KeepOperational is tailored to the needs of tactical and operational level actors. Within the preparation phase of the trial, the AC police was chosen to operate and assess KeepOperational, as it is the responsible actor of the safety region to generate traffic circulations plans. Further, it was expected that police would be reached by other emergency services to analyze the accessibility of certain points-of-interest on their behalf. By using crisis information from ZKI, it was suspected that KeepOperational shows the greatest value in the impact phase of the event. To assess its full potential in different phases of the CM cycle, the module was also set-up to support decision making in the threat phase by coupling predictive flood information from another tested technology called 3Di [
34].
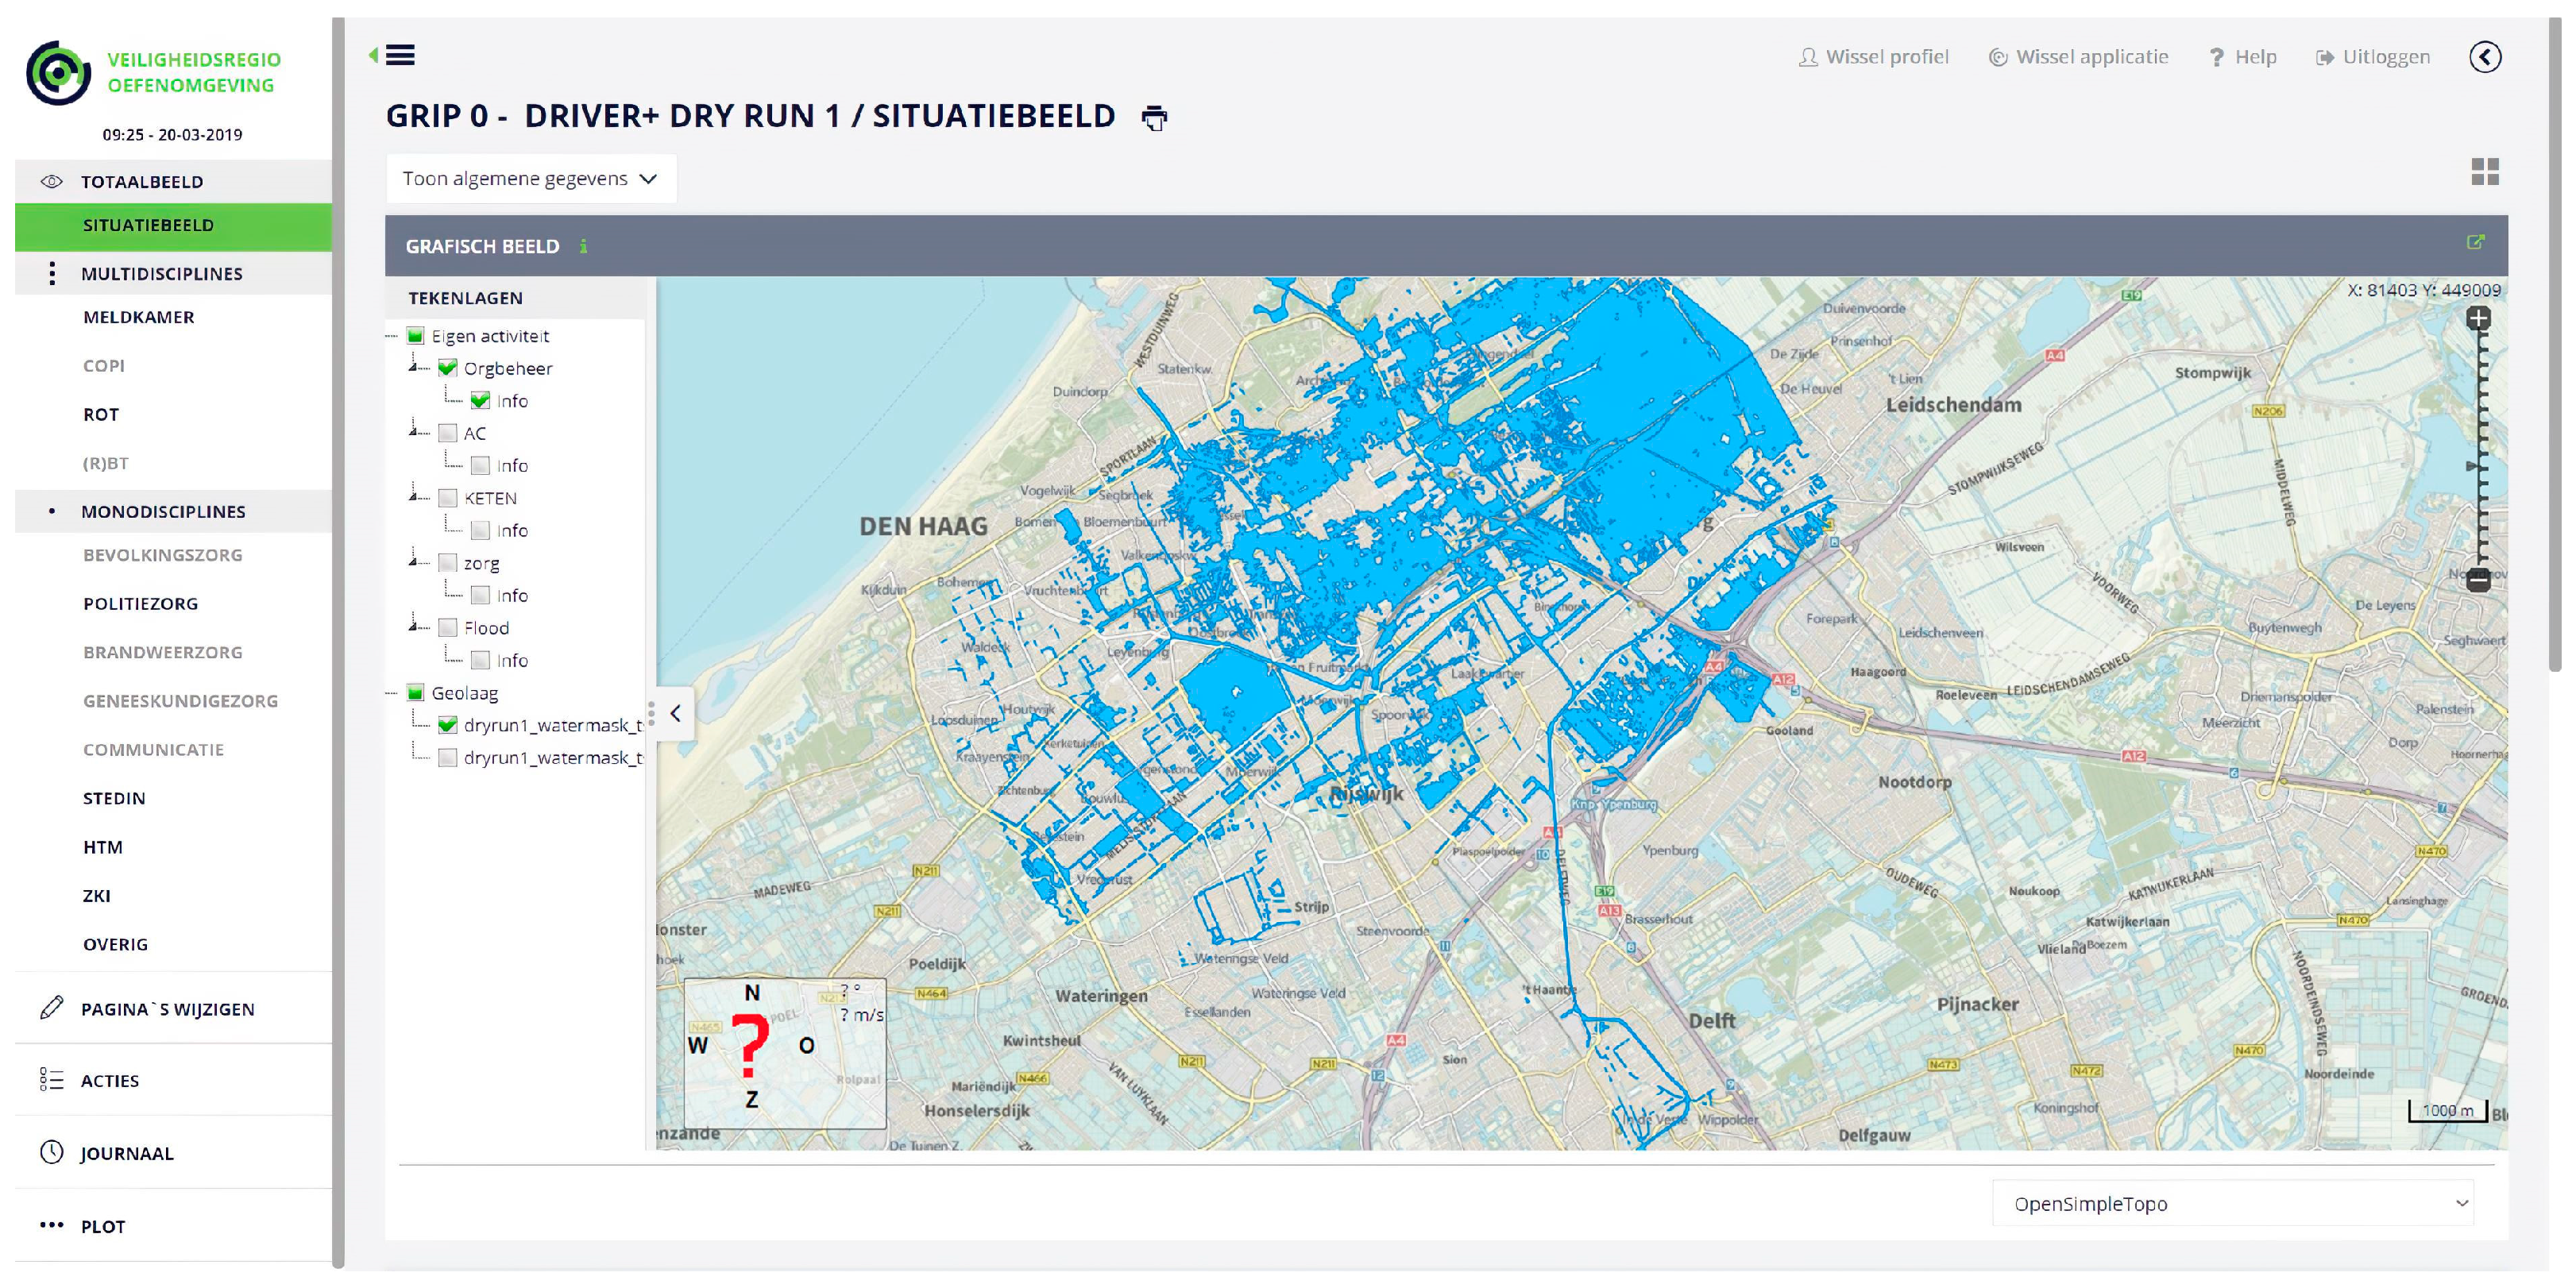
The information manager of the Regional Operational Team was identified by the involved practitioner working group as the appropriate point of contact for the rapid mapping request to ZKI. He was trained on how to request for support by ZKI and how to spread the delivered information with the means available. Data provision was scheduled at a realistic point in time, which meant delivery of the flood extent information in Block 3 (“situation assessment and evacuation”) of the scripted scenario. After verifying the data received from ZKI, the information manager triggered the integration of the Web Map Service layers into the common operational picture of the Dutch legacy emergency management system called LCMS [
35] (
Figure 2). Information shared through the information manager in the situational overview of LCMS was transferred to a second emergency management system called CrisisSuite [
36] that connected external CTs on demand of the Regional Operational Team to this information flow.
Sharing of the flood extent between ZKI and KeepOperational, but also with the other innovative tools, was technologically realized via the Web Feature Service interface of DLR’s EOC geoservice. The tools gained access to these services via large data update message. This message was distributed through the common information space of the TTI to the connected innovations. This enabled additional systems to utilize the flood information, but also to track interactions for evaluation purposes.
When receiving the flood information immediately upon availability from the ZKI module, the resulting network restrictions were applied to the underlying routing graph in KeepOperational. Additional restrictions of the traffic infrastructure or damages could be added manually through drawing functions or through the import function via standardized formats such as GeoJSON. Consequently, the current disaster situation was considered by the routing algorithm.
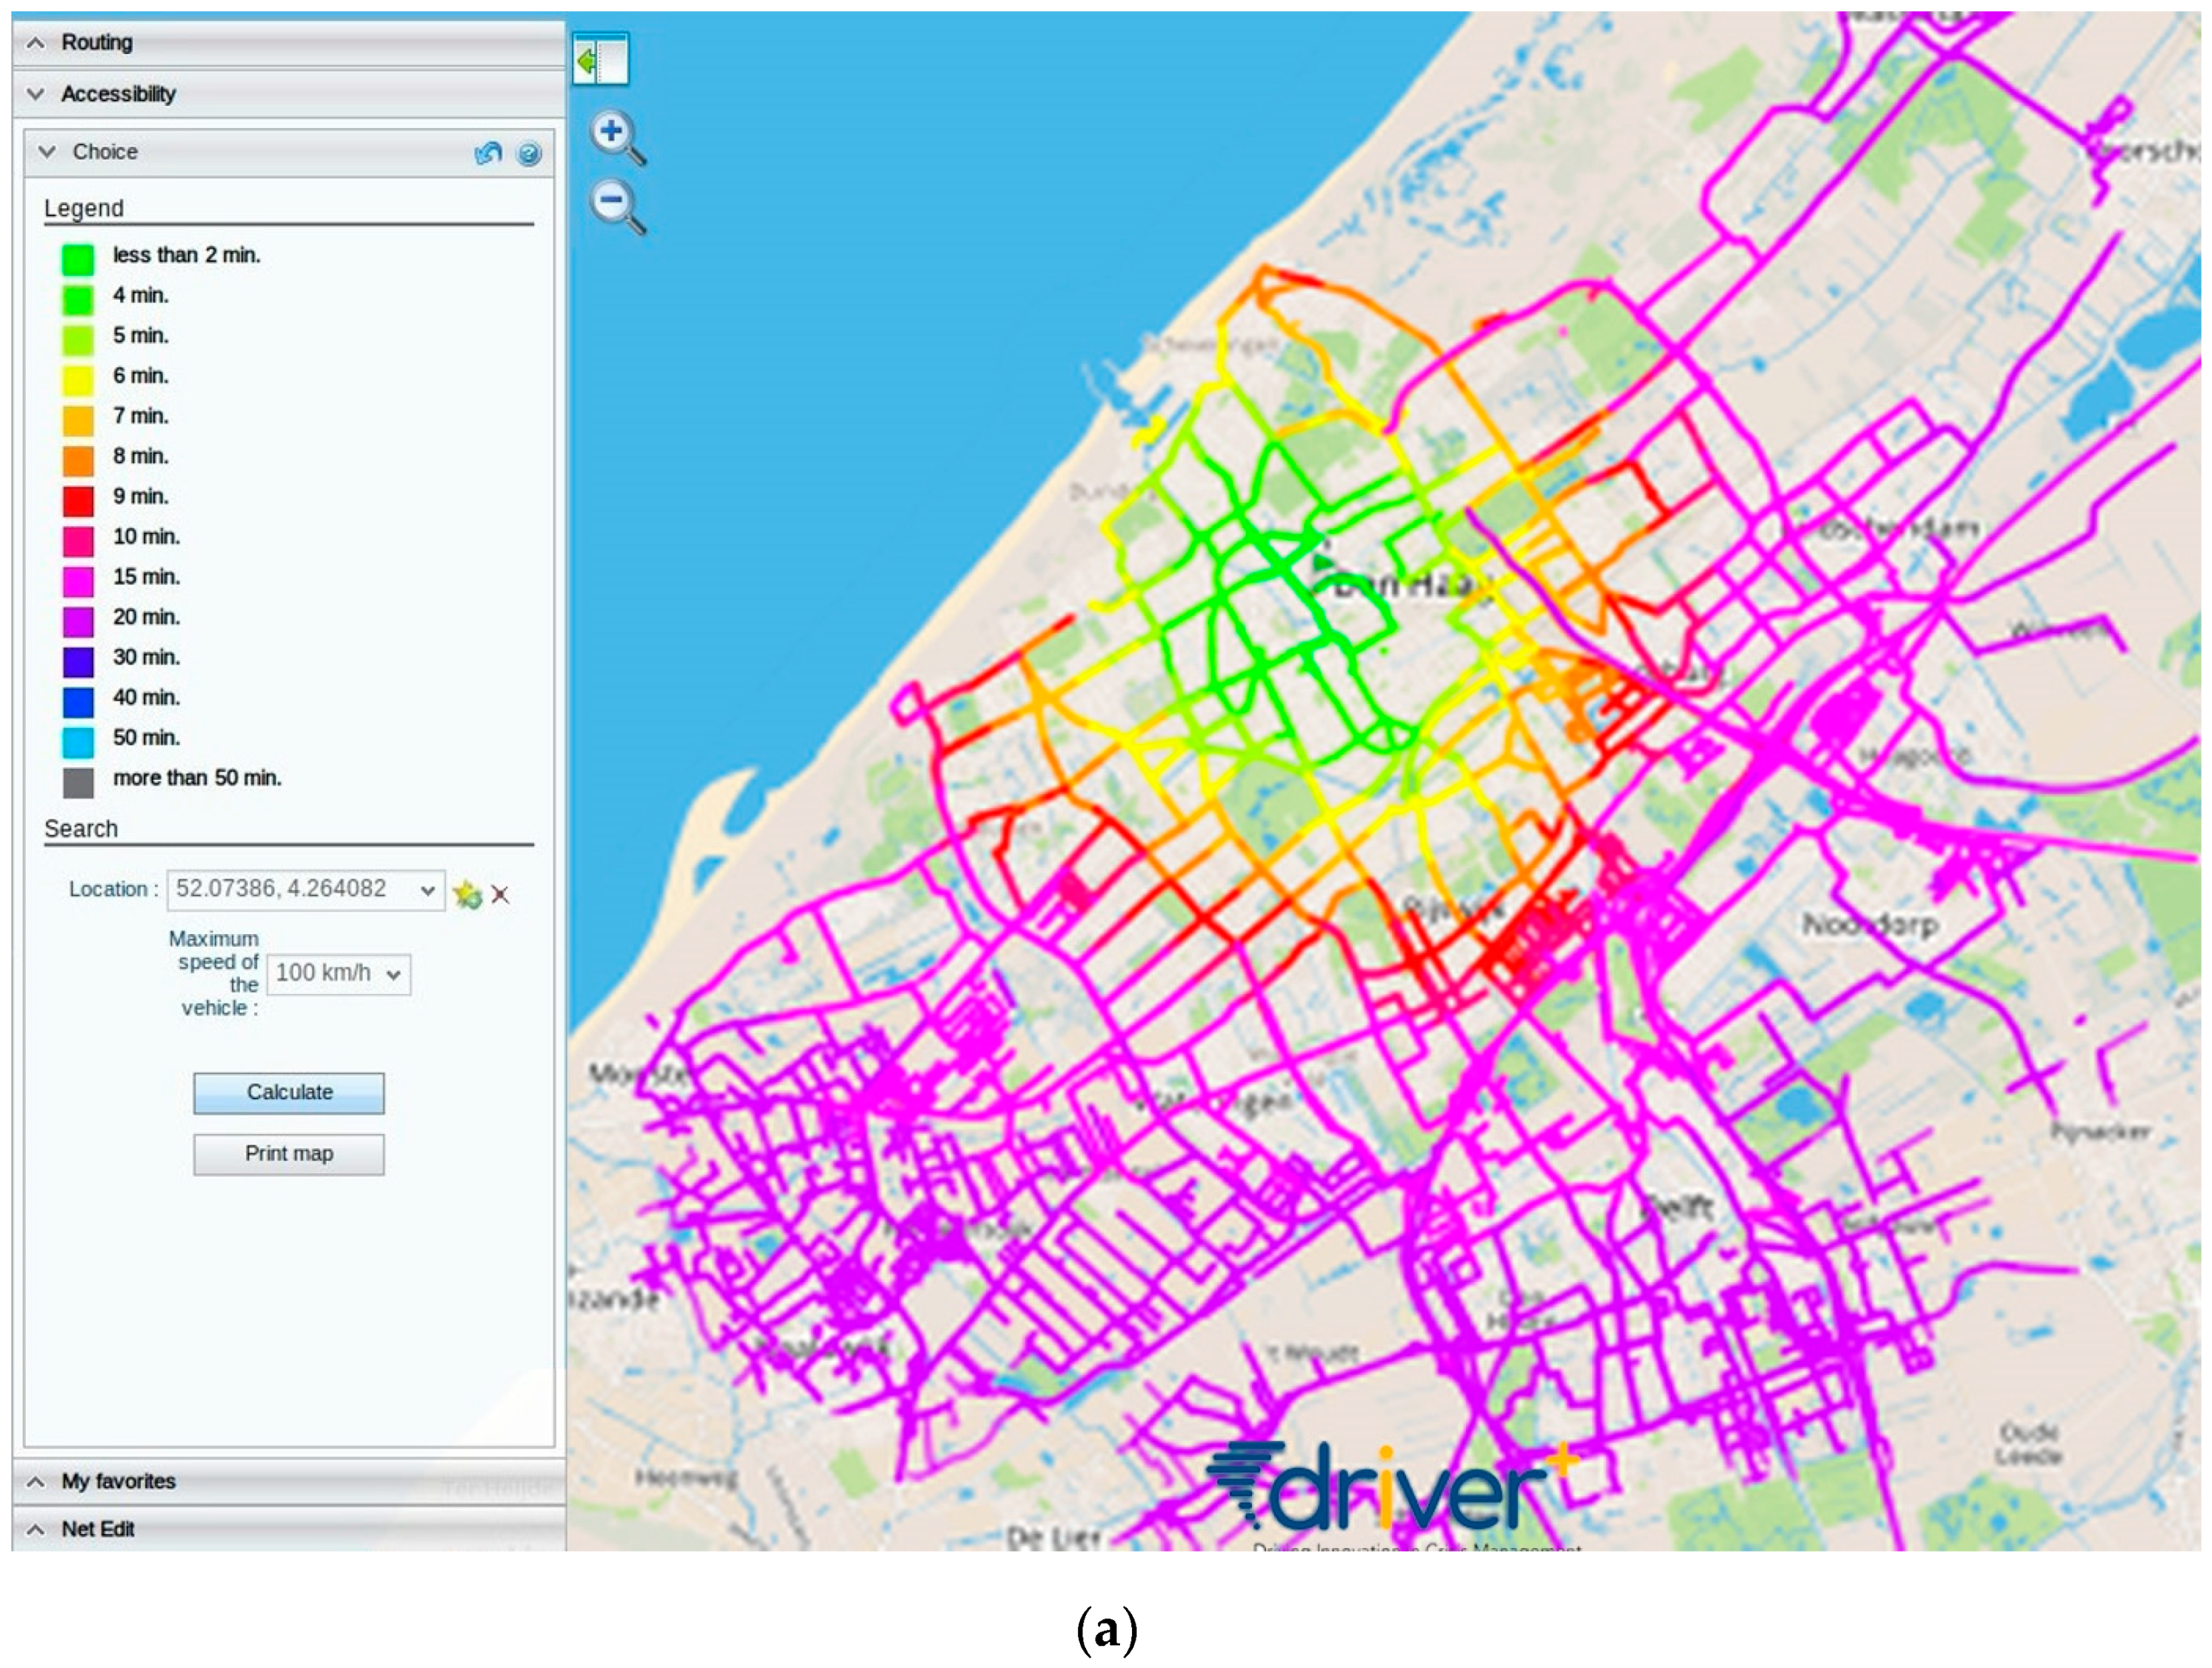
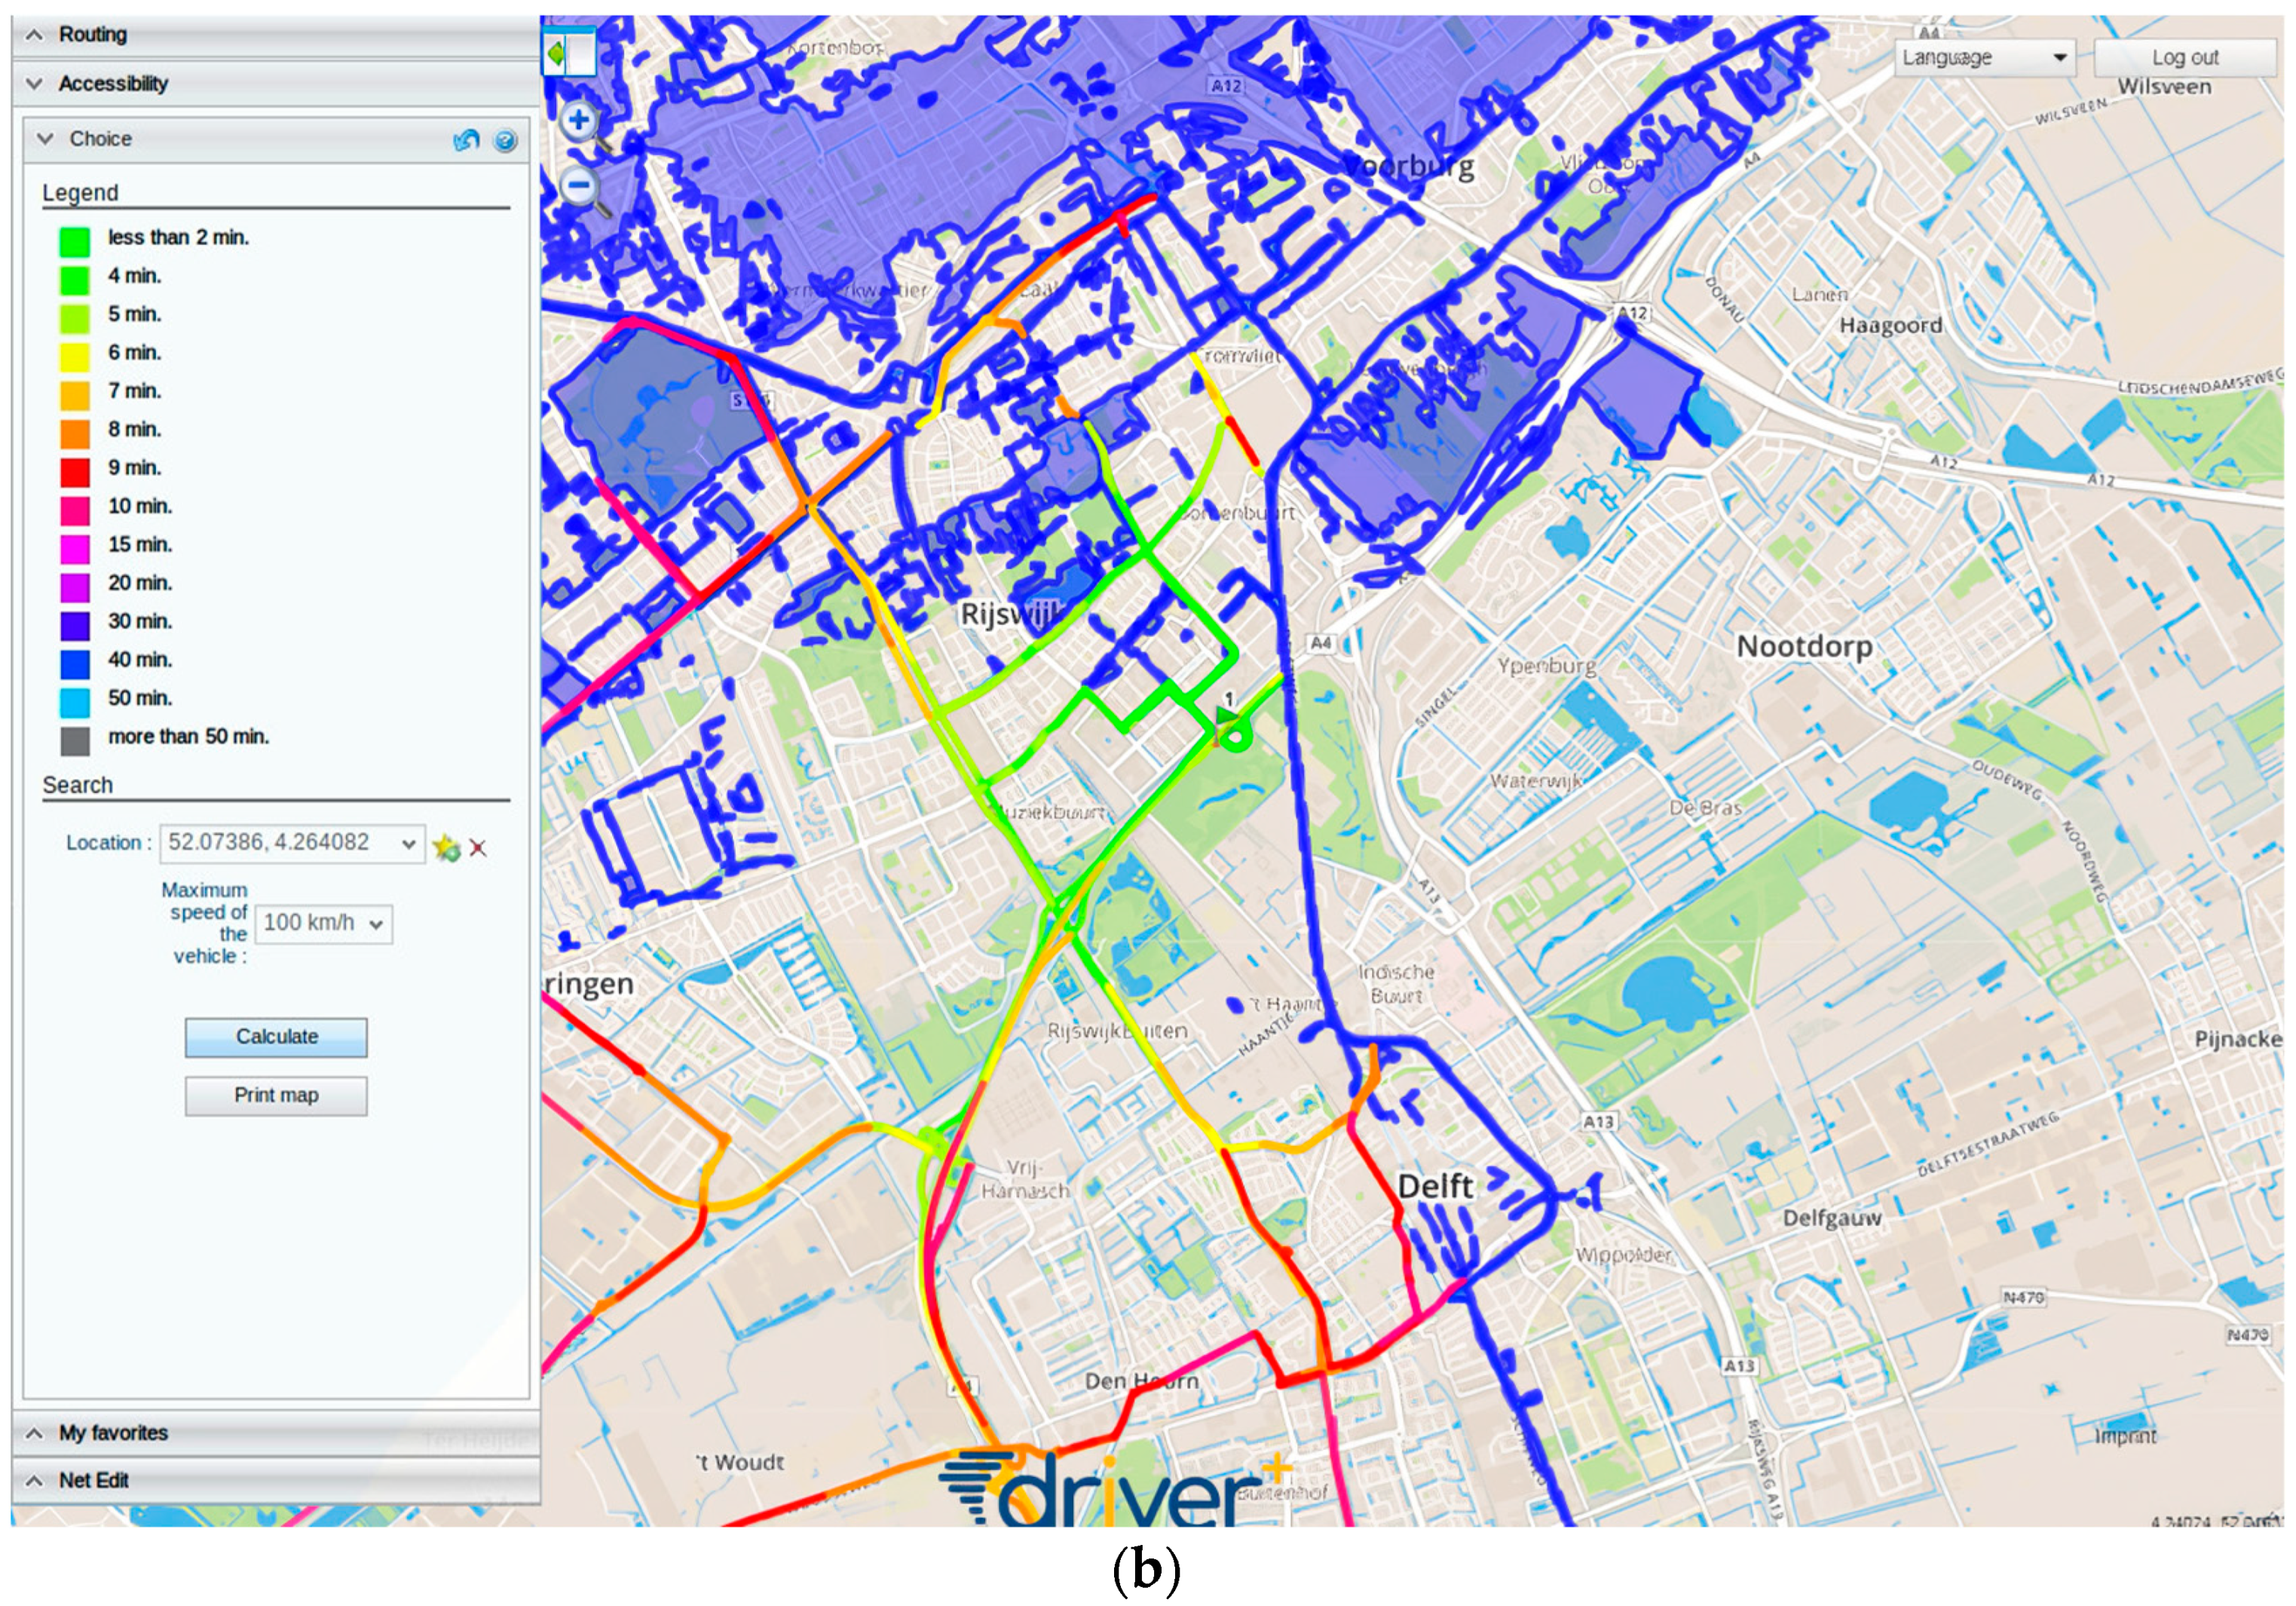
By selecting start and endpoints, the AC police queried suitable routes to be used for evacuation of the remaining population that avoided impaired areas with the route planning feature. The operator defined characteristics for special vehicles or convoys in his routing request to KeepOperational. The vehicle type each with characteristic dimensions and weight influences turning times, travel speed, or restricts available routes (due to occurrence of bridges, tunnels, or underpasses on the way). The respective restrictions are consequently considered in the proposed route. Other ACs also reached out to the police with special routing requests due to response activities. By using the isochrones router (
Figure 3), the police assessed the current accessibility of the affected area to discuss appropriate measures or used the tool to analyze the best distribution of assembly points for evacuation according to situation specific infrastructure constraints.
Due to the additional effort of value adding, response times for the damage assessment products took longer than for the flood extent layer. Hence, maps were not provided until the beginning of Block 4 (“damage assessment and recovery measures”). The download links were sent to the information manager of the Regional Operational Team, who verified the significance of the products. The distribution to the response teams was technically realized by integrating the hyperlinks in the situational overview of LCMS and passing the text-based information automatically from one emergency management system to the other through the TTI.
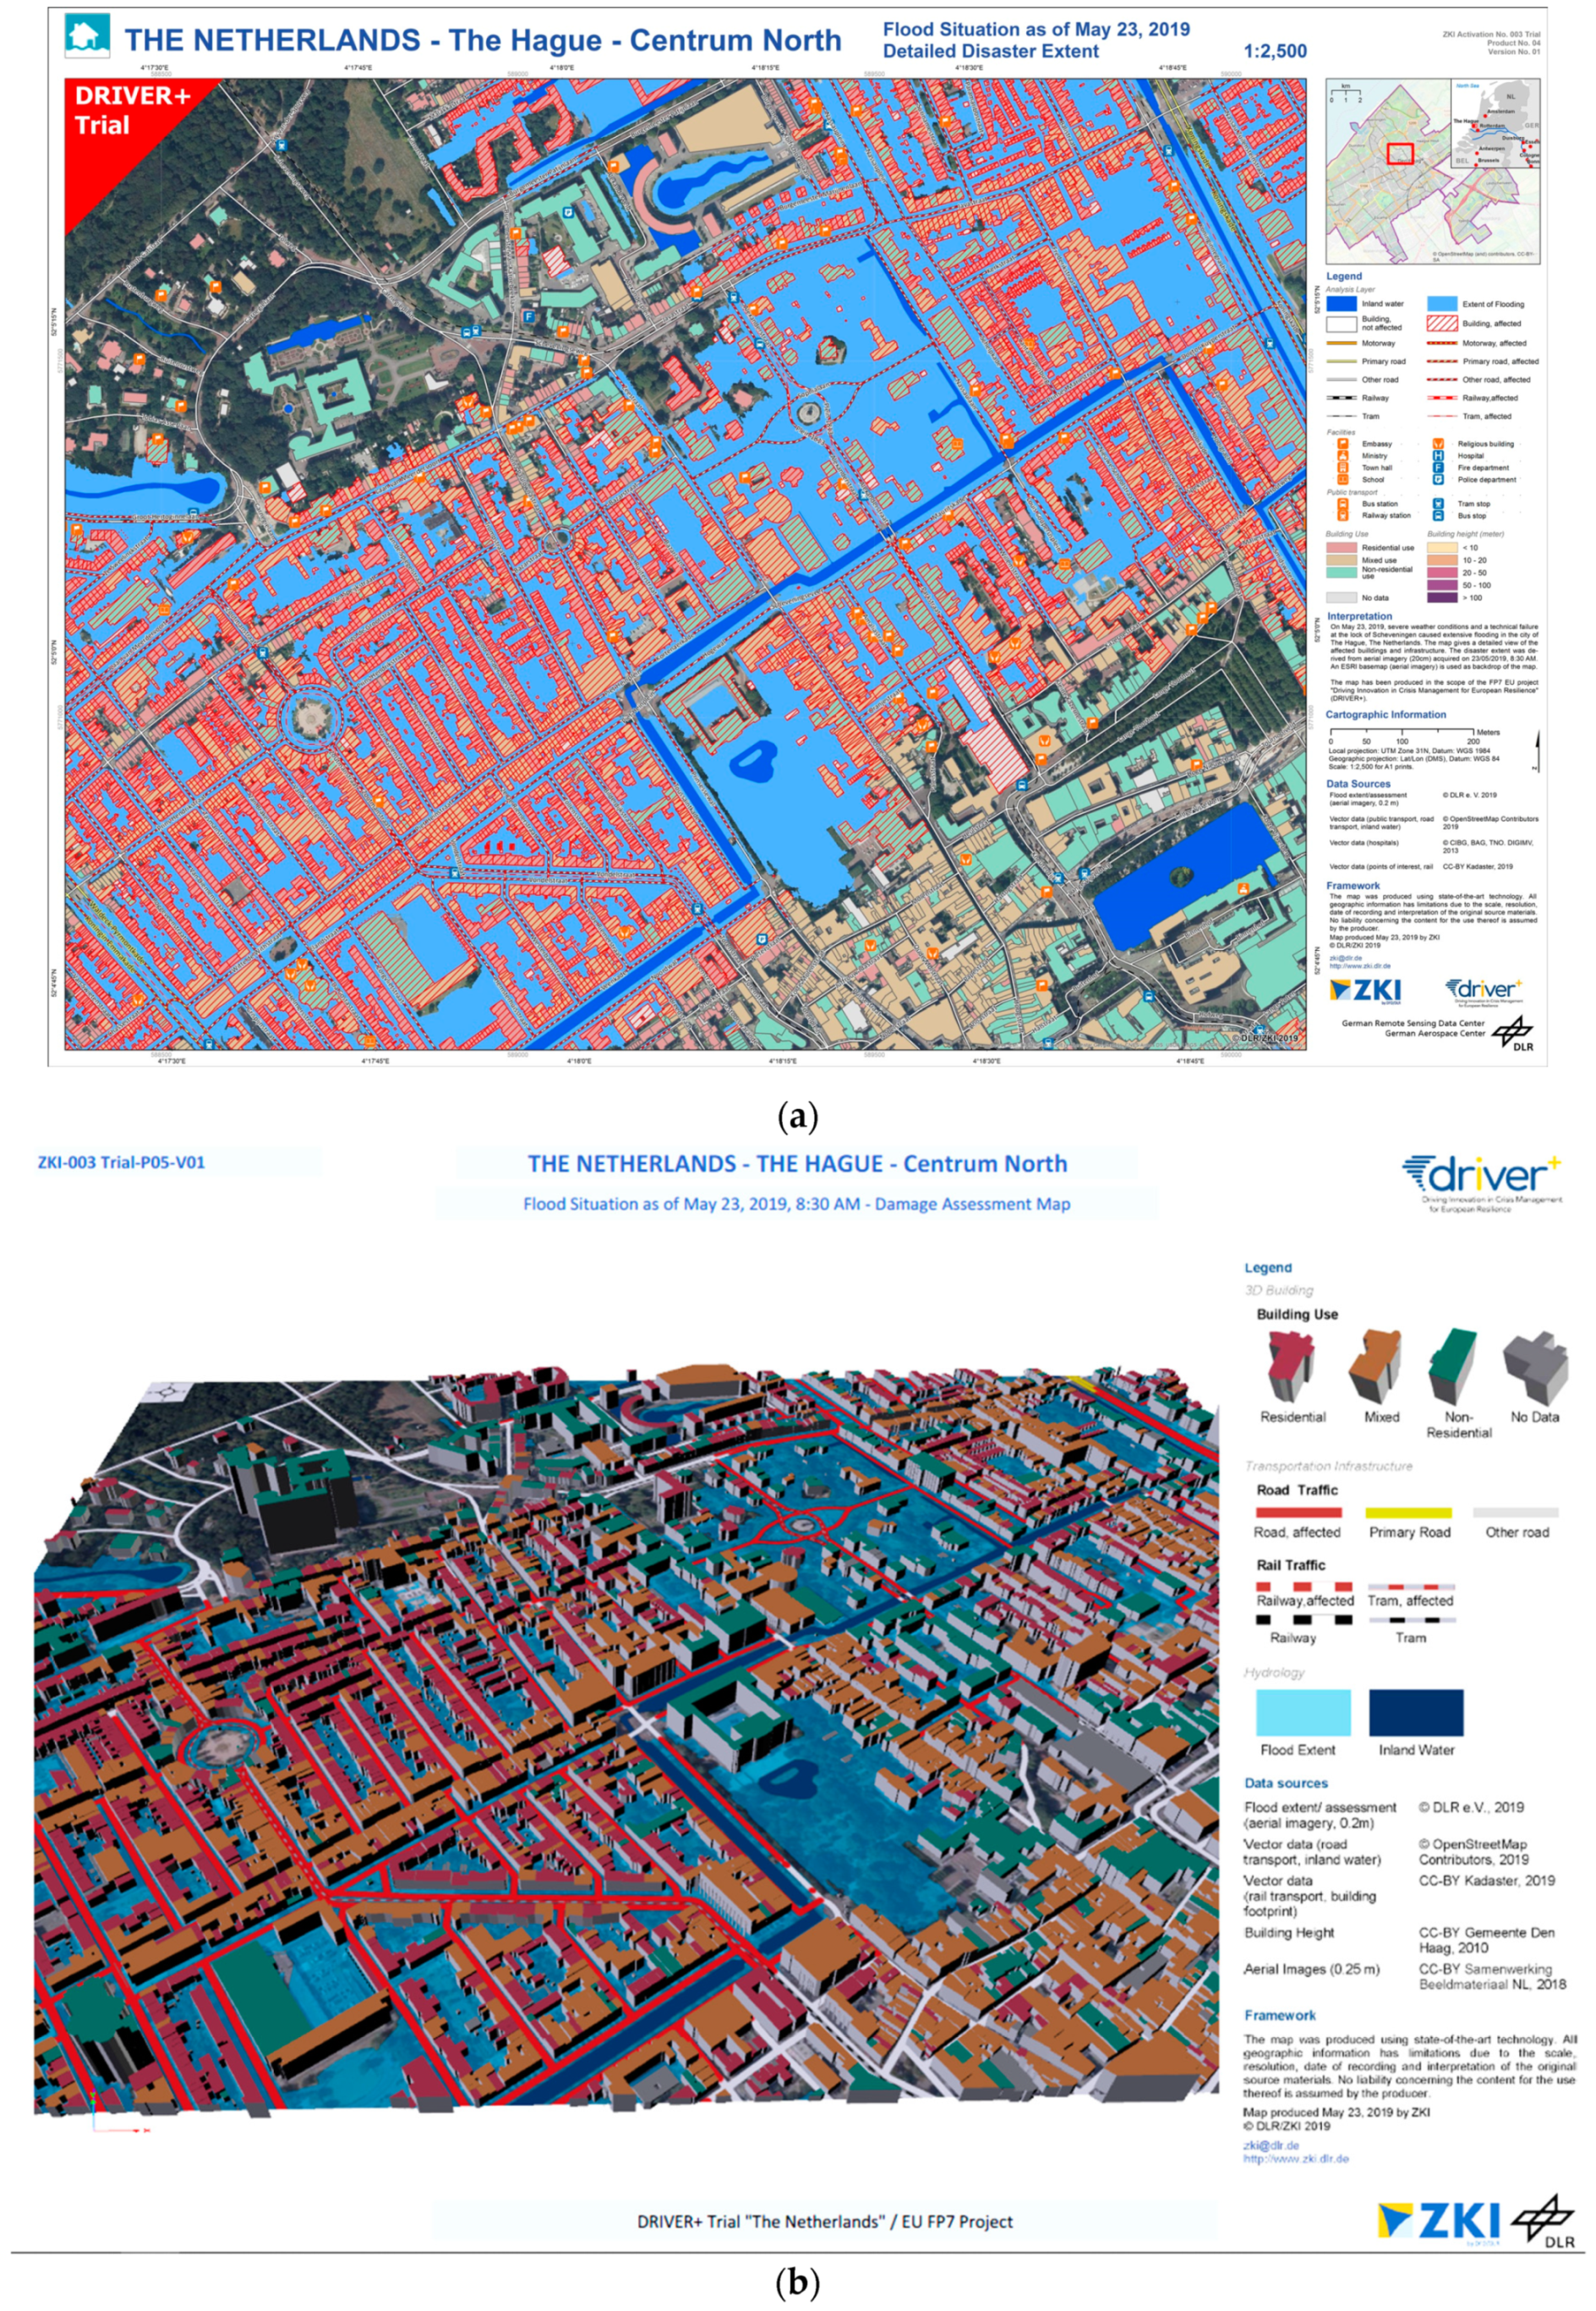
In the urban environment, information density was particularly high. One advantage of the provided PDF maps was that both 2D (
Figure 4.a) and corresponding 3D versions (
Figure 4.b) were interactive. Even though only one map product per area-of-interest was produced for all users, they could be tailored to user-specific requirements by enabling or disabling single information layers. Consequently, complexity was reduced for the individual user whereas distinct information needs of each AC or CT could be met. The PDF maps further enabled for lightweight GIS-functionality, such as making measurements in real-world units, or querying geographical positions or object attributes.
Providing a 3D perspective in addition was potentially helpful especially for external CM practitioners without local knowledge who are requested to assist the local teams. The associated hypothesis is that one may appraise a given situation better through a 3D representation of the area of interest as it creates the possibility to better imagine the geospatial surroundings. Thus, a 3D map may assist in disaster response, possibly already to prepare for deployment in advance.
3. Data Analysis Results and User Feedback
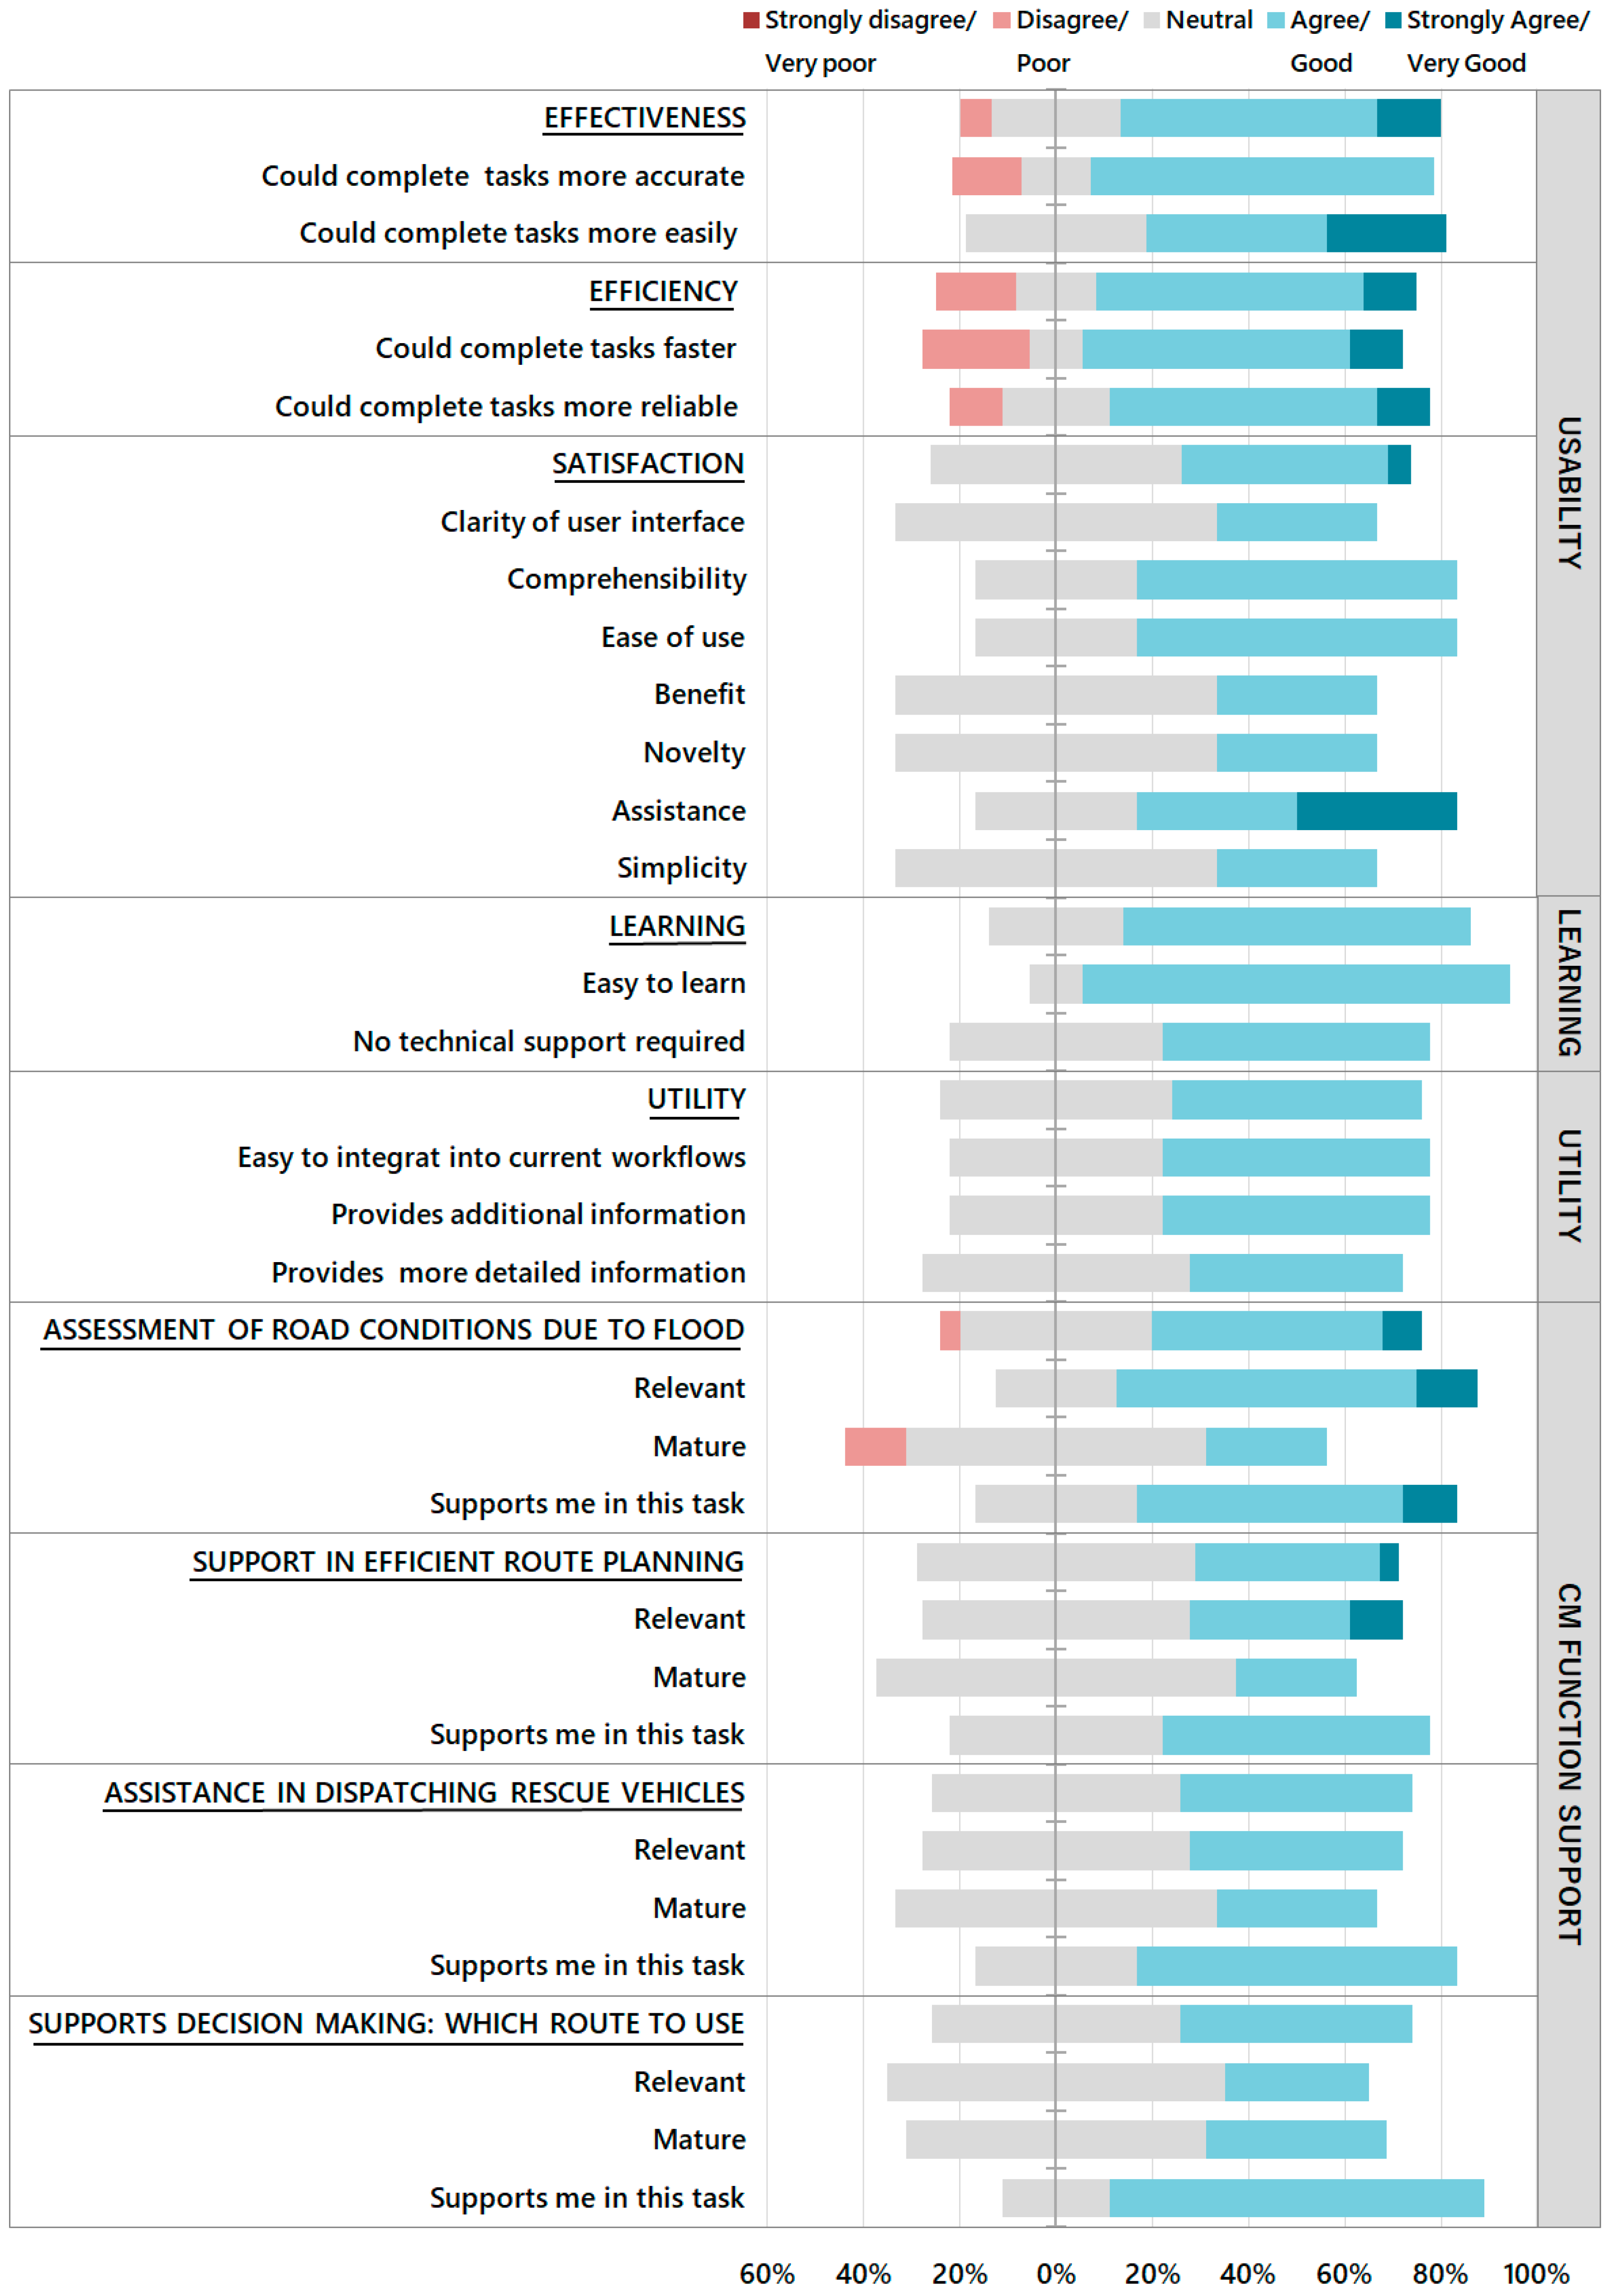
In the following, the mixed results obtained from solution questionnaires, debriefing sessions, and TTI capabilities on ZKI’s and KeepOperational’s performance in the trial are summarized. The results shown in the following sections are structured according to the modules’ primary focus of assessment. Results on the underlying items are shown in
Appendix A (
Figure A1 and
Figure A2) to provide additional insights.
3.1. Review of ZKI Products
The ZKI module aimed at the shortcomings in information exchange among emergency services and external organizations. In the trial, each of the 10 response teams (ACs and CTs) received support from ZKI through airborne remote sensing data (simulated results).
Through capabilities of Web Map Service, the flood extent was displayed simultaneously in both emergency management systems once published. This has been confirmed by the technical records. According to the record of observations, 9 out of 10 response teams actively used the flood extent layer provided by ZKI to gain situation awareness and to fulfil their task in the trial.
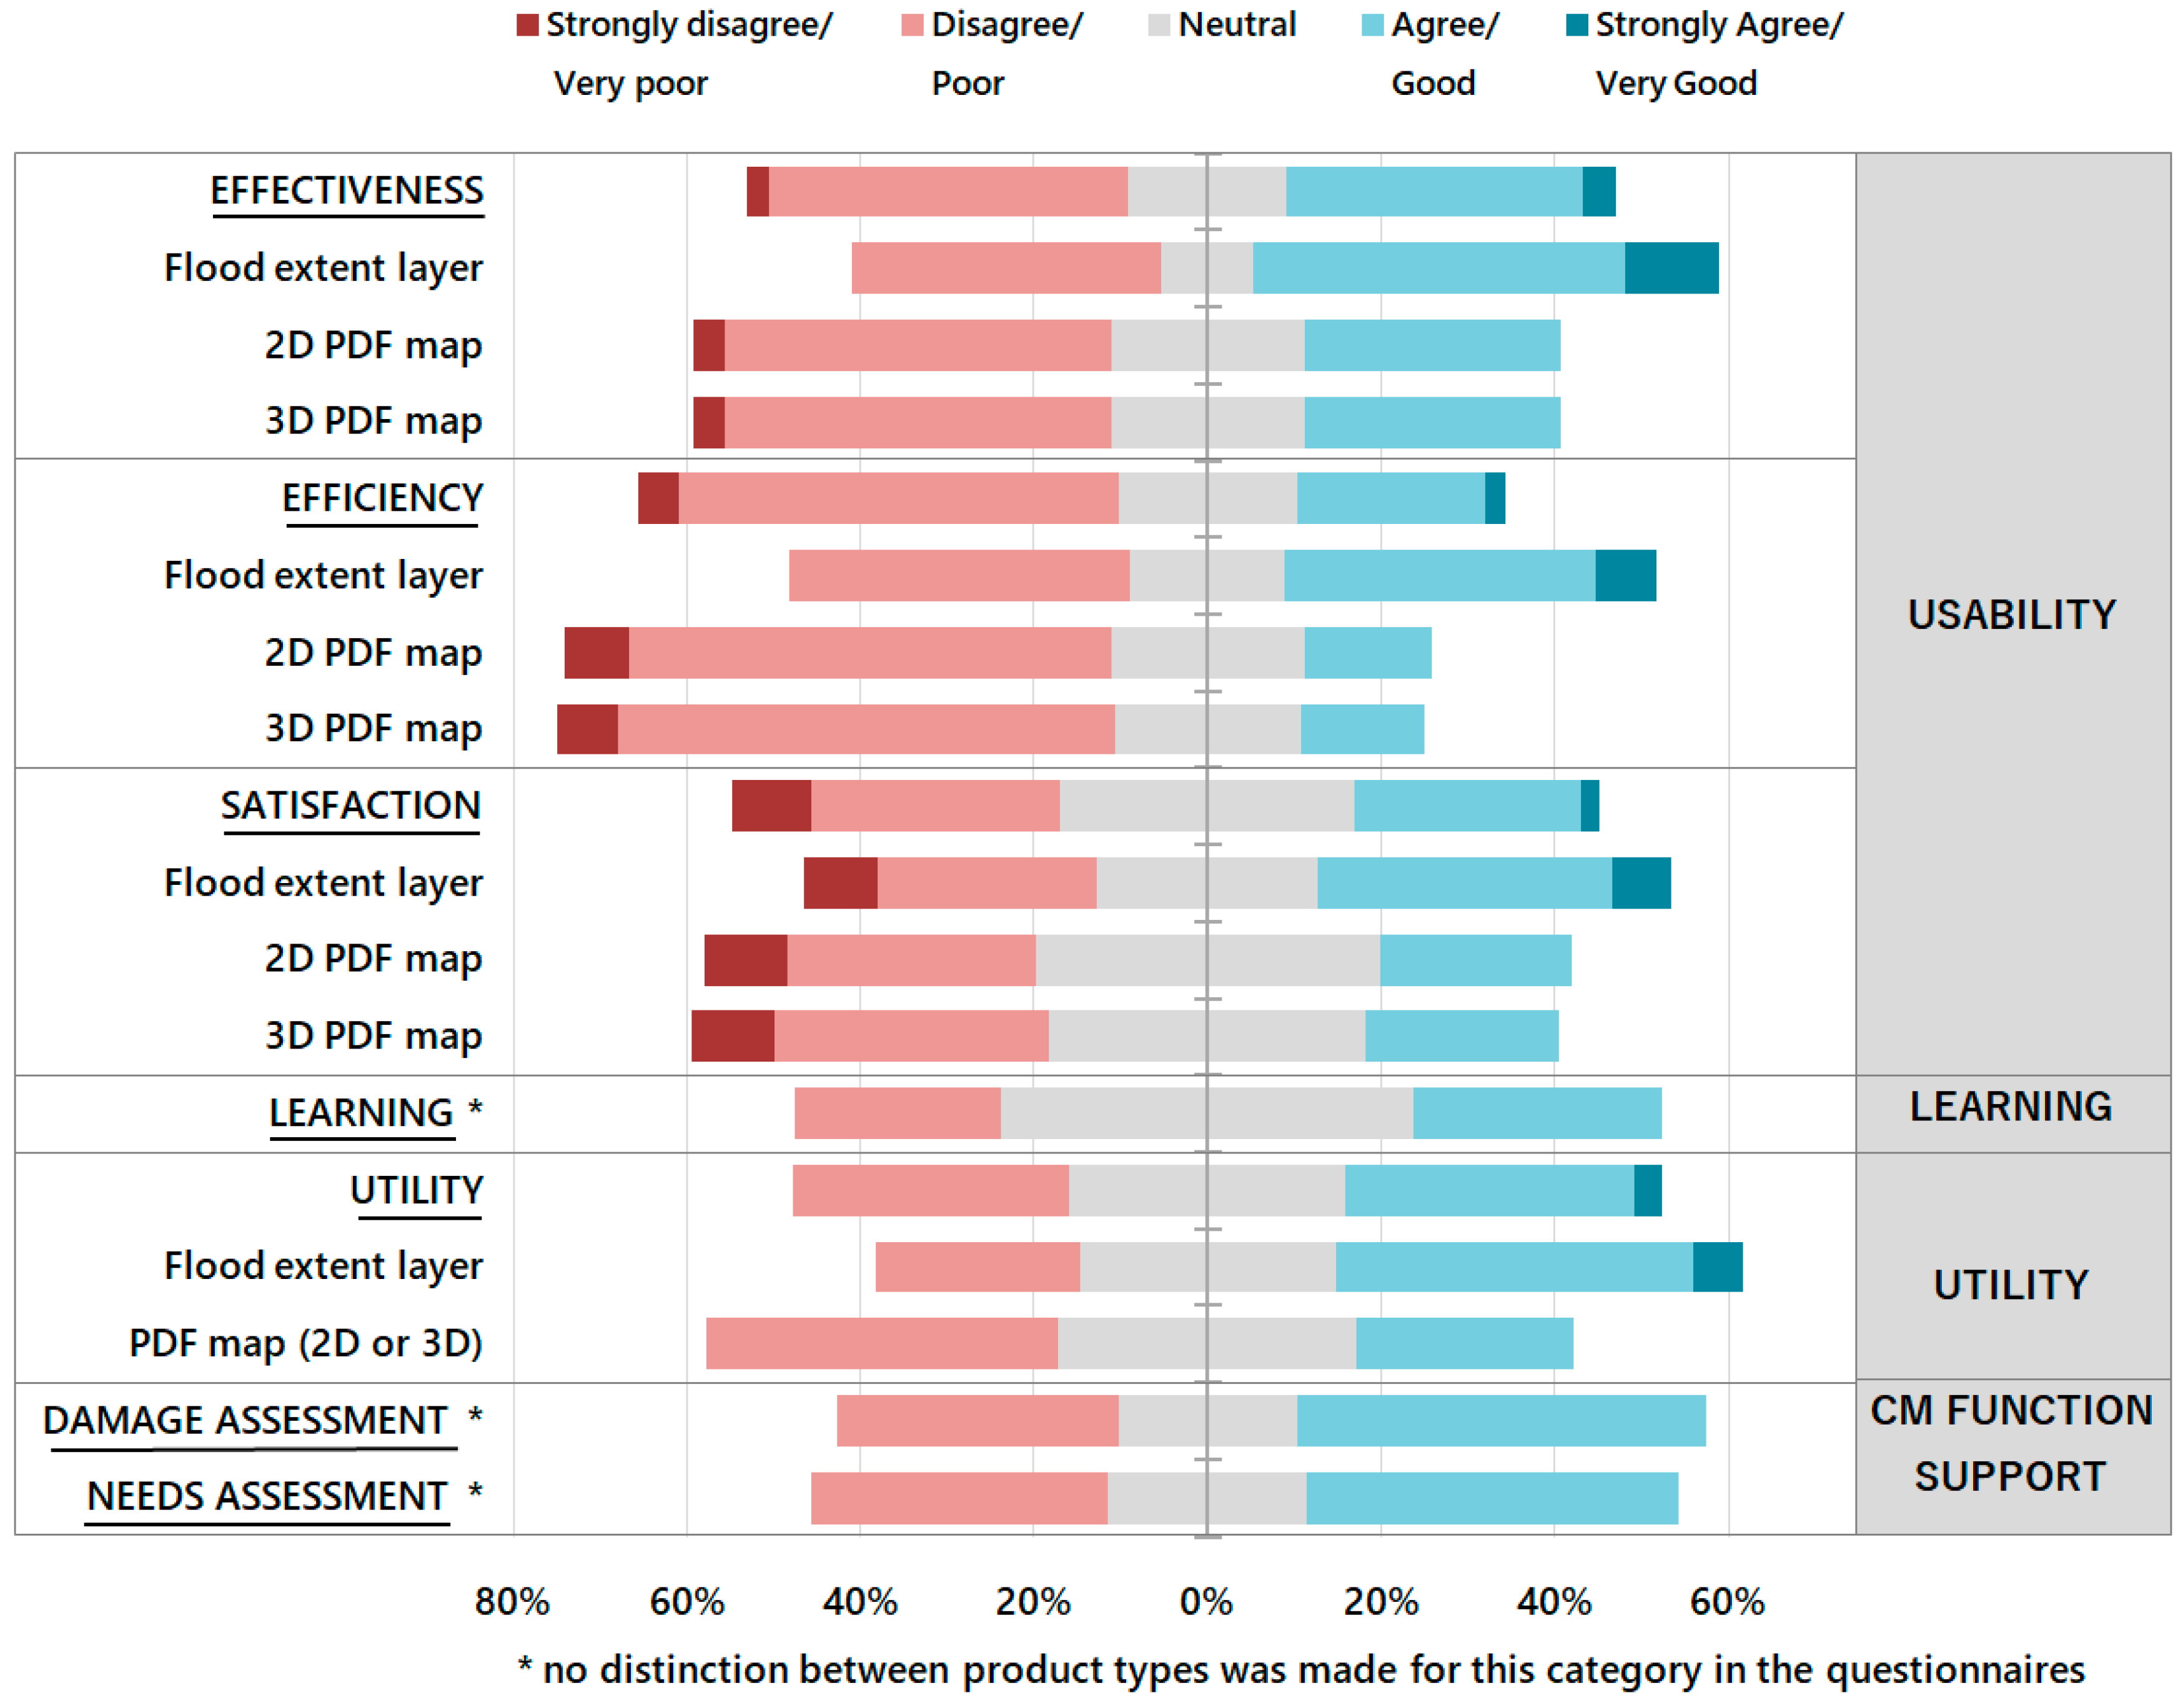
Regarding the flood extent layer, consenting appraisal predominates over the critical ones, overall. The evaluation of usability aspects shows that in relative terms, effectiveness scored best with about 55% of responses referring to “Agree” or “Strongly agree”, whereas efficiency and satisfaction rated only slightly lower. Looking at the aspect of utility, the positive valuations outweigh the unfavorable ones even more clearly. Only about 20% expressed a negative impression on utility aspects (
Figure 5, flood extent layer). Practitioner commentaries highlight the strength of the flood layer in proving more detailed information compared to common practices. The objective nature of images as data source of the flood information was further appreciated by the practitioners. Taking a closer look at the underlying data, it also reveals that the aspect of an easy integration into existing workflows through geospatial web services has also contributed to its positive utility assessment. According to the individual feedback and debriefing discussions, the negative share of the ratings for the flood mask are to be attributed to the explicit desire of the practitioners to not only receive flood extent, but also associated water depth information in order to perform the required tasks satisfactorily. This was brought up for discussion several times.
The interactive 2D and 3D map products could also be distributed successfully to all ACs and CTs. As the value-added damage assessment maps are PDF based, no specialized software, rather only an Adobe PDF Reader, was required on the machines of the end-users to display the interactive maps and show the analysis results. Eight out of 10 response teams actively accessed the maps to test them for their purposes.
2D and 3D maps were both valued very similarly. Overall, critical response dominates the graph drawn from the data on the map products. For the share of efficiency, the valuation was noticeably low with about 60% denying efficiency-related items. Reviewing utility values for the map products, only about one-quarter of the responding participants indicated to receive additional assistance by using the products (
Figure 5, 2D PDF map/3D PDF map). A review of the commentaries on the map products provides an explanation for the restrained results: Some practitioners stated that, compared to the flood extent layer, the extra information provided by the map products was not required to fulfill their specific tasks. Others expected that all information should be fully integrated into the emergency management system, e.g., LCMS, rather than to refer to additional files or interfaces, just as it was done before with the flood information. Especially for the 3D version’s usability deficits were reported, such as faltering movements on slow machines or orientation issues in the 3D space. Further, comments such as “it takes some time to understand all the possibilities” or “needs more training to use” reflect that users were insecure and not sufficiently trained by the pre-trial training condensed to one hour for grasping full potential from the maps.
Also taking the trial setup and available means into account, it is very likely that traditional emergency services were already sufficiently supported by utilizing the flood extent information, which was provided by ZKI earlier in the scenario already. The ACs could combine the flood extent layer with a wide range of authoritative geodata available to them through the map capabilities of LCMS. Records show that this has been realized by the practitioners in the trial. In this case, receiving information purely on the flood extent in shorter response times (in simulation time: Scenario block 3 of the trial) outweighs the additional support through professionally pre-interpreted information in form of maps that came with the drawback of multiple hours delay in provisioning time (in simulation time: Beginning of scenario block 4 of the trial) due to the additional expense of value-adding. This drawback of using the map products compared to the flood extent layer is clearly reflected in the efficiency evaluation (
Figure 5, usability).
In the case of 3D maps, the lack of water depth in the flood extent layer that was also integrated in the map product again negatively affects its application potential in CM as 3D content was limited to terrain and buildings only. The presumed additional support provided by a 3D view for external practitioners could not be approved as the involved practitioner teams in the trial were all locally based.
Overall, the support of module ZKI for the CM functions of needs assessment and damage assessment still scored predominantly in the positive range, with the latter being slightly better assessed (
Figure 5, CM function support). In line with that, it was concluded also by the trial innovation line assessment that overall module ZKI enabled a common understanding of the magnitude of the crisis and improved support capacities by providing a large-scale, continuous and unambiguous picture of the flood’s geographic extent. Therewith, ZKI contributed greatly to situational awareness. Further, the module demonstrated its benefit to speed up interagency information sharing by supporting net-centric data exchange and to strengthen informed decision making, e.g., on an effective deployment of human resources and equipment.
In view of the assessment of ZKI differentiated only by product type, a very ambivalent pattern of opinions emerges. The diverging stacked bar charts shown in
Figure 5 and
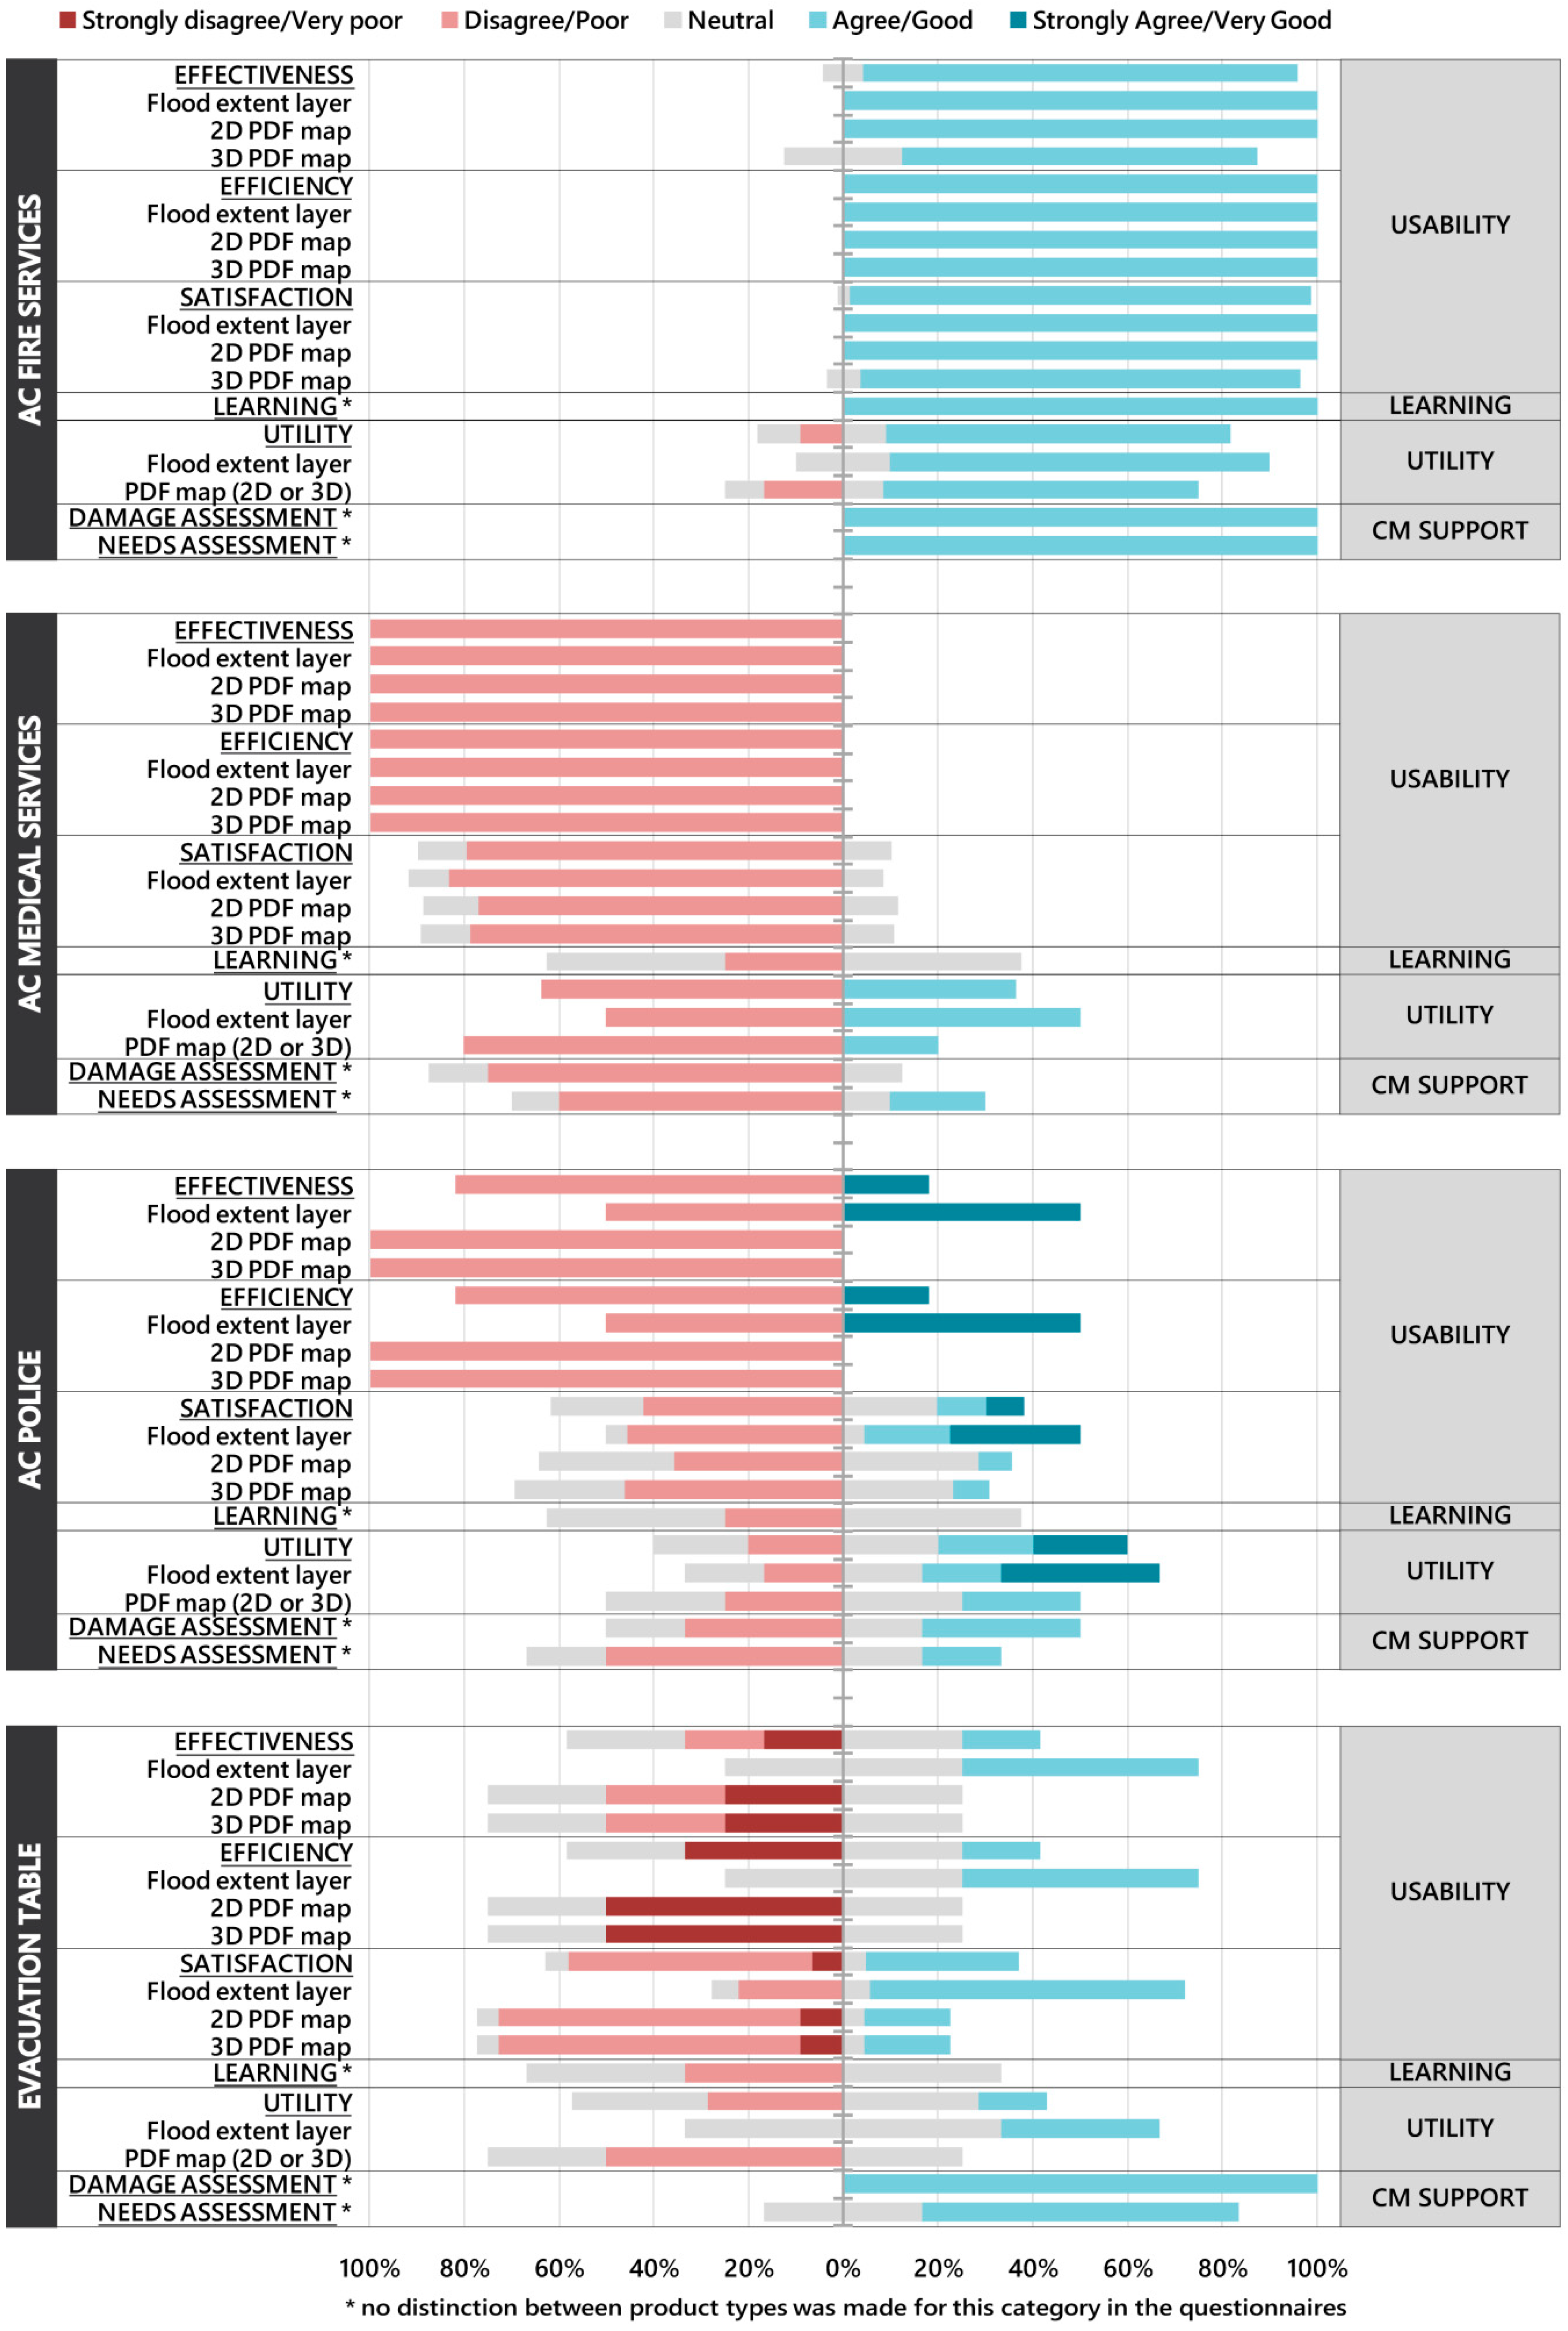
Figure A1 are based on a summary of all ratings regardless of the user’s affiliation. Separating the results by AC/CT affiliation instead, the resulting graphs provide better insights on the individual needs of each user group of the ZKI module. The differentiated approach distinguishing between affiliations draws on a very small sample size and does not allow for generic statements. It reveals, however, that results must be seen in context of the trial scenario and especially specific user roles, tasks, and the ability to quickly acquire new skills from the condensed training and apply them in practice.
The results presented in
Figure 6 range from almost exclusively consenting appraisal (
Figure 6, AC Fire services) to predominantly critical opinions (
Figure 6, AC Medical services). Also, some contrasting opinions within one team can be observed (
Figure 6, AC Police) or the distinct preference for one of the products to support a certain task verified (
Figure 6, Evacuation Table). This indicates that the perceived added value from the ZKI products in CM is very task dependent. By providing multiple sequential products as demonstrated in the trial, one can complement the other to reach a wide variety of the heterogenic target group. It further strengthens the service-oriented approach of ZKI to focus on customized products through personal consultancy.
3.2. Practitioners’ View on KeepOperational
Module KeepOperational targeted the experienced shortcomings in the planning and management of a large-scale evacuation. KeepOperational was used by AC police during the trial. However, being a web-based tool, it could easily be applied by additional response teams and support automatic information sharing.
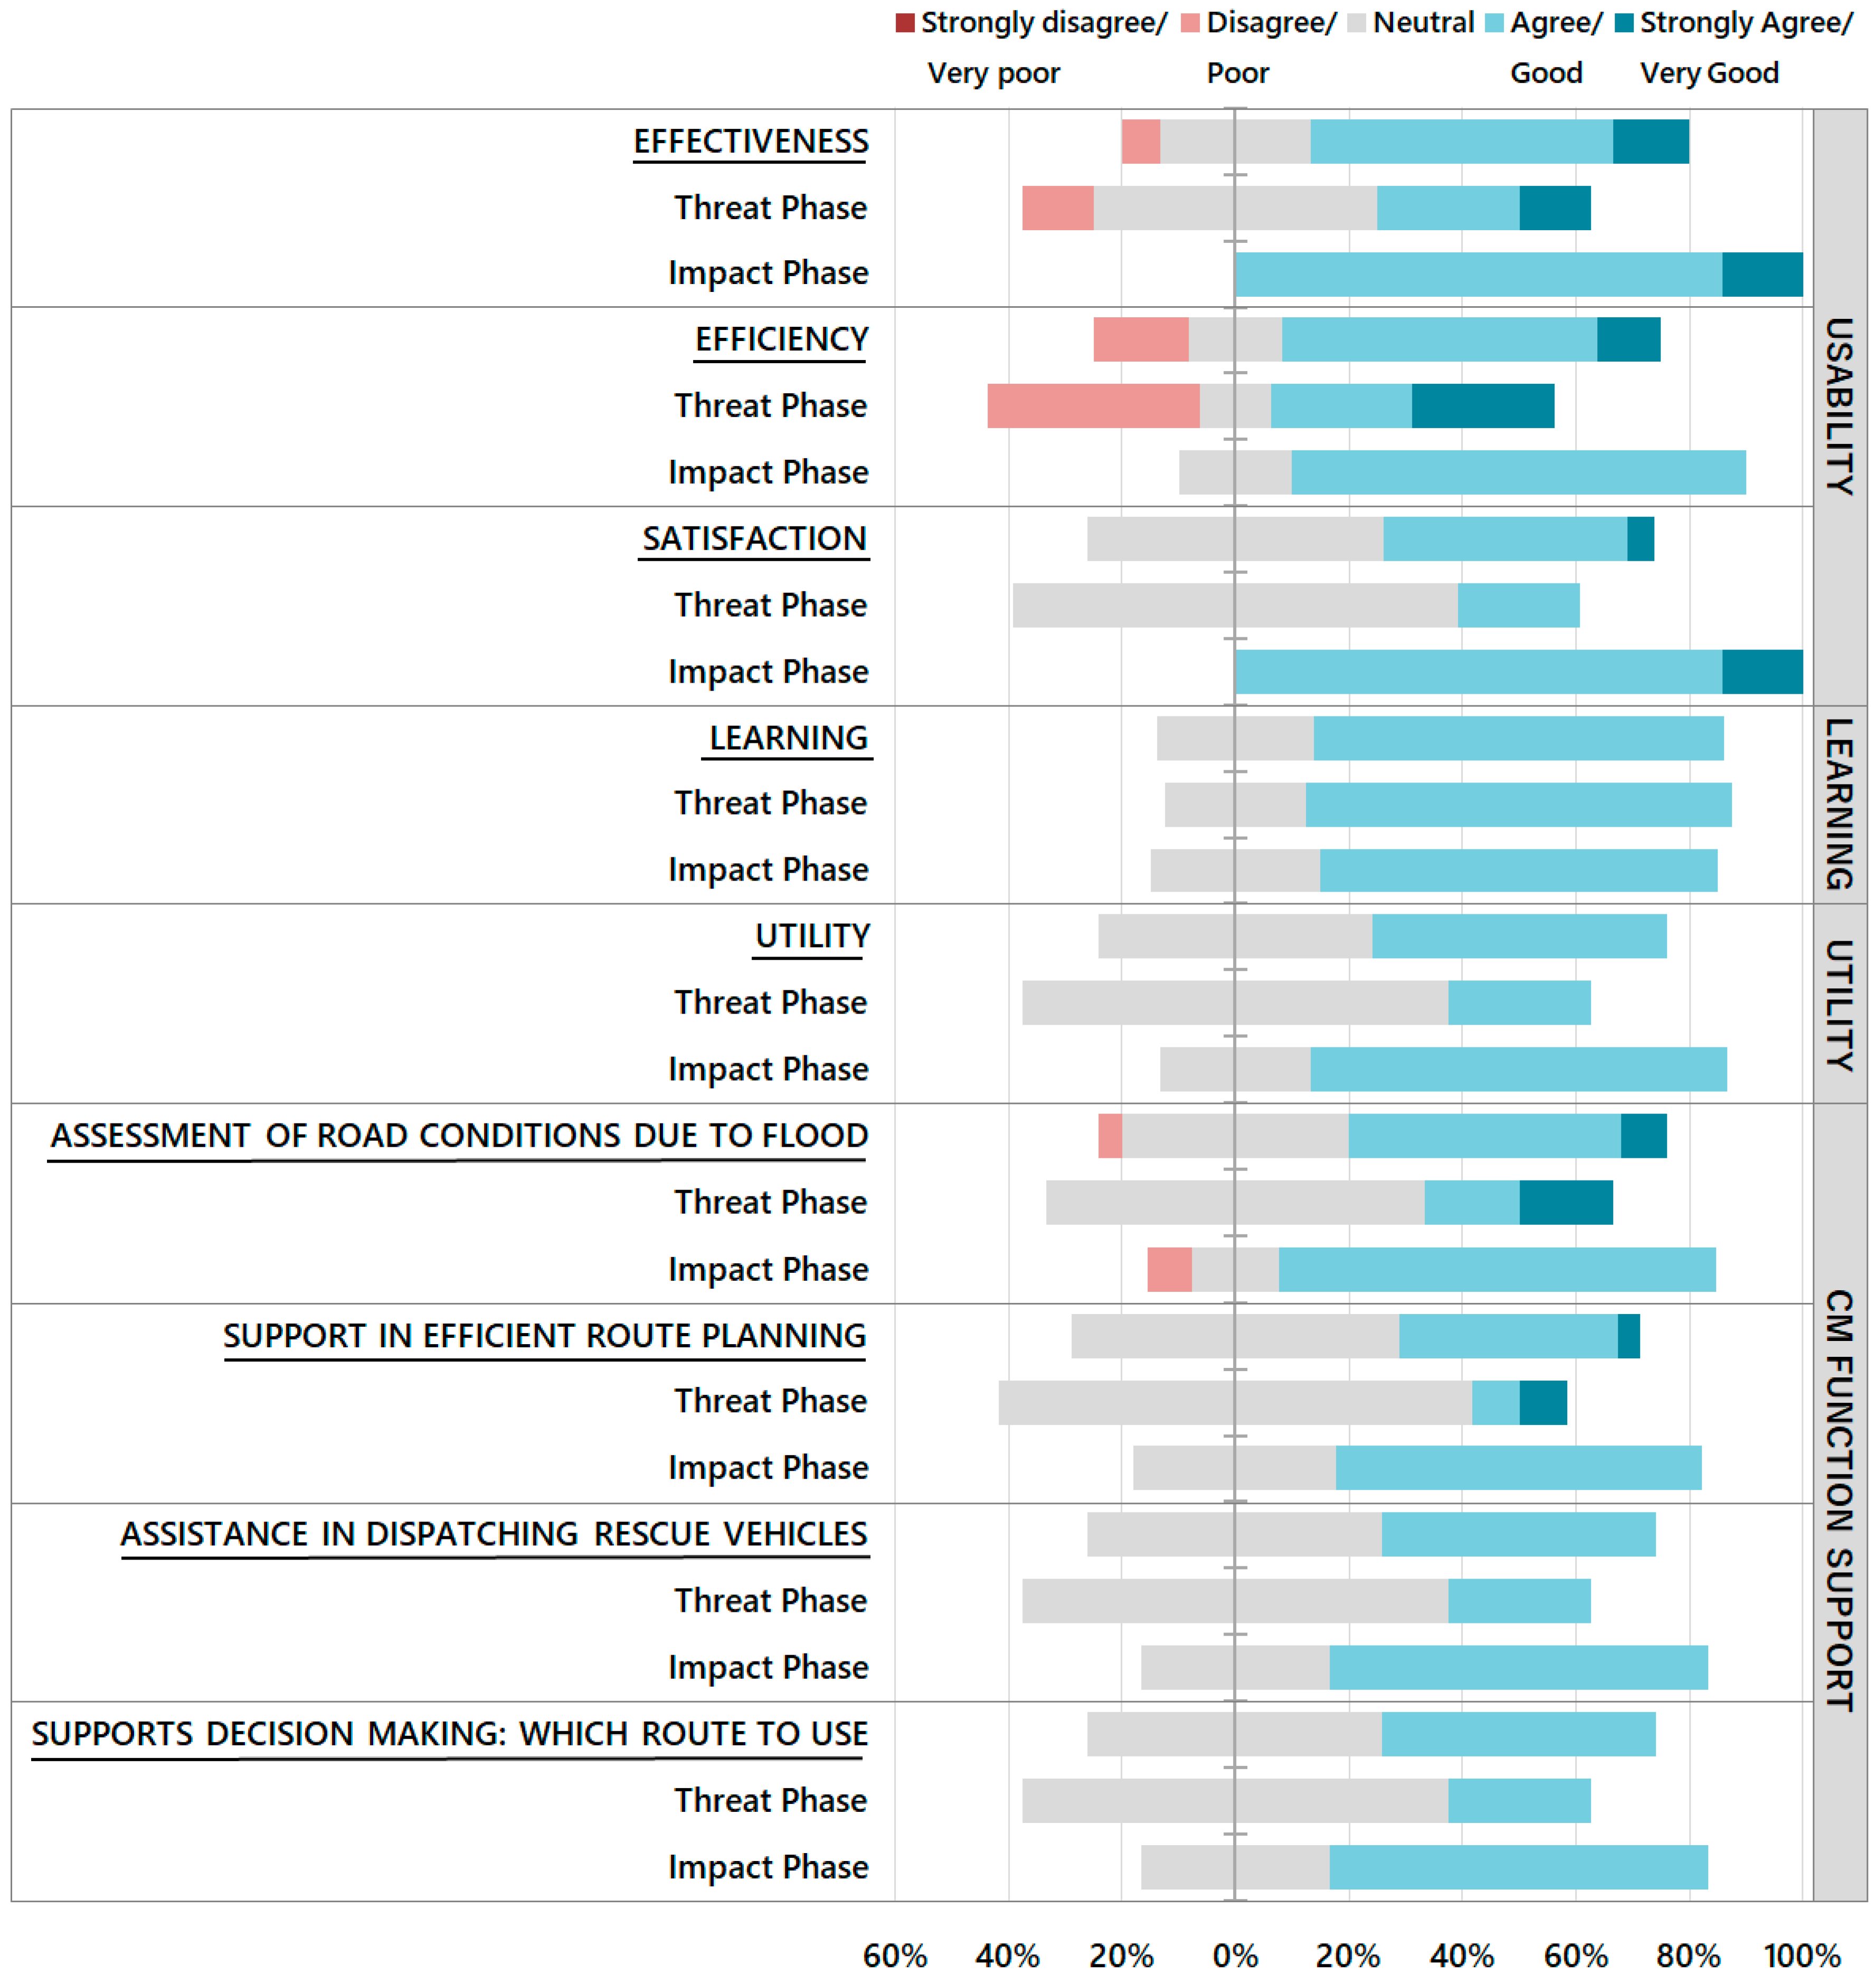
We assumed that the tool would create the most added value during the impact phase. This assumption could be confirmed for all aspects considered except learning (
Figure 7). The usability of KeepOperational was rated predominantly in the positive range. The highly improved effectiveness and efficiency ratings from about 40% consent to 90%–100% are an indicator that operators could gain confidence and experience by using the tool more frequently. Satisfaction also increased comparably from the threat to the impact phase (
Figure 7, usability). The assessment results show that KeepOperational was easy to learn and to understand (
Figure 7, learning). This fits in with the fact that not much training was required in the preparation to the trial to familiarize the practitioners with the basic features.
In the individual feedback, it was stated that the results were a solid addition for the AC police and that KeepOperational could be integrated well into the existing workflows. This is in line with the evaluation based on underlying items (
Figure A2, utility). Overall CM function support was rated in the affirmative spectrum. The low proportion of neutral answers indicates that some users were still not fully convinced by its features (
Figure 7, CM function support). This can be related to requests to improve the tool in the free-text amendments e.g., through visualization of differences in water depths, just as it was stated for the ZKI module. In KeepOperational, this could already be implemented to a certain extent with the existing technical means. However, KeepOperational only utilizes the flood information provided by other sources and can only comply with this request if sufficient data on the water depth and extent can be made available. One point of criticism has been the technical maturity of KeepOperational (
Figure A2, CM Function support). As KeepOperational is a tested prototype, but not a finalized product, this is not unexpected.
By reviewing all data provided by the TTI, it became clear that some newly introduced features of KeepOperational were not used at all. These were mostly smaller additions to the user interface, intended to ease working with KeepOperational. For example, a highlight and comment feature of the map. Some of these features were requested in the preparation phase of the trial and implemented to be assessed due to that feedback. We assume that the training was lacking sufficient focus on these new features.
The trial team concluded in its innovation line assessment that KeepOperational could provide additional, objective insights for traffic management in crisis situations. Instead of relying on expert judgements only, KeepOperational supported creating a robust traffic circulation plan at AC police. The overall positive results show that sharing full-coverage crisis information like ZKI’s flood extents is not only crucial for creating a situational awareness but can also be vital base information for other applications. By making it easier to utilize this information, KeepOperational creates additional value to ZKI’s products within the DLR system by providing a readily accessible traffic application.
4. Discussion and Future Work
To determine innovation inhibitors in sociotechnical setup of a CM organization and to justify required changes and associated expenses, an objective assessment becomes necessary. However, the rather fragmented, interdisciplinary working realities of CM do not allow for standard scientific research methods, which are often based on large sample size to obtain generalizable results. Using a combination of qualitative and quantitative methods in a mixed-research approach, the Trial Guidance Methodology addresses this issue and proposes a more holistic way to gain insights systematically. For our participation in the trial as technology provider, the direct feedback from users and their vision on the presented technology is of greatest value. However, the presented assessment of the DLR systems demonstrates that consequent findings are limited as they strongly depend on affiliations and tasks, unitary groups are rather small, and results only valid in the specific context. Coming from security research, the desire for obtaining more transferable findings is high and cannot be met by participating in a single trial. However, as the outcomes from DRIVER+ are distributed under an open-source license, they can be adopted by interested CM organizations. DRIVER+ also promotes establishing a pan-European network of centers of expertise that agree to apply the DRIVER+ Test-bed in future. By means of the Portfolio of Solutions, past setups and results can be documented and shared and may evolve into a living database of trials and its outcomes. From a research perspective, this provides potential to draw more robust conclusions, e.g., by learning from comparable implementations.
In this trial on large-scale flooding, the evaluation team concluded that the overall module ZKI could provide valuable assistance with its rapid situation assessment of the disaster extent and associated damages. However, the trial revealed deficits especially due to lack of water depths information in the water layer. Taubenböck et al. [
37] illustrate the challenges with deriving water depth from multi-source remote sensing data products that can commonly be obtained in crisis situations. Even with accurate, high-resolution base data, inherent uncertainties in the prerequisite digital terrain model and flood extent layer may cause significant vertical deviations in the water level estimates due to slight geometric inaccuracies in both datasets.
Based on the experience made in the trial, we suggest taking a different approach by fusing disaster information derived from earth observation data with results of hydrological modelling. It should be considered though that crisis mapping strives for an objective representation of an actual situation, whereas hydrologic modelling is based on mathematical assumptions. This simplification incorporates again some degree of uncertainty and compromise in favor of processing capability. The approach, however, seems promising to supplement the inundation area by water depth information of a required level of detail that is difficult to achieve in rapid mapping (classes of < 30cm; ≥ 30–50cm; ≥ 50cm). Consequently, such an interdisciplinary procedure is much needed to adapt support capacities in case of flooding to explicit user requirements and to extend mapping capabilities to the 3D space more effectively. Nonetheless, error estimates must be considered and weighed carefully. Bridging the world of modelling and remote sensing thus offers great potential, yet associated uncertainties need to be communicated appropriately. Using another trial setup to draw conclusion on results of this research topic would be a viable option.
Providing data with associated depth information would also be an additional gain for KeepOperational. The tool was used during the trial by the practitioners, but not as much as aspired. Providing a new technology that is both easy to deploy and tailored to the needs for CM, is challenging. Teaching the use of KeepOperational did not take long but adapting the learned and established process to incorporate a new tool into common practices takes significantly more time. In the preparation phase of the trial, KeepOperational was shown to the police and new features were added based on the input of the practitioners involved but were neglected in the trial. This example highlights that incorporating technical innovation may not only fail because user requests cannot be met, individual commitment to innovation on the part of the users is equally important.
The trial disclosed that the technical maturity of KeepOperational needs to be further improved and continuously expanded. Even though the usability scored well, e.g., search capabilities or user administration for simultaneous use by different groups must be addressed to comply with user requirements. Furthermore, the performance in crisis scenarios of even larger geographic extent is an issue that needs to be tackled in future.
The interdisciplinary and heterogenic working reality of CM practitioners complicates the provision of value-added products tailored to the needs of an entire user community simultaneously. The layered GeoPDF products are only one attempt to maximize the cost–benefit ratio. The trial revealed potential for improvement in usability aspects to better handle the interactive maps. The 3D PDF version especially showed deficits for comprehensive map applications. Whilst the PDF format can be easily exchanged and displayed without having to rely on additional software and continuous internet connectivity, the file-based approach reduces its acceptance by the user. Its rigid spatial extension turned out to be unsuitable when larger areas are to be depicted with high information density (e.g., urban areas). Web-based mapping dashboards that integrate latest crisis layers are already helping to keep an overview in large-scale disasters and support situation assessment in CM particularly due to their real-time capabilities. One recent example that demonstrated the benefits of these dynamic and highly automated mapping platforms is the dashboard created by researchers of Johns Hopkins University on spread of the newly emerged Coronavirus SARS-CoV2 [
38]. However, so far, these dashboards are limited to insights in 2D space. In metropolitan areas where 3D data collection is increasing and regularly updated city models are common standard, the extension of such dashboards into the third dimension would be a logical progression. The trial conducted in The Hague just proved once more that 3D information is in high demand by the CM domain to support decision making comprehensively in large-scale crisis scenarios.
As reflected in the evaluation results, the additional value created by data interpretation and compilation as map products is, however, compromised by its time component. Studies conducted by Hodgson et al. [
39] show that the value of remotely sensed information products decreases exponentially with the time lag to the event. This emphasizes that expanding the near real-time capability of the DLR “Airborne and terrestrial situational awareness” system also to the part of ZKI’s mapping pipeline is crucial. Artificial intelligence techniques show great promise to speed-up the task of analysis and value-adding. “Classical” machine learning methods (e.g., SVM, random forest) [
40] are increasingly being replaced by more powerful convolutional neural networks (CNN). DLR’s research is amongst others developing on CNN for three areas of cognitive image data analysis: Semantic segmentation (e.g., flood areas), object recognition (e.g., buildings), and change detection (e.g., damage to buildings). Another interesting use case building upon deep learning methods is presented by Duarte et al. [
41] on enhancing results through automated multisource/-scale data analysis.
5. Conclusions
This article demonstrated how a trial as a user-driven innovation approach can support technology providers to effectively bridge the gap between research and practice in order to support a sustainable and demand-oriented R&D in the field of crisis management. The introduced imaging and analysis system composed of the modules “KeepOperational” and “ZKI” aimed at providing contextual route planning and extend situational awareness based on disaster information derived through aerial image processing. During a two-day trial conducted in May 2019, both components of DLR’s interdisciplinary “Airborne and Terrestrial Situational Awareness” system were assessed positively by experienced crisis managers to support disaster response tasks in a large-scale flooding scenario. Specifically, the added value of the automated processing chain from the rapid acquisition of situational awareness information to a traffic management application has successfully been proven. Nonetheless, the trial has revealed a special need to invest further research efforts into the rapid provision of detailed 3D geo-information to effectively support disaster management and improve support capacities of both modules.
One motivation for the simultaneous provision of 2D and 3D map information was to gain additional insights into differences in use cases and support capabilities subject to user affiliations, tasks, or prior local knowledge with respect to the application’s dimension in emergency response. Even though task-dependent differences could be demonstrated on a general level, none of these topics could be investigated further from the data collected in the trial. Practitioners felt overwhelmed and lacked sufficient experience with the map products to selectively choose the most appropriate version depending on their tasks and to grasp full potential from the products provided. This creates additional research opportunities for the geospatial community with the aim to apply the strength of either 2D or 3D more purposefully and task oriented in the context of CM.
Multiple innovative technologies were selected in the trial “The Netherlands” to reach the overarching goal of closing three capability gaps at once. As it is very unlikely that a single solution is found that matches perfectly with an experienced shortcoming in the individual CM processes, trial preparation requires a joint exchange between practitioners, technology providers, and trial staff to adapt the setup, solution(s), or even CM processes accordingly in order to succeed. Allowing for interaction between multiple technologies to close the trial gaps not only demonstrated the power of the net-centric approach to exploit the full innovative potential of the technologies used; it further promoted the discovery of new, interdisciplinary approaches. From a technology provider’s perspective, this improved dialog at all levels, but especially between potential users and technical research in the context of an emerging need, has potential to make a major contribution that innovative ideas will find their way into practice more effectively.
However, this rather complex setup impedes evaluation and the ability to draw informed conclusions on a single technology, since there is no distinct separation. From a trial organizer’s perspective, focusing on multiple gaps in a broad-based scenario that included various stakeholders and interests simultaneously has been a very ambitious goal. According to our experience, we recommend narrowing the trial objective. Emphasizing a single gap, single solution, or a system-of-system setup as an entity in the trial eases evaluation and may help to obtain more explicit results. Nonetheless, participating in a trial event proved to be rewarding overall for CM practitioners as well as technology providers. The close collaboration, exchange of knowledge, and ideas for further development has been an inspiring experience. The results of DRIVER+ show a promising way forward on how to effectively approach innovation in CM.

 ,
, 


