A Method for Separating Multisource Partial Discharges in a Substation Based on Selected Bispectra of UHF Signals

1
Engineering Training Center, Shanghai University of Engineering Science, Shanghai 201620, China
2
School of Electronic Information and Electrical Engineering, Shanghai Jiao Tong University, Shanghai 200240, China
*
Author to whom correspondence should be addressed.
Appl. Sci. 2020, 10(11), 3751; https://doi.org/10.3390/app10113751
Submission received: 14 April 2020
/
Revised: 27 May 2020
/
Accepted: 27 May 2020
/
Published: 28 May 2020
(This article belongs to the Section Electrical, Electronics and Communications Engineering)
Abstract
:A method for separating multisource partial discharges (PDs) in a substation is proposed based on selected bispectra of ultrahigh frequency (UHF) electromagnetic waves. Bispectra are sensitive to Gaussian noises and processes of symmetrical distribution. The phase information contained in bispectra can be useful and important for further signal processing. Bifrequencies where Fisher-like class separability measures between signals’ bispectra achieve their maximums are selected as characteristic parameters of the signals. Then, the selected bispectra are utilized for training the radial basis neural network to separate PD UHF signals in a substation. The method is used to analyze simulated UHF signals mixed with Gaussian white noise and frequency-fixed interference, and to separate PD UHF signals that are collected in a 500 kV substation. In order to prove the validity of the proposed separation method, the localization results are compared with the results calculated by time delay sequence, and the proposed separating algorithm is verified in the interference circumstances of a substation. However, the exact location of PD sources cannot be calculated according to the time delay sequence when the PD sources in a substation are close to each other or there are fewer than four antennas for receiving signals.
1. Introduction
The monitoring for partial discharges (PDs) has become the main method for insulation testing and diagnosis. Ultrahigh frequency (UHF) electromagnetic waves are widely used in PD detection due to their superiority of strong anti-interference, high sensitivity, and stable transmission [1,2,3,4,5,6,7,8].
In order to extract signal characters and separate different PD sources, the suppression of field electromagnetic noise interference is important in PD detection and analysis. Recently, methods have been proposed for separating multiple PD sources, including time-resolved partial discharge (TRPD) [9,10], phase-resolved partial discharge (PRPD) [11], and time-frequency analysis with neural network and fractal technologies [12,13]. However, when multiple PD sources exist in the power station, their PRPD patterns blend together. Therefore, it is difficult to extract the characteristics of a single source from PRPD patterns. There are always many types of electromagnetic noise mixed in the UHF signals that are radiated from PDs and collected in a substation, such as white noise, wireless communication, and radio signals. The noise sources mentioned above cause difficulty in extracting waveform characteristics of PD pulses; therefore, the TRPD-based method is poor for separating multisource PDs. It is also hard to reach the goal by time-frequency analysis methods due to the complication of getting high-dimension time-frequency parameters. Furthermore, the time-frequency methods can only efficiently suppress narrowband or periodical noise. As far as white noise is concerned, the time-frequency methods do not work.
As properties of high order cumulants described in [14,15,16,17], high order cumulants whose orders are no less than three of a Gaussian process are zero. The odd-order cumulants of the symmetric distribution procedure are also zero. Therefore, the high order cumulants of the observation process are equal to the non-Gaussian signals, which is embedded in the colored-Gaussian noise. If the spectra of PD UHF signals in substations are reconstructed by using odd-order cumulants of the signals, the reconstructed spectra will not be mixed with colored-Gaussian noise, white noise, and symmetrical distribution noise. The high order cumulant algorithms can work without prior knowledge for correlation between signals and noise, and are better than other statistical methods using high order moment. Therefore, the high order cumulants are usually utilized as the tool for analyzing non-Gaussian signals.
In [18], the frequency spectrum of a signal is reconstructed based on an autoregressive and moving average (ARMA) model using high order cumulants; then, characteristic frequencies are selected by Fisher-like class separability measures. Finally, simulations and on-site experiments are used to show the capability of the algorithm. However, the phase information of signals is lost due to the spectrum reconstruction.
High order cumulants and multispectra have the properties of time-shift invariance, scale variability, and phase stability [19]. Furthermore, because of the special properties of high order cumulants, it can be deduced that the application of selected bispectra can effectively suppress Gaussian noise, periodic narrow-band signals, and frequency-fixed signals blended in the PD UHF signals. The phase information maintained in bispectra can be useful and important for further signal processing.
In the proposed algorithm, bifrequencies of signals where the bispectra have the maximum Fisher-like class separability measures are selected as characteristic parameters, which are used for training a radial basis neural network to separate the received signals. The simulated UHF signals mixed with fixed-frequency signals and different SNRs are analyzed by the proposed method. The result shows that the method is very effective at separating signals. Furthermore, the separation rate will be insensitive with variation in the number of characteristic parameters when more than 10 characteristic parameters are selected. Therefore, it is easy to determine the number of characteristics. Finally, the proposed method is used to handle the UHF signals radiated by different PD sources in a 500 kV substation. The field test results verified the effectiveness and prospect of the proposed method in separating PD signals.
2. Principle of Separating Multiple Signal Sources Based on Selected Bispectra
Supposing that a = [a1, ⋯, aL]T is a random vector, rth-order cross-cumulant means accumulant between different processes, and the rth-order cross-cumulants of a are defined as [16,18,19]:
where Φ(ω1, ω2, ⋯, ωL) is the first characteristic function of the random vector a, and ωi (i = 1, 2, ⋯, L) is the ith angular frequency.
where j is the imaginary unit, i.e., j2 = −1, and E [∙] represents mathematical expectation. rth-order auto-cumulant means the cumulant of the process itself, and the rth-order autocumulants of a random process {b[n]} are defined as:
where τi(i = 1, 2, ⋯, r − 1) denotes the time delay, and [n] is the sampling point. When the order of the cumulants is no less than three, the cumulants are defined as high-order cumulants with the multidimension Fourier transform.
Denoting the real signal observed by an antenna as {x[n]}, the signal sampling rate is fs and the mean value of {x[n]} is zero. By the definition of high-order cumulants, the third-order cumulants of {x(n)} can be calculated as:
Consequently, the bispectrum of {x[n]} is defined as 2D Fourier transformation of the third-order cumulants, i.e.,
The signal data is split into K sections with M observed samples in each section, denoted as x(i)(1), x(i)(2), ⋯, x(i)(M). Let i = 1, 2, ⋯, K, the data between the two adjacent sections can coincide. Then, calculate the discretized Fourier transformation coefficient for each section of signal data:
where λ = 0, 1, …, M/2; then, bispectra for each section of signals can be estimated as:
where , and L and N0 satisfy M = (2L + 1) N0. The bispectra estimation of the whole signal can be calculated as the mean bispectra of all sections:
Denote the estimated bispectra as ,
where ξ = (ω1, ω2) is a bifrequency, . is the set of sample bispectra, where the superscript l means the lth type of signals; k is the kth group of the lth type of observed signals, and Nl is the number of observed signals of the lth type.
Supposing that the prior probabilities of the various signals are equal, a Fisher-like class separability measure can be defined as [19]:
where and are the mean and variance of a sample bispectrum of the lth type of signals at the bifrequency ξ. is the mean sample bispectrum of all types of signals at bifrequency ξ. It is obtained that the ith and the jth type of signals has stronger separability at the bifrequency where is greater.
Bifrequencies with Q greatest Fisher-like class separability measures are selected as characteristic parameters of signals, and bispectra at the selected bifrequencies are called selected bispectra. Then, the selected parameters are used to train the radial basis neural network to separate the received signals. The steps of the offline training algorithm can be found in [17,20,21].
3. Simulations and Validations
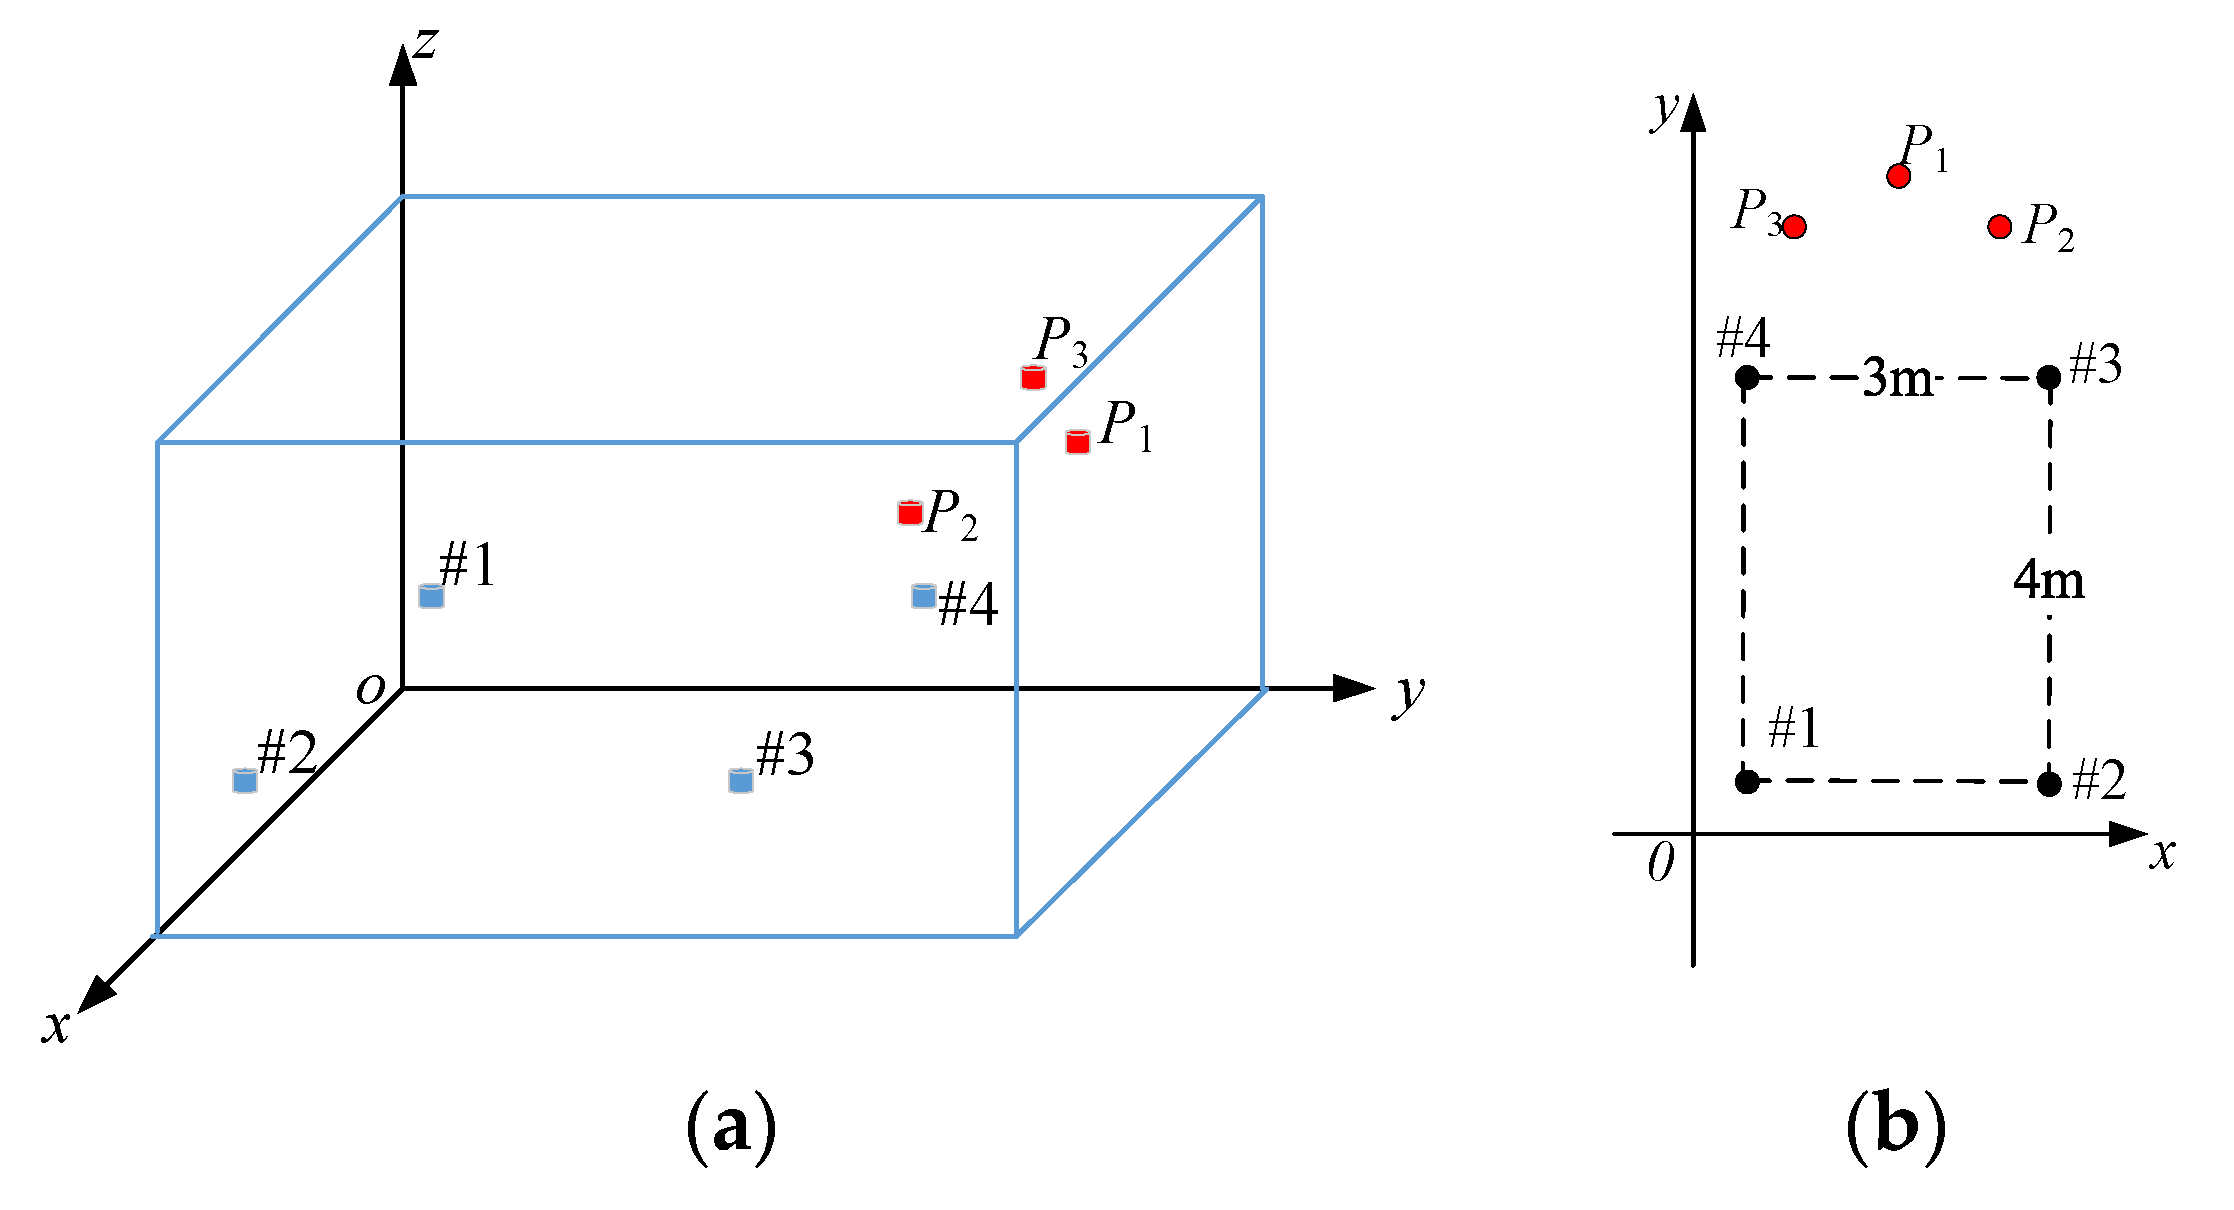
In order to verify the capability of separating UHF signals radiated by different PD sources, UHF signals simulated by Ansoft HFSS 13.0 are processed using the algorithm with a 3D coordinate system of the substation space. The simulated antennas used for accepting the signals are located at #1(0.5, 0.5, 1), #2(3.5, 0.5, 1), #3(3.5, 4.5, 1), and #4(0, 4.5, 1) (in meters), while the locations of the three PD sources are P1(2, 6.5, 3), P2(3, 6, 3), and P3(1, 6, 3). The simulated PD signals are stimulated by Gaussian current impulses with amplitudes of 1 A, 1.5 A, and 2 A, and time widths of 4 ns, 6 ns, and 2 ns, respectively. The space for the simulation is shown in Figure 1a. Locations of the simulated antennas and PD sources are shown in Figure 1b.
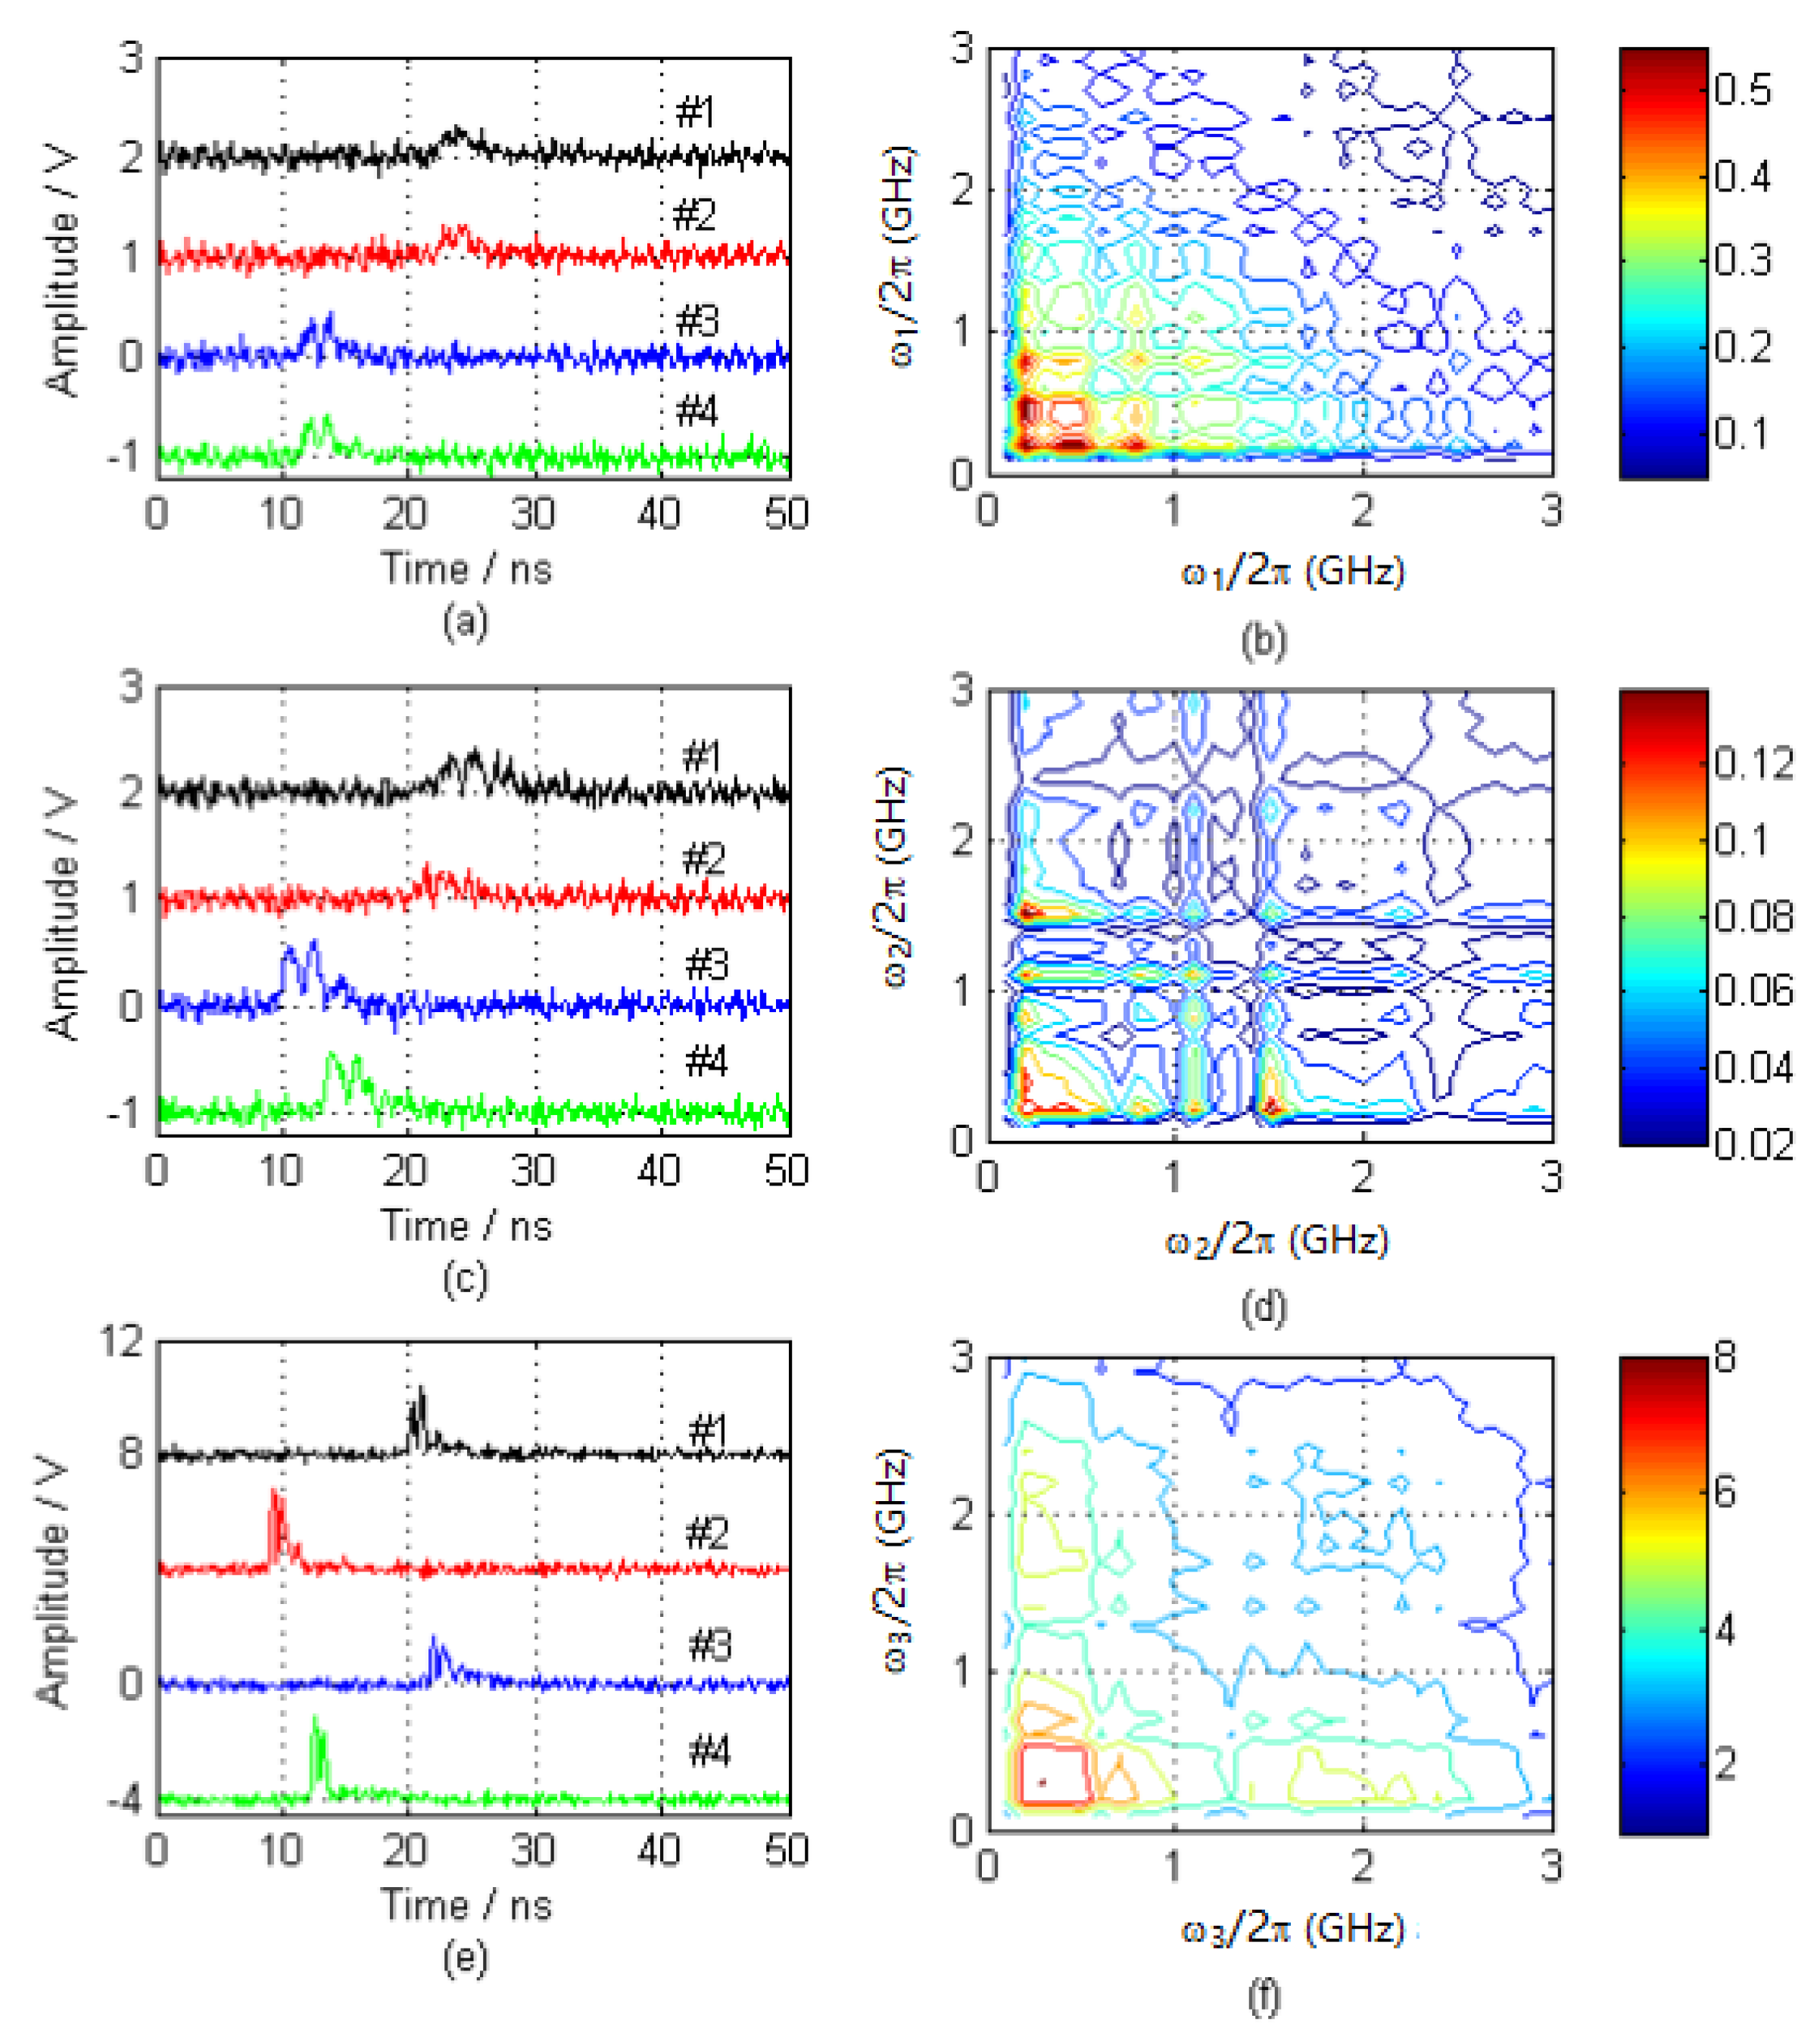
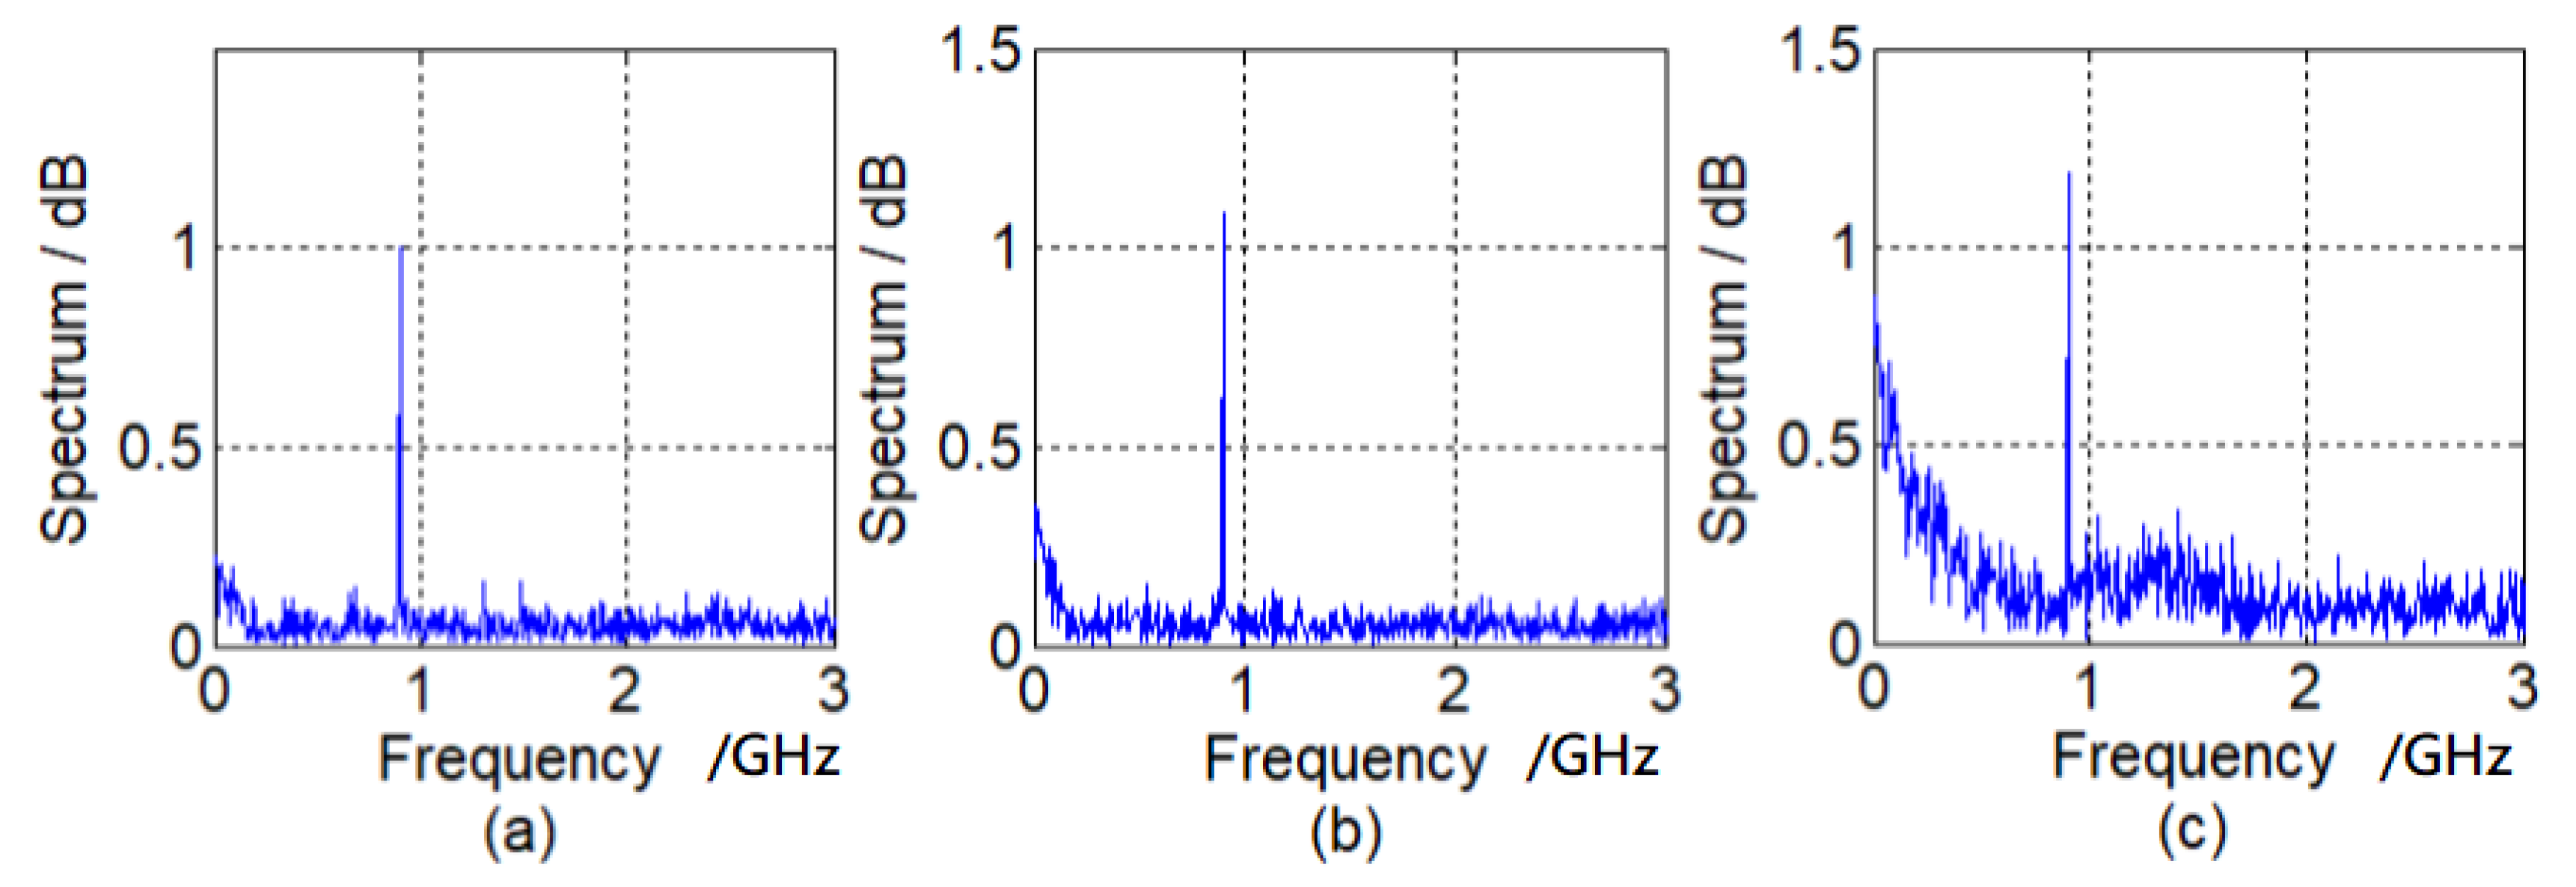
In order to verify the effectiveness of the above method in suppressing Gaussian white noises and frequency-fixed interference, white noises in different SNRs were added into the UHF signals simulated by the software, and interference with amplitude of 0.05 V and frequency of 900 MHz was also mixed into the signals. The signals radiated by PD sources mixed with white noises (when SNR = 25 dB) and frequency-fixed interference are demonstrated in Figure 2a,c,e, and their bispectra in the range of 0–3 GHz are demonstrated in Figure 2b,d,f, respectively. The frequency spectra of the signals are demonstrated in Figure 3a–c, respectively.
Twenty groups of each type of simulated UHF signals, which are mixed with noises are taken as trained samples, and the Fisher-like class separability measures were calculated using Equation (10). The separation measure between simulated signals radiated by sources P1 and P2, and that between P1 and P3 are demonstrated in Figure 4a,b, respectively.
Different numbers of bifrequencies at which the Fisher-like class separability measures between the bispectra of simulated signals achieve their locally maximums can be selected as characteristic bifrequencies. Then, RBFNNs used for separating different PD sources are trained.
The UHF signals received above are regarded as the observed signals for further analysis. Bispectra of the simulated signals with noise are calculated. Then, the selected bispectra are substituted to the trained RBFNNs.
Each PD source in the simulated substation can be obtained by the localization equations established by the estimated time delays [1,4]. The time delays between two signals can be calculated with high order cumulants [7]. This algorithm for estimating time delays has been proved to be insensitive for unknown correlated Gaussian noise [15,16]. The localization results are applied to compare with the separation result, which are obtained by the proposed method.
With different SNRs, 50 signals radiated by each simulated PD source can be obtained. Table 1 shows the average results of P1, P2, and P3. The separation rate for identifying the signal type when different characteristic bifrequencies are selected are shown in Table 2. The percent of the signals that are correctly separated is defined as the separation rate.
It can be inferred from Table 2 that Gaussian noises as well as the periodic narrow-band interference can be significantly restrained by the application of selected bispectra. Thus, the multiple simulated PD sources can be effectively separated by the proposed method. The separation rate of signals will be larger than 80% when SNR > 10 dB and more than 10 characteristic parameters are selected. Furthermore, the separation rate of the algorithm based on selected bispectra will be insensitive with varying number of characteristic parameters when more than 10 characteristic parameters are selected. Therefore, it is easy to determine how many characteristic parameters to choose.
Traditional methods for separating multiple PD sources are mainly based on correlation of observed time-domain signals and their power spectra. Therefore, noises of unknown correlation relationships cannot be efficiently suppressed from signals, and it is difficult to separate the signals radiated by different sources.
The multiple simulated PD sources were compared with the separation results obtained by the proposed method. However, when PD sources in a substation are close to each other, they cannot be identified by the localization results. The exact location of PD sources cannot be obtained by the algorithms based on time delays if less than four antennas are applied for acquiring signals. In these cases, the problem of separating the UHF signals radiating from different PD sources can be successfully resolved by the proposed algorithm.
4. Field Test in a Substation
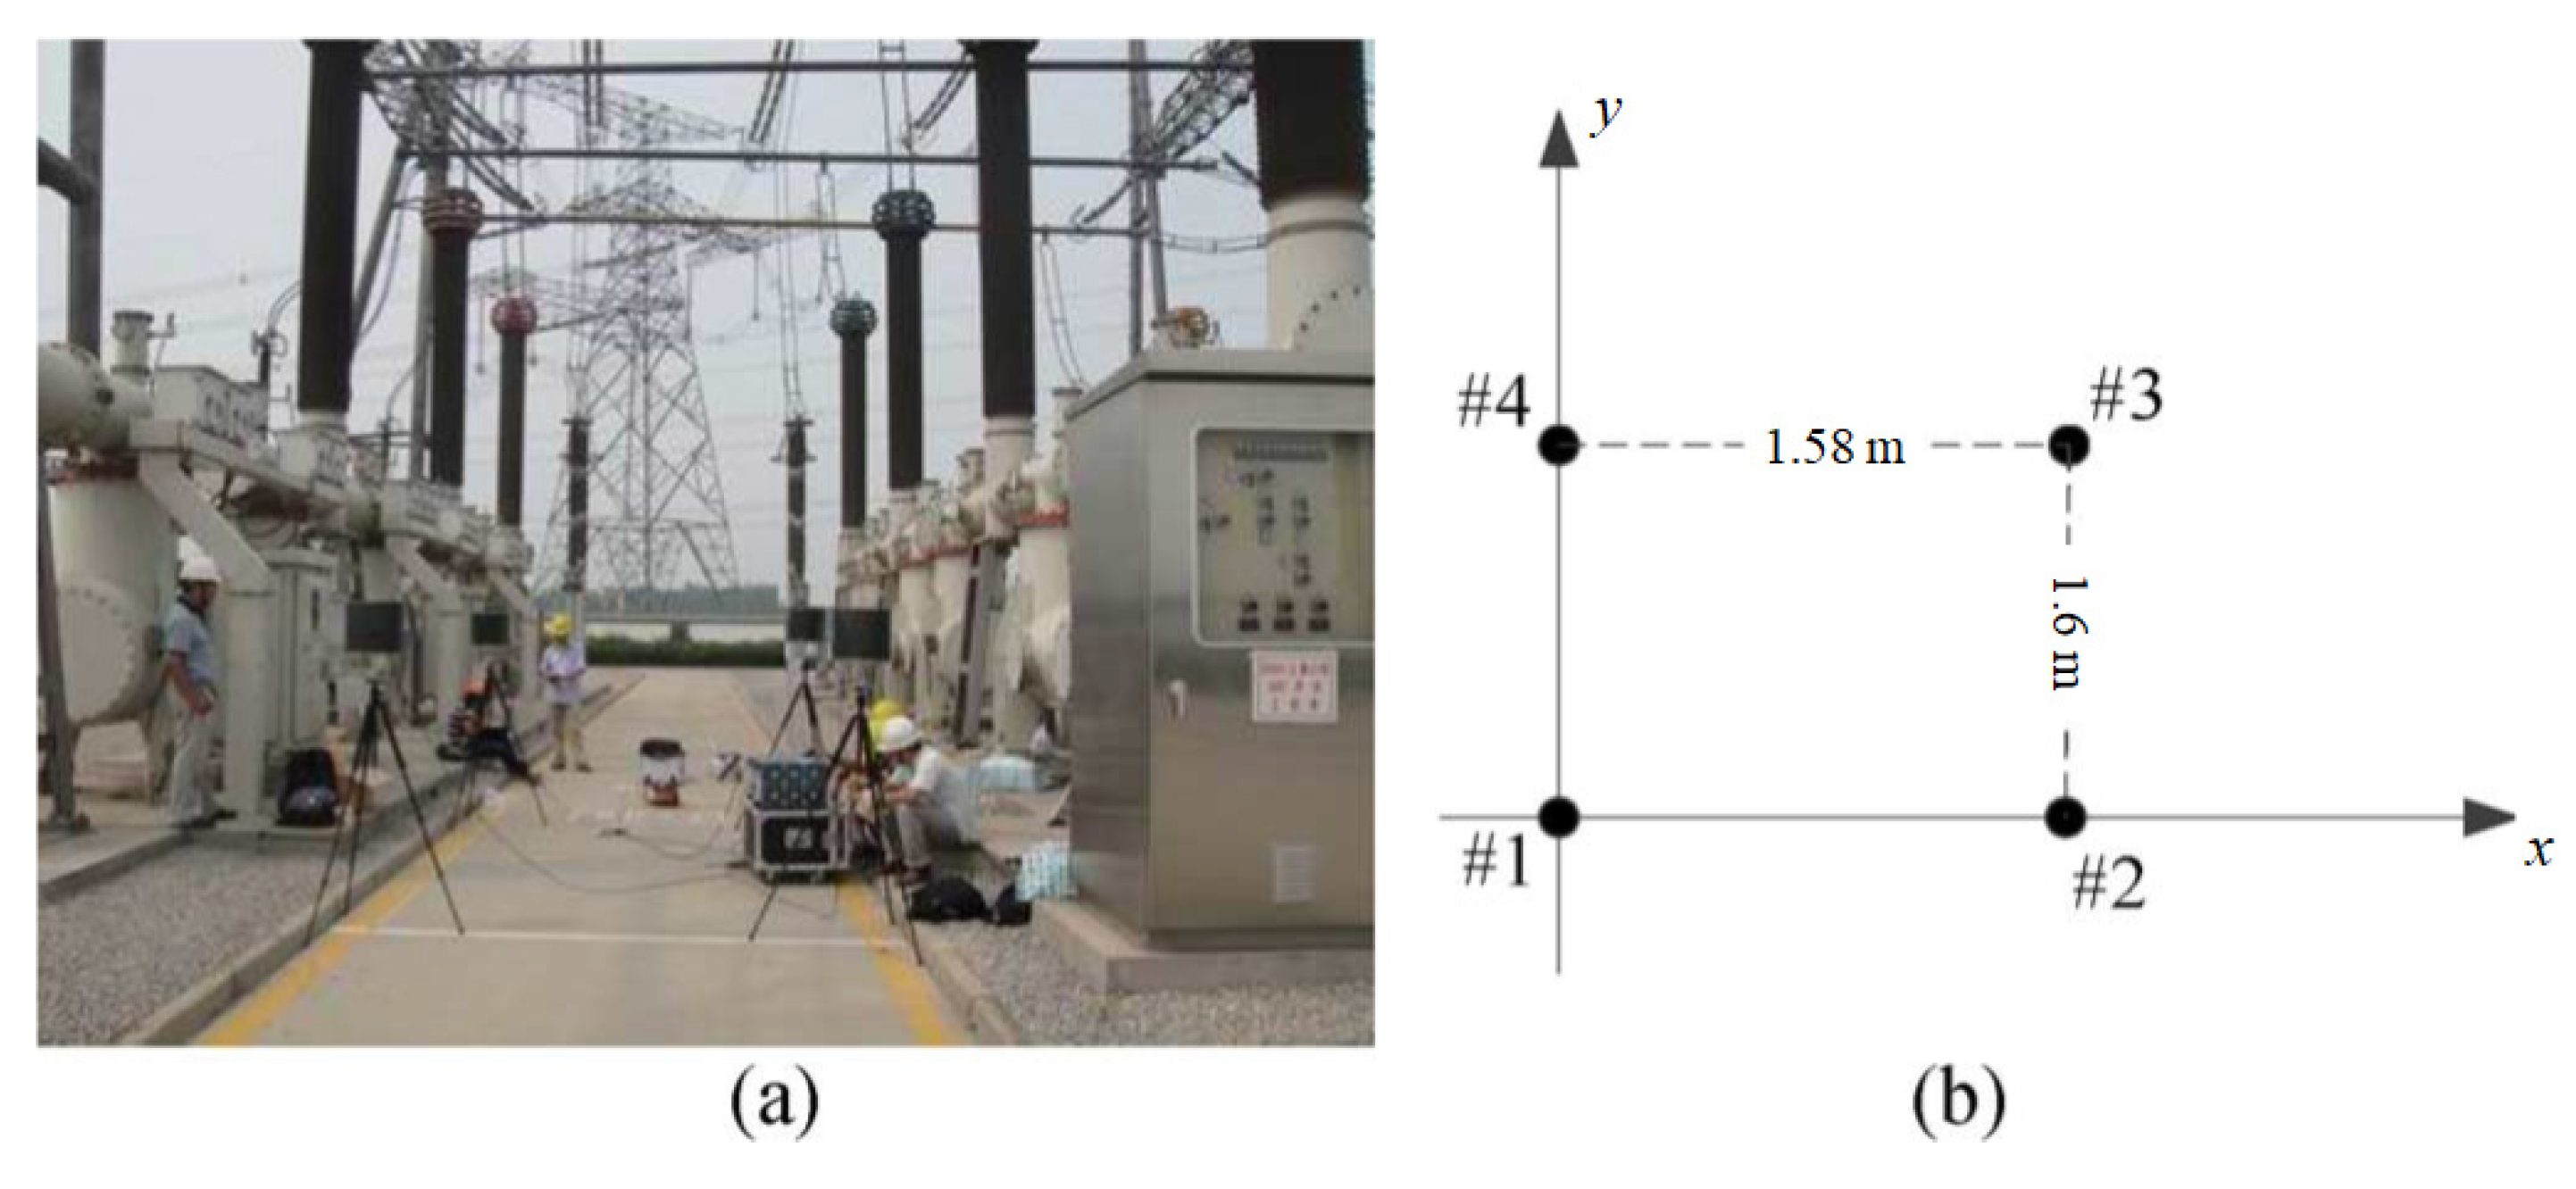
To verify the effectiveness of the proposed separation method for separating PD sources in a substation, a field test was performed in a 500 kV power substation. Four omnidirectional antennas arranged in a planar rectangular were applied for collecting PD UHF signals. A spatial coordinate system was set with antenna 1 as the coordinate origin. Then, the coordinates of four antennas were fixed as (0, 0) for #1, (1.58, 0) for #2, (1.58, 1.16) for #3, and (0, 1.16) for #4 in meters, respectively, as shown in Figure 5a,b. The frequency response of each UHF antenna was same as the bandwidth, 0.2–6 GHz. An oscilloscope was used as a signal acquisition device, the received signals were collected synchronously with a sampling rate of 5 GHz.
A PD simulator was placed in the substation at planar coordinates (−4, 5.5). The simulator can simulate PDs of different capacity between needle tips or plates, including 500–16,500 V contacts or air discharges, with an error of less than 5%. The rise time of the discharge pulse is 0.8 ns with an error of 25% or less. The frequency spectrum of the discharge signal produced is in the range of 0–2 GHz.
Two PD sources were found in the substation. One is an external PD source at the terminal of an incoming line, which can be measured by an ultraviolet imager, and the other is produced by the PD simulator. The coordinates of the external discharge source is (−4.4, −7).
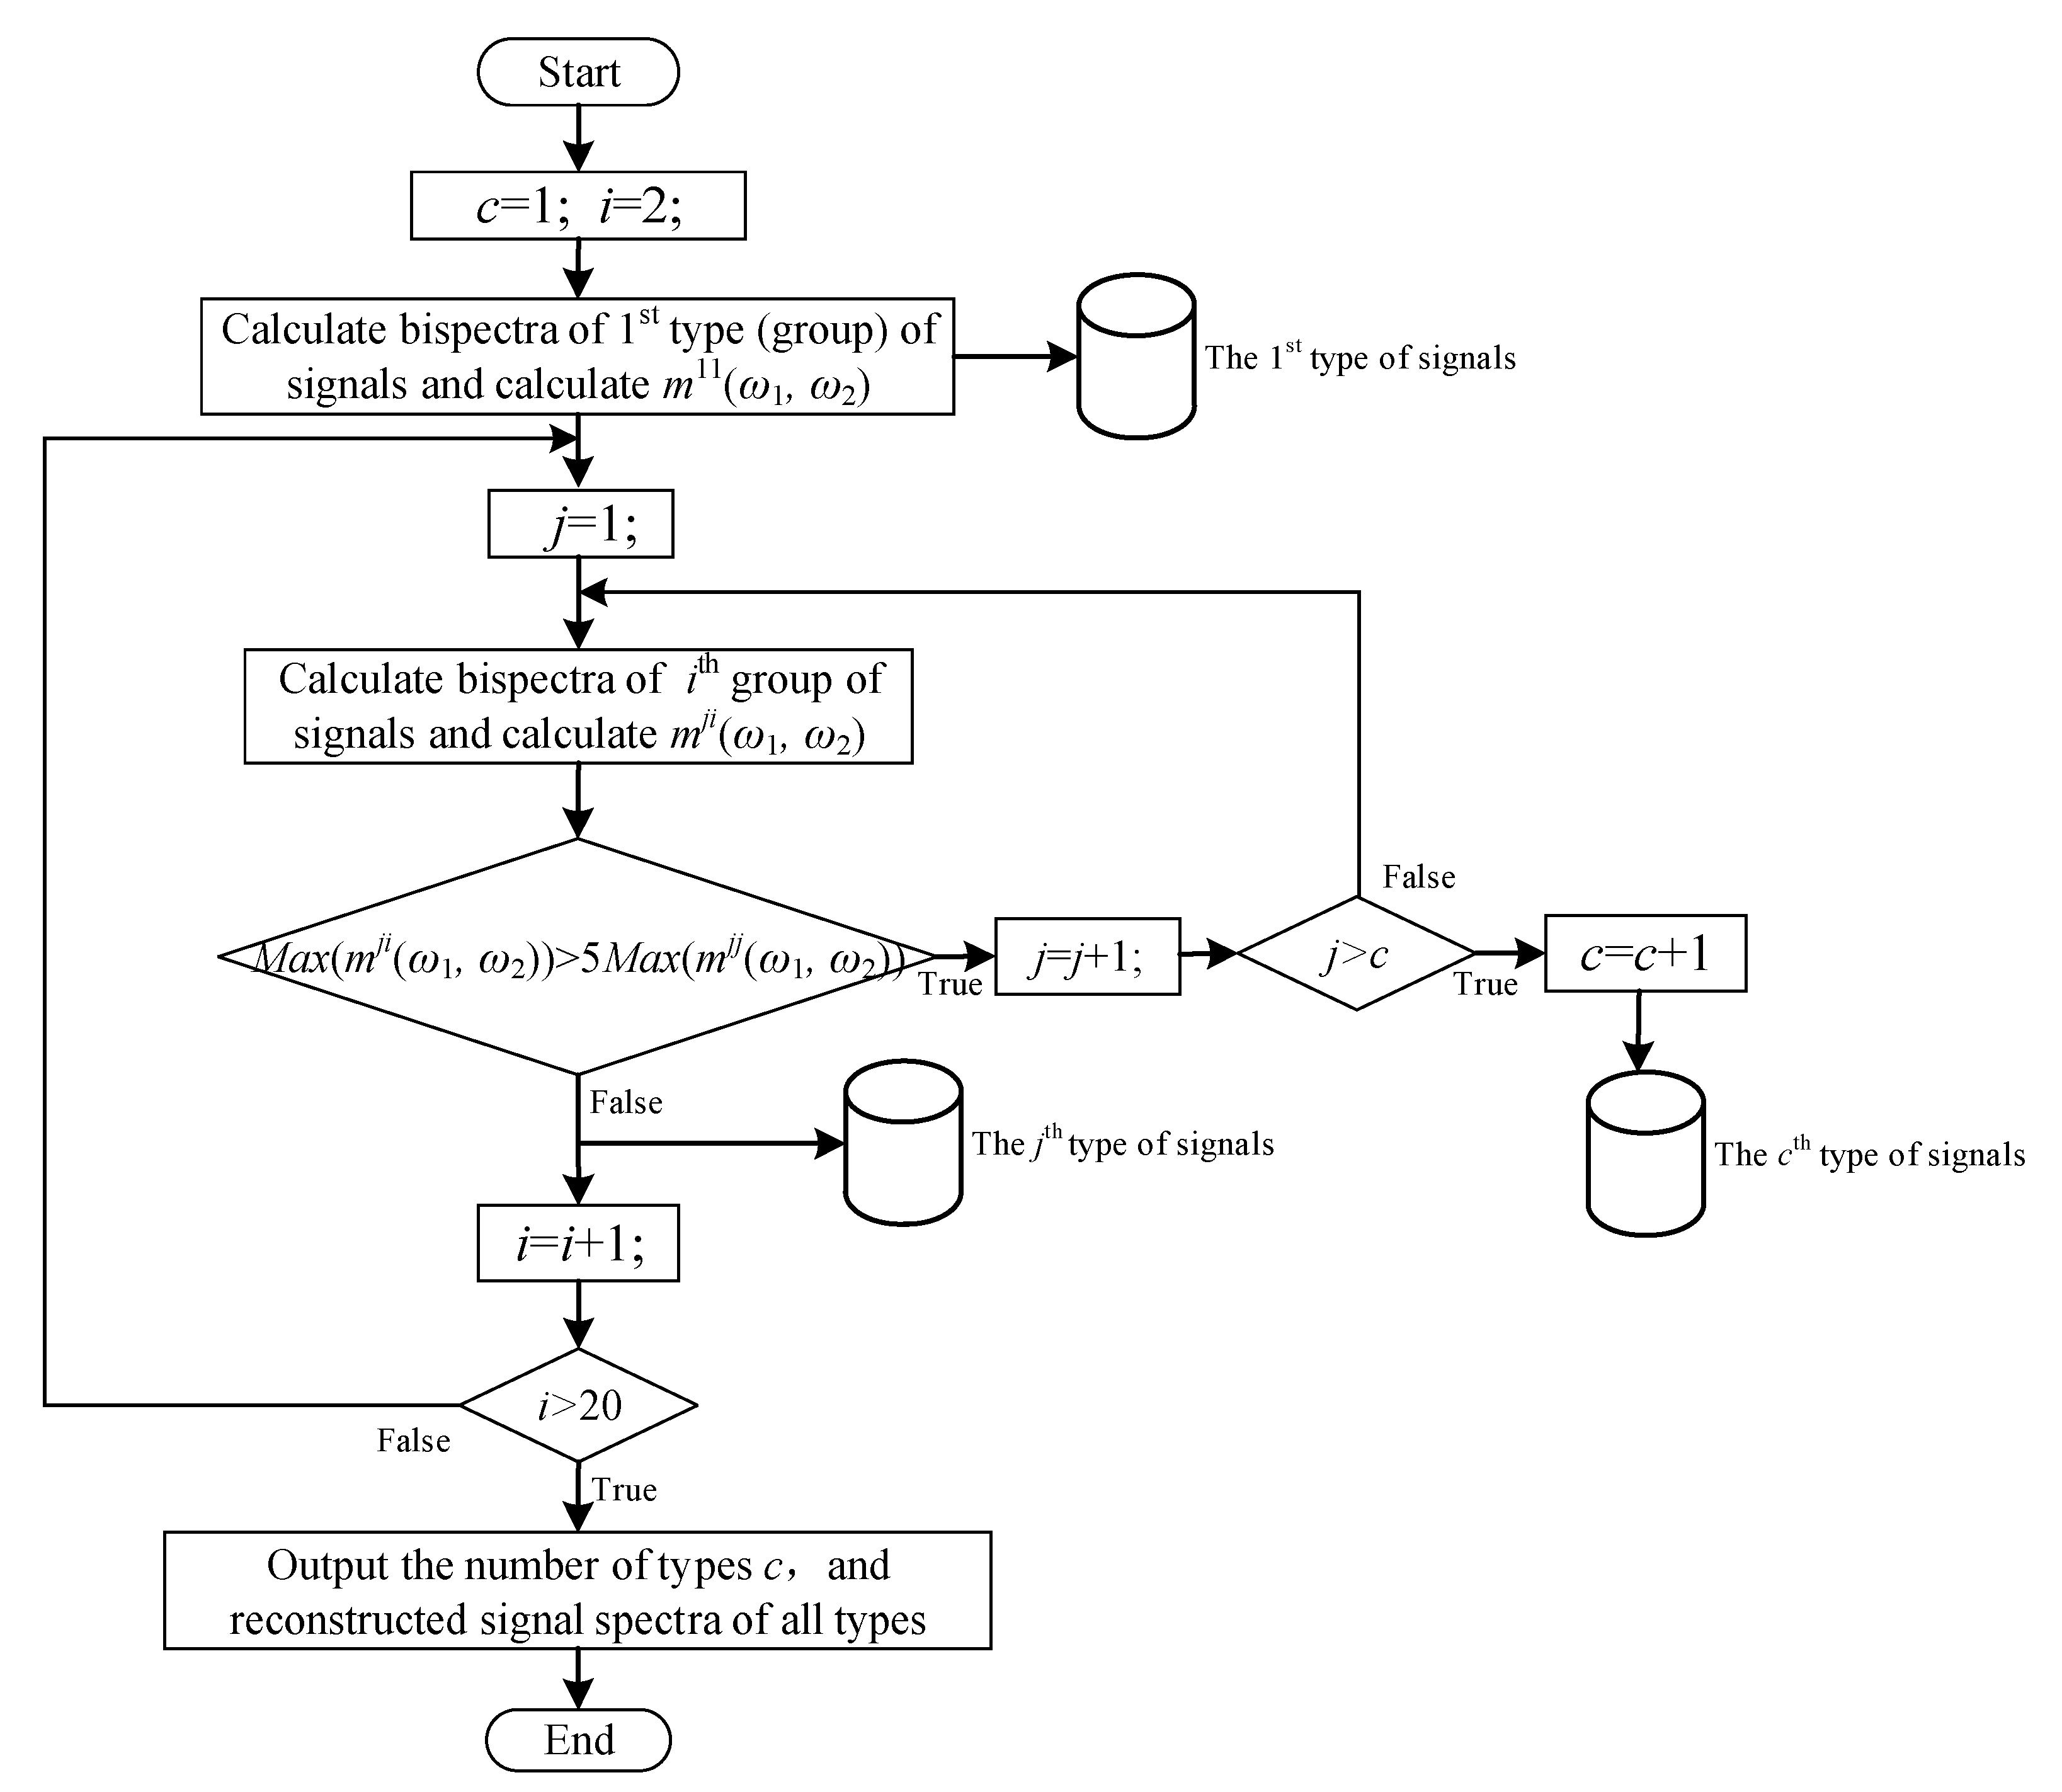
Two hundred groups of PD UHF signals in the substation were acquired and analyzed. The first 20 groups of signals were used to determine the number of signal types by Fisher-like class separation measures described in Equation (9). A flow chart for determining how many signal types are in the substation is shown in Figure 6. Meanwhile, the signals and bispectra included in each type are stored respectively. The signal data and its estimated bispectra are denoted as and , where the superscript j means the jth type of all signals, and the superscript i means the ith group among the jth type.
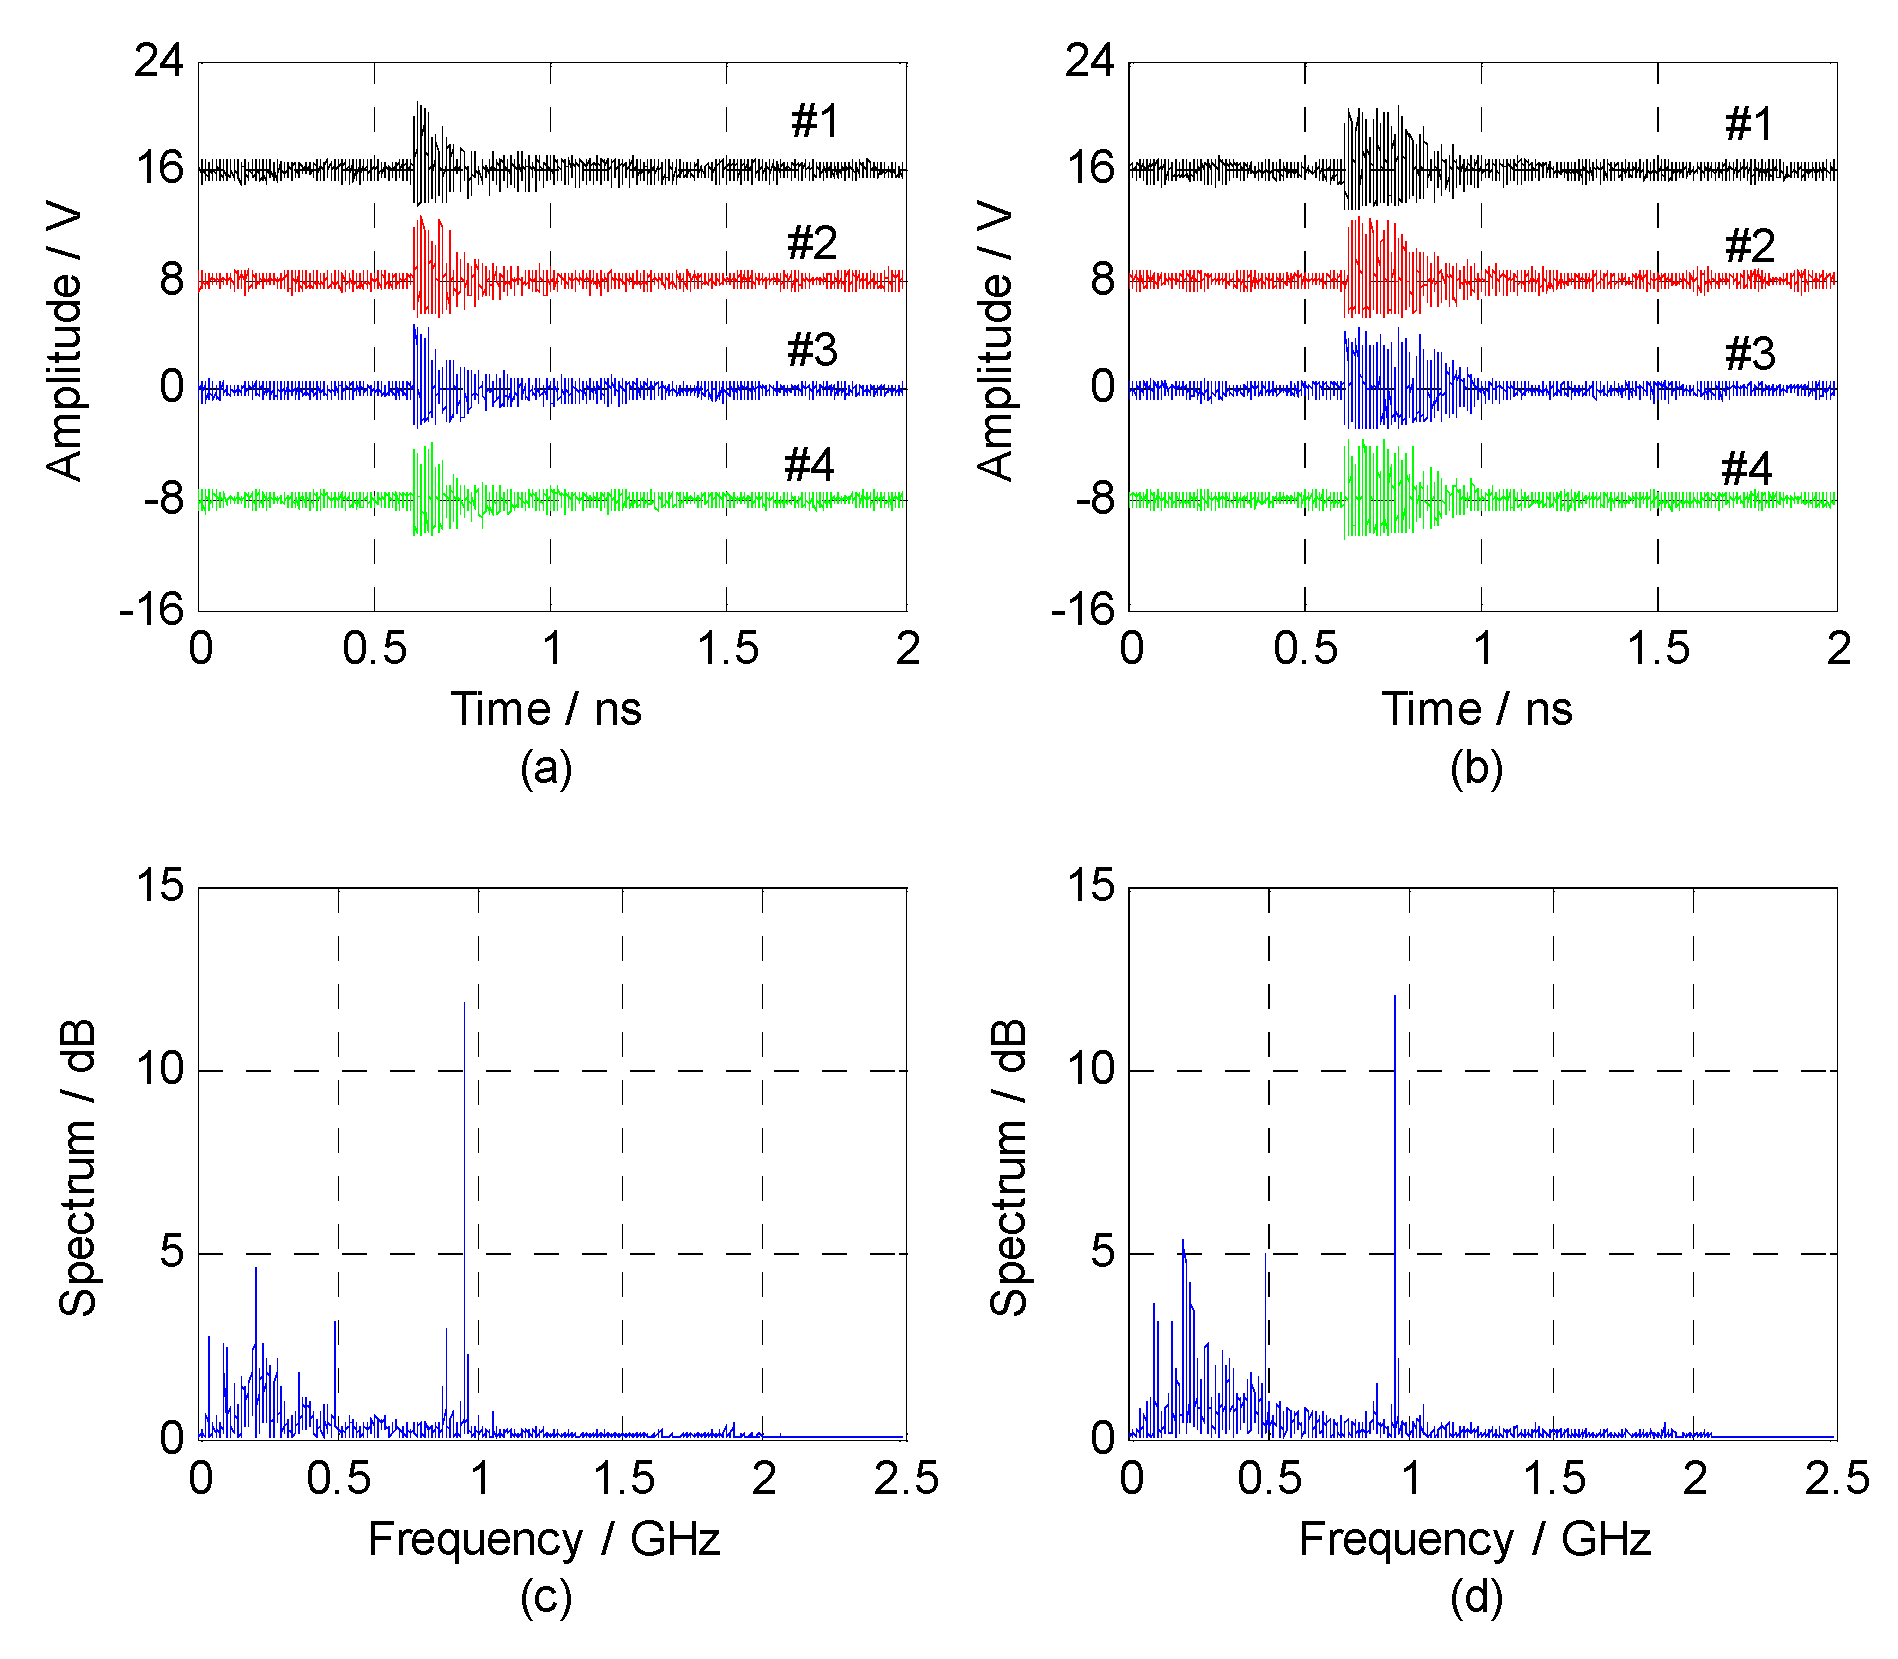
By the steps shown in Figure 6, two types of signals are deduced—the waveforms and frequency spectra—and are shown in Figure 7a–d. The result is identical to the detected PD sources in the substation.
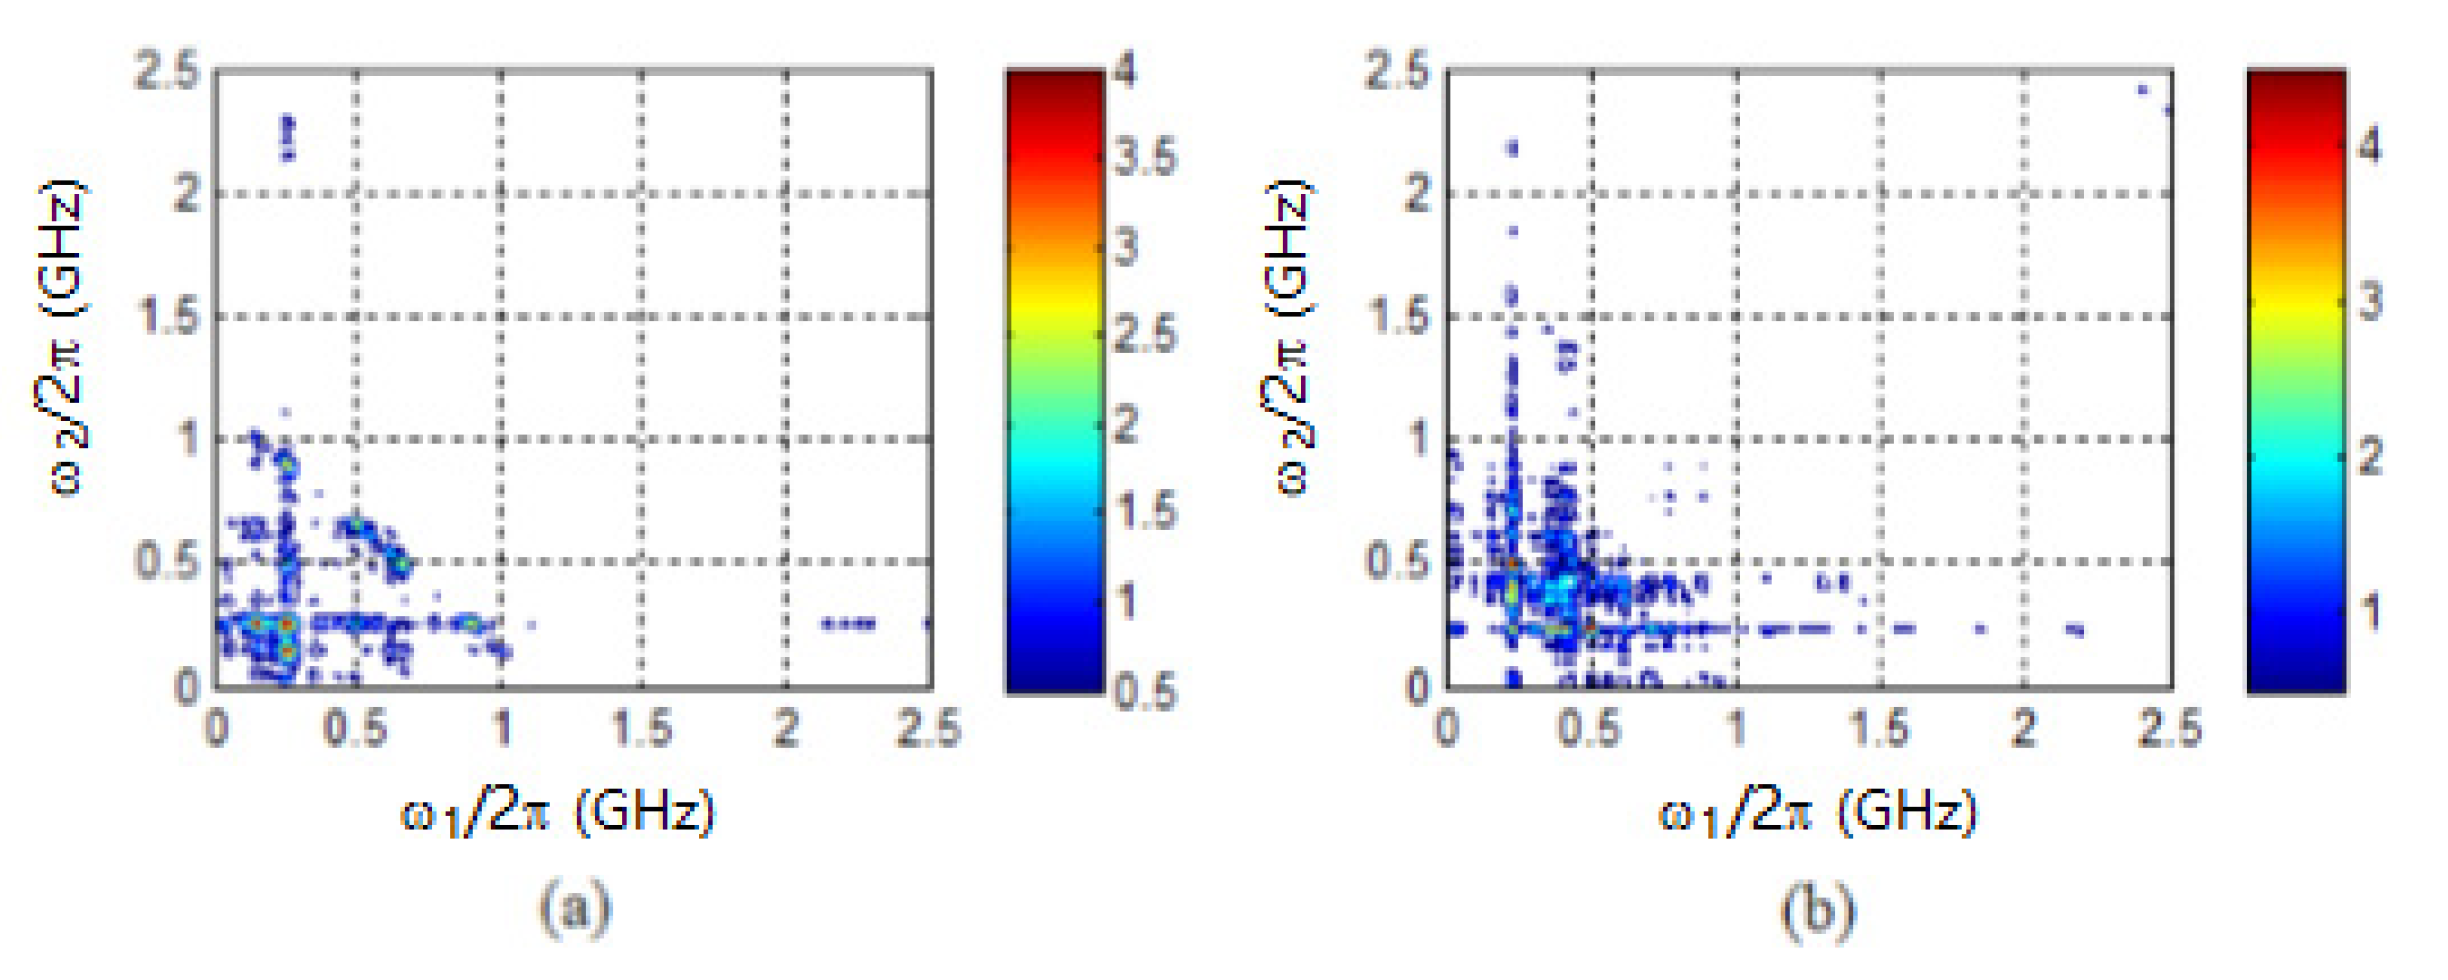
From the distribution of the frequency spectrum, it can be determined that PD UHF signals acquired in the substation are blended with white noises, wireless communication signals of 900 MHz, and radio signals of 100 MHz, which is similar to the noises simulated in Section 3. The bispectra of the two kinds of UHF signals are demonstrated in Figure 8a,b.
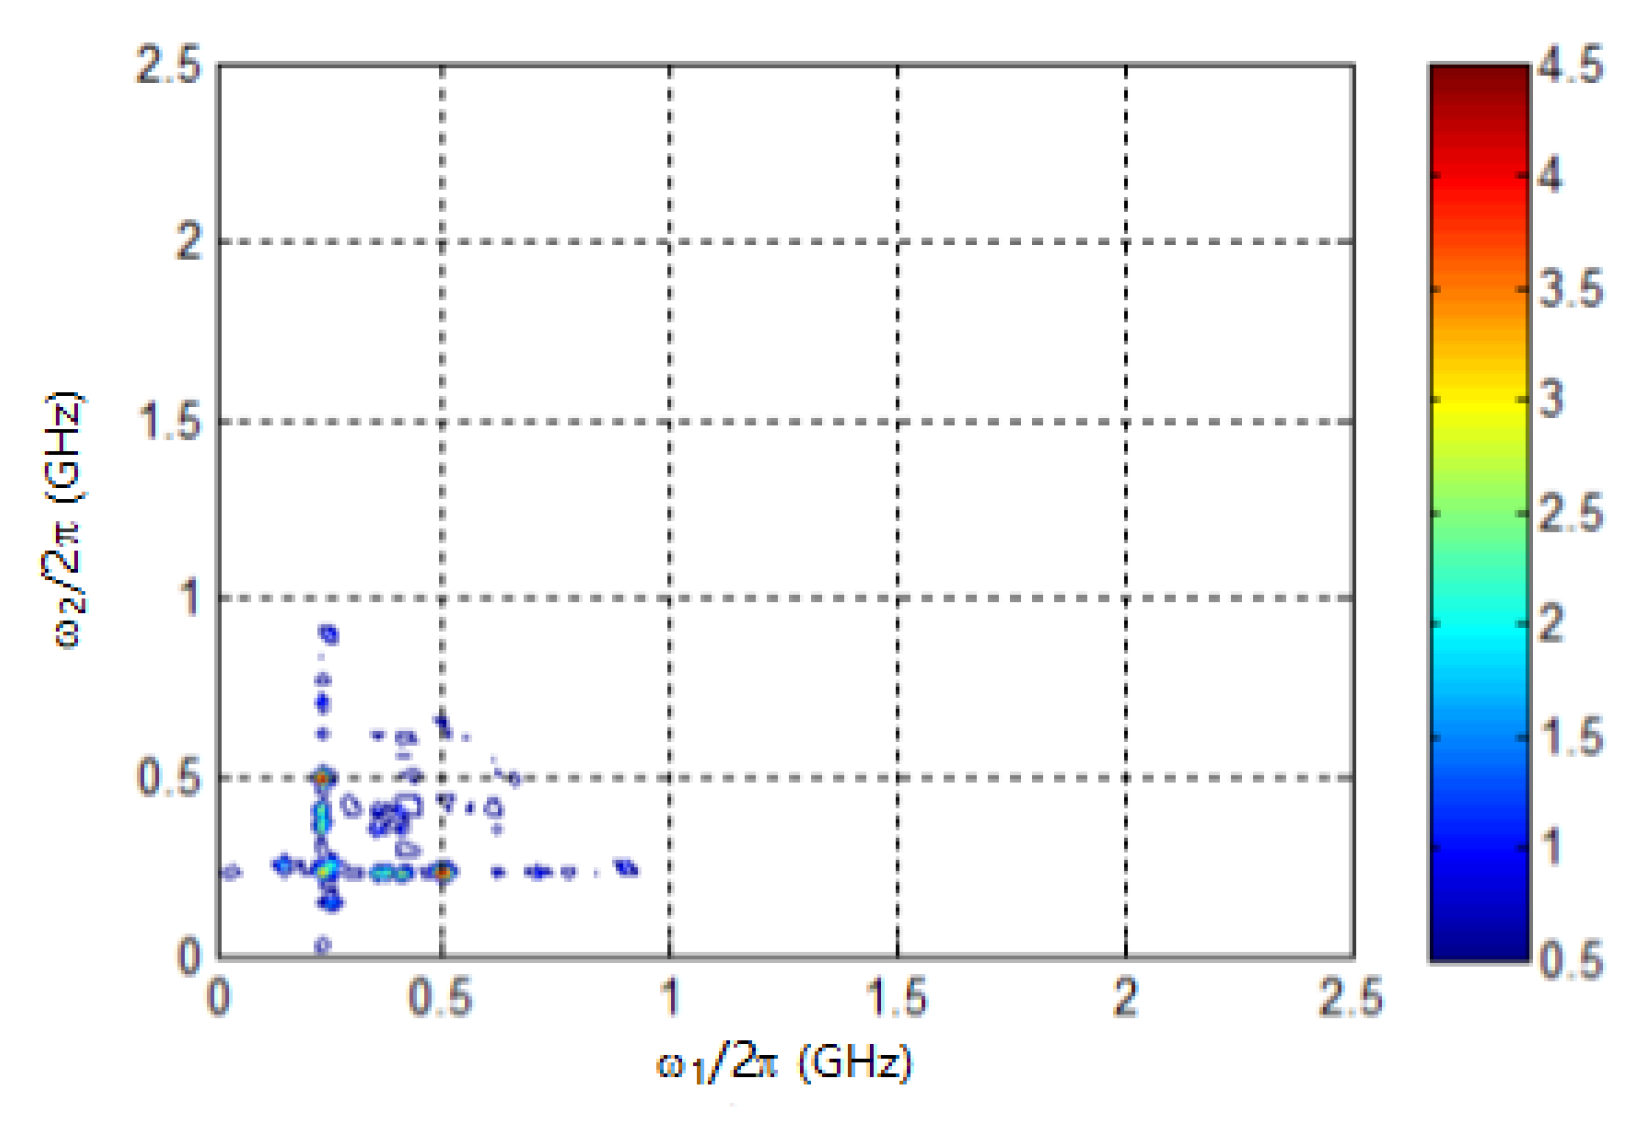
From the signals collected in the substation, 20 signals of each type were selected as samples, and the Fisher-like class separation measures were calculated. The separation measure calculated by the bispectra is shown in Figure 9. Then, the radial basis neural networks used for separating PD sources can be trained.
The PD sources calculated based on time delays are (−4.55, −6.78) and (−3.83, 5.23) in meters, respectively, which were identified as the external PD source and the PD simulator applied in the substation. The two kind of signals were separated with the proposed bispectra method. The signals’ separation rates are shown in Table 3 with different numbers of bispectra selected as characteristic parameters.
It can be seen from Table 3 that the separation rate is more than 70% with the proposed algorithm. Furthermore, the separation rate is more than 80% when more than 10 characteristic parameters are selected.
5. Conclusions
This paper describes a novel method for separating PD signals based on selected bispectra. The characteristic parameters are selected from the bispectra of the UHF signals with Fisher-like class separation measures. By the application of bispectra, the narrow-band periodical interferences as well as Gaussian noises blended in the UHF PD signals can be significantly suppressed. The phase information in the bispectra can be useful for further signal processing.
The proposed method was used to process UHF signals mixed with fixed-frequency interference and Gaussian white noise with different SNRs. The result showed that signals generated by multiple PD sources could be effectively separated. When SNR > 10 dB, the signal separation rate can exceed 80%. The separation rate of the algorithm based on the selected bispectra is related to the number of characteristic parameters. Therefore, it is easy to determine the number of characteristics.
To verify the validity of the proposed method for separating PD sources in a substation, the method was used to process UHF signals radiated by different discharge sources and received by an antenna array in a 500 kV substation. The signal separation rate exceeded 80% when more than 10 characteristic parameters were selected, which verified the effectiveness of the proposed method.
Author Contributions
Conceptualization, Z.H.; Data curation, Z.H.; Formal analysis, Z.H.; Funding acquisition, H.H.; Investigation, H.H.; Methodology, H.H.; Project administration, H.H.; Resources, H.H.; Software, Y.Z.; Supervision, Y.Z.; Validation, Y.Z.; Visualization, Y.Z.; Writing—original draft, G.S.; Writing—review & editing, X.J. All authors have read and agreed to the published version of the manuscript.
Funding
This work was supported in part by the National Key Research and Development Program of China under Grant 2017YFB0902705.
Conflicts of Interest
The authors declare no conflict of interest.
References
- Portugues, I.E.; Moore, P.J.; Glover, I.; Johnstone, C.; McKosky, R.H.; Goff, M.B.; Van Der Zel, L. RF-based partial discharge early warning system for air-insulated substations. IEEE Trans. Power Deliv. 2008, 24, 20–29. [Google Scholar] [CrossRef]
- Moore, P.; Portugues, I.; Glover, I. Partial discharge investigation of a power transformer using wireless wideband radio-frequency measurements. IEEE Trans. Power Deliv. 2005, 21, 528–530. [Google Scholar] [CrossRef]
- Moore, P.; Portugues, I.; Glover, I. Radiometric location of partial discharge sources on energized high-voltage plant. IEEE Trans. Power Deliv. 2005, 20, 2264–2272. [Google Scholar] [CrossRef]
- Tenbohlen, S.; Denissov, D.; Hoek, S.; Markalous, S. Partial discharge measurement in the ultra high frequency (UHF) range. IEEE Trans. Dielectr. Electr. Insul. 2008, 15, 1544–1552. [Google Scholar] [CrossRef]
- Moore, P.J.; Portugues, I.; Glover, I.A. A non-intrusive partial discharge measurement system based on RF technology. In Proceedings of the Power Engineering Society General Meeting IEEE, Toronto, ON, Cananda, 13–17 July 2003. [Google Scholar]
- Judd, M.; Yang, L.; Hunter, I. Partial discharge monitoring for power transformer using UHF sensors. Part 2: Field experience. IEEE Electr. Insul. Mag. 2005, 21, 5–13. [Google Scholar] [CrossRef]
- Hou, H.; Sheng, G.; Jiang, X. Robust time delay estimation method for locating uhf signals of partial discharge in substation. IEEE Trans. Power Deliv. 2013, 28, 1960–1968. [Google Scholar] [CrossRef]
- Harris, R.M.; Judd, M.D.; Moore, P.J.; Livie, J. Radiometric detection and analysis of arcing faults. IEEE Trans. Dielectr. Electr. Insul. 2015, 22, 1547–1558. [Google Scholar] [CrossRef]
- Mazroua, A.; Bartnikas, R.; Salama, M. Discrimination between PD pulse shapes using different neural network paradigms. IEEE Trans. Dielectr. Electr. Insul. 1994, 1, 1119–1131. [Google Scholar] [CrossRef]
- Zheng, Z.; Tan, K. Partial discharge recognition based on pulse waveform using time domain data compression method. In Proceedings of the 6th International Conference on Properties and Applications of Dielectric Materials, Xi’an, China, 21–26 June 2000. [Google Scholar]
- Strachan, S.; Rudd, S.; McArthur, S.; Judd, M.; Meijer, S.; Gulski, E. Knowledge-based diagnosis of partial discharges in power transformers. IEEE Trans. Dielectr. Electr. Insul. 2008, 15, 259–268. [Google Scholar] [CrossRef]
- Li, J.; Jiang, T.; Harrison, R.; Grzybowski, S. Recognition of ultra high frequency partial discharge signals using multi-scale features. IEEE Trans. Dielectr. Electr. Insul. 2012, 19, 1412–1420. [Google Scholar] [CrossRef]
- Yang, L.; Judd, M. Recognising multiple partial discharge sources in power transformers by wavelet analysis of UHF signals. IEE Proc. Sci. Meas. Technol. 2003, 150, 119–127. [Google Scholar] [CrossRef]
- Zhang, X.D. Time Series Analysis—High Order Statistic Method; Tsinghua University Publishing House: Beijing, China, 1996. [Google Scholar]
- Tugnait, J. Time delay estimation with unknown spatially correlated Gaussian noise. IEEE Trans. Signal Process. 1993, 41, 549–558. [Google Scholar] [CrossRef]
- Nikias, C.L. Time delay estimation in unknown gaussian spatially correlated noise. IEEE Trans. Acoust. Speech Signal Process. 1988, 36, 1706–1714. [Google Scholar] [CrossRef]
- Hou, H.; Sheng, G.; Li, S.; Jiang, X. A novel algorithm for separating multiple PD sources in a substation based on spectrum reconstruction of UHF signals. IEEE Trans. Power Deliv. 2014, 30, 809–817. [Google Scholar] [CrossRef]
- Cramér, H. Mathematical Methods of Statistics; Princeton Univ. Press: Princeton, NJ, USA, 1946. [Google Scholar]
- Zhang, X.D. Modern Signal Processing; Tsinghua University Publishing House: Beijing, China, 2002. [Google Scholar]
- Jianping, D.; Sundararajan, N.; Saratchandran, P. Communication channel equalization using complex-valued minimal radial basis function neural networks. IEEE Trans. Neural Netw. 2002, 13, 687–696. [Google Scholar] [CrossRef] [PubMed]
- Bors, A.; Pitas, I. Median radial basis function neural network. IEEE Trans. Neural Netw. 1996, 7, 1351–1364. [Google Scholar] [CrossRef] [PubMed] [Green Version]
Figure 1.
Schematic diagram of the simulated antenna array and partial discharge (PD) sources. (a) The simulated substation. (b) The planar diagram of simulated antennas and PD sources. P means the simulated PD sources, and # means the antennas.
Figure 1.
Schematic diagram of the simulated antenna array and partial discharge (PD) sources. (a) The simulated substation. (b) The planar diagram of simulated antennas and PD sources. P means the simulated PD sources, and # means the antennas.

Figure 2.
Waveform and bispectra of simulated PD signals mixed with noises (a,b,e): Signals radiated by simulated PD sources P1~P3 (b,d,f): Bispectra of the simulated signals.
Figure 2.
Waveform and bispectra of simulated PD signals mixed with noises (a,b,e): Signals radiated by simulated PD sources P1~P3 (b,d,f): Bispectra of the simulated signals.

Figure 3.
Frequency spectra of the simulated ultrahigh frequency (UHF) signals (a–c): Frequency spectra of stimulated UHF signal radiated by P1~P3.
Figure 3.
Frequency spectra of the simulated ultrahigh frequency (UHF) signals (a–c): Frequency spectra of stimulated UHF signal radiated by P1~P3.

Figure 4.
Fisher-like class separability measure of the simulated signals. (a): Separability measures between signals radiated by P1 and P2. (b): Separability measures between signals radiated by P1 and P3.
Figure 4.
Fisher-like class separability measure of the simulated signals. (a): Separability measures between signals radiated by P1 and P2. (b): Separability measures between signals radiated by P1 and P3.

Figure 5.
Arrangement of the antenna array in the substation. (a) Antenna array in the substation. (b) Planar schematic diagram of the antenna array.
Figure 5.
Arrangement of the antenna array in the substation. (a) Antenna array in the substation. (b) Planar schematic diagram of the antenna array.

Figure 6.
Flow chart for obtaining the number of signal types.

Figure 7.
UHF signals radiated by the PD sources observed in the substation. (a): Waveform of UHF signals radiated by the PD simulator. (b): Waveform of UHF signals radiated by the extra discharge (c,d): Frequency spectra of (a,b), respectively.
Figure 7.
UHF signals radiated by the PD sources observed in the substation. (a): Waveform of UHF signals radiated by the PD simulator. (b): Waveform of UHF signals radiated by the extra discharge (c,d): Frequency spectra of (a,b), respectively.

Figure 8.
Separabilities of the UHF signals collected in the substation. (a): Bispectra of UHF signals radiated by the PD simulator. (b): Bispectra of UHF signals radiated by the extra discharge.
Figure 8.
Separabilities of the UHF signals collected in the substation. (a): Bispectra of UHF signals radiated by the PD simulator. (b): Bispectra of UHF signals radiated by the extra discharge.

Figure 9.
Separabilities of UHF signals collected in the substation.


Table 1.
Location results of simulated PDs under different signal to noise rations (SNRs).
| SNR (dB) | Localization Result of P1 (in Meters) | Localization Result of P2 (in Meters) | Localization Result of P3 (in Meters) |
|---|---|---|---|
| 50 | (2.06, 6.54) | (2.93, 6.07) | (1.04, 5.95) |
| 25 | (2.13, 6.67) | (2.85, 6.12) | (1.07, 6.09) |
| 10 | (2.19, 6.73) | (2.79, 6.24) | (0.87, 6.16) |
| 5 | (2.27, 6.84) | (2.67, 6.29) | (1.25, 6.19 ) |
Table 2.
Separation rate of simulated signals under different SNRs.
| SNR (dB) | Q = 5 | Q = 8 | Q = 10 | Q = 12 | Q = 15 | Q = 20 |
|---|---|---|---|---|---|---|
| 50 | 92% | 94% | 95% | 95% | 95% | 95% |
| 25 | 81% | 84% | 86% | 87% | 86% | 87% |
| 10 | 76% | 80% | 82% | 82% | 81% | 83% |
| 5 | 73% | 76% | 79% | 80% | 80% | 80% |
Table 3.
Separation rate of signals collected in the substation with different numbers of selected bispectra.
Table 3.
Separation rate of signals collected in the substation with different numbers of selected bispectra.
| Q = 5 | Q = 8 | Q = 10 | Q = 12 | Q = 15 | Q = 20 |
|---|---|---|---|---|---|
| 74% | 77% | 80% | 82% | 81% | 82% |
© 2020 by the authors. Licensee MDPI, Basel, Switzerland. This article is an open access article distributed under the terms and conditions of the Creative Commons Attribution (CC BY) license (http://creativecommons.org/licenses/by/4.0/).
Share and Cite
MDPI and ACS Style
He, Z.; Hou, H.; Zang, Y.; Sheng, G.; Jiang, X. A Method for Separating Multisource Partial Discharges in a Substation Based on Selected Bispectra of UHF Signals. Appl. Sci. 2020, 10, 3751. https://doi.org/10.3390/app10113751
AMA Style
He Z, Hou H, Zang Y, Sheng G, Jiang X. A Method for Separating Multisource Partial Discharges in a Substation Based on Selected Bispectra of UHF Signals. Applied Sciences. 2020; 10(11):3751. https://doi.org/10.3390/app10113751
Chicago/Turabian StyleHe, Zhimin, Huijuan Hou, Yiming Zang, Gehao Sheng, and Xiuchen Jiang. 2020. "A Method for Separating Multisource Partial Discharges in a Substation Based on Selected Bispectra of UHF Signals" Applied Sciences 10, no. 11: 3751. https://doi.org/10.3390/app10113751
Note that from the first issue of 2016, this journal uses article numbers instead of page numbers. See further details here.