Ion Current Rectification in Extra-Long Nanofunnels


Department of Physics, University of Genoa, via Dodecaneso 33, 16146 Genoa, Italy
*
Author to whom correspondence should be addressed.
Appl. Sci. 2020, 10(11), 3749; https://doi.org/10.3390/app10113749
Submission received: 29 April 2020
/
Revised: 24 May 2020
/
Accepted: 25 May 2020
/
Published: 28 May 2020
(This article belongs to the Section Nanotechnology and Applied Nanosciences)
Abstract
:Nanofluidic systems offer new functionalities for the development of high sensitivity biosensors, but many of the interesting electrokinetic phenomena taking place inside or in the proximity of nanostructures are still not fully characterized. Here, to better understand the accumulation phenomena observed in fluidic systems with asymmetric nanostructures, we study the distribution of the ion concentration inside a long (more than 90 µm) micrometric funnel terminating with a nanochannel. We show numerical simulations, based on the finite element method, and analyze how the ion distribution changes depending on the average concentration of the working solutions. We also report on the effect of surface charge on the ion distribution inside a long funnel and analyze how the phenomena of ion current rectification depend on the applied voltage and on the working solution concentration. Our results can be used in the design and implementation of high-performance concentrators, which, if combined with high sensitivity detectors, could drive the development of a new class of miniaturized biosensors characterized by an improved sensitivity.
1. Introduction
Nanofluidics has been attracting the attention of a wide scientific community for a long time [1,2]. Nevertheless, its potential has not yet been fully exploited [3]. This interest is motivated by the fact that nanofluidic systems offer functionalities in terms of control of ionic and molecular transport that occur only at a nanoscale [4,5]. Solid-state nanopores [6] and nanochannels [7] mimicking biological counterparts [8] have been investigated and exploited in many applications [9], e.g., the detection of molecules of biomedical interest, such as proteins [10], nucleic acids [11], viruses [12,13,14], and nanovesicles [15] or for developing new components of ionic circuits [16], such as transistors [17], diodes [18,19], and ion pumps [20,21,22]. A large number of nanofluidic devices exploit electric fields for handling fluids and nano-objects near or through functional nanostructures; for this reason, understanding electrokinetic phenomena occurring at the nanoscale is of paramount importance. Many researchers focused their efforts on modeling, either by analytical or numerical methods, the electrokinetic behavior of fluids in nanoconfinement conditions or at micro-nanointerfaces [23,24], but a comprehensive understanding of all the phenomena taking place and how they influence each other is still far off. This lack of understanding is due to the complexity of the problem, which involves coupled nonlinear fluid flow, charged species transport, and a dynamic evolution of the electric field in a multi-scale space spanning from nanometers to centimeters, as stated by Han and coworkers [25]. In addition to symmetric geometries, nanopores and nanochannels with asymmetric characteristics have also been studied due to their interesting functionalities [26,27], especially when electric fields are applied. In particular, electrostatic interactions between molecules and ions in aqueous solutions, and the electric double layer (EDL), which forms on a nanostructure’s walls, can be exploited for creating ion-selective devices [28]. Concentration polarization (CP) [29] was observed at micro-nano interfaces [30], in nanochannels [17], and in ion current rectification (ICR) in nanostructures [31] with asymmetric surface charge distribution [32,33], geometry [20,26,27,33,34,35,36,37,38,39,40], or both [41]. Concerning conical nanochannels, many different parameters, such as length, cone angle, distribution of surface charge, size and shape, were analyzed to understand how they affect CP and ICR [34,42,43,44]. In particular, CP has been exploited to concentrate diluted analytes, such as proteins [29,45], to improve the sensitivity of biosensors. The challenging idea of combining accumulation capabilities with biological and chemical selectivity boosted the research of new methods and techniques for functionalizing the surface and/or immobilizing biomolecules. Nanochannel/nanopore surface functionalization was used for tuning the ion/molecule selectivity of the structure [46] and also for varying the rectification characteristics [46,47]. For example, Vlassiouk et al. [48] anchored biomolecules onto a conical nanopore to fabricate a biosensor for avidin, streptavidin, and immunoassays. Although research activities focused on the exploitation of CP for biosensing have been very intensive in recent years, as demonstrated by three recent reviews [29,45,49], the main disadvantage of CP-based accumulation systems is still the inability to precisely control the location of the preconcentrated biomolecule plug, as stated by Park and Yossifon [50]. In fact, by controlling the position of the plug it would be possible to overlap target biomolecules with probe molecules anchored on the surface to enhance the detection sensitivity and promote the recognition mechanisms.
With this idea in mind, we developed an immunosensor [51] to accumulate target biomolecules (e.g., antigens) inside a long funnel functionalized with probe molecules (e.g., antibodies). Exploiting the high surface-to-volume ratio of this structure, we succeeded in detecting, by fluorescence measurements, probe-target molecule interactions even for very dilute solutions (nearly 1 pg/mL). Moreover, we exploited the same geometry to implement ion current rectifiers [52] and studied how analytes accumulate inside the long funnel. The promising results we obtained in both fields (immunosensing and rectifiers) motivated us to further investigate the electrokinetic phenomena occurring inside such long structures in order to further improve the combination of accumulation and detection in the same area of a device. Here, we study the distribution of ions inside an extra-long (nearly 90 µm) funnel terminating with an 80 nm wide and nearly 1 µm long nanochannel. Our investigation was carried out by numerically solving the Poisson–Nernst-Planck equations in order to characterize the electrokinetic behavior of the structure for both positive and negative voltages and to estimate the rectification ratio (RR) in the range (−10, 10 V).
2. Methods
It is well established that the distribution of the electrical potential and the flux of each ion species due to a gradient in concentration (diffusion) and electric potential (drift) through a micro-nano fluidic device is governed by the Poisson–Nernst-Planck (PNP) equations. We solved these equations by the finite element method. Details on the implementation in the COMSOL Multiphysics® Software and on the mesh structure used in the simulations are provided in the Supplementary Materials. In the following, we provide details on the geometry that we analyzed and on the imposed boundary conditions.
2.1. Funnel and Nanochannel Geometry
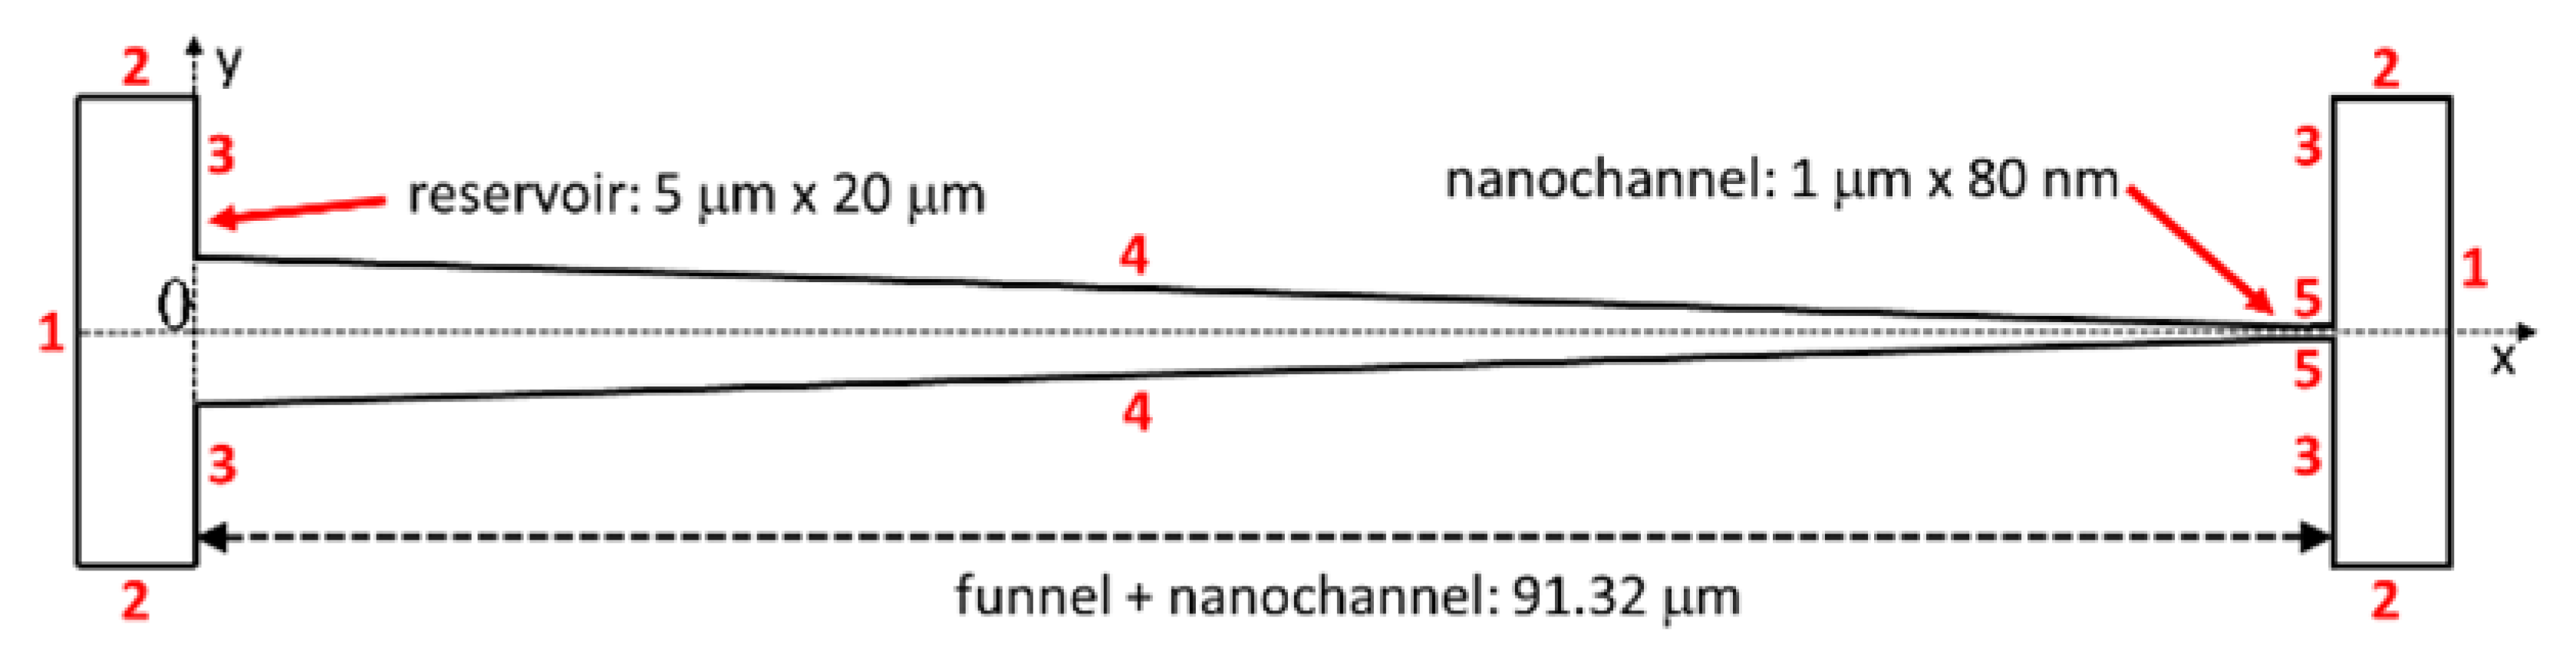
Figure 1 shows the geometry of the device used in the numerical finite element simulations. The 3D geometry of the system (reservoir + funnel + nanochannel + reservoir) was simplified to reduce computational effort by using a 2D axis-symmetric geometry.
Two reservoirs (5 µm × 20 µm), cis- on the left and trans- on the right, are connected by a funnel-shaped microchannel, 90.32 µm long and 6 µm wide at the base (cis-side). At the other extremity, the funnel ends with a rectangular nanochannel (1 µm × 80 nm) linked to the trans-reservoir. The total distance between the two reservoirs (funnel + nanochannel) is therefore 91.32 µm. This geometry was inspired by the structure used by Pezzuoli et al. [51,52].
2.2. Boundary Conditions
We set a constant surface charge of σ = −1 mC/m2 on the walls of the funnel and the nanochannel (labeled 4 and 5 in Figure 1). By changing the boundary conditions on wall 1 in the Poisson equation, we performed simulations for different applied voltages (V) between the cis- and trans- reservoirs. The trans-reservoir was set as grounded, while the potential for the cis- one was varied in a range of between −10 and +10 V. We studied the system filled with electrolytic solutions of KCl with different molarities (1–10−5 M). In the Nernst–Planck equations for both ion species, K+ and Cl−, we set the same concentration CBulk for boundaries 1 and 2 in both reservoirs. By solving the PNP equation system, we could model the distribution of K+ and Cl− ions in the funnel and in the nanochannel as well as calculate the ionic current in the device as a function of V and CBulk. In principle, the set of equations that describes the physics of the system should include the Navier–Stokes (NS) equation. Without it, we are neglecting the effect of electroosmosis, which is a reasonable assumption taking into account the device dimensions and the surface charge density [53,54]. To demonstrate that this is also an acceptable approximation for our system, we performed numerical simulations with a complete PNP-NS set of equations. The results for potassium and chlorine concentrations along different sections of the device were the same, within an error of 0.1%, of those calculated by PNP equations (see Supplementary Materials) for all of the six CBulk values (1–10−5 M) studied.
3. Results and Discussion
3.1. Accumulation
By varying the boundary conditions for the Poisson equation at wall 1 of the cis-reservoir (wall 1 of the trans-reservoir is grounded, i.e., V = 0 V), we calculated C(K+) and C(Cl-), the concentration of K+ and Cl− ions, respectively, inside and at the interface of the structure as a function of the voltage applied. Positive currents () flow from the wide opening towards the narrow opening of the nanochannel. With 1 M concentration in the two reservoirs (CBulk), an ion accumulation occurs in the funnel for negative voltages, with a peak increase in the concentration of about 0.8% in the proximity of the nanochannel entrance (Figure 2). On the other hand, an ion depletion (same “intensity” of the accumulation) occurs for positive voltages. Interestingly, at CBulk = 1 M the accumulation (depletion) is independent of the sign of ion charge (Figure 2a,b).
This phenomenon is due to the presence of surface charges on the walls of the funnel and nanochannel and, consequently, to the formation of an Electric Double Layer (EDL), whose thickness, called the Debye length, λD, can be estimated as follows
where kB is the Boltzmann constant, T the absolute temperature, CBulk the ionic concentration of the solution, NA the Avogadro number, ε the permittivity of free space, and e the elementary charge.
Indeed, simulations performed considering no surface charge, i.e., σ = 0 C/m2, present a constant ion concentration along the entire device (not shown here). However, the accumulation effect at a high concentration (CBulk = 1 M) is almost negligible, since the EDL is about 0.3 nm, as evidenced by the constant concentration along the transversal section in the middle of the nanochannel for both ions at any applied voltage (Figure 3). Only very close to the walls (distance less than 2 nm) does an increase in the K+ ion concentration (a decrease for Cl−) occur.
Figure 4 shows C(K+) e C(Cl−) along the longitudinal section of the nanochannel. The graphs clearly indicate that there is no difference in the concentration of the two species at any applied voltage, since all curves are superimposed. The accumulation effect is strongly dependent on CBulk. By decreasing by 5 orders of magnitude the ion concentration (CBulk = 10−5 M), the behavior drastically changes (Figure 5): (i) the accumulation effect in the funnel is much stronger with the maximum concentration, which is 50 times larger than CBulk; (ii) the independency from the ion charge sign is broken for positive applied voltages.
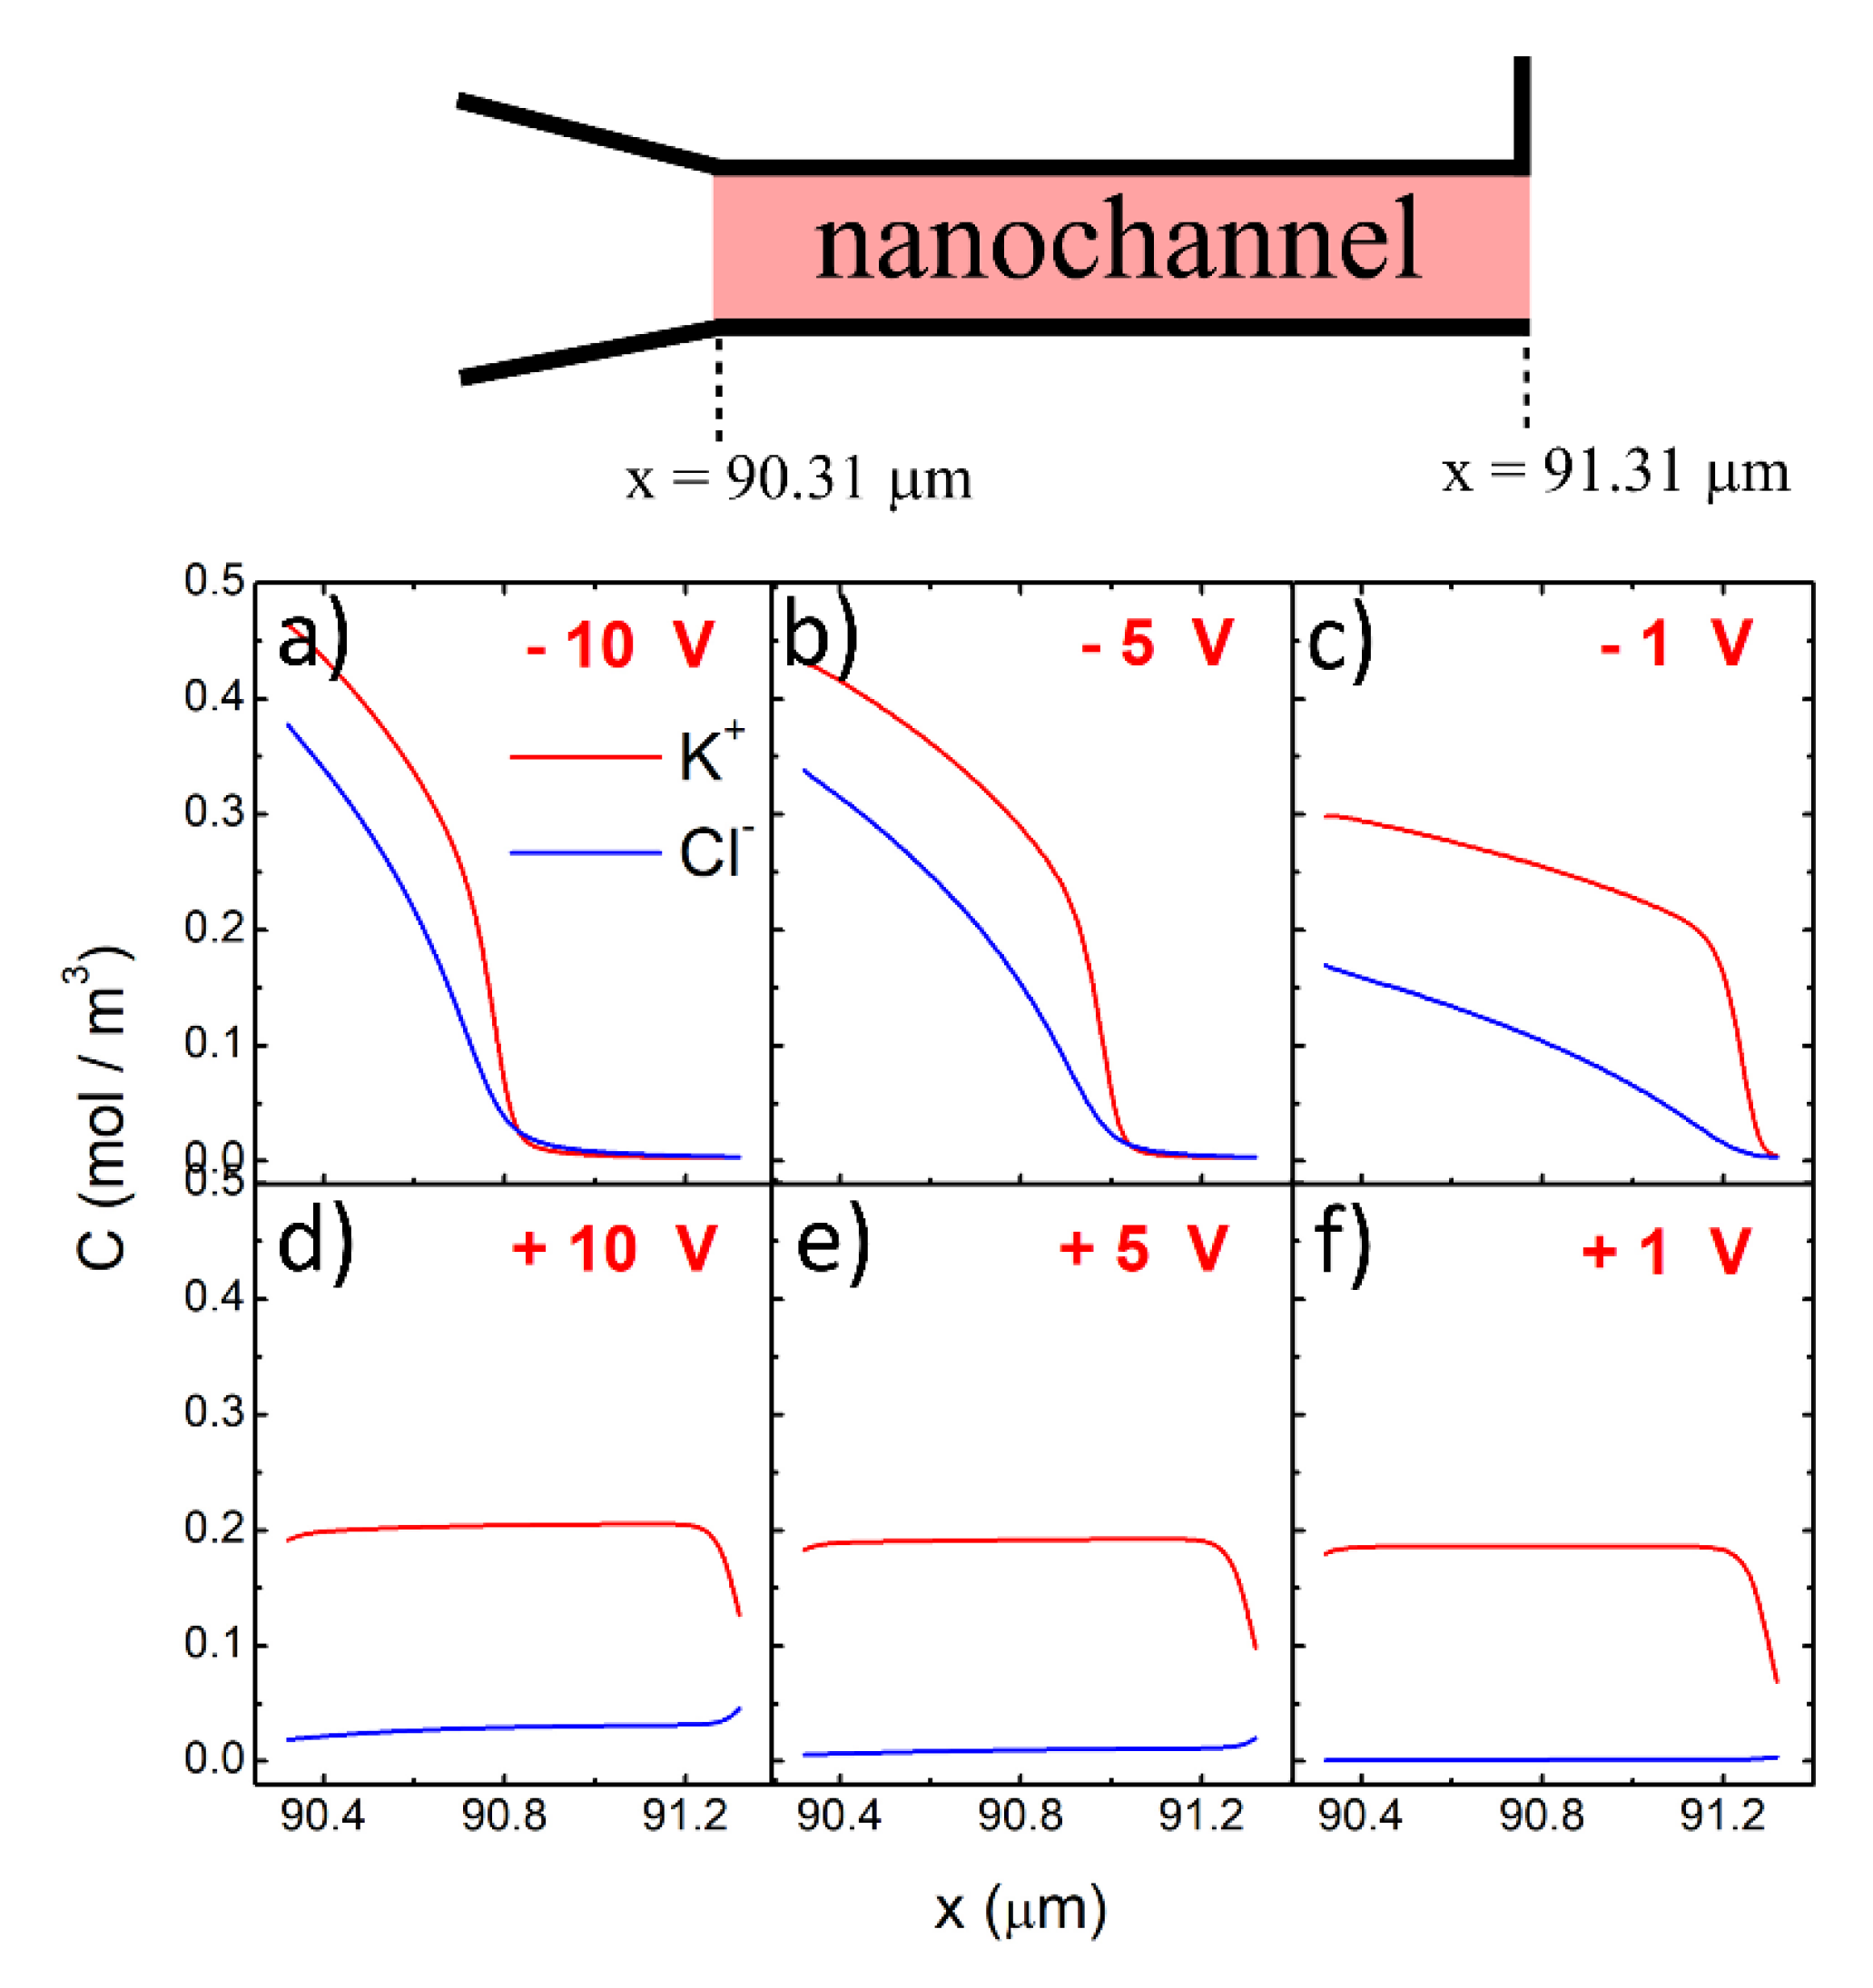
At CBulk = 10−5 M, both ions are accumulated in the funnel for negative voltages, while for “zero” and positive voltages, depletion of both ions occurs. Accumulation of K+ ions for “zero” and positive voltages occurs only in the nanochannel, whereas C(Cl−) is very low. A zoom-in of the ion concentration as a function of the position along the longitudinal section of the nanochannel shows this clearly (Figure 6).
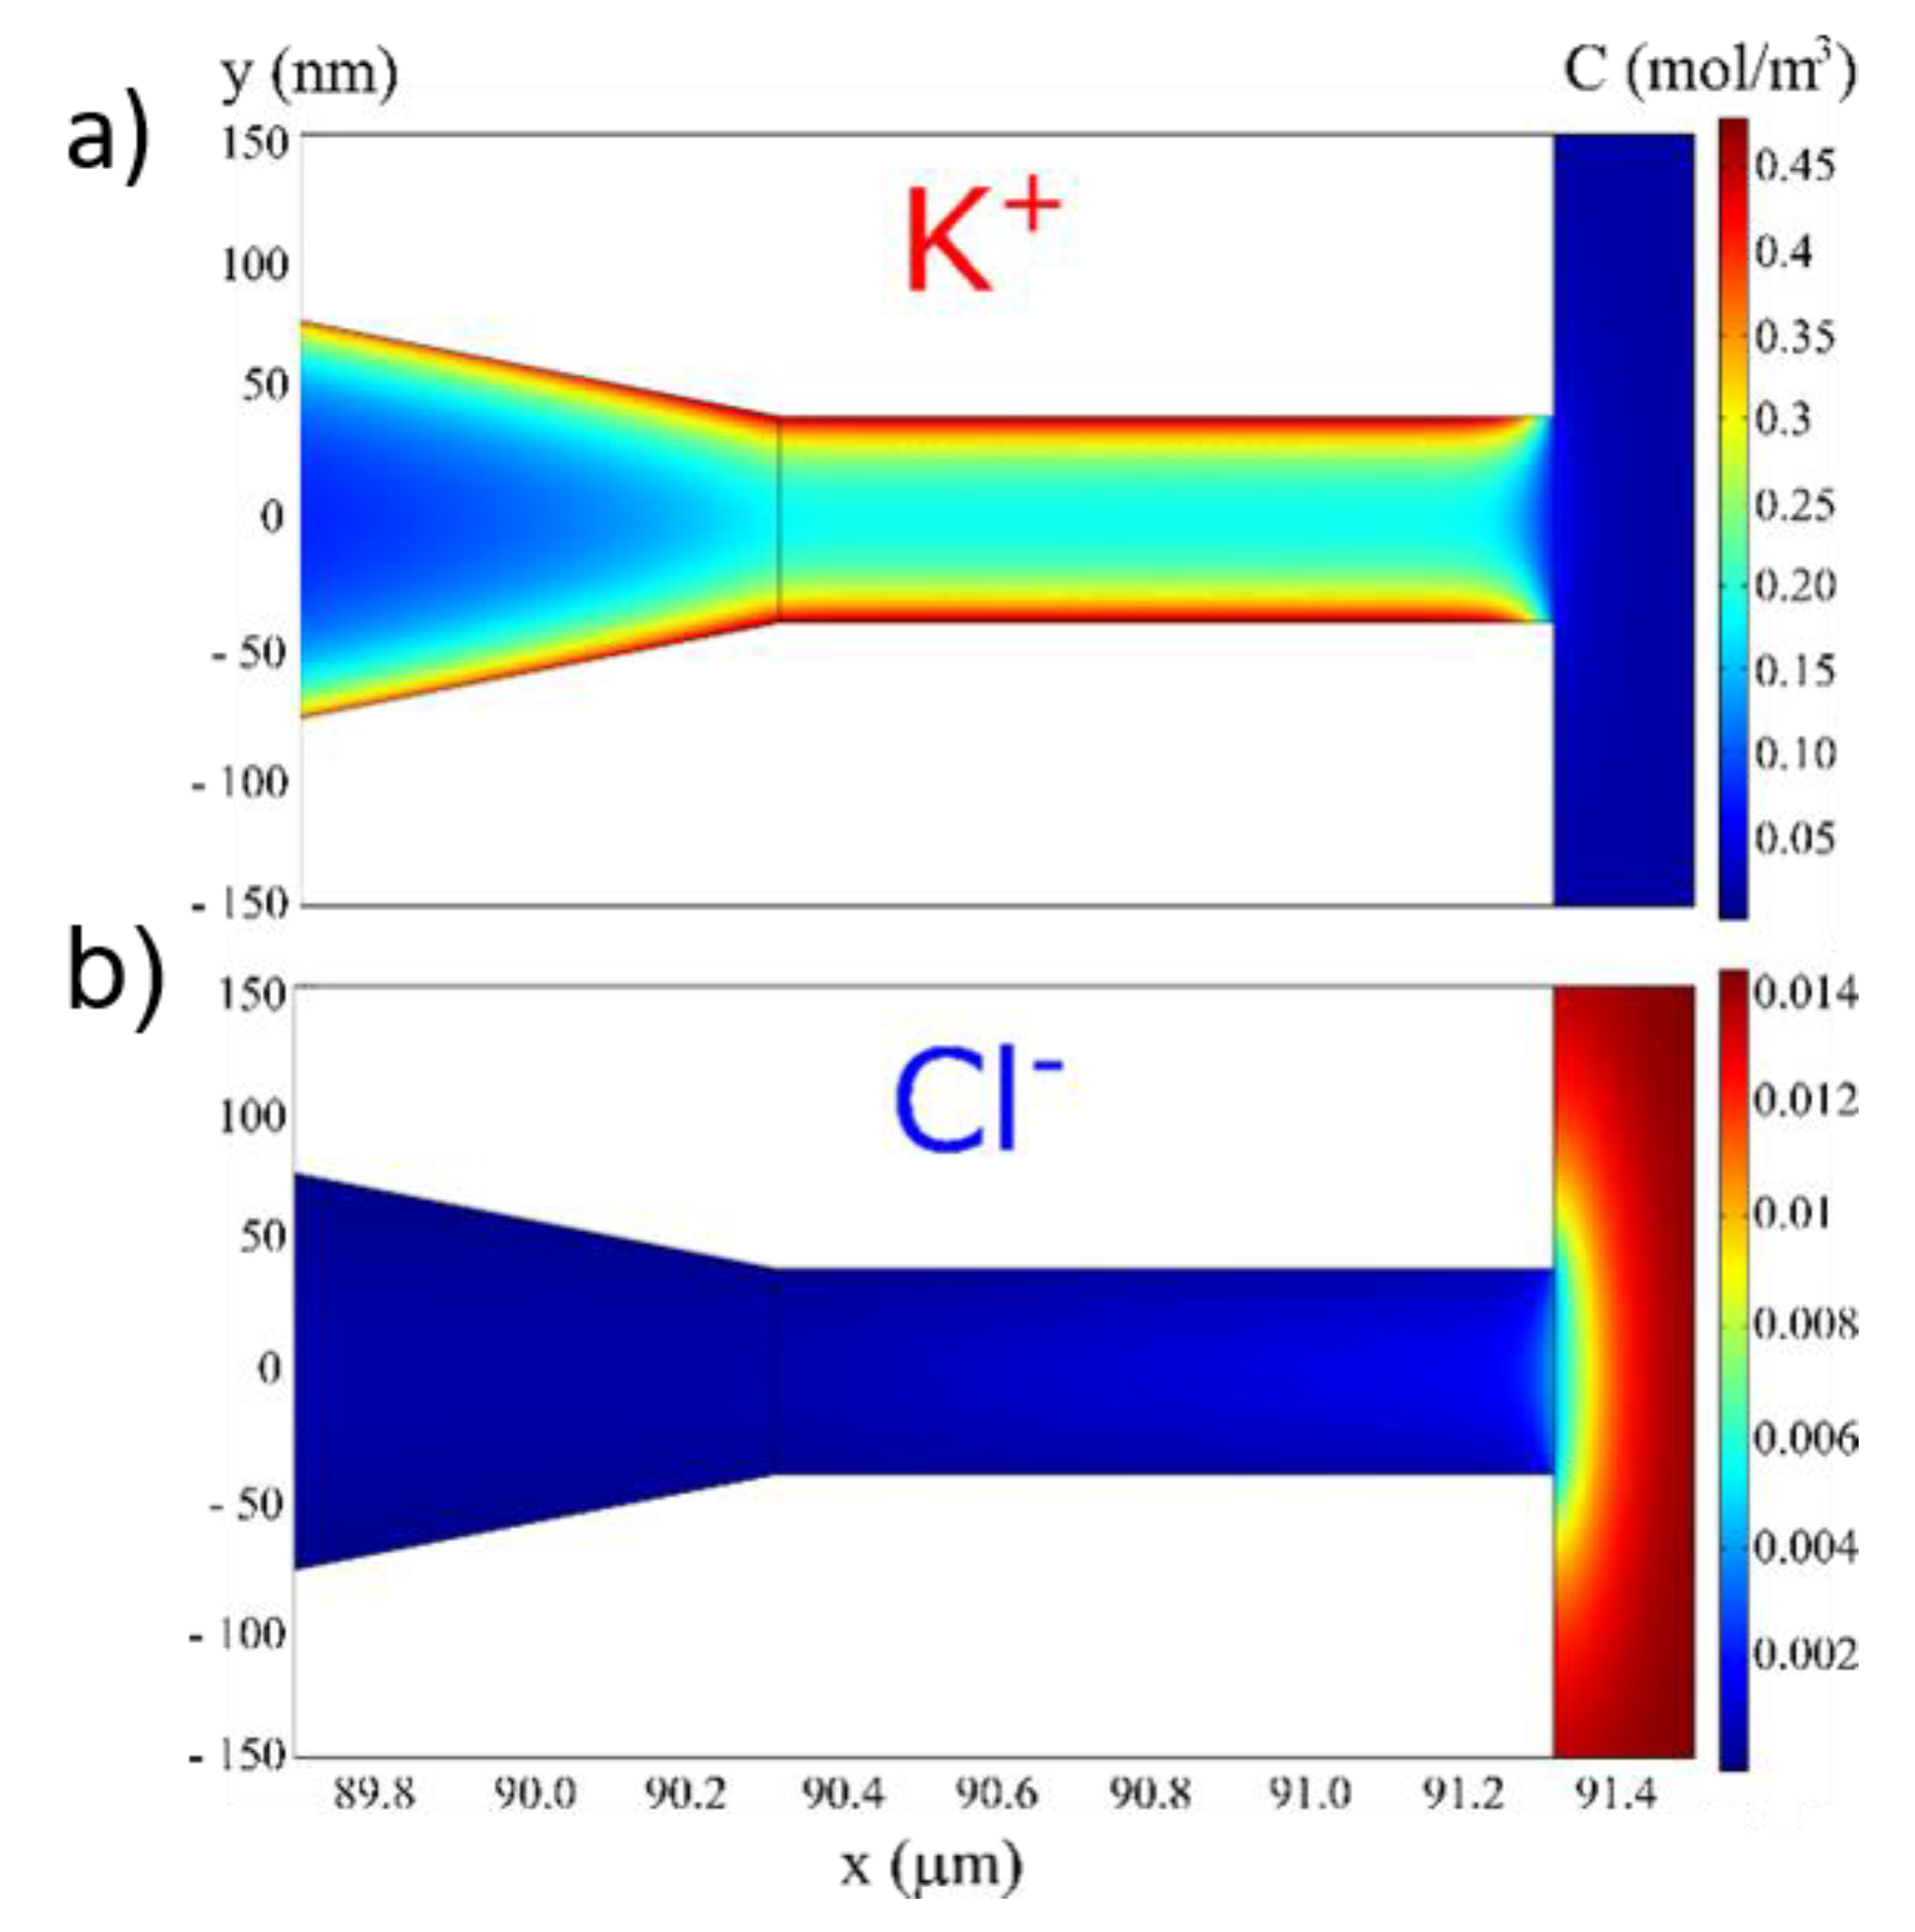
The independence of the concentration distribution from the sign of the charge is progressively broken by varying the applied voltage from −10 (Figure 6a) up to +10 V (Figure 6d). At −10 V, both C(K+) and C(Cl−) are up to 40 times larger than CBulk in the left half of the nanochannel, while both concentrations decrease to a very low value in the right half, towards the nanochannel end. This is due to the ion depletion area, which forms in the anodic reservoir around the nanochannel end. At low CBulk and high electric potential difference between the reservoirs, the depletion area propagates into the channel, forcing the ions to accumulate in the left half of the nanochannel. By decreasing the absolute value of the applied voltage, the ion distribution becomes charge sign-dependent; while K+ ions are uniformly distributed in the channel and reach a plateau for “zero” and positive voltages, Cl− are progressively dropped out (Figure 6d–f). The dependency on the ion charge sign at a positive applied voltage (+1 V) is clearly visible in the colored plot of Figure 7: C(K+) increases in the nanochannel, while for Cl− ions, the enrichment area in the cathodic side does not penetrate into the nanochannel. As we will also see in the following, in the nanochannel C(K+) is constant along longitudinal sections, whereas it increases towards the negatively charged surfaces. The asymmetric response with respect to the applied voltage suggests the use of the device as a rectifier at low CBulk, with an “forward state” for negative voltages and a “reverse state” for positive ones. Later on, we will further discuss this point by calculating the ionic current through the device as a function of V and CBulk.
These results are mainly due to the large value of the Debye length for low concentration. In fact, for CBulk = 1 M, λD = 0.3 nm, this is negligible compared with the nanochannel half-width (40 nm), whereas at CBulk = 10−5 M, λD = 96 nm, this is even larger than the width of the nanochannel itself. The increase in the Debye length when the ionic strength of the solution decreases determines an overlapping of the two EDLs in the nanochannel for a concentration lower than 10−3 M.
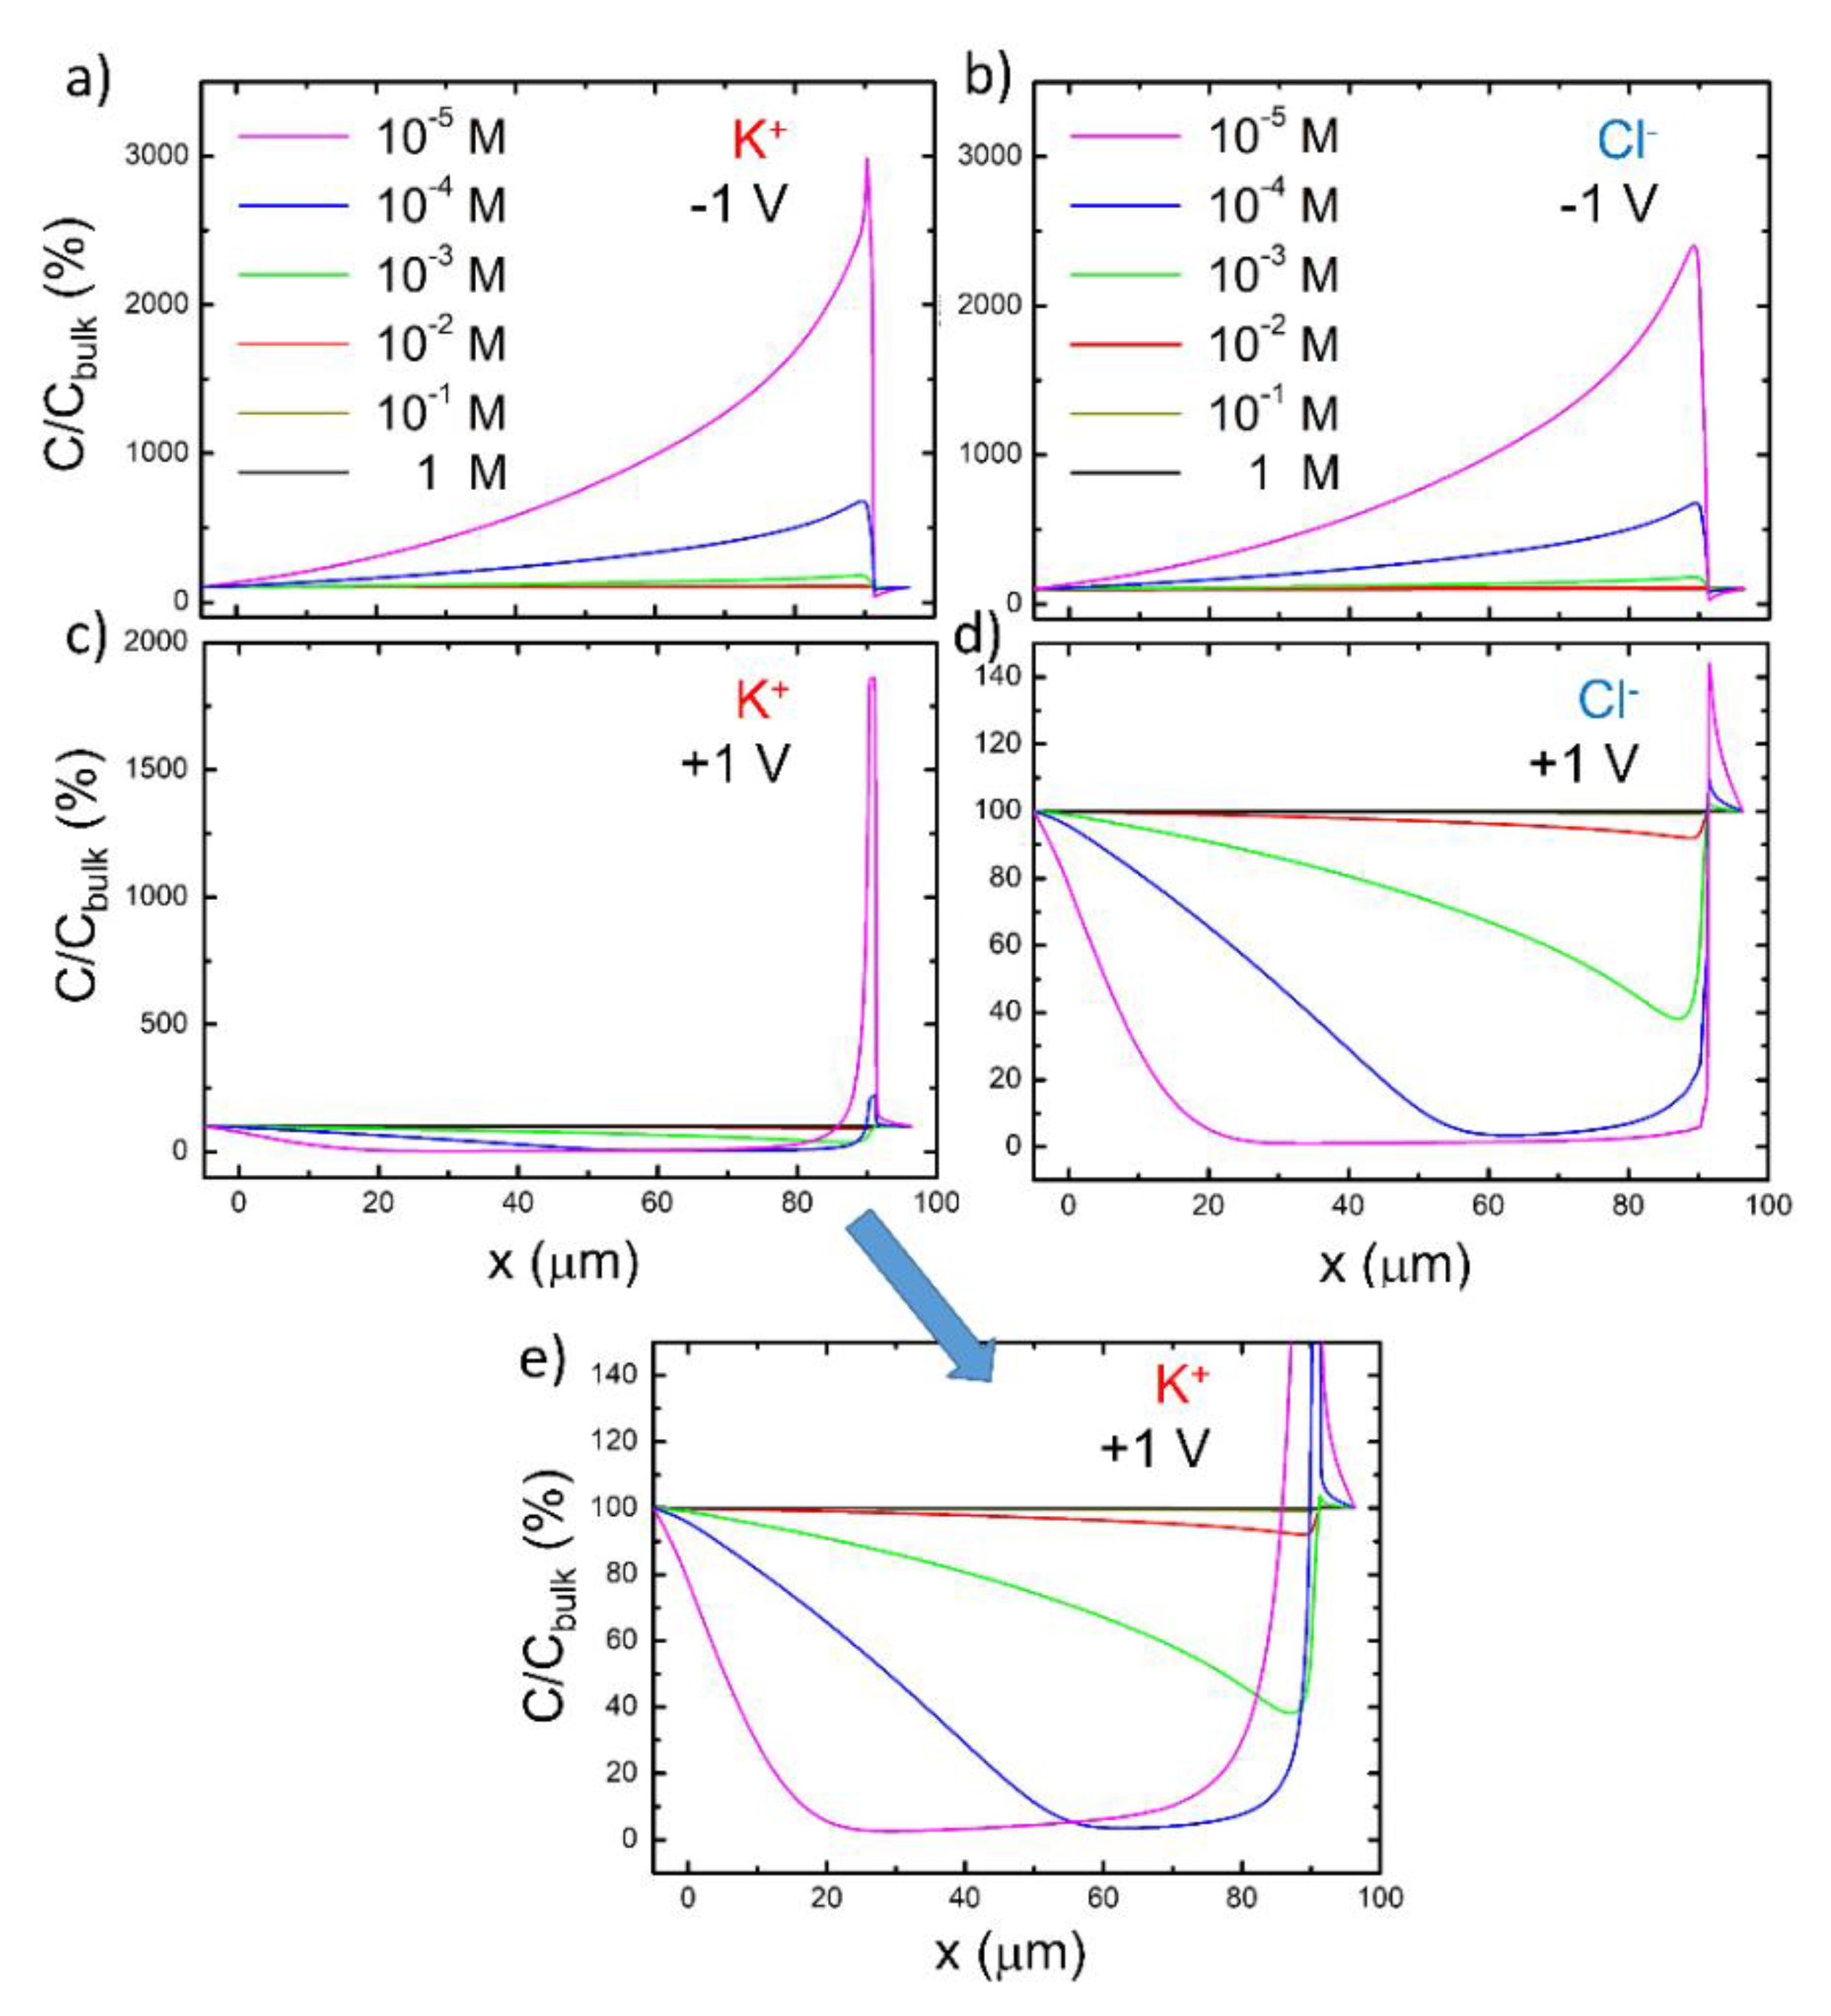
Figure 8 clearly shows that, at half the length of the nanochannel for CBulk = 10−5 M, the K+ and Cl− concentrations along with the transversal section change continuously from the center to the walls of the channel, with an increase and decrease by a factor 2 for C(K+) and C(Cl−), respectively. Moreover, at such a low concentration, the profile depends strongly on the applied voltage. The dependence of the ion accumulation/depletion on CBulk is well described by the graphs in Figure 9, in which the percentage increase in the ion concentration, Ci/CBulk, is plotted along the funnel for different CBulk and applied voltages V. The accumulation effect for negative voltage (−1 V) is strongly enhanced at low CBulk (magenta and blue curves), but almost independent of the ion charge sign at any CBulk (Figure 9a, b). Only at very low CBulk (10−5 M) is C(K+) larger than C(Cl−) at the funnel end. The ion depletion for positive voltage (+1 V) also increases at low CBulk, but in this case, the effect is charge sign dependent. While the concentration of K+ ions is well below CBulk in the funnel, it increases in the nanochannel by a factor of 18 with respect to CBulk (Figure 9c); there are only a few Cl− ions in both the funnel and the nanochannel (Figure 9d). A small increase in the Cl− ion concentration only occurs in the cathodic reservoir around the nanochannel end (enrichment area). These results are also visible in the plots in Figure 7 for a voltage applied of +1 V. The ion accumulation effect in the whole funnel is shown in the plot in Figure 10. Here, the K+ (Figure 10a) and Cl− (Figure 10b) concentrations in the nanofluidic device at CBulk = 10−3 M are plotted with −10 V applied between the reservoirs. It is clear that the accumulation effect is independent of the ion charge sign. It should be noted that the colored scale of the two plots is different. Curves with a similar trend are reported by Liu [43] and Pietschmann [35]. The maximum concentration of positive ions is higher than the one of negative ions and is reached at the negatively charged walls of the funnel and nanochannel (not visible in this plot). In addition to CBulk, the accumulation (for negative voltages)/depletion (for positive ones) phenomena are strongly dependent on the surface charge on the walls of the funnel and nanochannel. As mentioned before, with no surface charge, the ion concentration is constant and equal to CBulk in the whole device (see Supplementary Materials).
3.2. Rectification
As previously mentioned, at low CBulk the asymmetric response of the device for positive and negative applied voltages suggests the possibility to use it as a current rectifier. In order to estimate this effect, we consider the current density J at the point (x,y) due to the contributions of both ion species to be
where Di is the diffusion coefficient and Ci is the ionic concentration of each ion species, F is the Faraday constant, and V is the electrical potential. The current which flows through section x of the device is thus:
where the integral is calculated along the channel width, i.e., from to . Since we performed 2D simulations, the current is calculated as the amount of charge per second flowing through a segment instead of a surface and is measured in A/m. For a discrete set of data, Equation (3) can be rewritten as
where ∆y is the sampling interval for , and along the y-direction.
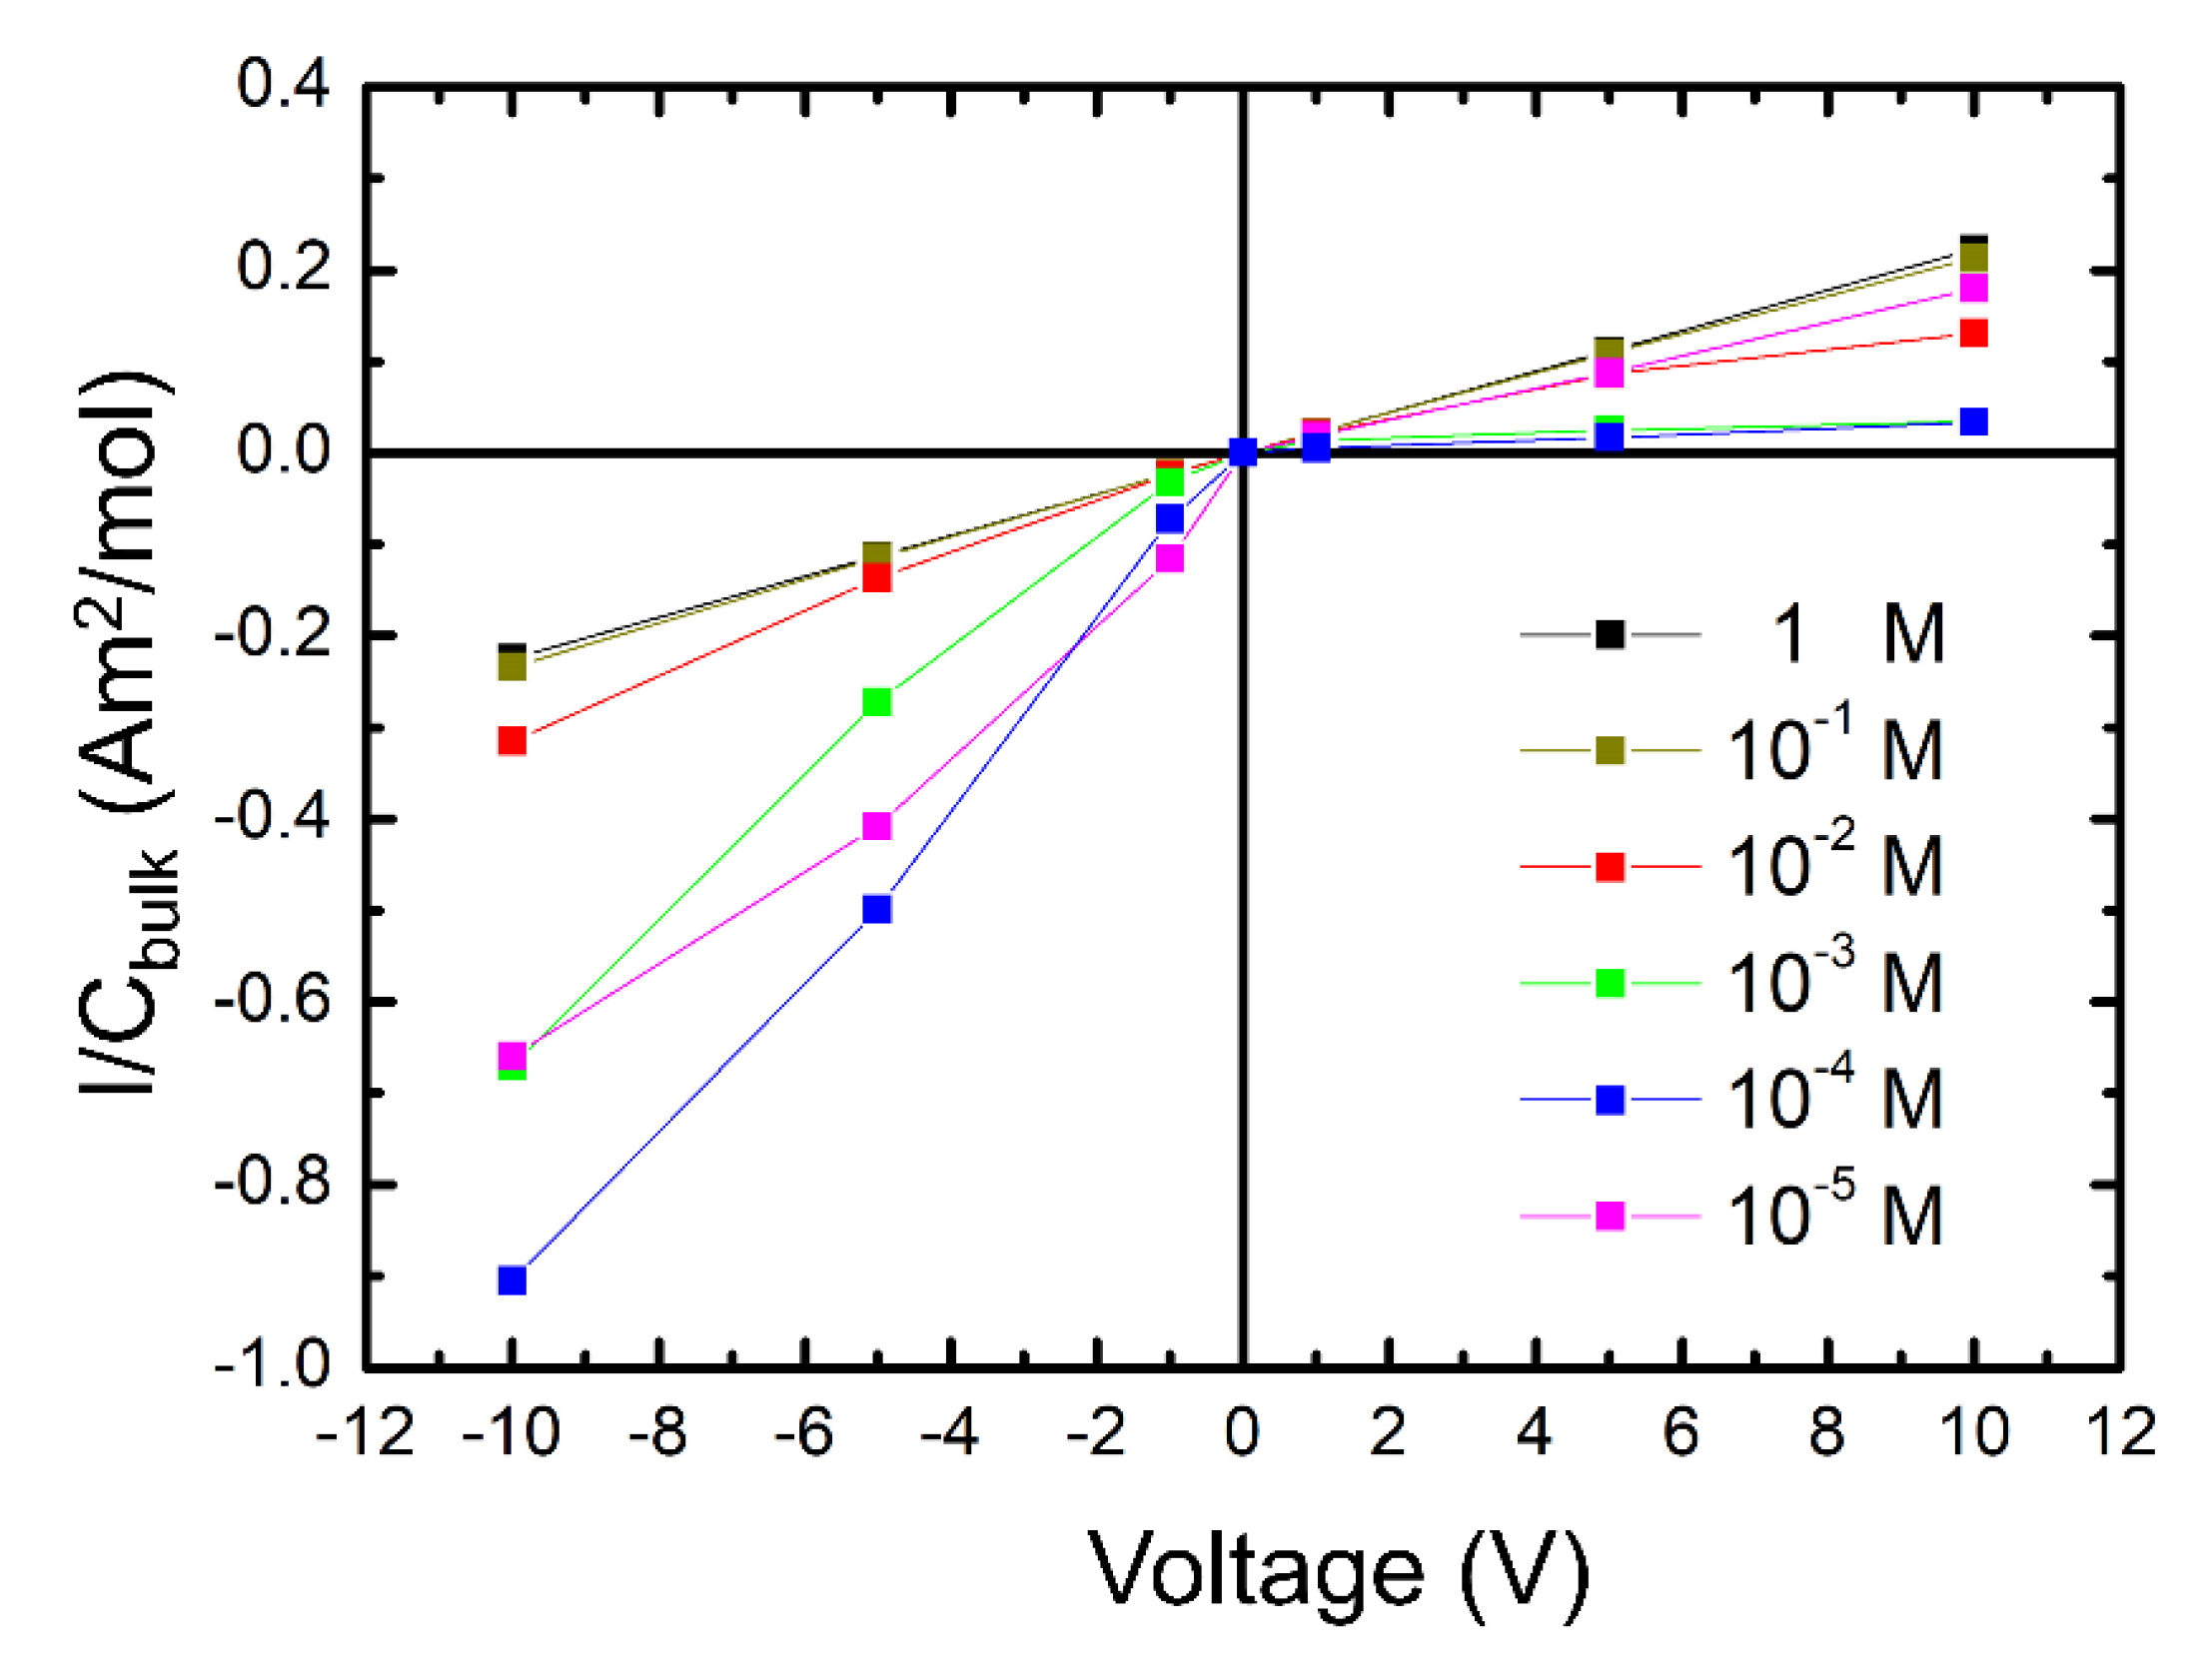
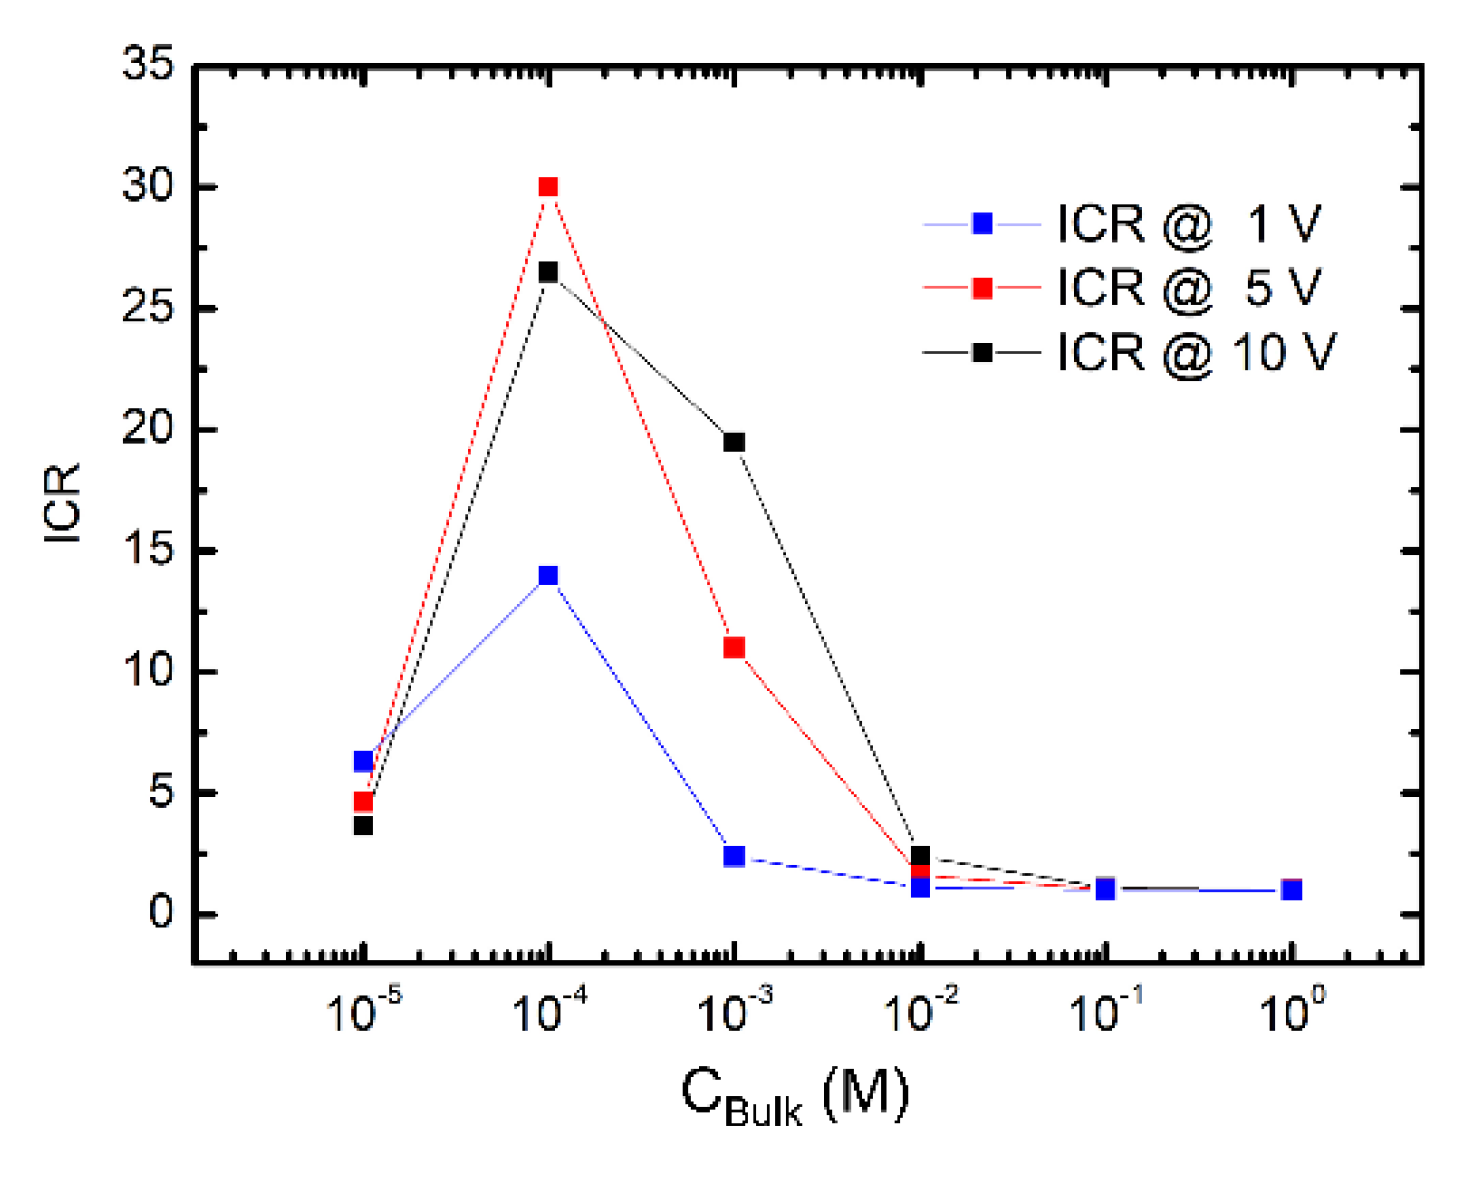
Figure 11 shows the plot of the current as a function of the applied voltage for different molarity of the KCl solutions. The currents have been normalized considering the concentration value in the reservoirs. At high CBulk (1 and 10−1 M, black and dark yellow squares), the plot is symmetric with respect to the origin (i.e., no rectification). At CBulk = 10−2 M (red squares), the rectification effect starts to be visible, whereas at 10−3 M (green squares), the device clearly exhibits the characteristic behavior of a diode and the current flows through the device only for negative voltage. The rectification also occurs at 10−4 M (blue squares), although at high voltage (−10 V) the effect is less pronounced than expected, while it decreases at 10−5 M (magenta squares). The general trend of the ion current rectification ratio (ICR =) is shown in Figure 12. It is clear that the ICR increases by decreasing the solution concentration (from 1 M to 10−4 M). Below a certain concentration, the ICR also depends on the applied voltage, while at CBulk = 1 M, the ICR is about 1 at any VBias, at CBulk = 10−3 M, the ICR is ca. 2.4 at 1 V, 11 at 5 V, and 20 at 10 V. Due to the limiting-current effect, at 10−5 M the ICR drops to a value of ca. 5, independently from the applied voltage. Maxima of the rectification ratio as a function of the concentration were reported in both experimental and theoretical works [38,39,44,55,56,57,58]. A similar behavior was observed by our group in devices with similar geometry [27]. According to Kovarik et al. [57], maxima occur at the bulk concentration at which the pore conductivity starts to differ significantly from the bulk, because of the contribution of surface-associated counterions to the current through the pore. For this bulk concentration, the conductivity of the pore in the “forward state” is significantly higher than in the “reverse state”, resulting in a strong ICR. For lower concentrations, the conductivity values of the pore in the “forward” and “reverse” states are both dominated by the current arising from the surface charge, thus the ICR is weakened.
Interestingly, Liu et al. [43] and Pietschmann et al. [35] calculated ion current rectification for conical structures depending on length (up to 12 µm). They found that if a conical pore is too short, the mechanism of ion-enrichment and depletion is too weak for a significant current rectification effect to occur. Thus, a long funnel grants strong rectification effects.
4. Conclusions
Numerical simulations performed on nearly 90 μm long nanofunnel devices showed the versatile behavior and functional potentialities of such nanofluidic structures. Depending on the applied voltage and the ionic strength, large ion accumulation occurs along a wide area of the funnel, suggesting the use of the device in the field of high sensitivity nanosensors. Moreover, the asymmetric response for positive and negative ions confers to the device the capability of rectifying ionic currents, with a rectification ratio of up to 30 at CBulk = 10−4 M and V = 5 V. These structures represent valuable tools for many fields of application, including ionic circuits. Thus, the simulation strategy that we have reported here is useful for guiding researchers in tuning the features of extra-long nanofunnels and in selecting the proper operating conditions depending on the desired electrokinetic behavior.
Supplementary Materials
The following are available online at https://www.mdpi.com/2076-3417/10/11/3749/s1, description of the equations used in the COMSOL Multiphysics® model, Figure S1: sketch of system geometry used in Comsol for the finite element calculations, Figure S2: description of the mesh used for simulations, Figure S3: comparison between the results obtained by PNP and PNP-NS equation systems, Figure S4: simulations performed considering neutral walls (no surface charge density).
Author Contributions
Conceptualization, D.R., D.P. and E.A.; methodology, D.R. and E.A.; software, D.R.; formal analysis, D.R., D.P. and E.A.; data curation, D.R.; writing—original draft preparation, D.R. and E.A.; writing—review and editing, D.P., P.G. G.F. and L.R.; supervision, L.R. All authors have read and agreed to the published version of the manuscript.
Funding
This research received no external funding.
Conflicts of Interest
The authors declare no conflict of interest.
References
- Abgrall, P.; Nguyen, N. Nanofluidic devices and their applications. Anal. Chem. 2008, 80, 2326–2341. [Google Scholar] [CrossRef] [PubMed]
- Kovarik, M.; Jacobson, S. Nanofluidics in Lab-on-a-Chip Devices. Anal. Chem. 2009, 81, 7133–7140. [Google Scholar] [CrossRef] [PubMed] [Green Version]
- Bocquet, L. Nanofluidics coming of age. Nat. Mater. 2020, 19, 254–256. [Google Scholar] [CrossRef] [PubMed] [Green Version]
- Plecis, A.; Schoch, R.; Renaud, P. Ionic transport phenomena in nanofluidics: Experimental and theoretical study of the exclusion-enrichment effect on a chip. Nano Lett. 2005, 5, 1147–1155. [Google Scholar] [CrossRef] [PubMed]
- Schoch, R.; Han, J.; Renaud, P. Transport phenomena in nanofluidics. Rev. Mod. Phys. 2008, 80, 839–883. [Google Scholar] [CrossRef] [Green Version]
- Dekker, C. Solid-state nanopores. Nat. Nanotechnol. 2007, 2, 209–215. [Google Scholar] [CrossRef]
- Napoli, M.; Eijkel, J.; Pennathur, S. Nanofluidic technology for biomolecule applications: A critical review. Lab A Chip 2010, 10, 957–985. [Google Scholar] [CrossRef]
- Kasianowicz, J.; Brandin, E.; Branton, D.; Deamer, D. Characterization of individual polynucleotide molecules using a membrane channel. Proc. Natl. Acad. Sci. USA 1996, 93, 13770–13773. [Google Scholar] [CrossRef] [Green Version]
- Zhu, Z.; Wang, D.; Tian, Y.; Jiang, L. Ion/Molecule Transportation in Nanopores and Nanochannels: From Critical Principles to Diverse Functions. J. Am. Chem. Soc. 2019, 141, 8658–8669. [Google Scholar] [CrossRef]
- Varongchayakul, N.; Song, J.; Meller, A.; Grinstaff, M. Single-molecule protein sensing in a nanopore: A tutorial. Chem. Soc. Rev. 2018, 47, 8512–8524. [Google Scholar] [CrossRef]
- Wanunu, M. Nanopores: A journey towards DNA sequencing. Phys. Life Rev. 2012, 9, 125–158. [Google Scholar] [CrossRef] [PubMed] [Green Version]
- de la Escosura-Muniz, A.; Merkoci, A. Nanochannels for electrical biosensing. Trac-Trends Anal. Chem. 2016, 79, 134–150. [Google Scholar] [CrossRef] [Green Version]
- Harms, Z.; Mogensen, K.; Nunes, P.; Zhou, K.; Hildenbrand, B.; Mitra, I.; Tan, Z.; Zlotnick, A.; Kutter, J.; Jacobson, S. Nanofluidic Devices with Two Pores in Series for Resistive-Pulse Sensing of Single Virus Capsids. Anal. Chem. 2011, 83, 9573–9578. [Google Scholar] [CrossRef] [PubMed] [Green Version]
- Harms, Z.; Haywood, D.; Kneller, A.; Selzer, L.; Zlotnick, A.; Jacobson, S. Single-Particle Electrophoresis in Nanochannels. Anal. Chem. 2015, 87, 699–705. [Google Scholar] [CrossRef] [Green Version]
- Goyal, G.; Darvish, A.; Kim, M. Use of solid-state nanopores for sensing co-translocational deformation of nano-liposomes. Analyst 2015, 140, 4865–4873. [Google Scholar] [CrossRef]
- Han, J.H.; Kim, K.B.; Kim, H.C.; Chung, T.D. Ionic Circuits Based on Polyelectrolyte Diodes on a Microchip. Angew. Chem. Int. Ed. 2009, 48, 3830–3833. [Google Scholar] [CrossRef]
- Daiguji, H.; Yang, P.; Majumdar, A. Ion transport in nanofluidic channels. Nano Lett. 2004, 4, 137–142. [Google Scholar] [CrossRef]
- Karnik, R.; Duan, C.; Castelino, K.; Daiguji, H.; Majumdar, A. Rectification of ionic current in a nanofluidic diode. Nano Lett. 2007, 7, 547–551. [Google Scholar] [CrossRef]
- Alibakhshi, M.; Liu, B.; Xu, Z.; Duan, C. Geometrical control of ionic current rectification in a configurable nanofluidic diode. Biomicrofluidics 2016, 10, 054102. [Google Scholar] [CrossRef] [Green Version]
- Siwy, Z.; Fulinski, A. Fabrication of a synthetic nanopore ion pump. Phys. Rev. Lett. 2002, 89, 198103. [Google Scholar] [CrossRef]
- Zhang, Y.; Schatz, G.C. Advantages of Conical Pores for Ion Pumps. J. Phys. Chem. C 2017, 121, 161–168. [Google Scholar] [CrossRef]
- Zhang, Y.; Schatz, G.C. Conical Nanopores for Efficient Ion Pumping and Desalination. J. Phys. Chem. Lett. 2017, 8, 2842–2848. [Google Scholar] [CrossRef] [PubMed] [Green Version]
- Zangle, T.A.; Mani, A.; Santiago, J.G. On the Propagation of Concentration Polarization from Microchannel-Nanochannel Interfaces Part II: Numerical and Experimental Study. Langmuir 2009, 25, 3909–3916. [Google Scholar] [CrossRef] [Green Version]
- Zangle, T.A.; Mani, A.; Santiago, J.G. Theory and experiments of concentration polarization and ion focusing at microchannel and nanochannel interfaces. Chem. Soc. Rev. 2010, 39, 1014–1035. [Google Scholar] [CrossRef] [PubMed]
- Ouyang, W.; Ye, X.; Li, Z.; Hang, J. Deciphering ion concentration polarization-based electrokinetic molecular concentration at the micro-nanofluidic interface: Theoretical limits and scaling laws. Nanoscale 2018, 10, 15187–15194. [Google Scholar] [CrossRef] [PubMed] [Green Version]
- Rosentsvit, L.; Wang, W.; Schiffbauer, J.; Chang, H.C.; Yossifon, G. Ion current rectification in funnel-shaped nanochannels: Hysteresis and inversion effects. J. Chem. Phys. 2015, 143. [Google Scholar] [CrossRef] [PubMed]
- Angeli, E.; Pezzuoli, D.; Repetto, D.; Guida, P.; Firpo, G.; Lo Savio, R.; Repetto, L.; Valbusa, U. Junction gap breakdown-based fabrication of PDMS ionic rectifiers. J. Micromechanics Microengineering 2020, 30, 025004. [Google Scholar] [CrossRef]
- Daiguji, H. Ion transport in nanofluidic channels. Chem. Soc. Rev. 2010, 39, 901–911. [Google Scholar] [CrossRef]
- Li, M.; Anand, R.K. Recent advancements in ion concentration polarization. Analyst 2016, 141, 3496–3510. [Google Scholar] [CrossRef] [Green Version]
- Kim, S.; Song, Y.; Han, J. Nanofluidic concentration devices for biomolecules utilizing ion concentration polarization: Theory, fabrication, and applications. Chem. Soc. Rev. 2010, 39, 912–922. [Google Scholar] [CrossRef] [Green Version]
- Siwy, Z.; Howorka, S. Engineered voltage-responsive nanopores. Chem. Soc. Rev. 2010, 39, 1115–1132. [Google Scholar] [CrossRef] [PubMed]
- Stein, D.; Kruithof, M.; Dekker, C. Surface-charge-governed ion transport in nanofluidic channels. Phys. Rev. Lett. 2004, 93, 035901. [Google Scholar] [CrossRef] [PubMed] [Green Version]
- van Oeffelen, L.; Van Roy, W.; Idrissi, H.; Charlier, D.; Lagae, L.; Borghs, G. Ion Current Rectification, Limiting and Overlimiting Conductances in Nanopores. PLoS ONE 2015, 10, e0124171. [Google Scholar] [CrossRef] [PubMed]
- Perry, J.; Zhou, K.; Harms, Z.; Jacobson, S. Ion Transport in Nanofluidic Funnels. ACS Nano 2010, 4, 3897–3902. [Google Scholar] [CrossRef]
- Pietschmann, J.F.; Wolfram, M.T.; Burger, M.; Trautmann, C.; Nguyen, G.; Pevarnik, M.; Bayer, V.; Siwy, Z. Rectification properties of conically shaped nanopores: Consequences of miniaturization. Phys. Chem. Chem. Phys. 2013, 15, 16917–16926. [Google Scholar] [CrossRef] [Green Version]
- Hlushkou, D.; Perry, J.M.; Jacobson, S.C.; Tallarek, U. Propagating Concentration Polarization and Ionic Current Rectification in a Nanochannel-Nanofunnel Device. Anal. Chem. 2012, 84, 267–274. [Google Scholar] [CrossRef]
- Xiao, K.; Xie, G.; Zhang, Z.; Kong, X.; Liu, Q.; Li, P.; Wen, L.; Jiang, L. Enhanced Stability and Controllability of an Ionic Diode Based on Funnel-Shaped Nanochannels with an Extended Critical Region. Adv. Mater. 2016, 28, 3345–3350. [Google Scholar] [CrossRef]
- Schiedt, B.; Healy, K.; Morrison, A.; Neumann, R.; Siwy, Z. Transport of ions and biomolecules through single asymmetric nanopores in polymer films. Nucl. Instrum. Methods Phys. Res. Sect. B Beam Interact. Mater. At. 2005, 236, 109–116. [Google Scholar] [CrossRef]
- Kubeil, C.; Bund, A. The Role of Nanopore Geometry for the Rectification of Ionic Currents. J. Phys. Chem. C 2011, 115, 7866–7873. [Google Scholar] [CrossRef]
- Siwy, Z. Ion-current rectification in nanopores and nanotubes with broken symmetry. Adv. Funct. Mater. 2006, 16, 735–746. [Google Scholar] [CrossRef]
- Nguyen, G.; Vlassiouk, I.; Siwy, Z. Comparison of bipolar and unipolar ionic diodes. Nanotechnology 2010, 21, 265301. [Google Scholar] [CrossRef] [PubMed]
- Ai, Y.; Zhang, M.; Joo, S.; Cheney, M.; Qian, S. Effects of Electroosmotic Flow on Ionic Current Rectification in Conical Nanopores. J. Phys. Chem. C 2010, 114, 3883–3890. [Google Scholar] [CrossRef]
- Liu, Q.; Wang, Y.; Guo, W.; Ji, H.; Xue, J.; Ouyang, Q. Asymmetric properties of ion transport in a charged conical nanopore. Phys. Rev. E 2007, 75, 051201. [Google Scholar] [CrossRef] [PubMed]
- Cervera, J.; Schiedt, B.; Neumann, R.; Mafe, S.; Ramirez, P. Ionic conduction, rectification, and selectivity in single conical nanopores. J. Chem. Phys. 2006, 124, 104706. [Google Scholar] [CrossRef] [PubMed] [Green Version]
- Fu, L.M.; Hou, H.H.; Chiu, P.H.; Yang, R.J. Sample preconcentration from dilute solutions on micro/nanofluidic platforms: A review. Electrophoresis 2018, 39, 289–310. [Google Scholar] [CrossRef]
- Lepoitevin, M.; Ma, T.; Bechelany, M.; Janot, J.; Balme, S. Functionalization of single solid state nanopores to mimic biological ion channels: A review. Adv. Colloid Interface Sci. 2017, 250, 195–213. [Google Scholar] [CrossRef]
- Vlassiouk, I.; Siwy, Z. Nanofluidic diode. Nano Lett. 2007, 7, 552–556. [Google Scholar] [CrossRef]
- Vlassiouk, I.; Kozel, T.; Siwy, Z. Biosensing with Nanofluidic Diodes. J. Am. Chem. Soc. 2009, 131, 8211–8220. [Google Scholar] [CrossRef] [Green Version]
- Wang, C.; Wang, Y.; Zhou, Y.; Wu, Z.; Xia, X. High-performance bioanalysis based on ion concentration polarization of micro-/nanofluidic devices. Anal. Bioanal. Chem. 2019, 411, 4007–4016. [Google Scholar] [CrossRef]
- Park, S.; Yossifon, G. Combining dielectrophoresis and concentration polarization-based preconcentration to enhance bead-based immunoassay sensitivity. Nanoscale 2019, 11, 9436–9443. [Google Scholar] [CrossRef]
- Pezzuoli, D.; Angeli, E.; Repetto, D.; Ferrera, F.; Guida, P.; Firpo, G.; Repetto, L. Nanofluidic-Based Accumulation of Antigens for Miniaturized Immunoassay. Sensors 2020, 20, 1615. [Google Scholar] [CrossRef] [PubMed] [Green Version]
- Pezzuoli, D.; Angeli, E.; Repetto, D.; Guida, P.; Firpo, G.; Repetto, L. Increased Flexibility in Lab-on-Chip Design with a Polymer Patchwork Approach. Nanomaterials 2019, 9, 1678. [Google Scholar] [CrossRef] [PubMed] [Green Version]
- Vlassiouk, I.; Smirnov, S.; Siwy, Z. Ionic selectivity of single nanochannels. Nano Lett. 2008, 8, 1978–1985. [Google Scholar] [CrossRef] [PubMed]
- Villegas, A.; Berardi, D.; Diez, F. Numerical investigation of the current transition regimes in nanochannels. Electrophoresis 2019, 40, 740–747. [Google Scholar] [CrossRef]
- Momotenko, D.; Girault, H.H. Scan-Rate-Dependent Ion Current Rectification and Rectification Inversion in Charged Conical Nanopores. J. Am. Chem. Soc. 2011, 133, 14496–14499. [Google Scholar] [CrossRef] [Green Version]
- White, H.S.; Bund, A. Ion current rectification at nanopores in glass membranes. Langmuir 2008, 24, 2212–2218. [Google Scholar] [CrossRef]
- Kovarik, M.; Zhou, K.; Jacobson, S. Effect of Conical Nanopore Diameter on Ion Current Rectification. J. Phys. Chem. B 2009, 113, 15960–15966. [Google Scholar] [CrossRef]
- Ramirez, P.; Apel, P.; Cervera, J.; Mafe, S. Pore structure and function of synthetic nanopores with fixed charges: Tip shape and rectification properties. Nanotechnology 2008, 19, 315707. [Google Scholar] [CrossRef]
Figure 1.
Sketch of the system geometry used for the FEM calculations. The red numbers correspond to walls with the same boundary conditions.
Figure 1.
Sketch of the system geometry used for the FEM calculations. The red numbers correspond to walls with the same boundary conditions.

Figure 2.
K+ (a) and Cl− (b) ion concentration along the longitudinal section of the funnel and nanochannel as a function of the applied voltage between the reservoirs (CBulk = 1 M = 103 mol/m3).
Figure 2.
K+ (a) and Cl− (b) ion concentration along the longitudinal section of the funnel and nanochannel as a function of the applied voltage between the reservoirs (CBulk = 1 M = 103 mol/m3).

Figure 3.
K+ (a) and Cl− (b) ion concentration along the transversal section at the middle of the nanochannel as a function of the applied voltage between the reservoirs (CBulk = 1 M = 103 mol/m3).
Figure 3.
K+ (a) and Cl− (b) ion concentration along the transversal section at the middle of the nanochannel as a function of the applied voltage between the reservoirs (CBulk = 1 M = 103 mol/m3).

Figure 4.
K+ (red line) and Cl− (dashed blue line) ion concentration along the longitudinal section of the nanochannel as a function of the applied voltage between the reservoirs (CBulk = 1 M = 103 mol/m3).
Figure 4.
K+ (red line) and Cl− (dashed blue line) ion concentration along the longitudinal section of the nanochannel as a function of the applied voltage between the reservoirs (CBulk = 1 M = 103 mol/m3).

Figure 5.
K+ (a) and Cl− (b) ion concentration along the longitudinal section of the funnel and nanochannel as a function of the applied voltage between the reservoirs (CBulk = 10−5 M = 10−2 mol/m3).
Figure 5.
K+ (a) and Cl− (b) ion concentration along the longitudinal section of the funnel and nanochannel as a function of the applied voltage between the reservoirs (CBulk = 10−5 M = 10−2 mol/m3).

Figure 6.
K+ (red line) and Cl− (blue line) ion concentration along the longitudinal section of the nanochannel for different applied voltages: (a) -10 V, (b) -5 V, (c) -1 V, (d) 10 V, (e) 5 V and (f) 1 V, between the reservoirs (CBulk = 10−5 M =10−2 mol/m3).
Figure 6.
K+ (red line) and Cl− (blue line) ion concentration along the longitudinal section of the nanochannel for different applied voltages: (a) -10 V, (b) -5 V, (c) -1 V, (d) 10 V, (e) 5 V and (f) 1 V, between the reservoirs (CBulk = 10−5 M =10−2 mol/m3).

Figure 7.
K+ (a) and Cl− (b) concentrations in the nanochannel at CBulk 10−5 M (10−2 mol/m3), with +1 V applied between the reservoirs.
Figure 7.
K+ (a) and Cl− (b) concentrations in the nanochannel at CBulk 10−5 M (10−2 mol/m3), with +1 V applied between the reservoirs.

Figure 8.
K+ (a) and Cl− (b) ion concentration along the transversal section at the middle of the nanochannel as a function of the applied voltage between the reservoirs (CBulk = 10−5 M = 10−2 mol/m3).
Figure 8.
K+ (a) and Cl− (b) ion concentration along the transversal section at the middle of the nanochannel as a function of the applied voltage between the reservoirs (CBulk = 10−5 M = 10−2 mol/m3).

Figure 9.
C/CBulk (%) for K+ (a,c) and Cl− (b,d) along the longitudinal section of the funnel and nanochannel, calculated for different CBulk with −1 V (a,b) and +1 V (c,d) applied between the reservoirs. (e) Zoom-in of the graph in (c). Note the different scale on the ordinate axis. CBulk: 1 M (black line), 10−1 M (dark yellow), 10−2 M (red), 10−3 M (green), 10−4 M (blue), and 10−5 M (magenta).

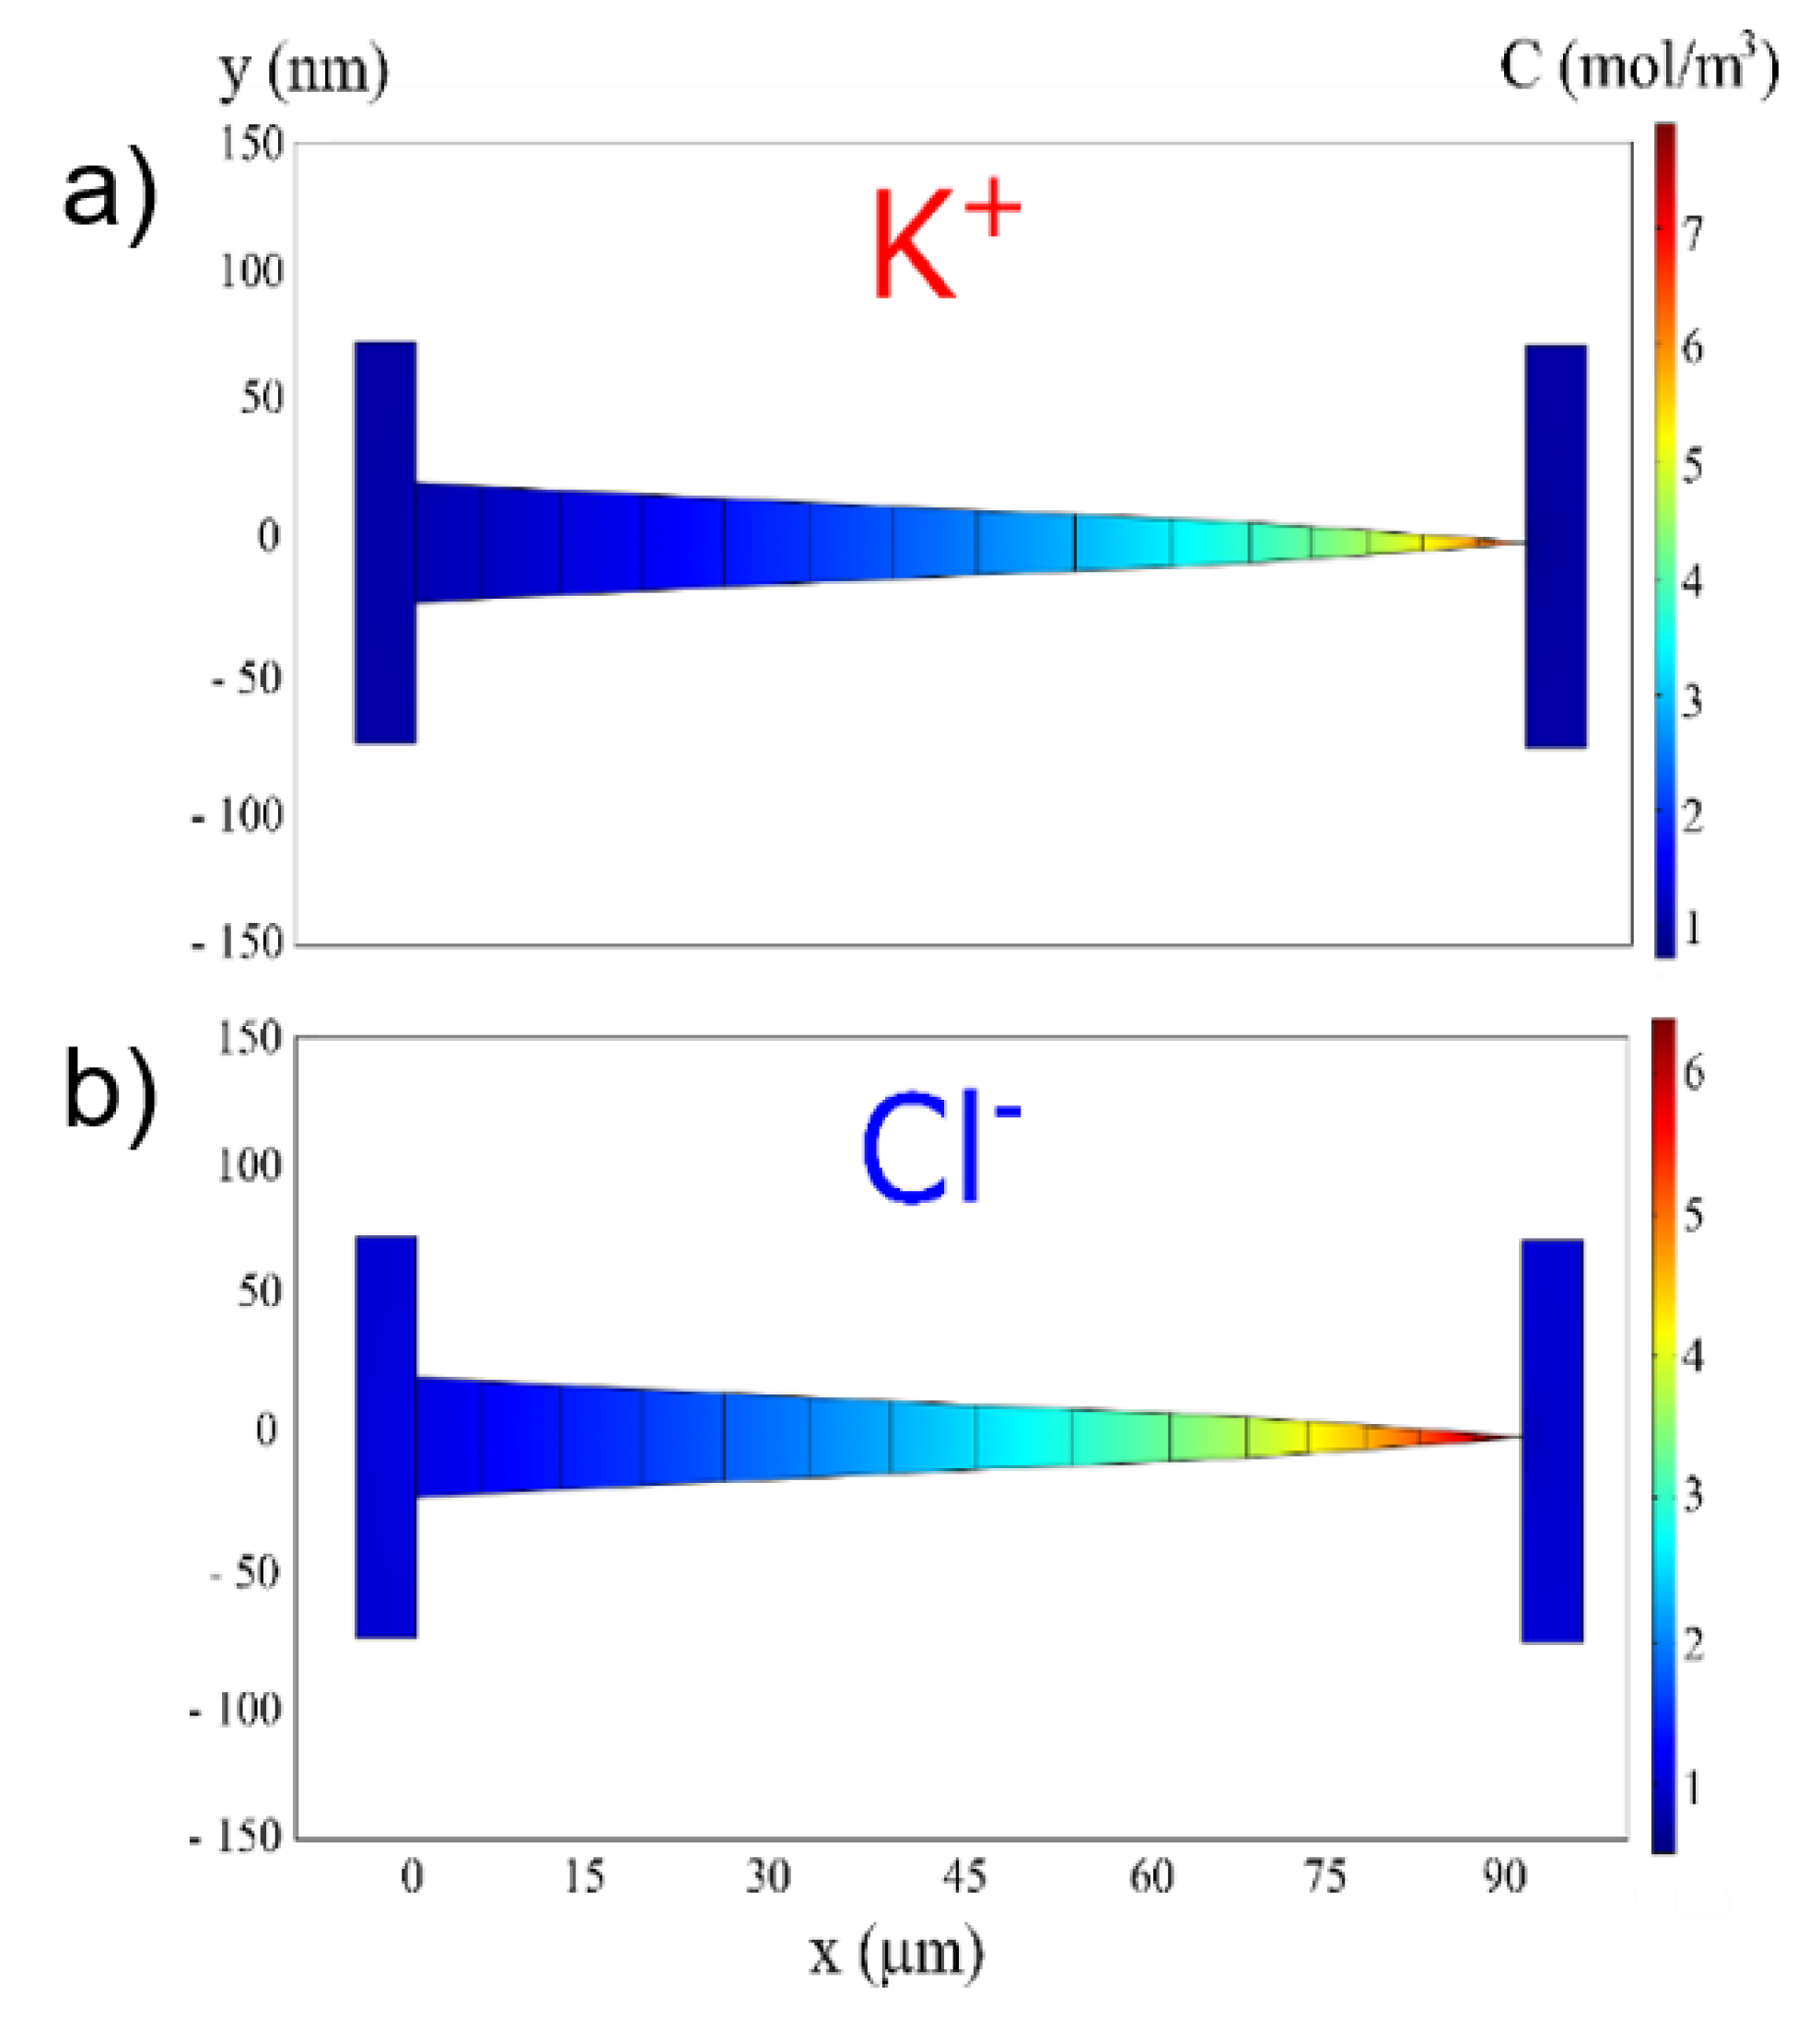
Figure 10.
K+ (a) and Cl− (b) concentrations in the nanofluidic device at CBulk 10−3 M (1 mol/m3), with -10 V applied between the reservoirs. Ion accumulation in the funnel for both ionic charges is clearly visible.
Figure 10.
K+ (a) and Cl− (b) concentrations in the nanofluidic device at CBulk 10−3 M (1 mol/m3), with -10 V applied between the reservoirs. Ion accumulation in the funnel for both ionic charges is clearly visible.

Figure 11.
Current I normalized with respect to CBulk as a function of the applied voltage V for different values of CBulk: 1 M (black squares), 10−1 M (dark yellow), 10−2 M (red), 10−3 M (green), 10−4 M (blue), and 10−5 M (magenta).
Figure 11.
Current I normalized with respect to CBulk as a function of the applied voltage V for different values of CBulk: 1 M (black squares), 10−1 M (dark yellow), 10−2 M (red), 10−3 M (green), 10−4 M (blue), and 10−5 M (magenta).

Figure 12.
Current I normalized with respect to CBulk as a function of the applied voltage V, for different values of CBulk: 1 M (black squares), 10−1 M (pink), 10−2 M (blue), and 10−3 M (red).
Figure 12.
Current I normalized with respect to CBulk as a function of the applied voltage V, for different values of CBulk: 1 M (black squares), 10−1 M (pink), 10−2 M (blue), and 10−3 M (red).

© 2020 by the authors. Licensee MDPI, Basel, Switzerland. This article is an open access article distributed under the terms and conditions of the Creative Commons Attribution (CC BY) license (http://creativecommons.org/licenses/by/4.0/).
Share and Cite
MDPI and ACS Style
Repetto, D.; Angeli, E.; Pezzuoli, D.; Guida, P.; Firpo, G.; Repetto, L. Ion Current Rectification in Extra-Long Nanofunnels. Appl. Sci. 2020, 10, 3749. https://doi.org/10.3390/app10113749
AMA Style
Repetto D, Angeli E, Pezzuoli D, Guida P, Firpo G, Repetto L. Ion Current Rectification in Extra-Long Nanofunnels. Applied Sciences. 2020; 10(11):3749. https://doi.org/10.3390/app10113749
Chicago/Turabian StyleRepetto, Diego, Elena Angeli, Denise Pezzuoli, Patrizia Guida, Giuseppe Firpo, and Luca Repetto. 2020. "Ion Current Rectification in Extra-Long Nanofunnels" Applied Sciences 10, no. 11: 3749. https://doi.org/10.3390/app10113749
Note that from the first issue of 2016, this journal uses article numbers instead of page numbers. See further details here.