Auralization of High-Order Directional Sources from First-Order RIR Measurements


1
Institute of Electronic Music and Acoustics, University of Music and Performing Arts Graz, Inffeldgasse 10/III, 8010 Graz, Austria
2
Institut Jean Le Rond ∂’Alembert, CNRS, UMR 7190, Sorbonne Université, 75005 Paris, France
3
Sciences et Technologies de la Musique et du Son (STMS)—Sorbonne Université, IRCAM, CNRS, 75004 Paris, France
*
Author to whom correspondence should be addressed.
Appl. Sci. 2020, 10(11), 3747; https://doi.org/10.3390/app10113747
Submission received: 17 April 2020
/
Revised: 10 May 2020
/
Accepted: 26 May 2020
/
Published: 28 May 2020
(This article belongs to the Section Acoustics and Vibrations)
Abstract
:Can auralization of a highly directional source in a room succeed if it employs a room impulse response (RIR) measurement or simulation relying on a first-order directional source, only? This contribution presents model and evaluation of a source-and-receiver-directional Ambisonics RIR capture and processing approach (SRD ARIR) based on a small set of responses from a first-order source to a first-order receiver. To enhance the directional resolution, we extend the Ambisonic spatial decomposition method (ASDM) to upscale the first-order resolution of both source and receiver to higher orders. To evaluate the method, a listening experiment was conducted based on first-order SRD-ARIR measurements, into which the higher-order directivity of icosahedral loudspeaker’s (IKO) was inserted as directional source of well-studied perceptual effects. The results show how the proposed method performs and compares to alternative rendering methods based on measurements taken in the same acoustic environment, e.g., multiple-orientation binaural room impulse responses (MOBRIRs) from the physical IKO to the KU-100 dummy head, or higher-order SRD ARIRs from IKO to em32 Eigenmike. For optimal externalization, our experiments exploit the benefits of virtual reality, using a highly realistic visualization on head-mounted-display, and a user interface to report localization by placing interactive visual objects in the virtual space.
1. Introduction
A modular and interactive measurement-based auralization of an acoustic environment benefits from a separation into its source-dependent, room-dependent, and receiver-dependent parts. Typically, the room-dependent part is characterized by a point-to-point room impulse response (RIR), which often assumes that source and receiver are both omnidirectional [1]. However, employing variable source and receiver directivities during auralization requires a more flexible room description that facilitates interfacing between the three parts.
Why source directivity matters: Otondo and Rindel [2] demonstrated that room acoustics parameters change with source directivity, and results from listening experiments indicate that the resulting loudness, reverberance, and clarity changes induced by directivity are perceived by listeners. Vigeant et al. [3] found that including source directivity can increase the realism of auralization results. Latinen et al. [4] showed that the source directivity can be used to alter the direct-to-reverberant ratio, which strongly correlates with perceived distance of a source. Another study employing a source of controllable higher-order directivity by Wendt et al. [5] showed that both the auditory source distance and the apparent source width are influenced by the directivity. Ronsse and Wang [6] found source directivity to modify clarity, localization, and timbre. In terms of localization, Wendt et al. [7] investigated how beam-formed source directivity of an icosahedral loudspeaker (IKO) produces auditory events that can be shifted between physical source and wall reflections, or follow traceable trajectories. Wang and Vigeant [8] demonstrated the influence of source directivity on reverberation time and clarity, and they found a clear effect of source directivity in their auralization experiment.
Why receiver directivity matters: Higher-order receiver directivities have been recently proved useful to characterize room acoustical measurements, see, e.g., in [9,10], and moreover, e.g., to identify the sound field isotropy in various reverberant rooms [11,12]. In the targeted auralization scenario, the receiver is obviously a listener and thus the various sound propagation paths arriving at the ears are weighted by their head related transfer functions (HRTFs). In order to employ an arbitrary receiver directivities during auralization or postprocessing, e.g., individualized HRTFs, the measured room-dependent part also has to be generic and has to facilitate higher-order receiver directivities.
Why we suggest Ambisonics: Directivities are typically measured under anechoic conditions, with a microphone array surrounding the source, or a loudspeaker array surrounding the receiver, respectively. For comparability and a unified directional interpolation, a representation of those directivities in terms of spherical harmonic expansion coefficients is beneficial, see, e.g., in [13,14]. Consequently, a generalized representation of the room-dependent part that interfaces with both the source and receiver directivities should also be expanded in spherical harmonics, i.e. represented in Ambisonics. Furthermore, Oberem et al. [15] found that dynamic binaural rendering (incorporating head rotations) significantly improves localization accuracy. Moreover, using Ambisonics has its benefits in facilitating dynamic rendering efficiently, as it implements dynamic sound scene rotation by a time-variant matrix multiplication [16,17], whereas the convolution with MagLs [18] HRIRs in the spherical harmonics domain remains time-invariant.
SRD ARIR: According to the above considerations, we propose a source-and-receiver-directional (SRD) higher-order Ambisonic room impulse response (ARIR) as representation of the room-dependent parts of auralization. Measuring such a SRD ARIR requires high-order spherical microphone and loudspeaker arrays, which are recently used for room acoustical measurements or propagation path identification [19,20] or as well for studying the concert hall preference [14].
Alternatively to measuring with high-order arrays, we introduced measurements with greatly reduced hardware effort in [21], where first-order source and receiver arrays are employed. The desired higher-order resolution at the receiver is obtained through our Ambisonic spatial decomposition method (ASDM) [22] that is based on Tervo et al. [23]. As an extension involving the source side, we propose the SRD ARIR algorithm that assigns a highly resolved direction of departure (DOD) and direction of arrival (DOA) to each sample of the omnidirectional-source-to-omnidirectional-receiver RIR.
Contents: In this contribution we present the concept and processing steps of a measurement-based auralization for high-order directional sources from hardware-efficient first-order measurements in Section 2. To facilitate an interactive real-time auralization, the source- and receiver-directivities, as well as the SRD ARIR are represented in the Ambisonic domain. The design and implementation of a comparative listening experiment are discussed in Section 3.2. For the sake of reproducibility and generalizability we employed the 20-channel icosahedral loudspeaker array (IKO, https://iko.sonible.com/) as a source with well-described controllable directivity [24]. The five measurement-based auralization techniques under test are described in Section 3.1 and include (i) dummy head BRIR rendering as defined in [22], (ii) rendering with MIMO RIRs as defined in [25], (iii) rendering using multi ASDM RIRs (upscaled for each individual IKO transducer), (iv) rendering using the upscaled SRD ARIR and a generic 3rd order directivity, and (v) rendering using the upscaled SRD ARIR with the real IKO directivity. The underlying measurements were taken in the György Ligeti Saal (V = 5630 , s.). A statistical analysis and discussion of the ratings is given in Section 3.3.
2. Auralization of Arbitrary Source Directivity from Measurements
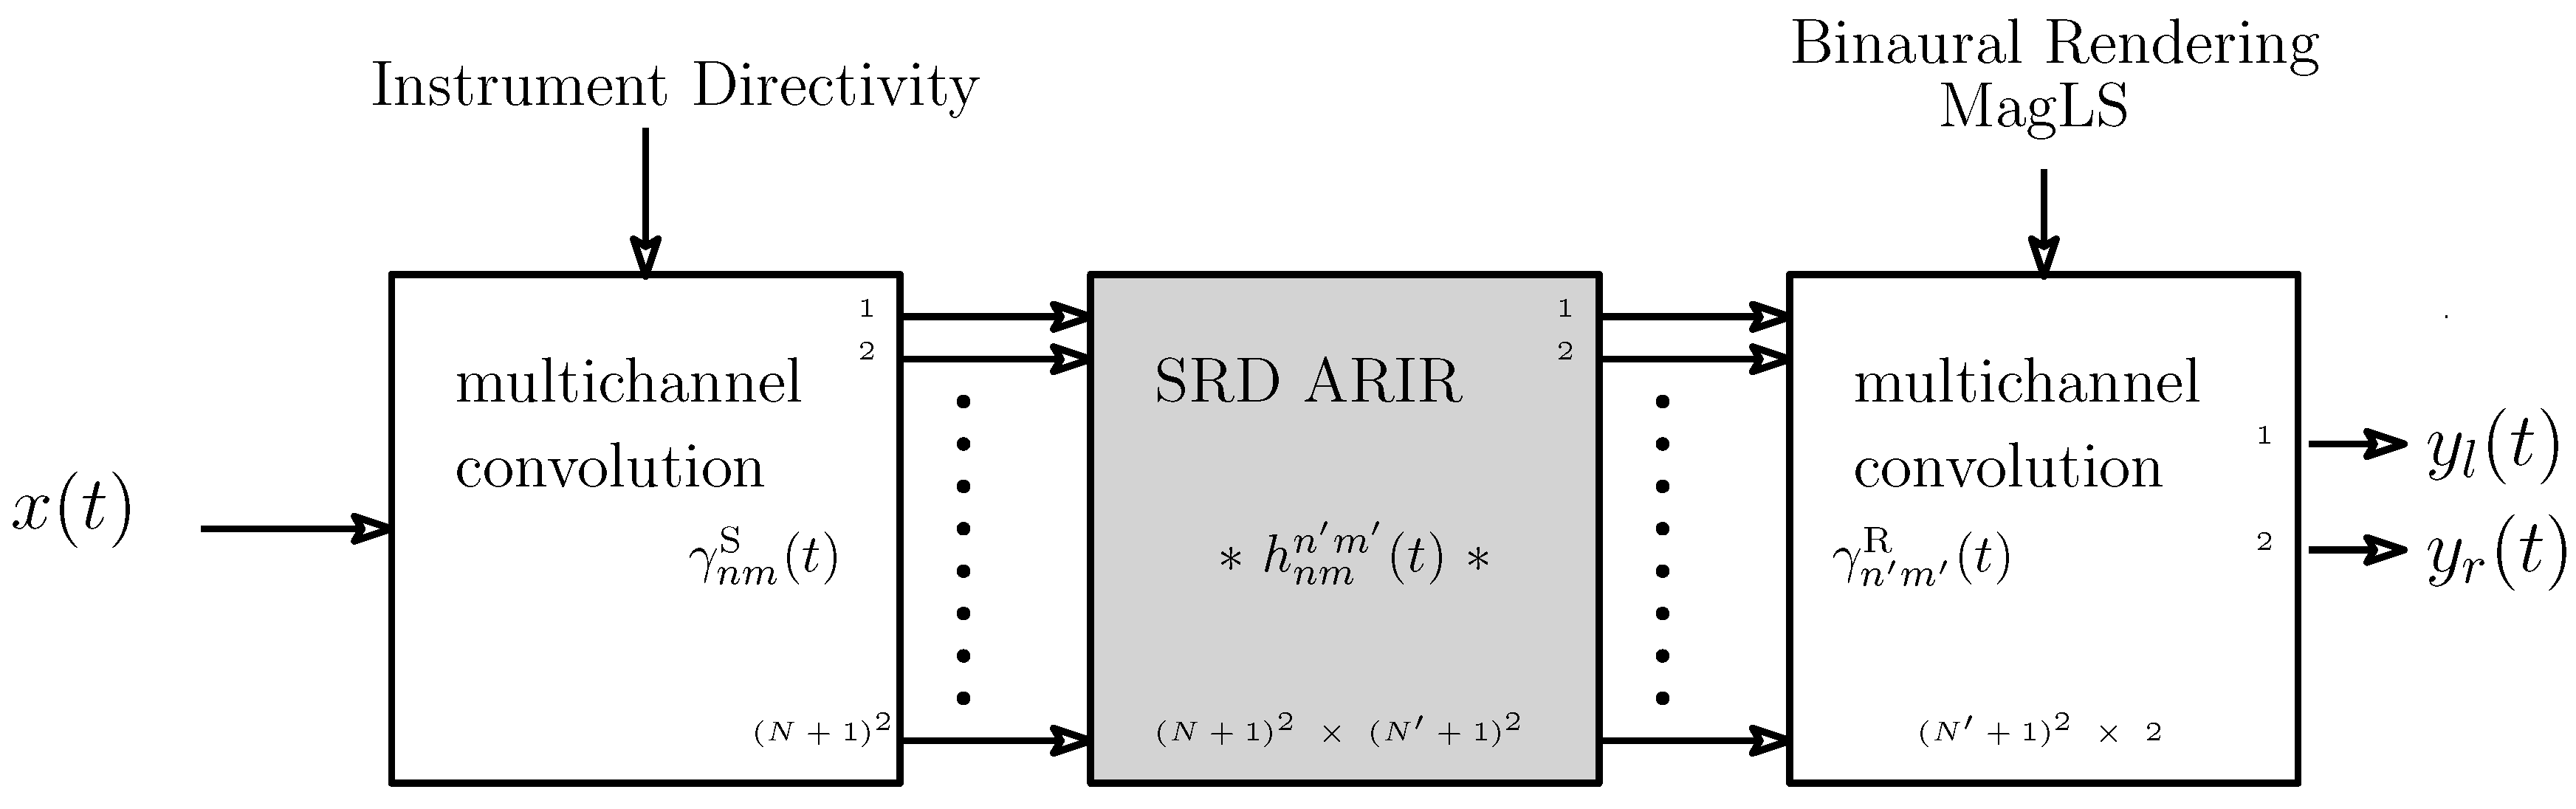
The block diagram of an auralization scenario employing the SRD ARIR is shown in Figure 1 and is similar to that in [26]. Source and receiver directivities are interfaced with the room through Ambisonic input and output signals. Here, the receiver directivity is represented by HRTFs, and a state-of-the-art binaural renderer, e.g., the MagLS renderer as outlined in [18], is used for obtaining the signals that are fed to headphones.
The concept of the SRD ARIR as well as its use for auralization is described in Section 2.1. The proposed hardware efficient (low order) SRD ARIR measurement method and the upscaling to higher orders is discussed in Section 2.2.
2.1. Theory behind Source and Receiver Directional (SRD) RIRs
Based on the image source method [27], or more generally, the geometrical theory of diffraction [28], physically consistent room acoustic models including edge diffraction can be devised based on geometric sound propagation paths, see, e.g., in [29,30,31]. Accordingly, we may write any source-and-receiver-directional room impulse response (SRD RIR) as the sum of discrete propagation paths of the index i
where each path is characterized by a direction of arrival (DOA) and departure (DOD) denoted as and , respectively; an arrival time ; its geometric length ; and its attenuation through reflection and diffraction on rigid or sound-soft surfaces. For complex surface impedances, multiplication by theoretically becomes convolution by an impulse response or it can be expanded to additional paths in discrete-time processing, as preferred here. All vectors describing continuous or discrete directions are denoted as unit direction vectors , with denoting the azimuth and the zenith angle; labels and refer to source or receiver.
We assume a signal that gets emitted by a source with the directivity and gets picked up with the receiver directivity . The resulting signal is described by the convolution with the following impulse response,
The RIR is obtained by weighting the SRD RIR with both the source and receiver directivities and , assuming they are frequency-independent; for frequency-dependent directivities, multiplication by the directivities is replaced by convolutions with the directional impulse responses of source and receiver , respectively.
In the Ambisonic domain: Equation (1) is transformed into the spherical harmonic domain by integrating either dependency on the variable sending and receiving direction over the spherical harmonics. As a result, the spherical delta functions are replaced by spherical harmonics (SH) evaluated at either DOA () or DOD () of the respective propagation path i. We get
where are the SH of order n and degree m, and the expression denotes a modeled source-and-receiver-directional room impulse response in Ambisonics (SRD ARIR), which we actually measure later on (see Section 2.2).
The directivities , can be represented by SH expansion:
where and N are the maximum orders used to represent the receiver and source directivity, respectively. By inserting Equations (3) and (4) into Equation (2), the integrals in Equation (2) invoke the orthogonality property for both source and receiver, yielding a neat sum for the RIR
For natural, frequency-dependent directivities, multiplication by the spherical-harmonic coefficients of the source and receiver directivity and is replaced by convolution with the coefficients of their directional impulse responses and , now in the SH domain.
2.2. Measuring the SRD ARIR: Proposed Method
This section presents the proposed efficient SRD ARIR measurement and postprocessing in detail.
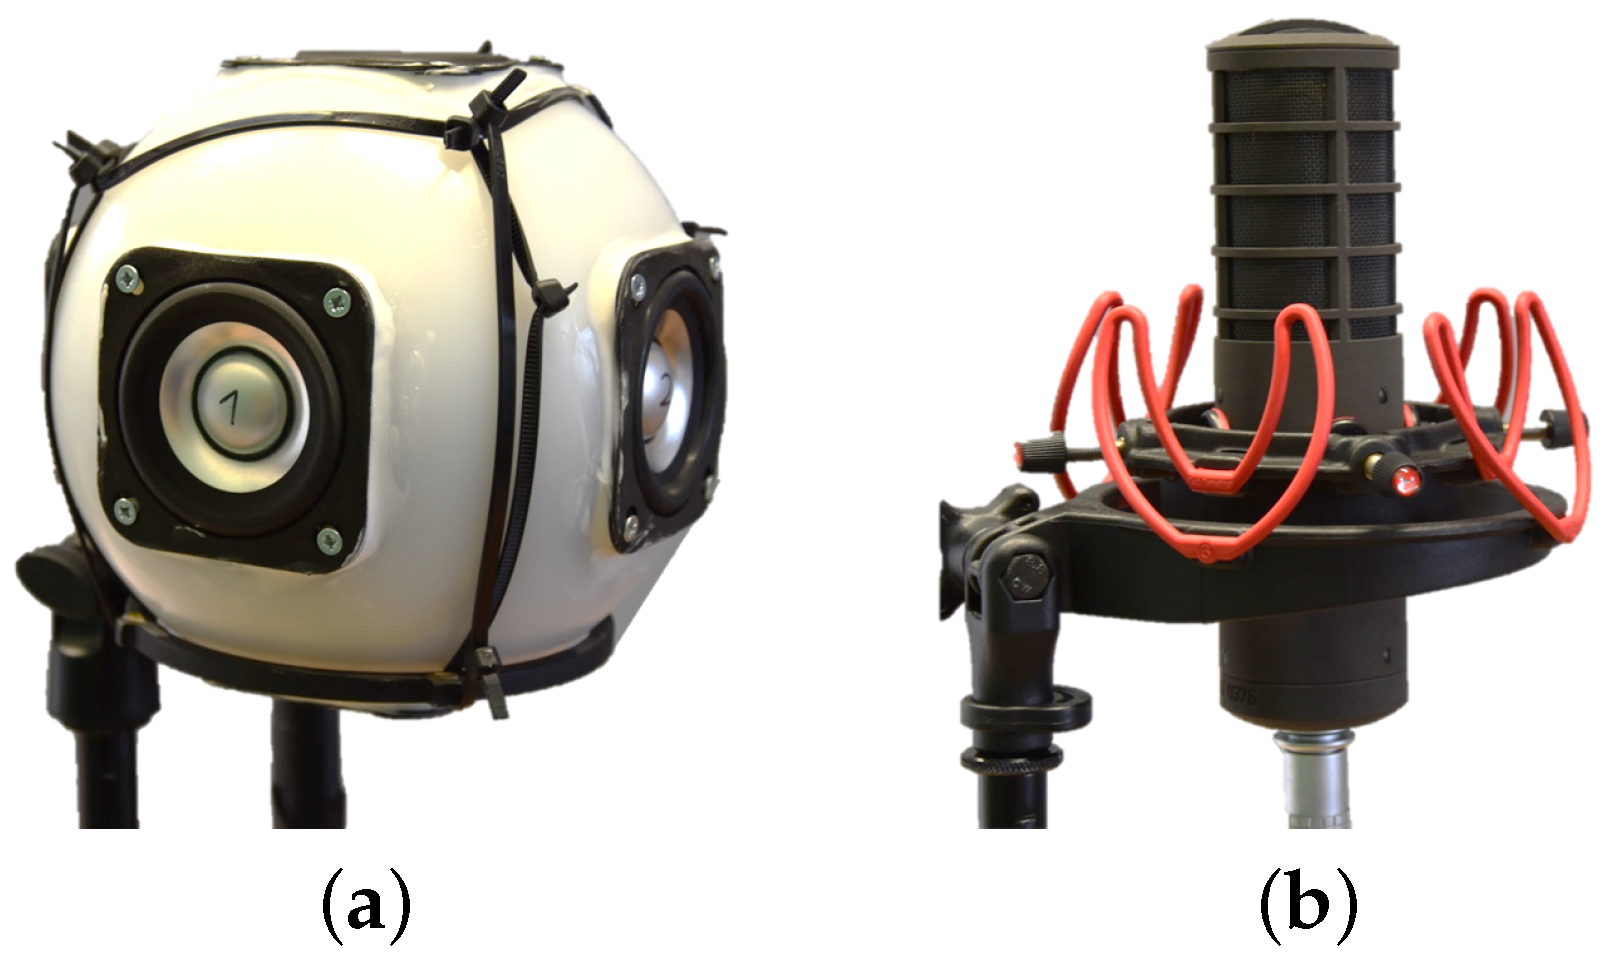
Measuring the MIMO RIRs: Here the multiple input multiple output (MIMO) RIRs are measured between a 6-channel compact spherical loudspeaker array (Cubelet) with a radius of cm and the 4-channel B-format microphone array (ST450), see Figure 2. The loudspeaker array is equipped with Fountek FR58EX drivers (2 inch coil diameter with mm maximum linear excursion). A more detailed description on the used arrays and high-resolution directivity measurements can be found online (https://phaidra.kug.ac.at/o:104374).
Omni to omni RIR: Depending on the array geometries, an approximation of the point-to-point omnidirectional RIR can be obtained by transforming both sides of the MIMO RIRs in the SH-domain and extracting the response between the 0th order components. If the array elements are arranged according to a spherical t-design, an approximate of is obtained summing over all channels in the array domain. Please note that the direct path in is ideally a single impulse. However, due to the non-ideal responses of the loudspeakers and microphones as well as the array geometries, even the direct path will be spread in time. A possible approach for improving the omnidirectional response is outlined in [32], but it is not employed here. A denoising of is optional but recommended when experiencing unrealistic long reverberation times. We suggest a denoising strategy that is similar to [33] and it is derived in the Appendix A.
DOA and DOD estimation: Due to the assumption of a temporally and spatially sparse RIR, we address a direction of arrival (DOA) and direction of departure (DOD) to each discrete time instance t of . While due to reciprocity any DOA estimation method, e.g., as summarized in [34], can be employed for both DOA and DOD estimation, we use the pseudo intensity vector approach (PIV) as presented by Jarrett et al. [35] for the DOA and an -vector measure [36] related to the magnitude sensor response (MSR) by Politis et al. [37] for determining the DOD.
The DOAs are calculated for the frequencies between and . Here, the upper frequency limit is chosen below the spatial aliasing frequencies kHz for cm (defined by ). For the estimation of the DODs, a less restrictive rule is assumed, as it is less affected by linear interference. Here, the upper frequency limit is kHz for cm (inter-transducer arc length roughly below half a wavelength ). The low cut at Hz minimizes low-frequency disturbance in both the DOA and DOD estimation, respectively. DODs and DOAs become
where indicates the direction of the p-th loudspeaker, is the number of array loudspeakers, the RIR between the p-th loudspeaker and the W channel of the ST450 array, is the norm operator, and are the first-order channels of the ST450 microphone array. Both the DOA and DOD are computed using a zero-phase band limitation (e.g., by MATLAB’s filtfilt with a 4th-order Butterworth band pass) denoted by and a zero-phase temporal smoothing of the resulting estimates using a moving-average Hann window in the interval for .
SRD ARIR: From Equation (3), and assuming a single propagation path at a time (i.e., assuming temporal disjointness), a first version of the upscaled SRD ARIR becomes
where the maximum orders and can be chosen freely. The multiplication of the omnidirectional RIR with the SH representations of and directionally sharpens the measured SRD ARIR, accordingly. However, the implicit assumption of disjointness (there being only a single DOA and DOD per time sample) is not necessarily true in the late diffuse part of the response. As a result, the temporal fluctuations of and cause amplitude modulation that potentially corrupt narrow-band spectral properties in . A typical result thereof is a mixing of the longer low-frequency reverberation tails towards higher frequencies, causing unnaturally long reverberation there [21,38], especially as the orders increase. We propose a scheme for spectral correction which is similar to the one in [38] but adopted for SRD ARIR processing.
In theory, the expected temporal energy decay in an ideal (isotropic) diffuse field should be identical for any source and receiver of random-energy-efficiency-normalized directivity such as the spherical harmonics; this must hold also after decomposition into frequency bands. However, less restrictively, even in non-isotropic diffuse fields, the expected energy decay is identical for subsets of source and receiver directivities that are (pseudo-)omnidirectional: Formal derivation in [38] showed that quadratic summation across same-order spherical harmonics is omnidirectional. Thus, from Equation (8) and with the Unsöld’s Theorem [39] for we obtain consistent powers of processed and original RIRs
To moreover enforce the short-term energies in to become spectrally consistent with those of , third-octave filtering is useful, where the bth sub-band signal with center frequency is obtained from a bank of zero-phase filters that is perfectly reconstructing . For every sub-band b and the orders , an energy decay of the upscaled SRD ARIR consistent with the original one of is enforced by envelope correction
where denotes temporal averaging with a time constant T (e.g., 46 ms).
The simplified Matlab source code of the proposed SRD ARIR method can be found in Appendix B.
3. Listening Experiment—Comparative Study
Due to the well-studied perceptual effects [5,7], its well-defined third-order beamforming [24], and its already available high resolution directivity measurements, see, e.g., in [13], the icosahedral loudspeaker (IKO) is employed as the source with controllable directivity throughout the listening experiment. The experiment itself aimed at evaluating the authenticity and perceived externalized localization achieved with the proposed SRD ARIR method, and to compare it with other auralization techniques. The tested five measurement-based auralization techniques (virtualization of the IKO) are described in Section 3.1. An overview of the design and implementation of the listening experiment is presented in Section 3.2 and insights on the statistical analysis of ratings and the corresponding results are presented in Section 3.3.
All underlying measurement data, a short description of the measurement set-up, directivity measurements, and response data as well as the evaluation of the listening experiment are made available online (https://phaidra.kug.ac.at/o:104417).
3.1. Auralization Techniques—Virtualizations of the IKO
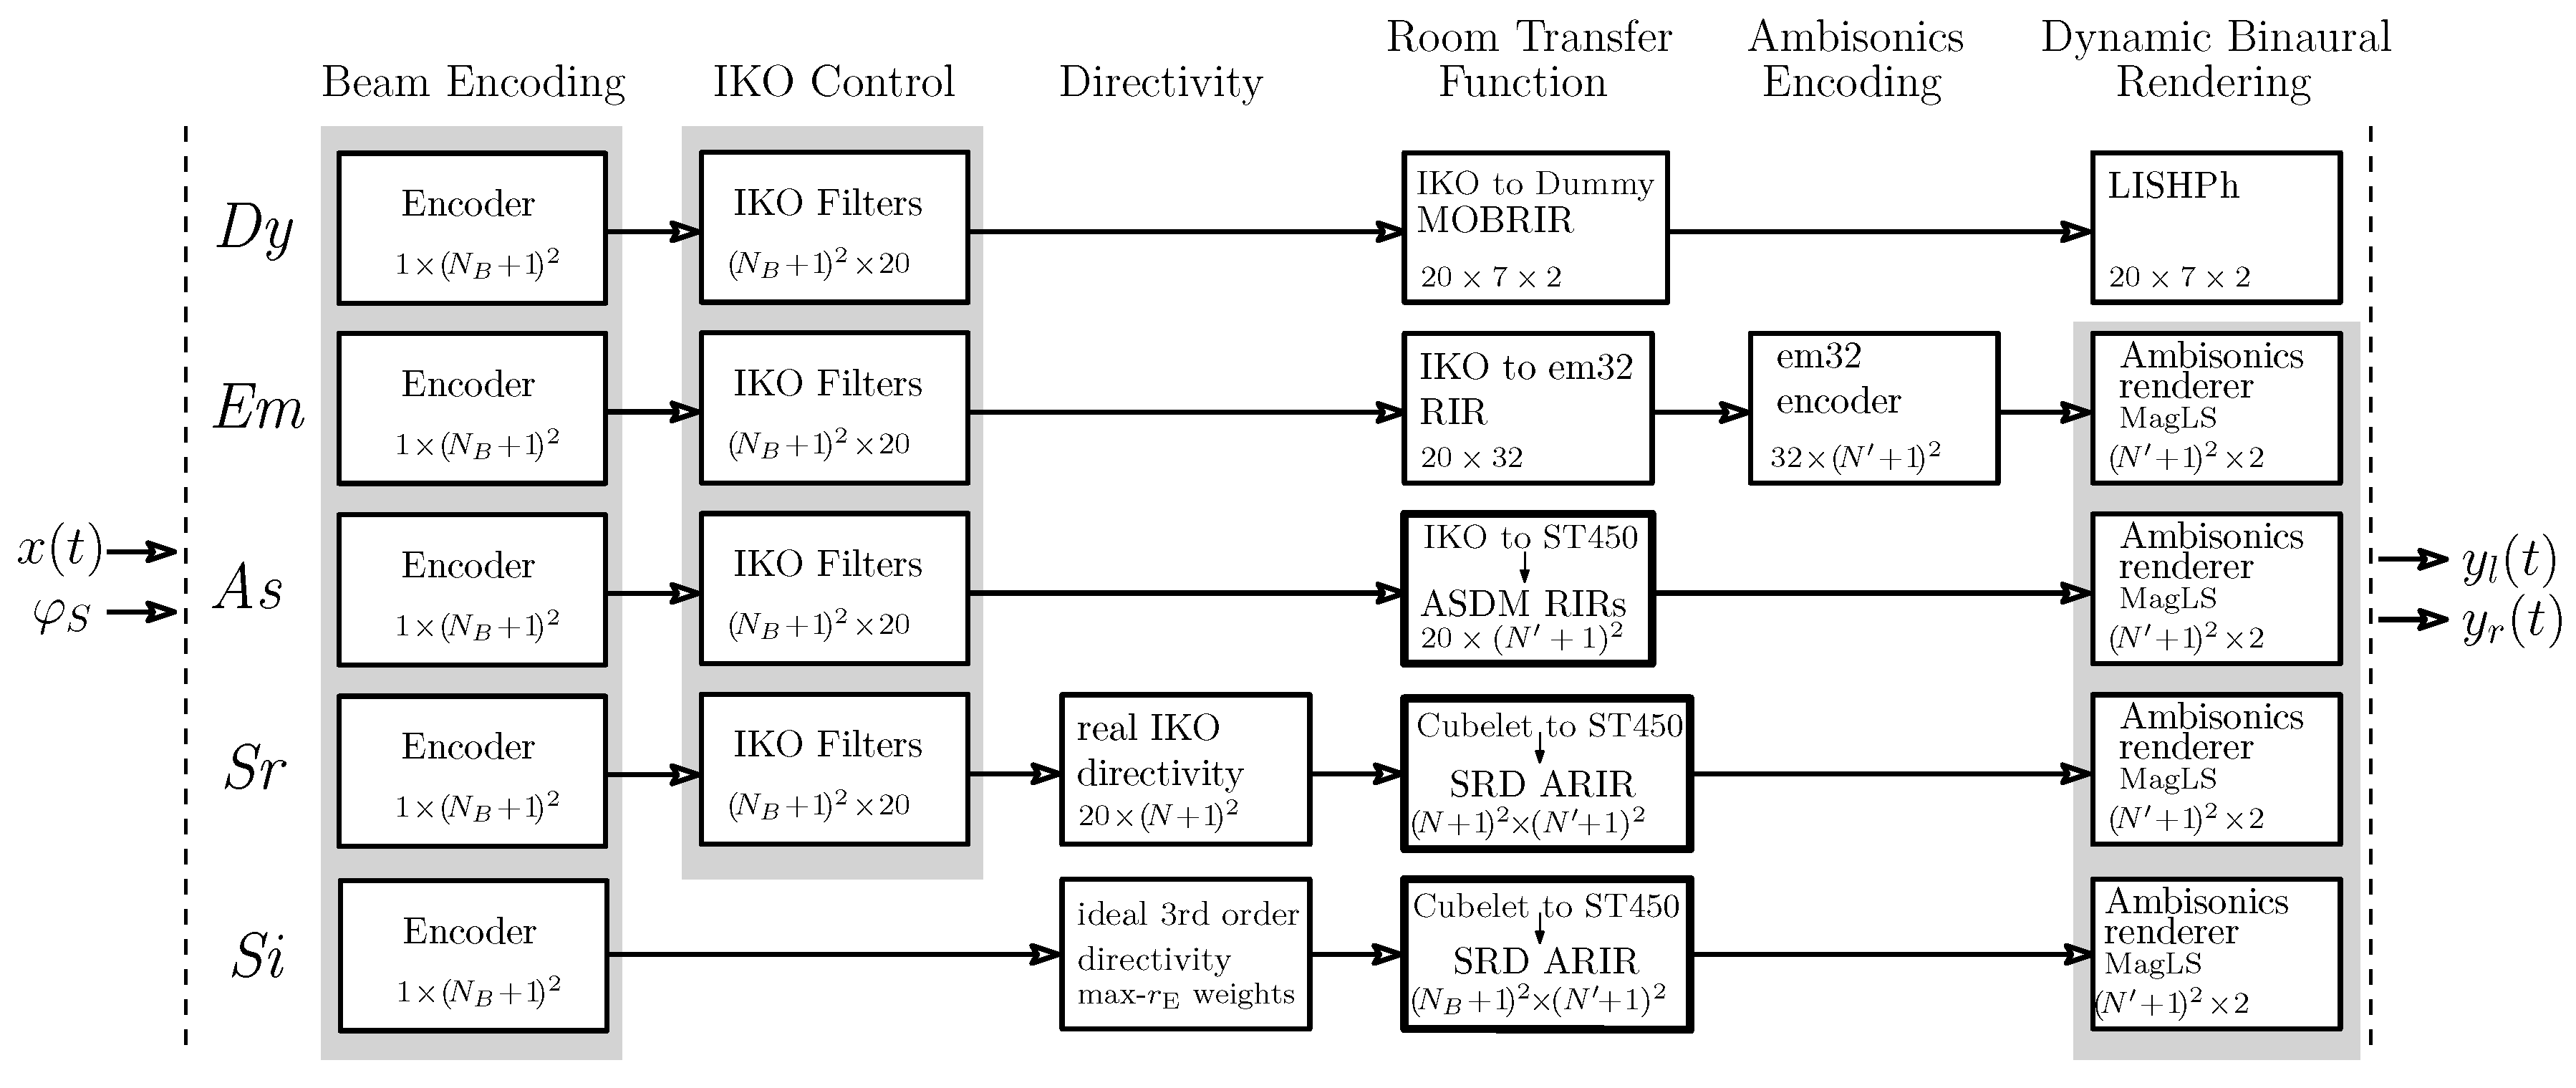
As acoustic virtualizations of the IKO, we compared five different auralization techniques in the listening experiment. The block diagram in Figure 3 depicts these techniques and their details are given below. The ear signals and are obtained by running the source signal through several processing stages. Those stages include (i) beam encoding, (ii) IKO control, (iii) directivity, (iv) room transfer function, (v) Ambisonics encoding, and finally (vi) the dynamic binaural rendering.
With the source signal and the desired beam direction , the frequency independent encoder outputs the order Ambisonics representation of the beam. The processing in the Beam Encoding stage is independent of the auralization technique.
In the IKO Control stage the channels are mapped to 20 loudspeaker signals of the IKO using the frequency-dependent IKO Filters. A measurement based approach for designing the multiple-input multiple-output (MIMO) IKO control filters is presented in [40]. It is based on laser Doppler vibrometry measurements and allows for control of side-lobe suppression and excursion-limiting filter design. The designed beam patterns were verified by far-field extrapolated measurements from a surrounding microphone array. The IKO’s beamforming can be analyzed by using the open source tool balloon_holo, which is part of IEM’s Open Data Project (https://opendata.iem.at/projects/dirpat/). All underlying measurements (laser Doppler vibrometry and pressure of a surrounding microphone array) as well as the corresponding IKO Filters can be found online (https://phaidra.kug.ac.at/o:67609) and a summary is presented in [13]; here, we used the IEM IKO3 (https://phaidra.kug.ac.at/o:75316).
In the latest stage, Dynamic Binaural Rendering of the Ambisonic scene is obtained by a convolution of the rotated Ambisonic signals with any state-of-the-art FIR binaural Ambisonic renderer. Here, we employ the time-invariant filters of the MagLS (magnitude-least-squares) renderer (The MagLS renderer is part of the IEM plugin suite which can be found here https://plugins.iem.at/) defined in [18,41] to get high-quality Ambisonic rendering already with an order as low as . The perceptual quality improvement of these filters is achieved by using a magnitude-least-squares optimization that disregards phase match in favor of an improved HRTF magnitude at high frequencies. MagLS as outlined in [18,36] also includes an interaural covariance correction that offers an optimal compromise for consistently rendering diffuse fields.
All other processing stages are rather specific per auralization technique and are therefore described separately below.
Dummy head BRIR-based (Dy): The Directivity and the Room Transfer Function are inherent in the directly measured multiple orientation BRIRs (MOBRIRs) between each loudspeaker of the IKO and the KU100 (https://en-de.neumann.com/ku-100) dummy head. Here, we used an orientation resolution of on an interval between to obtain the MOBRIRs and the data is available online (https://phaidra.kug.ac.at/o:104386). The Dy technique, the Dynamic Binaural Rendering is achieved by the linear interpolation with switched high frequency phase (LISHPh) method as described in [42]. In accordance with the findings in [22], setting the crossover , , and allows for high-quality BRIR-based binaural rendering, and thus this condition is used as a perceptual target in the study. The processing steps of the reference auralization are shown in the top row of the block diagram in Figure 3. Although the auralization quality (audio quality and spatial mapping) of the Dy technique is expected to be high, the measurement effort for the multiple orientations is somewhat enlarged, and the specific dummy head HRIRs cannot be exchanged unless multi-orientation measurement are repeated with other receivers, dummy heads, or individual subjects, separately.
IKO to em32 MIMO RIR (Em): Here, the Directivity and the Room Transfer Function are represented by the measured array domain MIMO RIRs between the 20 IKO loudspeakers and the 32 microphones of the em32 (https://mhacoustics.com/products). The resulting em32 signals are transformed in the Ambisonics domain using the state-of-the-art encoder presented in [36,40] and are finally binaurally rendered. An evaluation of this specific auralization technique can be found in [25] and the inherent processing stages are depicted in the second row of Figure 3. The underlying MIMO RIRs are accessible online (https://phaidra.kug.ac.at/o:104385). Measuring with the em32 or other higher-order compact spherical microphone arrays increases the hardware effort in terms of channel counts, but permits modular exchange of the receiver directivities or HRIRs, and achieves a native higher-order resolution at the receiver side. Further resolution enhancement by HOSIRR [43] is thinkable but was not used here.
Multi ASDM RIRs (As): This approach employs the first-order tetrahedral ST450 microphone array at the receiver side for measuring the (IKO to ST450) MIMO RIRs, which are available online (https://phaidra.kug.ac.at/o:104384). However, the MIMO RIRs are not used directly as the representation of the Directivity and Room Transfer Function. In a processing stage, the Ambisonic Spatial Decomposition Method (ASDM) [22] is applied to every transducer of the source array; here, the IKO, and the resulting upscaled ASDM RIRs, are eventually used for auralization. This permits a modular exchange of the receiver directivity or HRIRs while keeping the hardware effort at the receiver side minimal. Note that the multi ASDM method is a special form of the SRD ARIR approach, cf. assuming a fixed directivity at the source (the individual loudspeaker) and setting in Equation (5).
SRD ARIR and real IKO (Sr): The SRD ARIR method as proposed in Section 2 only requires first-order loudspeaker and microphone arrays for measuring the Room Transfer Function, on the source and receiver sides respectively. Thus, the SRD method is rather hardware efficient with a theoretical minimum of 4 channels for the source and the receiver. Here we used our 6-channel Cubelet and the tetrahedral ST450 as source and receiver arrays, respectively. Note that the first-order RIR measurements (https://phaidra.kug.ac.at/o:104376) as well as high resolution directivity measurements of the Cubelet are available online (https://phaidra.kug.ac.at/o:104374).
In a next processing step, the resolution is upscaled from first order to any higher order, see Equation (8) and the detailed description throughout Section 2.2. Therefore, both the source and receiver side are modular and permit exchange with any directivity pattern. In the experiment we inserted KU100 HRIRs with 5th order resolution of a MagLS decoder [18], and at the source side the true measured directivity of the IKO are used. The Directivity of the 20 loudspeakers is represented using an order N representation of the directional IRs from every loudspeaker to every microphone of a surrounding microphone array. We use IRs measured using an equiangular grid of zenith and azimuth angles, respectively. With 648 sampling points on the sphere we set . The high resolution directional IRs of the IKO are available online (https://phaidra.kug.ac.at/o:75316).
SRD ARIR and ideal 3rd-order directivity (Si): While the Room Transfer Function is represented by a SRD ARIR as well (same as for Sr), the source Directivity is assumed to be an ideal 3rd-order directivity instead of the real IKO, here. Thus, the directivity is synthesized by multiplying the encoded signals with a frequency-independent diagonal matrix containing the max- weights [44,45] up to order .
3.2. Design and Implementation
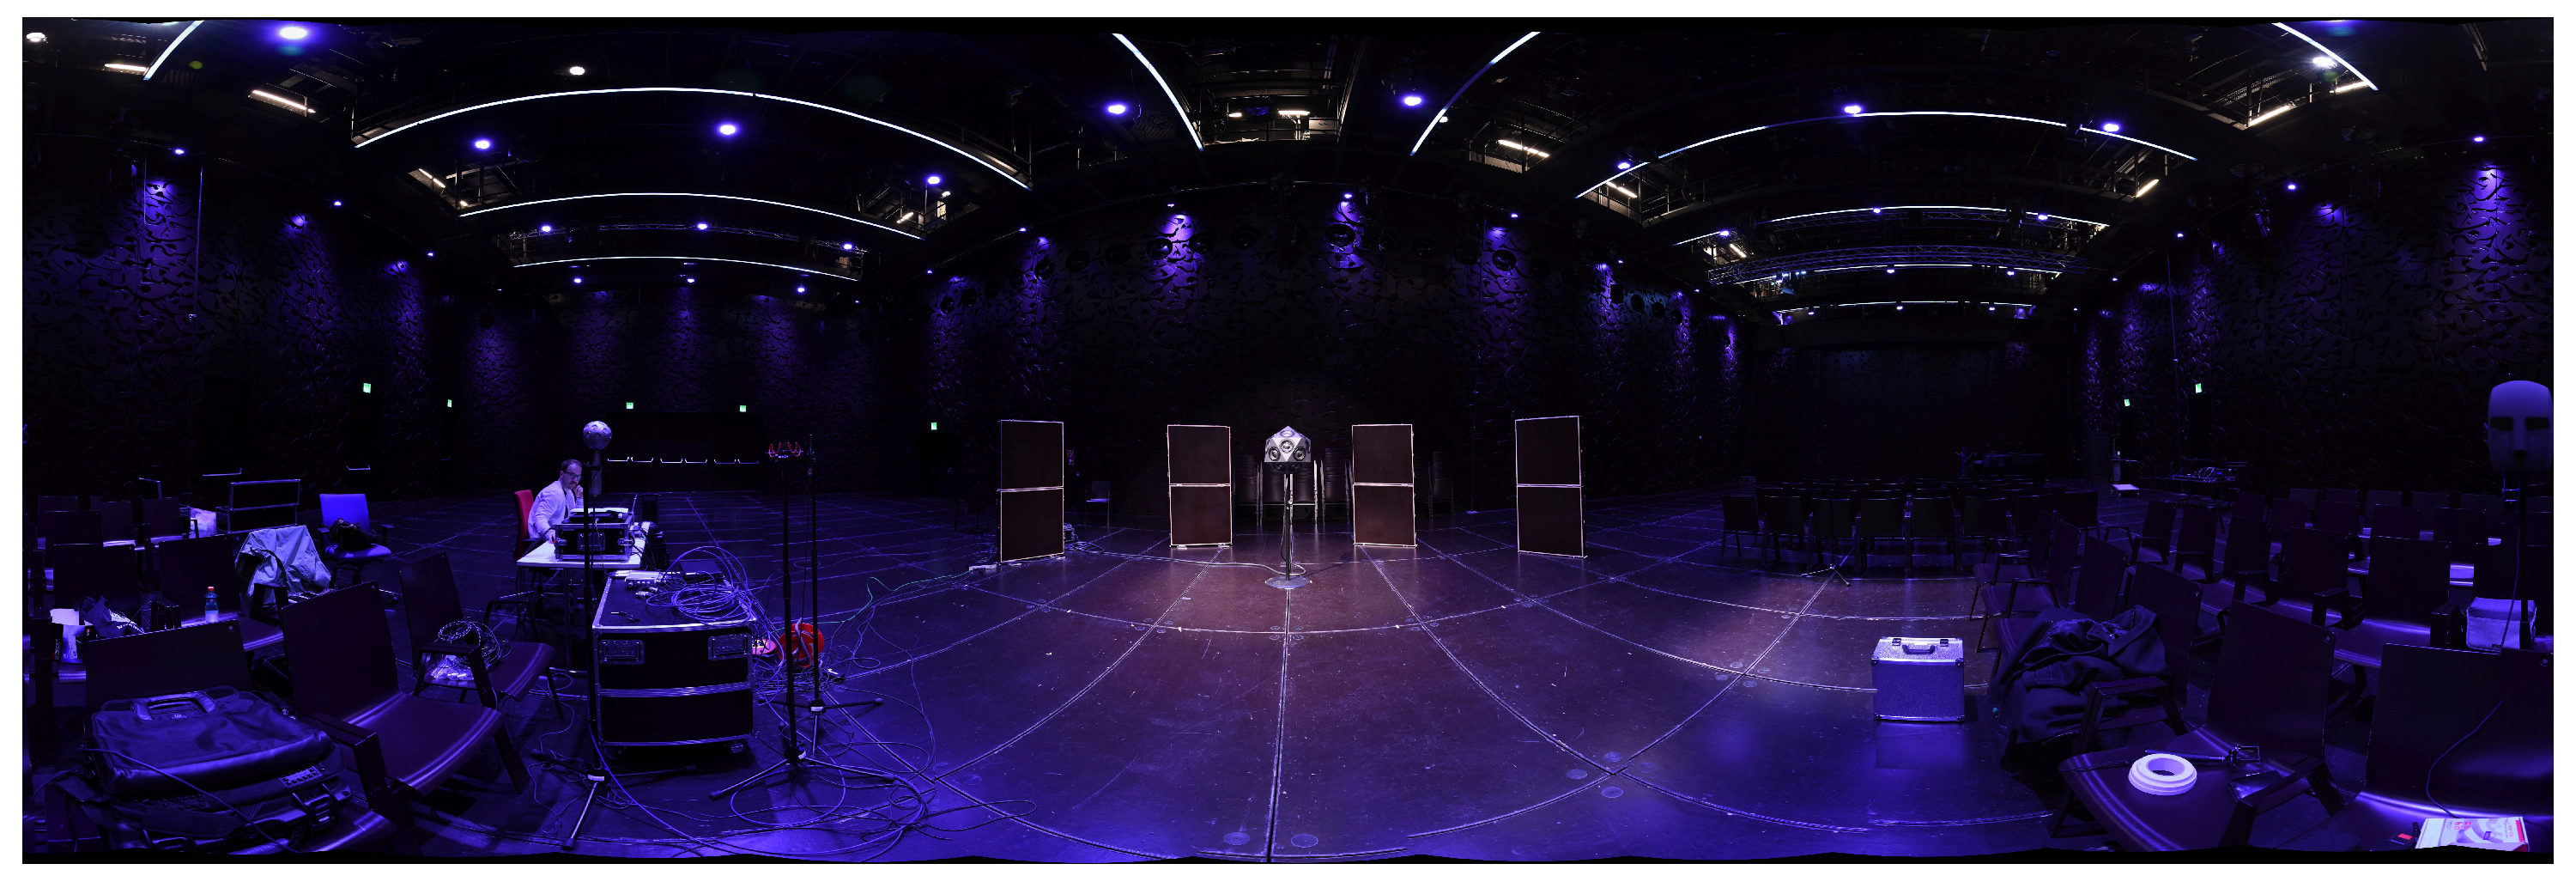
Measurements: The underlying measurements are done in the György Ligeti Saal (, ) in Graz, Austria. Figure 4 shows a panoramic photo of the measurement setup and Figure 5 the layout of source, receiver, and the locations of the four reflecting baffle ( m) positions. Source and receiver were aligned quasi-parallel to the shorter side walls of the room, are facing each other, and are apart. The source–receiver distance approximately corresponds to the critical distance () when assuming an omnidirectional source, and thus is considered generally interesting. As test signal we used interleaved and exponentially swept sines with a length of . The measured source and receiver configurations included (i) MOBRIRs (https://phaidra.kug.ac.at/o:104386) between the IKO and multiple dummy head orientations (measurements for Dy), (ii) MIMO RIRs (https://phaidra.kug.ac.at/o:104385) between the IKO and the em32 (measurements for Em), (iii) MIMO RIRs (https://phaidra.kug.ac.at/o:104384) between the IKO and ST450 (measurements for As), and (iv) MIMO RIRs (https://phaidra.kug.ac.at/o:104376) between the Cubelet and the ST450 (measurements for Sr, and Si).
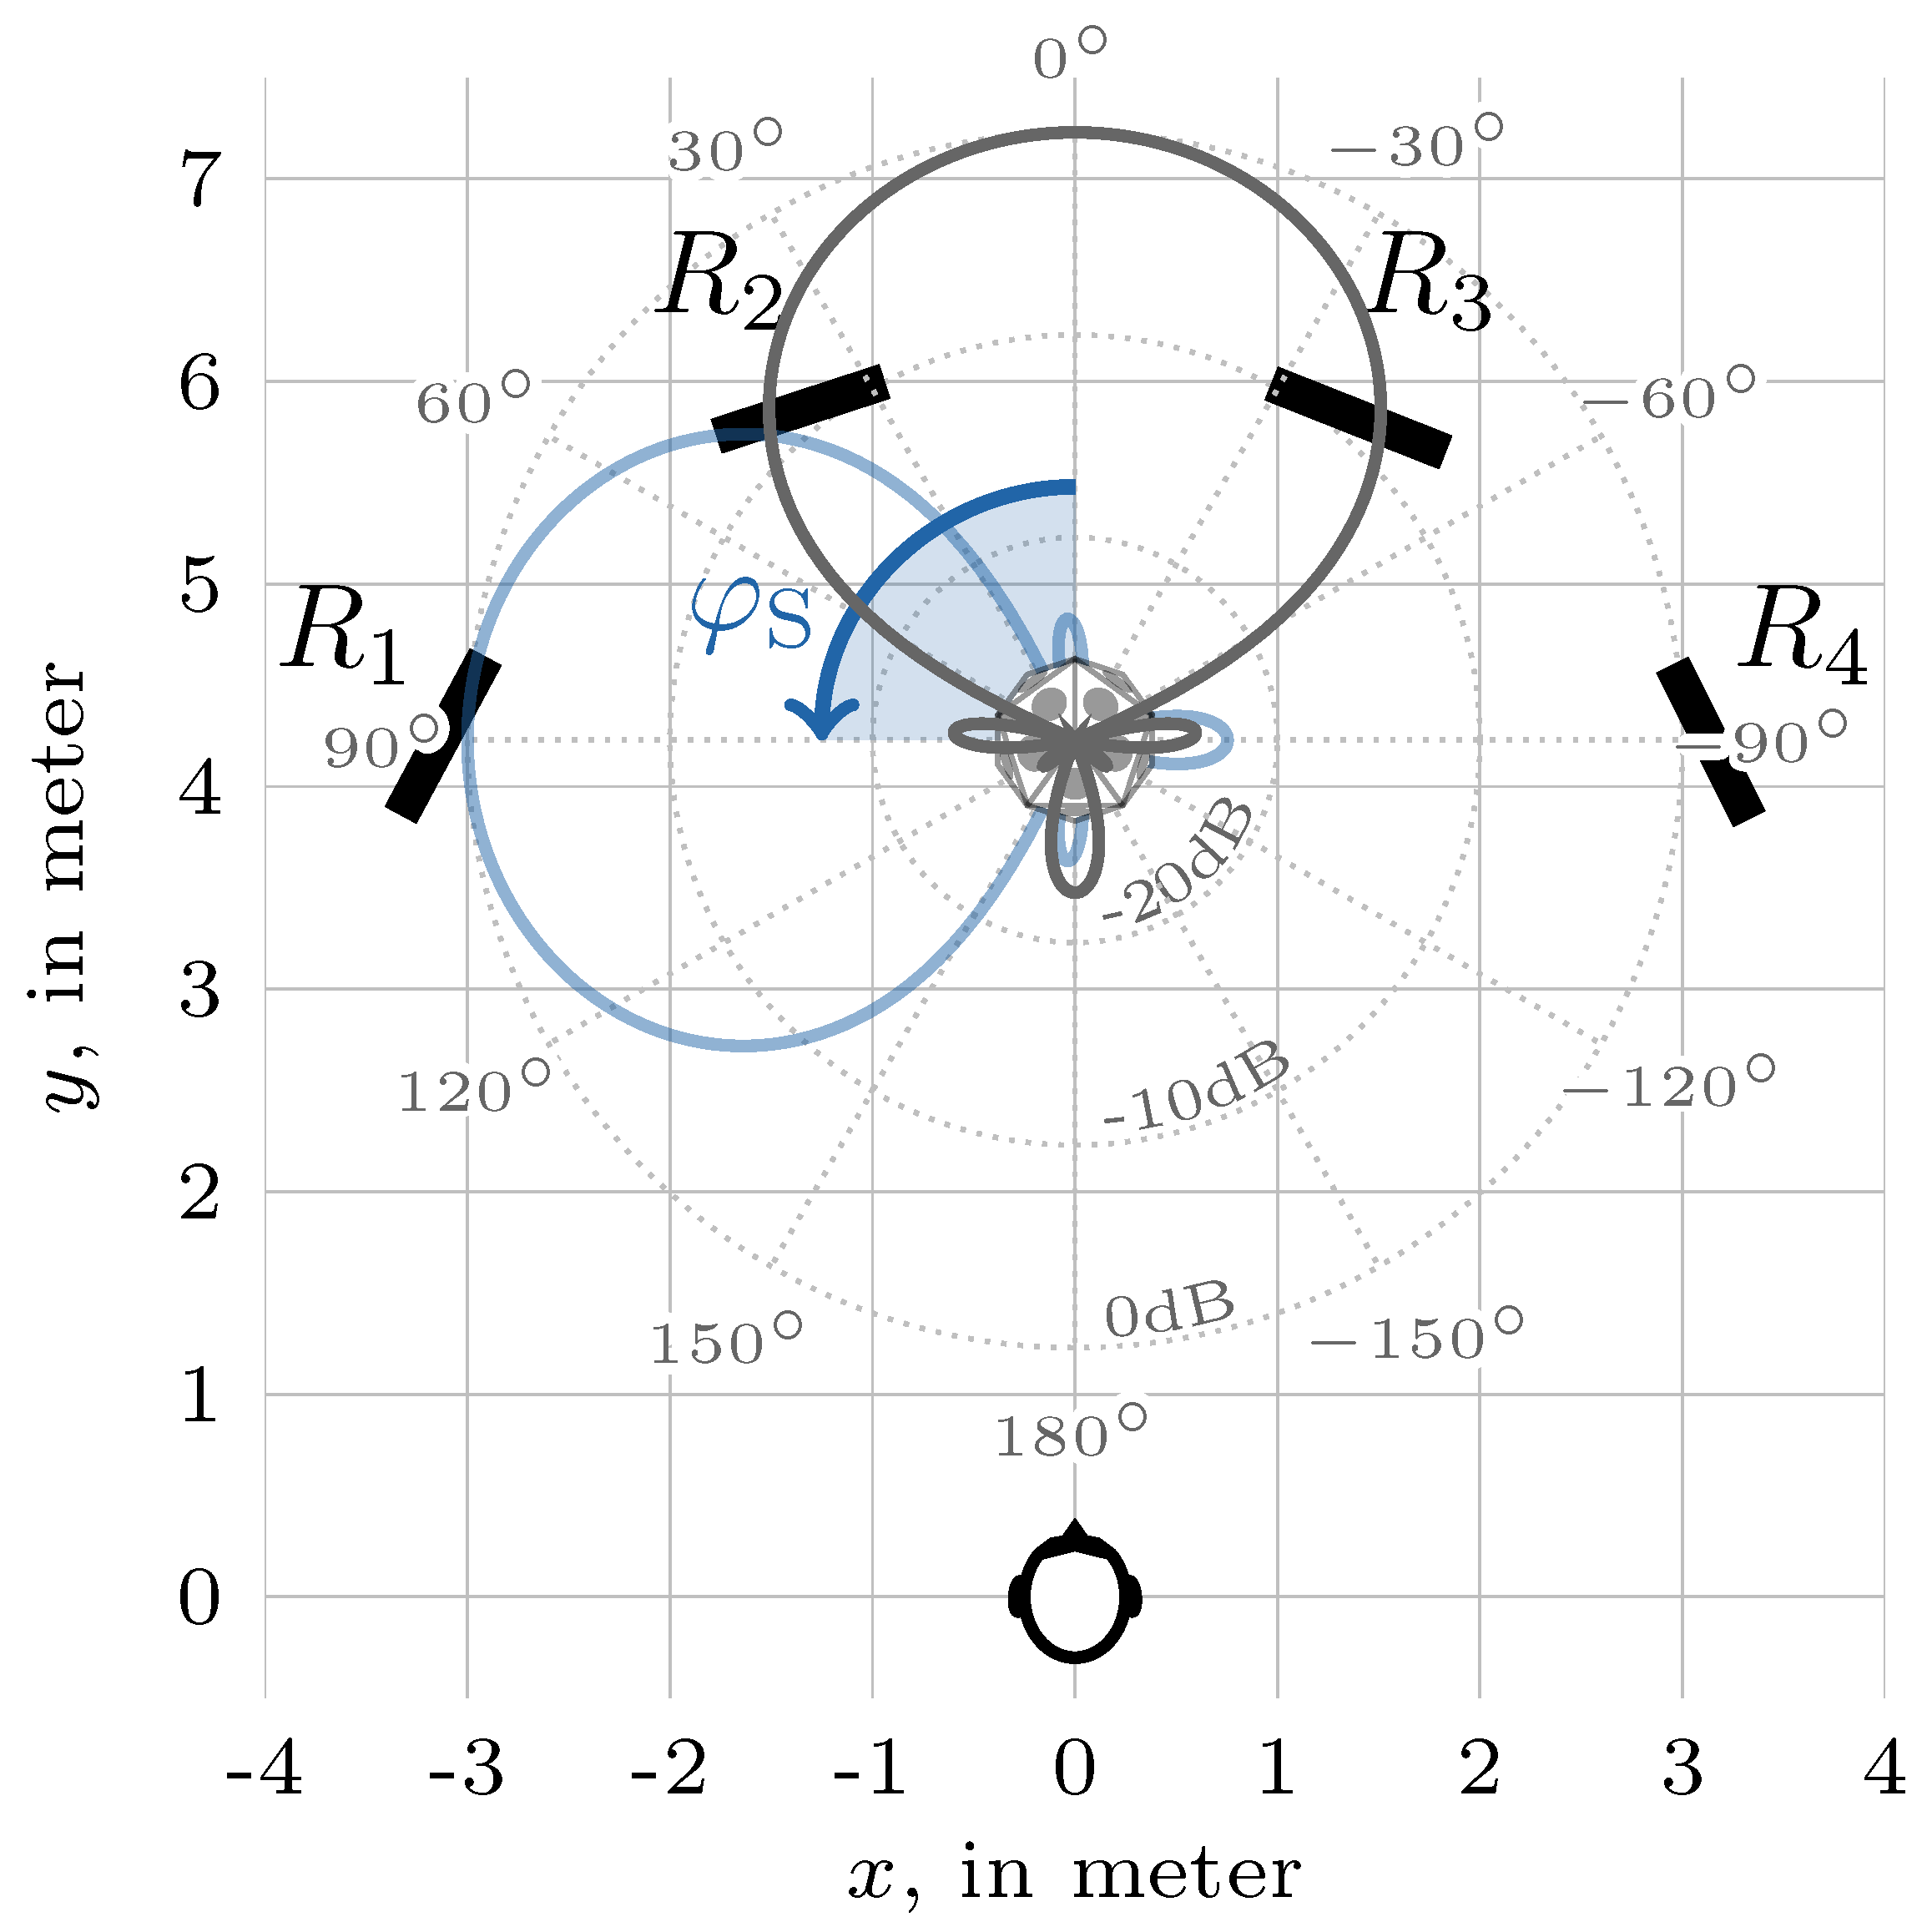
Tested Directivities: Here, we tested for six distinct beam directions on the horizon , which roughly correspond to the directions of the back wall, the listener, and the reflectors R1, R2, R3, R4, respectively, cf. Figure 5. Those specific directions were chosen as they evoke a pronounced direct or reflection path and allow for testing certain aspects of the auralization:
- : weak direct path, low direct-to-reverberant energy ratio (DRR).
- : pronounced reflections and weak direct path. Note that the directions and were perceptually chosen by the authors such that the perception of the baffle reflection (R3, and R4) is most pronounced. In order to avoid redundancy due to symmetry and to test for various reflection vs. direct path levels we also included and as possible beam directions.
- : pronounced direct path, high direct-to-reverberant energy ratio (DRR).
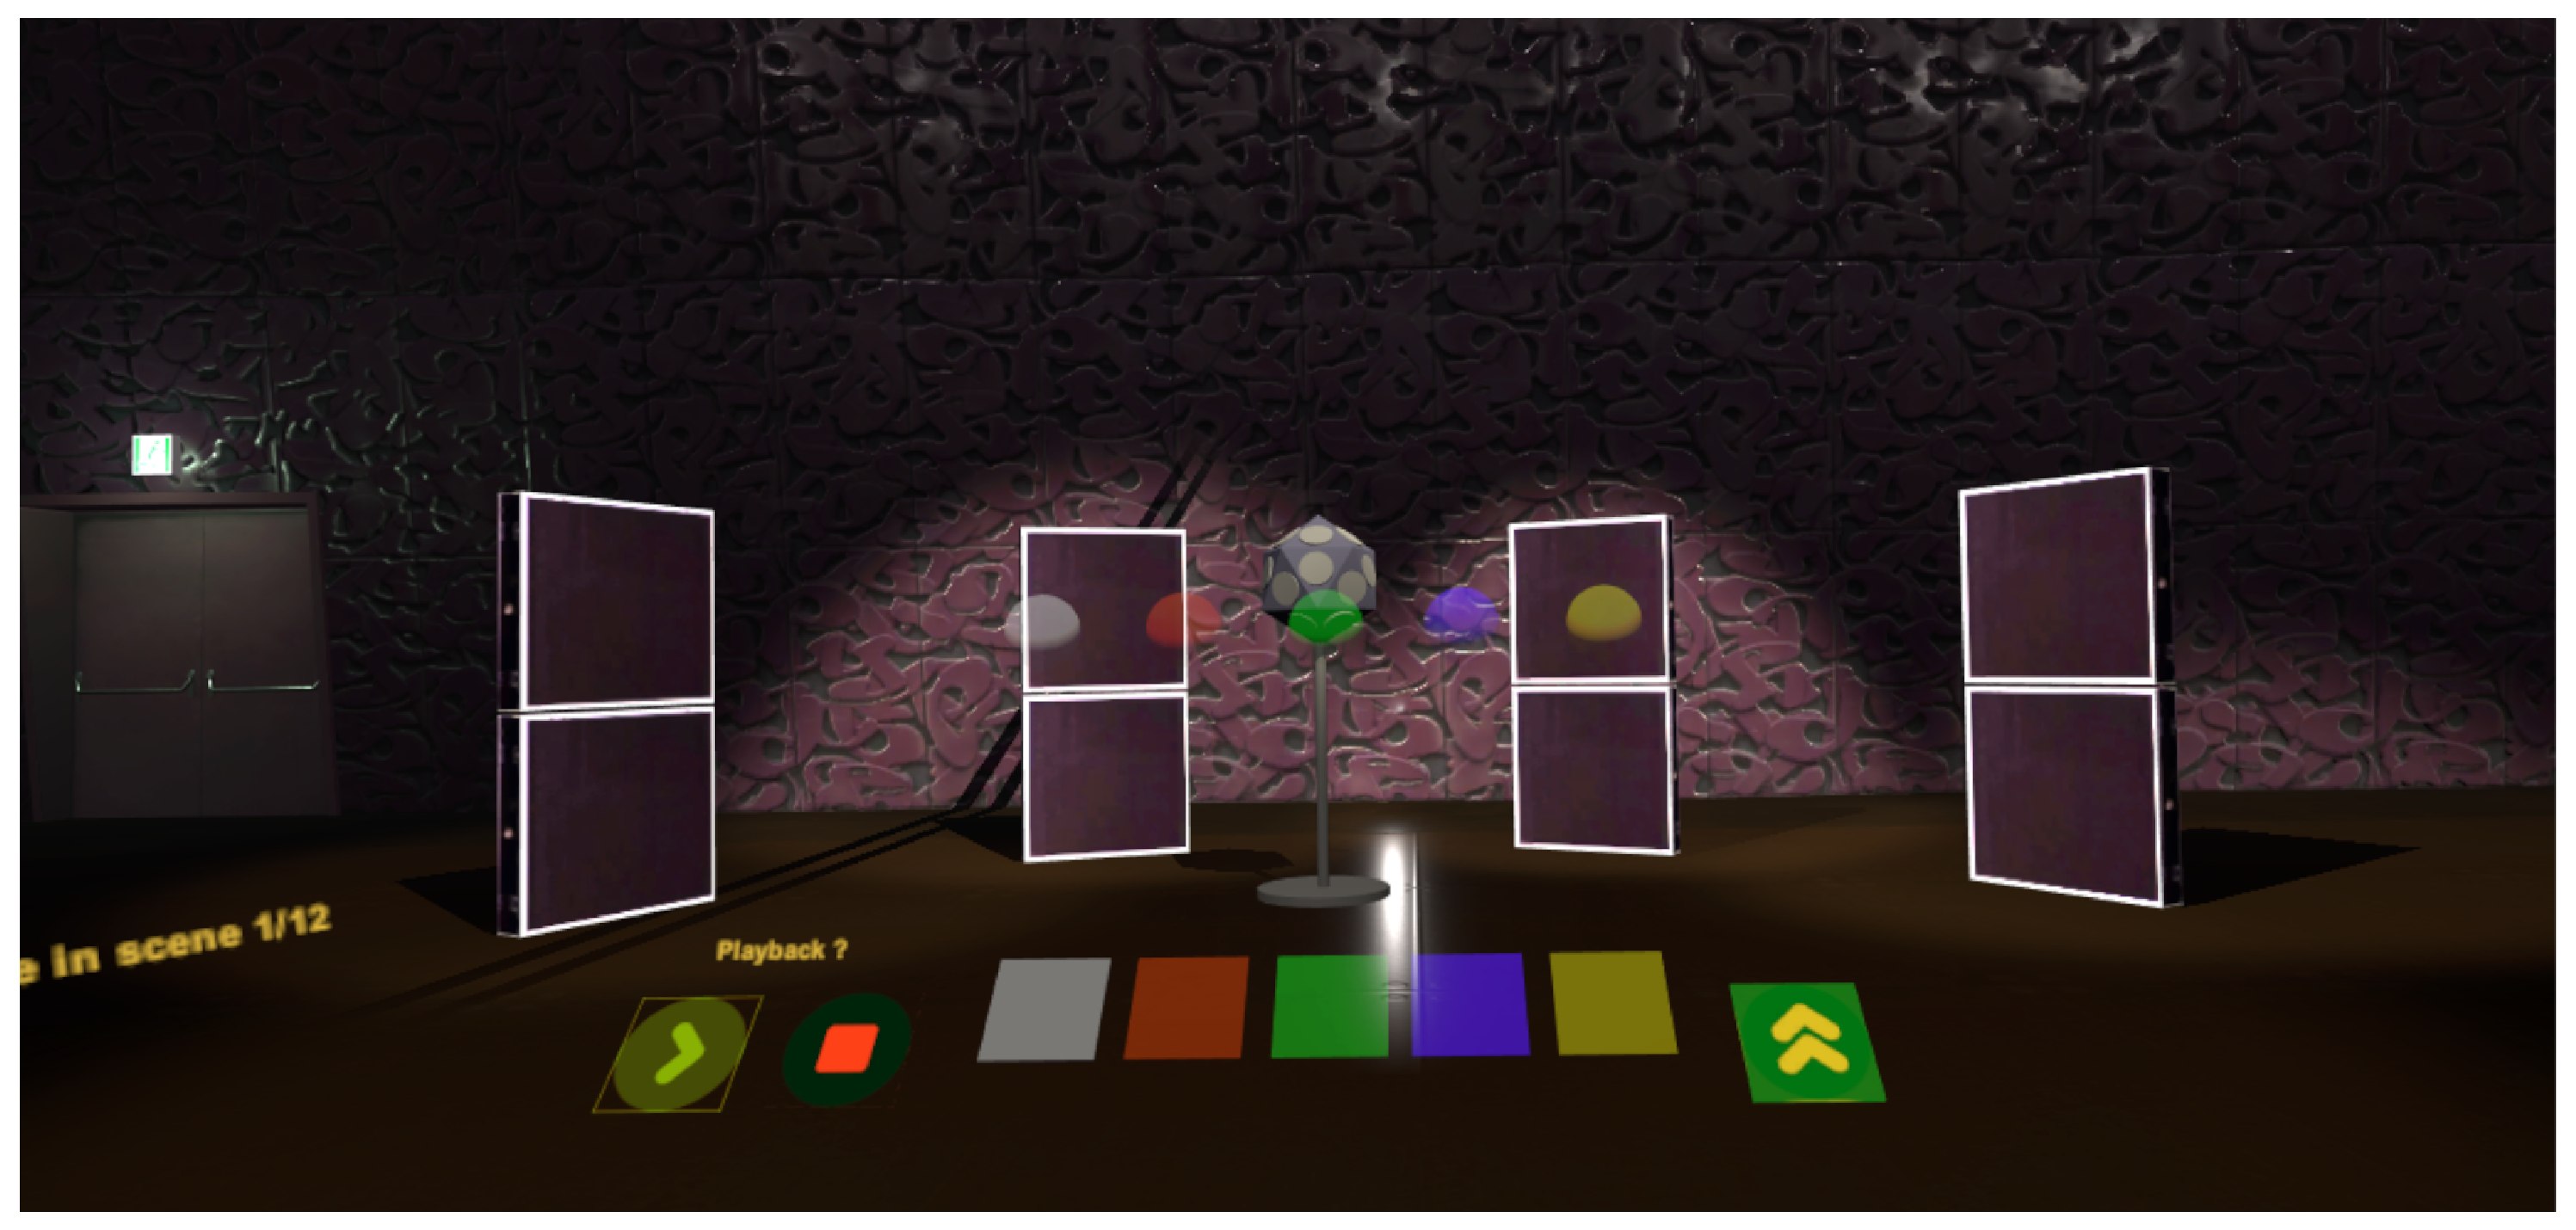
Implementation: For the sake of reproducibility and in order to circumvent room divergence [46,47,48], i.e., violation of acoustical expectations arising from the environment in which one listens to headphones, the entire scenery was modeled in virtual reality. In order to deliver graphics as realistically as possible, the room was modeled based on building plans and photogrammetry. Control buttons and labels were added to the virtual environment to give the participants control over the progression of the experimental trials and means to comparatively rate their auditory localization under the various conditions. A screenshot of the user interface is depicted in Figure 6. In addition to the typical playback and save/proceed (upwards facing arrow) buttons we used five colored squares and the corresponding spheres for controlling the experiment. Depending on the tested multistimulus set, those colored squares correspond either to all auralization techniques for a fixed beam direction or to all beam directions for a fixed auralization technique.
As VR game engine we used Unity (https://unity.com/) and the experimental game was played using the HTC VIVE, i.e., system comprising head-mounted display (HMD), controllers, and tracking. The tracking data, i.e., head rotations, from the HMD was sent to Reaper (https://www.reaper.fm) via OSC [49], where the audio processing was implemented.
While Rakerd and Hartmann [50] stated that short onsets and transient signals overall simplify localization, Wendt et al. [7] discovered that such signals are localized significantly closer to the IKO. In order to create a large scenery of perceivable auditory objects distributing to various remote locations with regard to the IKO, Wendt et al. [7] recommends using signals with slow onset. For conditions with clear effects, we therefore used a long pink noise burst with fade-in and fade-out times of (linear fades) and silence at the end.
For encoding and multi-channel convolution with IKO control filters, directivities, and RIRs we used the mcfx (http://www.matthiaskronlachner.com/?p=1910) plug-ins and as binaural renderer of the Ambisonic signals we used the BinauralDecoder (https://plugins.iem.at/) [18,41]. The ear signals were played back via headphones (AKG 702) plugged into an external audio interface (RME MadiFace & RME FireFace UCX). Note that an orientation mismatch between different arrays used for measuring the RIRs (cf. the IKO vs. Cubelet, and ST450 vs. em32) can almost not be avoided. Thus, the authors perceptually aligned the auralization techniques for .
During informal listening experiments (by four participants) we found that all auralization techniques under test obey a high overall sound quality (no artifacts or temporal smearing). However, the overall timbre slightly varies across the techniques as we employed technique specific measurement hardware (e.g., Cubelet vs. IKO). While a global and steering-direction-independent equalization was not feasible, the techniques were perceptually equalized using a parametric multi-band EQ for a fixed steering direction (pointing to the listener).
Input Method: During the experiment, participants were asked to indicate the position (i.e., direction and distance relative from the listener) of the perceived sound and to follow a certain procedure: (i) point to a colored square to select a stimulus for looped playback, (ii) pick-up the correspondingly colored ball by pointing towards it and pressing the trigger, (iii) with trigger pressed, point to the perceived direction and adjust the distance by moving the thumb on the controller track pad, (iv) release the trigger to drop off the ball at the intended position, (v) proceed until all balls are positioned, then save responses and proceed to next multistimulus set. Participants were allowed to reposition any ball as often as desired until the responses of the entire multistimulus set were logged in.
Design: The experiment consisted of 12 multistimulus sets, of which the first one was part of a training and familiarization phase. In the following 11 sets, participants were asked to rate 5 stimuli per set. Those 5 stimuli either consisted of all the five auralization techniques and a fixed beam direction (6 sets), or of all beam directions (except the beam direction) (In order to keep only 5 stimuli per scene, scenes with a given auralization technique were not containing the beam direction. For this reason results obtained for the beam direction were not used in the statistical analysis.) for a fixed auralization technique (5 sets). Both the order of sets, as well as the assignment of a stimulus to a certain colored square within the set were randomized. The 13 participants (normal hearing, all male, age between 24–52) were asked to repeat the experiment in order to provide a second response per set. Correspondingly, most of the 13 participants (except 1 who did not repeat the experiment) evaluated stimuli.
3.3. Results and Discussion
The positions of the perceived sound objects are given in the Cartesian coordinate system with the listener at the origin. As results show little to no variation in height (z coordinate), we focus on an evaluation of the coordinates.
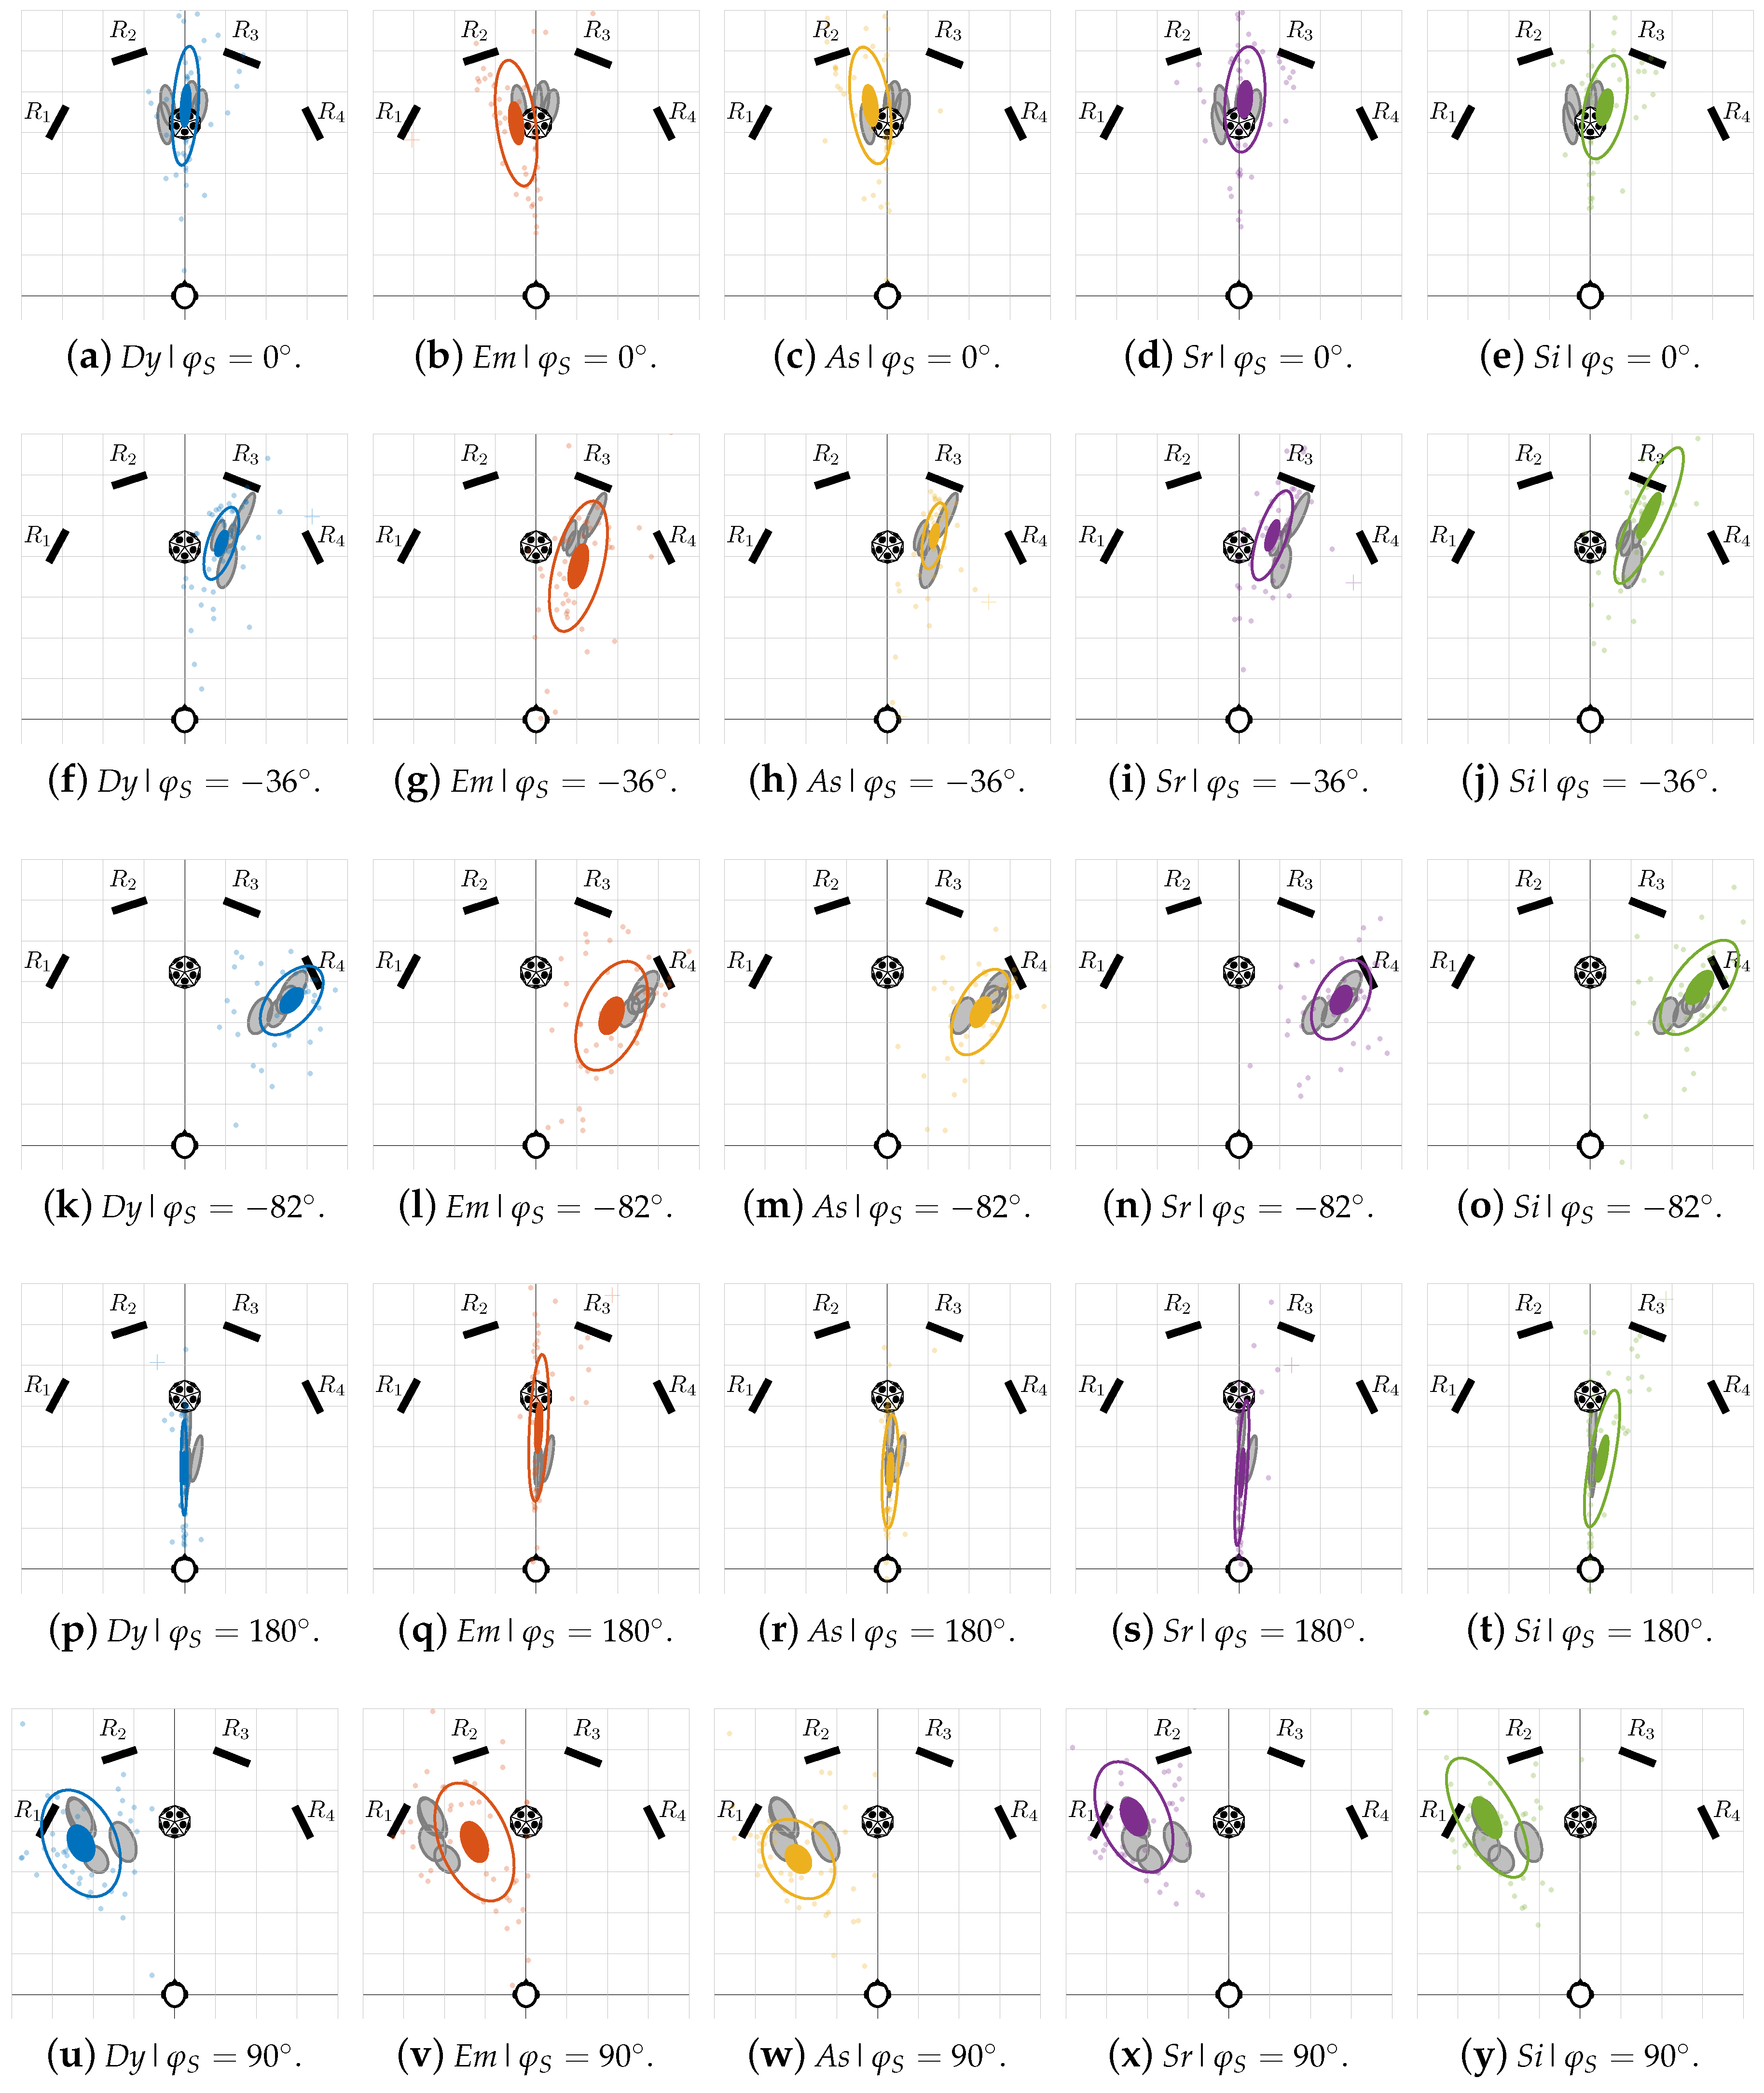
Overall inspection in two dimensions: In a first processing step, outliers are defined as responses lying outside a Mahalanobis distance (in estimated standard deviations) of three within a preliminary, non-robust analysis. After removal of the outliers, we use bivariate statistical analysis to estimate the means and their standard deviation and confidence region according to Hotelling’s T2 distribution (see [51] Ch. 3). The result of this analysis are depicted in Figure 7, where data points, outliers, and standard deviation and confidence region ellipses are indicated as dots, crosses, and not-filled and filled ellipses, respectively. In case of similar sizes of the statistical spreads, statistically significant differences may be inspected by observing whether the mean value of one condition lies outside the () confidence ellipses of the other conditions.
While each row of Figure 7 depicts the results for all auralization techniques and a certain beam direction , each column shows the perceived position of the auditory events per technique and for all beam directions . Thus, comparison within the rows is used to identify differences across auralization techniques, and comparison within each column gives indication if each auralization technique is able to reproduce the well-described perceptual effects of the IKO [7], or similar devices. These effects are explained by exciting pronounced propagation paths and dimming the direct path, which is known to evoke auditory events whose position needs not coincide with the physical source. Moreover, Wendt et al. [5] showed that the IKO’s directivity allows for altering the DRR and thus, for controlling the perceived distance, e.g., by steering the beam towards or away from the listener.
Overall, we observe that all techniques are qualitatively able reproduce the perceptual effects known from studies involving the physical IKO [5,7], cf. columns in Figure 7. The ratings show a clear consensus with the expected positions of the auditory events, i.e., by steering a beam towards a reflector the auditory event is located near the respective reflector baffle. Moreover, steering the beam towards away from the listener and towards the listener either evokes an auditory event behind the physical IKO or a very close one, respectively. We found that the ratings per beam direction are significantly different for all auralization techniques.
A detailed analysis of the differences related to the auralization techniques, cf. rows in Figure 7, is done for independent univariate attributes. These univariate attributes were not asked separately in the listening experiment, but they are obtained for the subsequent analysis by mapping of the responses to the following independent attributes (i) localizability, (ii) the direction, and (iii) distance. This analysis is based on the following considerations.
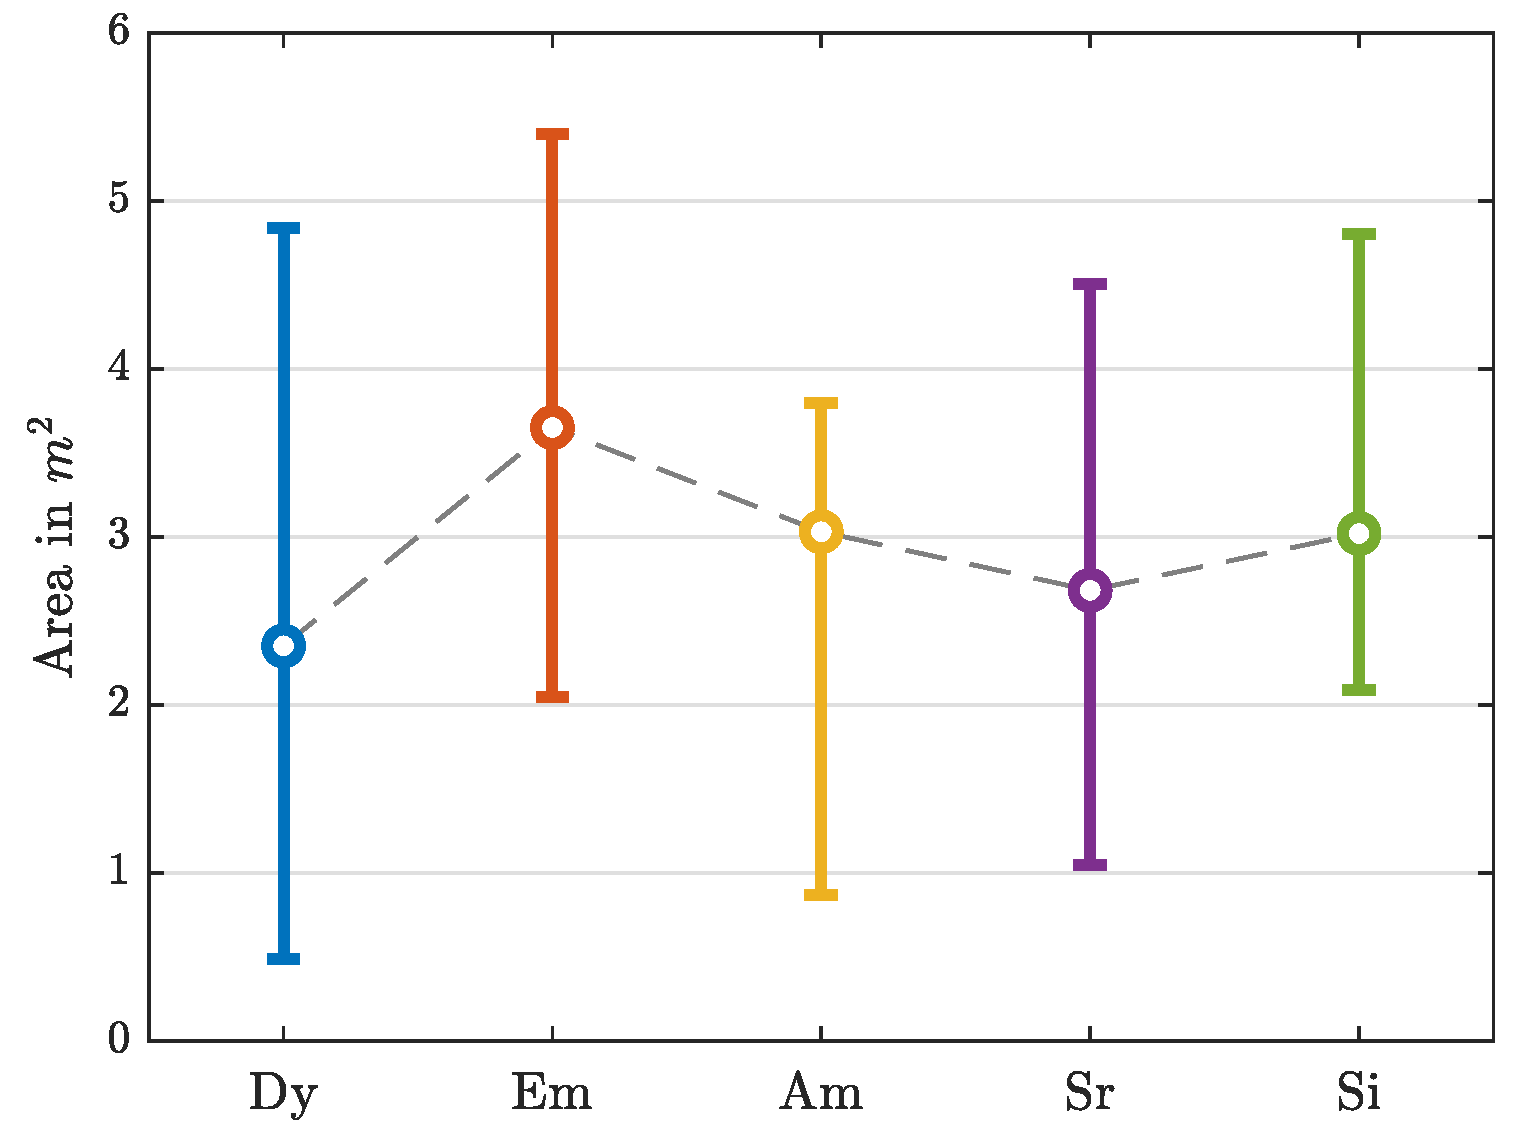
As defined by Lindau et al. [52], localizability is related to the ability to asses the spatial extent and location of a sound source. If this task is difficult, the localizability is low and if localizability is high, a sound source is clearly delimited. Moreover, localizability is often associated with the perceived extent of as sound source and thus we assume that the area of the standard deviation ellipse can be used as an indication of the localizability.
The two-dimensional source position indications yield a clear bivariate distribution, cf. Figure 7, and with a mean angular offset between the main axis of the standard deviation ellipse and the mean perceived direction (defined by listener and mean position of the perceived sound) of only , we may assume the variations to be independent along the perceptual axis of distance and direction.
As this visual evaluation may be difficult, we use a Wilcoxon signed-rank test [53] with a Bonferroni–Holm correction [54] to determine p-values of pairwise comparisons between test conditions and define as significantly different throughout this article. We employ nonparametric statistics as we do not assume a normal distribution of ratings and due to the correction (David Groppe, 2020, Bonferroni–Holm Correction for Multiple Comparisons, https://www.mathworks.com/matlabcentral/fileexchange/28303-bonferroni-holm-correction-for-multiple-comparisons) p-values can exceed the expected range and thus is valid. The Matlab script of the statistical analysis and the raw listener ratings are available online in the accompanying project (https://phaidra.kug.ac.at/o:104416). A detailed discussion of the results in terms of localizability, direction, and distance is given below.
Localizability: The median values and confidence interval of the area under the standard deviation ellipse pooled for all beam directions are depicted per auralization technique in Figure 8. While the median values indicate highest and lowest localizability for the Dy and Em techniques, respectively, the differences among all techniques is not significant ().
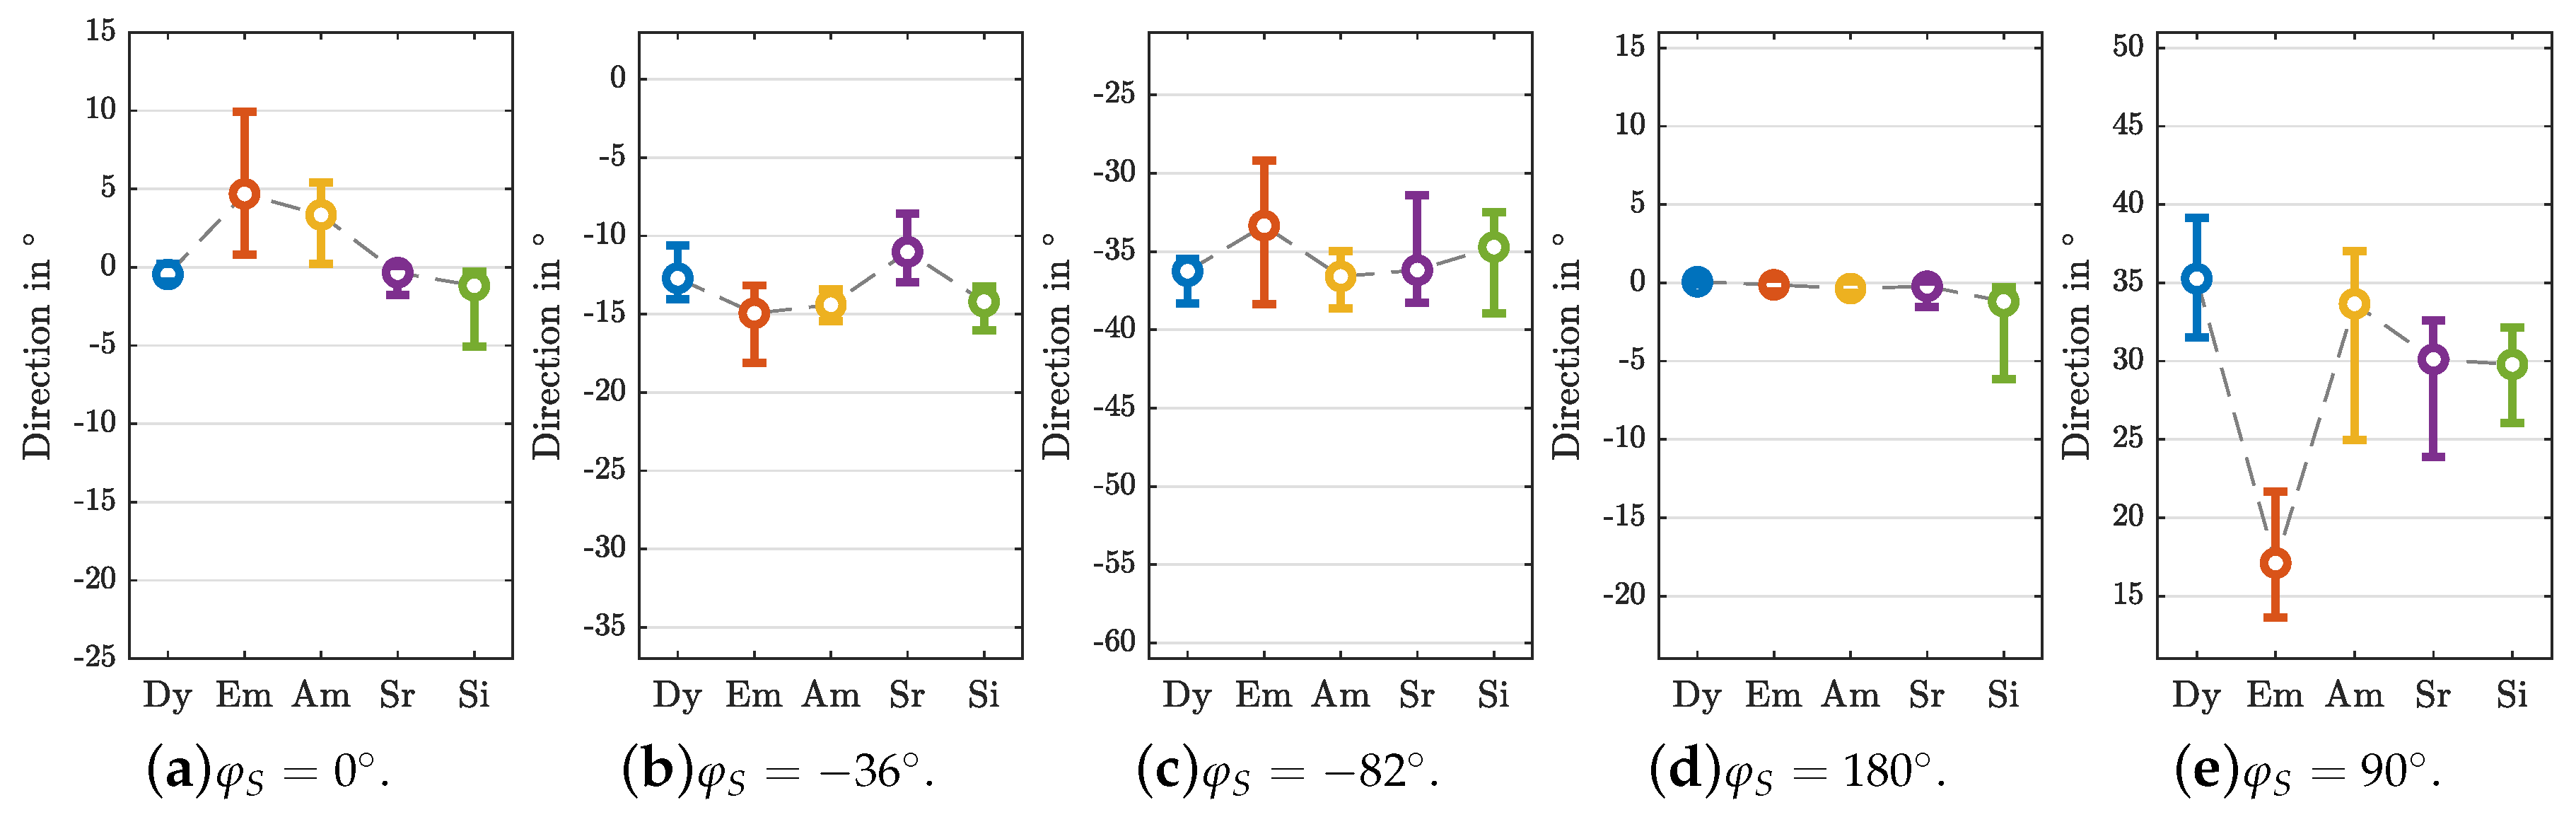
Direction: All ratings are transformed into a polar coordinate system with the listener at the center and are analyzed for azimuth and radius, i.e., direction and distance, separately. Due to the findings in [22] we assume that the Dy auralization can be used as the reference condition. Thus, the p-values are given for testing the significance levels between Dy and all other conditions. The median values and confidence intervals for all beam directions and auralization techniques are shown in Figure 9 and the in p-values between the reference condition (Dy) and the other techniques are presented in Table 1.
Despite an almost symmetrical set-up (cf. Figure 5) and only a slight change in beam direction, the direction results for the beams steered towards and show some deviation. Ratings for are less consistent (larger confidence interval) and the auditory event is localized more closely to the IKO for all techniques, when compared to . This can be explained when taking a closer look at the (ideal) 3rd-order max- weighted beam pattern as depicted in Figure 5. While for a side lobe is pointing towards the listener, this side lobe is almost avoided ( dB lower) for .
Overall, there is no significant difference between the directional mapping of the Dy and Sr techniques. For all other techniques we found significant differences for some beam directions. The Em-based auralization was the least consistent and produced the smallest lateralisation for and compared to the other techniques. This is particularly pronounced for where there is more direct sound.
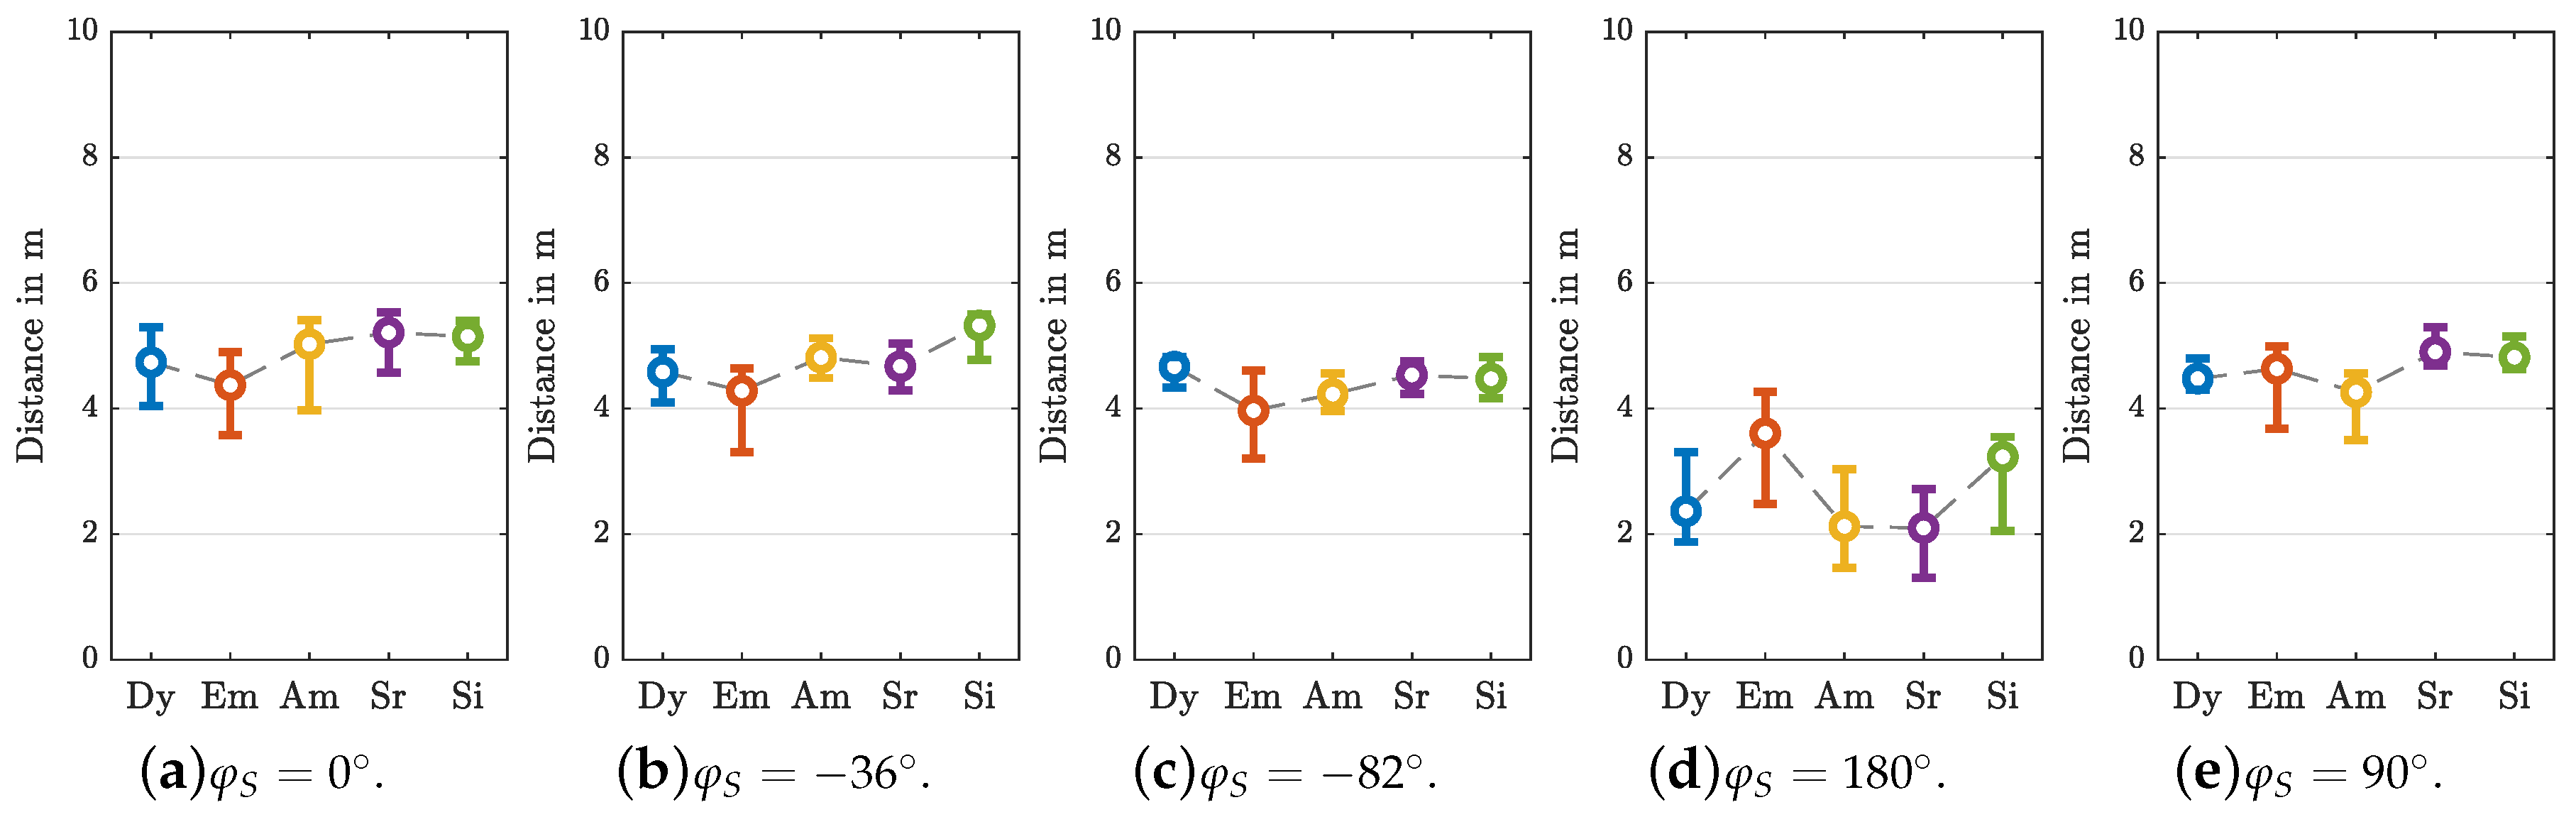
Distance: The median values and confidence intervals for all beam directions and auralization techniques are shown in Figure 10 and the in p-values between the reference condition (Dy) and the other techniques are presented in Table 2.
We found that the congruence of the distance mapping is high for all tested auralization techniques, almost independently of the specific beam directions . The only exception is the Em based auralization, where for the source is perceived significantly further away.
Discussion: The five different auralization techniques used to virtualize the IKO all involve measurements of RIRs. The results from the presented listening experiment verify that all tested techniques are able to qualitatively reproduce the perceptual effects known from studies involving the physical IKO [5,7], cf. ellipses in Figure 7. Moreover, still, a detailed analysis of the perceptual attributes of direction, and distance, indicates some significant differences to the reference condition (dummy head based rendering Dy) for specific combinations of technique and beam direction, with some noticeable trend.
In order to give an indication of the directional mapping quality of all tested auralization techniques, the mean direction offset to the Dy technique is listed in Table 3. Overall, the Em techniques yields with the largest incongruence in directional mapping, while the errors of As, Sr, and Si roughly stay below .
The mean distance offset between Dy and all other techniques pooled for all beam directions is given in Table 4. With a mean distance error of m the As, and Sr auralizations clearly outperform the Em, and Si techniques.
Although there is no clear perceptual winner, it still appears that the As and Sr approaches match the Dy reference best. We assume that using the first-order source (Cubelet) enhances the flexibility as its frequency range for directivity synthesis is larger than the one of the IKO because of its smaller size. Its upscaling permits a modular exchange of the directivity to arbitrary artificial or measured higher-order directivity patterns. On the receiver side, measurements with the dummy head (Dy) are not modular in terms of exchanging the receiver directivity patterns in terms of other HRIRs, while the measurements with the em32 and ST450 microphone arrays permit HRIR exchange. The em32 reaches a native resolution up to the 4th order, whereas the 1st-order ST450 is less demanding in terms of channel count, has no satisfactory native resolution but allows to be upscaled to higher orders.
Our impression is that auralization involving a first-order receiver and either the highly directional source or its first-order source as a replacement tend to work most reliably. Essentially, the results allow us to recommend the SRD ARIR (Sr) model and processing method for its high degree of modularity and reduction of measurement hardware and effort. It reaches perceptual qualities comparable to rendering based on dummy-head measurements (Dy), while higher-order directional sources can be exchangeably interfaced with the processed and upscaled SRD ARIRs. It is necessary to mention that the particular prototype employed as first-order measurement source (Cubelet) in our study is not necessarily powerful enough for every application, for instance, when the signal-to-noise ratio is low because of background noise. In such cases, stronger alternatives could be considered [55].
4. Conclusions
In this contribution we presented the concept and a comparative perceptual evaluation of a source-and-receiver-directional ARIR capture and processing approach (SRD ARIR) with a variety of technical alternatives. Although the proposed SRD ARIR rendering method only employs a small set of first-order directivities (omnidirectional and figures of eight aligned with x, y, and z) in the measurement, the approach produced auralization of higher-order directional source and receiver configurations that was performing well in the comparison. Its directional resolution enhancement involves the Ambisonic spatial decomposition method (ASDM) that we could extend to both sides of the measured ARIRs.
In the dynamic headphone-rendering-based evaluation, we employed the highly directional icosahedral loudspeaker (IKO) as a virtual source because of its well-described measured directivity and the well-studied perceptual effects it causes. For the sake of reproducibility and to obey optimal externalization the auralization listening experiment was done within a head-mounted-display visualization of the virtual environment. Interactive visual objects were used to indicate auditory event locations in space.
The proposed SRD ARIR method performed similarly accurate as the reference auralization based on multiple-orientation binaural room impulse responses (MOBRIRs). We found no significant difference for the perceptual attributes of localizability, direction, and distance. Although most of the alternative techniques performed comparable to the reference auralization, the SRD ARIR technique has benefits in terms of modularity and efficiency: It only requires a small number of hardware channels, and SRD ARIRs offer a generic interface between RIRs and source and receiver directivities. Any application requiring a flexible exchange of directivities can potentially benefit from the small number of responses needed to characterize the room (be it measured or simulated).
A collection of room responses measured for the study, responses of the listening experiment, the statistical analysis, and high-resolution directivities of the arrays is made available online (https://phaidra.kug.ac.at/o:104417).
Author Contributions
Conceptualization, M.Z. and F.Z. (Franz Zotter); Writing—Original Draft Preparation M.Z. and F.Z. (Franck Zagala) with periodic contributions by F.Z. (Franck Zagala); Writing—Review & Editing, M.Z. with contributions of F.Z. (Franz Zotter), and F.Z. (Franck Zagala); Software, M.Z. with periodic contributions by F.Z. (Franz Zotter) and F.Z. (Franck Zagala); Listening Experiment Implementation, M.Z.; Listening Experiment Design, M.Z., F.Z. (Franz Zotter), and F.Z. (Franck Zagala); Listening Experiment Conduction: F.Z. (Franck Zagala) with periodic contributions by M.Z.; Data Analysis, F.Z. (Franck Zagala) with periodic contributions by F.Z. (Franz Zotter) and M.Z.; Measurements, M.Z., F.Z. (Franz Zotter), and F.Z. (Franck Zagala). All authors have read and agreed to the published version of the manuscript.
Funding
The major part of the work was carried out within the OSIL project AR 328-G21 that was funded by the Open Access Funding by the Austrian Science Fund (FWF).
Acknowledgments
We thank Matthias Frank for his companionship in pursuing the proposed technique over the past years, and all voluntary listeners for their participation in our listening experiments.
Conflicts of Interest
The authors declare no conflicts of interest.
Appendix A. Transition to Noise in Schröder Backwards Integrated Impulse Response
The late part of a noisy impulse response of a room is well modeled by
where are two uncorrelated normalized noise processes, as the carrier of the diffuse, decaying reverberation, and as stationary background or measurement noise. The expected squared impulse response is
The expected Schröder backwards integrated impulse response yields
Within an early section the contribution of the stationary noise amplitude is negligible compared to the energy decay , and linear regression from the observed yields the coefficients a and b for the noise-free case by
At later time segments, in particular where the model based on a and b is exceeded by the observed , say, by a factor of 10, one can estimate c from linear regression of
Together with the known regression parameters b, a, and c, the envelope of the squared impulse response in Equation (A2) can be enforced to take the shape as if c were zero
Obviously, the envelope correction that restores the model envelope of a noise-free room impulse response becomes and therefore
Appendix B. SRD ARIR
The Matlab source code of the proposed SRD ARIR method, a source-and-receiver-directional version of the Ambisonic Spatial Decomposition Method (ASDM [22]) can be found in Listing 1. It requires the spherical harmonics implemented in Politis’ lirbrary (https://github.com/polarch/Spherical-Harmonic-Transform). The SRD algorithm becomes ASDM when choosing for the source.
Listing 1. MATLAB simplified source code of the proposed SRD ARIR method.


References
- BS EN ISO 3382-1:2009. Acoustics—Measurement of room acoustic parameters. Part 1: Performance spaces. In British Standard; Cambridge University Press: Cambridge, UK, 2009; pp. 1–26.
- Otondo, F.; Rindel, J.H. The Influence of the Directivity of Musical Instruments in a Room. Acta Acust. Acust. 2004, 90, 1178–1184. [Google Scholar]
- Vigeant, M.C.; Wang, L.M.; Rindel, J.H. Investigations of multi-channel auralization technique for solo instruments and orchestra. In Proceedings of the 19th International Congress on Acoustics, Madrid, Spain, 2–7 September 2007. [Google Scholar]
- Laitinen, M.V.; Politis, A.; Huhtakallio, I.; Pulkki, V. Controlling the perceived distance of an auditory object by manipulation of loudspeaker directivity. J. Acoust. Soc. Am. 2015, 137, 462–468. [Google Scholar] [CrossRef] [PubMed] [Green Version]
- Wendt, F.; Zotter, F.; Frank, M.; Höldrich, R. Auditory distance control using a variable-directivity loudspeaker. Appl. Sci. 2017, 7, 666. [Google Scholar] [CrossRef] [Green Version]
- Ronsse, L.M.; Wang, L.M. Effects of room size and reverberation, receiver location, and source rotation on acoustical metrics related to source localization. Acta Acust. Acust. 2012, 98, 768–775. [Google Scholar] [CrossRef]
- Wendt, F.; Sharma, G.K.; Frank, M.; Zotter, F.; Höldrich, R. Perception of Spatial Sound Phenomena Created by the Icosahedral Loudspeaker. Comput. Music J. 2017, 41, 76–88. [Google Scholar] [CrossRef]
- Wang, L.M.; Vigeant, M.C. Evaluations of output from room acoustic computer modeling and auralization due to different sound source directionalities. Appl. Acoust. 2008, 69, 1281–1293. [Google Scholar] [CrossRef]
- Khaykin, D.; Rafaely, B. Acoustic analysis by spherical microphone array processing of room impulse responses. J. Acoust. Soc. Am. 2012, 132, 261–270. [Google Scholar] [CrossRef]
- Morgenstern, H.; Klein, J.; Rafaely, B.; Noisternig, M. Experimental investigation of multiple-input multiple-output systems for sound-field analysis. In Proceedings of the 22nd International Congress on Acoustics, Buenos Aires, 5–9 September 2016. [Google Scholar]
- Alary, B.; Massé, P.; Välimäki, V.; Noisternig, M. Assessing the Anisotropic Features of Spatial Impulse Responses. In Proceedings of the EAA Spatial Audio Signal Processing Symposium; EAA: Oshkosh, WI, USA, 2019; pp. 43–48. [Google Scholar] [CrossRef]
- Nolan, M.; Verburg, S.A.; Brunskog, J.; Fernandez-Grande, E. Experimental characterization of the sound field in a reverberation room. J. Acoust. Soc. Am. 2019, 145, 2237–2246. [Google Scholar] [CrossRef] [Green Version]
- Schultz, F.; Zaunschirm, M.; Zotter, F. Directivity and electro-acoustic measurements of the IKO. In Proceedings of the 144th AES Convention, Milan, Italy, 23–26 May 2018. [Google Scholar]
- Neal, M.T. A Spherical Microphone and Compact Loudspeaker Array Measurement Database for the Study of Concert Hall Preference. Ph.D. Thesis, The Pennsylvania State University, State College, PA, USA, 2019. [Google Scholar]
- Oberem, J.; Richter, J.G.; Setzer, D.; Seibold, J.; Koch, I.; Fels, J. Experiments on localization accuracy with non-individual and individual HRTFs comparing static and dynamic reproduction methods. bioRxiv 2018, bioRxiv 2020.03.31.011650. [Google Scholar]
- Ivanic, J.; Ruedenberg, K. Rotation matrices for real spherical harmonies. direct determination by recursion. J. Phys. Chem. 1996, 100, 6342–6347. [Google Scholar] [CrossRef]
- Pinchon, D.; Hoggan, P.E. Rotation matrices for real spherical harmonics: General rotations of atomic orbitals in space-fixed axes. J. Phys. A Math. Theor. 2007, 40, 1597–1610. [Google Scholar] [CrossRef] [Green Version]
- Schörkhuber, C.; Zaunschirm, M.; Höldrich, R. Binaural Rendering of Ambisonic Signals via Magnitude Least Squares. Proc. DAGA 2018, 44, 339–342. [Google Scholar]
- Pollow, M.; Klein, J.; Dietrich, P.; Vorlaender, M. Including Directivity Patterns in Room Acoustical Measurements; Acoustical Society of America: Melville, NY, USA, 2013; Volume 015008. [Google Scholar] [CrossRef]
- Noisternig, M.; Klein, J.; Berzborn, M.; Recher, A.; Warusfel, O. High-Resolution MIMO DRIR Measurements in an Opera Hall. In Proceedings of the 42nd Annual German Congress on Acoustics (DAGA), Aachen, Germany, 14–17 March 2016. [Google Scholar]
- Zaunschirm, M.; Baumgartner, C.; Schörkhuber, C.; Frank, M.; Zotter, F. An Efficient Source-and-Receiver-Directional RIR Measurement Method. In Proceedings of the DAGA; DAGA: Aachen, Germany, 2017; pp. 1343–1346. [Google Scholar]
- Zaunschirm, M.; Frank, M.; Zotter, F. Binaural Rendering with Measured Room Responses: First-Order Ambisonic Microphone vs. Dummy Head. Appl. Sci. 2020, 10, 1631. [Google Scholar] [CrossRef] [Green Version]
- Tervo, S.; Patynen, J.; Lokki, T. Acoustic reflection path tracing using a highly directional loudspeaker. In Proceedings of the IEEE Workshop on Applications of Signal Processing to Audio and Acoustics, New Paltz, NY, USA, 18–21 October 2009; pp. 245–248. [Google Scholar]
- Zotter, F.; Zaunschirm, M.; Frank, M.; Kronlachner, M. A Beamformer to Play with Wall Reflections: The Icosahedral Loudspeaker. Comput. Music J. 2017, 41. [Google Scholar] [CrossRef]
- Zaunschirm, M.; Frank, M.; Zotter, F. An Interactive Virtual Icosahedral Loudspeaker Array. In Proceedings of the DAGA; DAGA: Aachen, Germany, 2016; pp. 1331–1334. [Google Scholar]
- Pelzer, S.; Pollow, M.; Vorländer, M. Auralization of a virtual orchestra using directivities of measured symphonic instruments. In Proceedings of the Acoustics 2012 Nantes Conference, Nantes, France, 23–27 April 2012; pp. 2379–2384. [Google Scholar]
- Allen, J.B.; Berkley, D.A. Image method for efficiently simulating small-room acoustics. J. Acoust. Soc. Am. 1979, 65, 943–950. [Google Scholar] [CrossRef]
- Keller, J.B. Geometrical theory of diffraction. J. Opt. Soc. Am. 1962, 52, 116–130. [Google Scholar] [CrossRef]
- Svensson, U.P.; Fred, R.I.; Vanderkooy, J. An analytic secondary source model of edge diffraction impulse responses. J. Acoust. Soc. Am. 1999, 106, 2331–2344. [Google Scholar] [CrossRef] [Green Version]
- Tsingos, N.; Funkhouser, T.; Ngan, A.; Carlbom, I. Modeling acoustics in virtual environments using the uniform theory of diffraction. In Proceedings of the 28th Annual Conference on Computer Graphics and Interactive Techniques, SIGGRAPH 2001, Los Angeles, CA, USA, 12–17 August 2001; pp. 545–553. [Google Scholar] [CrossRef] [Green Version]
- Vorlaender, M. Auralization: Fundamentals of Acoustics, Modelling, Simulation, Algorithms and Acoustic Virtual Reality; RWTHedition; Springer: Berlin/Heidelberg, Germany, 2008. [Google Scholar] [CrossRef]
- Schoerkhuber, C.; Hoeldrich, R. Signal-Dependent Encoding for First-Order Ambisonic Microphones. In Proceedings of the 43rd DAGA Conference, Kiel, Germany, 6–9 March 2017. [Google Scholar]
- Massé, P.; Carpentier, T.; Warusfel, O.; Noisternig, M. Denoising directional room impulse responses with spatially anisotropic late reverberation tails. Appl. Sci. 2020, 10, 1033. [Google Scholar] [CrossRef] [Green Version]
- Tuncer, T.E.; Friedlander, B. Classical and Modern Direction-of-Arrival Estimation; Academic Press: Cambridge, MA, USA, 2009. [Google Scholar]
- Jarrett, D.P.; Habets, E.A.P.; Naylor, P.A. 3D Source localization in the spherical harmonic domain using a pseudointensity vector. In Proceedings of the 18th European Signal Processing Conference, Aalborg, Denmark, 23–27 August 2010. [Google Scholar]
- Zotter, F.; Frank, M. Ambisonics: A Practical 3D Audio Theory for Recording, Studio Production, Sound Reinforcement, and Virtual Reality; SpringerOpen: Berlin/Heidelberg, Germany, 2019; pp. 1–210. [Google Scholar] [CrossRef] [Green Version]
- Politis, A.; Delikaris-Manias, S.; Pulkki, V. Direction-of-arrival and diffuseness estimation above spatial aliasing for symmetrical directional microphone arrays. In ICASSP, IEEE International Conference on Acoustics, Speech and Signal Processing—Proceedings; IEEE: Piscataway, NJ, USA, 2015; pp. 6–10. [Google Scholar] [CrossRef]
- Zaunschirm, M.; Frank, M.; Zotter, F. BRIR Synthesis Using First-Order Microphone Arrays. In Proceedings of the Conference of the Audio Eng. Soc. 144, Milan, Italy, 23–26 May 2018; pp. 1–10. [Google Scholar]
- Unsold, A. Beiträge zur quantenmechanik der atome. Annalen der Physik 1927, 387, 355–393. [Google Scholar] [CrossRef]
- Zotter, F. A Linear-Phase Filter-Bank Approach to Process Rigid Spherical Microphone Array Recordings. In Proceedings of the 5th IcETRAN, Subotica, Serbia, 11–14 June 2018; pp. 550–557. [Google Scholar]
- Zaunschirm, M.; Schörkhuber, C.; Höldrich, R. Binaural rendering of Ambisonic signals by head-related impulse response time alignment and a diffuseness constraint. J. Acoust. Soc. Am. 2018, 143, 3616–3627. [Google Scholar] [CrossRef]
- Zaunschirm, M.; Frank, M.; Franz, Z. Perceptual Evaluation of Variable-Orientation Binaural Room Impulse Response Rendering. In Proceedings of the 2019 AES International Conference on Immersive and Interactive Audio, York, UK, 27–29 March 2019. [Google Scholar]
- Merimaa, J.; Pulkki, V. Spatial impulse response rendering I: Analysis and synthesis. J. Audio Eng. Soc. 2005, 53, 1115–1128. [Google Scholar]
- Daniel, J.; Rault, J.; Polack, J. Ambisonics encoding of other audio formats for multiple listening conditions. In Audio Engineering Society Convention 105; Audio Engineering Society: New York, NY, USA, 1998. [Google Scholar]
- Zotter, F.; Frank, M. All-round ambisonic panning and decoding. J. Audio Eng. Soc. 2012, 60, 807–820. [Google Scholar]
- Plenge, G. On the problem of ’in head localization’. Acta Acust. Acust. 1972, 26, 241–252. [Google Scholar] [CrossRef]
- Werner, S.; Klein, F.; Mayenfels, T.; Brandenburg, K. A summary on acoustic room divergence and its effect on externalization of auditory events. In Proceedings of the 2016 8th International Conference on Quality of Multimedia Experience, QoMEX 2016, Lisbon, Portugal, 6–8 June 2016. [Google Scholar] [CrossRef]
- Cubick, J. Investigating distance perception, externalization and speech intelligibility in complex acoustic environments Hearing. Ph.D. Thesis, Technical University of Denmark, Lyngby, Denmark, 2017. [Google Scholar]
- Wright, M.; Freed, A. Open SoundControl: A New Protocol for Communicating with Sound Synthesizers Matthew. In International Computer Music Conference (ICMC); Michigan Publishing: Thessaloniki, Greece, 1997. [Google Scholar]
- Rakerd, B.; Hartmann, W.M. Localization of sound in rooms, III: Onset and duration effects. J. Acoust. Soc. Am. 1986, 80, 1695–1706. [Google Scholar] [CrossRef] [PubMed]
- Anderson, T.W. An Introduction to Multivariate Statistical Analysis, 3rd ed.; Wiley-Interscience: New York, NY, USA, 2003; p. 752. [Google Scholar] [CrossRef]
- Lindau, A.; Erbes, V.; Lepa, S.; Maempel, H.J.; Brinkman, F.; Weinzierl, S. A spatial audio quality inventory (SAQI). Acta Acust. Acust. 2014, 100, 984–994. [Google Scholar] [CrossRef]
- Wilcoxon, F. Individual comparisons by ranking methods. In Breakthroughs in Statistics; Springer: Berlin/Heidelberg, Germany, 1992; pp. 196–202. [Google Scholar]
- Holm, S. A simple sequentially rejective multiple test procedure. Scand. J. Stat. 1979, 6, 65–70. [Google Scholar]
- Meyer-Kahlen, N.; Zotter, F.; Pollack, K. Design and Measurement of First-Order, Horizontally Beam-Controlling Loudspeaker Cubes. In Proceedings of the 144th Convention of the AES, Milan, Italy, 23–26 May 2018. [Google Scholar]
Figure 1.
Auralization scenario using the source and receiver directional (SRD) ARIR (in the Ambisonics domain). Here, is the source signal, is the SRD ARIR, and and are the directional impulse responses of the source and receiver, e.g., ear directivity, respectively.
Figure 1.
Auralization scenario using the source and receiver directional (SRD) ARIR (in the Ambisonics domain). Here, is the source signal, is the SRD ARIR, and and are the directional impulse responses of the source and receiver, e.g., ear directivity, respectively.

Figure 2.
Compact arrays that are used to measure the multiple input multiple output (MIMO) room impulse responses (RIRs). (a) Cubelet: Spherical ( cm) 6-channel loudspeaker array prototype with loudspeakers arranged on surfaces of a cube. (b) TSL ST450: 4-channel Ambisonic B-format microphone array with cm.

Figure 3.
Auralization techniques evaluated in the listening experiment. Here , , and and are the source signal, the beam direction, and the ear signals of the left and right ear, respectively. The auralization techniques from top to bottom are (i) dummy head BRIR (Dy), (ii) MIMO ARIR (Em), (iii) Multi ASDM (As), (iv) real SRD ARIR (Sr), and (v) ideal SRD ARIR (Si) auralization. Note that gray-shaded boxes indicate functional blocks which are shared between different techniques. The boxes delimited by bold lines mark techniques in which the actual Room Transfer Function is not directly measured but obtained by processing (e.g., upscaling by an ASDM method) of the underlying measurements as proposed in Section 2.2. A detailed description of the techniques can be found throughout Section 3.1.

Figure 4.
Panoramic image () of the measurement setup in the György Ligeti Saal, Graz. The camera perspective corresponds with the receiver/listener position.
Figure 4.
Panoramic image () of the measurement setup in the György Ligeti Saal, Graz. The camera perspective corresponds with the receiver/listener position.

Figure 5.
Position of source, listener, and reflectors (R1,..,R4) in György Ligeti Saal, Graz. An ideal 3rd-order max- weighted beampattern with a dynamic range of 30dB is shown in gray. For the listening experiment we used the beam directions .
Figure 5.
Position of source, listener, and reflectors (R1,..,R4) in György Ligeti Saal, Graz. An ideal 3rd-order max- weighted beampattern with a dynamic range of 30dB is shown in gray. For the listening experiment we used the beam directions .

Figure 6.
Screen shot of VR-rendered environment. Listener faces icosahedral loudspeaker (IKO) and uses controller to switch between conditions when moved over colored floor panels and to drag-and-drop place correspondingly colored auditory event markers (opaque/translucent for active/inactive).
Figure 6.
Screen shot of VR-rendered environment. Listener faces icosahedral loudspeaker (IKO) and uses controller to switch between conditions when moved over colored floor panels and to drag-and-drop place correspondingly colored auditory event markers (opaque/translucent for active/inactive).

Figure 7.
Bivariate statistical analysis of the perceived position of the auditory event per beam direction (columns) and per auralization technique (rows). Data points, outliers, and standard deviation and confidence region ellipses are indicated as dots, crosses, and not-filled and filled ellipses, respectively.

Figure 8.
Median value and confidence interval of the area under the standard deviation ellipse pooled for all beam directions .
Figure 8.
Median value and confidence interval of the area under the standard deviation ellipse pooled for all beam directions .

Figure 9.
Median value and confidence interval of direction ratings per beam direction . Please note the varying y-axis as per sub-figure a range of around the median of the Dy ratings is shown.
Figure 9.
Median value and confidence interval of direction ratings per beam direction . Please note the varying y-axis as per sub-figure a range of around the median of the Dy ratings is shown.

Figure 10.
Median value and confidence interval of distance ratings per beam direction . Please note the fixed y-axis showing the interval of m form the listener.
Figure 10.
Median value and confidence interval of distance ratings per beam direction . Please note the fixed y-axis showing the interval of m form the listener.


Table 1.
p-values (Wilcoxon signed-rank test with Bonferroni–Holm correction) for ratings of direction. Insignificant differences (p-values ) are indicated by bold numbers.
Table 1.
p-values (Wilcoxon signed-rank test with Bonferroni–Holm correction) for ratings of direction. Insignificant differences (p-values ) are indicated by bold numbers.
| Dy | |||||
| Em | 0.00 | 0.15 | 1.38 | 0.70 | 0.00 |
| As | 0.00 | 0.08 | 1.77 | 0.17 | 0.52 |
| Sr | 0.76 | 0.23 | 3.76 | 0.07 | 0.07 |
| Si | 0.30 | 0.15 | 3.76 | 0.00 | 0.03 |
Table 2.
p-values (Wilcoxon signed-rank test with Bonferroni–Holm correction) for ratings of distance. Insignificant differences (p-values ) are indicated by bold numbers.
Table 2.
p-values (Wilcoxon signed-rank test with Bonferroni–Holm correction) for ratings of distance. Insignificant differences (p-values ) are indicated by bold numbers.
| Dy | |||||
| Em | 1.14 | 0.78 | 0.49 | 0.02 | 1.27 |
| As | 3.40 | 0.78 | 0.91 | 1.52 | 0.47 |
| Sr | 3.24 | 0.65 | 2.21 | 1.53 | 0.37 |
| Si | 3.40 | 0.04 | 1.52 | 1.42 | 0.47 |
Table 3.
Mean direction offset to dy per auralization technique over all tested beam directions .
| Em | As | Sr | Si |
|---|---|---|---|
Table 4.
Mean absolute distance offset to Dy per auralization technique over all tested beam directions .
Table 4.
Mean absolute distance offset to Dy per auralization technique over all tested beam directions .
| Em | As | Sr | Si |
|---|---|---|---|
| m | m | m | m |
© 2020 by the authors. Licensee MDPI, Basel, Switzerland. This article is an open access article distributed under the terms and conditions of the Creative Commons Attribution (CC BY) license (http://creativecommons.org/licenses/by/4.0/).
Share and Cite
MDPI and ACS Style
Zaunschirm, M.; Zagala, F.; Zotter, F. Auralization of High-Order Directional Sources from First-Order RIR Measurements. Appl. Sci. 2020, 10, 3747. https://doi.org/10.3390/app10113747
AMA Style
Zaunschirm M, Zagala F, Zotter F. Auralization of High-Order Directional Sources from First-Order RIR Measurements. Applied Sciences. 2020; 10(11):3747. https://doi.org/10.3390/app10113747
Chicago/Turabian StyleZaunschirm, Markus, Franck Zagala, and Franz Zotter. 2020. "Auralization of High-Order Directional Sources from First-Order RIR Measurements" Applied Sciences 10, no. 11: 3747. https://doi.org/10.3390/app10113747
Note that from the first issue of 2016, this journal uses article numbers instead of page numbers. See further details here.