Using Keystroke Dynamics in a Multi-Agent System for User Guiding in Online Social Networks


Valencian Research Institute for Artificial Intelligence (VRAIn), Universitat Politècnica de València, Camino de Vera s/n, 46022 Valencia, Spain
*
Author to whom correspondence should be addressed.
Appl. Sci. 2020, 10(11), 3754; https://doi.org/10.3390/app10113754
Submission received: 21 April 2020
/
Revised: 18 May 2020
/
Accepted: 25 May 2020
/
Published: 28 May 2020
(This article belongs to the Special Issue Sentiment Analysis for Social Media Ⅱ)
Abstract
:Featured Application
The application of this proposal is the detection of the sentiment and stress levels of users navigating a social network site (SNS) by using the proposed new analyzer agents that have been integrated into the existing multi-agent system (MAS), for preventing potential issues that could arise from the interactions and avoiding risks. The MAS uses sentiment and stress analyzers that process text data, and sentiment and stress analyzers for keystroke dynamics data; this should allow the system to early prevent future issues caused by social interactions, since the experiments have shown that the state detected by the analyzers does propagate in the network through replies to messages.
Abstract
Nowadays there is a strong integration of online social platforms and applications with our daily life. Such interactions can make risks arise and compromise the information we share, thereby leading to privacy issues. In this work, a proposal that makes use of a software agent that performs sentiment analysis and another performing stress analysis on keystroke dynamics data has been designed and implemented. The proposal consists of a set of new agents that have been integrated into a multi-agent system (MAS) for guiding users interacting in online social environments, which has agents for sentiment and stress analysis on text. We propose a combined analysis using the different agents. The MAS analyzes the states of the users when they are interacting, and warns them if the messages they write are deemed negative. In this way, we aim to prevent potential negative outcomes on social network sites (SNSs). We performed experiments in the laboratory with our private SNS Pesedia over a period of one month, so we gathered data about text messages and keystroke dynamics data, and used the datasets to train the artificial neural networks (ANNs) of the agents. A set of experiments was performed for discovering which analysis is able to detect a state of the user that propagates more in the SNS, so it may be more informative for the MAS. Our study will help develop future intelligent systems that utilize user data in online social environments for guiding or helping them in their social experience.
1. Introduction
The presence of online applications in our daily lives has risen recently, and social network sites (SNSs) are some of the most predominant. In this scenario, it is interesting that the systems that are managing online sites could also help prevent potential issues that could arise from user interactions. Two aspects that a system should take into account when dealing with these kinds of scenarios are the potential risks that can arise from the interactions between users and what factors influence the likelihood of incurring in one risk or another. Regarding the risks, several risk factors have been reported in [1,2]. Between them, there are contact risks or the risk of interacting with strangers, content risks or the risk of receiving inappropriate content, and commercial risks or the risk of being asked for personal information. Another factor is the fact that certain social groups can be more vulnerable to risks. In [3] it is shown that teenagers, who belong to a social group that uses SNSs frequently [4], have characteristics that make them more vulnerable to risks navigating SNSs. Concerning the factors that can influence people to incur risks, we focus on the decision making process in the current work. In [5] authors reviewed the effects of several aspects of the emotional states of the users on decision making. They show that incidental moods affect decision making by altering the perception of a person, and that discrete emotions, integral affects, and regret also affect decision making (with regret acting as anticipated regret, as in thinking of a negative outcome before it happens). Furthermore, stress has been associated with a concrete emotional state and has been used to implement software called TensiStrength to detect stress and relaxation magnitude in texts in [6]. For this reason, it may be useful to create a module that specializes in detecting stress apart from the sentiment analysis module, in a system that guides users in online sites.
Regarding the influence of the emotional state in the decision making process, and following the general idea of aiding decision making of users in SNSs through analyzing their emotional state and stress levels, in [7] we built a multi-agent system (MAS) used for analyzing the data of users in a SNS. The analyses in the MAS are used to detect the emotional states and stress levels of users and guide them based on this information. In this MAS only sentiment and stress analysis on text data was being performed. Nevertheless, in the literature, we found that keystroke dynamics have been used to successfully build models that detect the sentiment state of a person [8]. Keystroke dynamics are also a non-invasive way of gathering data from users that can be the input to models able to detect sentiment and stress levels. For these reasons, we consider that it is a way to improve the system that we presented in [7]. For this purpose, we designed, implemented, and integrated two new analyzers into a new version of our system, which are used to perform sentiment and stress analysis with keystroke dynamics data, respectively. The analyses of data that are performed by the new analyzers use artificial neural networks (ANNs) to improve the classification accuracy of the system since machine learning techniques have achieved state-of-art accuracies in aspect-based sentiment analysis tasks [9]. Moreover, a combined version of both sentiment and stress analysis has been proposed for text data and keystroke dynamics data.
The contributions of the present work are, then, the design and implementation of agents capable of recognizing sentiment and stress in keystroke dynamics data, and their integration into a MAS that uses this information for guiding users in SNSs. This process has the goal of achieving better recognition of negative states that could produce negative outcomes on SNSs, so the system can better prevent them. For being able to validate our proposal and to check whether there is a better recognition of negative states that propagate in the network, we performed experiments with data from our private SNS Pesedia [10]. In these experiments, we checked whether the analyzers are able to detect a state that is also found in replies to messages where it is detected (which we call propagation of the state in the network). We compare the propagation of the state detected with keystroke dynamics analyzers to the state detected by the other analyzers that use text data. Finally, we compare different combined analyses to the analyses that use only one data analysis. Pesedia is a SNS used by young people, both male and female, with ages compressed in the 12–15 years old range; it is used in our laboratory experiments and to gather data. It is a SNS made using the social networking engine Elgg (https://elgg.org/). This SNS is built using plug-ins that add functionalities to a base generic networking site, which is provided by the Elgg engine.
Employing the analyzers implemented, the system is able to help prevent contact risks by warning the user before posting a message with negative sentiment polarity or high-stress level that could attract unwanted and harmful interactions. The system could also avoid getting publications with negative polarity or high-stress level, which could appear as an effect of the user posting while having negative sentiment or high-stress level. Finally, since the system aims to prevent publications with either negative polarity or high-stress level, it could prevent users from sharing personal information, thereby helping prevent the commercial risk. For the sake of example, this could happen if a user that is feeling stressed gets asked for personal information, and due to their high level of stress, they post the information without thinking it over.
The rest of the paper is structured as follows. Section 2 reviews state-of-art work related to the topic of this paper. Section 3 describes our proposed MAS for user guiding in online social environments. Section 4 describes the experiments performed with our SNS Pesedia and the new analyzers. Finally, Section 5 exposes conclusions extracted and future lines of work.
2. Related Work
In this section, a review is performed on state-of-art work related to keystroke dynamics analysis for building models for sentiment and stress detection, and the influence of emotion and stress on keystroke dynamics, to assess whether it is suitable to add to our system analyzers that use keystroke dynamics as input to detect sentiment and stress. We will also review works about multi-modal sentiment state detection, where various inputs are used for the detection of the user sentiment, which goes in line with our new MAS. Moreover, to the best of our knowledge, there is no such a system that uses a combination of sentiment and stress analysis from text and keystroke dynamics for discovering whether a message could generate a negative repercussion in a SNS and warns the user in the moment of posting a message.
Keystroke dynamics data has been used in the literature to predict the sentiment of the person writing a text. In [11] a group of subjects was asked to type numbers after hearing each of the International Affective Digitized Sounds 2nd edition (IADS-2) [12] and the keystroke dynamics were recorded. They found evidence through statistical analysis that supports that keystroke duration and latency are influenced by arousal. Keystroke dynamics have been studied for discovering the effect of emotion on keystroke data, but they have also been used to build different emotion detection models. In [8] a group of people was asked to type and label the text typed with their emotional state. Then, classifiers for different emotional states that use keystroke dynamics data as input were successfully built, reaching an accuracy of 77.4% to 87.8% for the confidence, hesitance, nervousness, relaxation, sadness, and tiredness classifiers.
In regard to the relation with keystroke dynamics and stress levels, in [13] authors gathered keystroke dynamics data from a group of people in two separate scenarios (with normal conditions and under stress). They discovered that about half the keystroke parameters change significantly (after performing the corresponding t-test) from the data of the scenario of normal conditions to the one wherein the subjects were influenced by stress. Additionally, in [14], authors successfully built different machine learning models that detected cognitive and physical stress using keystroke dynamics features (decision tree, support vector machines, artificial neural networks, k-nearest neighbor, and AdaBoost).
Multimodal sentiment analysis has started gaining more attention from researchers recently. There are three main approaches for assessing multimodal sentiment analysis, which are early, intermediate, and late fusion [15]. Early fusion combines different data sources into a single feature vector. As an example of early fusion, in [16] authors extracted features from audio, video, and text, and later fused them with a multiple kernel learning classifier. Intermediate fusion is performed fusing the data in the intermediate layers of the model itself (e.g., in the intermediate layers of an ANN). Finally late fusion is the process of combining the outputs of different sentiment classifiers, trained with different modalities of data for giving a final decision on sentiment classification. In [15], three different models are presented—two unimodal models for sentiment classification, using deep convolutional neural networks (CNN) and image data, and other that employs a long-short term memory network (LSTM) and text data, respectively. The third model combines the output visual features from the CNNs and text features from the LSTM before feeding a fully connected layer with the combination for giving a sentiment classification, which is an example of intermediate fusion. The authors also created a framework for late fusion, where they take into account the outputs of the three models presented for giving a final sentiment classification. As has been shown, different strategies with unimodal and multimodal data have been employed in the literature for sentiment analysis. Nevertheless, to the best of our knowledge, there is not an approximation that performs sentiment and stress classification using late fusion of text analysis and keystroke dynamics analysis, which are two non-intrusive data modalities. In this work, we propose this form of late fusion, which will be more extensively detailed in the next section.
3. System Description
In this section, the new analyzers capable of performing sentiment and stress analysis on keystroke dynamics data will be presented, and also their implementation and evaluation will be shown. Moreover, we show the final architecture of our enhanced MAS after the integration of the new agents and explain the process of user guiding, which employs the advisor agent.
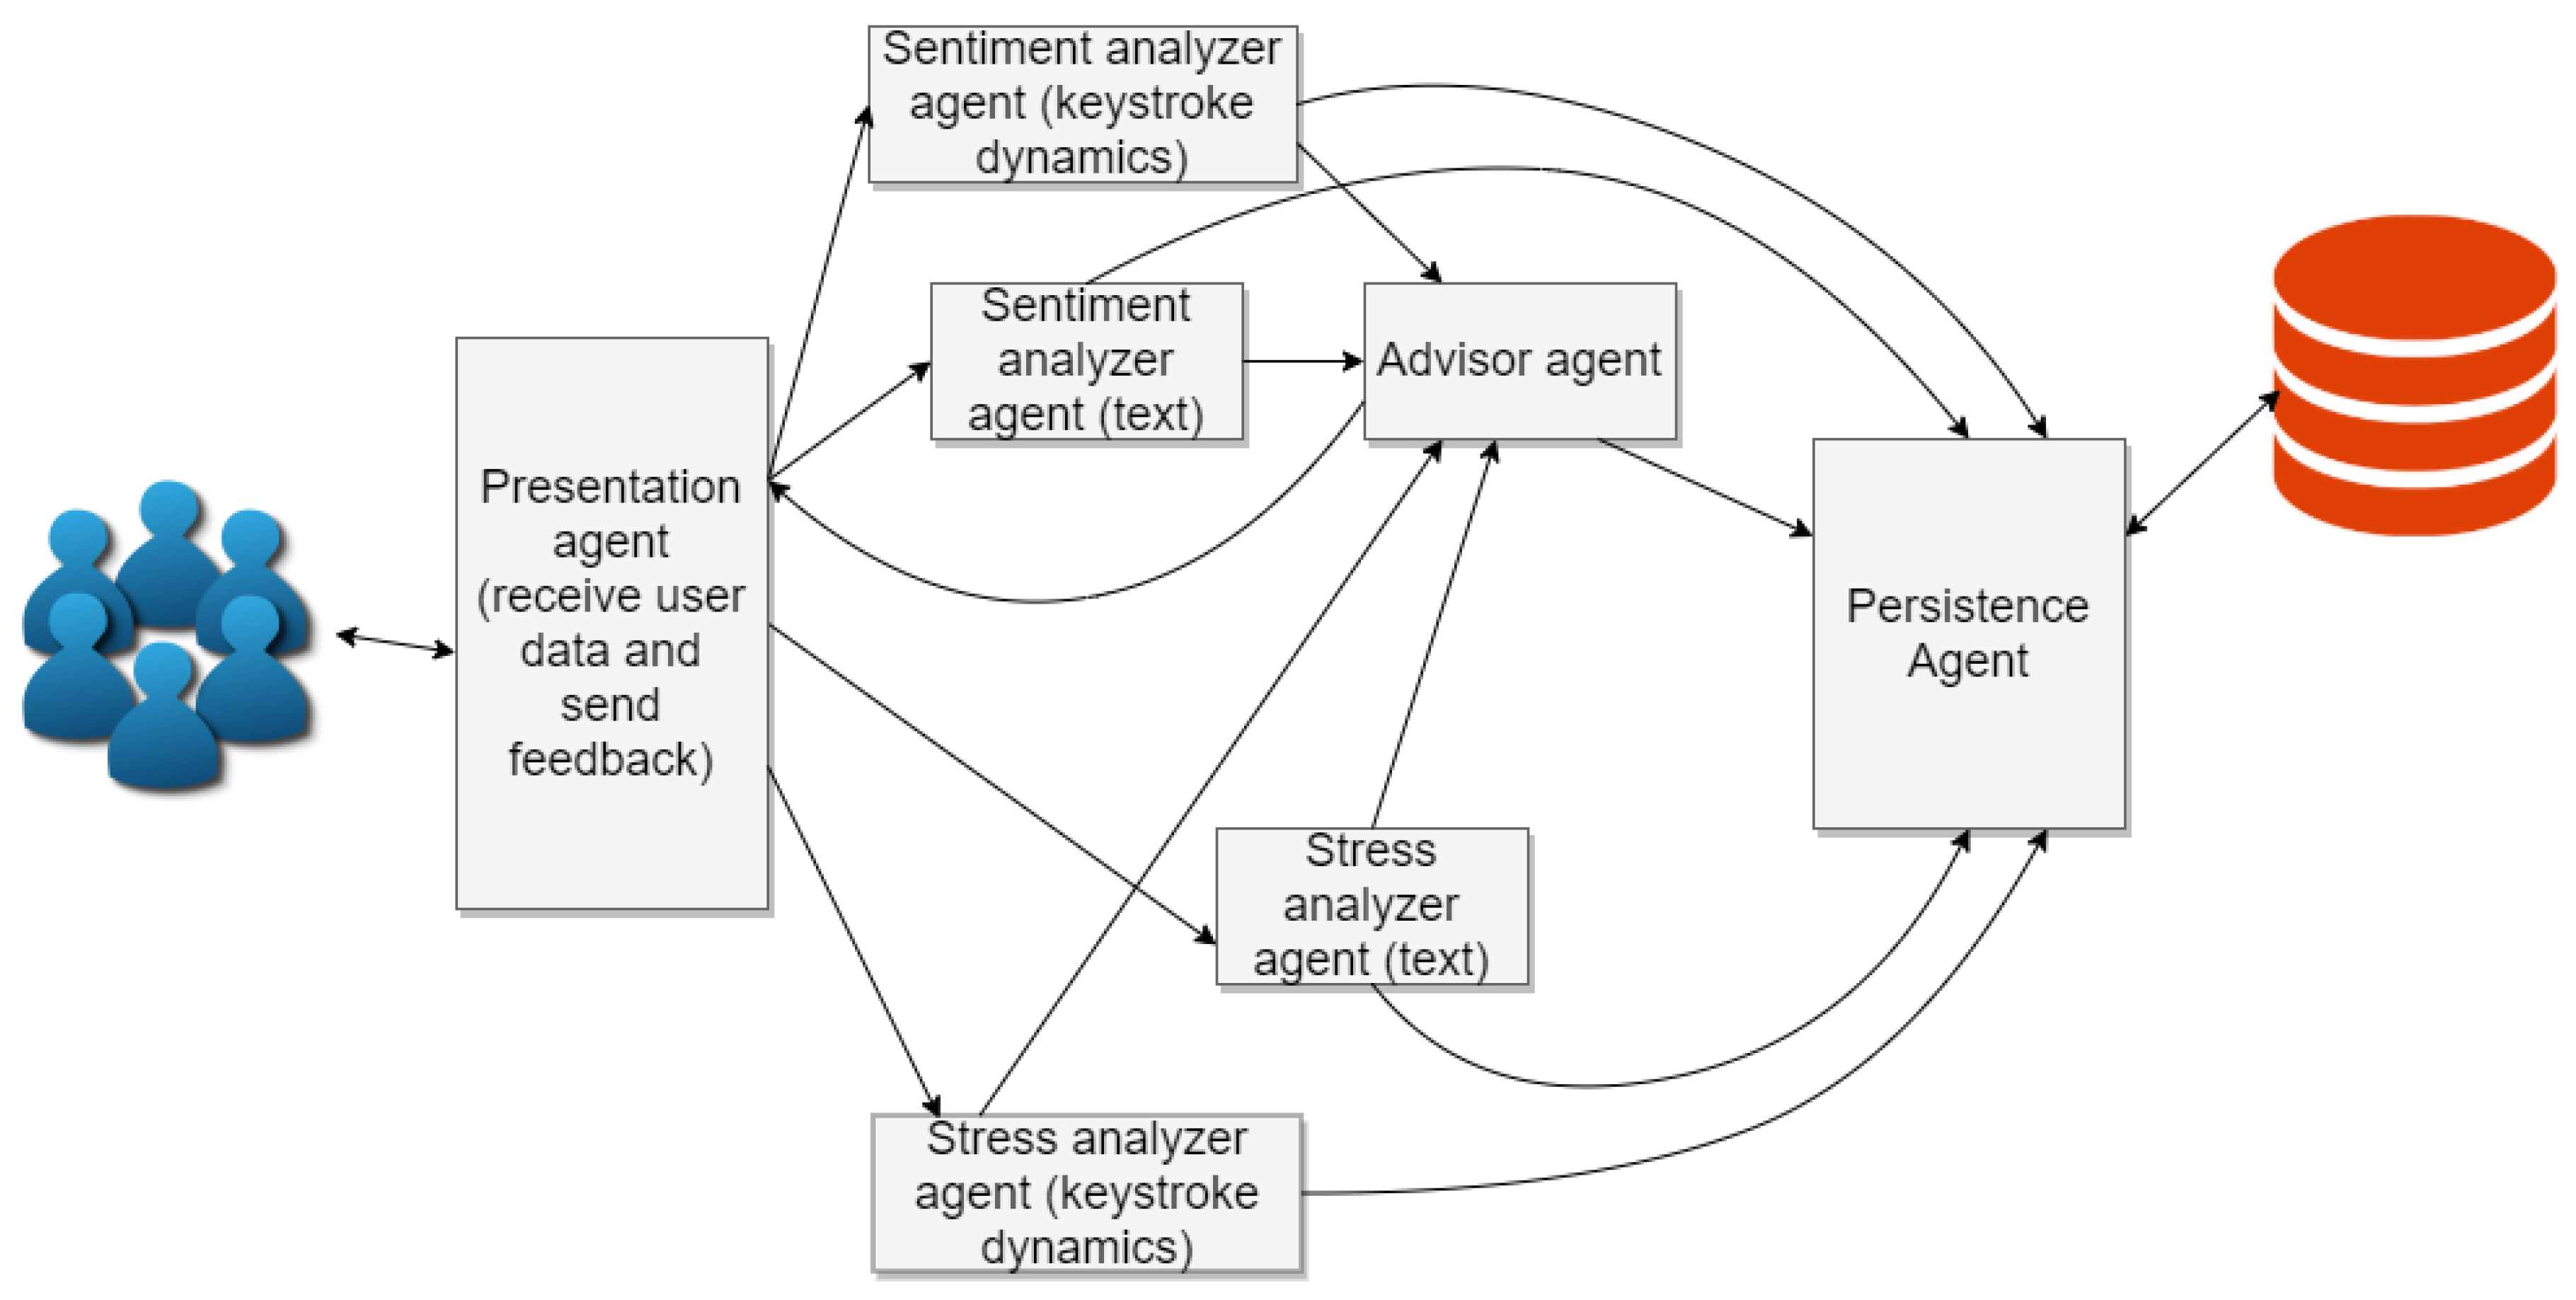
We designed agents that can perform sentiment analysis and stress analysis on keystroke dynamics data, and we implemented and integrated them into a MAS that contains agents capable of performing sentiment and stress analysis on text data, initially presented in [7]. This MAS guides users by analyzing their data when they post a message in a SNS and generating feedback when necessary to prevent potential negative outcomes. The MAS was built using the SPADE Multi-Agent platform [17], and every agent performs a different role in the system. There are agents that retrieve data from users in a SNS and also give back the feedback of the MAS to the users, other agents are in charge of the analyses and feedback generation. Finally, there is an agent in charge of data storage and retrieval in the MAS. A general view of the proposed extended MAS architecture can be seen in Figure 1.
There are four analyzer agents in the MAS, which are the text sentiment analyzer agent, the text stress analyzer agent, the keystroke dynamics sentiment analyzer agent, and finally, the keystroke dynamics stress analyzer agent. The four agents have similarities and differences, but they all take either text messages or keystroke dynamics data as input and give a sentiment polarity or stress level class label as output. The classes for sentiment polarity are “positive” and “negative”, and those for stress levels are “stressed” or “no stressed”. We built the different analyzers using a feed-forward ANN trained with Tensorflow (https://www.tensorflow.org) version 1.8.0 and Keras (https://keras.io) version 2.2.0 in the language Python, in its version 3.5.2. For training the ANNs for the analyzers, two datasets were constructed, made with short text messages and with keystroke dynamics samples of users typing messages, respectively. The samples in the datasets were labeled with an emotion label from a set of five emotions inspired in the PAD temperament model [18] (happy, bored, relaxed, anxious, and angry), and also labeled with a label of “stress” or “no stress”. The dataset was built by users of our SNS Pesedia, who as stated before were both male and female, and had ages compressed in the 12–15 years old range. It was made using self-reporting of the users that wrote text messages in the SNS. This labeling process was not mandatory; thus, only the messages that were labeled were inserted into the dataset. Moreover, for being able to train ANNs that consider only two sentiment classes, a mapping was made from five emotions with “negative sentiments” and “positive sentiments”, based on the values of pleasure, arousal, and dominance of these five emotions in the PAD temperament model. The mapping is the following:
- Happy: Mapped as positive sentiment.
- Bored: Mapped as negative sentiment.
- Relaxed: Mapped as positive sentiment.
- Anxious: Mapped as negative sentiment.
- Angry: Mapped as negative sentiment.
The functionality of the individual agents in the MAS is the following:
- Presentation agent: This agent receives data from users navigating in a SNS through certain widgets that are used by users to interact with the system. Then the agent sends this data of text and keystroke dynamics to the analyzer agents. It also receives the feedback generated by the advisor agent and sends it back to users navigating the SNS.
- Sentiment analyzer (text data): This agent computes a sentiment polarity (positive or negative), using text data.
- Stress analyzer (text data): This agent computes a stress level (low or high), using text data.
- Sentiment analyzer (keystroke dynamics data): This agent computes a sentiment polarity (positive or negative), using keystroke dynamics data.
- Stress analyzer (keystroke dynamics data): This agent computes a stress level (low or high), using keystroke dynamics data.
- Advisor agent: The advisor agent calculates the combined analysis from the outputs of the four analyzer agents, and generates feedback for the users if the message is deemed negative. The final definition of the process used for generating the feedback is extracted after the conclusions reached in the experiments with data from our SNS Pesedia, which are both shown in the next section.
- Persistence agent: This agent receives data from the analyzer agents and feedback generated and stores it in the database of the MAS.
The process of the MAS starts when a message is being written in the SNS, so the data of the text and keystroke dynamics are sent to the MAS, which calculates the values of sentiment and stress level using both sources of data. When those analyses are performed, the information of predicted sentiment polarity and stress level is sent to the advisor agent, which performs two tasks: the first task is to perform the combined analysis using sentiment and stress levels from the analysis on text data, and on keystroke dynamics data. The other task is the generation of a warning for the user in case the message is deemed as negative by the information generated in the analyses. If the warning is generated, then it is sent to the presentation agent, in charge of sending it as feedback to the SNS, and it is also sent to the persistence agent to store it in the database.
Keystroke Dynamics Analyzer Agents
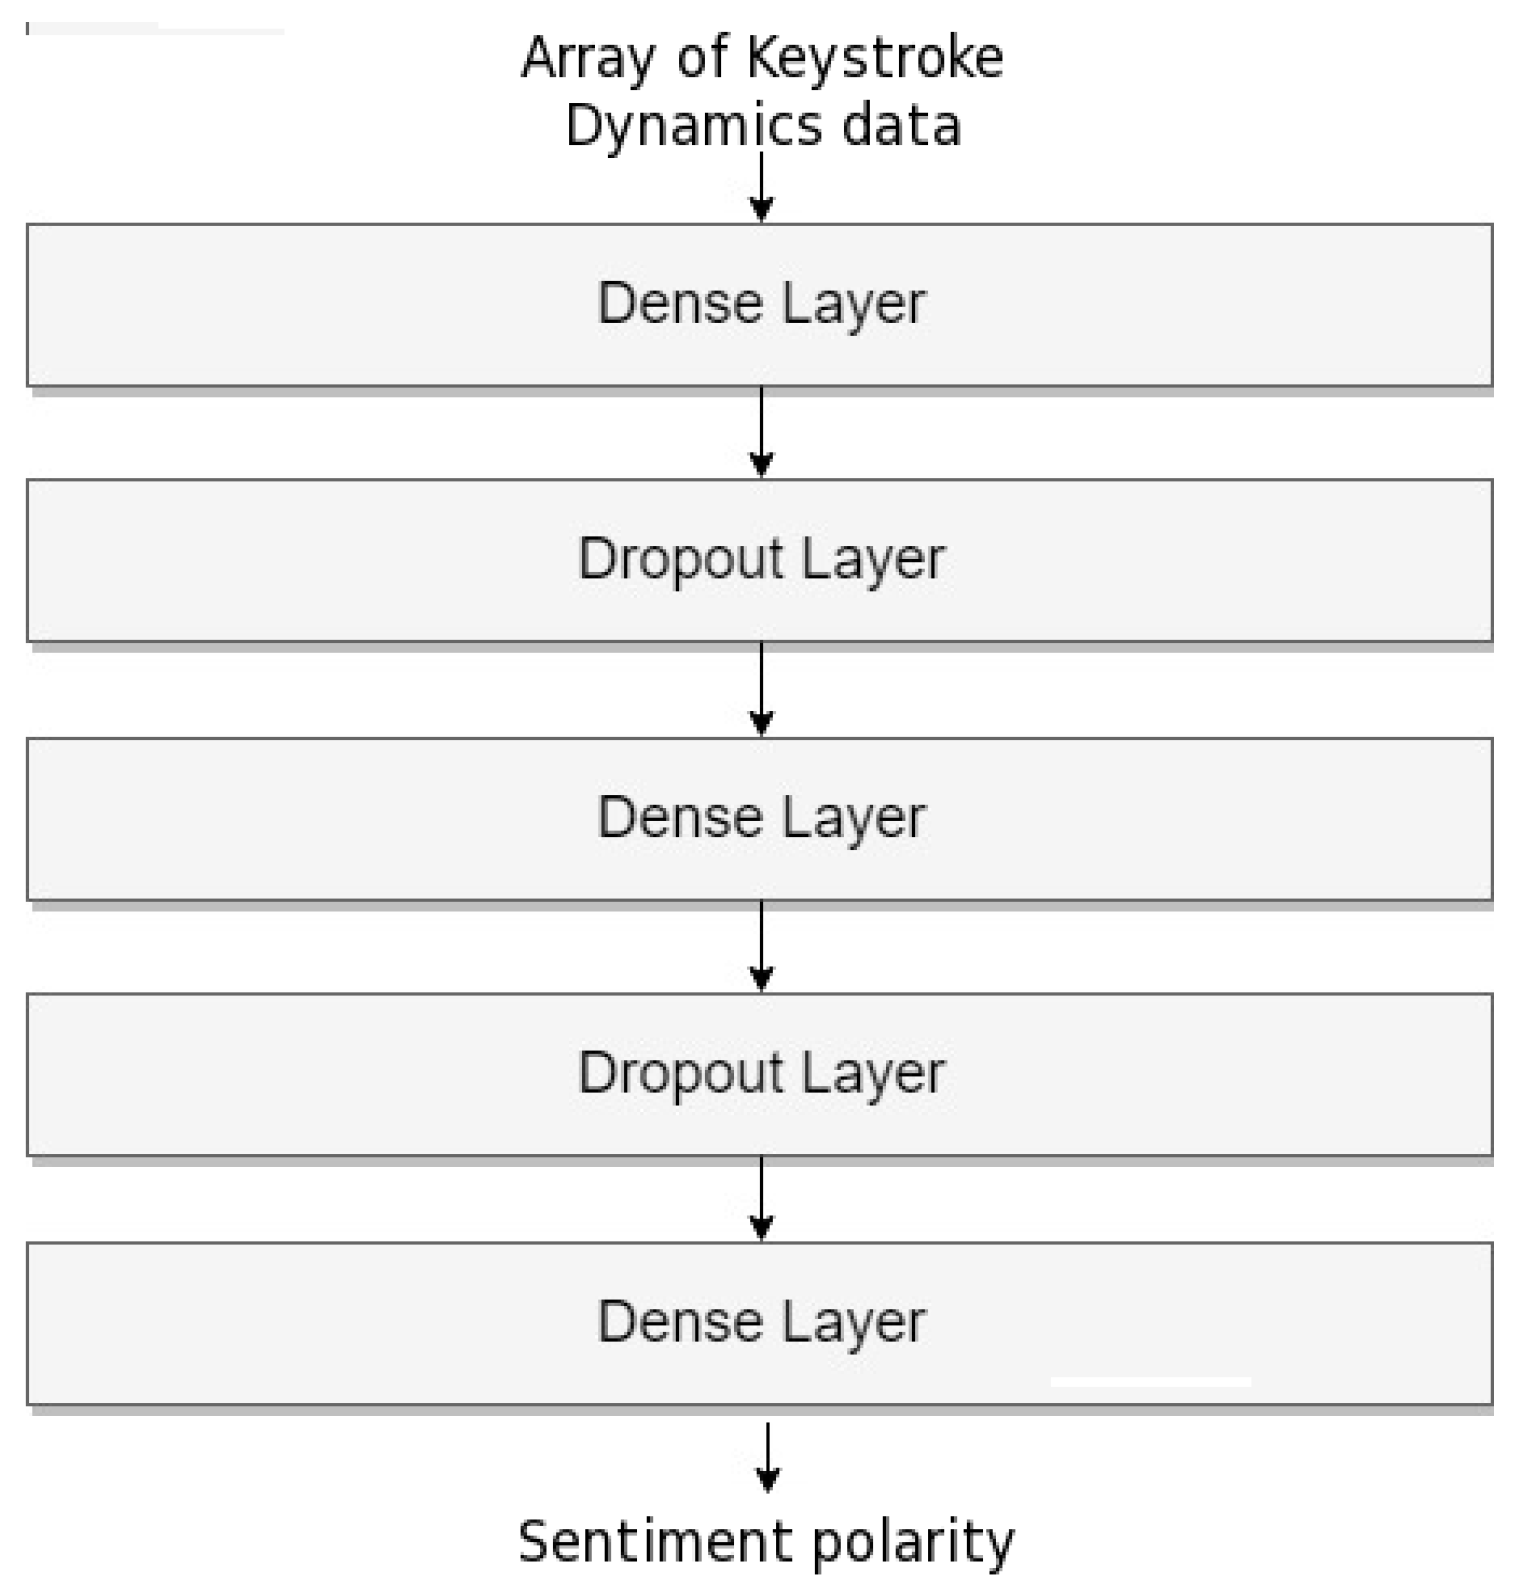
In this section the two new agents that perform sentiment and stress analysis on keystroke dynamics data will be presented, and their design and implementation explained, with information about the training of the machine learning models used. Regarding the keystroke dynamics sentiment analyzer agent, it was trained using keystroke dynamics data from the keystroke dynamics Pesedia self-reported dataset mentioned in this section, and the sentiment labels in the dataset were used during the training of the ANN. The architecture of this neural network can be seen in Figure 2. The collected keystroke dynamics data contains information about the text typing patterns of users, which include text typing speed and character frequency. Text typing speed features included averaged latency for different features, which are listed in Table 1. For the case of character frequency features, the selected ones are the frequencies of pulsation for certain keys, which are listed in Table 1 as well. Several of the features selected are commonly used in keystroke dynamics analysis (e.g., the interval of time between releasing a key and pressing another, the interval for typing a key sequence, the interval between subsequent key presses, dwell time), and digraph and trigraph features apply these concepts to two-key and three-key sequences [13]. The selected typing speed features are the following:
- Key press: Measures the average key press time of users or dwell time (the time a key is pressed), which is included for being able to detect variations on general key dwelling speed that might be caused by sentiment polarities or stress level variations.
- Key release and press interval: Measures the average interval of time which takes a user to release a key and press another one. It serves the purpose of detecting variations of key input speed on a different action that the key press—in this case, the interval between releasing a key and pressing another, which denotes the time in which the user starts inputting different information after finishing one.
- Key press and second press interval: Similar to the previous one, this time the average interval between two key presses is measured. This interval measures the time that the user uses from starting to input one piece of information to inputting another.
- Key release and second release interval: Measures the average interval between two key releases, which represents the time that the user spends from some information being inputted to more getting input as well.
- Key press related to digraphs: Since digraph features are timing characteristics for two-key sequences, this feature measures the key press timing related to sequences of two keys; that is, the average key press timing in the digraphs detected at the text, using a list of common digraphs for detecting them. This feature captures timing information which is associated with commonly typed digraphs, which might offer useful information in addition to the previously presented features.
- Key release and press interval related to digraphs: The feature that measures average release and press interval for common digraphs.
- Key press related to trigraphs: Average key press timing for common trigraphs.
- Key release and press interval related to digraphs: Average release and press interval for common trigraphs.
- Digraph typing: Averaged value of total time for inputting a digraph.
- Trigraph typing: Analog to the previous feature but for the case of trigraphs.
- General typing speed: The feature that represents average typing speed.
The selected character frequency features do not describe or represent keystroke timing information, but instead aim to represent user behaviors such as corrections (delete, backspace) and moving between parts of the webpage (page up, page down, home, end, key up, key down, key left, key right), which might be affected by the sentiment polarity or stress levels. Four commonly used keys are also used as frequency of pulsation features, completing the set of frequency features, which are enter, space bar, shift, and caps lock. Since they are commonly used keys, the differences in the frequency of pulsation might be informative for the machine learning model for predicting sentiment polarities and stress levels, since these states of the user could affect the frequency in which they are used.
The feature vectors, which are fed to the ANN shown in Figure 2, are vectors of floating-point numbers, corresponding to the presented text typing speed features, followed by the key frequency features, in the order in which they are shown in Table 1.
These data were collected in our SNS Pesedia during a period of one month, and the users were able to self-report on their emotional states and stress levels, adding finally to the dataset only the samples in which the reports of the user states were actually done. These data were later processed with a Python script to generate a file that could be used to conveniently feed the ANNs with arrays with the data on the different characteristics, and for eliminating any potential missing data to ensure correctness before starting the training and validation process of the models. The file contains a total of 12,313 data samples. For training the models used in the final system, 10% of the data samples were used for training and 90% for the validation of the models.
In the architecture of this ANN, the array containing the keystroke dynamics data in the form of floating-point numbers is fed directly to the first dense layer. In Figure 2 we can see that there are three dense layers in the architecture of the ANN, with two dropout layers placed between the dense layers acting as a regularization mechanism. The dropout rate of 0.25 in both dropout layers and the architecture of the network were both adjusted experimentally aiming for better accuracy, and for a confusion matrix that showed an equilibrated distribution between the two classes. Several other parameters of the ANN were also adjusted experimentally, which were the sigmoid activation function being used in the dense layers, the inputs, outputs, and neurons of each layer, using binary crossentropy as the loss function for training, and using an Adam optimizer [19]. The inputs in the dense layers are in order: 25, 64, and 64—with outputs and neurons 64 in all three except in the final dense layer, which is 2. The input vector is the array with the selected features explained in this section; the output 2 in the final dense layer represents the two possible classes (negative and positive sentiment polarity); and finally, the rest were adjusted experimentally as explained before. The dropout layers have the same input, output, and neurons of 64 since they are connected between dense layers, acting as a regularization mechanism. In the validation process, 61% accuracy was reached, which is lower than the accuracy achieved in state-of-art aspect-based sentiment analysis using supervised machine learning (68.0% to 77.2%) [9], and is on the low side of the accuracies of techniques for discriminating between different affective or valence states using keystroke dynamics (57% to 95.6%) [20]. This could be caused by the dataset of keystroke dynamics data, as it is not a very big dataset and was made using self-reporting by young people.
In the case of the keystroke dynamics stress analyzer agent, we used the same ANN architecture as the previous agent, as it was found experimentally to be the best for model accuracy. Again, the keystroke data in the dataset was used for the training, but this time using the stress labels to train the model. Finally, in the validation process, 64% accuracy was reached this time; that is better than the case of the keystroke dynamics sentiment analyzer agent, and is higher than the accuracies found by using different machine learning methods for stress strength detection as shown in [6], but is lower than the accuracy of 75% reported by [14] when detecting stress via a combination of keystroke dynamics and linguistic analysis. There were machine learning methods employed for detecting stress using keystroke dynamics with user personalized models (detection of stress with models trained to identify stress in a concrete user), which reached nearly 90% accuracy [20], and 96.76% to 99.5% accuracy detecting stress states based on the time of the day [21]. However, since these methods are based on user personalized models, they are not comparable to our approach, which is based in user-independent models (we use the same models to predict stress in all the users instead of personalized models).
4. Experiments with Data from the SNS Pesedia
We conducted experiments with our SNS Pesedia during a period of one month. During that time, we gathered the text and keystroke dynamics data of the user when he or she made a post on Pesedia, so we could analyze these two sources of information in later experiments. As stated previously, Pesedia was used by children with ages ranging from twelve to fifteen years old. In Pesedia, the users can perform several actions related to social interaction in SNSs. These actions include: posting messages on their walls or other peoples’ walls; sending private messages; creating groups and inviting people; making friends; sharing content with certain people; making lists of people. In our experiments, we make use of the messages posted on walls and groups and their replies. We also use the concept of propagation. By propagation, we refer to the fact that a detected state by an analyzer on a message is also found in the majority of the replies to the message in which the state is detected. Only direct replies are considered, not replies to replies. This design decision was taken to be able to study the effect of the emotional state detected in a message on its replies; in future works the effect in multiple levels of replies or other messages might be tested.
Our aims in the experimentation are two-fold: to discover whether the new analyzers integrated into the system predict a state that propagates more in the network, and to know which analyzer achieves the best propagation in general. In this way, we would be able to know which analyses can be more helpful for the feedback generation to the user, aiming to prevent a negative repercussion on the social network. On the other hand, to be able to know whether the combined analysis is able to detect a state of the user that propagates more in the network than the analyses using only text or only keystroke dynamics data.
4.1. Metric for the Experiments
In this section, the metric that is used in the experiments will be explained using a formula. This metric is propagation of detected value (PDV). The following terms are later used for the formula of the metric:
- messages_with_replies: Total amount of messages that generated replies.
- messages_with_propagated_state: Aggregated value of messages with the propagated state, which are messages with the same detected state as is present in most replies.
The following formula describes the calculation of the metric used in the experiments conducted:
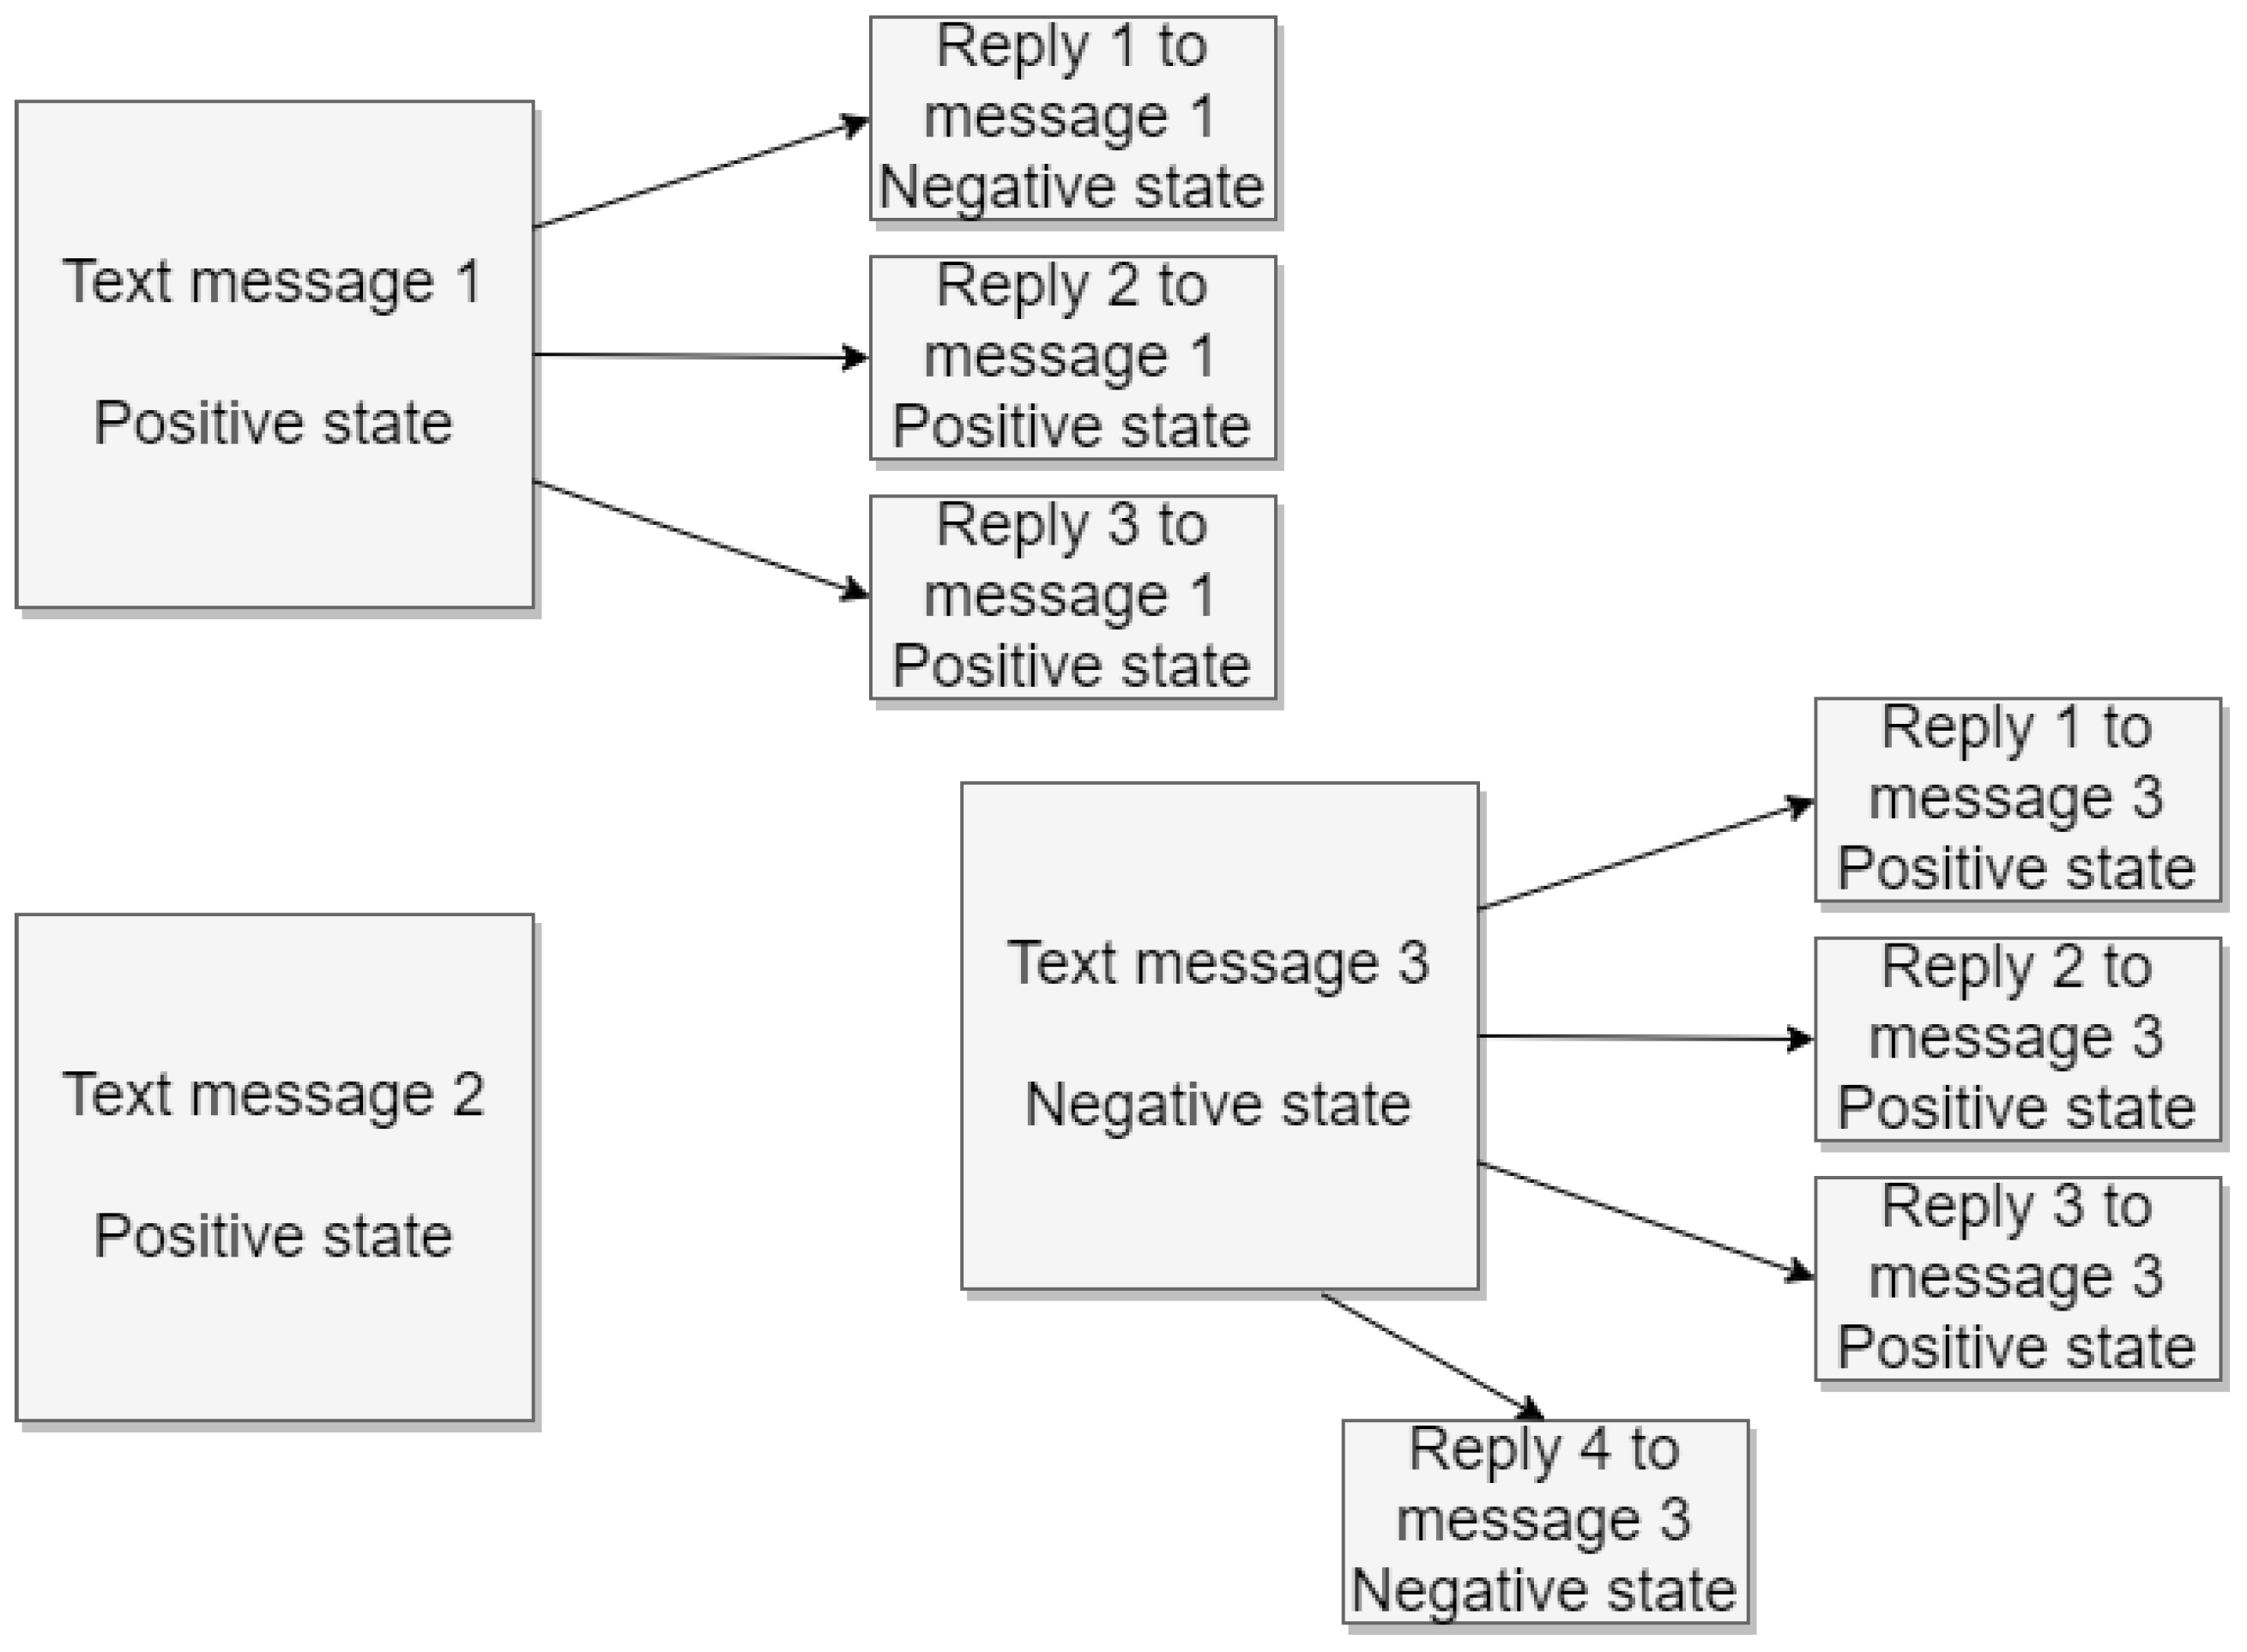
For the sake of example, we propose the following scenario: There are three messages posted in the social network, two of them with replies and one without. All the messages and their replies have been analyzed and a state associated with them by the system. This can be seen in Figure 3. As can be seen, the first message generated three replies and two of them were positive (making the most present value in the replies positive), so there has been propagation from the original message to the replies since this original message also resulted in positive state. For the case of the third message, there is no propagation since there are three replies detected as positive and only one negative, and the original message was detected as negative. In this scenario, messages_with_replies would be computed as two, since only two messages have replies. For computing Messages_with_propagated_state, we summed the number of messages that generated replies and propagated the state detected in them to those replies. As has been said, only one of the messages propagated the state to the replies; therefore, the value of Messages_with_propagated_state in this example is one. Finally, the value of PDV for this example would be computed as 0.5.
4.2. Plan of the Experiments
We used the messages that had or generated replies in the network for our experiment and used the text data and keystroke dynamics data of the user writing those messages. The goal of the experimentation was to compute the propagation of the detected value in the messages in the network, by comparing this value to the most present value detected in the replies of the messages. This propagation was measured for the different analyses that we had available, which were sentiment, stress, and combined analysis using text, and then again sentiment, stress, and combined but using keystroke dynamics data. We also computed the propagation for a combined analysis that used both combined sentiment and stress analysis on text data, and combined sentiment and stress analysis on keystroke dynamics data.
We performed the training of the ANNs that would conduct the different analyses using different partitions of the training dataset mentioned in Section 3 each time. We performed five different partitions of the dataset. In this way, we obtained five ANNs trained to detect sentiment and five trained to detect stress levels on text data, and again five ANNs to detect sentiment and five to detect stress levels with keystroke dynamics data, using different partitions of the data for training each one. This process was done for being able to analyze not only differences between analyzers, but also for exploring the differences of ANNs trained with different data. For this purpose, we proceeded to perform experiments with the data not used for training (we separated the messages that were used for training from the dataset for conducting these experiments), comparing the ANNs that detected sentiments with the ones that detected stress labels on text data, and the same with the ones that operate with keystroke dynamics data. That resulted in a total of 25 experiments on text and 25 on keystroke dynamics data, since we compared every pair of text ANNs and every pair of keystroke dynamics ANNs.
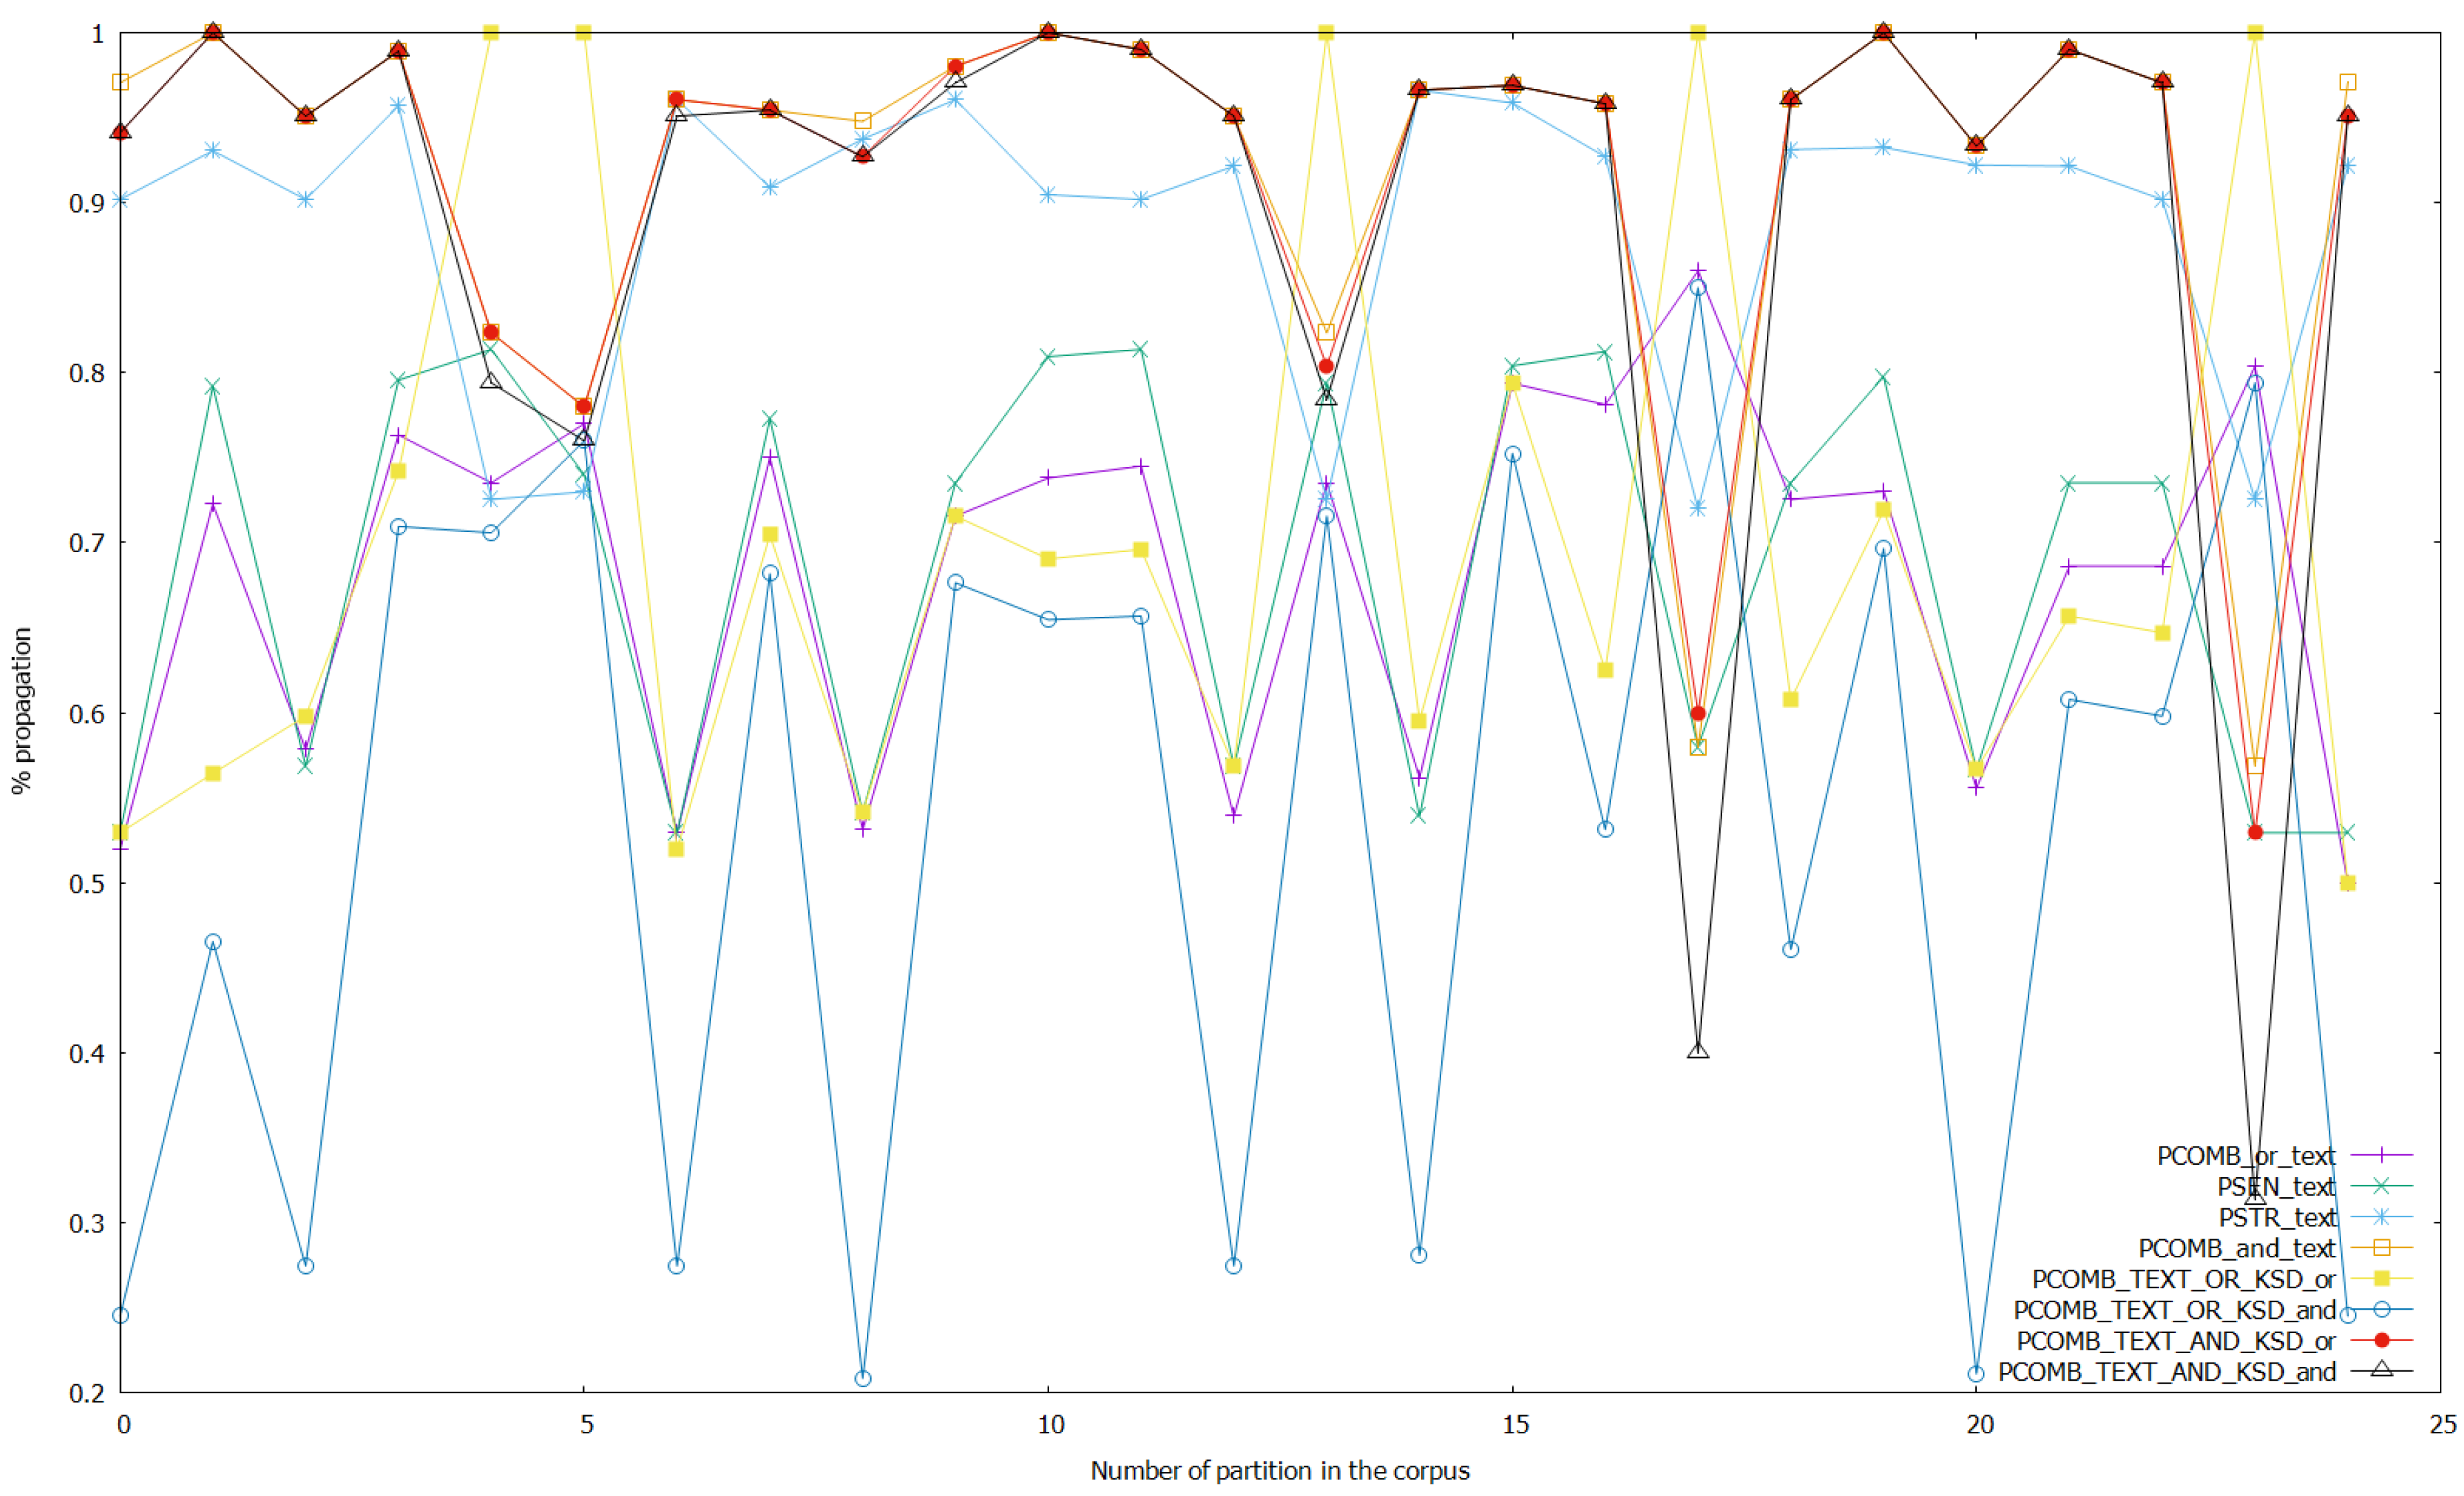
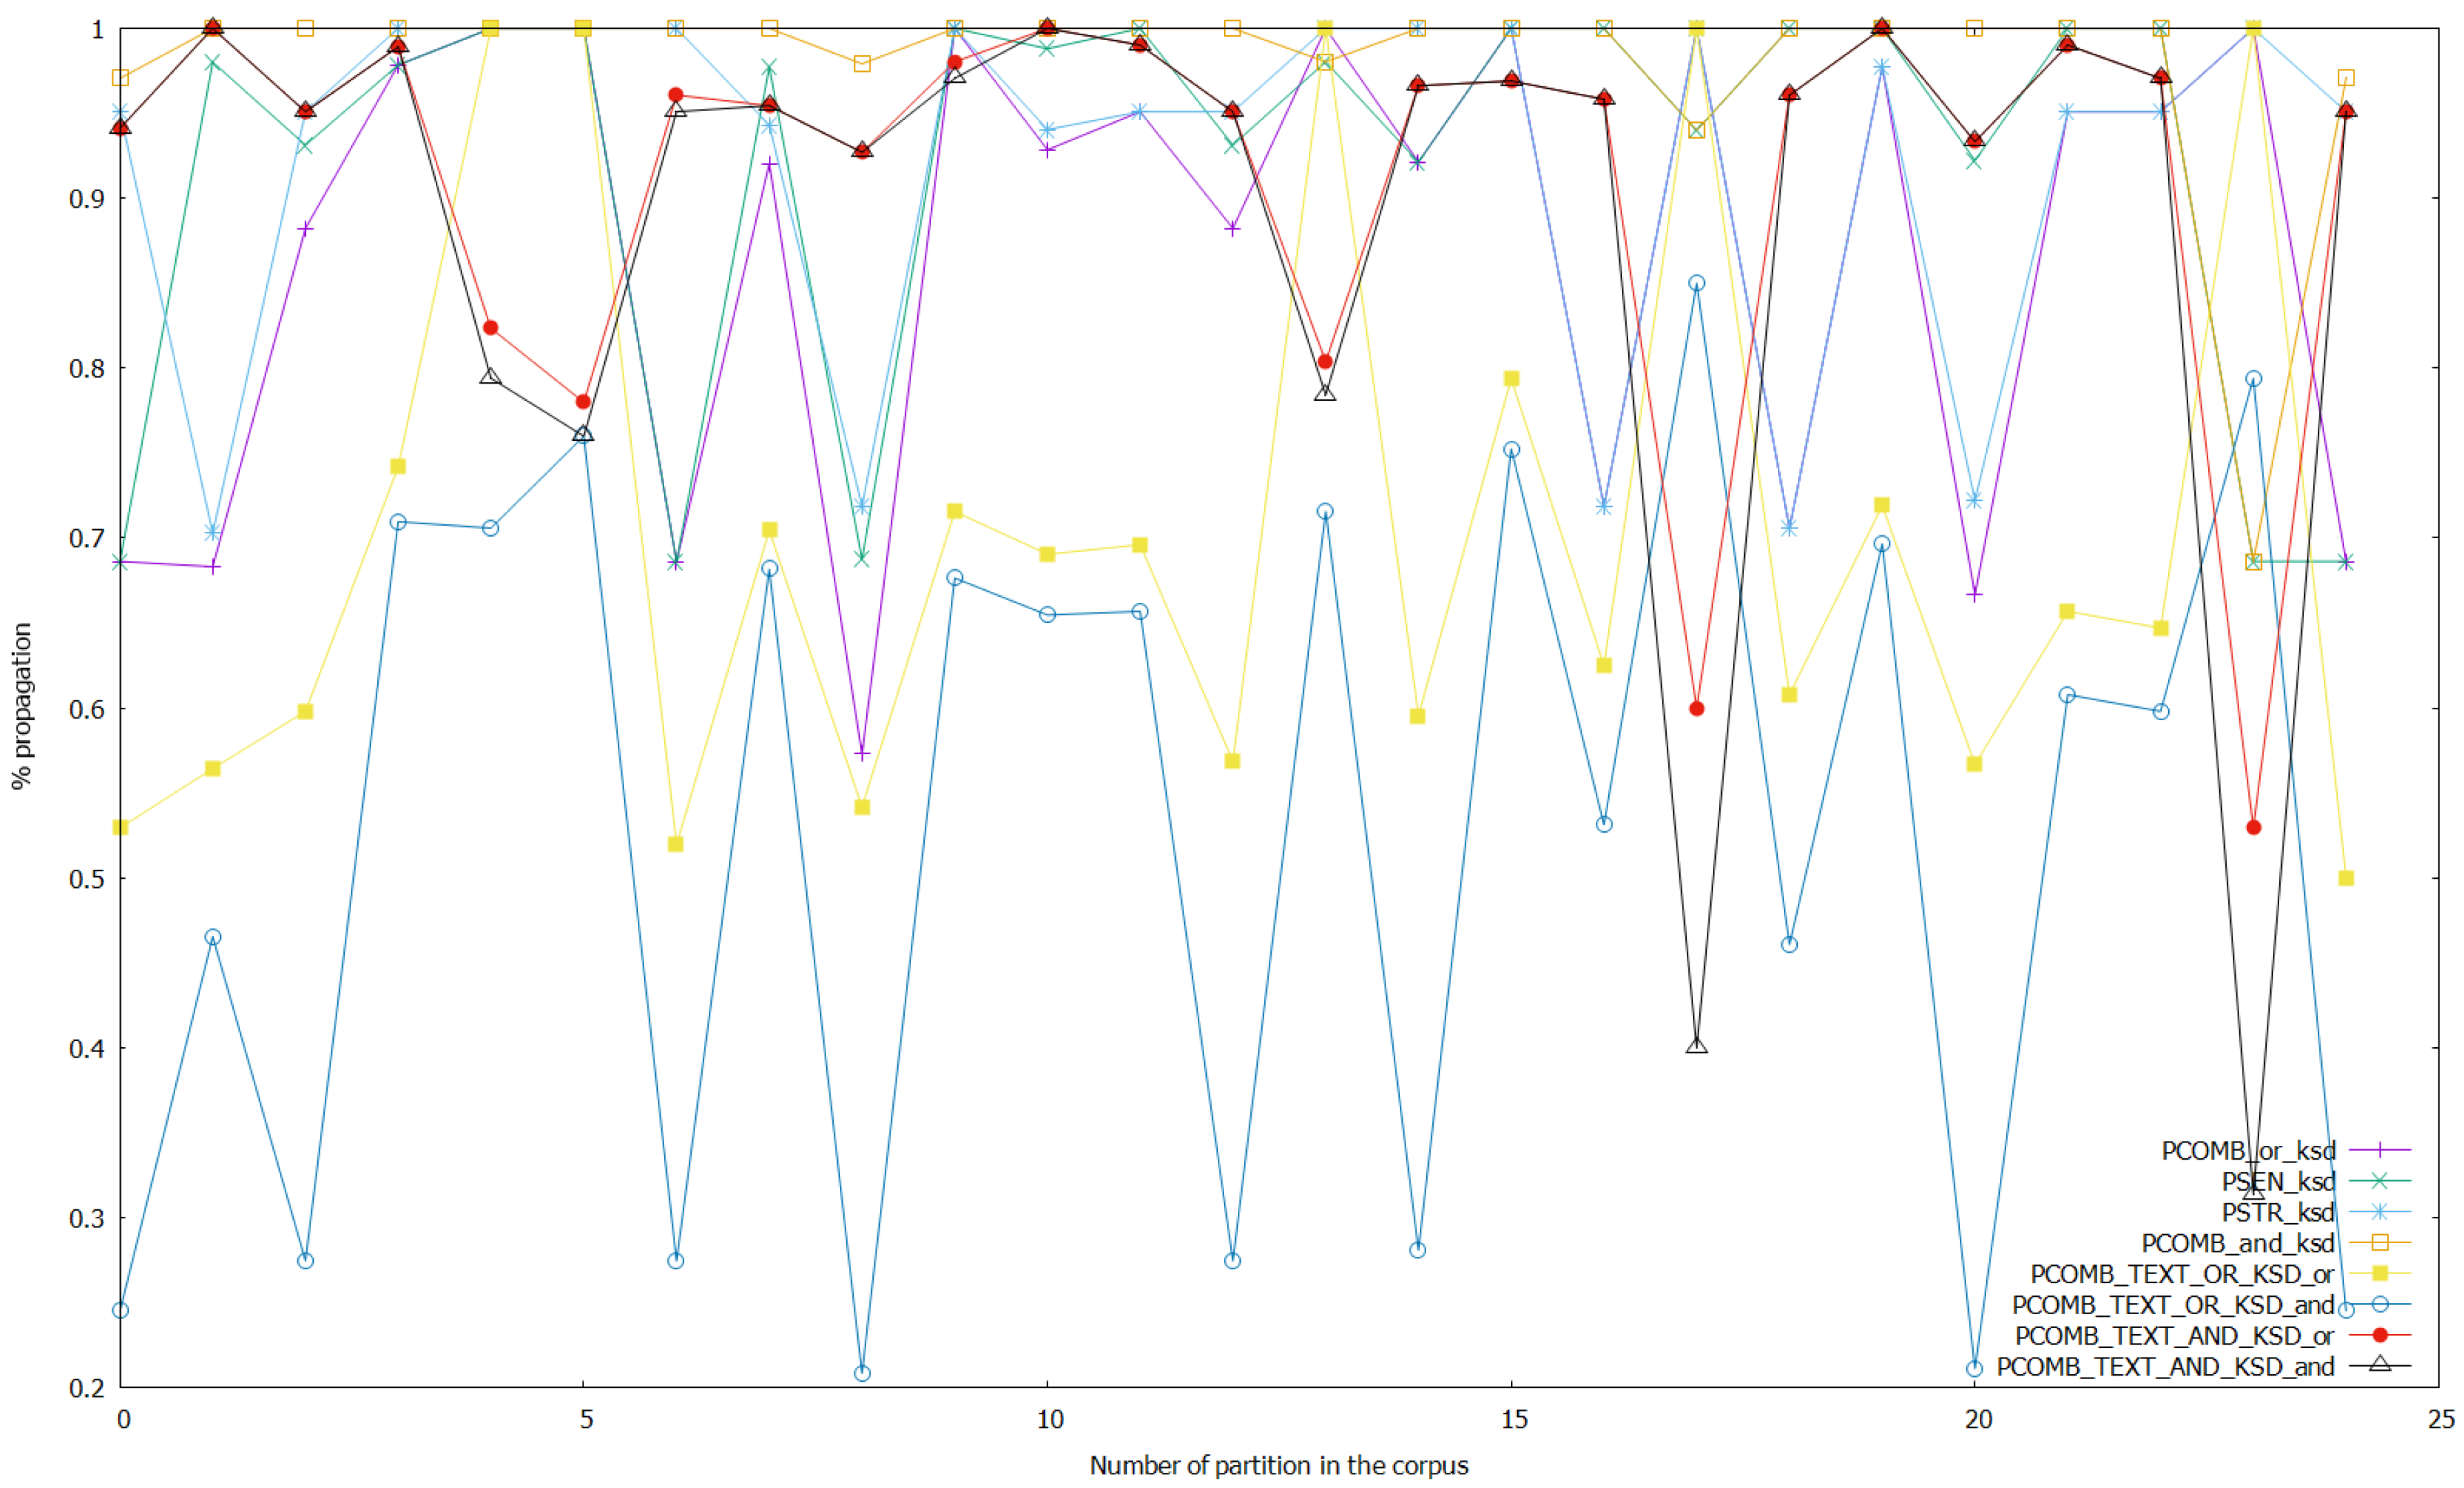
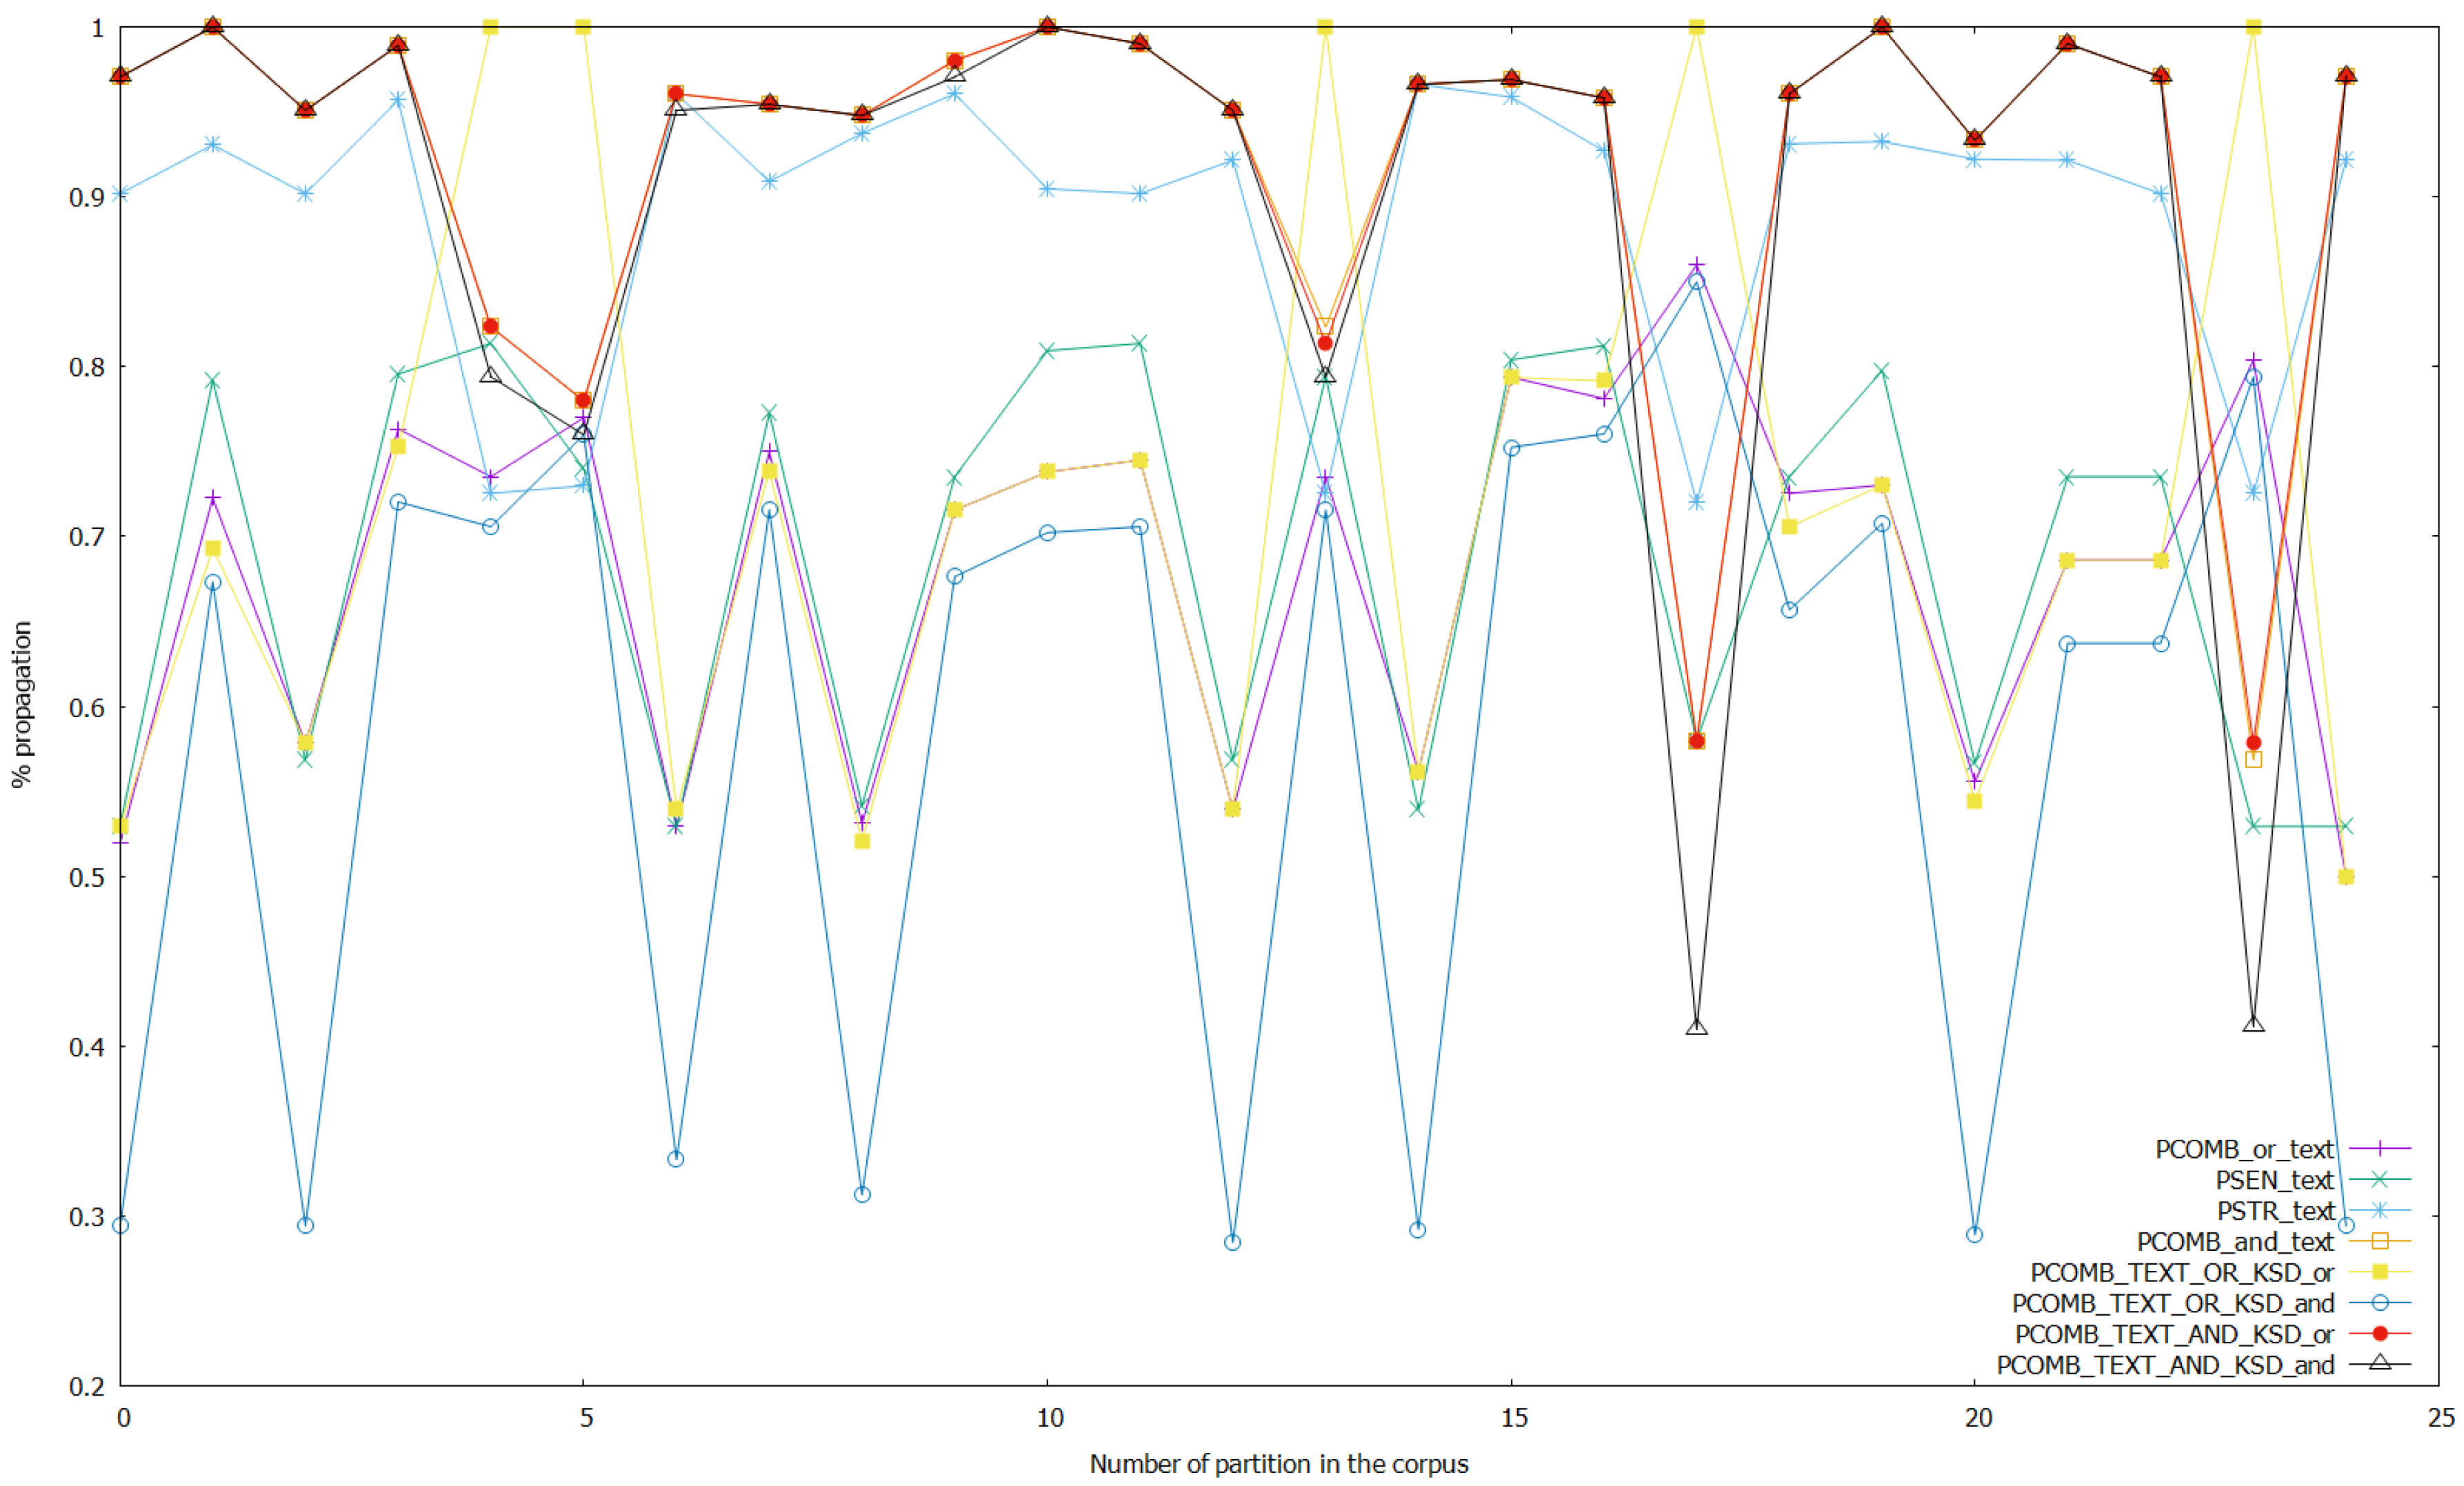
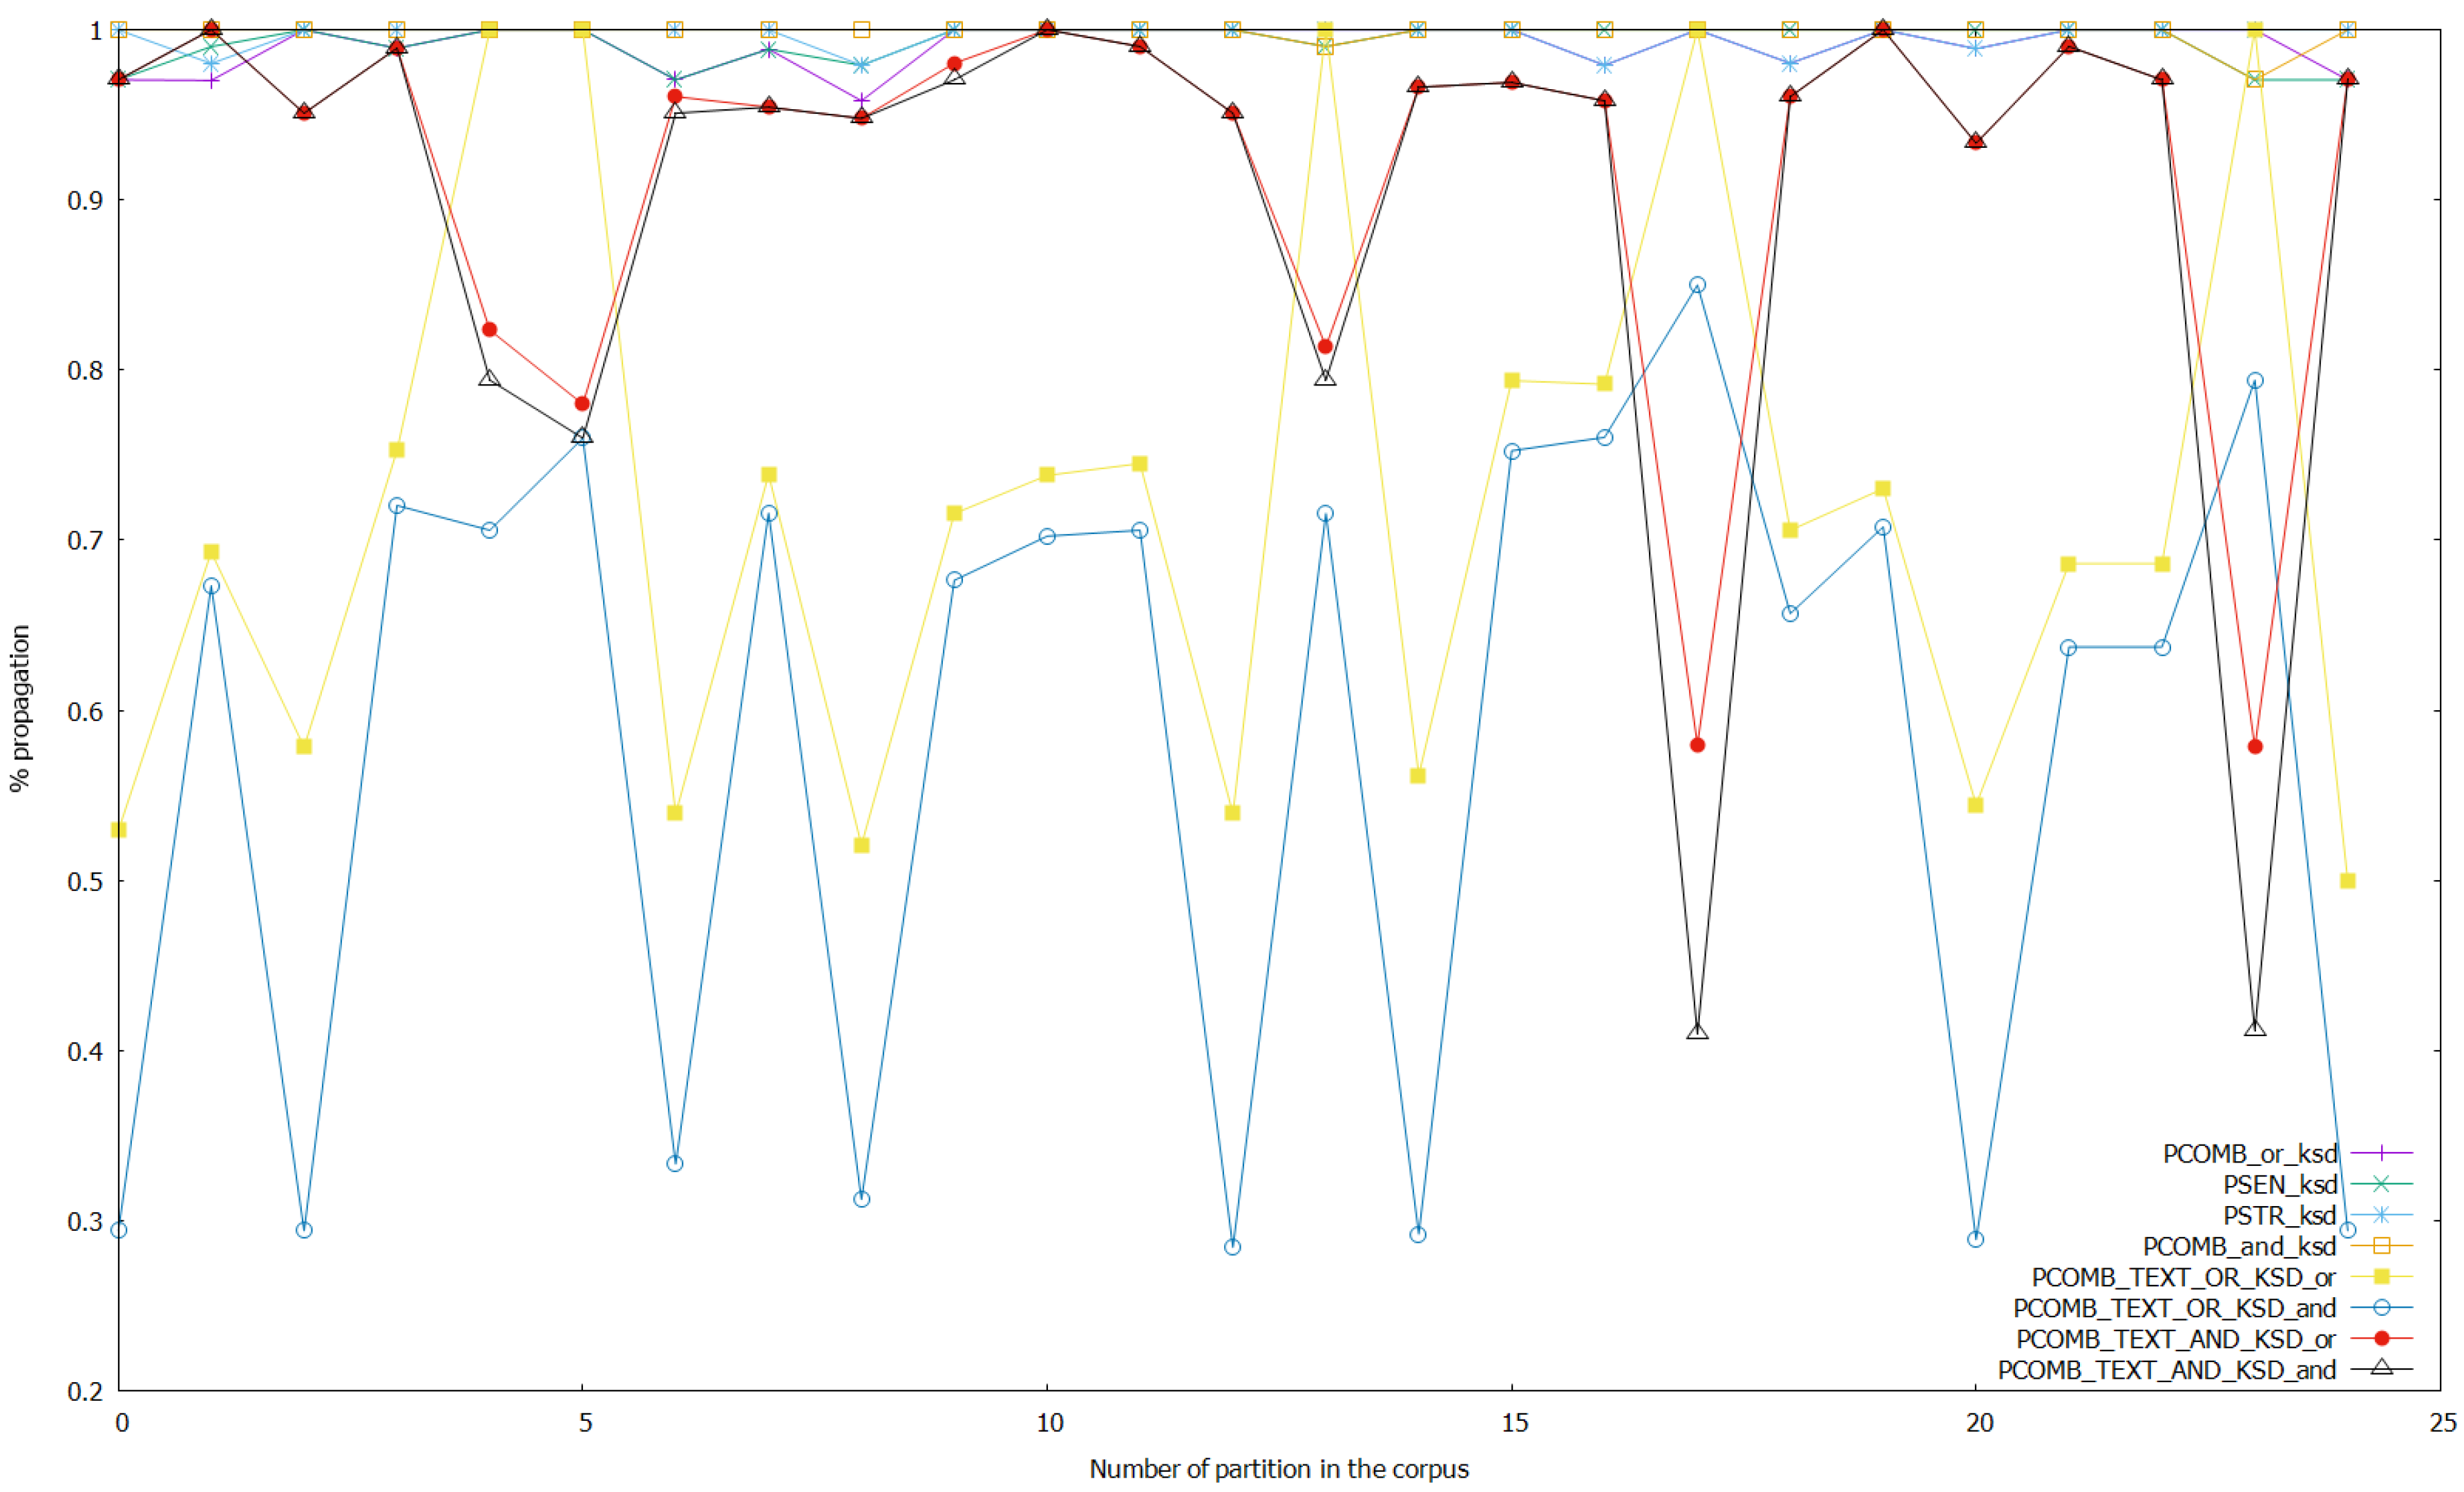
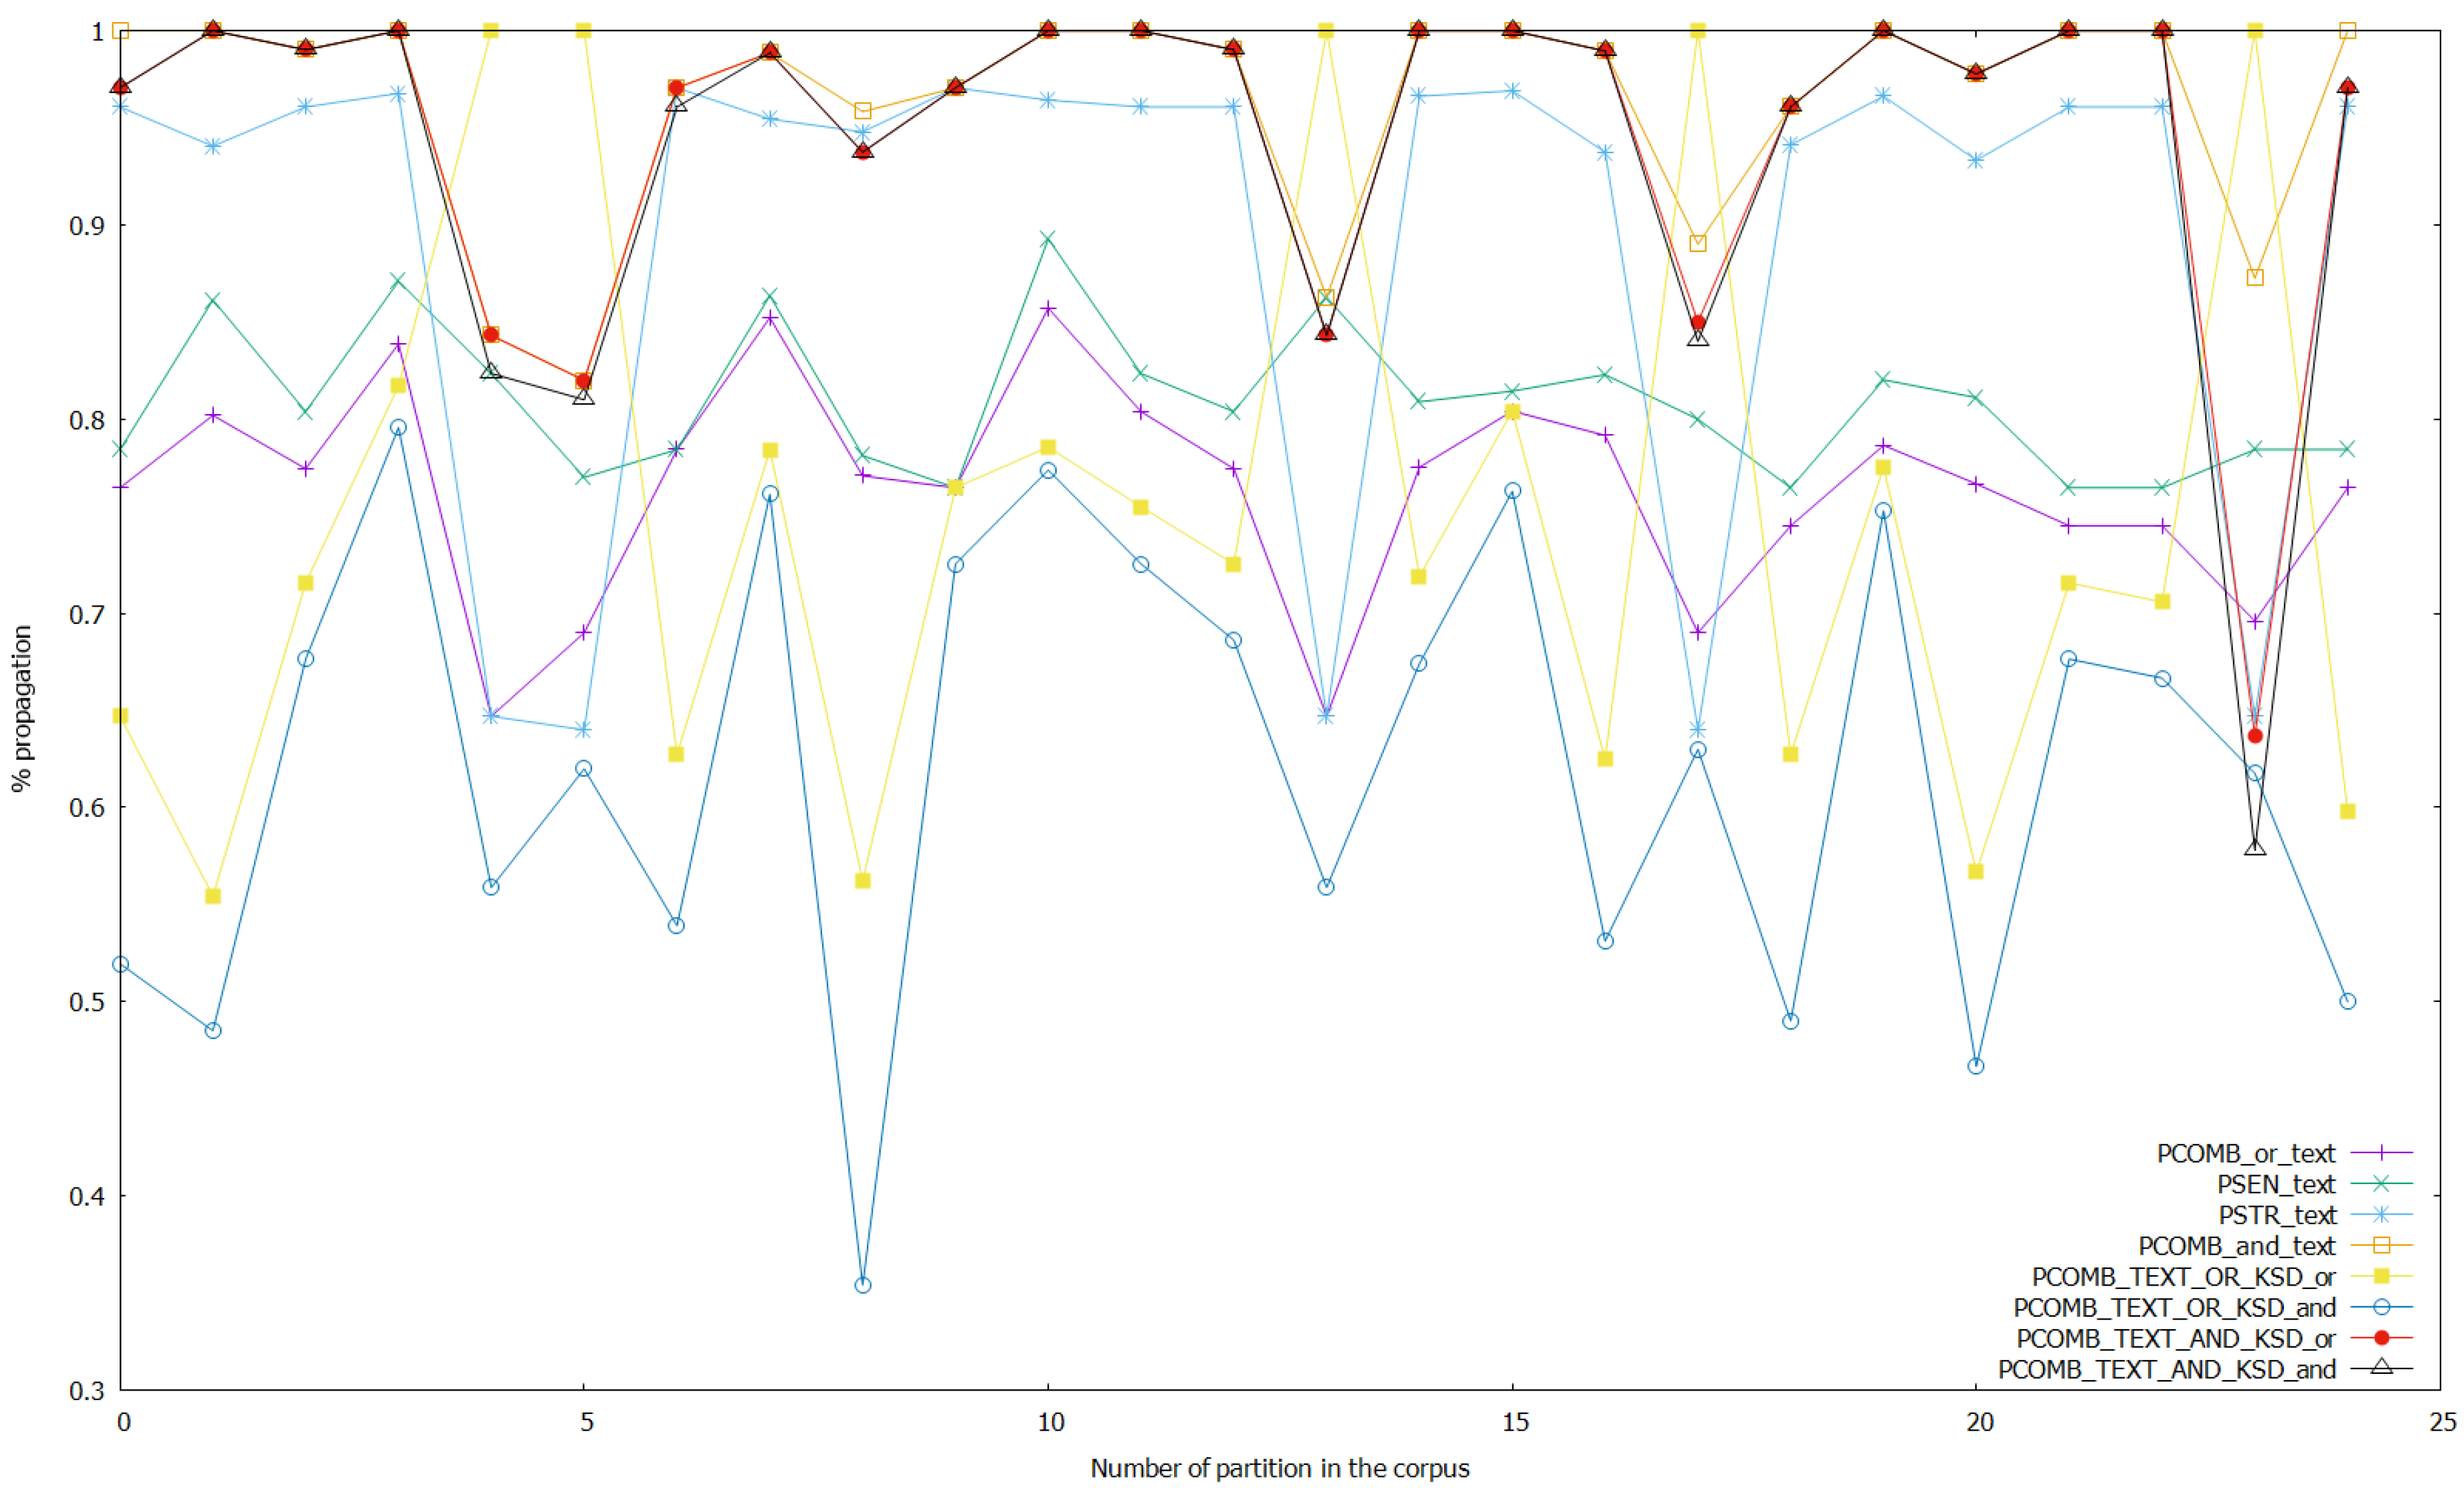
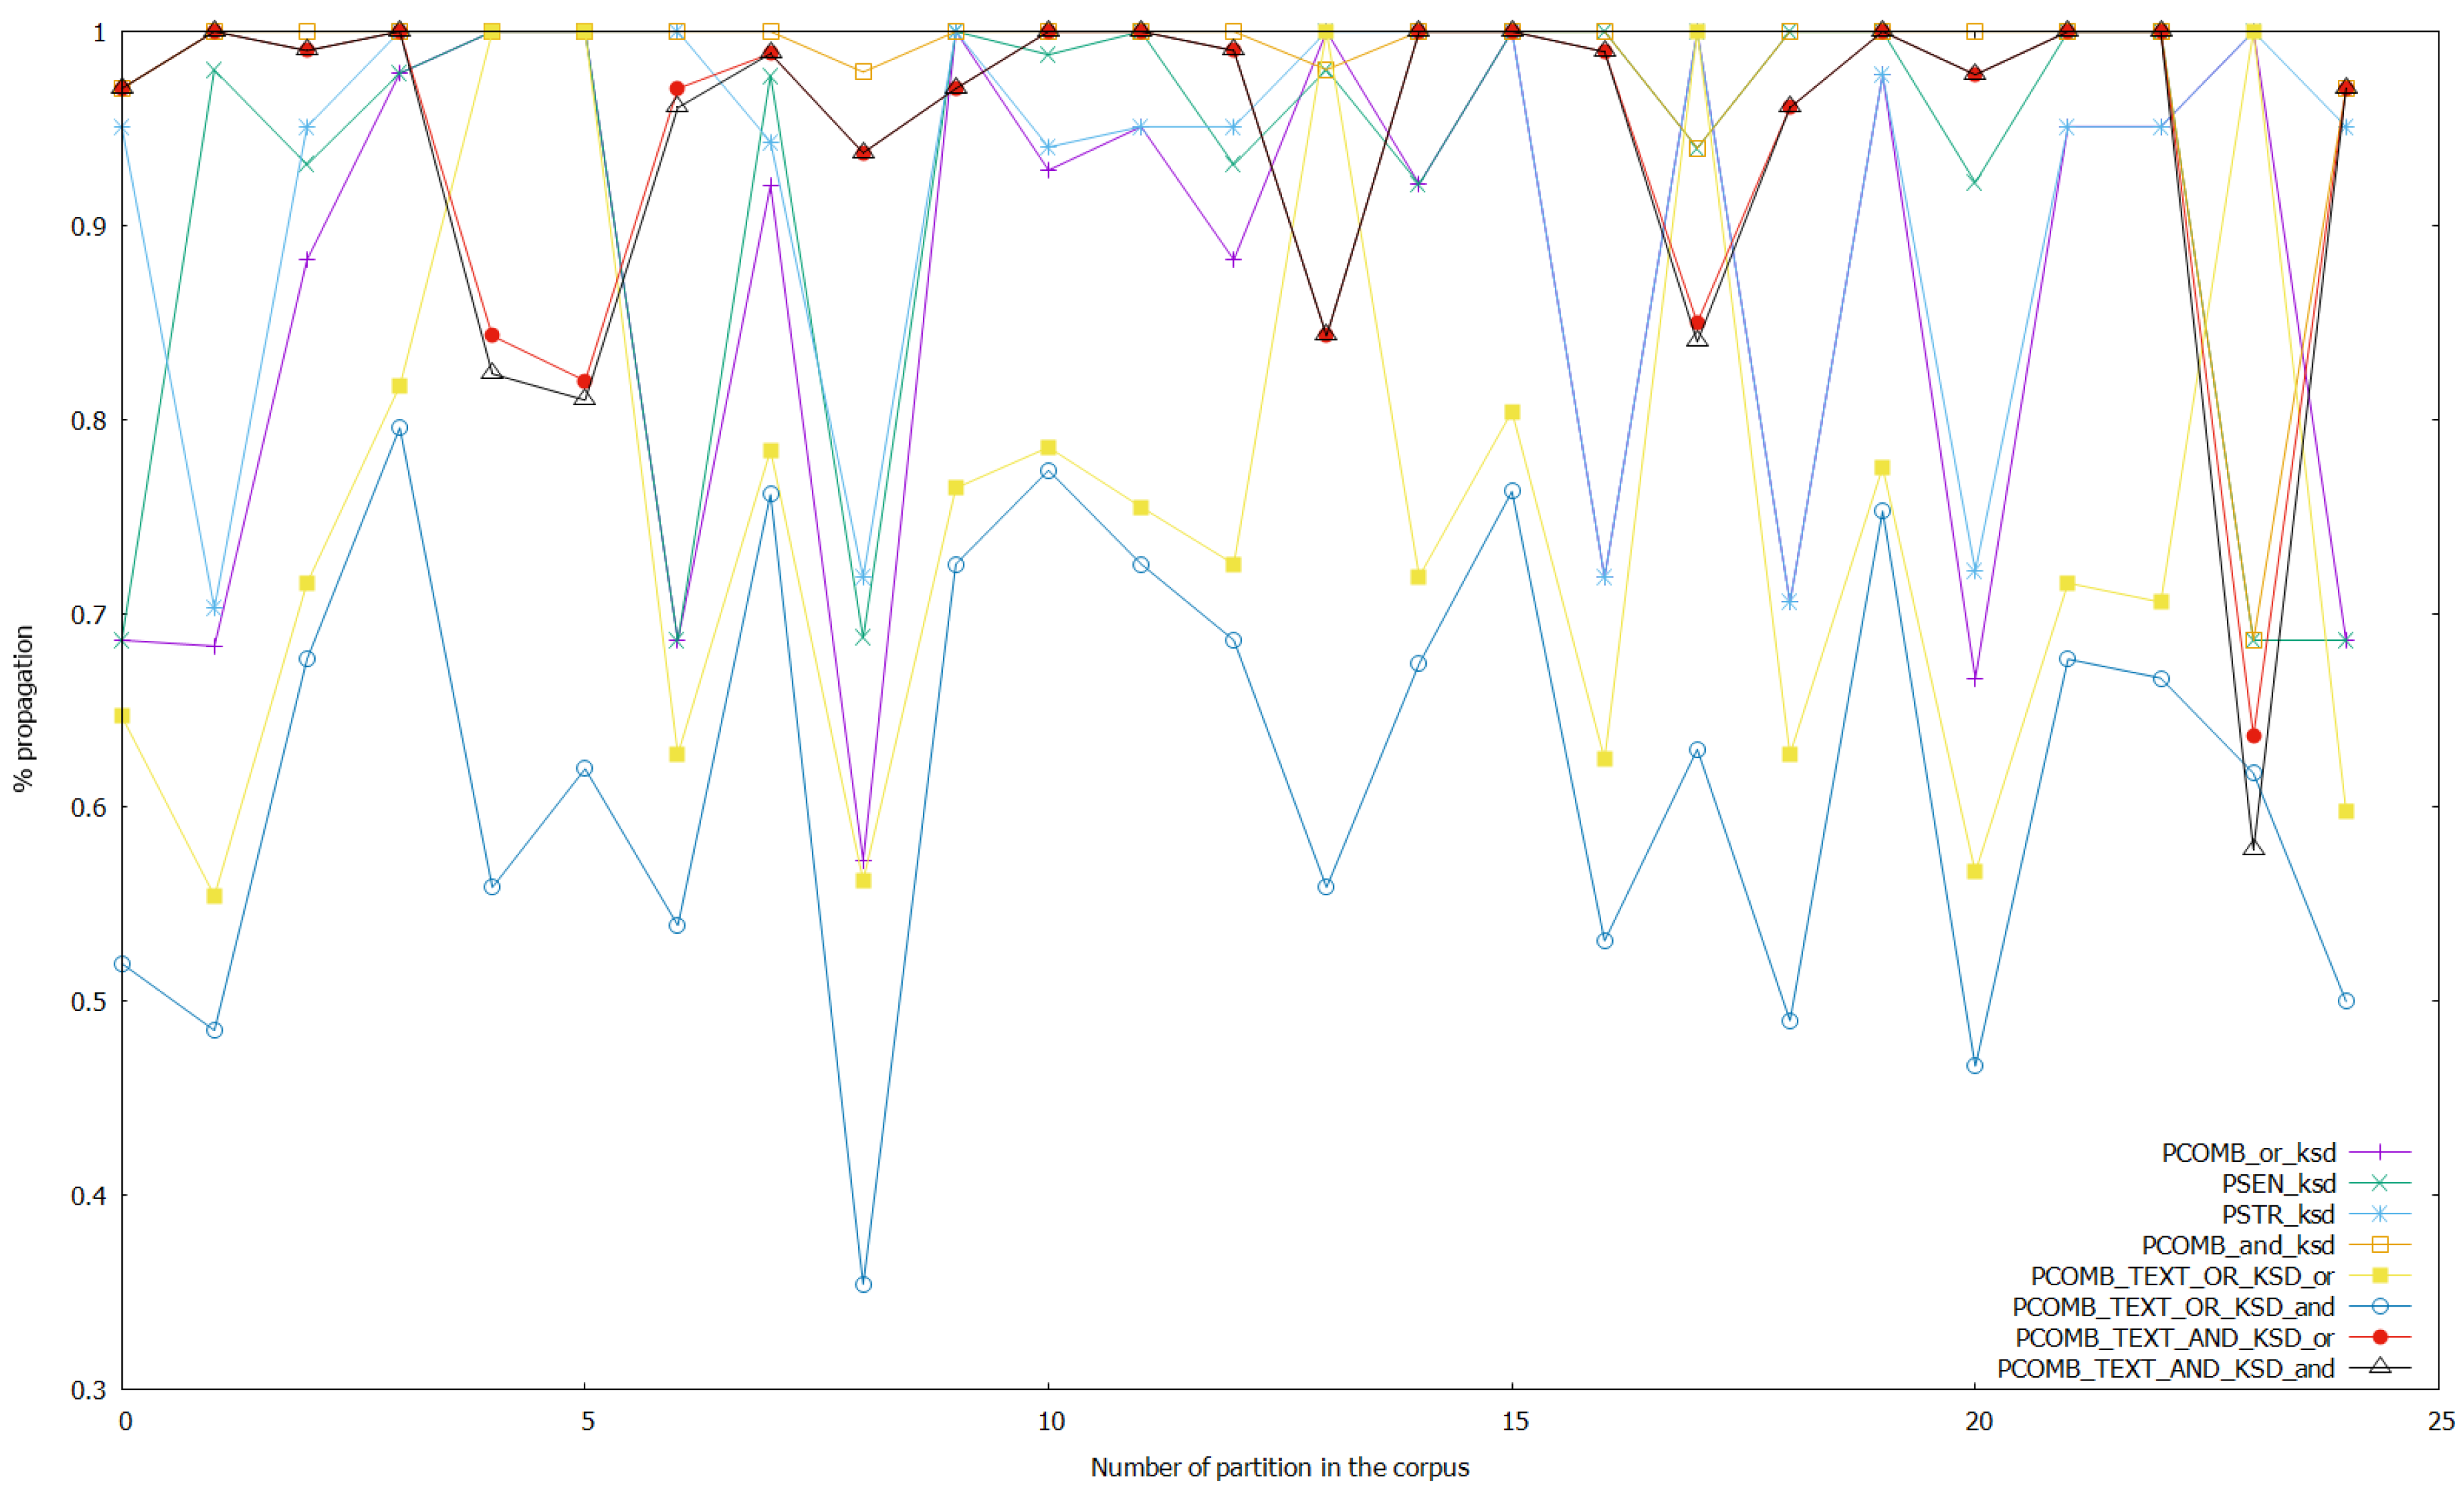
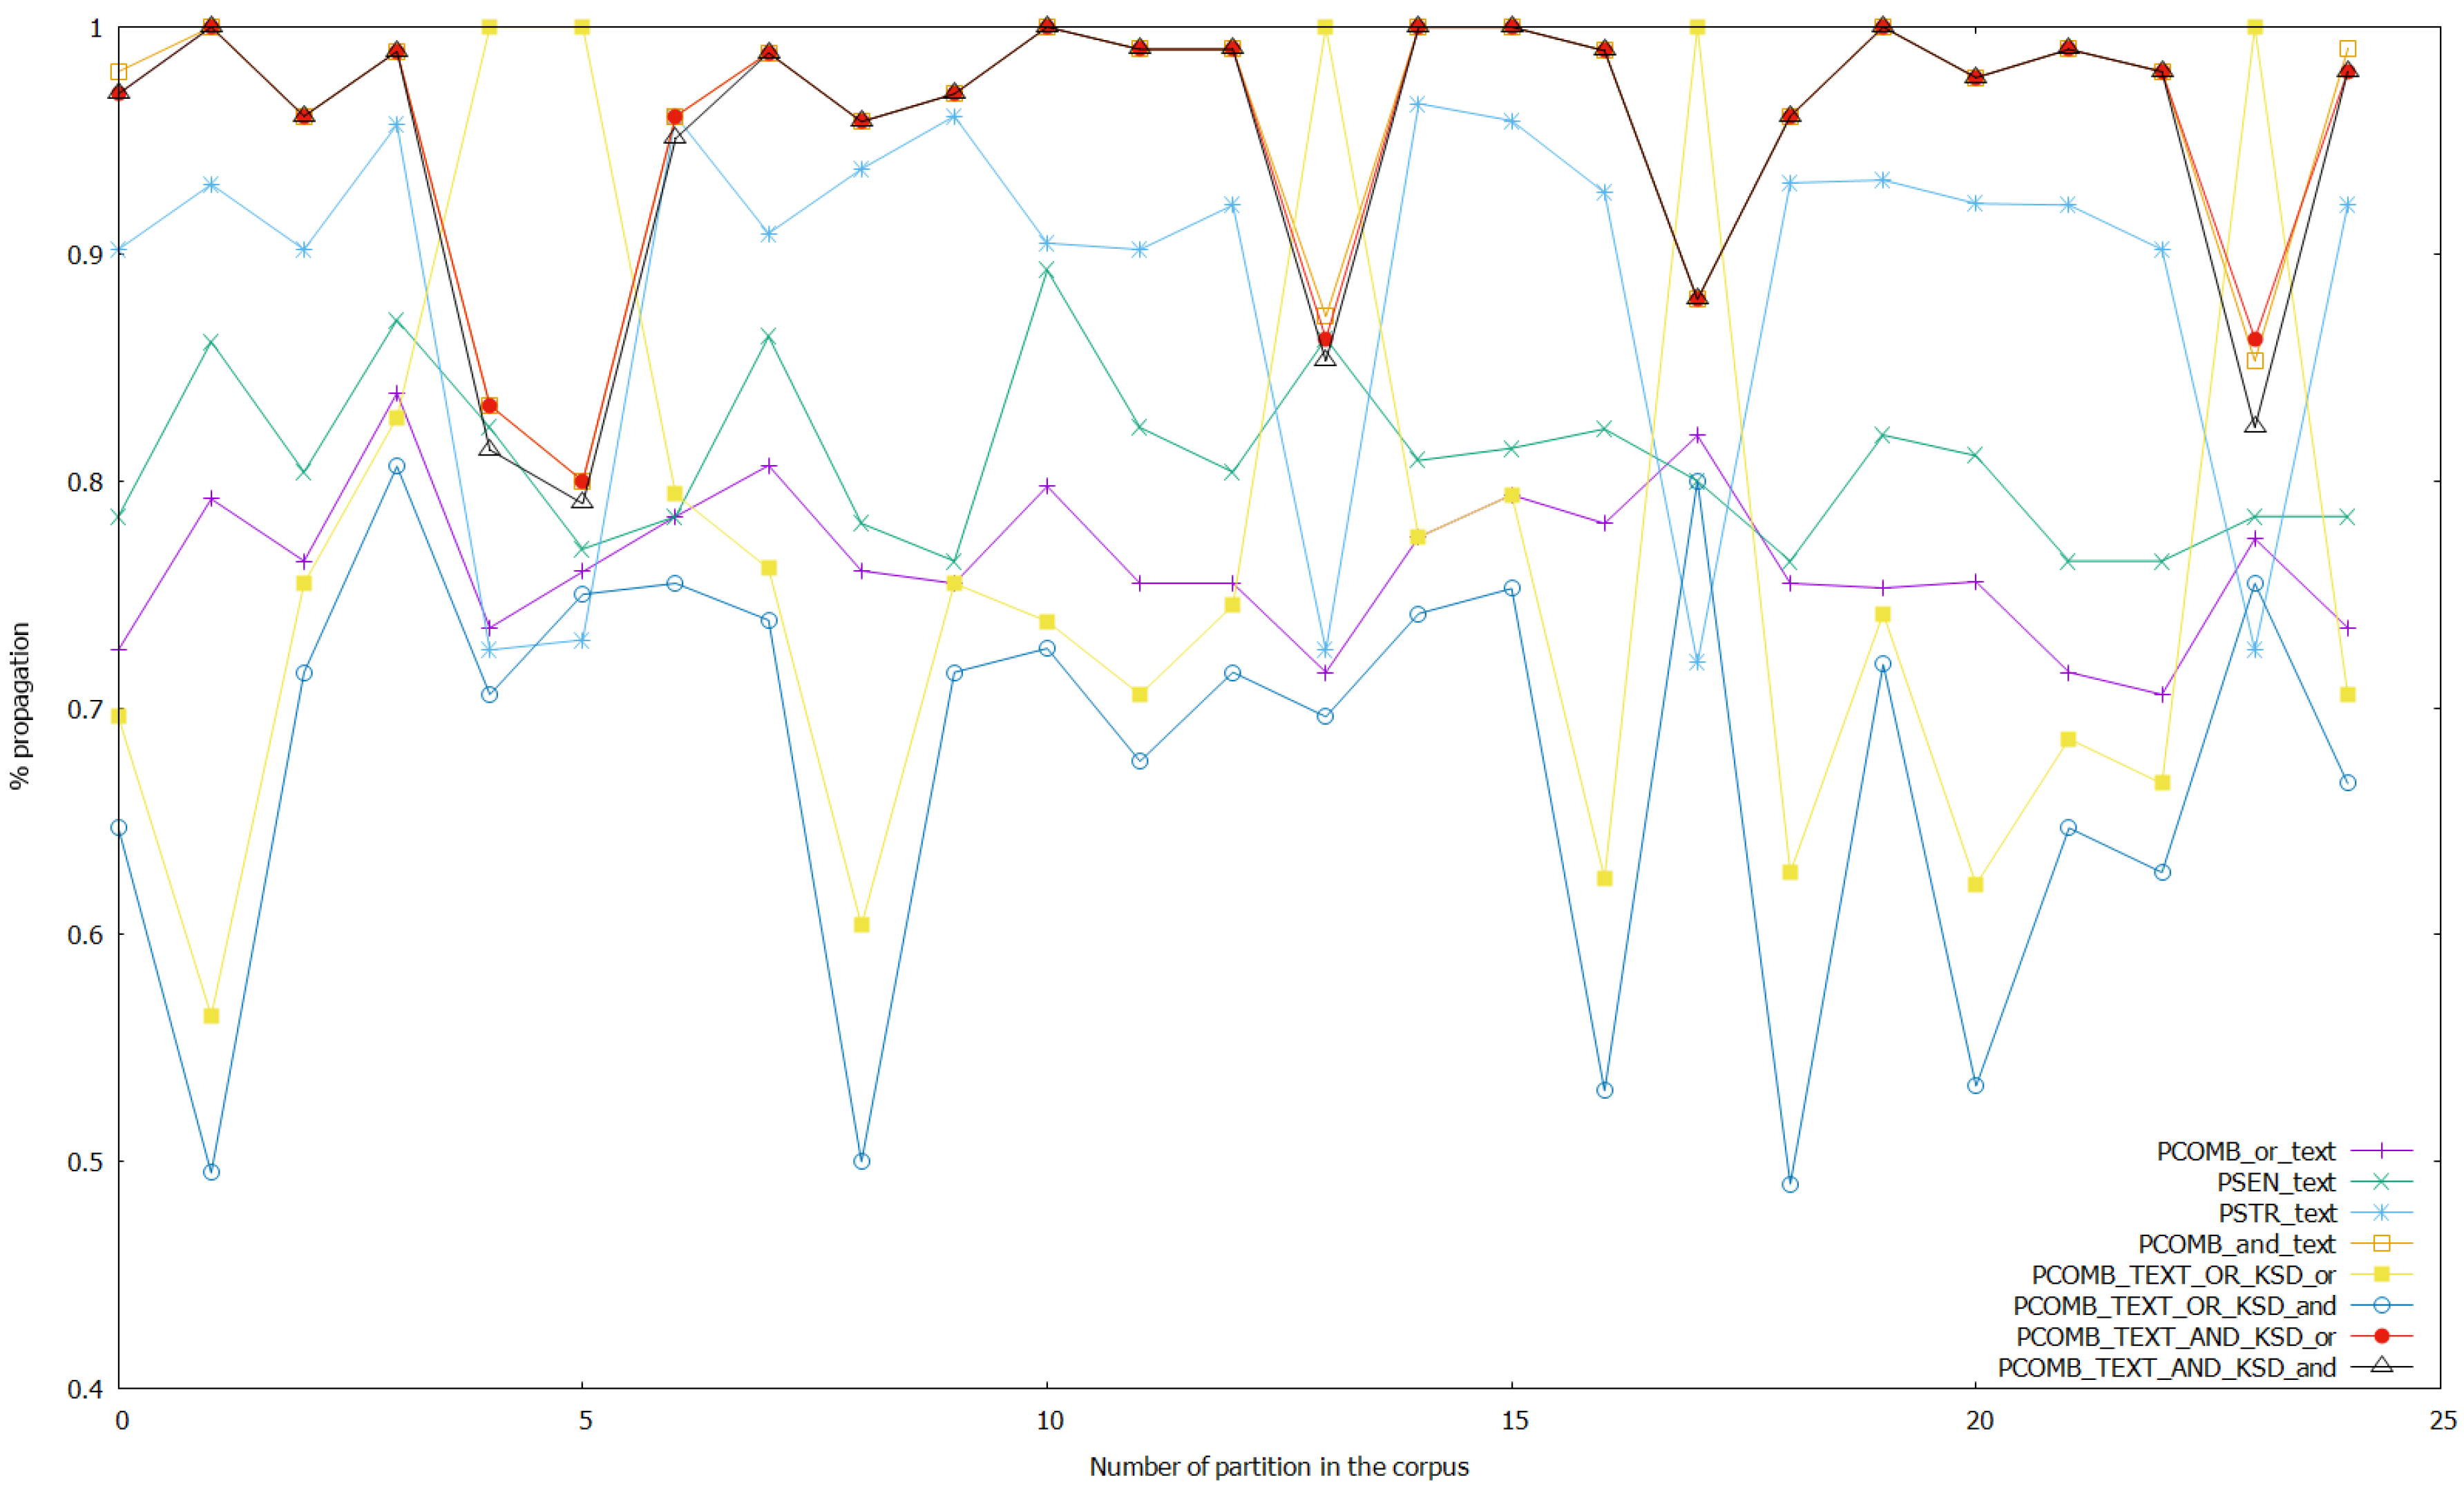
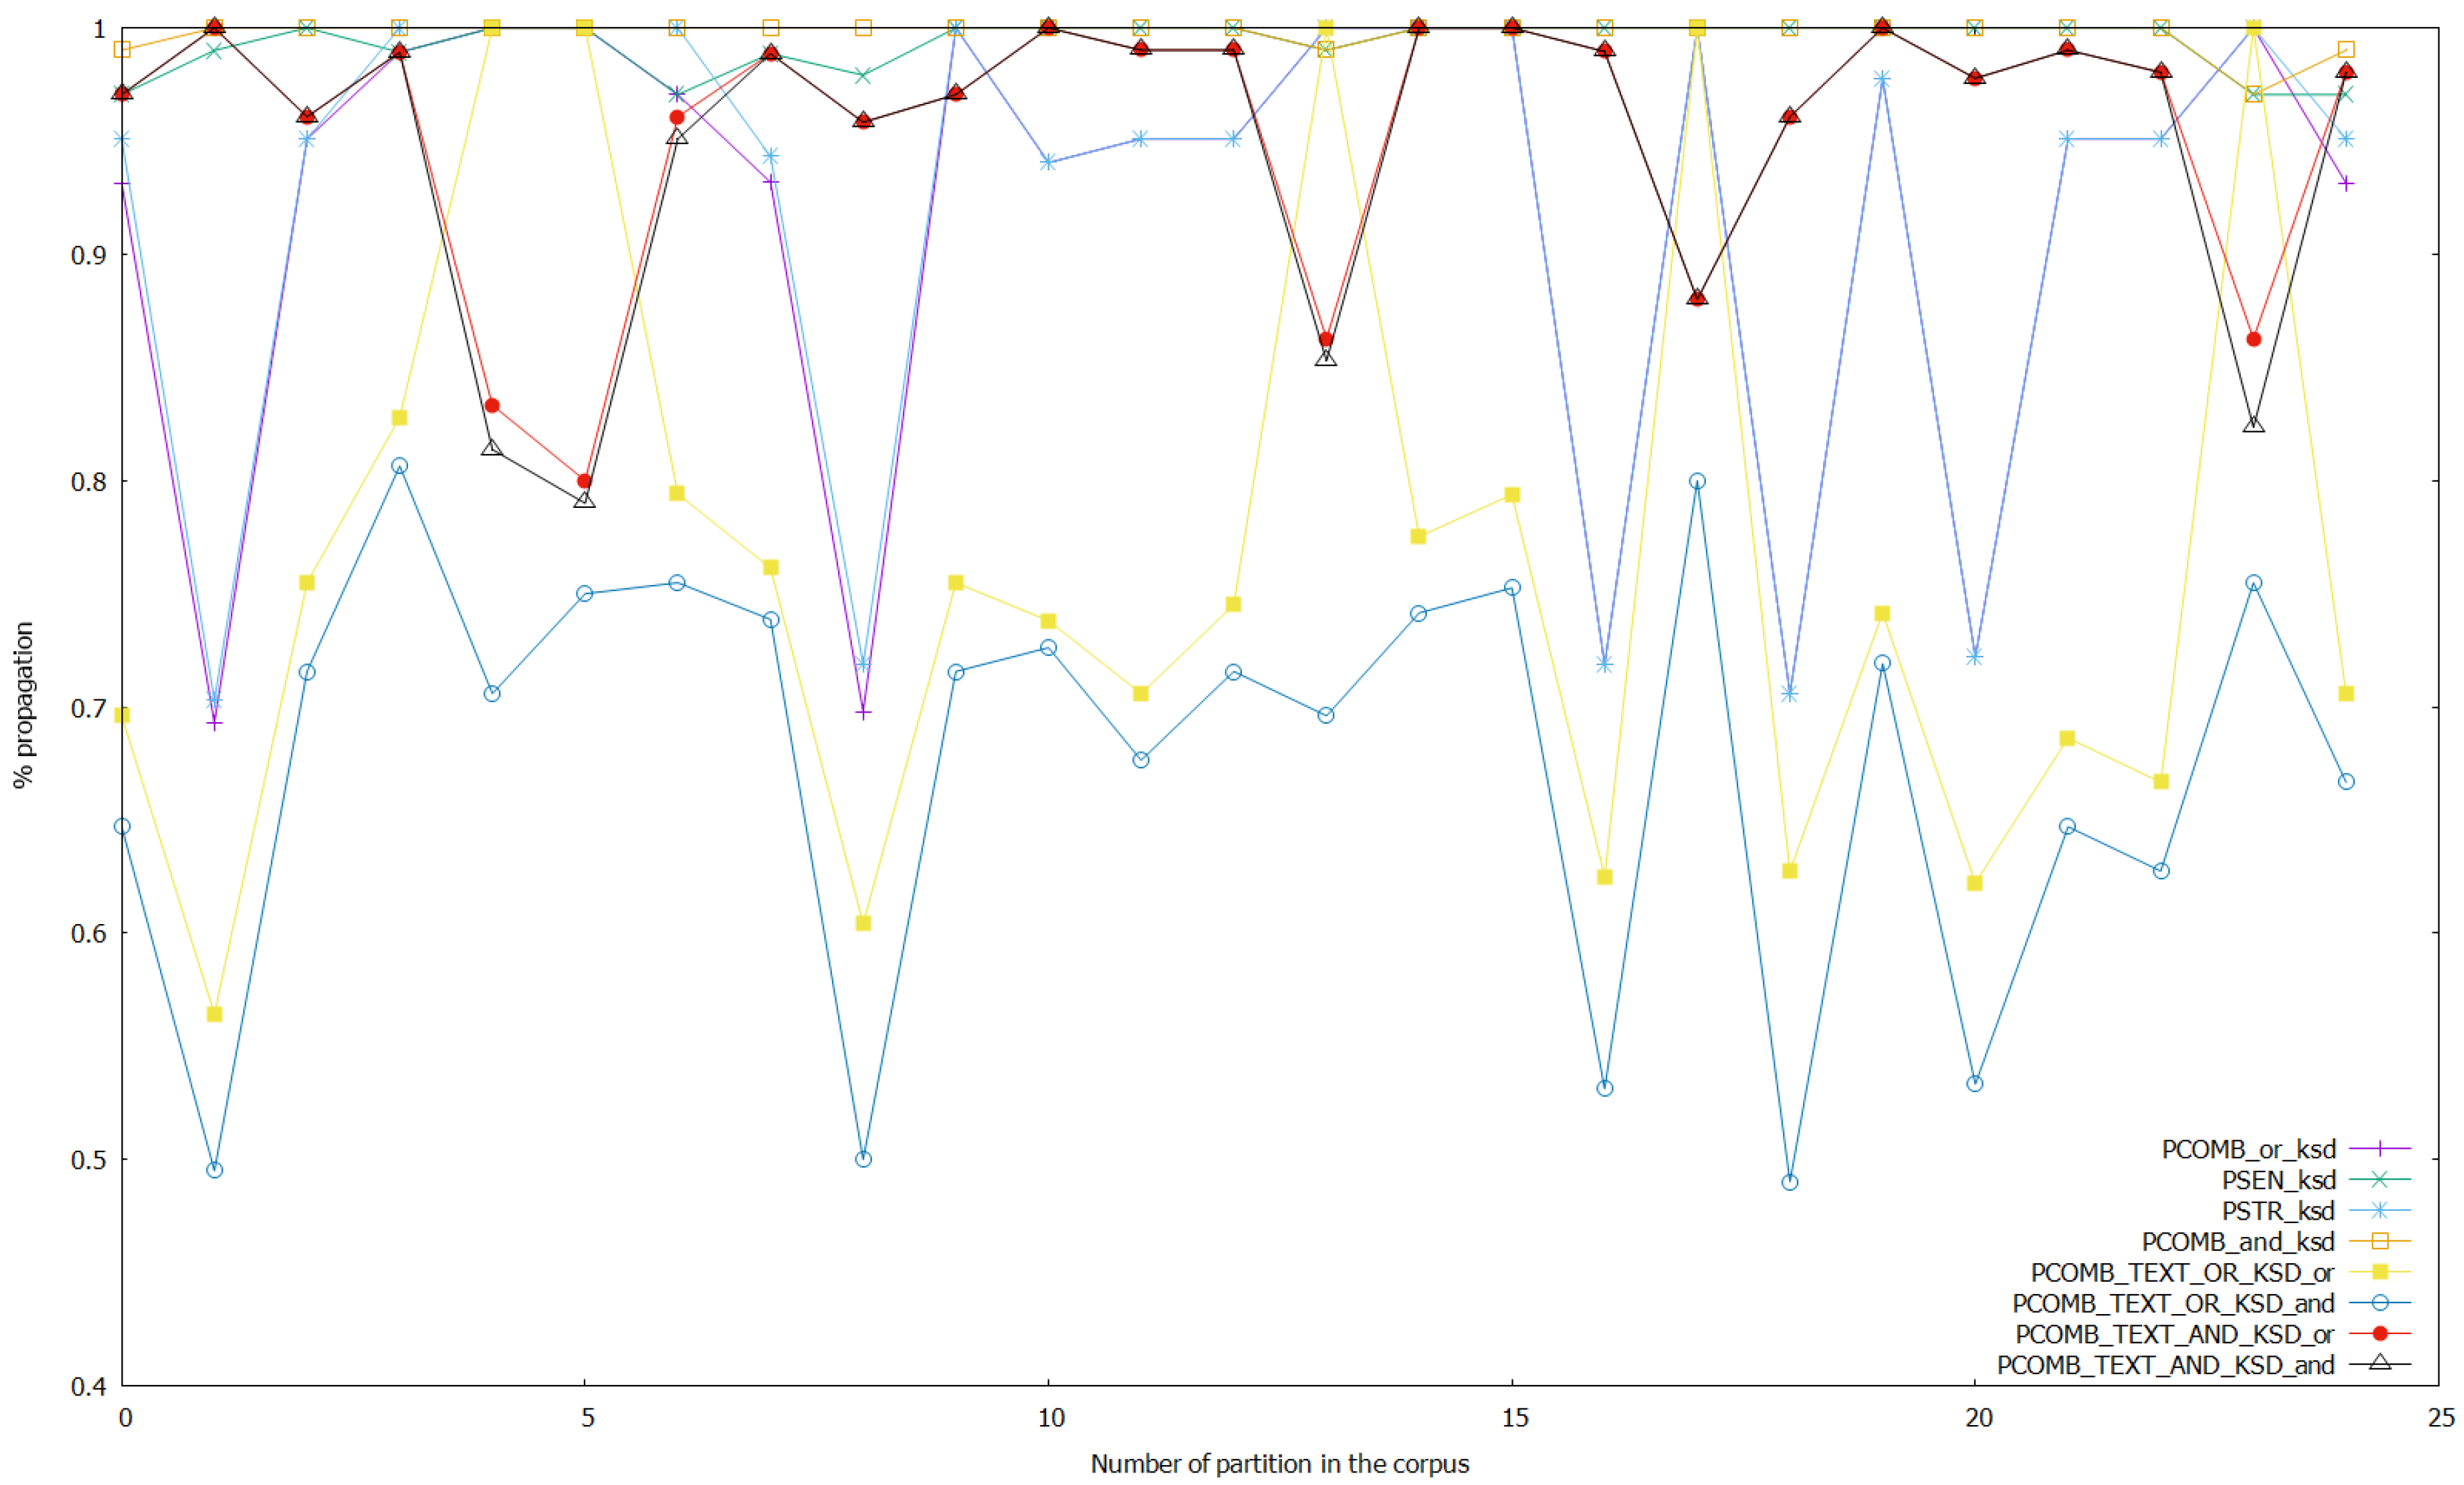
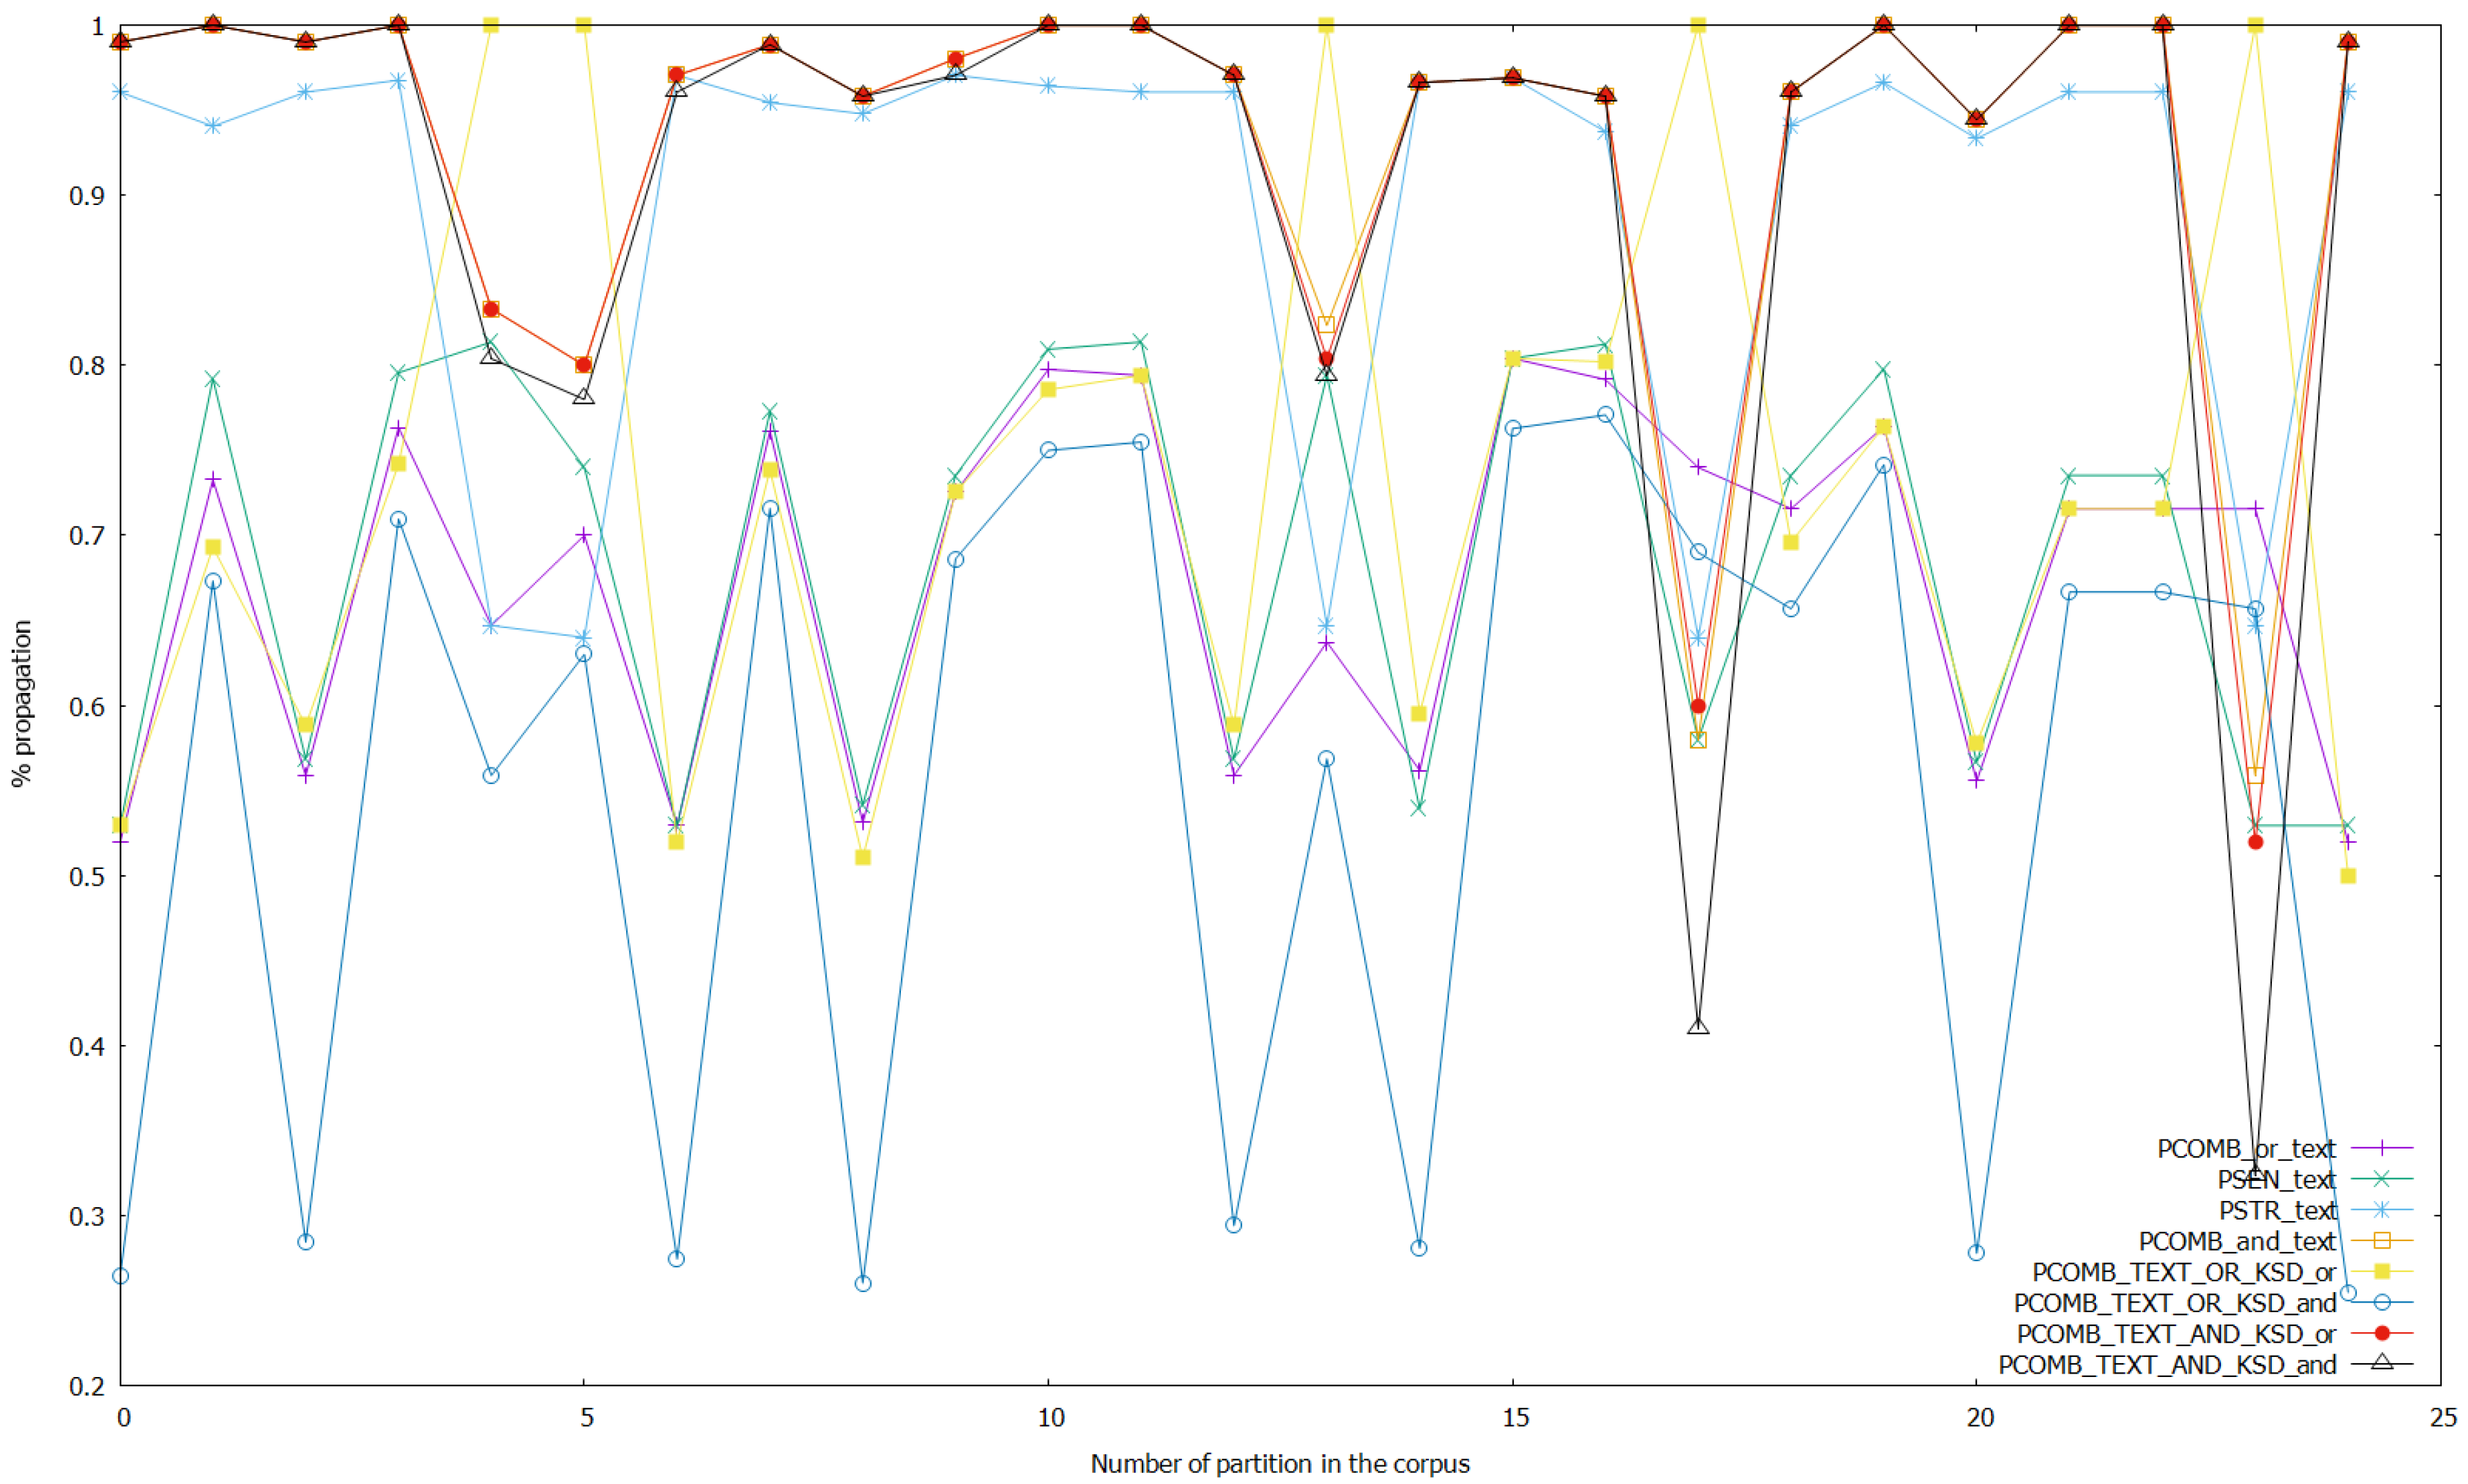
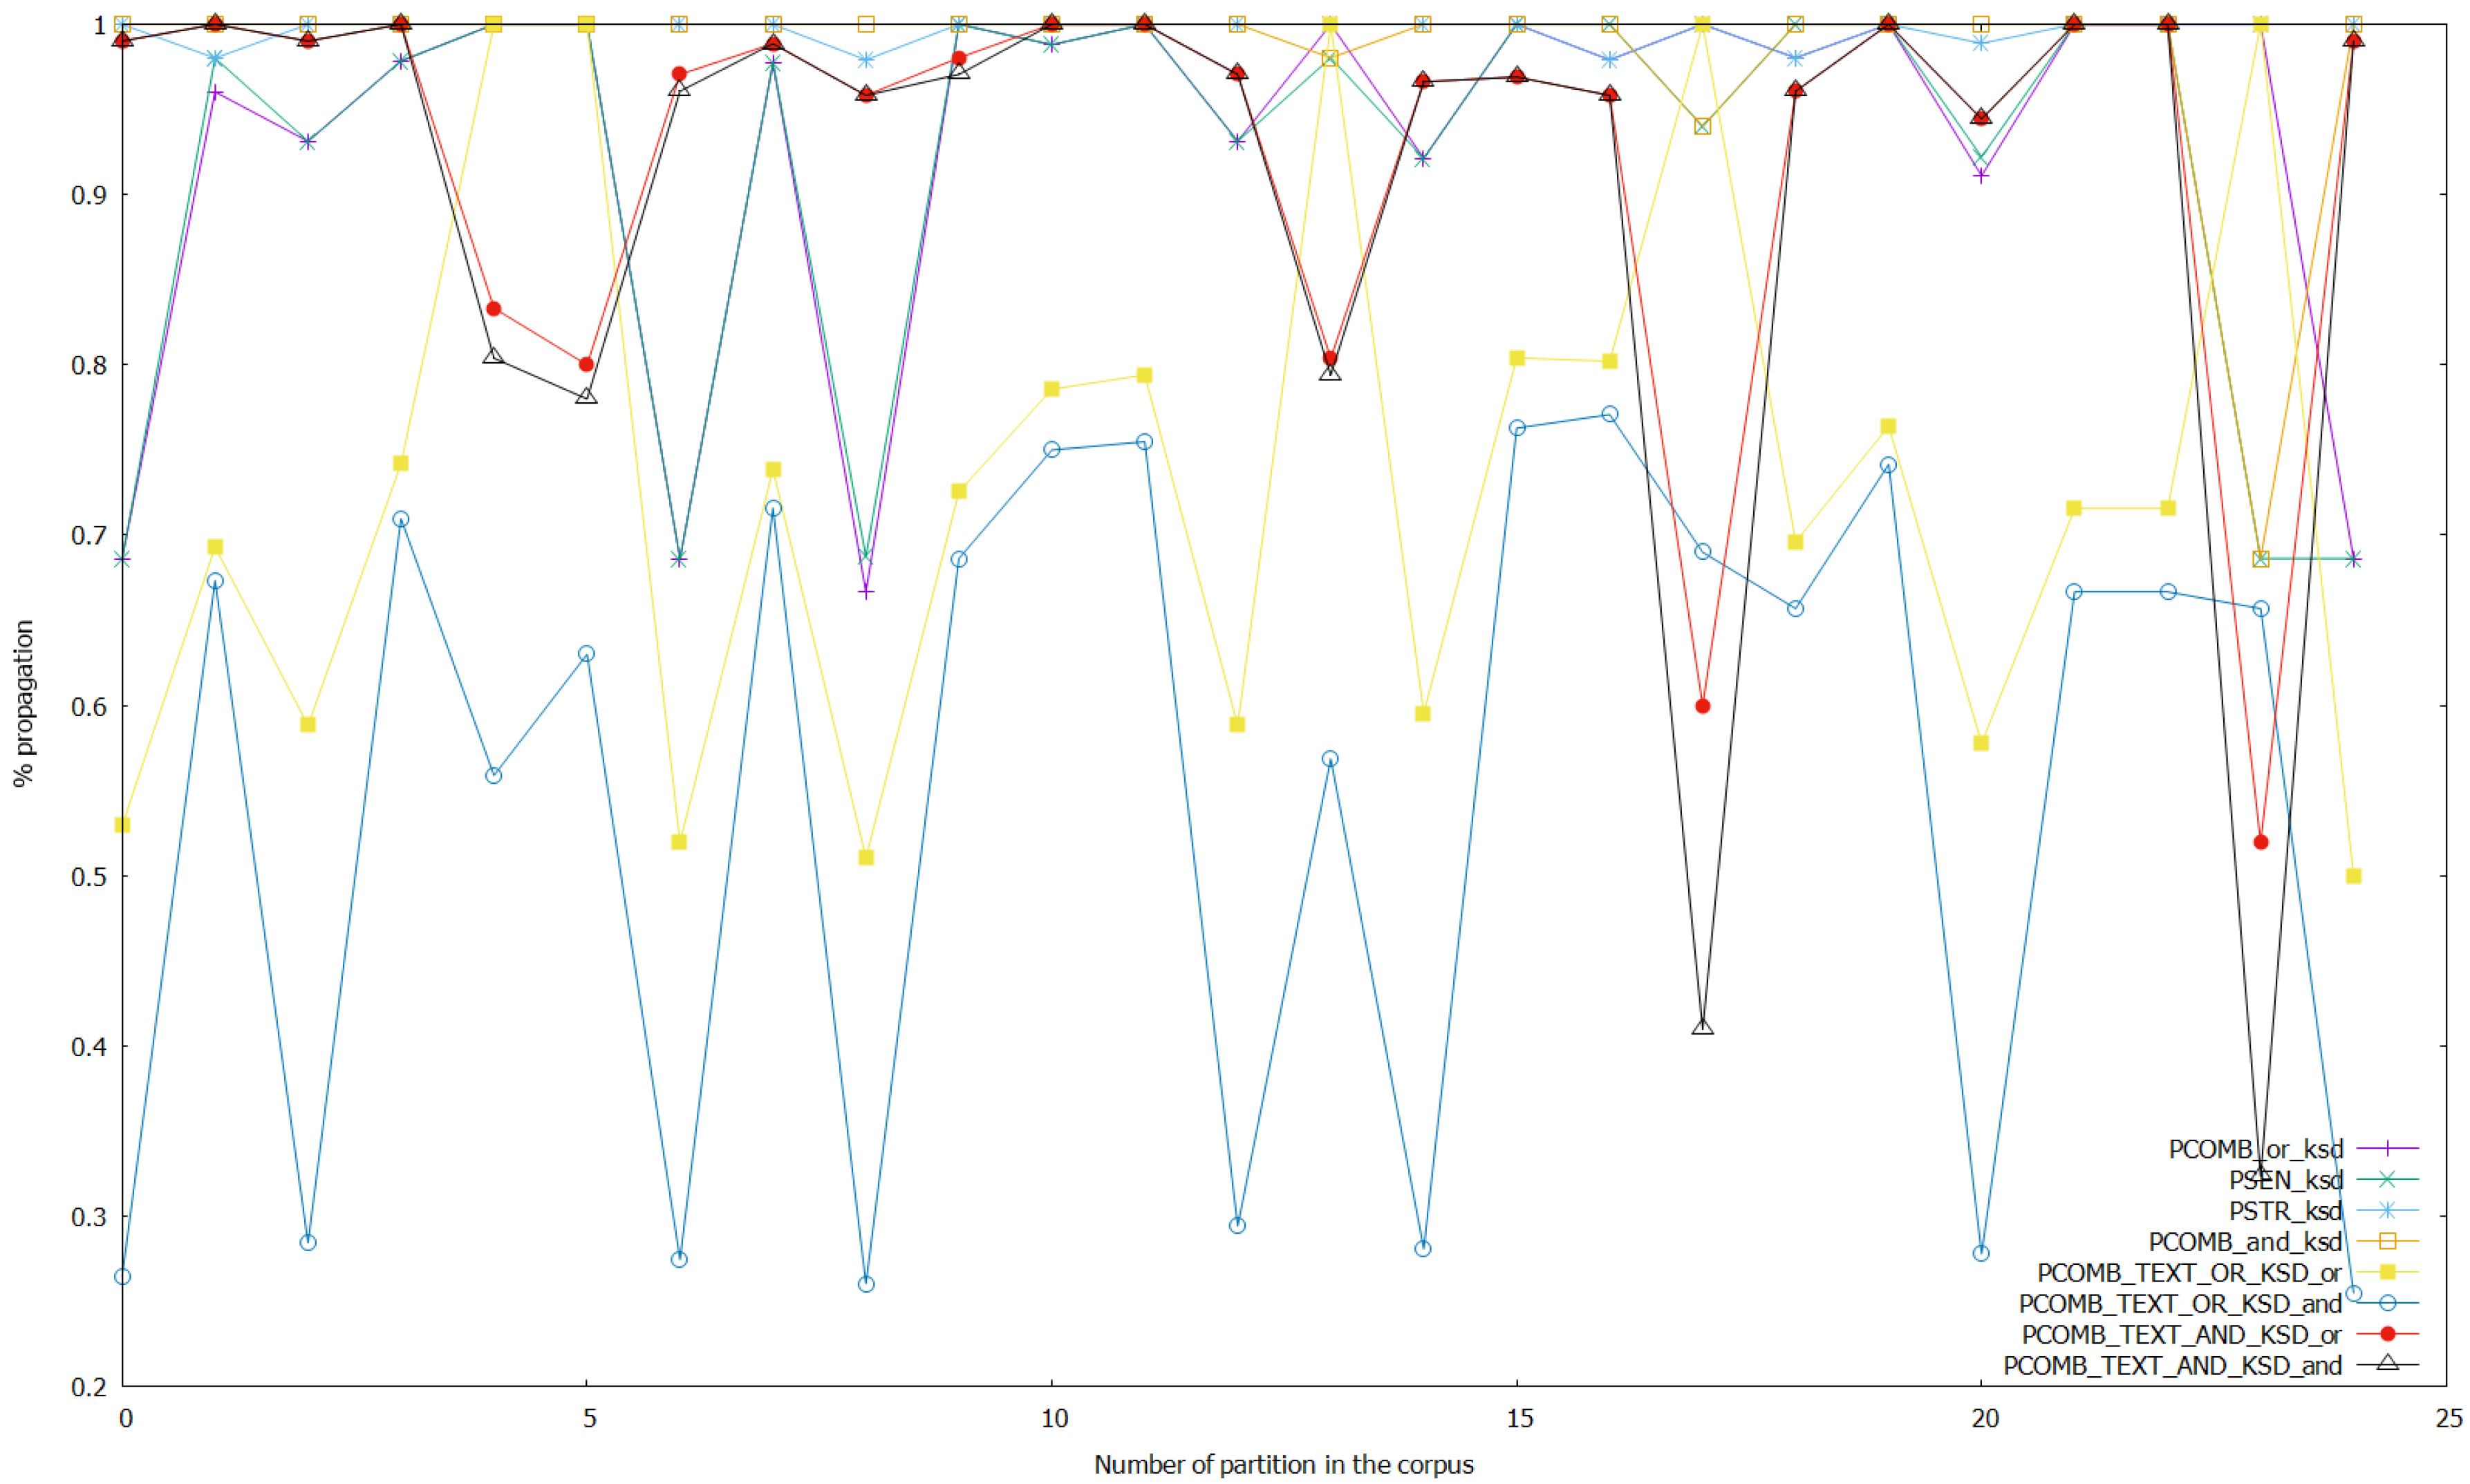
Finally, we launched several experiments with the setup presented in this section, changing the threshold of class inference in the ANNs from 0.5 to 0.9. This means that if the probability of a class given as output by the ANN model is greater or equal than the threshold, the result of the analysis is this concrete class; otherwise, it is the other class. We show in Figure 4 the results of propagation for the analyses on text data, and the combined analyses of text and keystroke dynamics data with thresholds for class detection unaltered. Figure 5 shows the results of propagation of analyses on keystroke dynamics data and the combined analyses with thresholds unaltered again. Then, for analyzing the effect of altering the threshold on the ANNs, we show the following figures, where the threshold is set to 0.7 (we do not show the other possibilities such as threshold 0.9 since 0.7 was shown experimentally to be the only case where there are bigger differences with the base case with no changes). We show in Figure 6 the results of the analyses on text data and combined analyses (text and keystroke), while changing the threshold of the ANNs that work with keystroke dynamics data to 0.7. We show the results for the analyses on keystroke dynamics data and the combined analyses applying this same process in Figure 7. Altering the threshold in ANNs that work with text data to 0.7, we repeated this process and obtained the Figure 8 and Figure 9. Finally, we show in Figure 10 and Figure 11 the results altering the threshold to 0.7 in the ANNs that perform sentiment analysis, and in Figure 12 and Figure 13 the results altering the threshold to 0.7 in the ANNs that perform stress analysis.
In the figures, the legend represents the following forms of the metric presented in Section 4.1:
- PCOMB_or_text: PDV of the “or” version of combined sentiment and stress analyzers on text.
- PSEN_text: PDV of the sentiment analyzer on text.
- PSTR_text: PDV of the stress analyzer on text.
- PCOMB_and_text: PDV of the “and” version of combined sentiment and stress analyzers on text.
- PCOMB_or_ksd: PDV of the “or” version of combined sentiment and stress analyzers on keystroke dynamics.
- PSEN_ksd: PDV of the sentiment analyzer on keystroke dynamics.
- PSTR_ksd: PDV of the stress analyzer on keystroke dynamics.
- PCOMB_and_ksd: PDV of the “and” version of combined sentiment and stress analyzers on keystroke dynamics.
- PCOMB_TEXT_OR_KSD_or: “or” version of combined analysis, using the values resulting from the output of PCOMB_or_text and PCOMB_or_ksd.
- PCOMB_TEXT_OR_KSD_and: “and” version of combined analysis, using the values resulting from the output of PCOMB_or_text and PCOMB_or_ksd.
- PCOMB_TEXT_AND_KSD_or: “or” version of combined analysis, using the values resulting from the output of PCOMB_and_text and PCOMB_and_ksd.
- PCOMB_TEXT_AND_KSD_and: “and” version of combined analysis, using the values resulting from the output of PCOMB_and_text and PCOMB_and_ksd.
4.3. Results
As Table 2 shows, in the experiments with both the ANNs trained with text data (embeddings of texts) and the ones trained with data of keystroke dynamics, there is a propagation of the detected state of the user to the replies of the message being analyzed. We can appreciate that there are several differences between experiments with different partitions of the data used on the training and in the experimentation, even when the general trend is to find a propagation of the state. There were cases that provided a network that was very likely to give as output one of the two classes (negative or positive sentiment for sentiment analysis, or in the case of stress analysis high or low stress level). This was because the data in the partition of the dataset used for the experiment were unbalanced in favor of one of the classes, which resulted in high propagation in the later experiment (since the ANN was very likely to output one of the two classes, the comparison between the analyses of the messages and the replies matched most of the time). Additionally, some cases give poor propagation, since the data in that partition could not provide an ANN that would give satisfying results of accuracy.
The average propagated values for the different analyses are shown in Table 2. In the experiments without altering the thresholds for class detection, the best-performing analyses in terms of propagation for combined analyses of sentiment and stress that use fusion of text and keystroke data (combining the output of the respective analyzers) were PCOMB_TEXT_AND_KSD_and (0.8951 average propagation) and PCOMB_TEXT_AND_KSD_or (0.9153 average propagation), the latter being better than the former. For combined analyses of sentiment and stress that do not use data fusion, the best-performing analyses were PCOMB_and_text (0.9196 average propagation) and PCOMB_and_ksd (0.9811 average propagation), the latter being better than the former again. As shown in Table 2 the non-fusion analyses also shown higher average propagation than the analyses using text and keystroke dynamics data. PSEN_ksd and PSTR_ksd are the two non-combined and non-fusion analyses with the highest propagation (0.9193 and 0.9235 average propagation respectively) and PSTR_ksd also has higher propagation than PCOMB_and_text but lower than PCOMB_and_ksd. Finally, PCOMB_or_ksd also shown a high result of propagation, but lower than the best performing analyses already discussed in this section. The worst performing analyses were PCOMB_TEXT_OR_KSD_or, PCOMB_TEXT_OR_KSD_and, PCOMB_or_text, and PSEN_text (0.7033, 0.5333, 0.6823, and 0.6868 average propagation respectively), PCOMB_TEXT_OR_KSD_or best.
Regarding the experimentation altering the threshold for class detection for the ANNs, it can be seen that as a general trend, every analysis affected obtains a better propagation of the state detected upon setting the threshold to a more strict point (e.g., 0.7 like in the results shown on Figure 6, Figure 7, Figure 8, Figure 9, Figure 10, Figure 11, Figure 12 and Figure 13). On the one hand, when altering the threshold of the ANNs that work with keystroke dynamics data, setting it to 0.7, it is shown that PCOMB_TEXT_AND_KSD_or (best performing fusion analysis) is able to perform with a very similar propagation than PCOMB_and_text (which is the best analysis using only text data, while analyses using keystroke data were close to total propagation because of making the threshold strict for this data). Moreover, when doing more strict detection with the ANNs that perform sentiment analysis, we obtained a similar case to the one wherein the thresholds on ANNs that work with keystroke data were altered. PCOMB_TEXT_AND_KSD_or performs similarly than PCOMB_and_text, and we also see that in this case, the combined analyses that use fusion of text and keystroke data perform better in general. On the other hand, if a strict threshold for class detection on the ANNs that work with text data is set, even when it can be seen that the combined analyses that perform fusion of text and keystroke data improve in terms of propagation, this change does not accomplish25 May 2020 making these analyses better than the best performing non-fusion analyses: (PCOMB_and_text and PCOMB_and_ksd). Finally, setting the threshold for the ANNs that perform stress analysis to strict detection does not have a strong effect on the propagation in general (even when a small improvement from the case without altering thresholds can be seen in general), except in the case of the stress analysis and PCOMB_or_ksd; that improves 6.14% from the case without altering thresholds, while still performing lower than PCOMB_and_ksd. Additionally, this case does not manage to make the combined fusion analyses to be better than the best performing non-fusion analyses.
4.4. Reformulation of the Advisor Agent
Since there has been an addition of new analyzers in the system and experiments performed for knowing which analyzers work best at detecting states in the user that propagate more and therefore might be more informative for the advisor agent, this agent has been redesigned and its decision making process for generating feedback updated. The selection of the analyses used in the advisor agent is done because the experiments have shown that as a general trend they are the best at detecting a state that propagates more in the network, and they are shown in the following. As has been stated in the previous section, the advisor agent accomplishes two different tasks: the calculation of the combined analyses from the data given by the four analyzer agents, and the generation of feedback to the users interacting in the SNS that generated the message being analyzed.
In accordance with the experiments performed, the first task of the advisor agent has been determined to be the calculation of three different combined analyses, selected from the results of the experiments that aimed to discover which analysis is more informative at detecting a state of the user that propagates more in the SNS. The three combined analyses computed in this agent are the following: PCOMB_and_text, PCOMB_and_ksd, and PCOMB_TEXT_AND_KSD_or. The two combined analyses that use only one data source (PCOMB_and_text and PCOMB_and_ksd) use the “and” version of combined analysis. Finally, the combined analysis of text and keystroke dynamics use an “or” version of combined analysis, taking the output of the text combined analysis and keystroke dynamics combined analysis as input. This selection of analyses is done based on the results of the experiments, as has been shown in Figure 4, Figure 5, Figure 6, Figure 7, Figure 8, Figure 9, Figure 10, Figure 11, Figure 12 and Figure 13.
The second task of this agent is to generate feedback to the user, based on the data generated on the analysis. The rules used for this process are based on the following:
- As the default case, if there are no issues detecting input, or with data availability or neutral detections, then the warning is generated when a negative message is detected by the text and keystroke dynamics data combined analysis.
- The tokenizer sometimes is not able to detect any token in the input text; in this case, the feedback to warn the user is generated when the sentiment and stress combined analysis on keystroke dynamics data assigns a negative label to the message.
- One source of data is not available, text or keystroke dynamics, so the warning is generated if the combined analysis on the available data detects a negative message.
- The class probability detected is in the range of 0.5–0.525 for both sentiment and stress analysis on one kind of data, meaning that the ANN models for this data source detect a neutral state. In this case, the warning is generated if the combined analysis on the other data source detects a negative message outside of the mentioned range of class probability. If both data sources generated an output with a class probability inside the mentioned range, then the combined analysis of text and keystroke dynamics data is used for the generation of the warning, doing so if a negative message is detected by this combined analysis.
5. Conclusions and Future Work
In the present work, we introduced new agents capable of performing sentiment and stress analysis on keystroke dynamics data into a MAS presented in a previous work, in order to improve the capacity of the MAS when predicting user states that could generate a problem or make risks arise from the social interaction. The MAS guides users on a SNS or another online social environment by analyzing the data of a user that posts a message and giving feedback to the user if this message is deemed negative by the MAS agents analyses. We also propose different versions of combined analysis that use both sentiment analysis and stress analysis on text data and on keystroke dynamics data, to be used in the advisor agent of the MAS for the task of generating feedback to the users. For discovering what analyses are more informative to be used in the generation of warnings or feedback, and thus improve the system ability to prevent negative outcomes and risks in a social online environment, we integrated our MAS into a private SNS called Pesedia and performed experiments with real users during a period of one month. During this period, we gathered the dataset of text and keystroke dynamics data used for training the machine learning models. We performed a laboratory experiment with the data from the dataset not used for training that aimed at discovering which analyses are able to predict a state of the user that propagates more to the replies of the message analyzed in the network. In this way, we would be able to know what analyses can be considered more informative to be taken into account for warning the users, in terms of their ability to detect a state that may potentially propagate more in the network. We also launched experiments with different setups in the threshold for class detection in the ANNs that perform the analysis.
Regarding the experimentation with the different analyses for discovering which one detects a state that propagates more to the replies, we found that the best analyses are the “or” version of combined text and keystroke analysis that uses “and” combinations of sentiment and stress analysis, and the “and” versions of text combined analysis and keystroke dynamics combined analysis. Analyses on only keystroke dynamics also shown high results of propagation but the combined version of sentiment and stress on keystroke dynamics was better than the non-combined analyses. Moreover, when setting a high threshold for class detection (making the detection process more strict, by selecting one class only with a 70% of probability or more), in the ANNs that perform analysis on keystroke dynamics data and in the ANNs that perform sentiment analysis, the best analysis that combines text and keystroke data approaches the best single data type analysis. This is not the case when altering the threshold for the ANNs that perform analysis on text data and that perform stress analysis.
The proposed approach, as shown by the experiments, can help users navigating in an online social environment be aware that the information they post has a chance of generating negativity or high stress in the network, and thus can help prevent risks. Nevertheless, the targeted users in our proposed system are people of a young age, and so we built and trained models with data from people of ages between 12 and 15 years old; therefore, it is not granted that the performance of the system implemented will be the same when used in online social environments with older or more experienced users. Despite this limitation, in [7] we built text data analyzers (which also included combined analysis) that were able to predict sentiment and stress states of the users that propagated to the replies of messages in the SNS twitter.com, which has a wide range of users; therefore, it has been shown that analyzers of text data can be used for this purpose. Moreover, data privacy is a limitation for the proposed system, since it relies on the analyses on user data to generate feedback and potentially prevent risks. Consequently, if the users do not consent the use and analysis on their data, the system will be unable to work and provide feedback or warnings.
For future lines of work, we plan on exploiting the different available data and analyses in the MAS with a case-based reasoning module, to be able to generate feedback that is more useful to the user. This new module is expected to improve the current advisor agent, which uses a series of rules to decide which output from the analyzers to use to give or not feedback and warnings to the users. New ways of guiding users through their experience, apart from warning for posting or not could be implemented. Additionally, we will aim to improve the interface for warning and guiding users with additional widgets.
Author Contributions
Conceptualization, G.A., V.J., A.G.-F., and A.E.; data curation, G.A.; formal analysis, G.A., V.J., A.G.-F., and A.E.; investigation, G.A., V.J., A.G.-F., and A.E.; methodology, G.A., V.J., A.G.-F., and A.E.; software, G.A.; supervision, G.A., V.J., A.G.-F., and A.E.; validation, G.A.; visualization, G.A., V.J., A.G.-F., and A.E.; writing—original draft, G.A.; writing—review and editing, G.A., V.J., A.G.-F., and A.E. All authors have read and agreed to the published version of the manuscript.
Funding
This work was funded by the project TIN2017-89156-R of the Spanish government.
Conflicts of Interest
The authors declare no conflict of interest. The funders had no role in the design of the study; in the collection, analyses, or interpretation of data; in the writing of the manuscript, or in the decision to publish the results.
References
- De Moor, S.; Dock, M.; Gallez, S.; Lenaerts, S.; Scholler, C.; Vleugels, C. Teens and ICT: Risks and Opportunities; TIRO: Belgium, 2008; Available online: http://goo.gl/vvNl2z (accessed on 18 May 2020).
- Livingstone, S.; Haddon, L.; Görzig, A.; Ólafsson, K. Risks and Safety on the Internet: The Perspective of European Children: Full Findings and Policy Implications from the EU Kids Online Survey of 9–16 Year Olds and Their Parents in 25 Countries; EU Kids Online, Deliverable D4; EU Kids Online Network: London, UK, 2011. [Google Scholar]
- Vandenhoven, E.; Schellens, T.; Valacke, M. Educating teens about the risks on social network sites. Media Educ. Res. J. 2014, 43, 123–131. [Google Scholar]
- O’Keeffe, G.S.; Clarke-Pearson, K. The impact of social media on children, adolescents, and families. Pediatrics 2011, 127, 800–804. [Google Scholar] [CrossRef] [PubMed] [Green Version]
- George, J.M.; Dane, E. Affect, emotion, and decision making. Organ. Behav. Hum. Decis. Process. 2016, 136, 47–55. [Google Scholar] [CrossRef]
- Thelwall, M. TensiStrength: Stress and relaxation magnitude detection for social media texts. Inf. Process. Manag. 2017, 53, 106–121. [Google Scholar] [CrossRef] [Green Version]
- Aguado, G.; Julian, V.; Garcia-Fornes, A. Towards Aiding Decision-Making in Social Networks by Using Sentiment and Stress Combined Analysis. Information 2018, 9, 107. [Google Scholar] [CrossRef] [Green Version]
- Epp, C.; Lippold, M.; Mandryk, R.L. Identifying emotional states using keystroke dynamics. In Proceedings of the SIGCHI Conference on Human Factors in Computing Systems, Vancouver, BC, Canada, 7–12 May 2011; pp. 715–724. [Google Scholar]
- Schouten, K.; Frasincar, F. Survey on aspect-level sentiment analysis. IEEE Trans. Knowl. Data Eng. 2016, 28, 813–830. [Google Scholar] [CrossRef]
- Bordera, J.A. PESEDIA. Red Social Para Concienciar en Privacidad. Master’s Thesis, Universitat Politècnica de València, Valencia, Spain, 2016. [Google Scholar]
- Lee, P.M.; Tsui, W.H.; Hsiao, T.C. The influence of emotion on keyboard typing: An experimental study using auditory stimuli. PLoS ONE 2015, 10, e0129056. [Google Scholar] [CrossRef] [PubMed] [Green Version]
- Bradley, M.; Lang, P. The International Affective Digitized Sounds (2-nd Edition; IADS-2): Affective Ratings of Sounds and Instruction Manual Gainesville; The Center for Research in Psychophysiology: Gainesville, FL, USA, 2007. [Google Scholar]
- Kołakowska, A. Towards detecting programmers’ stress on the basis of keystroke dynamics. In Proceedings of the 2016 Federated Conference on Computer Science and Information Systems (FedCSIS), Gdańsk, Poland, 11–14 September 2016; pp. 1621–1626. [Google Scholar]
- Vizer, L.M.; Zhou, L.; Sears, A. Automated stress detection using keystroke and linguistic features: An exploratory study. Int. J. Hum. Comput. Stud. 2009, 67, 870–886. [Google Scholar] [CrossRef]
- Huang, F.; Zhang, X.; Zhao, Z.; Xu, J.; Li, Z. Image–text sentiment analysis via deep multimodal attentive fusion. Knowl. Based Syst. 2019, 167, 26–37. [Google Scholar] [CrossRef]
- Poria, S.; Chaturvedi, I.; Cambria, E.; Hussain, A. Convolutional MKL based multimodal emotion recognition and sentiment analysis. In Proceedings of the 2016 IEEE 16th International Conference on Data Mining (ICDM), Barcelona, Spain, 12–15 December 2016; pp. 439–448. [Google Scholar]
- Gregori, M.E.; Cámara, J.P.; Bada, G.A. A jabber-based multi-agent system platform. In Proceedings of the Fifth International Joint Conference on Autonomous Agents and Multiagent Systems, Hakodate, Japan, 8–12 May 2006; pp. 1282–1284. [Google Scholar]
- Mehrabian, A. Pleasure-arousal-dominance: A general framework for describing and measuring individual differences in temperament. Curr. Psychol. 1996, 14, 261–292. [Google Scholar] [CrossRef]
- Kingma, D.P.; Ba, J. Adam: A Method for Stochastic Optimization, 2014. In Proceedings of the 3rd International Conference for Learning Representations, San Diego, CA, USA, 7–9 May 2015. [Google Scholar]
- Lau, S.H. Stress Detection for Keystroke Dynamics. Ph.D. Thesis, Carnegie Mellon University, Pittsburgh, PA, USA, May 2018. [Google Scholar]
- Ulinskas, M.; Damaševičius, R.; Maskeliūnas, R.; Woźniak, M. Recognition of human daytime fatigue using keystroke data. Procedia Comput. Sci. 2018, 130, 947–952. [Google Scholar] [CrossRef]
Figure 1.
Architecture of the multi-agent system (MAS).

Figure 2.
Architecture of the ANN for the sentiment analyzer agent with keystroke dynamic data.

Figure 3.
Example of messages posted and replies with different polarities.

Figure 4.
Results of the experiments with the sentiment, stress, and combined analyses on text, and with the combined analyses on text and keystroke data with thresholds unaltered.
Figure 4.
Results of the experiments with the sentiment, stress, and combined analyses on text, and with the combined analyses on text and keystroke data with thresholds unaltered.

Figure 5.
Results of the experiments with the sentiment, stress, and combined analyses on keystroke data, and with the combined analyses on text and keystroke data with thresholds unaltered.
Figure 5.
Results of the experiments with the sentiment, stress, and combined analyses on keystroke data, and with the combined analyses on text and keystroke data with thresholds unaltered.

Figure 6.
Results of the experiments with the sentiment, stress, and combined analyses on text, and with the combined analyses on text and keystroke data with threshold set to 0.7 in the ANNs that work with keystroke data.
Figure 6.
Results of the experiments with the sentiment, stress, and combined analyses on text, and with the combined analyses on text and keystroke data with threshold set to 0.7 in the ANNs that work with keystroke data.

Figure 7.
Results of the experiments with the sentiment, stress, and combined analyses on keystroke data, and with the combined analyses on text and keystroke data with threshold set to 0.7 in the ANNs that work with keystroke data.
Figure 7.
Results of the experiments with the sentiment, stress, and combined analyses on keystroke data, and with the combined analyses on text and keystroke data with threshold set to 0.7 in the ANNs that work with keystroke data.

Figure 8.
Results of the experiments with the sentiment, stress, and combined analyses on text, and with the combined analyses on text and keystroke data with threshold set to 0.7 in the ANNs that work with text data.
Figure 8.
Results of the experiments with the sentiment, stress, and combined analyses on text, and with the combined analyses on text and keystroke data with threshold set to 0.7 in the ANNs that work with text data.

Figure 9.
Results of the experiments with the sentiment, stress, and combined analyses on keystroke data, and with the combined analyses on text and keystroke data with threshold set to 0.7 in the ANNs that work with text data.
Figure 9.
Results of the experiments with the sentiment, stress, and combined analyses on keystroke data, and with the combined analyses on text and keystroke data with threshold set to 0.7 in the ANNs that work with text data.

Figure 10.
Results of the experiments with the sentiment, stress, and combined analyses on text, and with the combined analyses on text and keystroke data with threshold set to 0.7 in the ANNs that perform sentiment analysis.
Figure 10.
Results of the experiments with the sentiment, stress, and combined analyses on text, and with the combined analyses on text and keystroke data with threshold set to 0.7 in the ANNs that perform sentiment analysis.

Figure 11.
Results of the experiments with the sentiment, stress, and combined analyses on keystroke data, and with the combined analyses on text and keystroke data with threshold set to 0.7 in the ANNs that perform sentiment analysis.
Figure 11.
Results of the experiments with the sentiment, stress, and combined analyses on keystroke data, and with the combined analyses on text and keystroke data with threshold set to 0.7 in the ANNs that perform sentiment analysis.

Figure 12.
Results of the experiments with the sentiment, stress, and combined analyses on text, and with the combined analyses on text and keystroke data with threshold set to 0.7 in the ANNs that perform stress analysis.
Figure 12.
Results of the experiments with the sentiment, stress, and combined analyses on text, and with the combined analyses on text and keystroke data with threshold set to 0.7 in the ANNs that perform stress analysis.

Figure 13.
Results of the experiments with the sentiment, stress, and combined analyses on keystroke data, and with the combined analyses on text and keystroke data with threshold set to 0.7 in the ANNs that perform stress analysis.
Figure 13.
Results of the experiments with the sentiment, stress, and combined analyses on keystroke data, and with the combined analyses on text and keystroke data with threshold set to 0.7 in the ANNs that perform stress analysis.


Table 1.
Text typing speed and key frequency features used to train the models.
| Text Typing Speed Features | Key Frequency Features |
|---|---|
| key press | enter |
| key release and press interval | space bar |
| key press and second press interval | back space |
| key release and second release interval | delete |
| key press related to digraphs | key up |
| key release and press interval related to digraphs | key down |
| key press related to trigraphs | key left |
| key release and press interval related to trigraphs | key right |
| digraph typing | shift |
| trigraph typing | home |
| general typing speed | end |
| page up | |
| page down | |
| caps lock |
Table 2.
Mean and standard error (in parenthesis) for the different versions of PDV in the experiments: PSTR_text (1), PCOMB_or_text (2), PSEN_text (3), PCOMB_and_text (4), PSTR_ksd (5), PCOMB_or_ksd (6), PSEN_ksd (7), PCOMB_and_ksd (8), PCOMB_TEXT_OR_KSD_or (9), PCOMB_TEXT_OR_KSD_and (10), PCOMB_TEXT_AND_KSD_or (11), PCOMB_TEXT_AND_KSD_and (12). The best-performing results of PDV are marked in bold for each column.
| Version of PDV | No Changes in the Thresholds | Threshold 0.7 in Sentiment Analysis | Threshold 0.7 in Stress Analysis | Threshold 0.7 in Analyses on Text | Threshold 0.7 in Analyses on Keystroke Data |
|---|---|---|---|---|---|
| 1 | 0.8879 (0.0171) | 0.8879 (0.0171) | 0.8951 (0.0257) | 0.8951 (0.0257) | 0.8879 (0.0171) |
| 2 | 0.6823 (0.0214) | 0.7644 (0.0066) | 0.6743 (0.0203) | 0.7633 (0.0110) | 0.6823 (0.0214) |
| 3 | 0.6868 (0.0238) | 0.8093 (0.0074) | 0.6868 (0.0238) | 0.8093 (0.0074) | 0.6868 (0.0238) |
| 4 | 0.9196 (0.0237) | 0.9567 (0.0117) | 0.9293 (0.0244) | 0.9634 (0.0113) | 0.9196 (0.0237) |
| 5 | 0.9235 (0.0219) | 0.9235 (0.0219) | 0.9963 (0.0015) | 0.9235 (0.0219) | 0.9963 (0.0015) |
| 6 | 0.8700 (0.0285) | 0.9186 (0.0221) | 0.9314 (0.0229) | 0.8700 (0.0285) | 0.9907 (0.0027) |
| 7 | 0.9193 (0.0244) | 0.9928 (0.0022) | 0.9193 (0.0244) | 0.9193 (0.0244) | 0.9928 (0.0022) |
| 8 | 0.9811 (0.0126) | 0.9976 (0.0013) | 0.9843 (0.0127) | 0.9811 (0.0126) | 0.9984 (0.0012) |
| 9 | 0.7033 (0.0337) | 0.7676 (0.0270) | 0.7354 (0.0330) | 0.7551 (0.0293) | 0.7236 (0.0335) |
| 10 | 0.5333 (0.0432) | 0.6763 (0.0191) | 0.5541 (0.0405) | 0.6220 (0.0233) | 0.5826 (0.0407) |
| 11 | 0.9153 (0.0242) | 0.9559 (0.0116) | 0.9278 (0.0251) | 0.9484 (0.0173) | 0.9196 (0.0235) |
| 12 | 0.8951 (0.0350) | 0.9523 (0.0129) | 0.9092 (0.0352) | 0.9441 (0.0195) | 0.9026 (0.0323) |
© 2020 by the authors. Licensee MDPI, Basel, Switzerland. This article is an open access article distributed under the terms and conditions of the Creative Commons Attribution (CC BY) license (http://creativecommons.org/licenses/by/4.0/).
Share and Cite
MDPI and ACS Style
Aguado, G.; Julián, V.; García-Fornes, A.; Espinosa, A. Using Keystroke Dynamics in a Multi-Agent System for User Guiding in Online Social Networks. Appl. Sci. 2020, 10, 3754. https://doi.org/10.3390/app10113754
AMA Style
Aguado G, Julián V, García-Fornes A, Espinosa A. Using Keystroke Dynamics in a Multi-Agent System for User Guiding in Online Social Networks. Applied Sciences. 2020; 10(11):3754. https://doi.org/10.3390/app10113754
Chicago/Turabian StyleAguado, Guillem, Vicente Julián, Ana García-Fornes, and Agustín Espinosa. 2020. "Using Keystroke Dynamics in a Multi-Agent System for User Guiding in Online Social Networks" Applied Sciences 10, no. 11: 3754. https://doi.org/10.3390/app10113754
Note that from the first issue of 2016, this journal uses article numbers instead of page numbers. See further details here.