Effect of Drawing Pass on Softening or Plasticizing of Q235 Steel Bar during Electrochemical Cold Drawing


State Key Laboratory of Advanced Processing and Recycling of Nonferrous Metals, Lanzhou University of Technology, Lanzhou 730050, China
*
Author to whom correspondence should be addressed.
Metals 2020, 10(6), 715; https://doi.org/10.3390/met10060715
Submission received: 26 April 2020
/
Revised: 25 May 2020
/
Accepted: 26 May 2020
/
Published: 28 May 2020
Abstract
:In this work, the effect of drawing pass on the surface layer softening or plasticizing of Q235 steel bar during electrochemical cold drawing (ECD) was studied, as well as cold drawing in air (DIA) for comparison. The results indicate that the softening or plasticizing degree gradually decreases with increasing drawing pass. The reason for this should be that dislocations generated in surface layer are only partially overflowed from the surface in the form of additional dislocation flux. The general dislocation density thereby gradually increases with the increase in drawing pass, resulting in the increase in the work hardening degree of the surface layer, and thus, the drawing stress. In this case, the texture orientation of the bar surface layer is gradually enhanced. In contrast, the dislocation density, and thus the work hardening degree of DIA bar, are higher than those of the ECD partner, resulting in larger drawing stress. ECD can obtain a product with excellent comprehensive mechanical properties compared with DIA, and there are no cracks on the fracture surface of ECD bar drawn for at least seven passes.
1. Introduction
At present, metal profiles such as bars, wires and tubes are widely used in many industries [1,2,3]. It is worth noting that these metal profiles are always obtained by drawing. Drawing is an important technology for manufacturing the profiles and key parts of difficult-to-deform metals with high hardness and strength, for instance, metal matrix composites, Mg alloys [4], Ti-based alloys [5], Ni-based alloys [6], and stainless steels [7]. These profiles are critical to aerospace, energy, petrochemical engineering and other strategic projects [8,9,10,11]. However, it is difficult to draw these materials due to their high deformation resistance, poor formability and high work-hardening degree. Generally, annealing or heating is used to solve these problems [12,13,14,15,16]. However, these methods will undoubtedly increase the production costs and decrease the performance of the final products.
In view of this, relatively new electroplastic drawing technology and ultrasonic vibration drawing technology have been developed. Electroplastic drawing technology is a drawing technology based on electroplastic effect [17,18]. The essence of electroplastic drawing technology is to apply a high-intensity pulsed current to a metal to generate an electron flux inside the metal, which can open up entanglement between dislocations, promote the movement of dislocations and thus, improve the deformability of materials and ultimately decrease drawing force [19,20,21,22,23,24]. Based on the electroplasticity, a new sintering method of powder metallurgy, named discharge-sintering or electric pulse consolidation, has also been developed [25,26]. Compared with the hot-pressed sintering of traditional powder metallurgy, this technique can achieve materials with a more compact microstructure. However, the current density used in electroplastic drawing technology is very high, being up to 103–104 A per mm2 [22,23,24]. Such a high-density current not only causes a large amount of energy consumption and increases production costs, but also poses a serious safety risk. Ultrasonic vibration drawing technology refers to applying ultrasonic vibration to die during drawing [27,28,29,30]. The results show that compared with traditional drawing, ultrasonic vibration drawing decreases drawing resistance significantly; the reduction can be up to 12% [29]. For difficult-to-deform metals or large-sized materials, high-power ultrasonic equipment is needed. However, under the current technological conditions, this equipment sometimes cannot be realized [31]. That is, these two relatively new technologies have their own defects and limitations. Therefore, it is urgent to develop an efficient, energy-saving, environmentally friendly and safety technology for producing the profiles and key components of these metals.
A new technique for manufacturing bars of hardly deformed metals, called electrochemical cold drawing (ECD), was proposed by Gutman based on his research on electrochemical corrosion behavior of metals [32]. During this process, a metal bar is immersed in an electrolyte as anode. At the same time, a very small DC current of about 10−1 to 102 mA per cm2 flows directly from the bar to the electrolyte, and then to cathode that is also immersed in the electrolyte. According to this principle, only an electrolyzer is integrated at the position where the drawing die is installed, i.e., the structure of traditional cold drawing machine does not need to be changed. That is to say, the technology is easy to be implemented and there is no potential risk besides significant energy saving.
The theoretical basis of ECD is the chemical mechanical effect (CME) proposed by Gutman [32]. It can be found that the surface of steel is softened under the action of CME and the surface hardness can be reduced by 20–80% compared with that measured in air. The surface-softening degree is proportional to current density and varies with the electrolyte kind and molarity [32,33]. According to these findings, if a metal is drawn under these conditions, the drawing force should be decreased due to the surface softening. As for the mechanism of surface softening, Gutman believes that when anode current passes through the stressed zone in surface layer of a metal, the atoms on the surface layer are dissolved. A chemical potential gradient of dislocation formation is thereby formed in this zone, resulting in an additional dislocation flux towards surface. Dislocations then reach the surface and finally overflow from the surface, resulting in the decrease in dislocation density in the surface deformation zone, and thus softening or plasticizing the surface layer [34]. As the applied current density increases, the movement of additional dislocation flux is accelerated, and the deformation becomes more easily operated. Therefore, the softening degree of the surface layer is enhanced [34]. Limited studies on ECD of magnesium alloys show that CME can actually improve the plasticity and decrease the hardness of surface layer and the drawing force of these relatively difficult-to-deform metals [35,36]. To date, no studies have been publicly reported on the effect of drawing pass on softening or plasticizing during ECD. In this work, in order to provide theoretical guidance for the engineering application of this technology, the effect of drawing pass on surface layer softening or plasticizing during ECD of Q235 steel bar was studied.
2. Materials and Methods
2.1. Material
The material used in this study was Q235 steel bars with a dimension of Φ 9.0 mm × 600 mm. Their chemical compositions were 0.17% C, 0.46% Mn, 0.21% Si, 0.03% S, 0.04% P and the balance of Fe (wt. %). Prior to drawing, the bars were annealed at 720 °C for 3 h, and then air-cooled to room temperature (25 °C).
2.2. Drawing Process
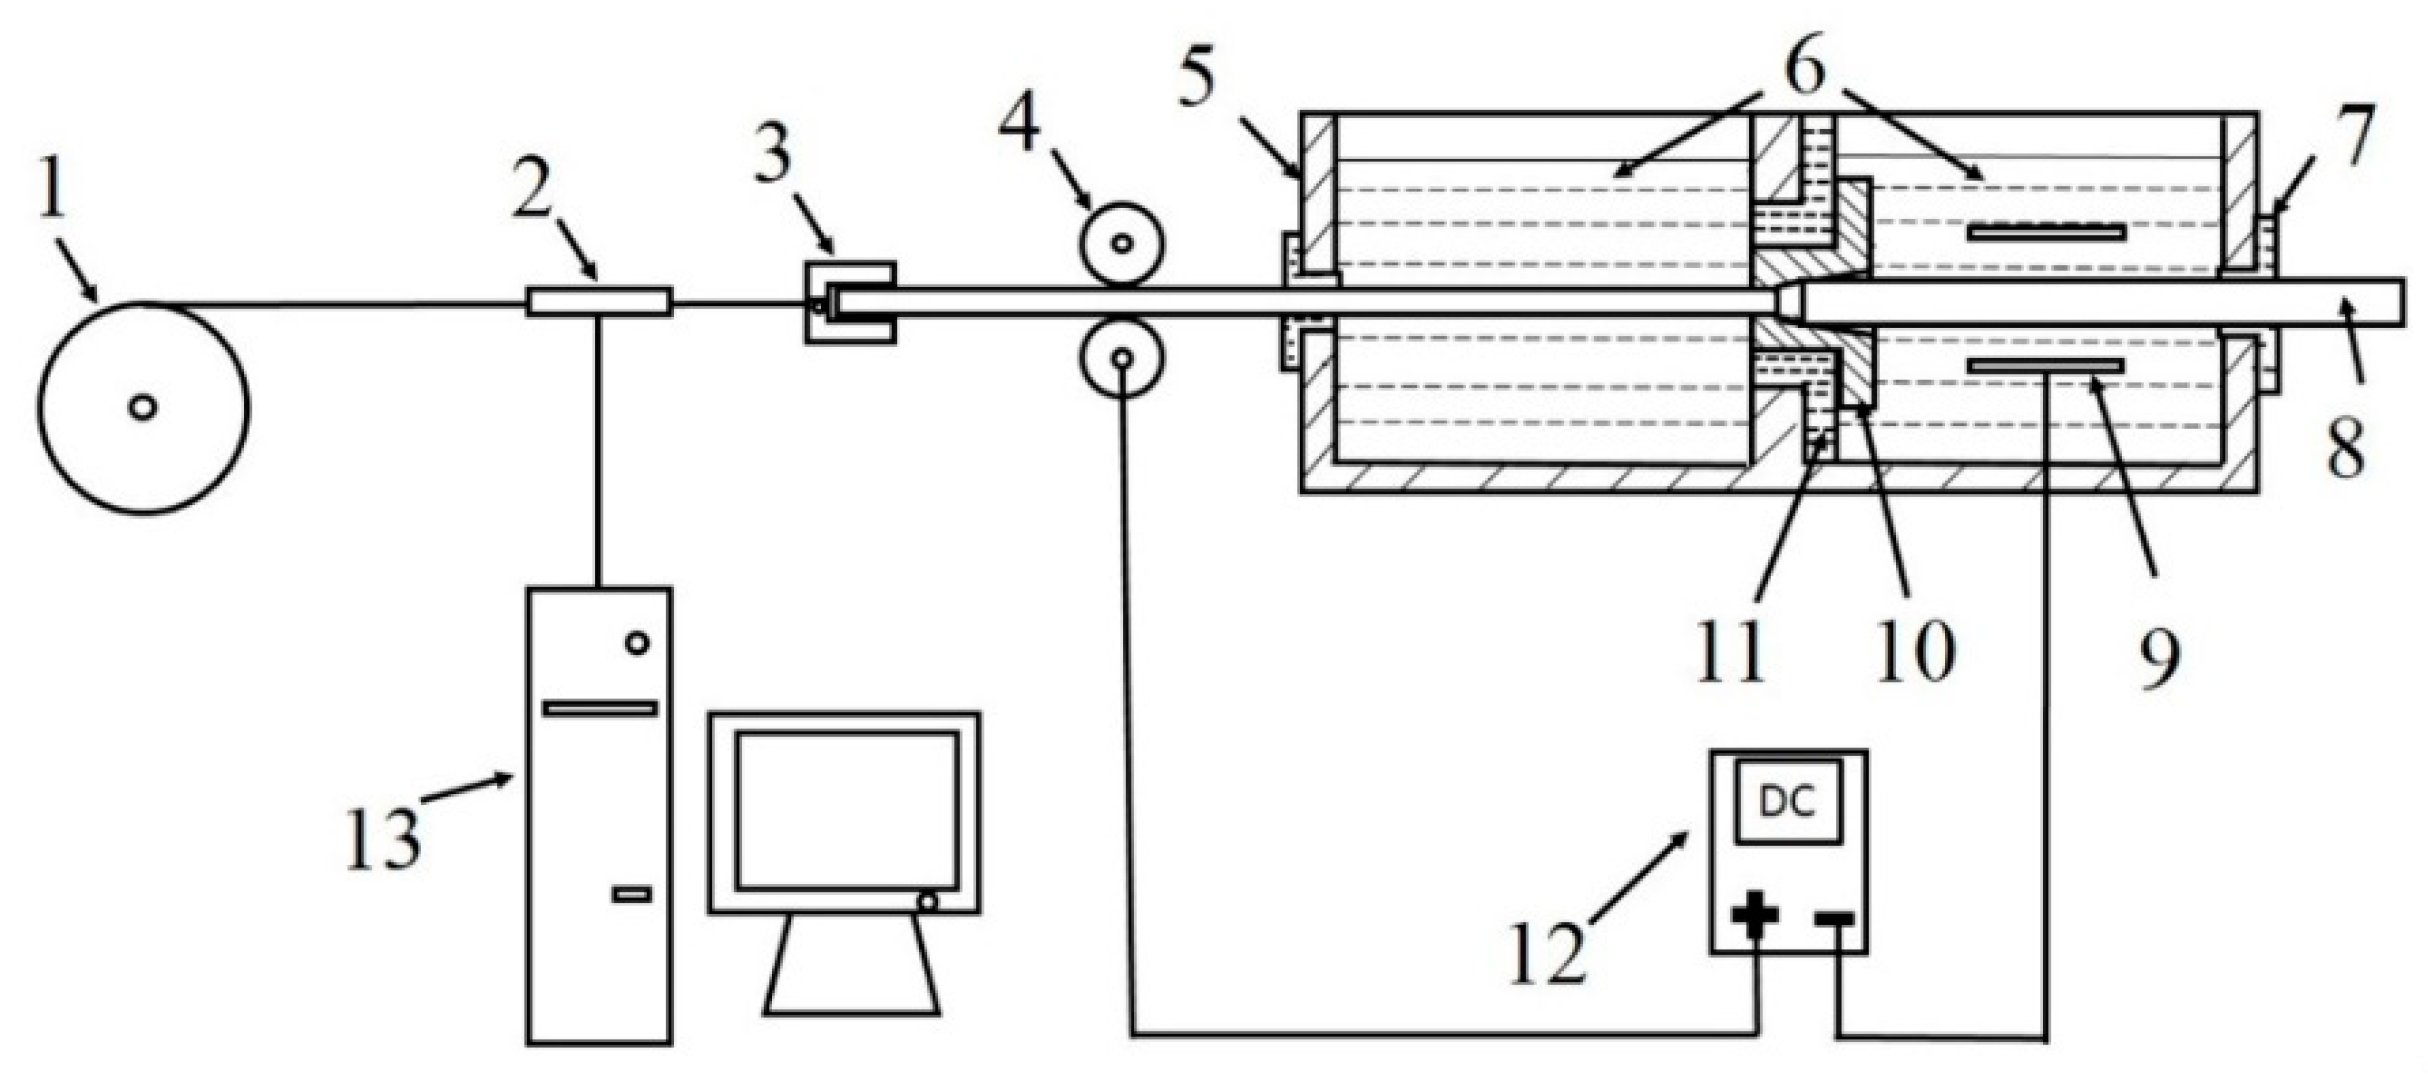
The ECD experiments were conducted using self-designed cold drawing equipment. The related principles and drawing process are detailed in [35,36]. For convenience, the schematic diagram of ECD is presented in Figure 1. In this study, the diameters of the dies used for seven-pass drawing were 8.6 mm (1st drawing pass), 8.3 mm (2nd drawing pass), 7.9 mm (3rd drawing pass), 7.0 mm (4th drawing pass), 6.4 mm (5th drawing pass), 5.8 mm (6th drawing pass), and 5.2 mm (7th drawing pass), respectively. All the annealed Q235 steel bars were polished by abrasive paper in order to remove surface oxides, and then cleaned in turn by acetone and anhydrous ethanol. Each bar was cut into two parts. One part was electrochemically corroded for 3 min in 0.95 M H2SO4 aqueous solution under a current of 420 mA, and then drawn immediately under the same current. For comparison, the other part was drawn in air. The employed drawing speeds of these two methods were all 0.25 m·s−1.
2.3. Laboratory Investigations
Metallographic specimens were machined from the drawn bars. One longitudinal section of each specimen parallel to the drawing direction was finished and polished by standard metallographic techniques. The specimens were then etched using 4 vol. % ethanol solution prior to being observed by Zeiss Axio Scope A1 optical microscope (OM, Carl Zeiss AG, Jena, Germany). To observe the texture orientations of the bar surface layers, an analysis of electron back-scattered diffraction (EBSD) was conducted. A small bar with a length of 10 mm was cut from each bar and processed into a specimen with 10 mm length and 3 mm thickness along its longitudinal axis. They were then mechanically finished and polished into thin sheets with a thickness of 2 mm, and electrochemically polished for 20–30 s using a DPF-2 electrolytic polishing instrument (Shanghai optical instrument Company, Shanghai, China). The applied current density and acceleration voltages were 15–50 mA·cm−2 and 20–25 V, respectively. The used electrolyte consists of 100 mL HClO4 and 900 mL ethanol. Finally, they were analyzed by EBSD equipped with a FEI-Quanta 450 FEG field emission scanning electron microscope (SEM, FEI, Hillsboro, OR, USA). The cross sections of another group of small bars with a length of 10 mm were examined by a D/Max-2400 Powder X-ray diffractometer (XRD, Rigaku, Tokyo, Japan) to calculate dislocation densities of the surface deformation layers. The detailed calculation process can be found in [37,38]. The microhardness values of both the surfaces and cross sections were measured by exerting a load of 0.1 Kgf for 15 s using a Wilson VH1102 automatic hardness test system (Buehler, Lake Bluff, IL, USA). The average of at least seven tests was recorded as the microhardness. Some drawn bars were used for tensile testing by a WDW-100D computer-controlled electronic universal material testing machine. Finally, the morphologies of the tensile fracture surfaces were observed by a JSM-6700F cold field emission scanning electron microscope (SEM, JEOL, Tokyo, Japan).
3. Results and Discussion
During drawing, the drawing force P obeys the following equation given by Rabinowicz [39]
where is the deformation resistance (MPa),is the crosssection area of bar exited in drawing die (), φ is the logarithm of deformation ratio, μ is the friction coefficient, and α is the cone half angle of the die (rad). The drawing stress τ (MPa) can be achieved by the equation:
Compared with drawing in air (DIA), the drawing stress decrement of ECD, i.e., the softening degree can be calculated by
where and are the drawing stresses of DIA and ECD, respectively. And the decrement rate of drawing stress ∆τ can be obtained according to the equation
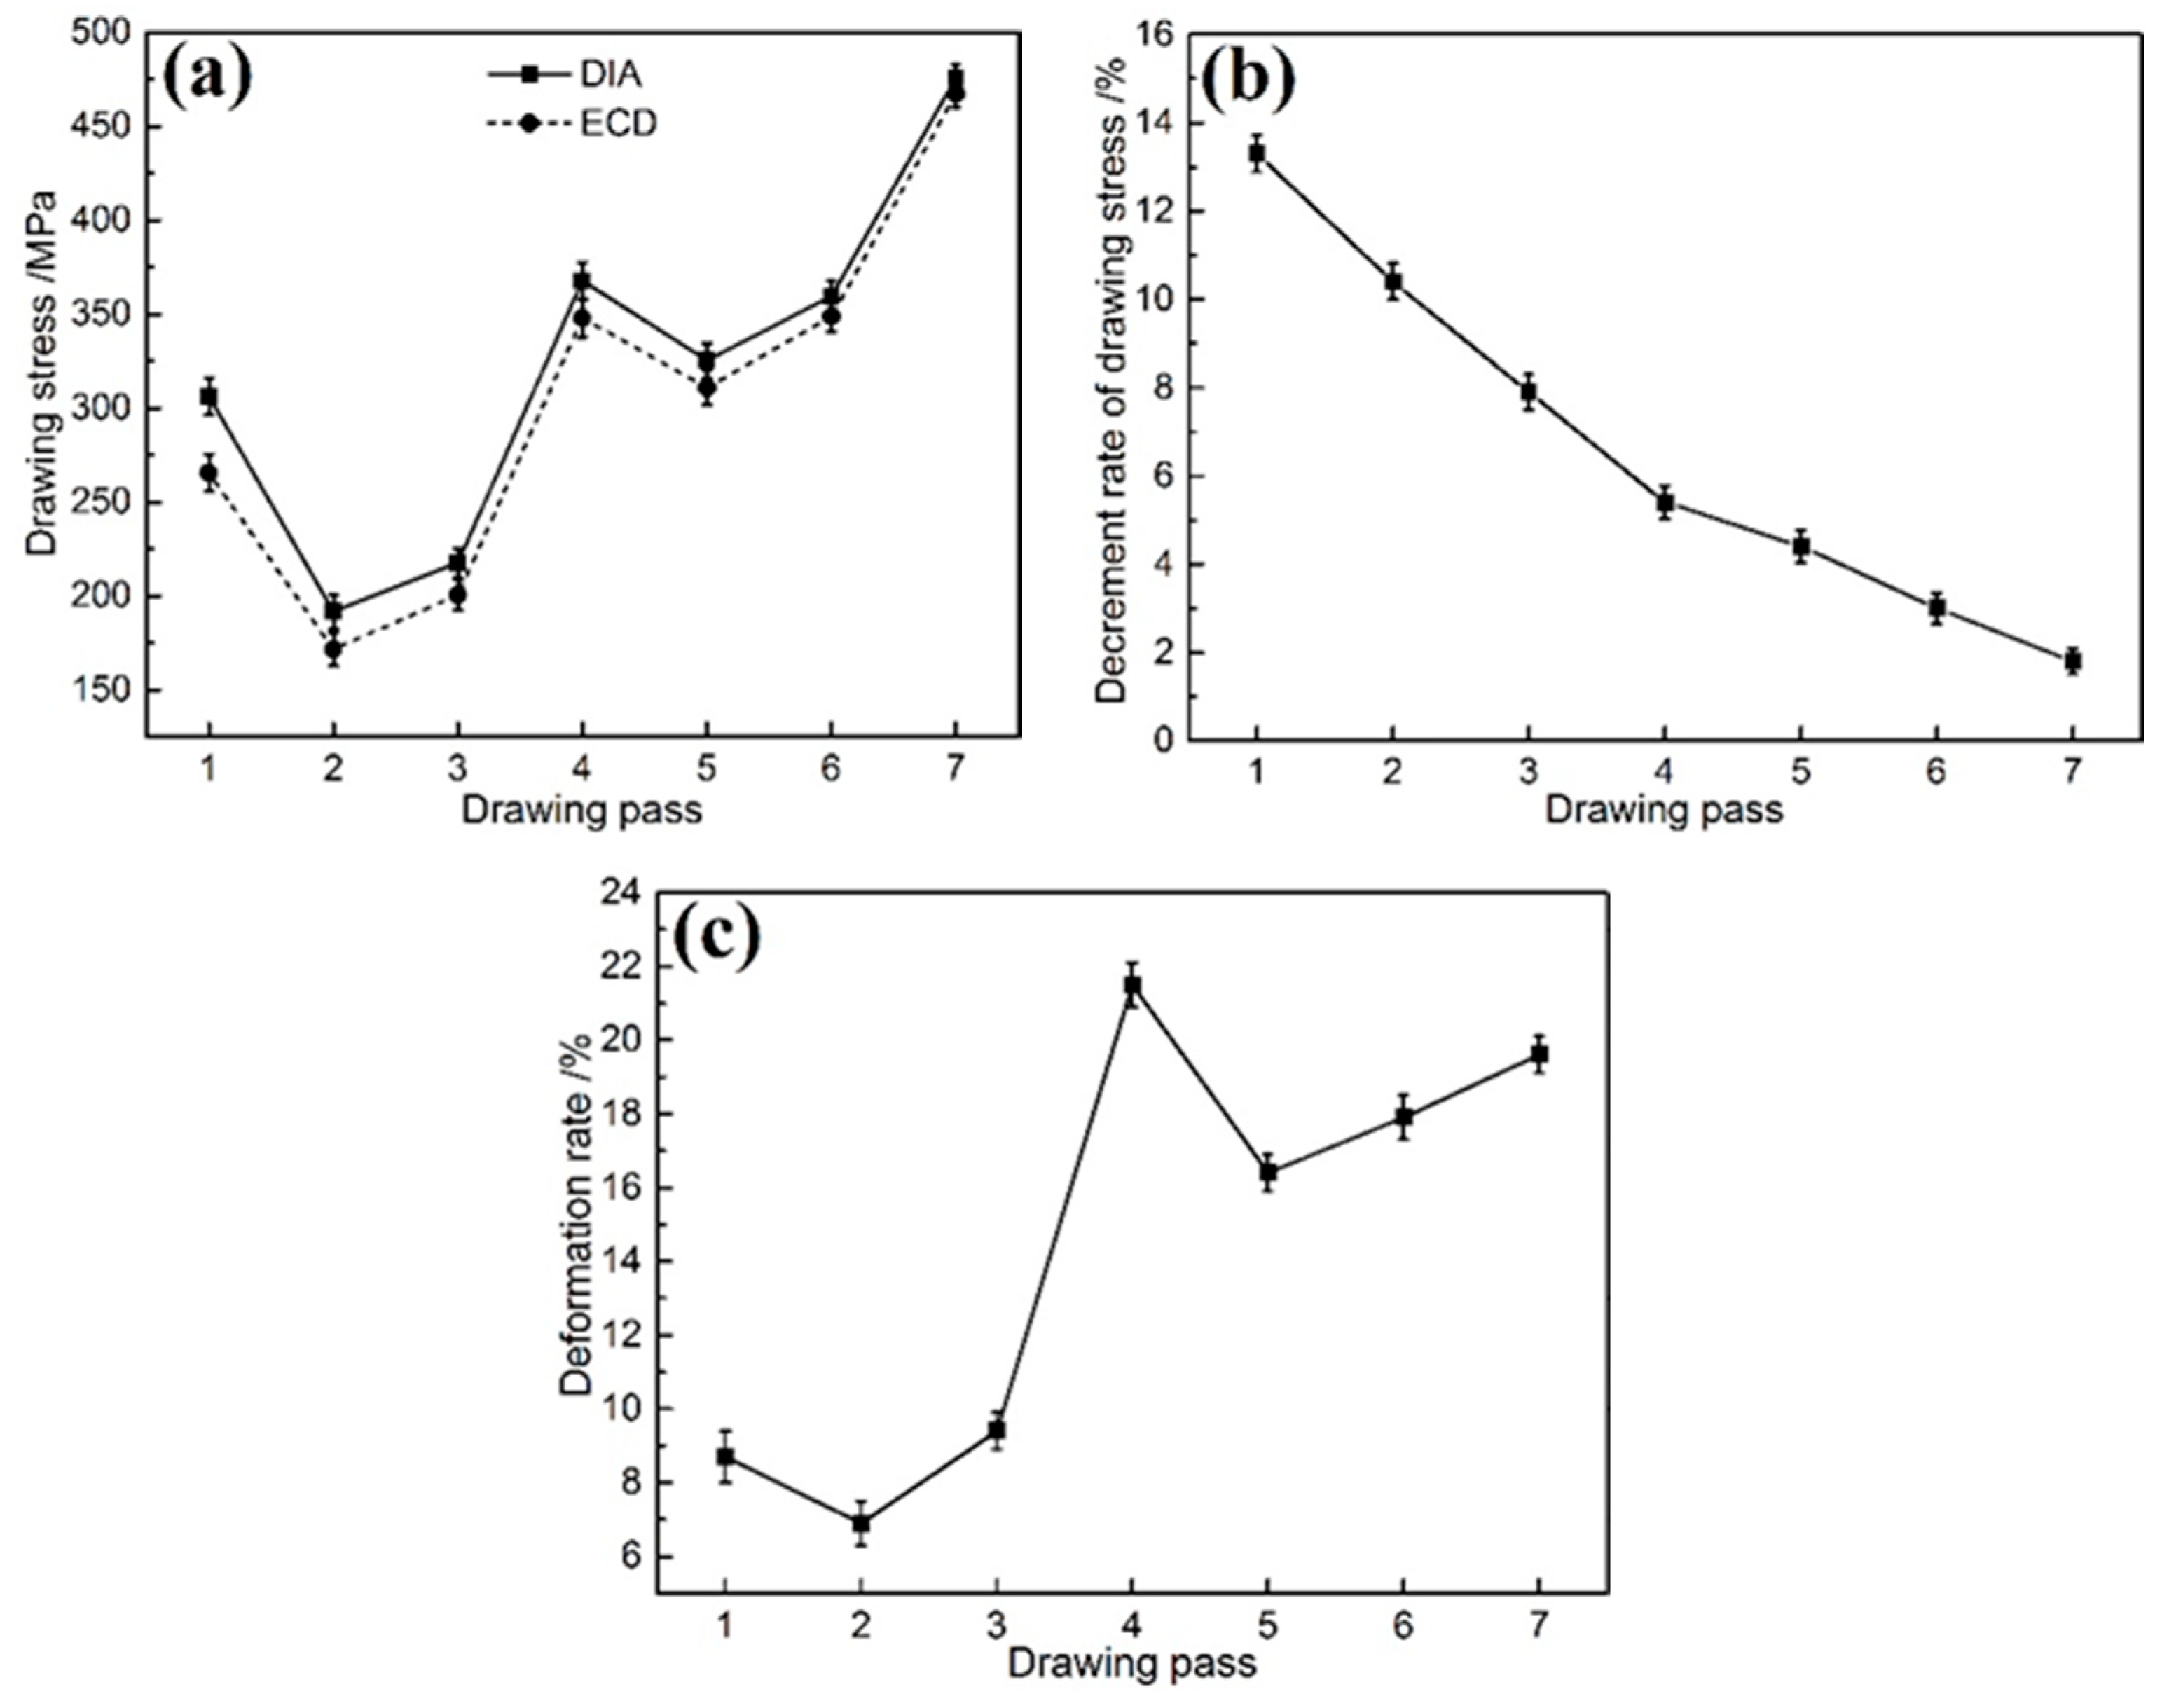
Figure 2a,b shows the calculated results of and ∆τ during each pass drawing of ECD and DIA respectively. With the increase in drawing pass, the change trends of drawing stress of the two-method drawing are same (Figure 2a). During the first-pass drawing, the drawing stresses of the two methods are all relatively large due to the high deformation rate. With the increase in drawing pass, the drawing stresses are generally in an increase trend except those of the second- and fifth-pass drawings (Figure 2a). These exceptions at these two passes contribute to the relatively low deformation rates (Figure 2c). Importantly, the drawing stress of ECD is always lower than that of DIA under each-pass drawing (Figure 2a). However, as the drawing pass increases, the decrement rate decreases gradually (Figure 2b). Compared with DIA, the maximum decrement rate can reach 13.3% (Figure 2b). The results mean that ECD can soften the steel, but the softening degree decreases gradually with increased drawing pass.
To characterize the softening degree, Gutman theoretically deduced an expression between drawing stress decrement Δτ* and dislocation density [32],
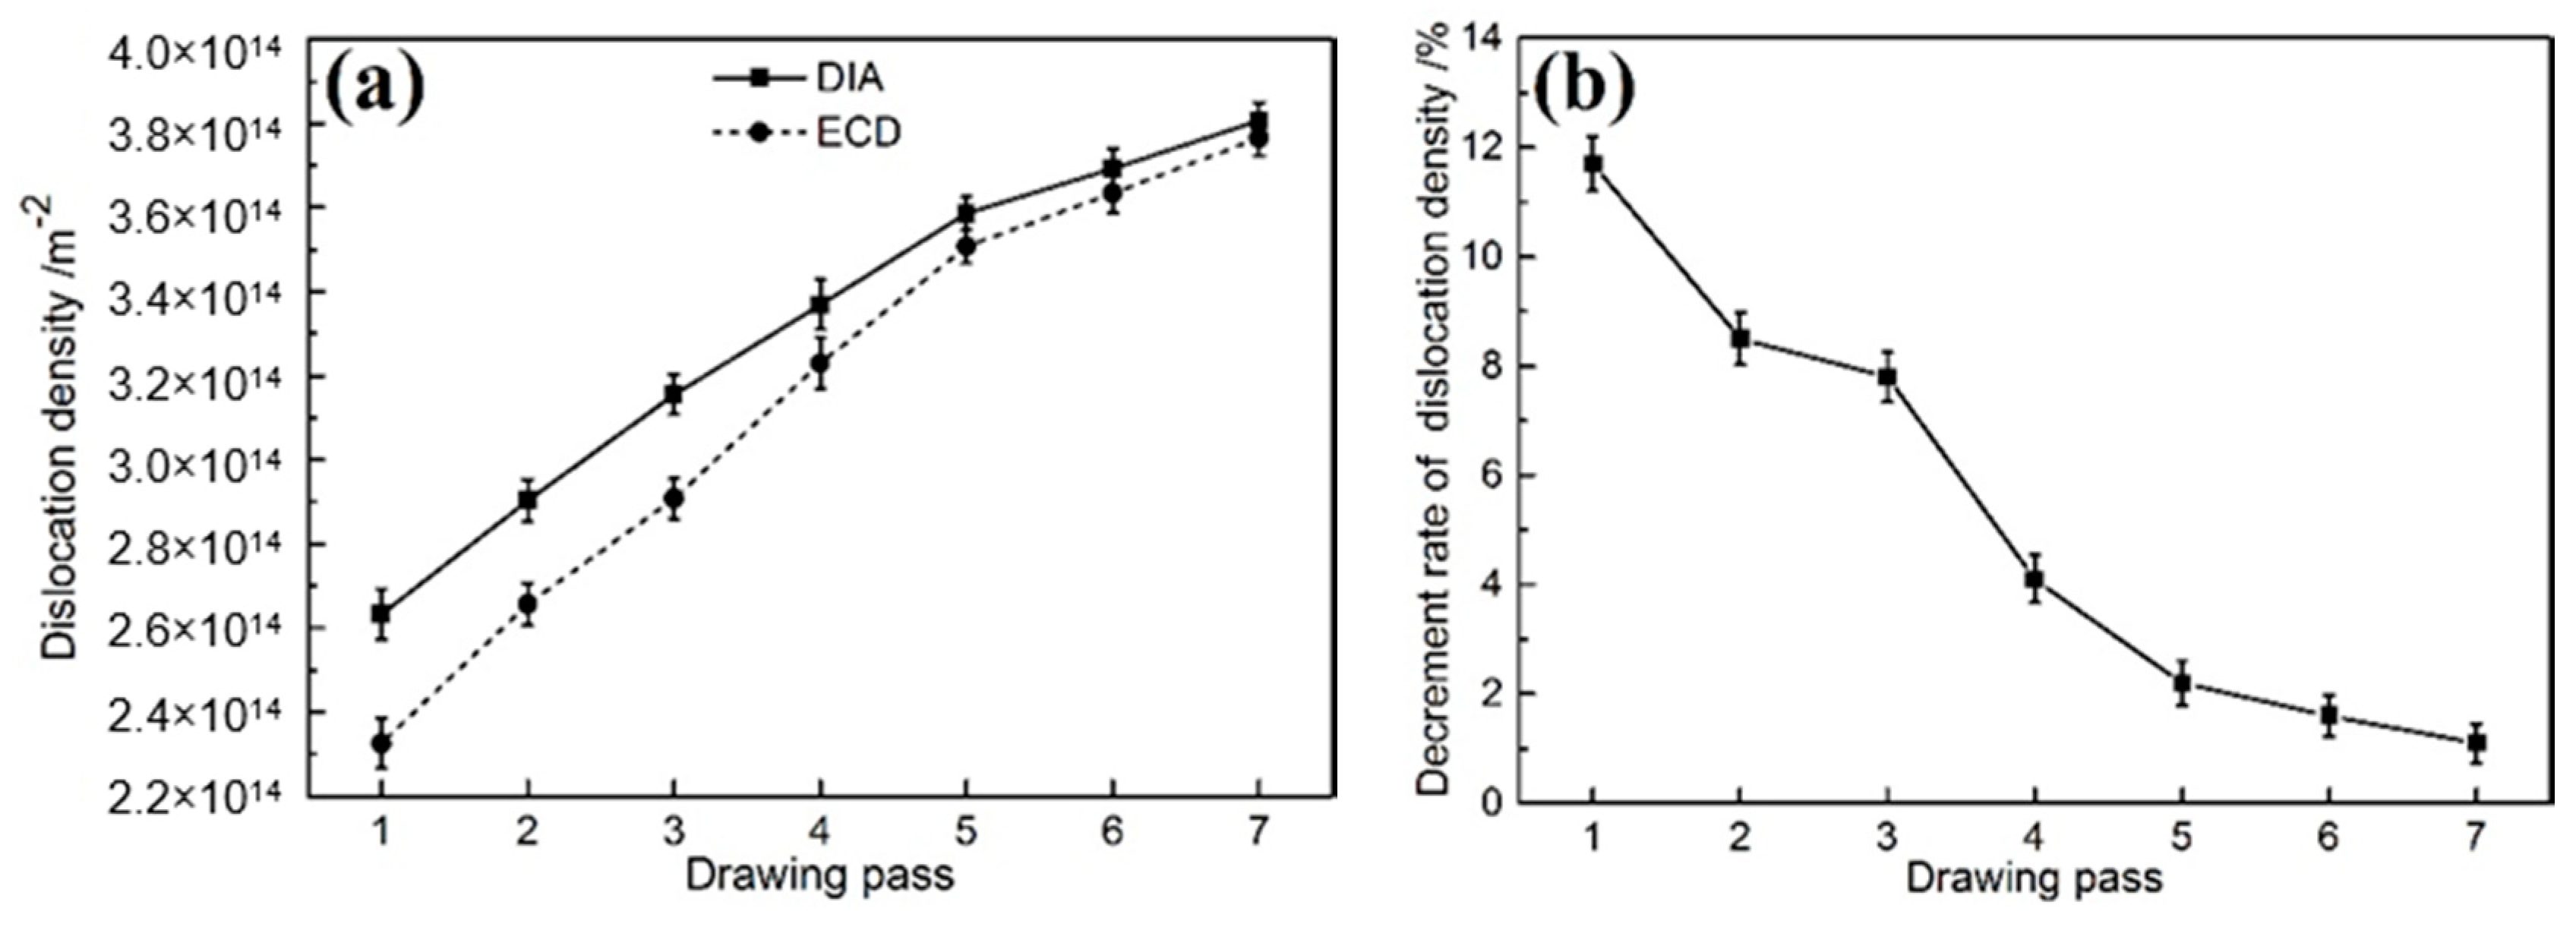
It can be found that the stress decrement (softening degree) Δτ* is inversely proportional to dislocation density . The variations in the dislocation densities of the ECD and DIA bars with drawing pass are shown in Figure 3. The dislocation densities of the ECD bars are always lower than those of DIA partners under the same drawing pass (Figure 3a). Compared with DIA, the maximum reduction rate for ECD bar is 11.7% at the first-pass drawing (Figure 3b), and the reduction rate then decreases rapidly with the increase in drawing pass (Figure 3b). During the DIA process, dislocation entanglement is quite serious, which leads to the rapid increase in dislocation density in the surface deformation layer. This is aggravated gradually with increasing drawing pass. However, for the ECD process, the mobility of dislocations is enhanced under a chemical potential gradient originated from anode dissolution [35], equivalent to the relaxation of dislocations in the surface layers. That is, the dislocations become more mobile, forming an additional dislocation flux towards the surface and overflowing from the surface [36]. The dislocation density in the surface deformation layer is then decreased, and thus the deformation resistance is reduced. However, as expected, only the dislocations in the grains that are exposed on electrolyte can reach the surface, and finally overflow from the surface. The reason is that the dislocation in the inner grains will be impinged by grain boundaries. Namely, only the dislocations in the outmost layer of grains can overflow from the surface, contributing to the decrease in dislocation density. In addition, only part of the dislocations in this layer can overflow from the surface. In this case, the general dislocation density in the surface layer should also increase due to the accumulation of dislocations as the drawing pass increases. Therefore, it is expected that the work hardening degree is also increased continuously for the ECD bar with the increase in drawing pass. As a result, the softening degree of the surface layer is reduced, resulting in the decrease in the reduction rate of drawing stress.
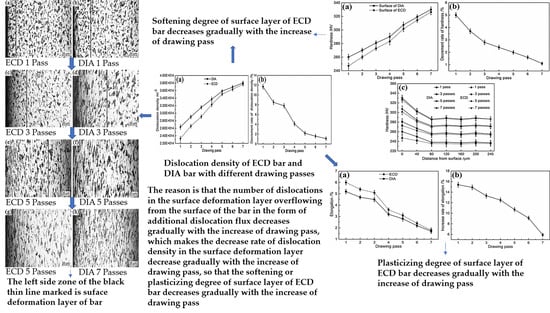
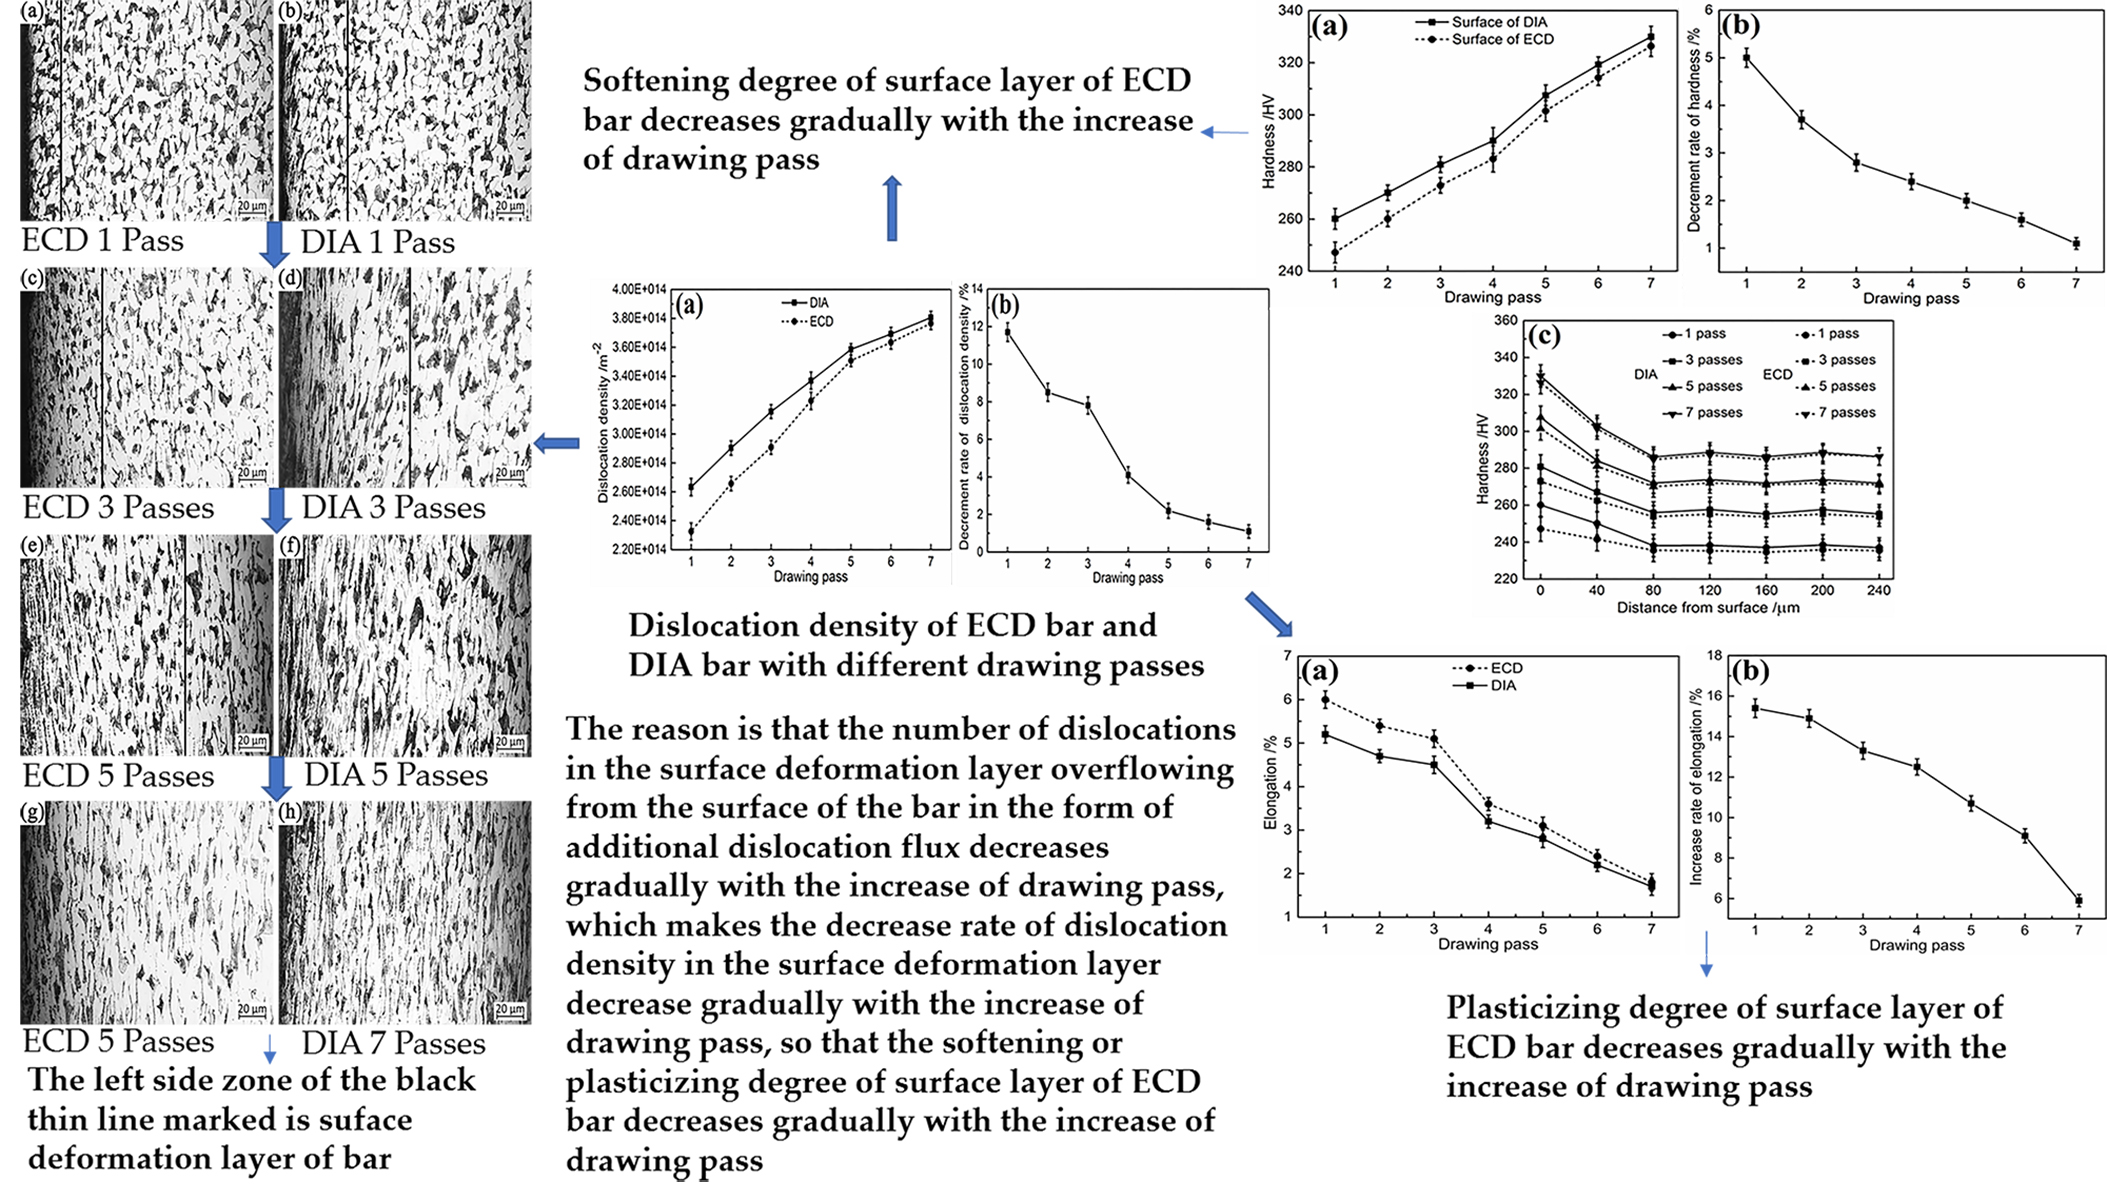
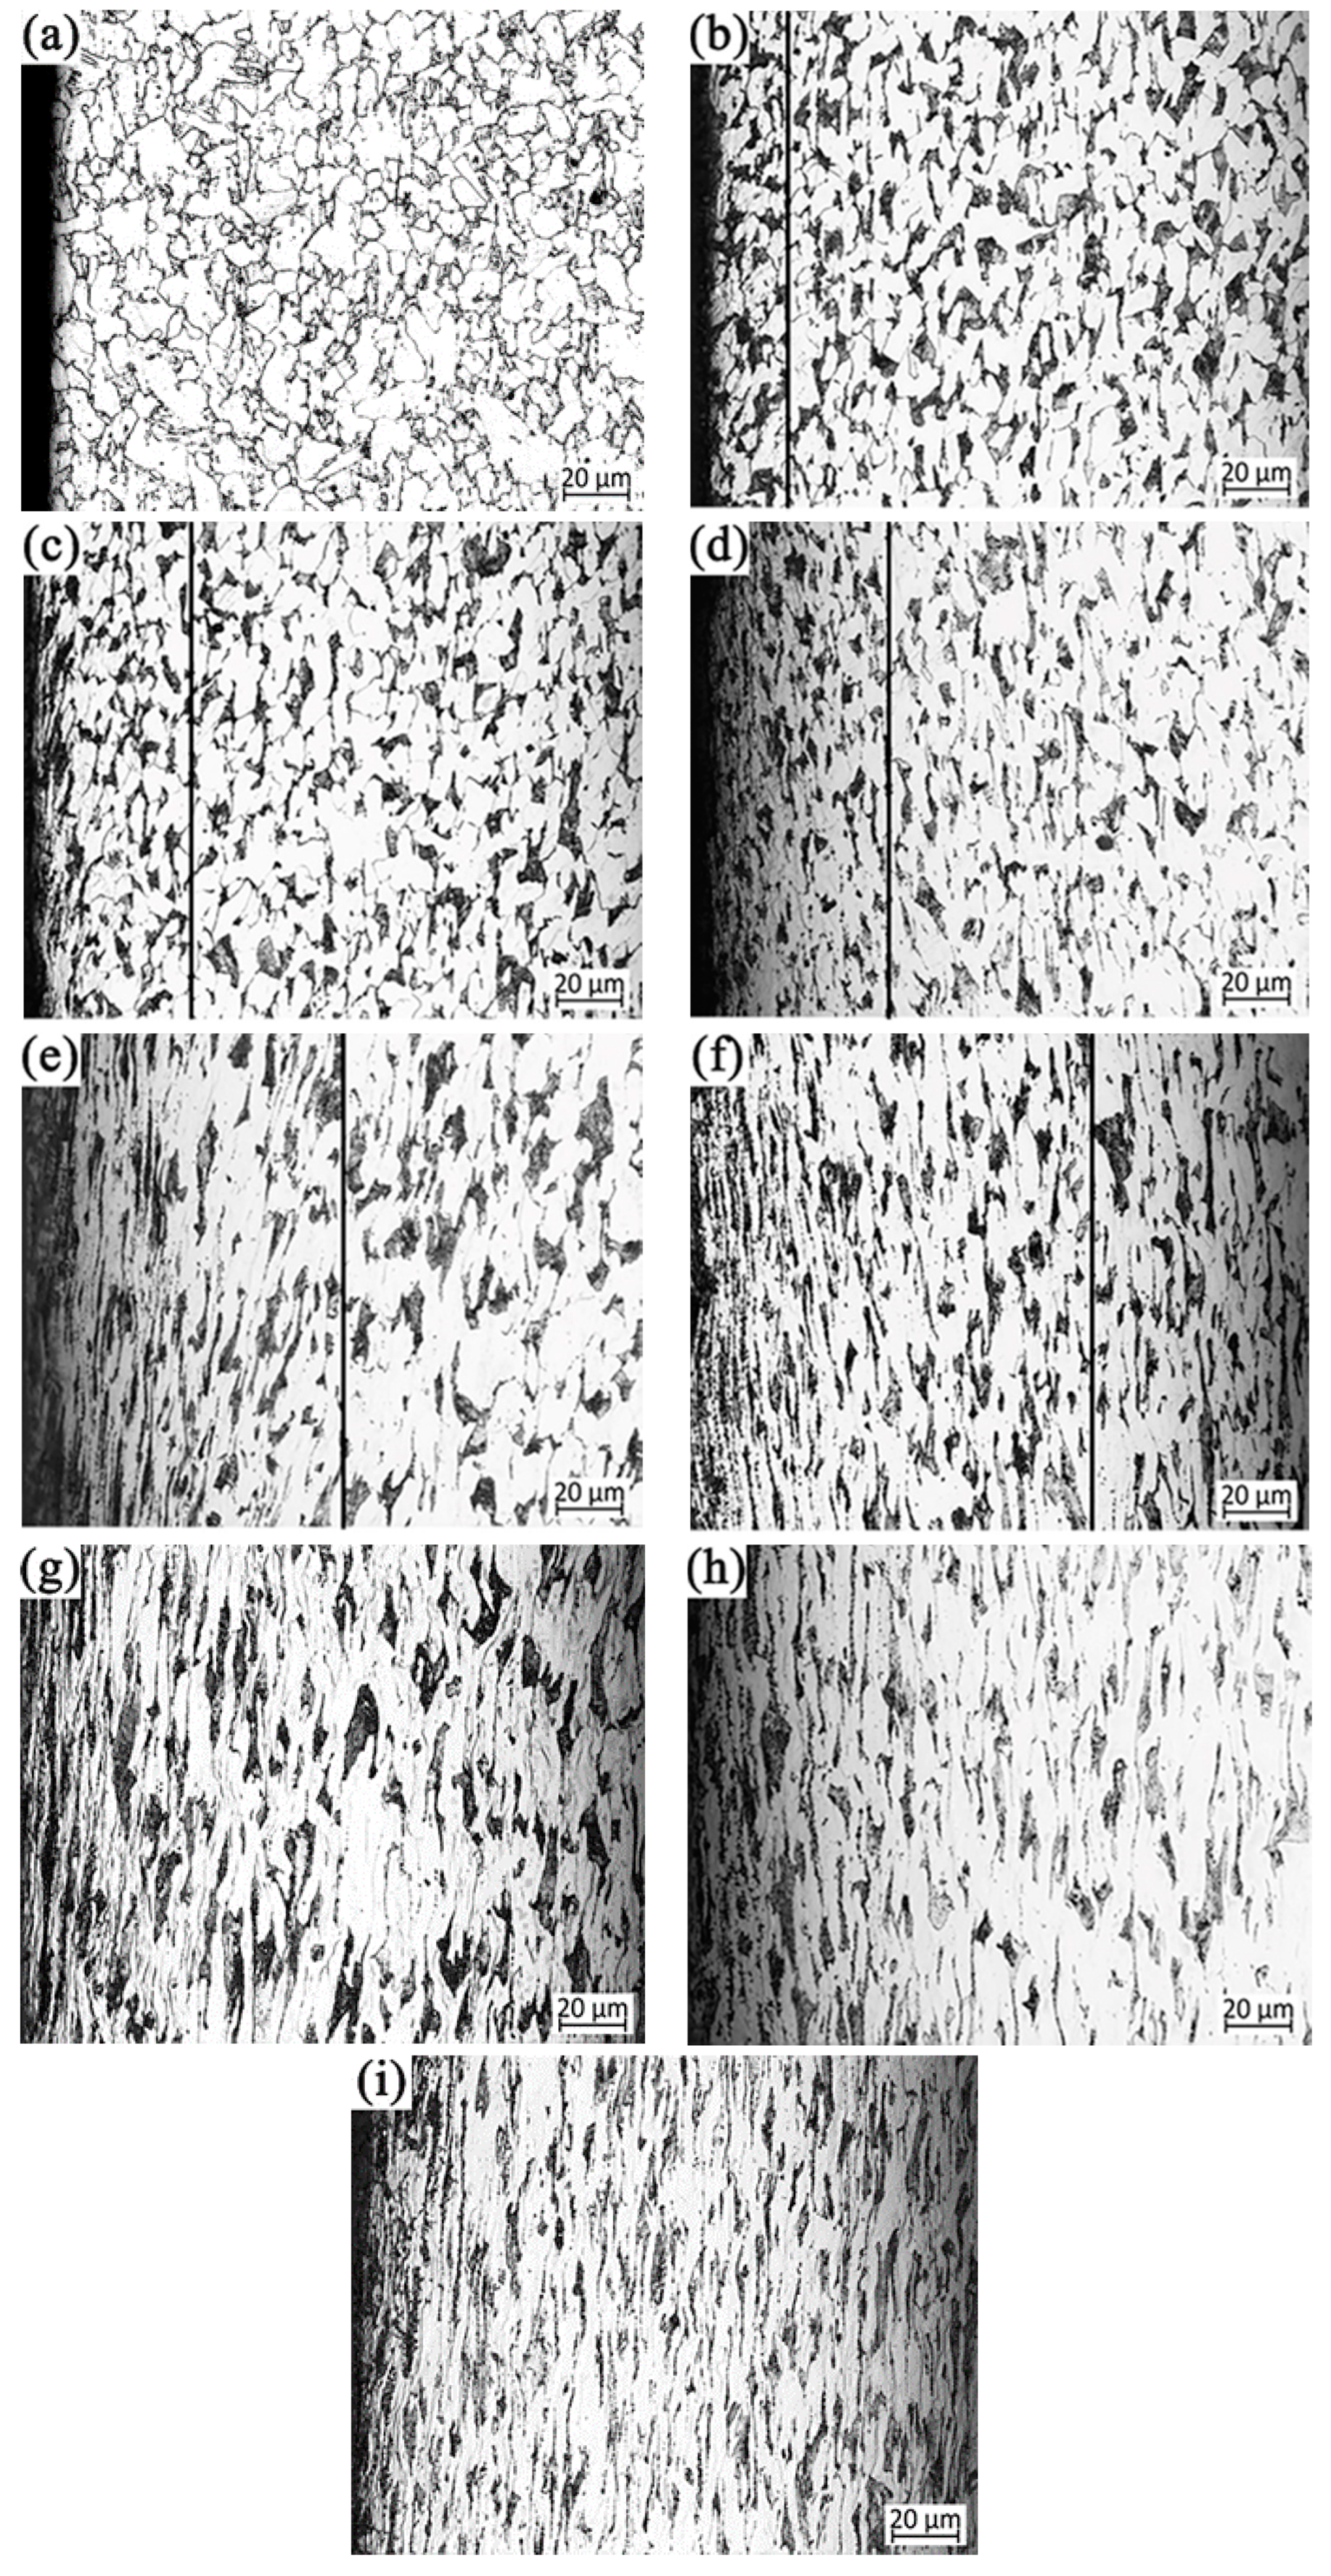
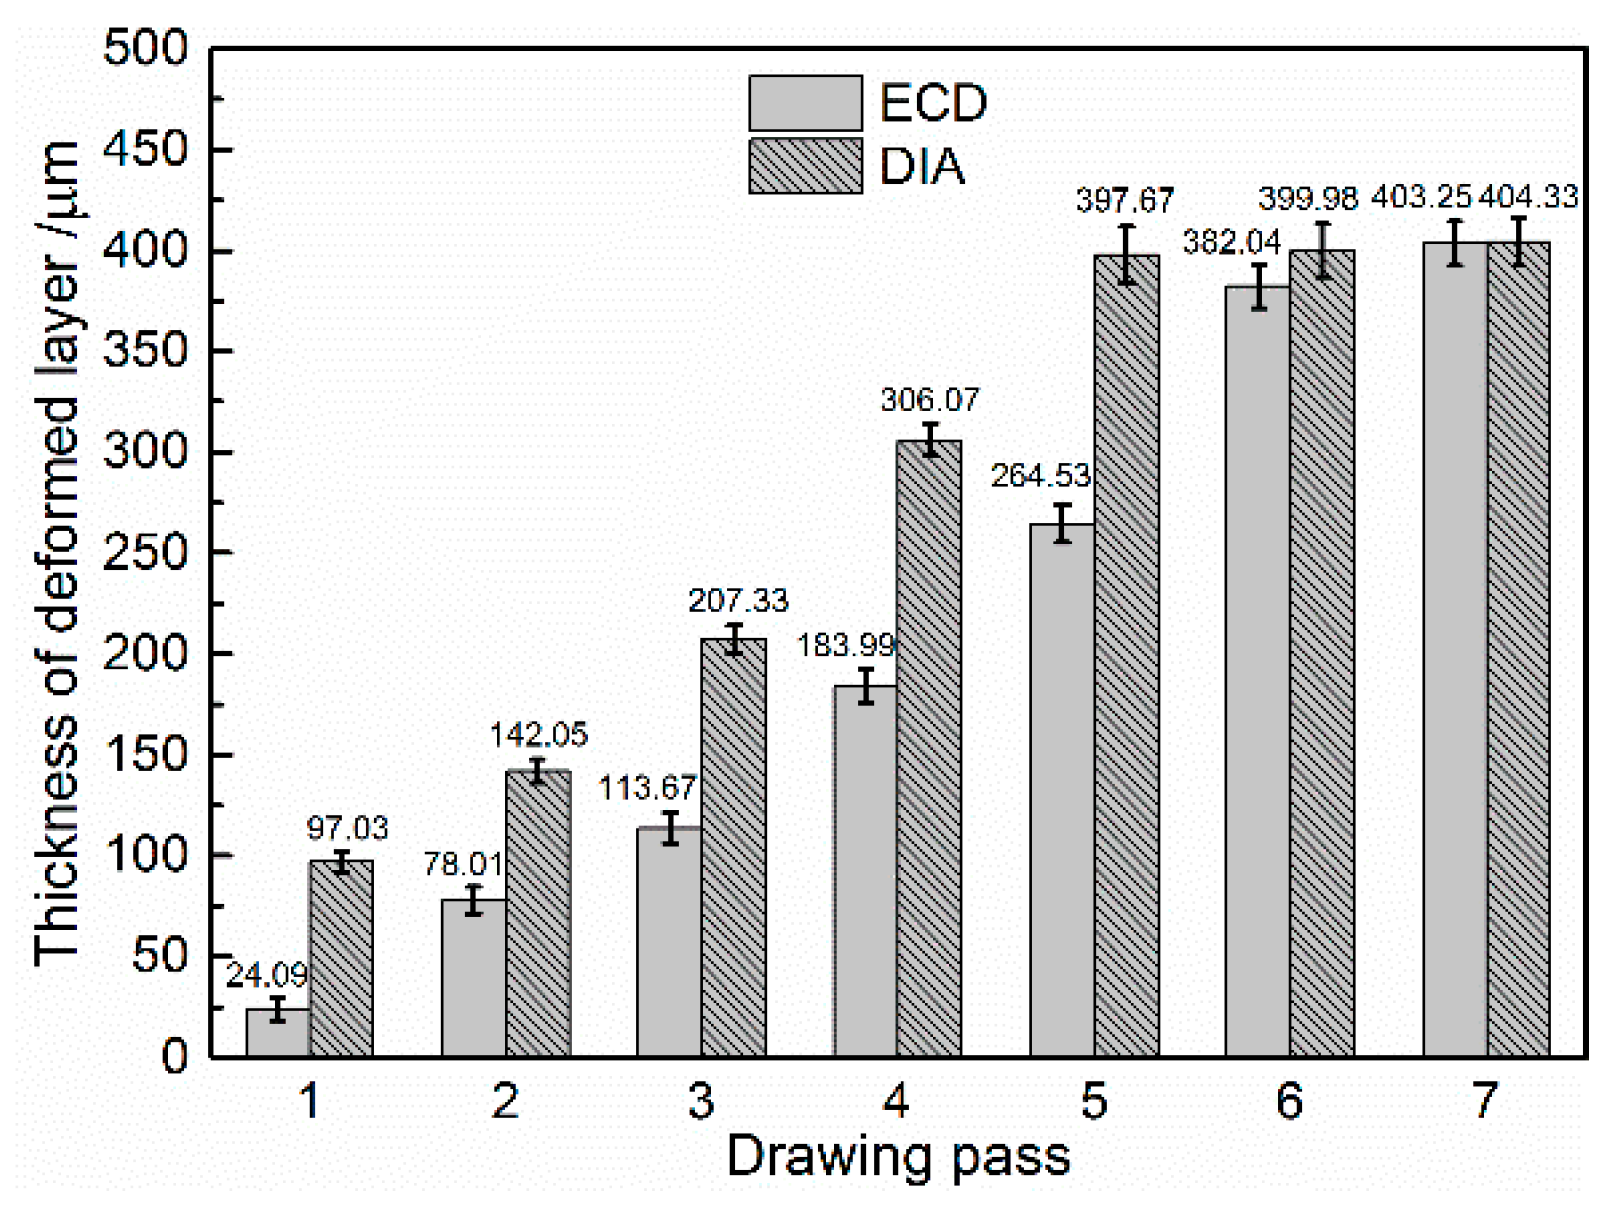
The softening can also be observed from the surface layer microstructures of drawn bars. OM microstructures along longitudinal direction of the raw bar and drawn bars by ECD and DIA for different drawing passes are shown by Figure 4. Since the raw bar is in an annealed state, there are not any deformation characteristics (Figure 4a). However, after being drawn by either ECD or DIA, there is always an obvious surface deformation surface. Comparing the images in Figure 4, it can be found that both the deformation degree of the grains and the thickness of the surface deformation layer all increase with increasing drawing pass for the ECD and DIA bars. However, these two deformation parameters of ECD bars are always smaller than those of DIA bars at the same drawing pass (comparing Figure 4b–i). Compared with DIA, the maximum reduction rate of surface deformation layer thickness of ECD bar can reach 75.17%. With the increase in drawing pass, the reduction rate decreases rapidly (Figure 5). When the bar was drawn for seven passes, the differences in deformation degree and deformation layer thickness between the two-method processed bars are very small (comparing Figure 4h,i, and Figure 5). That is, the changes in both deformation degree and deformation layer thickness are completely consistent with those of drawing stress (force) and dislocation density with drawing pass; the larger the former two parameters are, the larger the latter two parameters are, and vice visa.
For the ECD process, with the increase in drawing pass, the work hardening of surface layer is also exacerbated gradually due to the accumulation of dislocations. As a result, the deformation degree of grains in the deformation layer and the thickness of surface deformation layer increase gradually. In view of this point, the effect of CME on the softening degree is gradually weakened with the increase in drawing pass. In other words, the work hardening of the surface layer is only weakened, but not completely eliminated as discussed above. This is the main reason that the decrement rate of drawing stress is decreased with increasing drawing pass. Simultaneously, driving by the stress applied by drawing machine, the grains in the surface layer, similar to DIA, are also elongated along drawing direction. In addition, when the bar passed through the die, the circumferential shear stress and radial compressive stress exerted by the die led the grains in surface layer to be compressed [40]. As the drawing pass increases, the work hardening also becomes more and more serious. Therefore, both the grain compression and elongation degrees in the surface layer of ECD bar, also including DIA bars, become more obvious, i.e., the deformation degree becomes more serious.
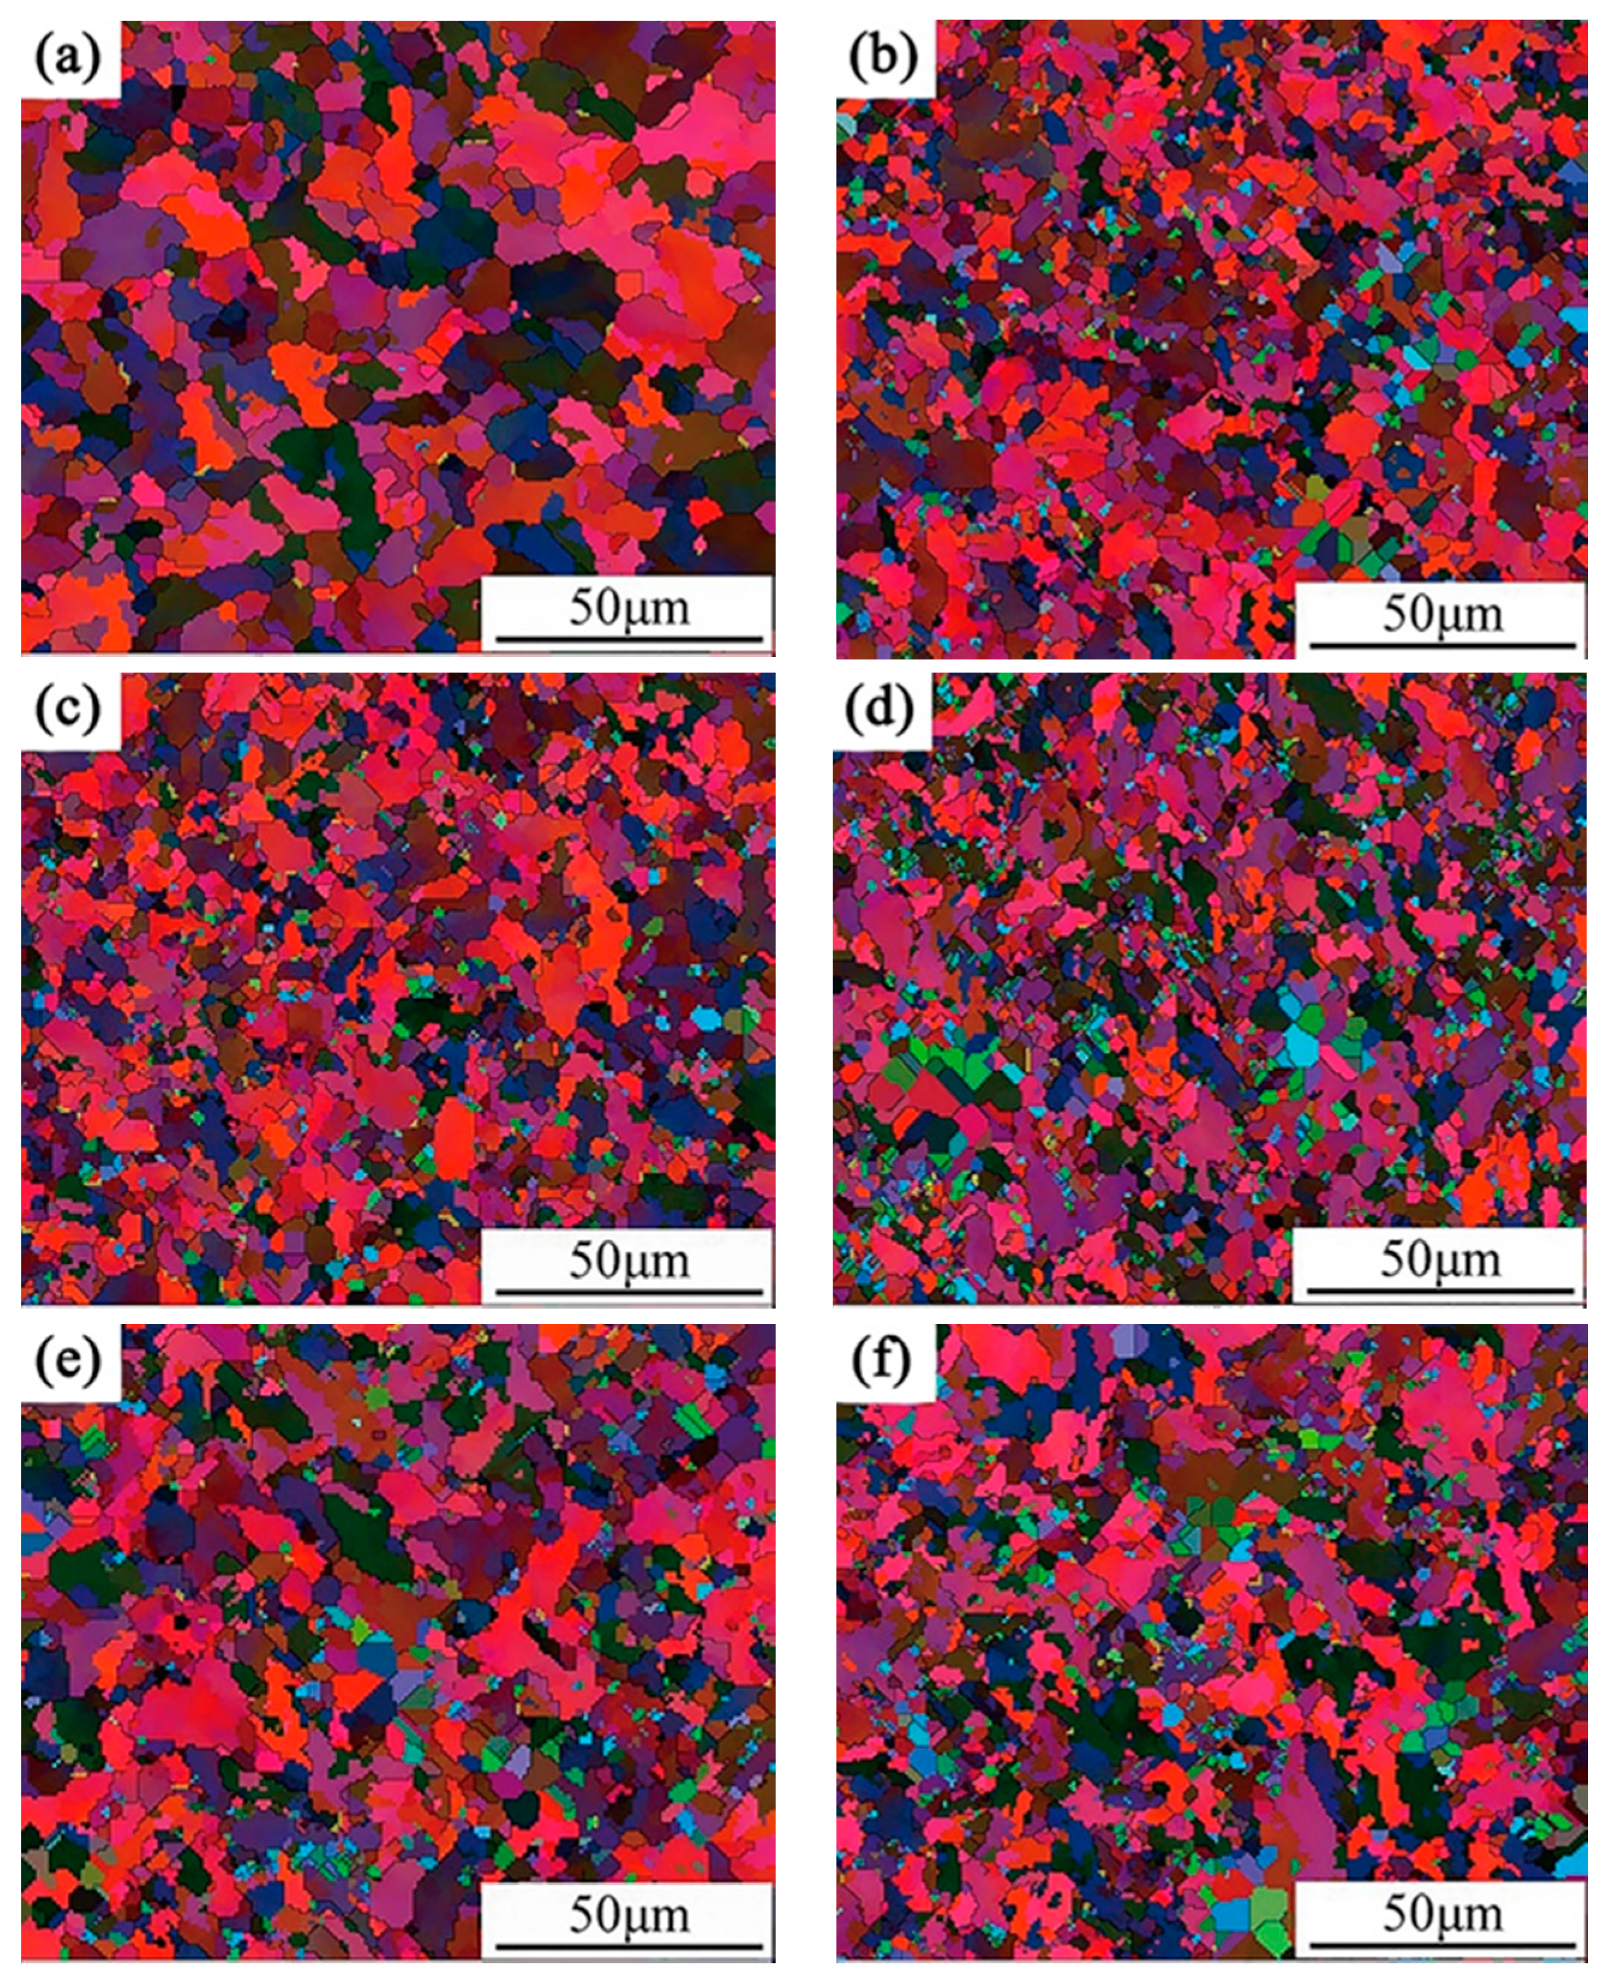
Figure 6 gives the grain orientation images of surface deformation layers along axial direction of the bars drawn by ECD and DIA for different passes. In these images, different colors represent different grain orientations. The variation from blue to red denotes the change of grains from a weak orientation to a strong orientation. It can be seen that the grain orientations of the ECD bars are significantly weaker than those of the corresponding DIA partners at the same drawing passes (comparing Figure 6a–f). This means that the microstructure textures of ECD bars are always weaker than those of DIA partners. Thus, the deformation degrees of the ECD bars are smaller than those of DIA ones. This is completely consistent with the result from the above microstructure observation. Figure 6 also shows that the greater the number of drawing pass is, the smaller the difference in grain orientation between the two-method processed bars is. The reason for this is that the difference in the dislocation density of the surface deformation layer between the ECD and DIA bars gradually decreases as the drawing pass increases. This also indicates that the softening degree of the ECD bar surface layer gradually decreases as the number of drawing pass increases.
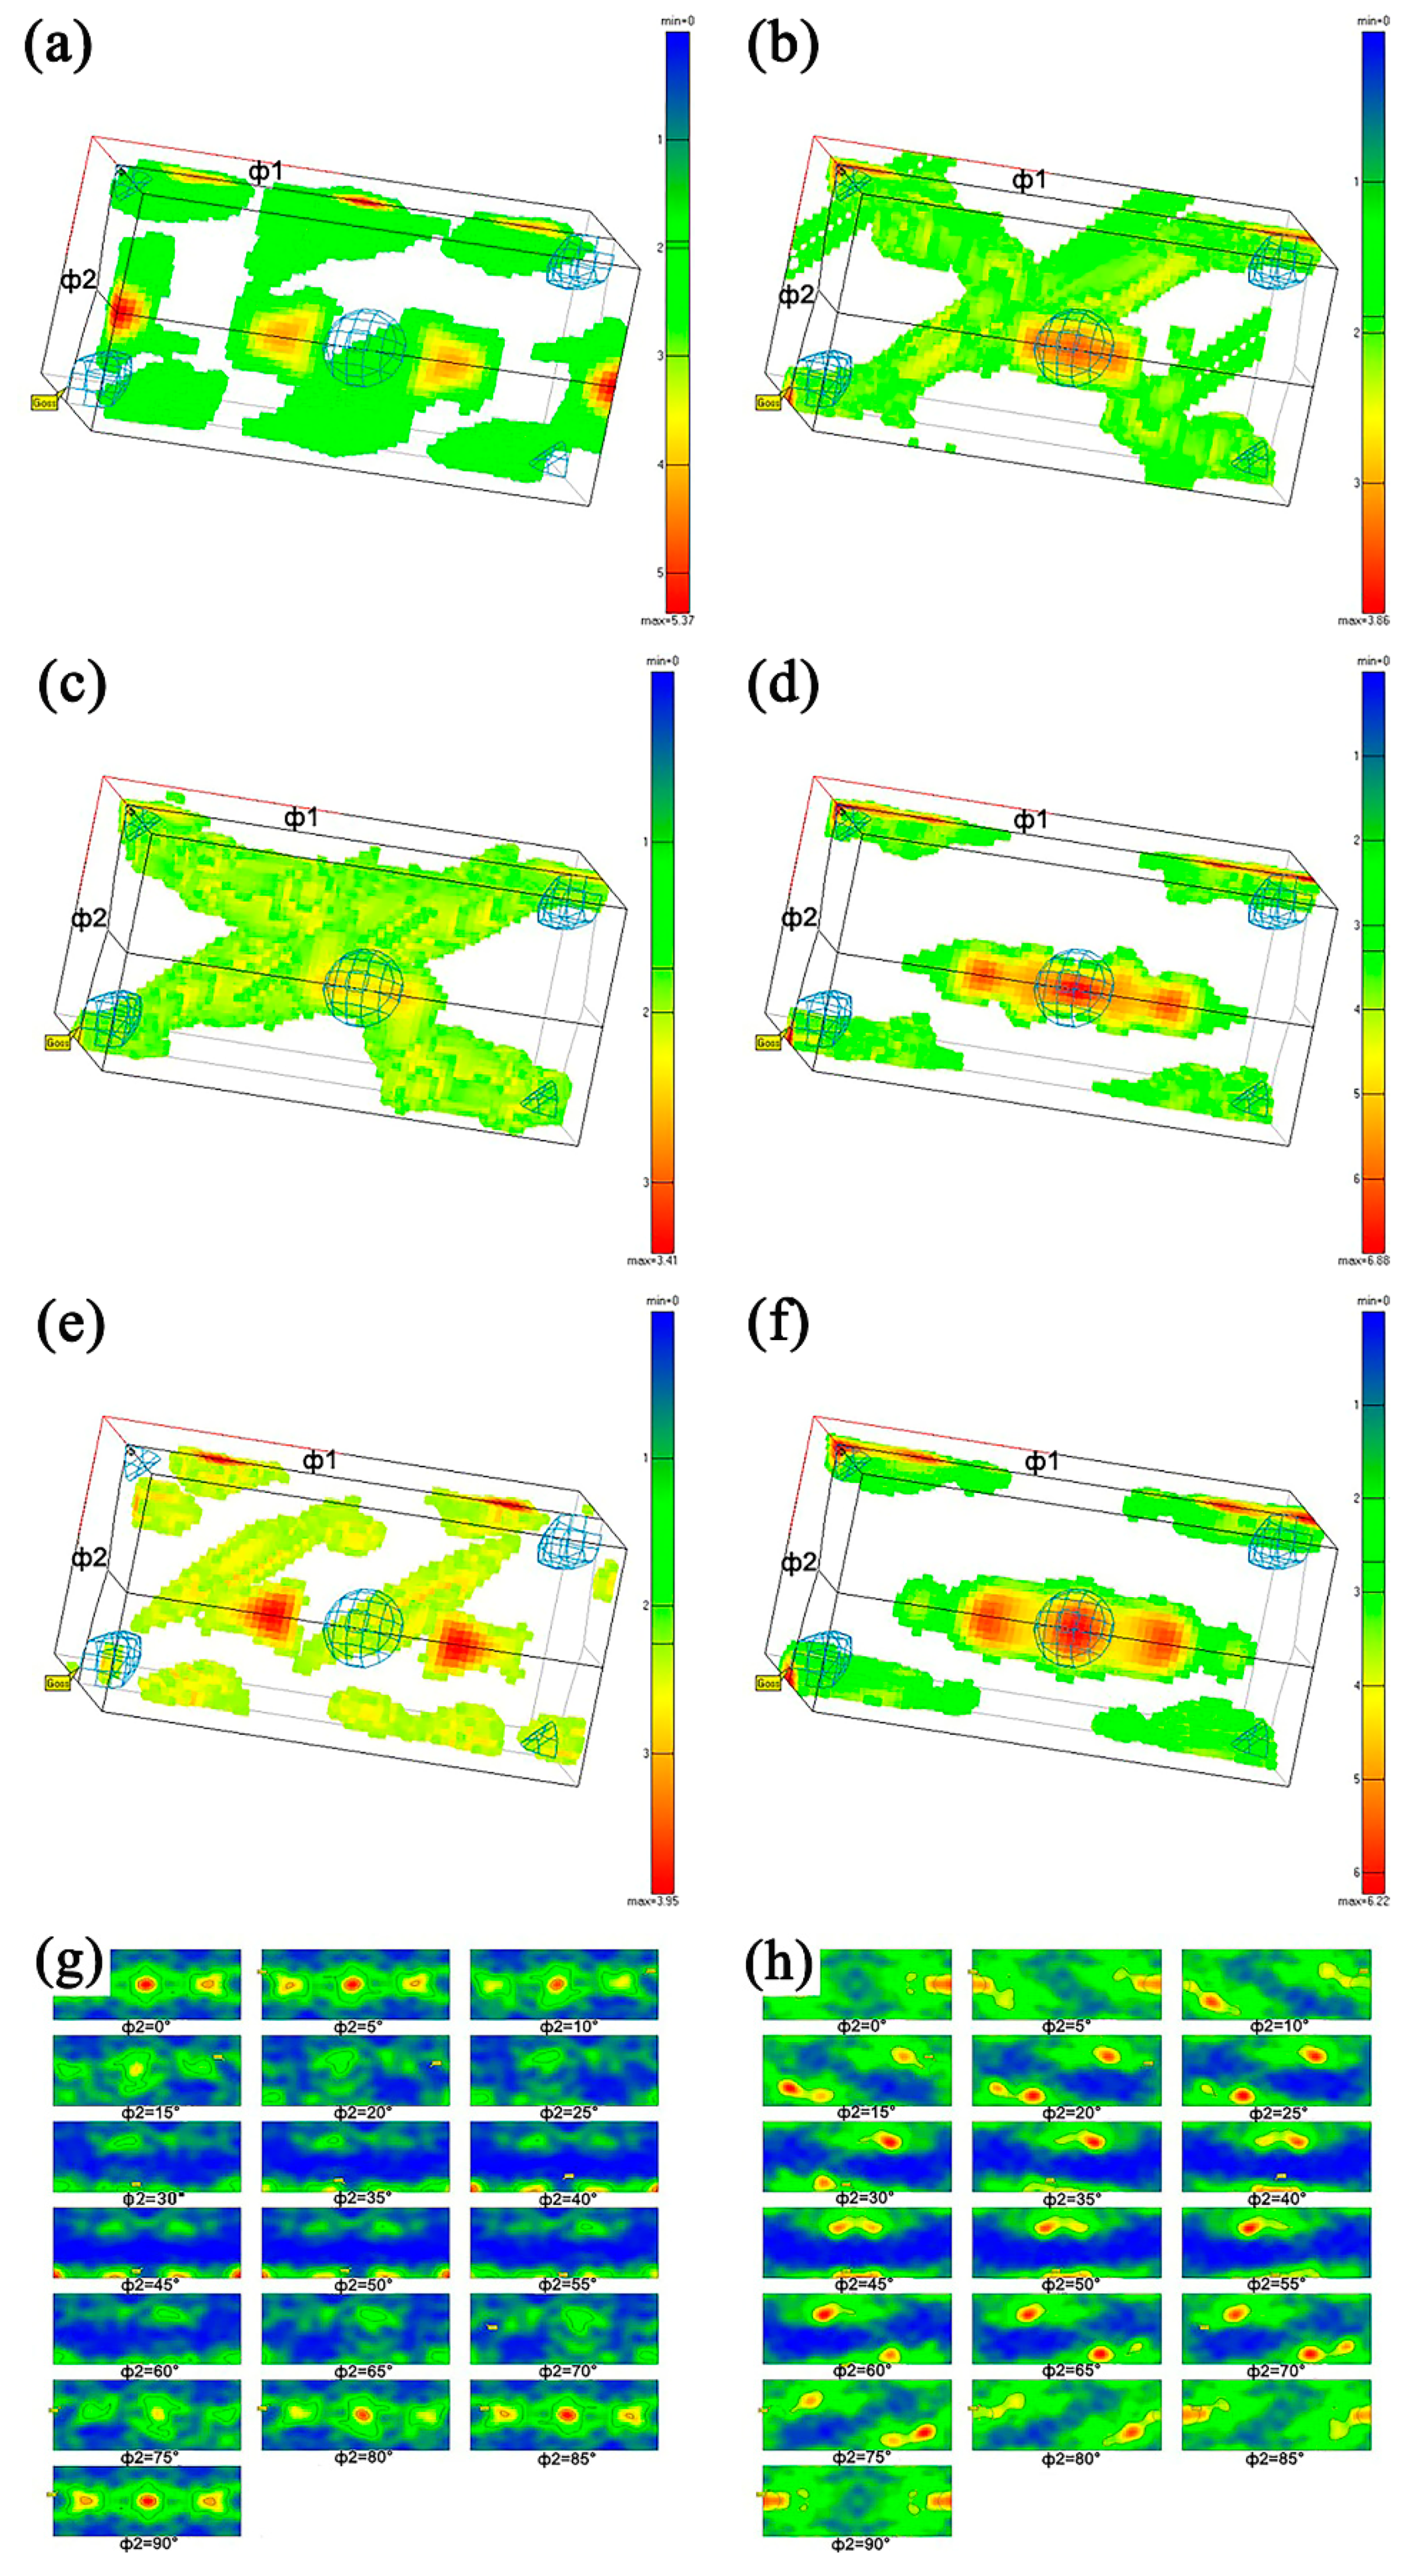
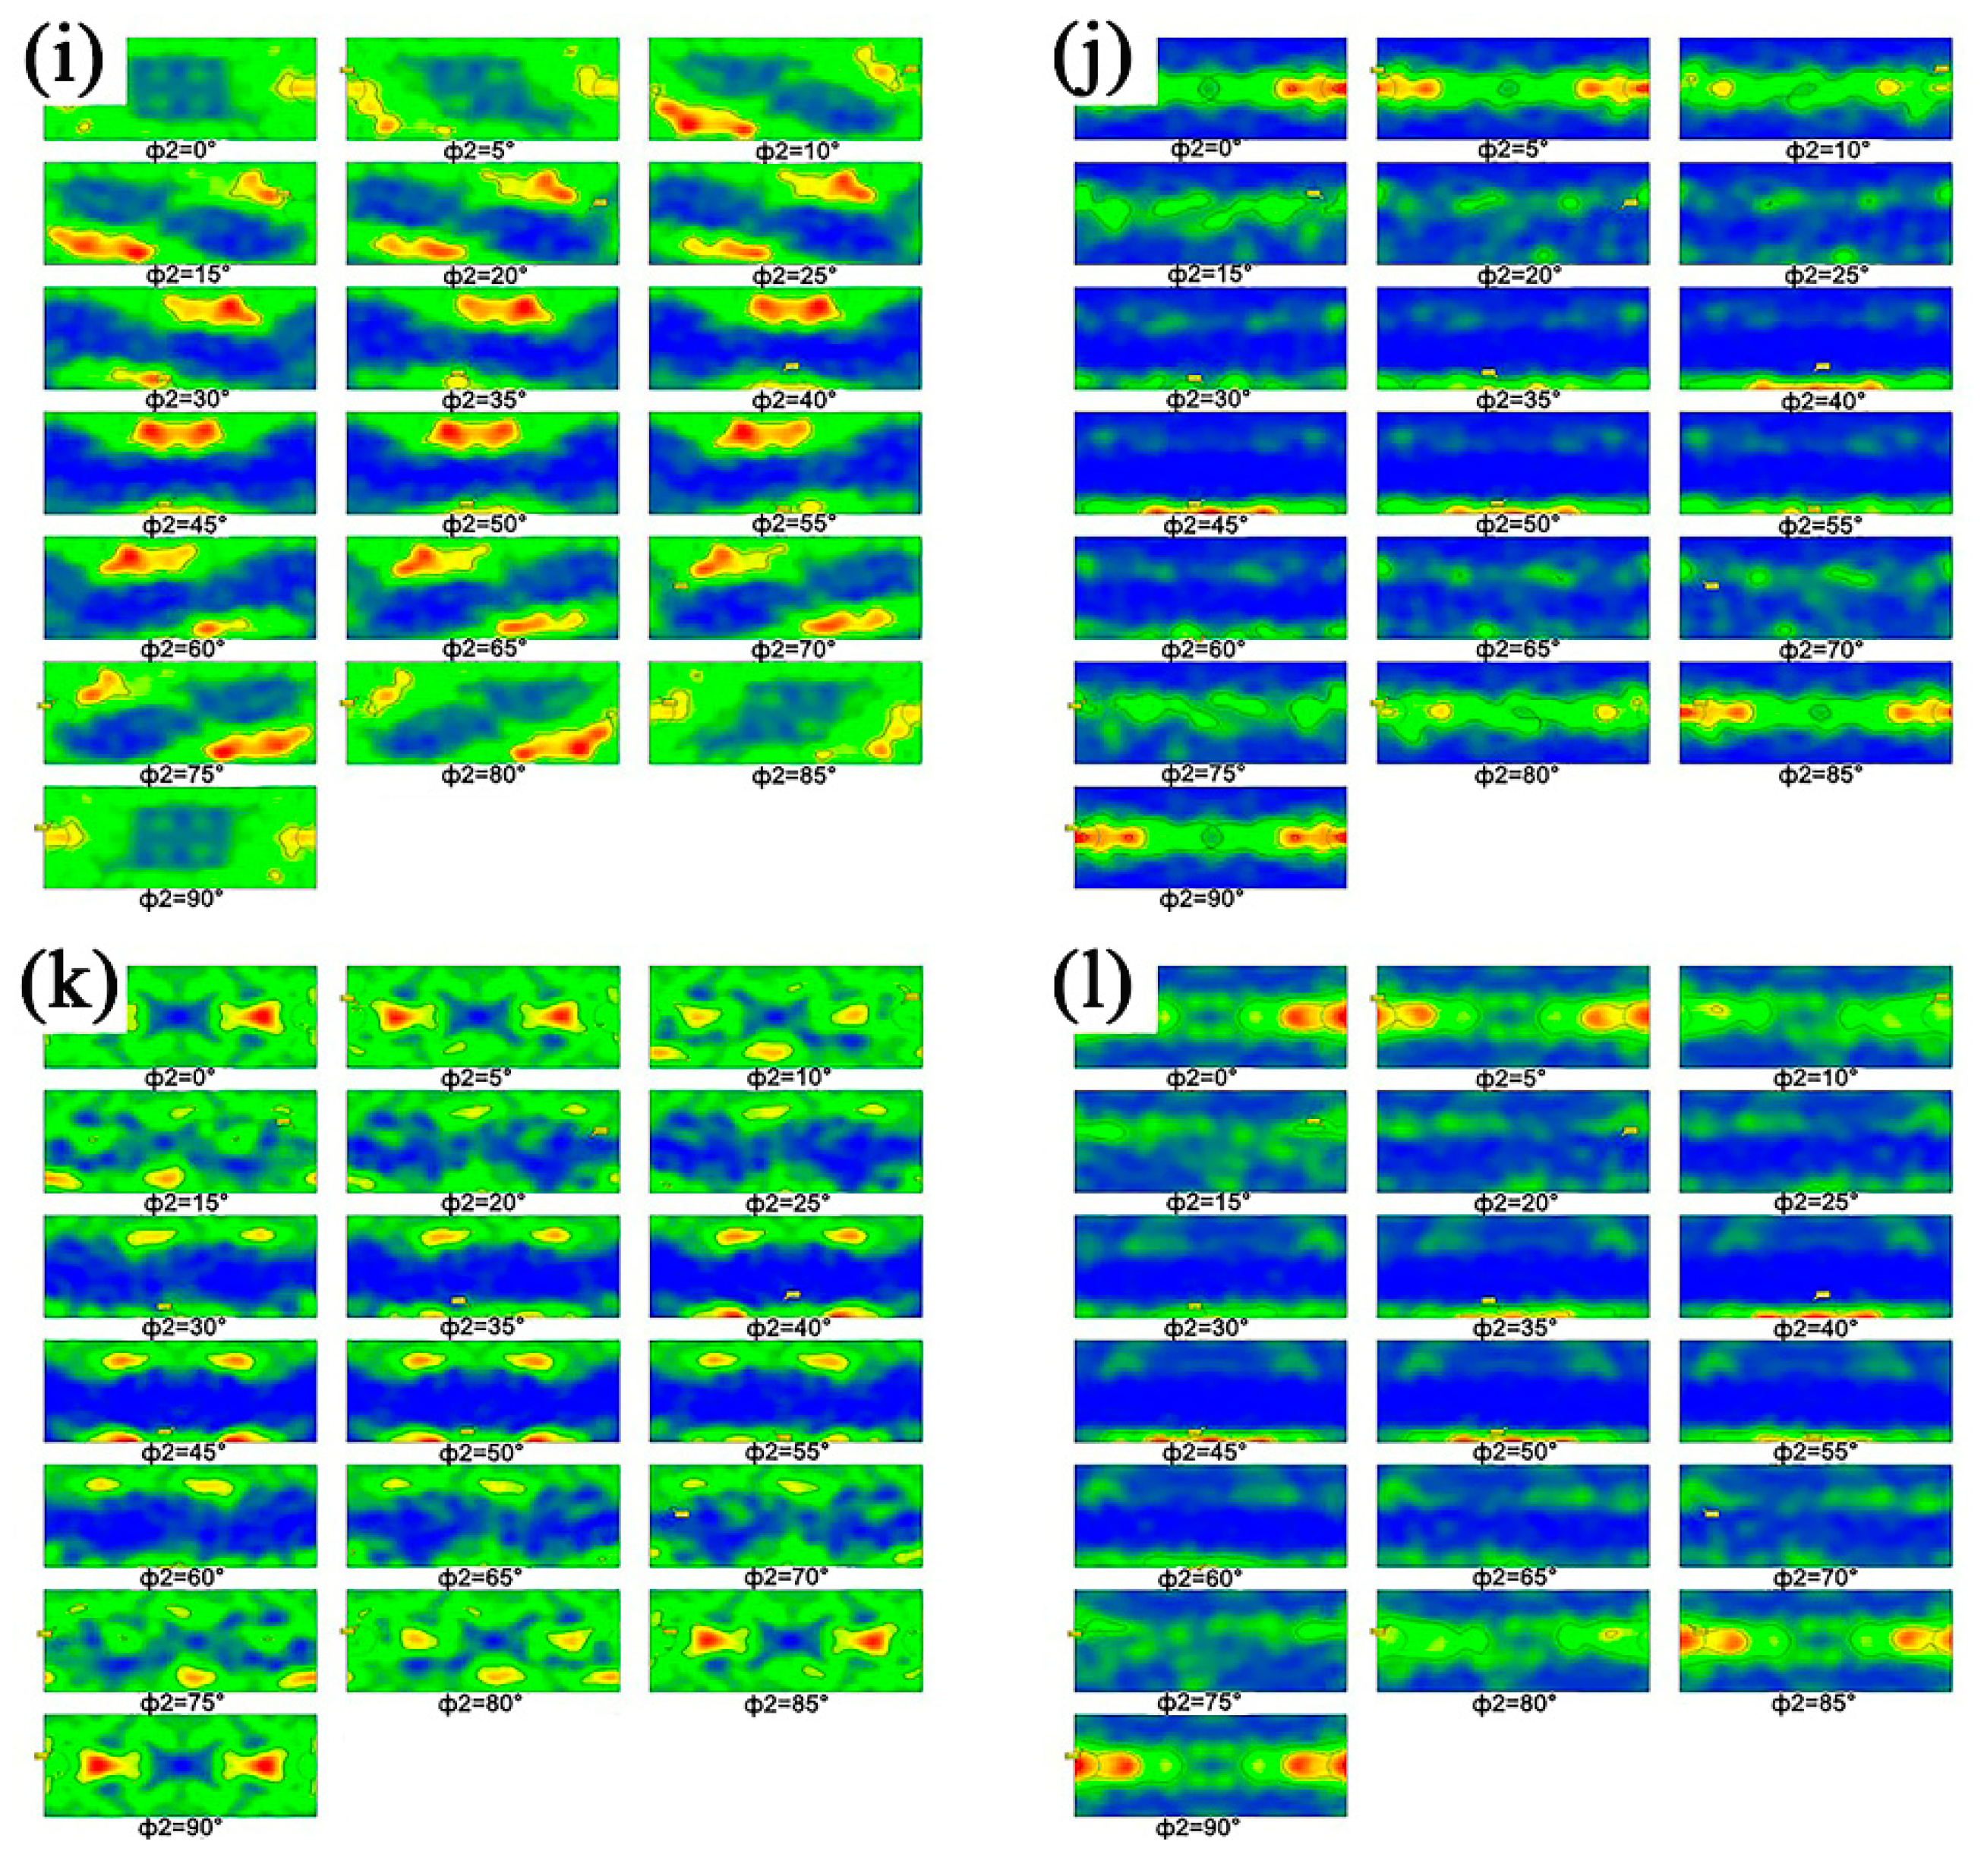
To further confirm the effect of drawing pass on surface layer softening during ECD, the texture orientations of surface deformation layer along axial direction of ECD bars were also analyzed by EBSD, as well as that of DIA bar, as shown by Figure 5. After being drawn for three passes, the texture orientation of the ECD bar is quite decentralized and its Ø2 distributes within 0°~40° and 55°~90° (Figure 7a,g); while that of DIA bar is quite stronger and its Ø2 gathers within 0°~30° and 60°~90° (Figure 7b,h). When the drawing is carried out for five passes, the orientation of ECD bar is slightly enhanced and its Ø2 focus in 0°~30° and 60°~90° (Figure 7c,i). However, the orientation of the DIA bar becomes more obvious and its Ø2 gathers in 0°~15° and 75°~90° (Figure 7d,j). As the drawing is performed for seven passes, the texture orientation of ECD bar is further enhanced and its Ø2 concentrates in 0°~25° and 65°~90° (Figure 7e,k). In the meantime, the texture orientation of DIA bar becomes much more obvious and its Ø2 gathers in more narrow-angle ranges of 0°~10° and 80°~90° (Figure 7f,l). The above results show that the ranges of Ø2 angle of surface layer of the ECD and DIA bars all decrease with the increase in drawing pass. The Ø2 ranges of ECD bars are always wider than those of DIA partners and the difference between them decreases gradually. That is to say, the texture orientation of the ECD bar is always weaker than that of the DIA bar at the same drawing pass, and the difference between them decreases with increasing drawing pass. This result is consistent with that achieved from the above grain orientation observation. The results further demonstrate that ECD can soften the surface layer as compared with DIA and this softening is weakened as the drawing pass increases.
The above EBSD results indicate that the deformation degrees of surface layers of ECD bars are always smaller than those of DIA partners. However, similar to that of DIA bar, the deformation degree is also enhanced as the drawing pass increases. This is consistent with the result from the microstructure observation in Figure 4. According to the mechanism of CME proposed by Gutman, the additional dislocation flux that moves towards surface can generate in the surface layer, and finally overflows from the surface during ECD [32,33]. This results in the decrease in dislocation density (Figure 2), and thus, the degree of work hardening and deformation resistance (Figure 2a). It is due to the decrease in dislocation density that the resulting microstructure texture is weakened, and the texture orientation is not as concentrated as that of the DIA bar. The dislocations generated during each-pass ECD are only partially overflowed from surface, as discussed above. Therefore, the general dislocations are gradually accumulated as the drawing pass increases (Figure 3a). The microstructure texture thereby becomes obvious (Figure 7a–g) and the deformation layer is thickened (Figure 5). Thus, the resulting work hardening degree, similar to that of DIA, is also enhanced, resulting in the increase in drawing stress (Figure 2a). Therefore, it can be concluded that the partial overflowing of dislocations is the reason that the textures of ECD bars are weaker than those of DIA ones, and also the reason that the differences in dislocation density, deformation layer thickness and drawing stress between these two-method processed bars are decreased with increasing drawing pass. More importantly, the present results indirectly demonstrate that an additional dislocation flux is actually generated during ECD.
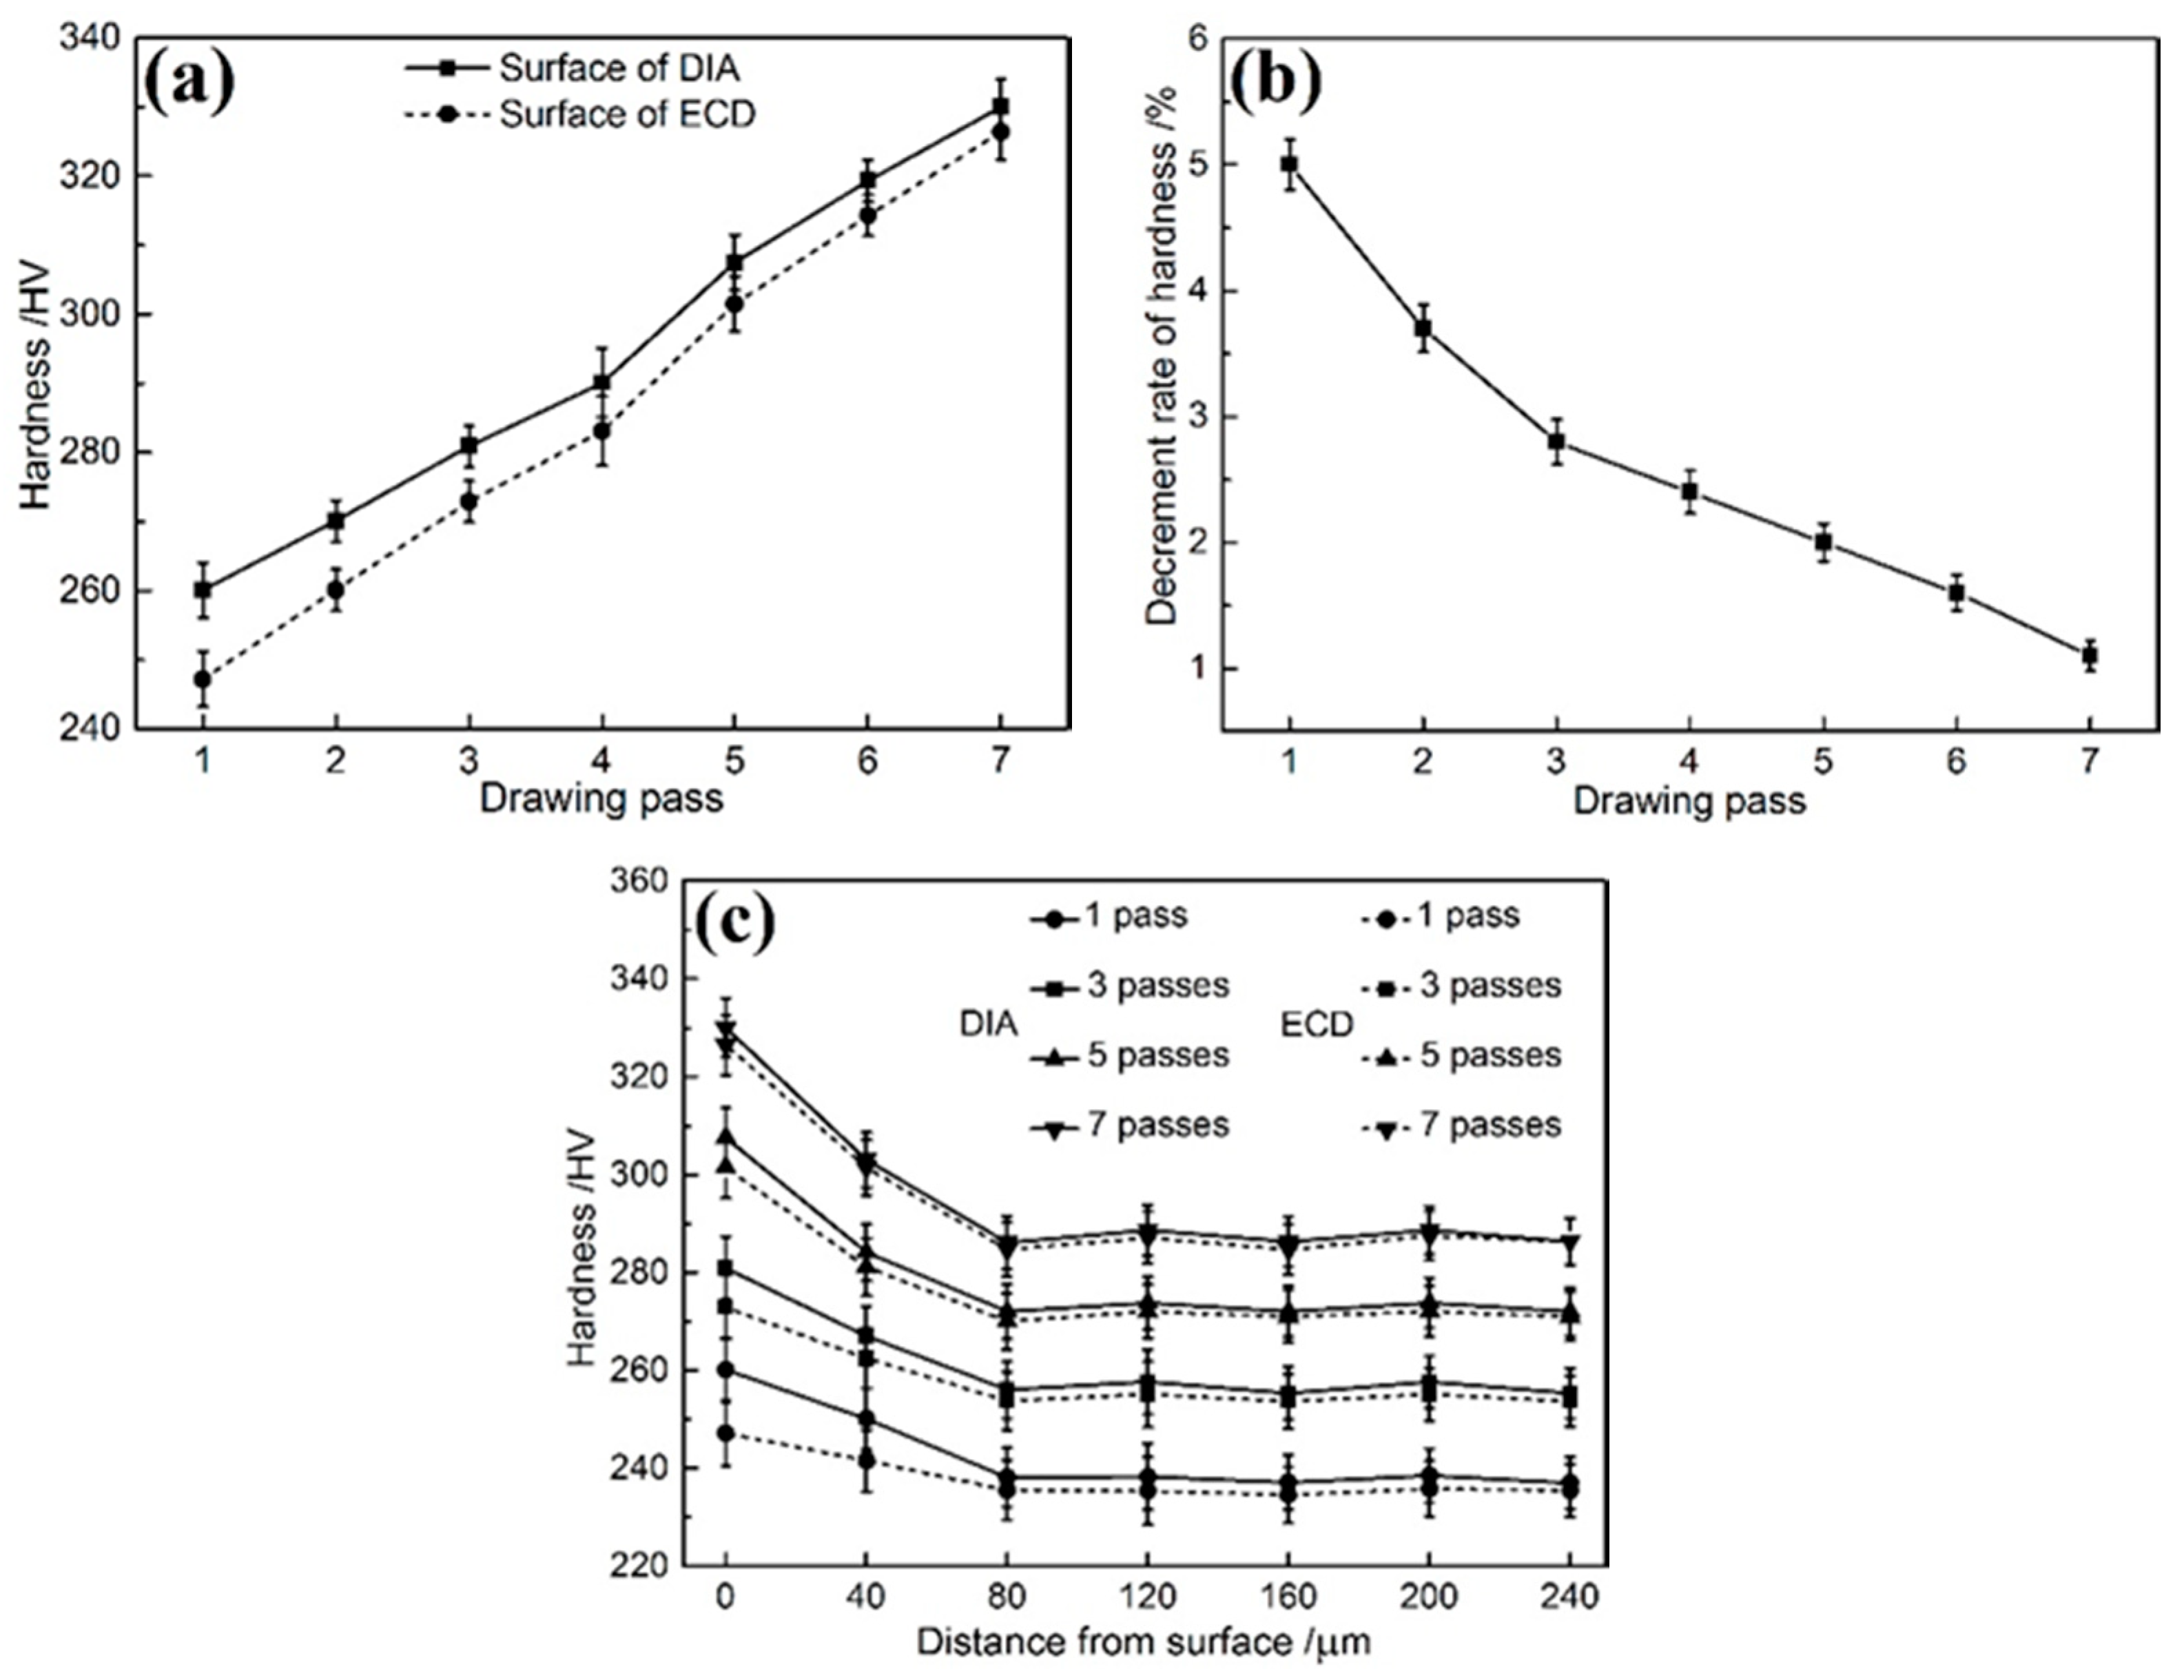
In addition, surface hardness can more accurately reflect the softening degree. As shown by Figure 8a, the surface hardness of the two-method processed bars all gradually increases with the increase in drawing pass. This means that the work hardening degrees of surface layers for the two-method processed bars all increase continuously. Compared with that of the DIA bar, the surface hardness of the ECD bar is always smaller, but the deduction rate decreases as the drawing pass increases (Figure 8b). This also indicates that ECD can actually soften the surface layer, but the softening degree decreases with increasing drawing pass. The hardness of both the ECD and DIA bar surface layers all decreases with the increase in distance from surface (Figure 8c). The closer the site is to the surface, the greater the difference in hardness between ECD and DIA bars is, and vice visa (Figure 8c). In addition, the hardness difference between the two-method drawn bars becomes smaller and smaller with the increase in drawing pass. More importantly, Figure 8c shows that the thickness of the surface softening layer during ECD is only 80 μm. These hardly confirm that ECD can only soften a thin surface layer, and the softening degree decreases gradually with increasing drawing pass. As discussed above, the reasons that lead to these results are that the influence of CME is only limited within a thin surface layer and the dislocation density in this layer also increases with drawing pass.
Compared with hardness, elongation can directly reflect the plasticity. As shown in Figure 9a, with the increase in drawing pass, because the work hardening becomes more and more obvious, the elongations of the two-method drawn bars all decrease gradually. In general, the elongations of ECD bars are always higher than those of DIA bars under the same drawing pass. But the difference between them becomes smaller and smaller with increasing drawing pass (Figure 9b). Compared with DIA, the maximum increment rate in elongation of ECD bar is 15.40%, and the lowest increment is still 5.90%. As shown in Figure 9c, with the increase of drawing pass, the ultimate tensile strength of the two-method processed bars all increases rapidly, and the strengths of ECD bars are always lower than those of DIA bars under the same drawing pass. Similar to the elongation, the difference in ultimate tensile strength between the two-method processed bars also decreases gradually with the increase of drawing pass (Figure 9d). Compared with that of DIA bar, the maximum reducing rate in ultimate tensile strength of ECD bar reaches 1.81%, and the lowest rate is only 0.58%. That is, CEM can actually improve the ductility of steel bar, and this improvement should contribute to the softening or plasticizing of surface layer. However, the softening degree decreases with the increase in drawing pass due to the increased work hardening. These results indicate that ECD can obtain a product with quite higher strength and better plasticity compared with DIA. That is to say, ECD bars can be used as important components in the manufacturing industry that require excellent comprehensive mechanical properties.
Figure 9a shows that ECD can improve the elongation of bulk bar compared with DIA, but the improvement is very limited. The reason for this is that only a thin surface layer about 80 μm is softened. The status of the inner region in large proportion of the bar is same to that of DIA bar, i.e., the large-proportion region is not influenced by CME. The improvement in the resulting elongation is therefore limited. But at least, this result implies that ECD can soften or plasticize the bar surface layer and the slight improvement in elongation should be attributed to the surface layer softening. It is due to this softening that that the strengths of the ECD bars are slightly lower than those of the DIA partners (Figure 9c). With the increase in drawing pass, the decrease in elongation and increase in strength of the two-method processed bars should be contributed to the accumulated work-hardening. The limited softened surface layer with 80 μm thickness, and the decreased softening degree, are the reasons that both the elongation and strength differences between the two-method drawn bars decrease with increased drawing pass. In addition, it is expected that because the softening is limited within a thin surface layer, the effects of this softening on the elongation and strength should be decreased as the bar diameter increases.
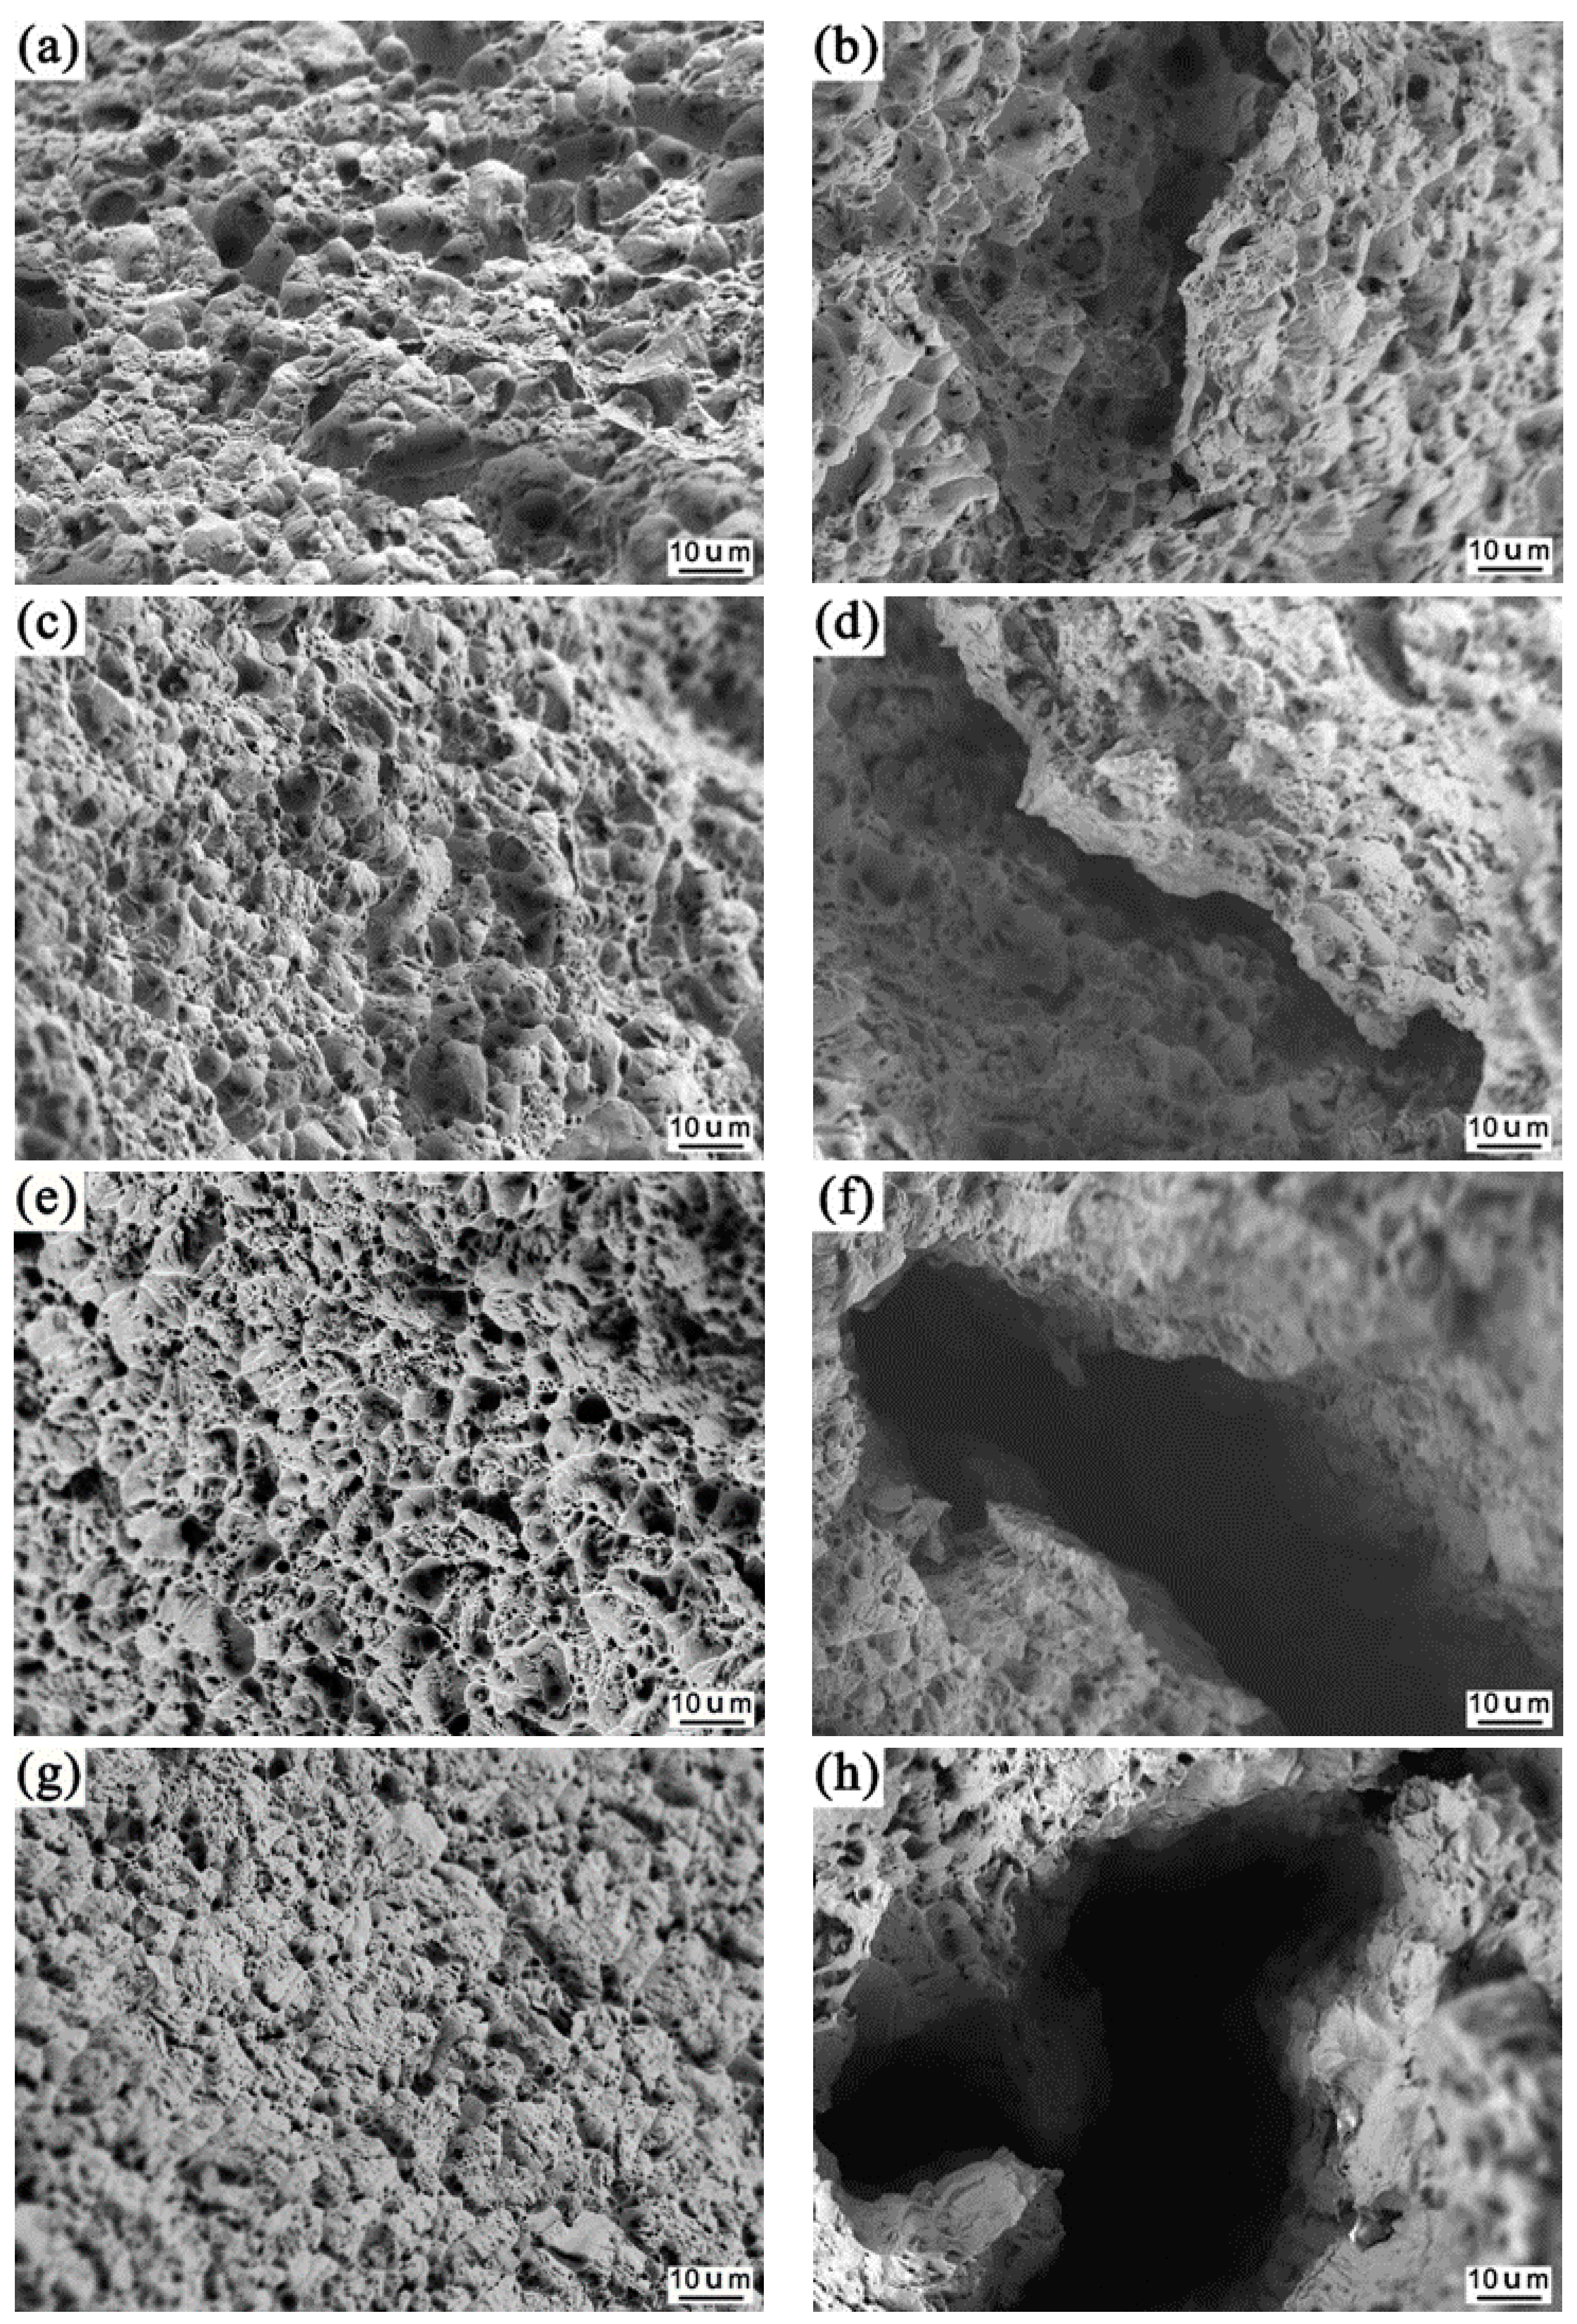
Figure 10 shows the morphologies of the tensile fracture surface edges of the ECD and DIA bars processed for different drawing passes. Because the fracture surface morphology of a ductile-fractured metal is always characterized mainly by dimples, and the ductility is closely related to the size and number of dimples, the larger both the number and size are, the greater the ductility is; in addition, if there are cracks on the fracture surface, the larger both the number and size of cracks are, the worse the plasticity is [41]. In view of this, the fracture surfaces of all the ECD bar surface layers are characterized by dimples (Figure 10a,c,e,g). Therefore, the fractures of all the ECD bars belong to ductile fracture. Although some local morphologies of the DIA bars are featured by large-sized cracks, there are still lots of dimples in other regions, so the fractures of all the DIA bars are also ductile fractures (Figure 10b,d,f,h).
Through careful observation, it can be found that the number and size of dimples decrease with increasing drawing pass for the two-method drawn bars and the decrements of these two parameters of DIA bar are more obvious than those of the ECD one. This means that the plasticity of ECD and DIA bar surface layers all decreases gradually, and the decrement of the ECD bar is smaller that of the DIA bar. It is also found that the number and size of dimples in the DIA bar are always smaller than those of the ECD bar under the same drawing pass. As discussed above, there is a softening surface layer with a thickness of 80 μm during ECD, i.e., because of CME, the ductility of the surface layer during ECD is better than that during DIA. Therefore, the number and size of resulting simples in this layer on the fracture surface of ECD bar are larger than those of DIA bar. However, the degree of this softening is gradually weakened as the drawing pass increases. Both the number and size of dimples are thereby decreased with increasing drawing pass. In addition, no cracks were found in the edges on tensile fracture surfaces of ECD bars drawn for any passes (Figure 10a,c,e,g). However, some cracks can be found in the fracture surfaces of all DIA bars, and their sizes increase obviously with the increase in drawing pass (Figure 10b,d,f,h). These also imply that the plasticity of the surface layer is always better than that of DIA bars at the same drawing pass due to the plasticizing or softening, but the plasticizing or softening degree decreases with increasing drawing pass due to the accumulated work hardening. These results also indirectly confirm that the difference in surface plasticity between the ECD and DIA bars should be attributed to the decrease in work hardening originated from additional dislocation flux during ECD.
4. Conclusions
1. The drawing stress of ECD is always lower than that of DIA at the same drawing pass, and the maximum reduction rate is up to 13.3%. The dislocation density of ECD bar is always smaller than that of the DIA bar, and the maximum reduction rate can reach 11.7%. With the increase in drawing pass, the stress gradually increases due to the enhanced work hardening from the increase in dislocation density;
2. The deformation degree and thickness of surface deformation layer of ECD bar are always smaller than those of the DIA bar at the same drawing pass. The texture orientation of ECD bar surface layer is always weaker than that of DIA bar. That is, the work hardening of surface layer is lower than that of the DIA bar. Compared with that of DIA bar, the surface hardness of ECD bar can be decreased by 5%. The thickness of surface layer softened during ECD is about 80 μm;
3. Compared with DIA, ECD can improve the elongation of Q235 steel bar, but slightly decrease the ultimate tensile strength. That is to say, ECD can obtain a product with better comprehensive mechanical properties than DIA. This also indirectly demonstrates that ECD can soften or plasticize surface layer. This softening or plasticizing should be contributed to the generated additional dislocation flux because all of the present results can be well interpreted by this theory.
Author Contributions
J.G. and T.C. designed the experimental program; J.G. and B.L. performed the experiments and analyzed the experiment results under the guidance of T.C.; J.G. wrote the paper and T.C. reviewed the paper. All authors have read and agreed to the published version of the manuscript.
Funding
The authors wish to express thanks for the financial support from the National Natural Science Foundation of China (Grant No. 51971105) and the International Scientific and Technological Cooperation Project of Gansu Province, China (Grant No. 1504WKCA021).
Conflicts of Interest
The authors declare no conflict of interest.
References
- Magalhães, F.; Pertence, A.; Campos, H.; Aguilar, M.; Cetlin, P. Defects in axisymmetrically drawn bars caused by longitudinal superficial imperfections in the initial material. J. Mater. Process. Technol. 2012, 212, 237–248. [Google Scholar] [CrossRef] [Green Version]
- Borges, M.D.O.; Martinez, G.A.S.; Baldissera, M.R.; Rodrigues, G.; Ribeiro, R.B.; Silva, G. Drawing Tantalum Encapsulated in the Cooper Pipe. Mater. Sci. Forum 2014, 805, 356–361. [Google Scholar] [CrossRef]
- Bayoumi, L.S. Cold drawing of regular polygonal tubular sections from round tubes. Int. J. Mech. Sci. 2001, 43, 2541–2553. [Google Scholar] [CrossRef]
- Seet, H.L.; Li, X.P.; Lee, K.S.; Liu, L.Q. Cold drawing of micro Ni 80 Fe 20/Cu composite wires. J. Mater. Process. Technol. 2007, 192, 350–354. [Google Scholar] [CrossRef]
- Kotkunde, N.; Deole, A.D.; Gupta, A.K.; Singh, S.K.; Aditya, B. Failure and formability studies in warm deep drawing of Ti–6Al–4V alloy. Mater. Des. 2014, 60, 540–547. [Google Scholar] [CrossRef]
- Prasad, K.; Panda, S.K.; Kar, S.; Murty, S.; Sharma, S. Prediction of fracture and deep drawing behavior of solution treated Inconel-718 sheets: Numerical modeling and experimental validation. Mater. Sci. Eng. A 2018, 733, 393–407. [Google Scholar] [CrossRef]
- He, S.; Van Bael, A.; Li, S.; Van Houtte, P.; Mei, F.; Sarban, A. Residual stress determination in cold drawn steel wire by FEM simulation and X-ray diffraction. Mater. Sci. Eng. A 2003, 346, 101–107. [Google Scholar] [CrossRef]
- Sun, L.; Bai, J.; Xue, F.; Tao, L.; Chu, C.; Meng, J. Exceptional texture evolution induced by multi-pass cold drawing of magnesium alloy. Mater. Des. 2017, 135, 267–274. [Google Scholar] [CrossRef]
- Froes, F.H.; Eliezer, D.; Aghion, E. The science, technology, and applications of magnesium. JOM 1998, 50, 30–34. [Google Scholar] [CrossRef]
- Agnew, S.R. Wrought magnesium: A 21st century outlook. JOM 2004, 56, 20–21. [Google Scholar] [CrossRef]
- Hao, Y.; Chen, T.; Ma, Y.; Li, Y.; Yan, F.; Huang, X. Some Key Issues and Accesses to the Application of Magnesium Alloys. Int. J. Mod. Phys. B 2010, 24, 2237–2242. [Google Scholar] [CrossRef]
- Cui, Z.; Liu, B. Metallology and Heat Treatment Principle, 3rd ed.; Press of Harbin Institute of Technology: Harbin, China, 2007; pp. 230–239. [Google Scholar]
- Jager, A.; Lukáč, P.; Gärtnerová, V.; Bohlen, J.; Kainer, K. Tensile properties of hot rolled AZ31 Mg alloy sheets at elevated temperatures. J. Alloy. Compd. 2004, 378, 184–187. [Google Scholar] [CrossRef]
- Robson, J. Critical Assessment 9: Wrought magnesium alloys. Mater. Sci. Technol. 2014, 31, 257–264. [Google Scholar] [CrossRef] [Green Version]
- Wang, S.-Y.; Gao, L.; Luo, A.A.; Li, D.; Zeng, X. Hot deformation behavior and workability of pre-extruded ZK60A magnesium alloy. Trans. Nonferrous Met. Soc. China 2015, 25, 1822–1830. [Google Scholar] [CrossRef]
- Ramezani, M.; Neitzert, T. Investigation of Hot Formability of AZ61 Mg Alloy. Mod. Mech. Eng. 2015, 5, 21–27. [Google Scholar] [CrossRef] [Green Version]
- Sprecher, A.F.; Mannan, S.L. Overview no. 49: On the mechanisms for the electroplastic effect in metals. Acta Metall. 1986, 34, 1145–1162. [Google Scholar] [CrossRef]
- Cao, W.-D.; Sprecher, A.; Conrad, H. Effect of strain rate on the electroplastic effect in Nb. Scr. Met. 1989, 23, 151–155. [Google Scholar] [CrossRef]
- Troitskii, O. Pressure shaping by the application of a high energy. Mater. Sci. Eng. 1985, 75, 37–50. [Google Scholar] [CrossRef]
- Yang, D.; Conrad, H. Effect of an electric field on the plastic deformation and fracture of polycrystalline NaCl. Mater. Sci. Eng. A 1997, 225, 173–183. [Google Scholar] [CrossRef]
- Stashenko, V.I.; Troitskii, O.A.; Novikova, N.N. Electroplastic drawing medium-carbon steel. J. Mach. Manuf. Reliab. 2009, 38, 369–372. [Google Scholar] [CrossRef]
- Silveira, V.; Fortes, R.; Mannheimer, W. A comment on “effect of electric current pulses on the recrystallization of copper”. Scr. Met. 1983, 17, 1381–1382. [Google Scholar] [CrossRef]
- Tang, G.; Zheng, M.; Zhu, Y.; Zhang, J.; Fang, W.; Li, Q. The application of the electro-plastic technique in the cold-drawing of steel wires. J. Mater. Process. Technol. 1998, 84, 268–270. [Google Scholar] [CrossRef]
- Tang, G.-Y.; Zhang, J.; Yan, Y.; Zhou, H.; Fang, W. The engineering application of the electroplastic effect in the cold-drawing of stainless steel wire. J. Mater. Process. Technol. 2003, 137, 96–99. [Google Scholar] [CrossRef]
- Fais, A. A faster FAST: Electro-Sinter-Forging. Met. Powder Rep. 2018, 73, 80–86. [Google Scholar] [CrossRef]
- Gobber, F.S.; Bidulskà, J.; Fais, A.; Franchini, F.; Bidulskỳ, R.; Kvakaj, T.; Actis Grande, M. Characterization of microstructural and mechanical properties after cold rolling of an electro-sinter-forged Cu-Sn alloy. Arch. Metall. Mater. 2020, 65, 787–792. [Google Scholar]
- Murakawa, M.; Jin, M. The utility of radially and ultrasonically vibrated dies in the wire drawing process. J. Mater. Process. Technol. 2001, 113, 81–86. [Google Scholar] [CrossRef]
- Liu, S.; Shan, X.; Guo, K.; Yang, Y.; Xie, T. Experimental study on titanium wire drawing with ultrasonic vibration. Ultrasonics 2018, 83, 60–67. [Google Scholar] [CrossRef]
- Siegert, K.; Mock, A. Wire drawing with ultrasonically oscillating dies. J. Mater. Process. Technol. 1996, 60, 657–660. [Google Scholar] [CrossRef]
- Hayashi, M.; Jin, M.; Thipprakmas, S.; Murakawa, M.; Hung, J.-C.; Tsai, Y.-C.; Hung, C.-H. Simulation of ultrasonic-vibration drawing using the finite element method (FEM). J. Mater. Process. Technol. 2003, 140, 30–35. [Google Scholar] [CrossRef]
- Petruzelka, J.; Sarmanova, J.; Sarman, A. The effect of ultrasound on tube drawing. J. Mater. Process. Technol. 1996, 60, 661–668. [Google Scholar] [CrossRef]
- Gutman, E.M. Mechanochemistry of Solid Surface; World Scientific Publishing: Hackensack, NJ, USA, 1994; pp. 195–208. [Google Scholar]
- Gutman, E.; Unigovski, Y.; Schneck, R.; Ye, F.; Liang, Y. Electrochemically enhanced surface plasticity of steels. Appl. Surf. Sci. 2016, 388, 49–56. [Google Scholar] [CrossRef]
- Gutman, E. Surface plasticity modification using electrolytic etching. Surf. Coat. Technol. 1994, 67, 133–136. [Google Scholar] [CrossRef]
- Li, L.; Chen, T.; Zhang, S.; Gutman, E.M.; Unigovski, Y.; Yan, F. Electrochemical cold drawing of Mg alloy bars. Mater. Sci. Technol. 2016, 33, 244–254. [Google Scholar] [CrossRef]
- Li, L.; Chen, T.; Zhang, S.; Yan, F. Electrochemical cold drawing of in situ Mg 2 Si p /AM60B composite: A comparison with the AM60B alloy. J. Mater. Process. Technol. 2017, 240, 33–41. [Google Scholar] [CrossRef]
- Williamson, G.; Hall, W. X-ray line broadening from filed aluminium and wolfram. Acta Met. 1953, 1, 22–31. [Google Scholar] [CrossRef]
- Smallman, R.E.; Westmacott, K.H. Stacking faults in face-centered cubic metals and alloys. Philos. Mag. 1957, 2, 669–683. [Google Scholar] [CrossRef]
- Rabinowicz, E.; Tanner, R.I. Friction and Wear of Materials. J. Appl. Mech. 1966, 33, 479. [Google Scholar] [CrossRef]
- Xu, X. New Technology for New Products of Special Steel Wire, 1st ed.; Metallurgical Industry Press: Beijing, China, 2008; pp. 424–433. [Google Scholar]
- Song, H.; Wang, Z.-J.; Gao, T. Effect of high density electropulsing treatment on formability of TC4 titanium alloy sheet. Trans. Nonferrous Met. Soc. China 2007, 17, 87–92. [Google Scholar] [CrossRef]
Figure 1.
Schematic diagram of electrochemical cold drawing: (1) drawing roller; (2) sensor; (3) collet; (4) conductive wheels (anode); (5) electrolytic cell; (6) electrolyte solution; (7) rubber seal; (8) steel bar; (9) stainless steel sheet (cathode); (10) drawing die; (11) insulating mat; (12) DC power supply; (13) computer.

Figure 2.
Variations of (a) drawing stress of electrochemical cold drawing (ECD) and cold drawing in air (DIA), (b) decrement rate of drawing stress of ECD compared with DIA, and (c) deformation rate with drawing pass.
Figure 2.
Variations of (a) drawing stress of electrochemical cold drawing (ECD) and cold drawing in air (DIA), (b) decrement rate of drawing stress of ECD compared with DIA, and (c) deformation rate with drawing pass.

Figure 3.
Variations (a) dislocation density of ECD and DIA bars and (b) decrement rate of dislocation density of ECD bar compared with DIA bar with drawing pass.
Figure 3.
Variations (a) dislocation density of ECD and DIA bars and (b) decrement rate of dislocation density of ECD bar compared with DIA bar with drawing pass.

Figure 4.
OM images along longitudinal direction of (a) raw bar and drawn bars using (b), (d), (f), (h) ECD and (c), (e), (g), and (i) DIA for (b), (c) 1; (d), (e) 3; (f), (g) 5; and (h), (i) 7 passes.
Figure 4.
OM images along longitudinal direction of (a) raw bar and drawn bars using (b), (d), (f), (h) ECD and (c), (e), (g), and (i) DIA for (b), (c) 1; (d), (e) 3; (f), (g) 5; and (h), (i) 7 passes.

Figure 5.
Surface deformation layer thickness of ECD and DIA bars processed for different drawing passes.
Figure 5.
Surface deformation layer thickness of ECD and DIA bars processed for different drawing passes.

Figure 6.
Electron back-scattered diffraction (EBSD) grain orientation images of surface deformation layer along axial direction of the drawn bars using (a), (c), (e) ECD and (b), (d) and (f) DIA for (a), (b) 3; (c), (d) 5; and (e), (f) 7 passes.
Figure 6.
Electron back-scattered diffraction (EBSD) grain orientation images of surface deformation layer along axial direction of the drawn bars using (a), (c), (e) ECD and (b), (d) and (f) DIA for (a), (b) 3; (c), (d) 5; and (e), (f) 7 passes.

Figure 7.
Three-dimensional spatial orientation distributions of grains in the surface deformation layers of bars drawn using (a), (g); (c), (i); and (e), (k) ECD, and (b), (h); (d), (j); and (f), (l) DIA for (a), (g), (b), (h) 3; (c), (i), (d), (j) 5; and (e), (k), (f), (l) 7 passes.
Figure 7.
Three-dimensional spatial orientation distributions of grains in the surface deformation layers of bars drawn using (a), (g); (c), (i); and (e), (k) ECD, and (b), (h); (d), (j); and (f), (l) DIA for (a), (g), (b), (h) 3; (c), (i), (d), (j) 5; and (e), (k), (f), (l) 7 passes.


Figure 8.
Variations in (a) surface hardness of the ECD and DIA bars, (b) decrement rate of the surface hardness of the ECD bar compared with DIA bar with drawing pass, and (c) cross section hardness of the ECD and DIA bars processed for different passes with the distance away from surface.
Figure 8.
Variations in (a) surface hardness of the ECD and DIA bars, (b) decrement rate of the surface hardness of the ECD bar compared with DIA bar with drawing pass, and (c) cross section hardness of the ECD and DIA bars processed for different passes with the distance away from surface.

Figure 9.
Variations in (a) elongations of ECD and DIA bars, (b) increment rate of elongation of ECD bar compared with DIA bar, (c) ultimate tensile strengths of ECD and DIA bars, and (d) decrement rate of ultimate tensile strength of ECD bar compared with DIA bar with drawing pass.
Figure 9.
Variations in (a) elongations of ECD and DIA bars, (b) increment rate of elongation of ECD bar compared with DIA bar, (c) ultimate tensile strengths of ECD and DIA bars, and (d) decrement rate of ultimate tensile strength of ECD bar compared with DIA bar with drawing pass.

Figure 10.
SEM morphologies of tensile fracture surface edges of the bars drawn by (a), (c), (e) and (g) ECD, and (b), (d), (f) and (h) DIA for (a), (b) 1; (c), (d) 3; (e), (f) 5 and (g), (h) 7 passes.
Figure 10.
SEM morphologies of tensile fracture surface edges of the bars drawn by (a), (c), (e) and (g) ECD, and (b), (d), (f) and (h) DIA for (a), (b) 1; (c), (d) 3; (e), (f) 5 and (g), (h) 7 passes.

© 2020 by the authors. Licensee MDPI, Basel, Switzerland. This article is an open access article distributed under the terms and conditions of the Creative Commons Attribution (CC BY) license (http://creativecommons.org/licenses/by/4.0/).
Share and Cite
MDPI and ACS Style
Guo, J.; Chen, T.; Li, B. Effect of Drawing Pass on Softening or Plasticizing of Q235 Steel Bar during Electrochemical Cold Drawing. Metals 2020, 10, 715. https://doi.org/10.3390/met10060715
AMA Style
Guo J, Chen T, Li B. Effect of Drawing Pass on Softening or Plasticizing of Q235 Steel Bar during Electrochemical Cold Drawing. Metals. 2020; 10(6):715. https://doi.org/10.3390/met10060715
Chicago/Turabian StyleGuo, Jangli, Tijun Chen, and Bo Li. 2020. "Effect of Drawing Pass on Softening or Plasticizing of Q235 Steel Bar during Electrochemical Cold Drawing" Metals 10, no. 6: 715. https://doi.org/10.3390/met10060715
Note that from the first issue of 2016, this journal uses article numbers instead of page numbers. See further details here.