Article

Comparison of Modern and Pleistocene (MIS 5e) Coastal Boulder Deposits from Santa Maria Island (Azores Archipelago, NE Atlantic Ocean)

by
Sérgio P. Ávila
1,2,3,4,*,
Markes E. Johnson
5,
Ana Cristina Rebelo
1,3,6,7,
Lara Baptista
1,3,4 and
Carlos S. Melo
1,3,8,9
1
CIBIO, Centro de Investigação em Biodiversidade e Recursos Genéticos, InBIO Laboratório Associado, 9501-801 Ponta Delgada, Portugal
2
Departamento de Biologia, Faculdade de Ciências e Tecnologia da Universidade dos Açores, 9501-801 Ponta Delgada, Portugal
3
MPB-Marine Palaeontology and Biogeography lab, University of the Azores, 9501-801 Ponta Delgada, Portugal
4
Faculdade de Ciências da Universidade do Porto, 4169-007 Porto, Portugal
5
Department of Geosciences, Williams College, Williamstown, MA 01267, USA
6
Divisão de Geologia Marinha, Instituto Hidrográfico, Rua das Trinas 49, 1249-093 Lisboa, Portugal
7
Staatliches Museum für Naturkunde Stuttgart, Rosenstein 1, 70191 Stuttgart, Germany
8
Departamento de Geologia, Faculdade de Ciências, Universidade de Lisboa, 1749-016 Lisboa, Portugal
9
Instituto Dom Luiz, Faculdade de Ciências, Universidade de Lisboa, 1749-016 Lisboa, Portugal
*
Author to whom correspondence should be addressed.
J. Mar. Sci. Eng. 2020, 8(6), 386; https://doi.org/10.3390/jmse8060386
Submission received: 21 April 2020 / Revised: 21 May 2020 / Accepted: 26 May 2020 / Published: 28 May 2020

Abstract

:
Modern and palaeo-shores from Pleistocene Marine Isotope Substage 5e (MIS 5e) featuring prominent cobble/boulder deposits from three locations, on the southern and eastern coast of Santa Maria Island in the Azores Archipelago, were compared, in order to test the idea of higher storminess during the Last Interglacial. A total of 175 basalt clasts from seven transects were measured manually in three dimensions perpendicular to one another. Boulders that exceeded the minimum definitional diameter of 25 cm contributed to 45% of the clasts, with the remainder falling into the category of large cobbles. These were sorted for variations in shape, size, and weight pertinent to the application of two mathematical formulas to estimate wave heights necessary for traction. Both equations were based on the “Nott-Approach”, one of them being sensitive to the longest axis, the other to the shortest axis. The preponderance of data derived from the Pleistocene deposits, which included an intertidal invertebrate fauna for accurate dating. The island’s east coast at Ponta do Cedro lacked a modern boulder beach due to steep rocky shores, whereas raised Pleistocene palaeo-shores along the same coast reflect surged from an average wave height of 5.6 m and 6.5 m. Direct comparison between modern and Pleistocene deposits at Ponta do Castelo to the southeast and Prainha on the island’s south shore produced contrasting results, with higher wave heights during MIS 5e at Ponta do Castelo and higher wave heights for the modern boulder beach at Prainha. Thus, our results did not yield a clear conclusion about higher storminess during the Last Interglacial compared to the present day. Historical meteorological records pit the seasonal activity of winter storms arriving from the WNW-NW against the scant record of hurricanes arriving from the ESE-SE. The disparity in the width of the marine shelf around Santa Maria Island with broad shelves to the north and narrow shelves to the south and east suggested that periodic winter storms had a more regular role in coastal erosion, whereas the rare episodic recurrence of hurricanes had a greater impact on southern and southeastern rocky shores, where the studied coastal boulder deposits were located.

1. Introduction

Survey models regarding the level of storm intensity during the Last Interglacial stage of the Pleistocene, specifically the Marine Isotope Substage 5e (MIS 5e), have been conducted on a global scale [1], but studies organized on a more regional scale provide the potential for higher resolution. Localized studies on the propensity for storms in the Bahamas and Bermuda (Western Atlantic) [2,3] reveal patterns in agreement with global results. However, for higher latitudes in the North Atlantic Ocean (e.g., the Azores Archipelago), such analyses have been scarce [4]. Climatological reconstructions are of utmost importance because they allow the scientific community, policymakers, and the general public to better predict and plan for future hazardous events. With a worldwide extension of 500,000 km, coastlines are highly complex and dynamic geomorphological features [5] that commonly correspond to areas of high-density human habitation [6]. With ongoing conditions of global warming, there is even more urgency for increased knowledge about the deep history of storm patterns associated with oceanic circulation.
The shorelines of volcanic oceanic islands are highly dynamic in nature as a result of volcanism, mass wasting, and exposure to the energetic action of the open sea [7,8,9,10]. Exposure to wave action is the primary factor that shapes coastlines, as wave surge crossing island shelves acts continuously, but at different levels of energy [11]. In the Azores Archipelago, all islands are subject to the direct action of waves [11]. Unprotected by the absence of barriers (e.g., reefs) and with narrow insular shelves [12], erosion rates are high [6]. The result is the production of variable amounts of detrital materials that are readily shaped and transported, commonly including coastal boulder deposits (CBDs). Sometimes, transported materials are configured in peculiar geomorphologies, such as fajãs [13]. In the Azores, processes that lead to the production of modern CBDs allow for comparisons with morphologies deposited during the Last Pleistocene Interglacial episode (MIS 5e). Santa Maria is the only island in the Azores with marine fossiliferous sequences that date back to the Pliocene and late Pleistocene (MIS 5e) [14,15,16]. The presence of such sequences makes this island an ideal place for studies testing the postulated higher storminess and inferred palaeo-wave heights that affected the wider archipelago approximately 125,000 years ago.
Inference on palaeo-wave-heights through measurements of eroded blocks in Pleistocene settings has been conducted by Johnson et al. [17,18,19] at localities in the Mexican Gulf of California, providing a useful methodology for application elsewhere. Here, we adapted the program using mathematical formulas to compare the storminess during the Last Interglacial (MIS 5e) and the modern situation, deduced from storms imprinted in the CBDs. Herein, we presented the first estimations for palaeo-wave heights from the Pleistocene (MIS 5e) in the Azores. Data on the shape, size, and calculated weight of palaeo-shore boulders from Santa Maria Island had the advantage of being sourced from well-dated MIS 5e outcrops containing thermophile fauna typical of the Last Interglacial. Crucially, estimates on wave heights from MIS 5e CBDs might be compared with adjacent modern beach boulders. Work was limited to localities on the island’s south and east coast, where marine shelves were narrower. The island’s broader northern shelf provided the basis for conjecture on differences in storm patterns that led to that outcome.

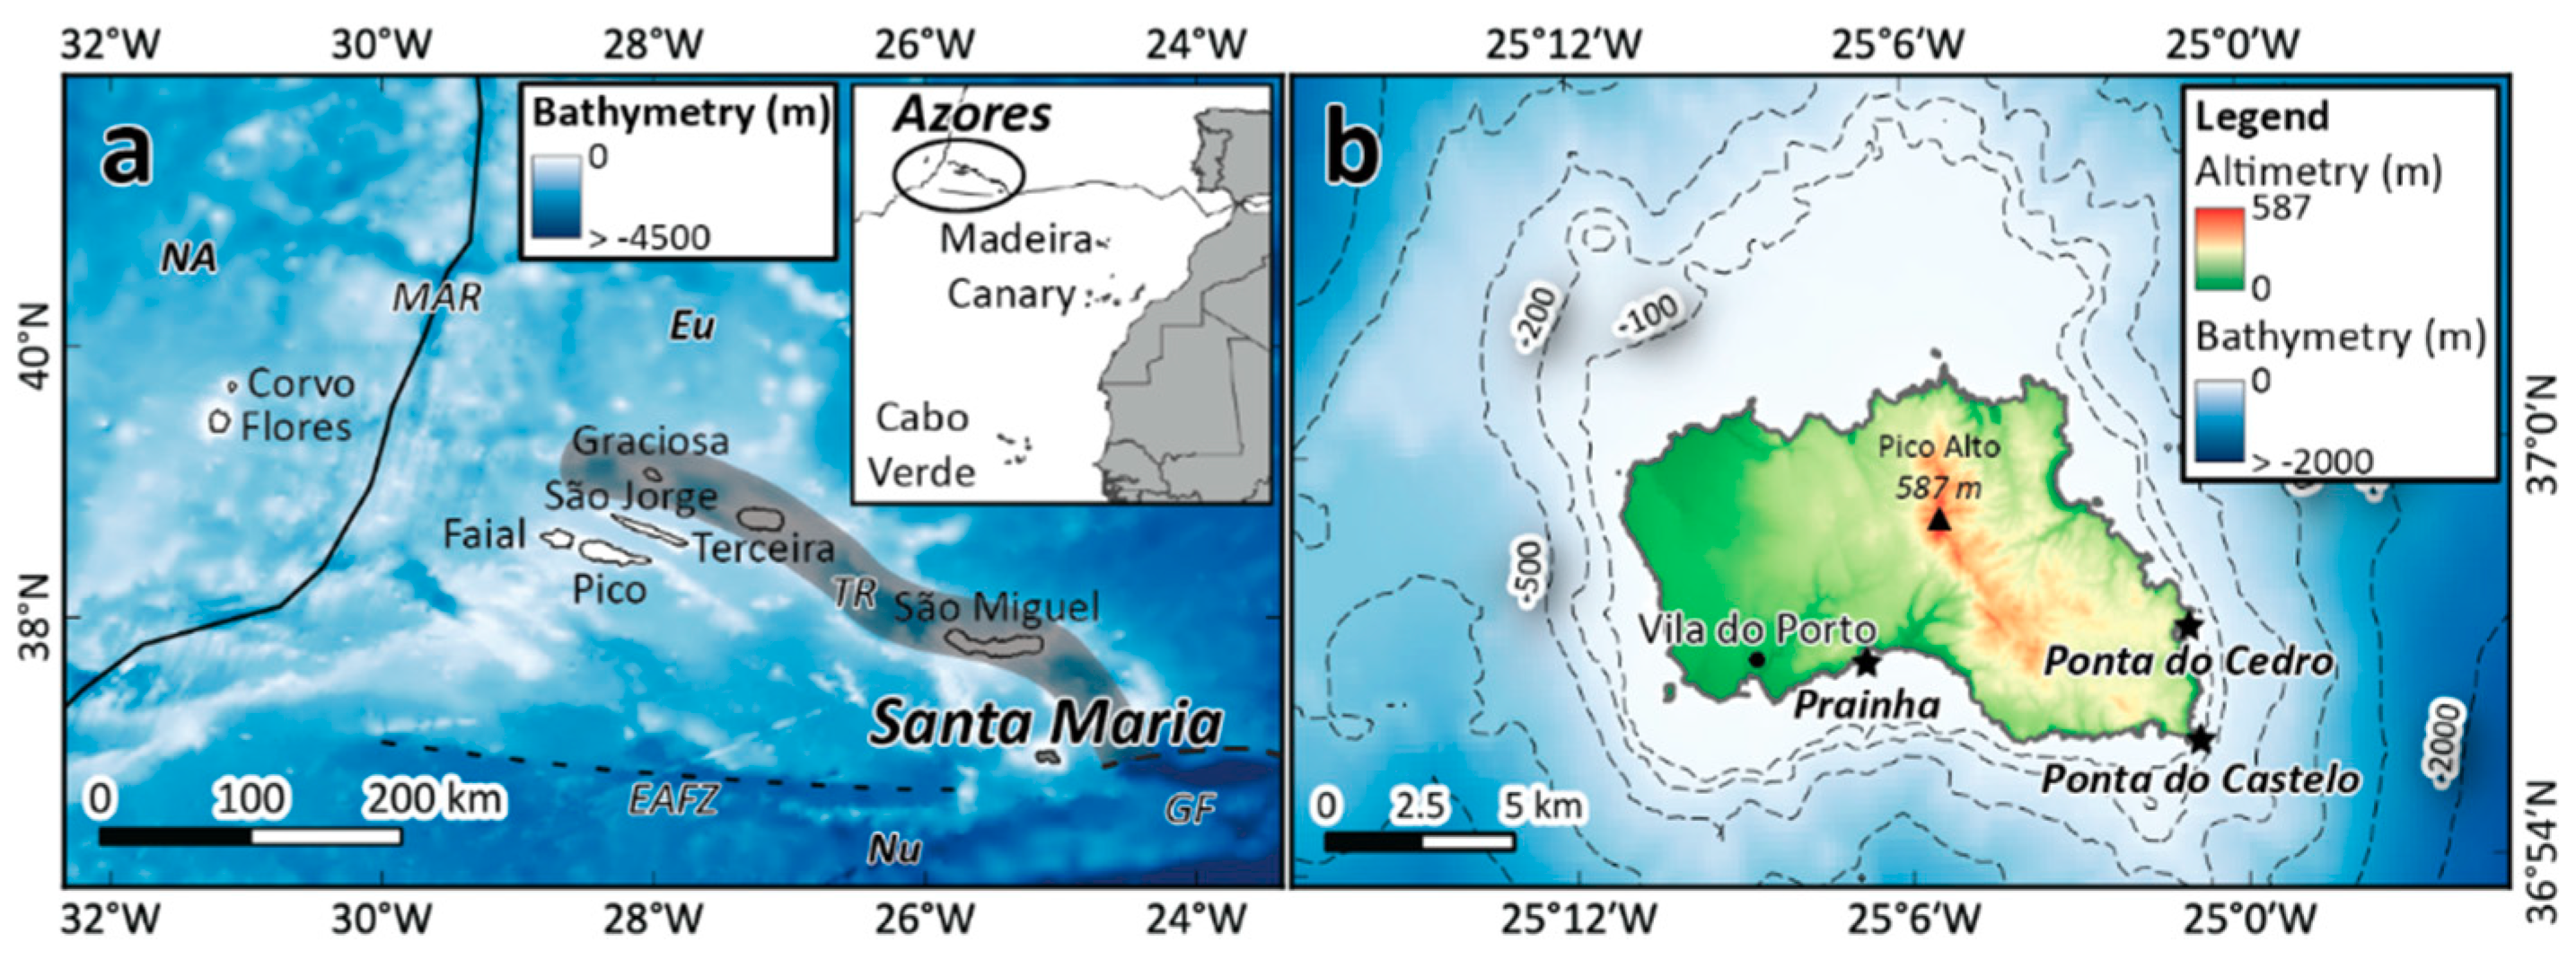
2. Geographical and Geological Setting

2.1. Position and Geotectonic Setting

The Azores is an oceanic volcanic archipelago with nine islands, found in the NE North Atlantic Ocean, between latitudes 36°55′ and 49°43′ N and longitudes 24°46′ and 31°16′ W, and spreading along a distance of 650 km (Figure 1a). Seated on the Azores Plateau, the archipelago straddles a triple junction between the Eurasian, North American, and Nubian (African) tectonic plates [20]. Santa Maria Island is the most southeastern and oldest among these and is seated on the Nubian plate. It exhibits a geologic record, marking the earliest emergence from the sea due to Surtseyan volcanic activity approximately 6 million years ago [8]. Much of the ensuing rock record, which includes intercalated sedimentary strata and extensive volcanic flows, is restricted to the Pliocene Epoch [21,22]. Island uplift, which commenced 2.8 million years ago, has resulted in more than 200 m of tectonic rise, as a result of which older Pliocene marine strata are well exposed in sea cliffs on all sides of the island, but most accessible along the south and eastern shores [23]. Santa Maria ranks seventh in size compared to the other islands in the Azores Archipelago, with an area of 97 km2 and a coastal circumference of 53 km. The island presents a peculiar orography, with a flatter Western part and a rougher Eastern part, as a result of its unusual geological evolution (i.e., different erosional rates and off-center volcanism during a rejuvenated stage, mostly located on the eastern section of the older edifice [8,24]; Figure 1b). In terms of bathymetry, the island is much reduced in size with an asymmetrical marine shelf that is broadest to the north and narrowest to the south and east [24]. The shelf is also characterized by a suite of submerged terraces, all presumably younger than ~1 Ma, which are more developed and preserved in wider and low-gradient sectors (Figure 1b) [25]. During the Last Interglacial epoch of the Pleistocene, extensive boulder beds were emplaced all around the island that incorporates marine fossils attributed to the MIS 5e [4]. Three localities, including Prainha and Ponta do Castelo on the south shore and Ponta do Cedro on the east coast, were chosen to highlight lateral variations in Pleistocene boulder size together with a review of the associated fauna. Comparisons were drawn with modern boulder beds at the two southern localities, whereas the plunging coastal cliffs at Ponta do Cedro lacked any such development of a coastal boulder deposit (CBD) at or close to modern sea level.

2.2. Sources and Shaping of the Boulders

The Prainha site is situated within a bay, thus affording a higher potential for the deposition of clasts and finer sediments. The analysis of local currents showed a confluence of waves to the south coast of the island (https://www.ipma.pt/pt/maritima/hs/index.jsp?area=acores-east) that explains how during the summer season the nearby coastlines collect extensive (on a local scale) sand beaches. The area is also the river-mouth of some streams. As the archipelago’s climate is classified as “Warm Temperate” [29], higher precipitation events are common. Such events are responsible for the transport of varying amounts of boulders and sand to the intertidal zone. As rough seas are commonly registered in the archipelago, the boulders are easily rounded and shaped.
At the southeasternmost tip of the island, Ponta do Castelo presents the most complex wave regime from the three sites studied. In the area, perpendicular (in direction) wave currents interact, promoting rougher seas, even under fair-weather conditions. As a result of this exposure, no fine sediment is deposited, and only a well-developed CBD is present.
In Ponta do Cedro, however, despite being found inside a bay, like Prainha, a plunging coastline allows for no accumulation of sandy deposits, and a modern CBD also is absent. Ponta do Cedro and Ponta do Castelo, however, share the same type of boulder source resulting from erosion of the area’s high sea cliffs. Both these sites are situated in the rough eastern end of the island, where sea cliffs are impressive in height.

2.3. Wave Energy and Direction

The Azores occupies a region in the NE Atlantic Ocean encompassing approximately 22,500 km2 (Figure 1a) and is characterized by a high level of marine storm activity. Hurricanes rarely cross through the region during the annual Atlantic hurricane season, although tropical cyclones are common. Such storms arrive from a zone off the west coast of Africa in the vicinity of the Cabo Verde Archipelago, located at a lower 17° N latitude. Notwithstanding, extreme storm events tend to arrive once every seven years, on average [6,30]. In contrast and as a result of the exposure to the strong NW North Atlantic winds – the Westerlies [31], the northern exposures of islands are subject to winter storms. The archipelago is also in the pathway the Gulf Stream makes from the North American coasts towards the central zone of the North Atlantic [32,33], being so a source of many instability processes, meanders, and eddies [34]. The main wave direction that affects the archipelago comes from WNW-NW [5,8,23]. Such predominance is reflected in the island’s bathymetrical morphology that shows higher erosional rates on the W and N coasts. According to Rusu and Soares [11], and using the closest station to Santa Maria Island (P18), present-day mean wave heights during summer is 1.75 and during winter is 3.20 m. For the Azores archipelago, Santa Maria presents the lowest values regarding the mean values for both seasons, and Corvo presents the highest. This variation in values has been related to the shadow effect promoted mainly by São Miguel Island (North of Santa Maria), protecting it from the high wave energy [13].

3. Methods

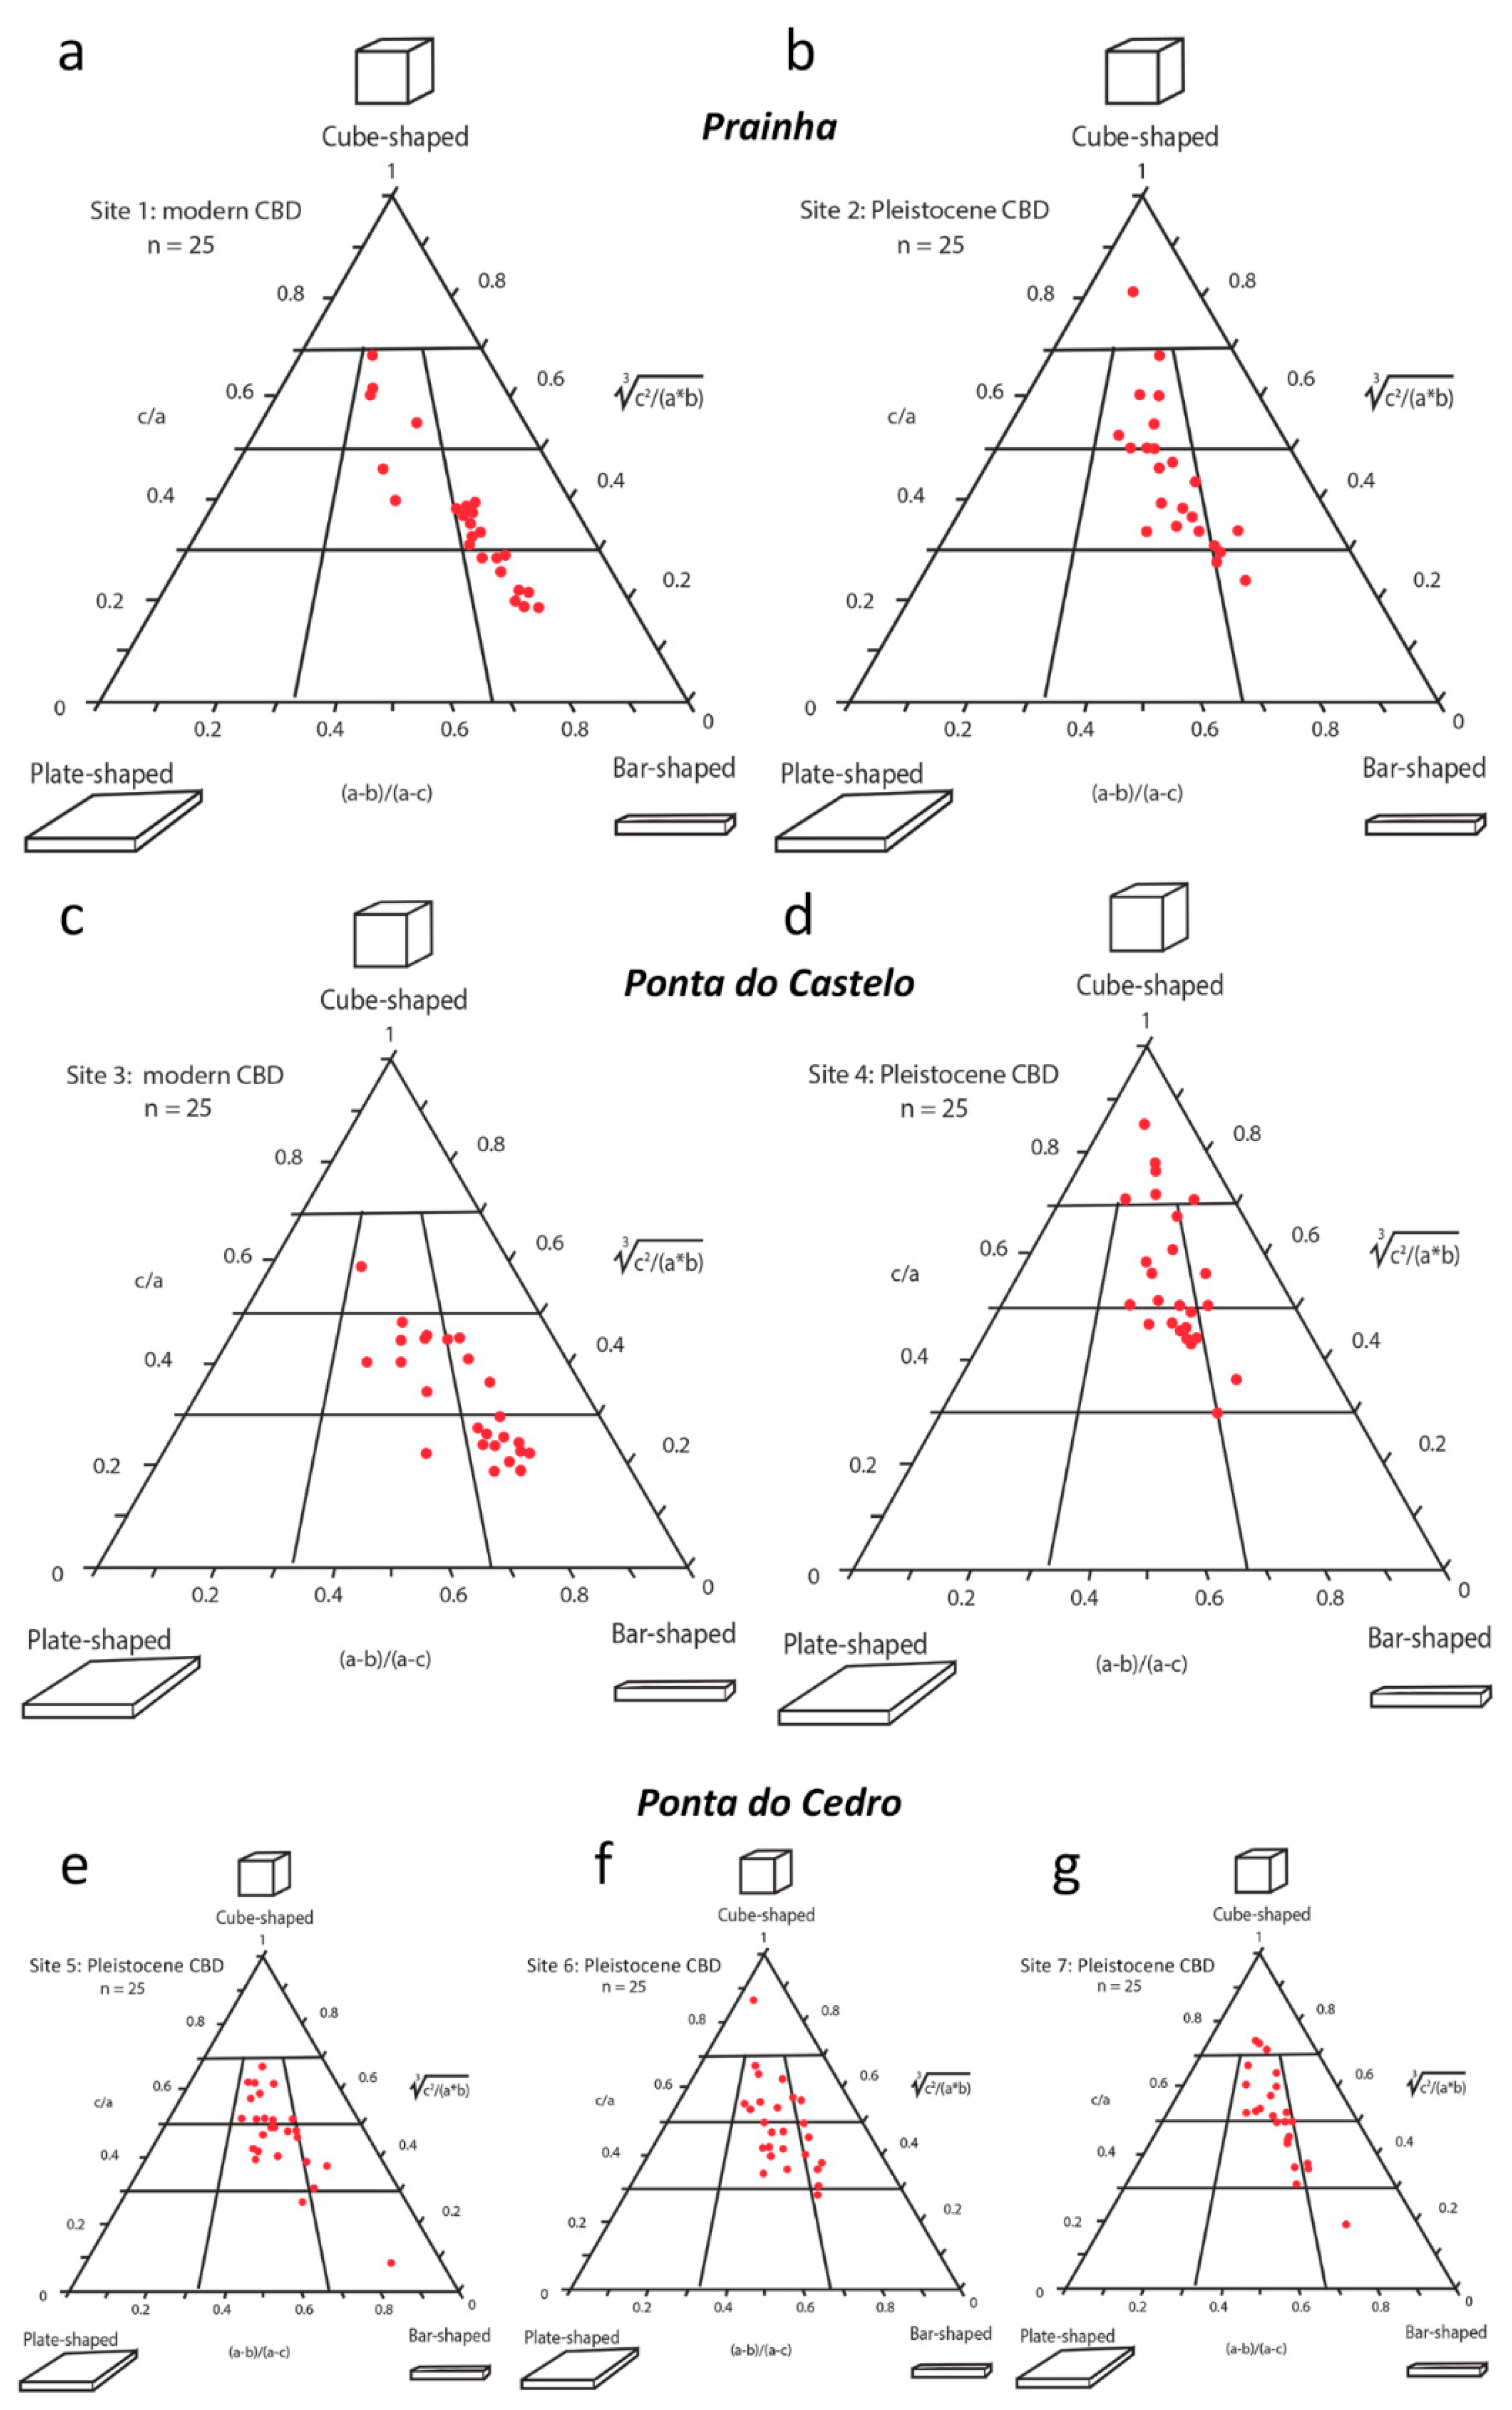
3.1. Data Collection

Original data were collected for both modern and MIS 5e coastal boulder deposits at two localities (Prainha and Ponta do Castelo, Figure 1b) and only MIS 5e from one locality (Ponta do Cedro, Figure 1b). Measurements from modern deposits were performed at mean sea level, while Pleistocene deposit heights varied from ~2.5 m and as much as ~9.0 m above mean sea level (amsl) at five localities, all on the southern and eastern shores of Santa Maria Island. The definition for a boulder adapted to this exercise is that of Wentworth [35] for an erosional clast equal or greater than 256 mm and less than 4096 mm in diameter, with cobbles defined as clasts pertaining to the class 64-256 mm in maximum diameter. For each data set, 25 of the largest available clasts were selected along a transect line parallel to the shore spaced no more than one meter apart. Each clast required three measurements along principle axes (long a, intermediate b, and short c). The initial calculation for volume was simply a multiplication of the long, intermediate, and short-axis values. In all cases, this resulted in a cubical to a rectangular shape that did not take into account the rounding of the boulders by erosion; therefore, a final adjustment to 75% was made, regarding the volume estimates for each boulder, in accordance with previous works [18,19]. Triangular plots were employed to demonstrate variations in boulder shape, following the practice of Sneed and Folk for river pebbles [36]. Data regarding the maximum and intermediate lengths perpendicular to one another from individual boulders were plotted in bar graphs to show potential shifts in size from one transect to the next. A brief description of the fossil fauna in each site was also provided. This was important information, as, together with the geological data, the presence of the characteristic MIS 5e thermophilic taxa [4] attested to the age of the deposit, which was not possible to date due to the absence of suitable biogenic material (e.g., corals).

3.2. Hydraulic Model

With the determination of specific gravity based on the standard density value for oceanic basalt at 3.0 g/cm3, a hydraulic model might be applied to predict the energy needed to transfer larger basalt blocks from rocky shoreline to an adjacent coastal boulder deposit as a function of wave impact. Basalt is a volcanic rock that forms from surface flows with variable thicknesses and a propensity to develop vertical fractures. These factors regulate the size and general shape of blocks loosened in the cliff face [6]. Herein, we used two different formulas to estimate the magnitude of storm waves applied to joint-bounded boulders derived, respectively, from Equation (36) in the work of Nott [37] (Equation (1)) and from a recent formula of Pepe et al. [38] that used the velocity equations of Nandasena et al. [39] to estimate wave heights (Equation (2)):
H S = ( ρ s ρ w ρ w ) a C l
H S = ( ( ρ s ρ w ρ w ) C l ) .   c .   ( cos θ + μ s × sin θ C l ) 100
where Hs is the height of the storm wave at breaking point; ρs is the density of the boulder (3 tons/m3 or 3 g/cm3); ρw is the density of water at 1.02 g/cm3; a is the length of the boulder on long axis in cm; c is the length of the boulder on short axis in cm; θ is the angle of the bed slope at the pre-transport location (1° for joint-bounded boulders); μs is the coefficient of static friction (=0.7); Cl is the lift coefficient (=0.178). Equation (1) was more sensitive to the length of a boulder at the long axis, whereas Equation (2) was more sensitive to the length of a boulder on the short axis. Therefore, some differences were expected in the estimates of HS.

4. Results

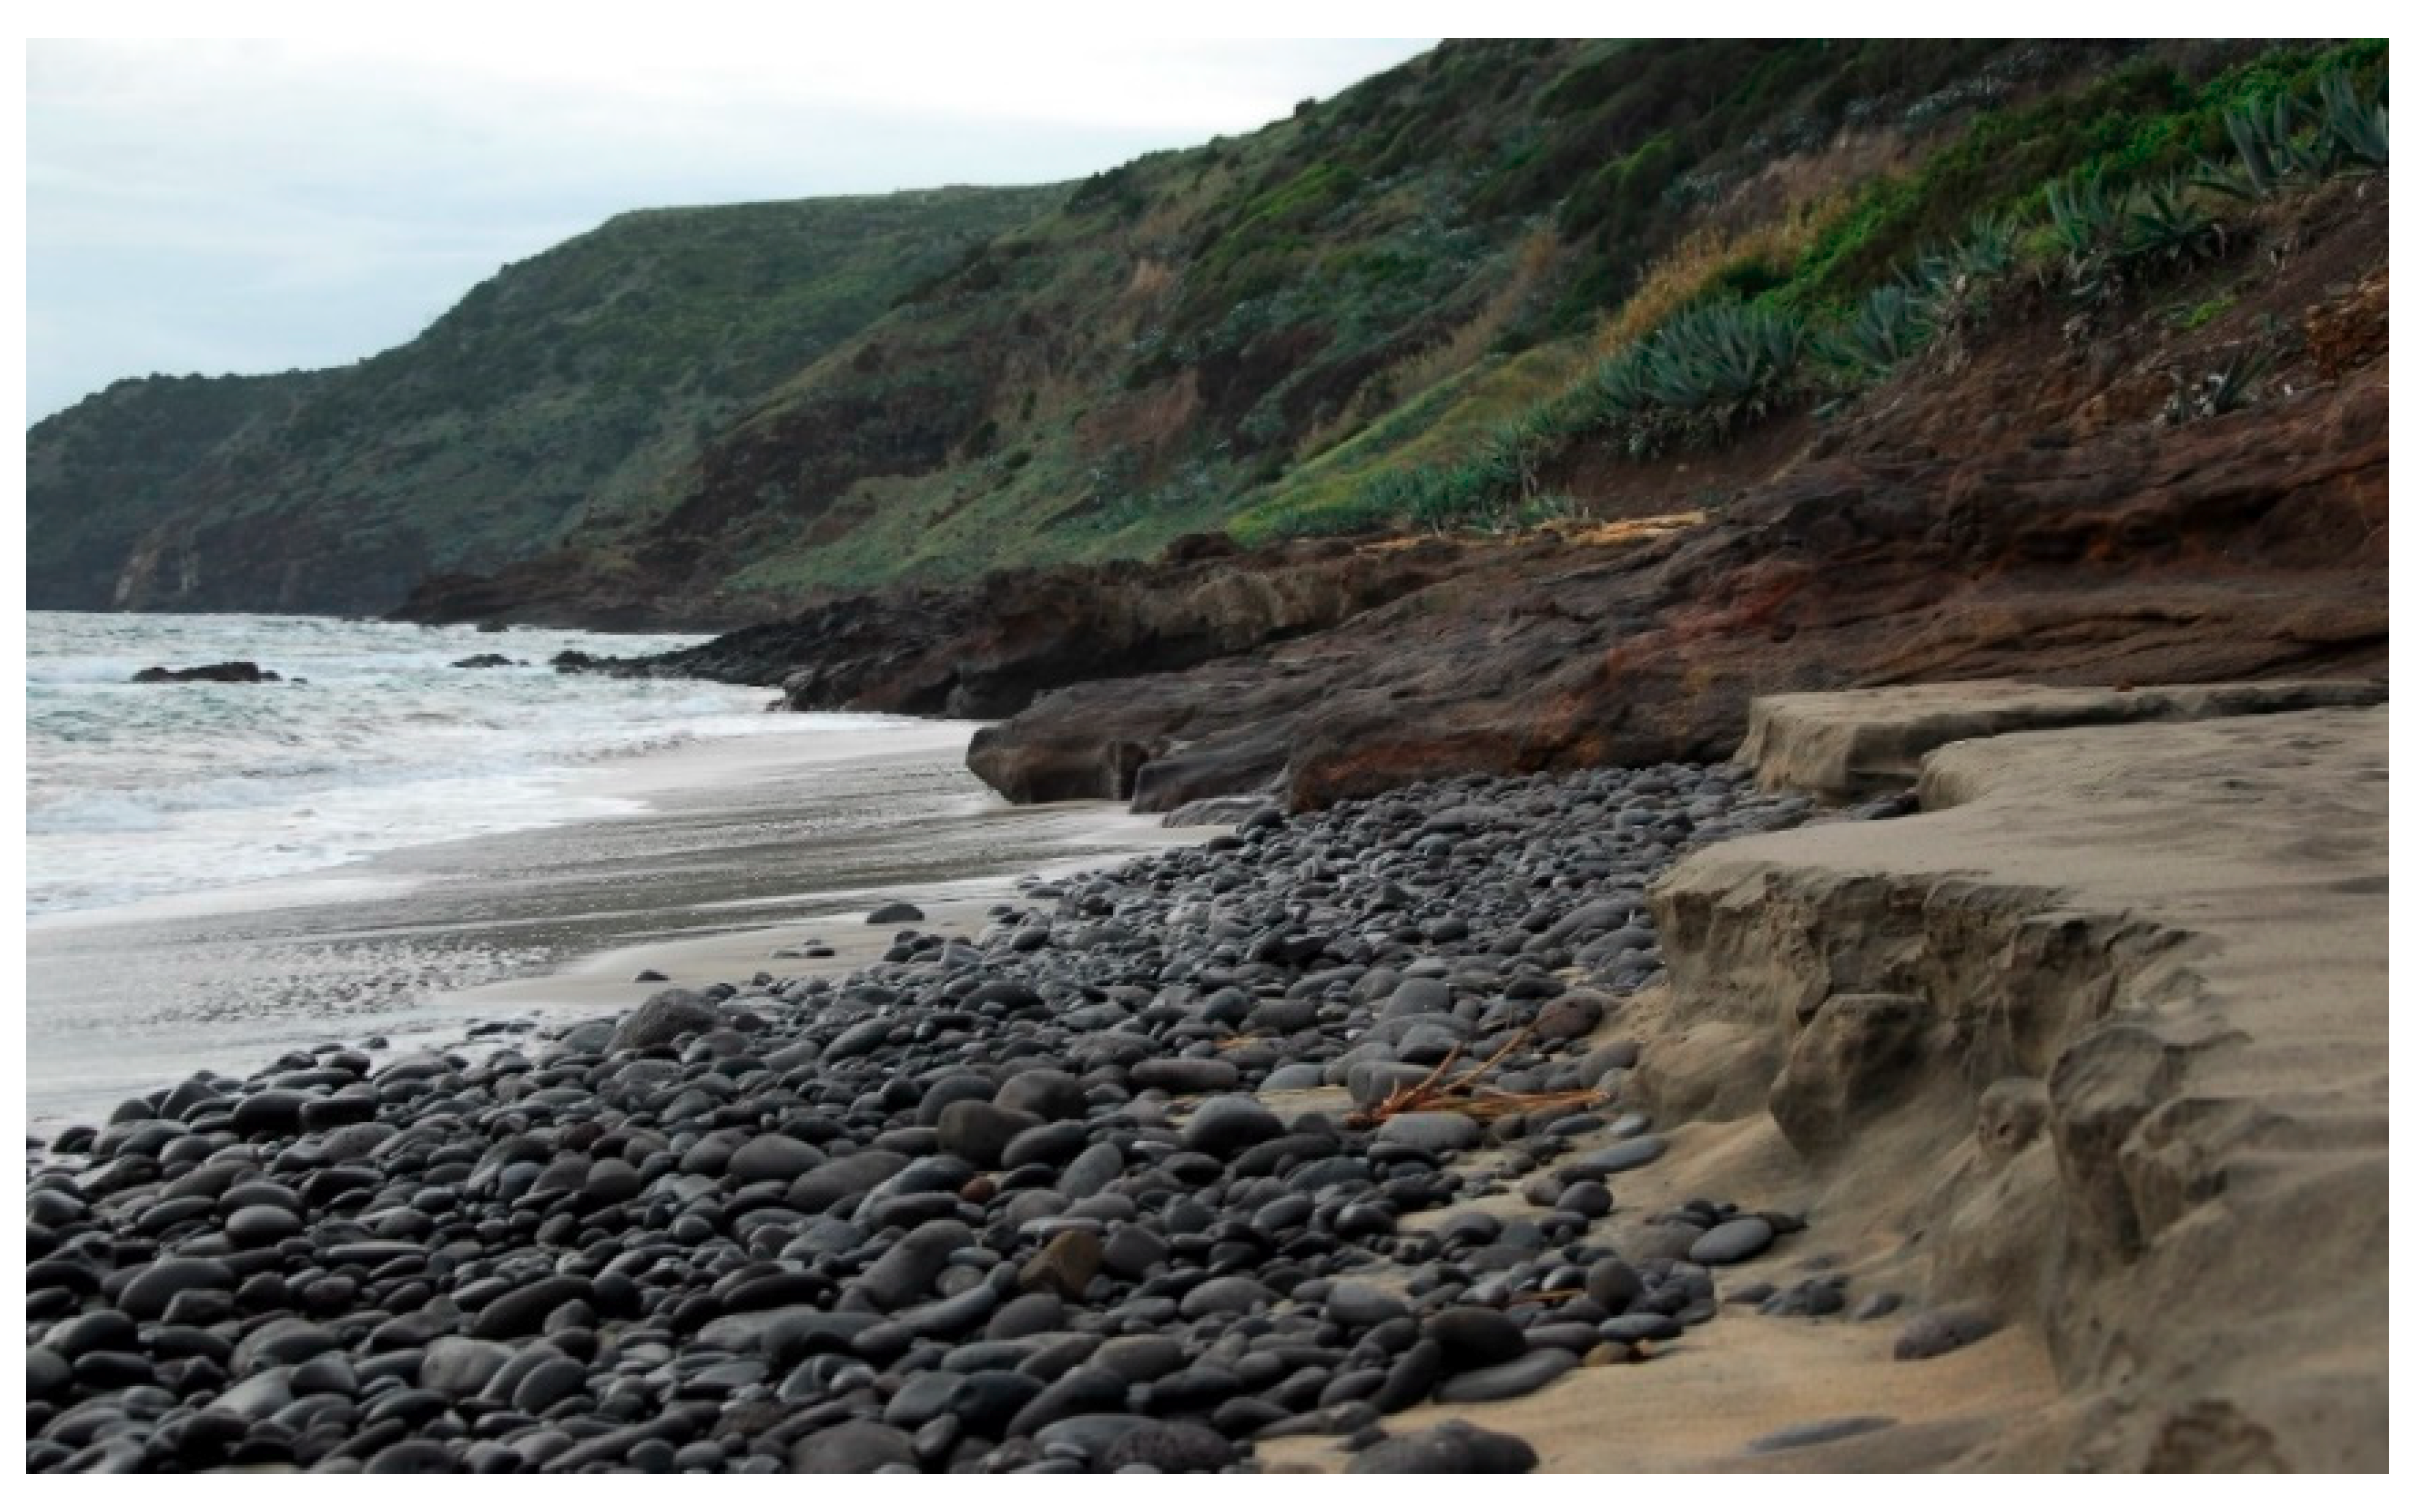
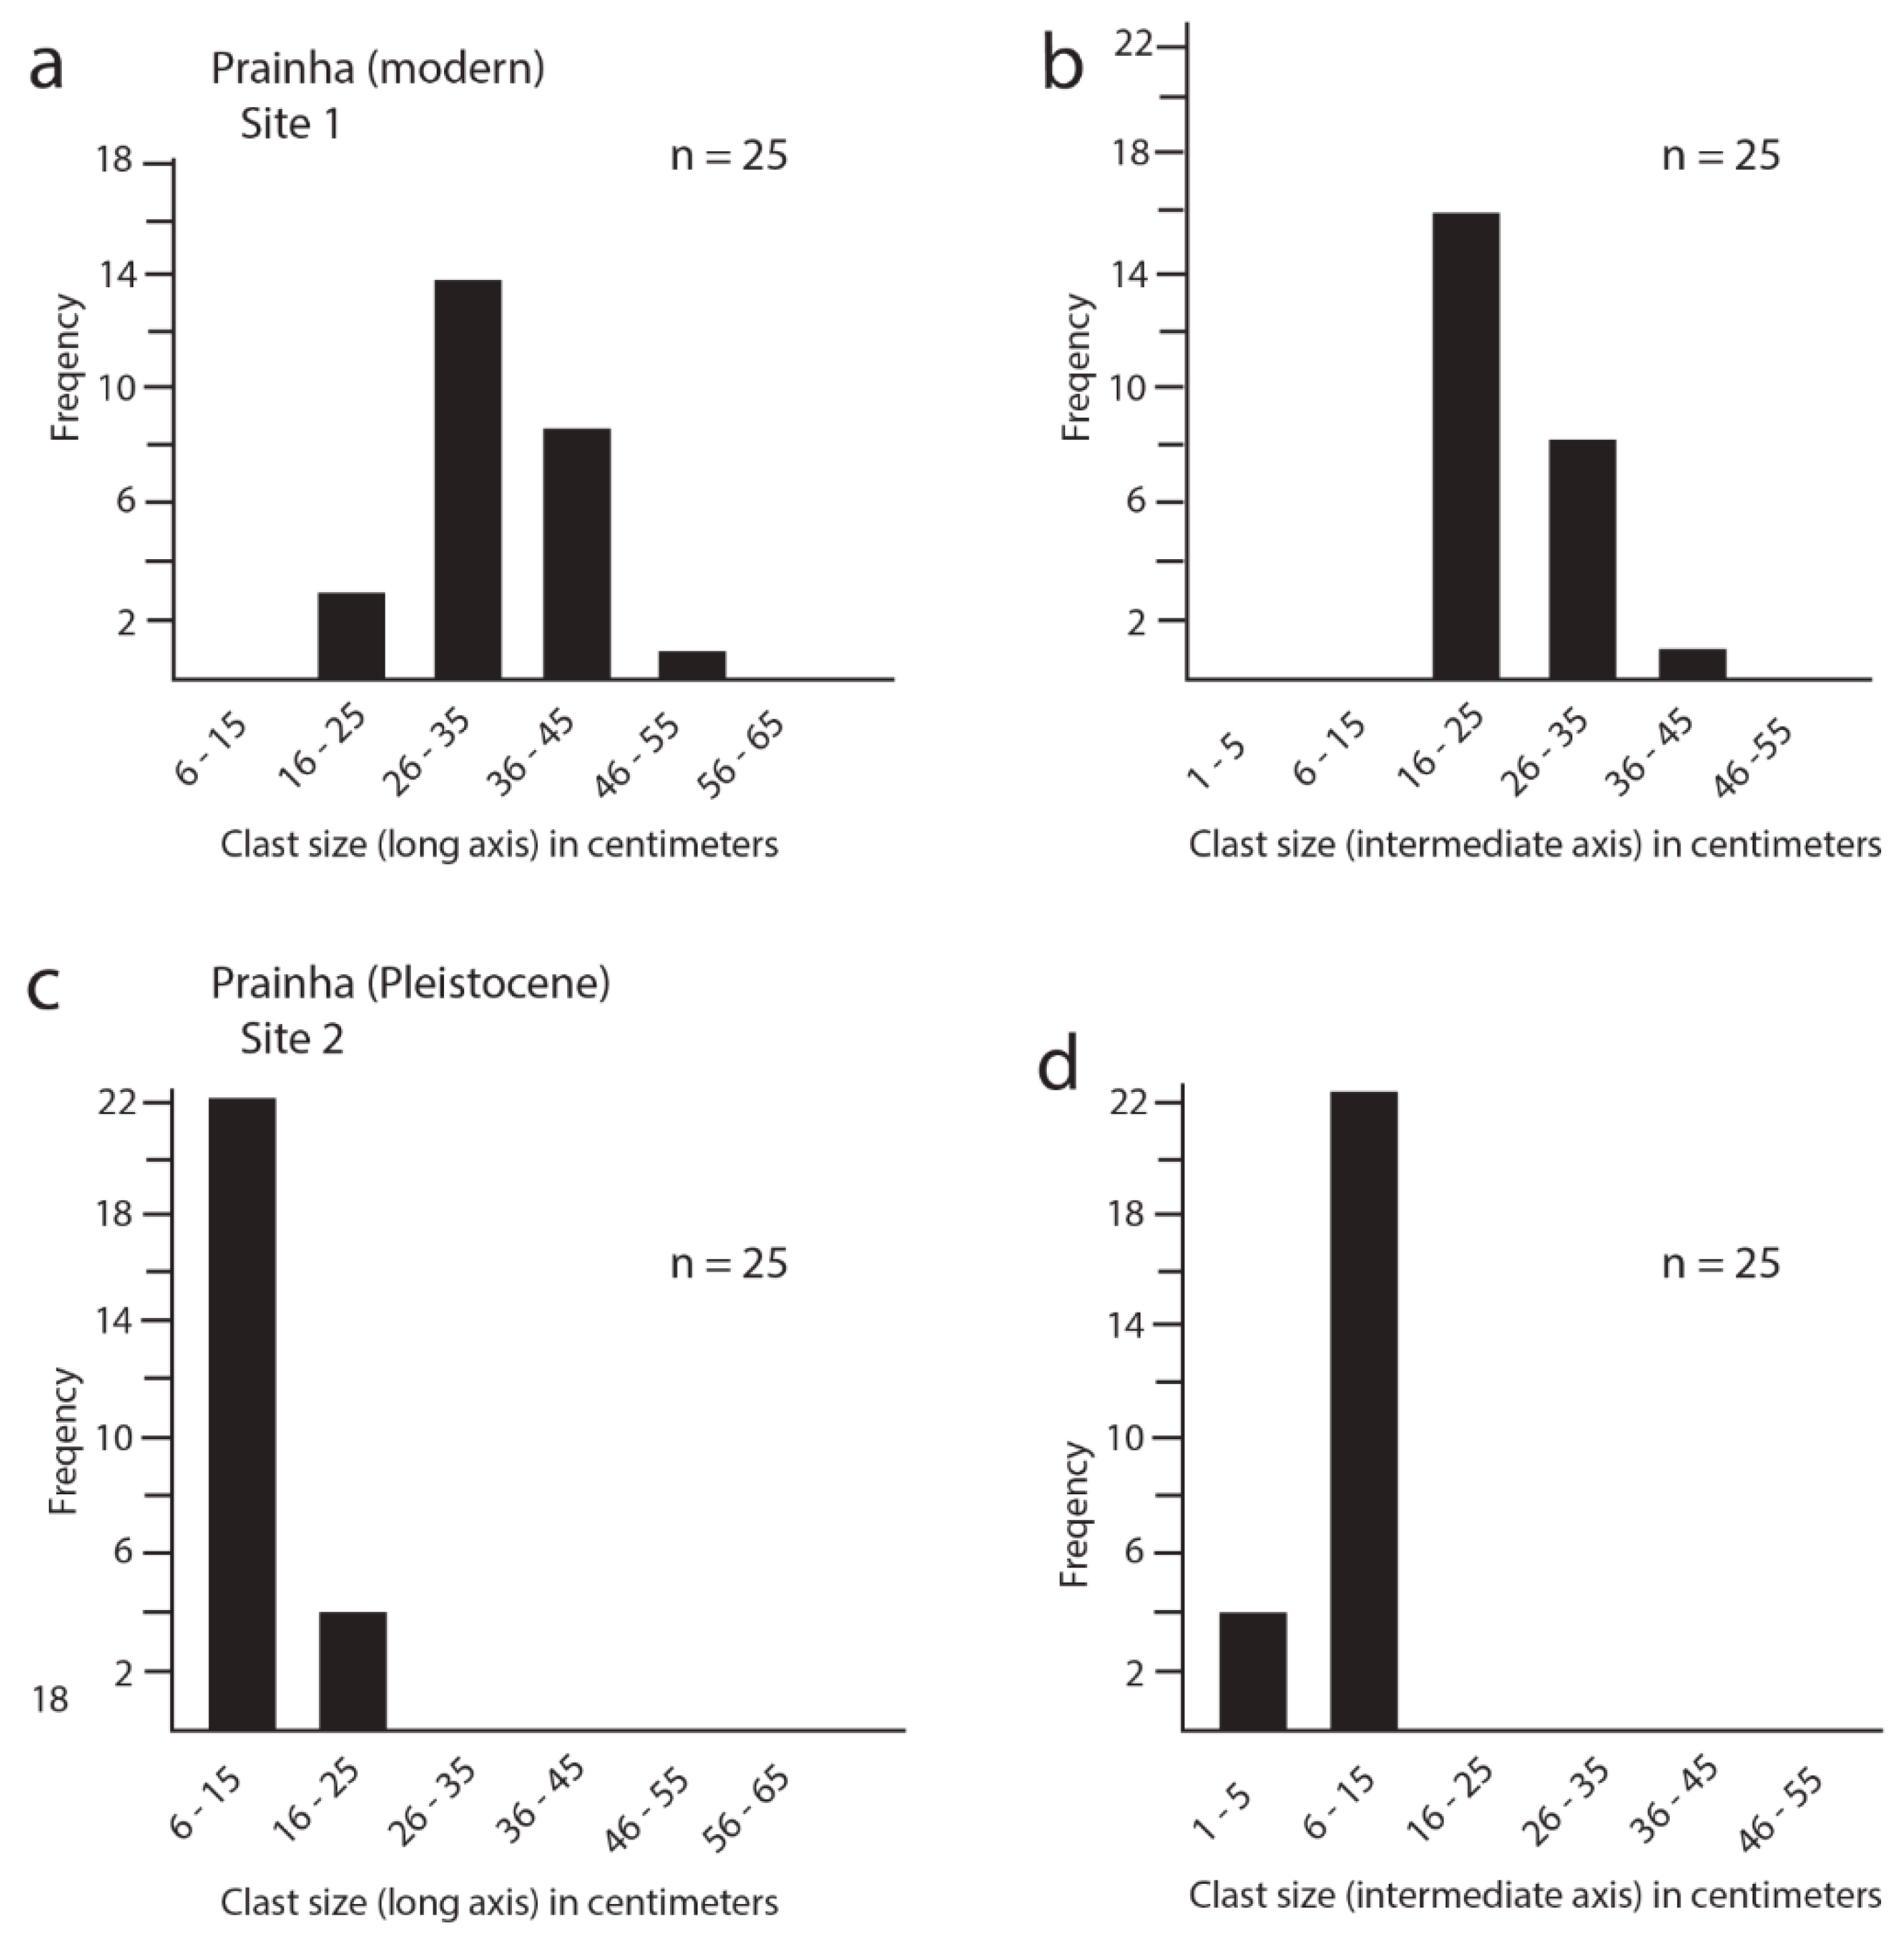
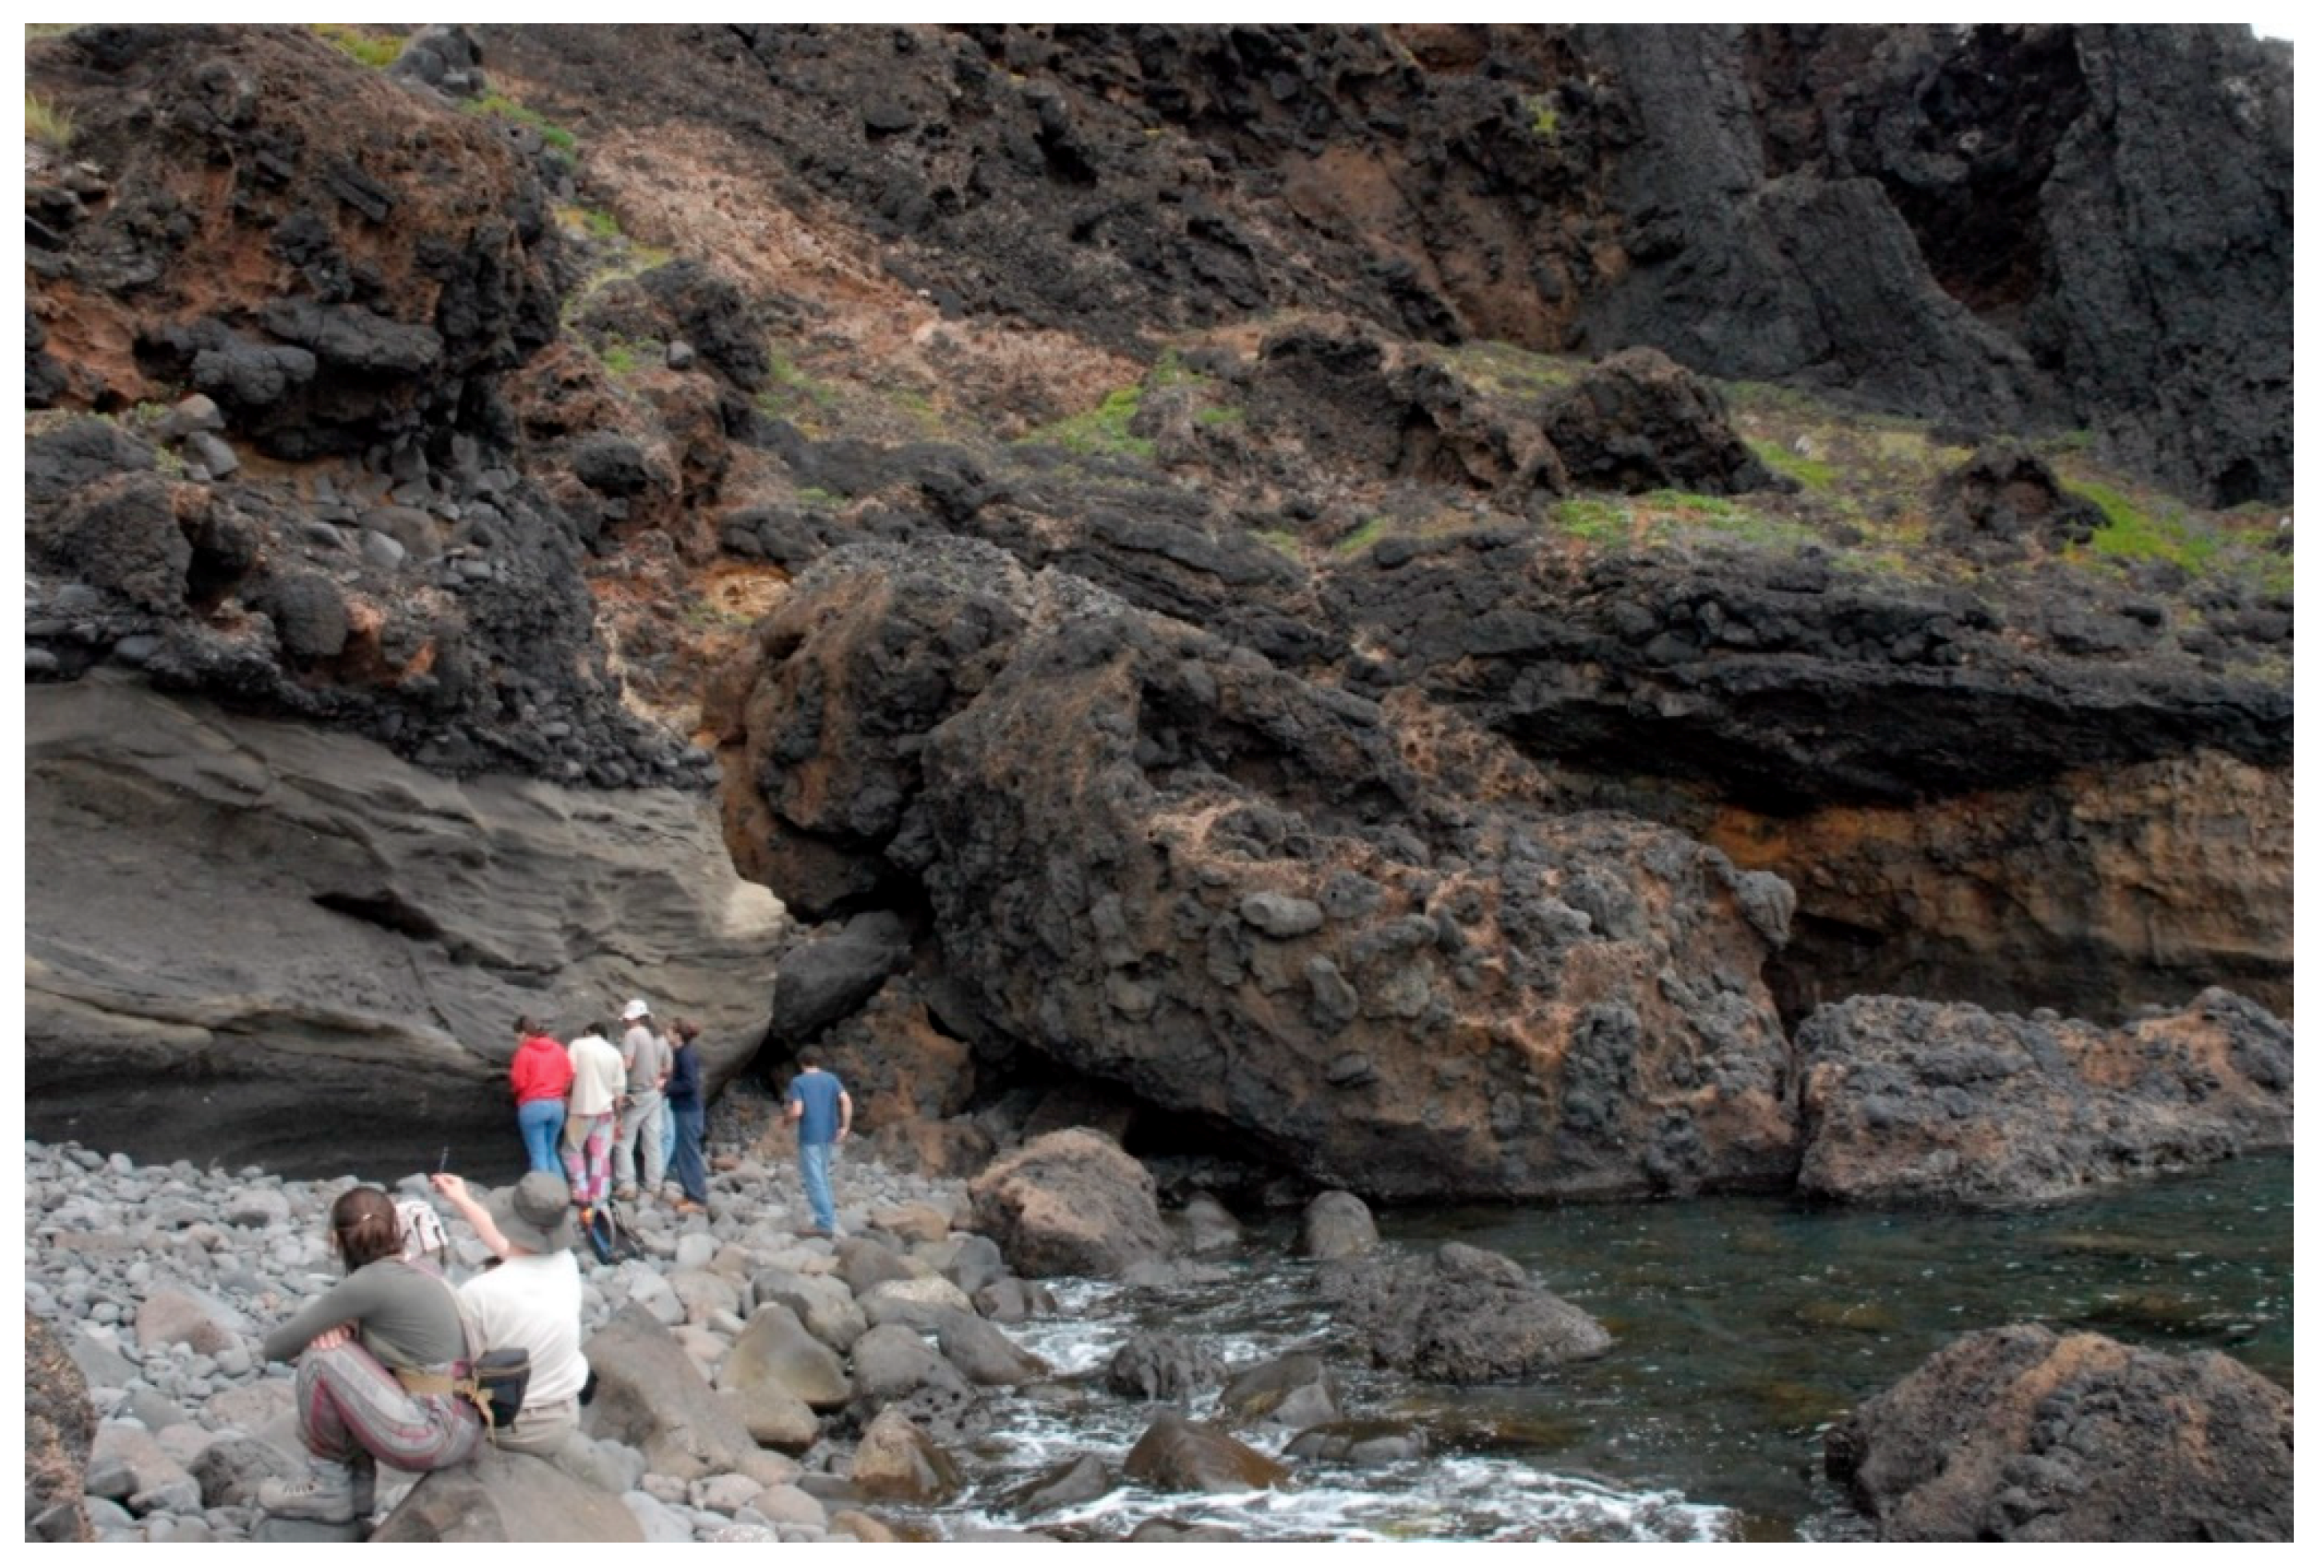
4.1. Prainha on the South Shore

Located 3.5 km east of the harbor at Vila do Porto (Figure 1b), Prainha’s area presented well-developed modern CBD, at heights of ~0.5 m amsl (Figure 2), as well as exposed Pleistocene marine sequences, deposited on top of volcaniclastic rocks at an elevation of ~3 m amsl [40] (Figure 3). Although CBDs were present all-year-round at Prainha, the location of this site (south coast of the island) combined with the fact that Prainha was found within a bay, and taking into consideration the wave regime, it resulted that, in some cases, the modern CBD was covered by sand. Raw data on clast size in three dimensions collected from the two parallel transects at this locality are present in Table 1 and Table 2.
Data points representing individual boulders grouped by transect were plotted on a set of Sneed-Folk triangular diagrams (Figure 4a,b), showing shape variations. Those points clustered nearest to the core of the diagrams were most faithful to an average value with somewhat equidimensional axes in three directions. Only rarely any points fell into the upper-most triangle, which signified a cube-shaped endpoint.
The majority of points from both sets fell within the central part of the two tiers beneath the top triangle. However, the overall trend shared between the two sets traced a similar pattern angled toward the lower right corner of the diagrams. The modern CBD at Prainha (Figure 2 and Figure 4a) demonstrated a greater tendency to elongate shapes represented by the endpoint for bar-shaped clasts. No points appeared in the lower-left tier of either diagram, which represented an endpoint reserved for plate-shaped clasts. Although the general trend in slope was similar between the modern and Pleistocene CBDs, the plots had no bearing on actual variations in clast size.
Variations in boulder size as a function of maximum and intermediate axis length were plotted using bar graphs (Figure 5), based on raw data drawn from Table 1. The greatest number of boulders in the sample measured from the modern CBD fell within a maximum diameter size range between 26 and 35 cm (Figure 5a), which qualified as small boulders in the Wentworth scheme [35]. The largest boulders encountered at Prainha were few in number but ranged in size between 46 and 55 cm. The tendency towards an elongated shape among these clasts was shown by a marked shift in the dominant bin-size for the intermediate axis, within an interval of 16 to 25 cm (Figure 5b).
In strong contrast, all clasts encountered from the Pleistocene (MIS 5e) conglomerate fell into the category of cobbles as defined in the Wentworth scheme [35]. By far, the largest number of clasts within the sample fell into the size range between 6 and 15 cm in maximum diameter (Figure 5c), also replicated by the same frequency for the intermediate axis (Figure 5d). However, a subsample of smaller clasts in the size range of pebbles to small cobbles appeared in the sample measured for the intermediate axis. Comparing the modern CBD at Prainha (Figure 2) with the general contents of the Pleistocene conglomerate at the same locality, it was clear that wave conditions on the modern shore eroded significantly larger clasts from the parent basalt rocky shore.

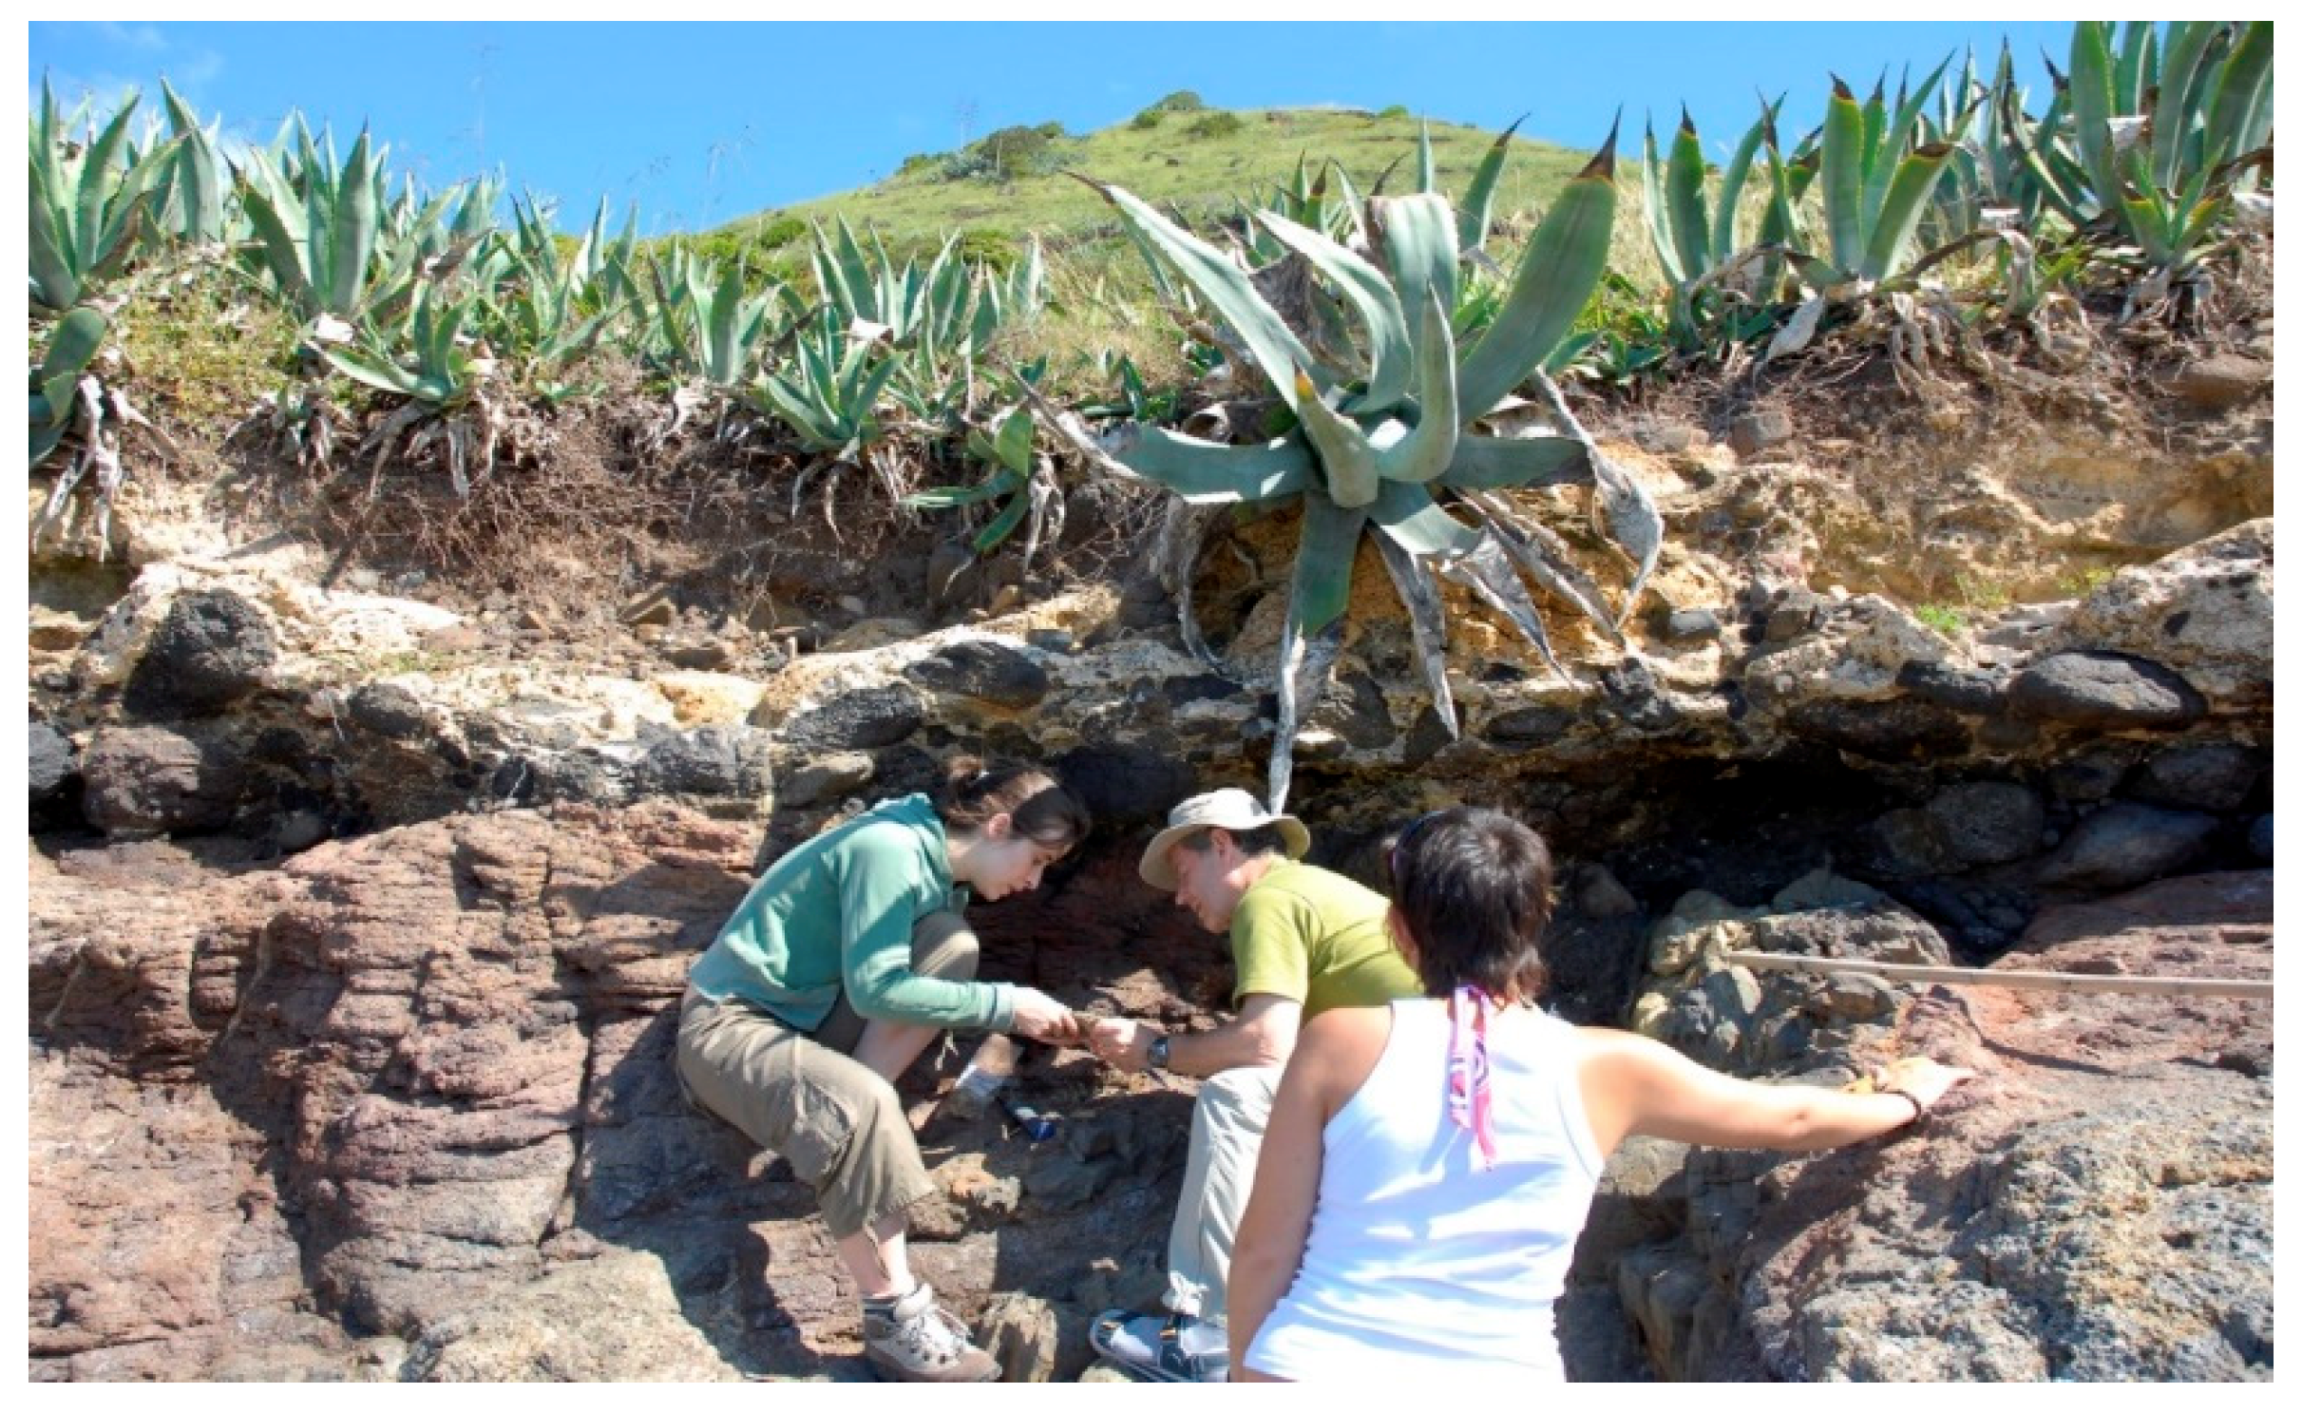
4.2. Context of the Pleistocene Fauna at Prainha

Prainha is one of the six Pleistocene (MIS 5e) fossiliferous outcrops described for Santa Maria Island. MIS 5e CBDs are known from Prainha, Ponta do Castelo, Ponta do Cedro, and Pedra-que-pica, but do not occur at Lagoinhas nor at Vinha Velha.
Prainha is the best-studied outcrop from Santa Maria Island, and its fossils being first reported by Portuguese geologists [41,42]. After these pioneer works, Santa Maria outcrops’ and their fossiliferous remains have been systematically described, with a total of 148 fossil marine-specific taxa presently reported from the Santa Maria Last Interglacial deposits [4]. The most biodiverse invertebrate group is, by far, the marine mollusks, with a total of 138 taxa (114 Gastropoda and 24 Bivalvia) [41,43,44,45] reported for all MIS 5e deposits in the island (of these, 100 gastropods and 20 bivalve taxa are reported from Prainha). It is followed by the Echinodermata (three taxa) and Cnidaria Anthozoa (one coral taxa) [40,46,47]. Four species of coralline red algae have also been reported from the MIS 5e of Prainha [48]. Finally, rare vertebrate remains have been described from the MIS 5e sedimentary sequences in Santa Maria: one bony fish species, Sparisoma cretense (Linnaeus, 1758) reported from the MIS 5e of Vinha Velha [49], and one undetermined Balaenopteridae species (a baleen whale) reported from the MIS 5e of Prainha [50]. As a result of its high palaeobiodiversity, a high number of scientific studies, education and touristic potential, and the presence of extremely rare vertebrate cetacean remains, Prainha is considered as a high-relevance, national geosite [15,16].

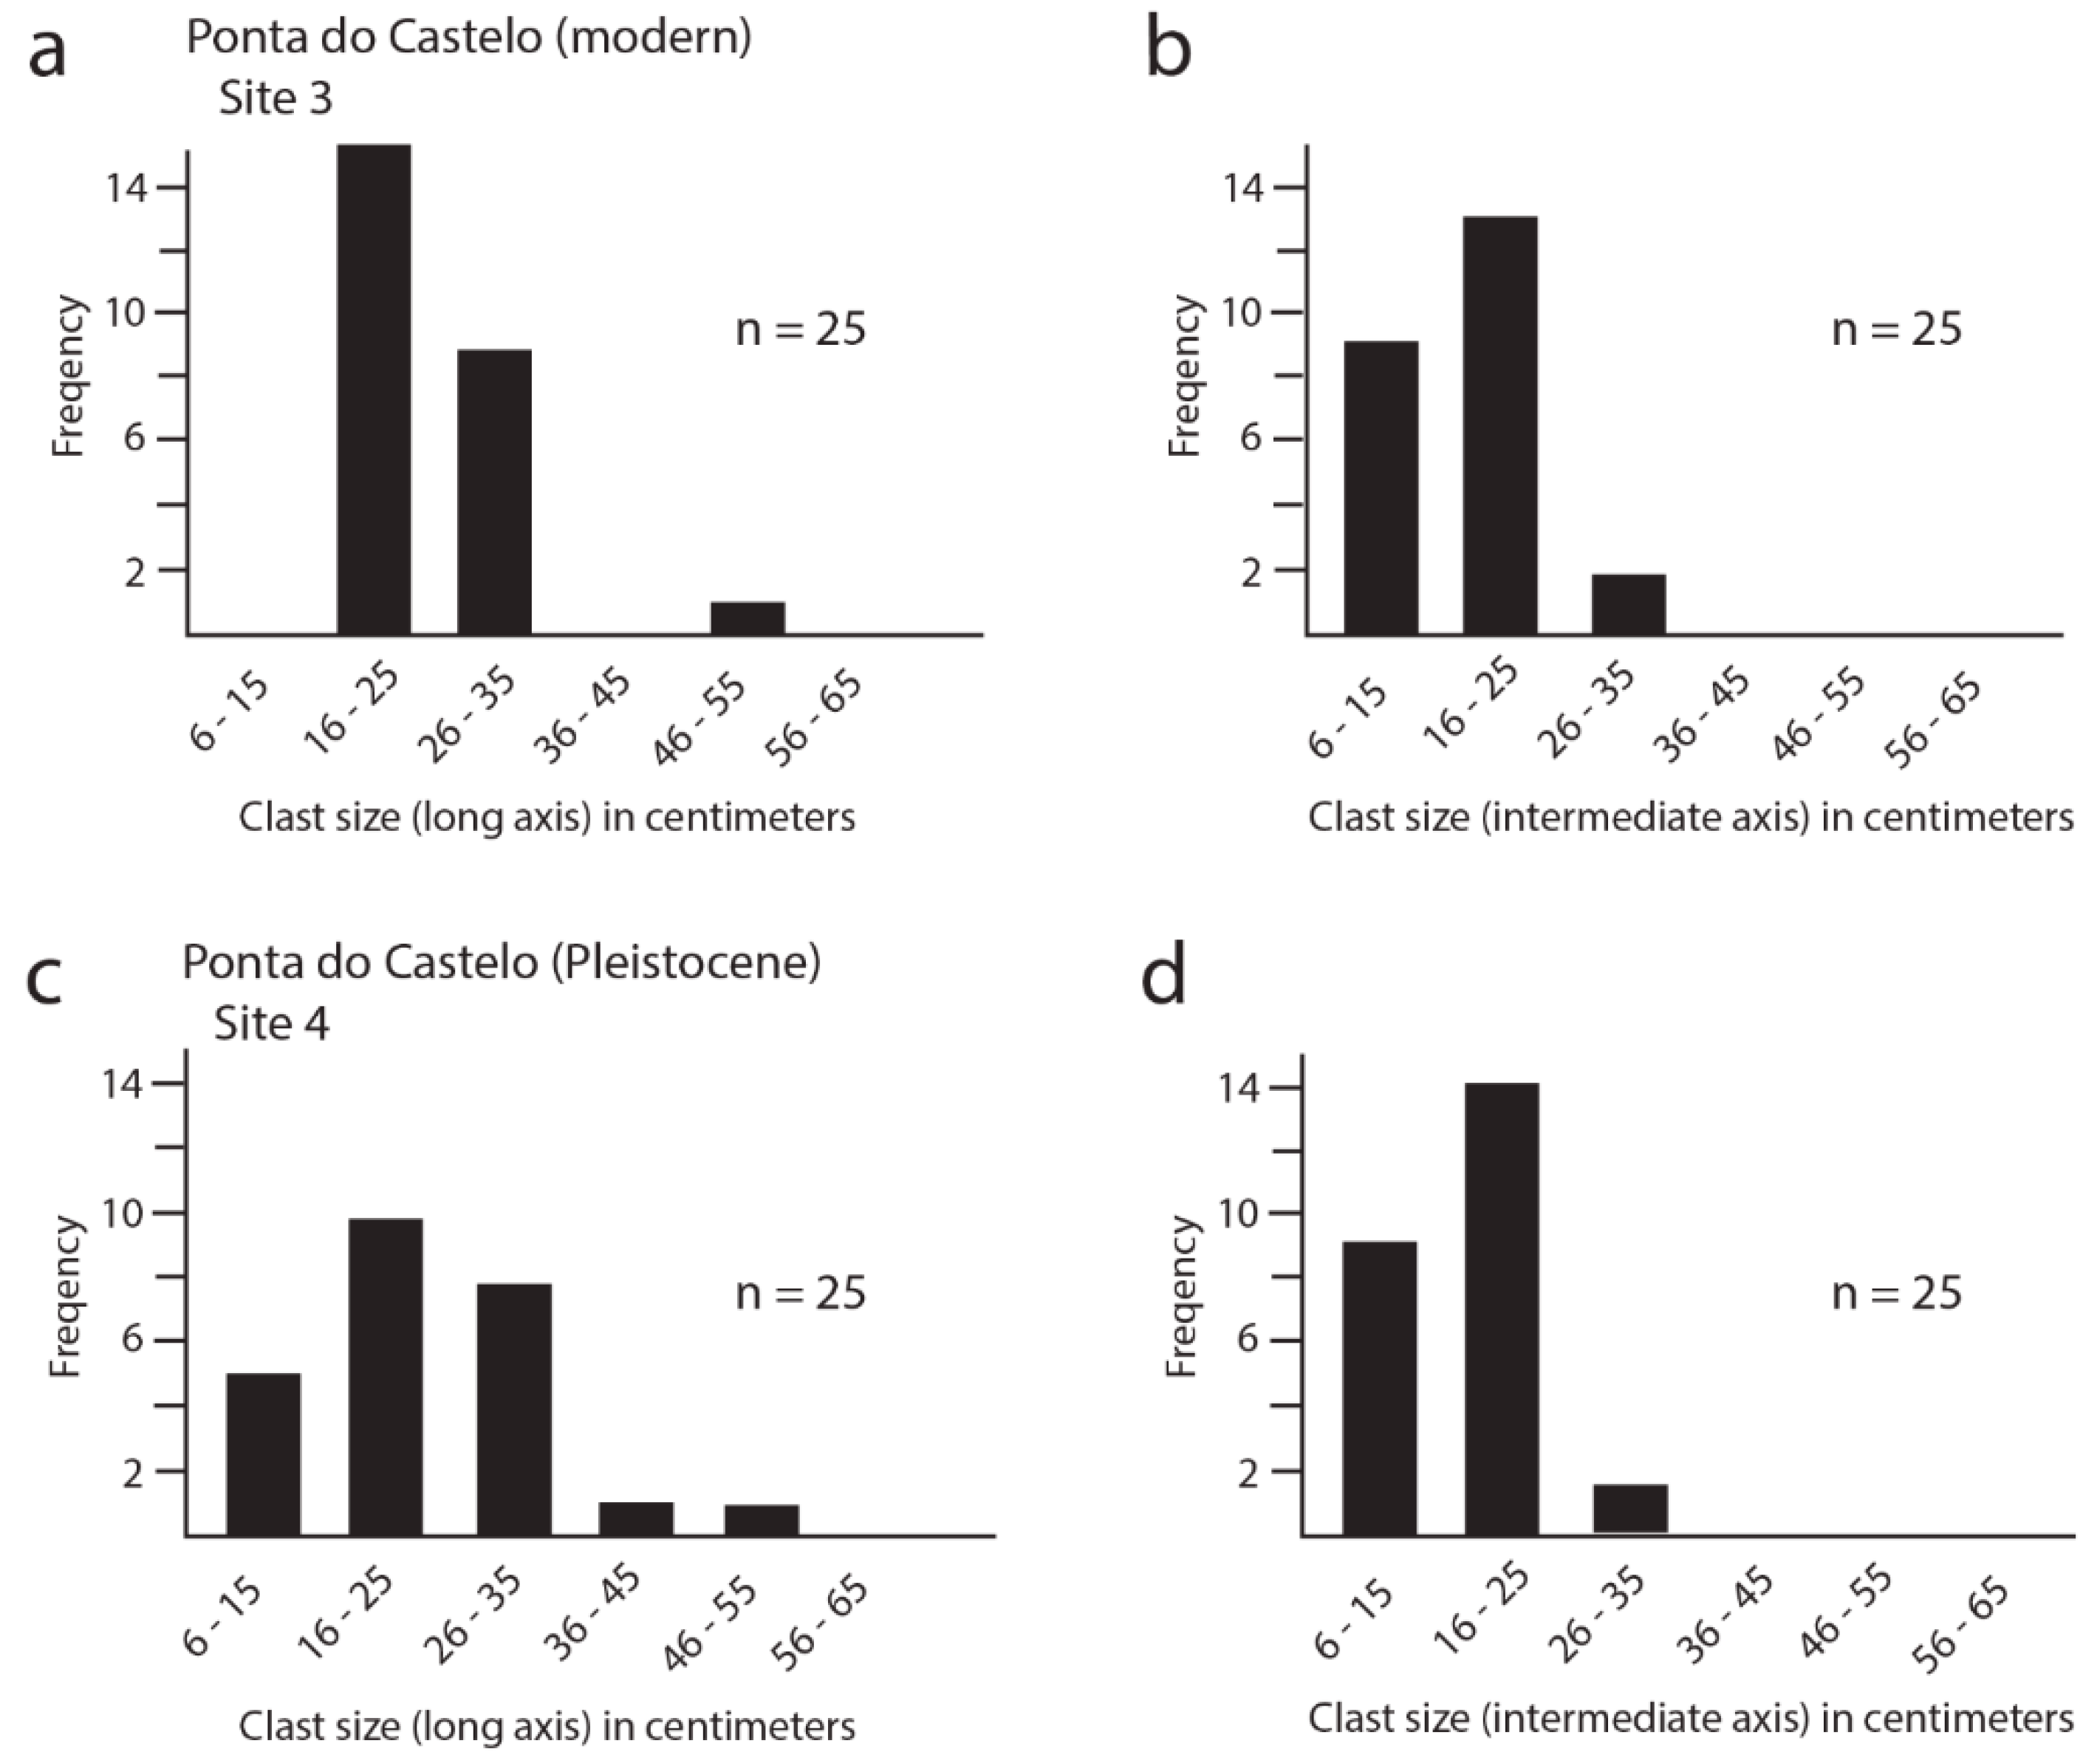
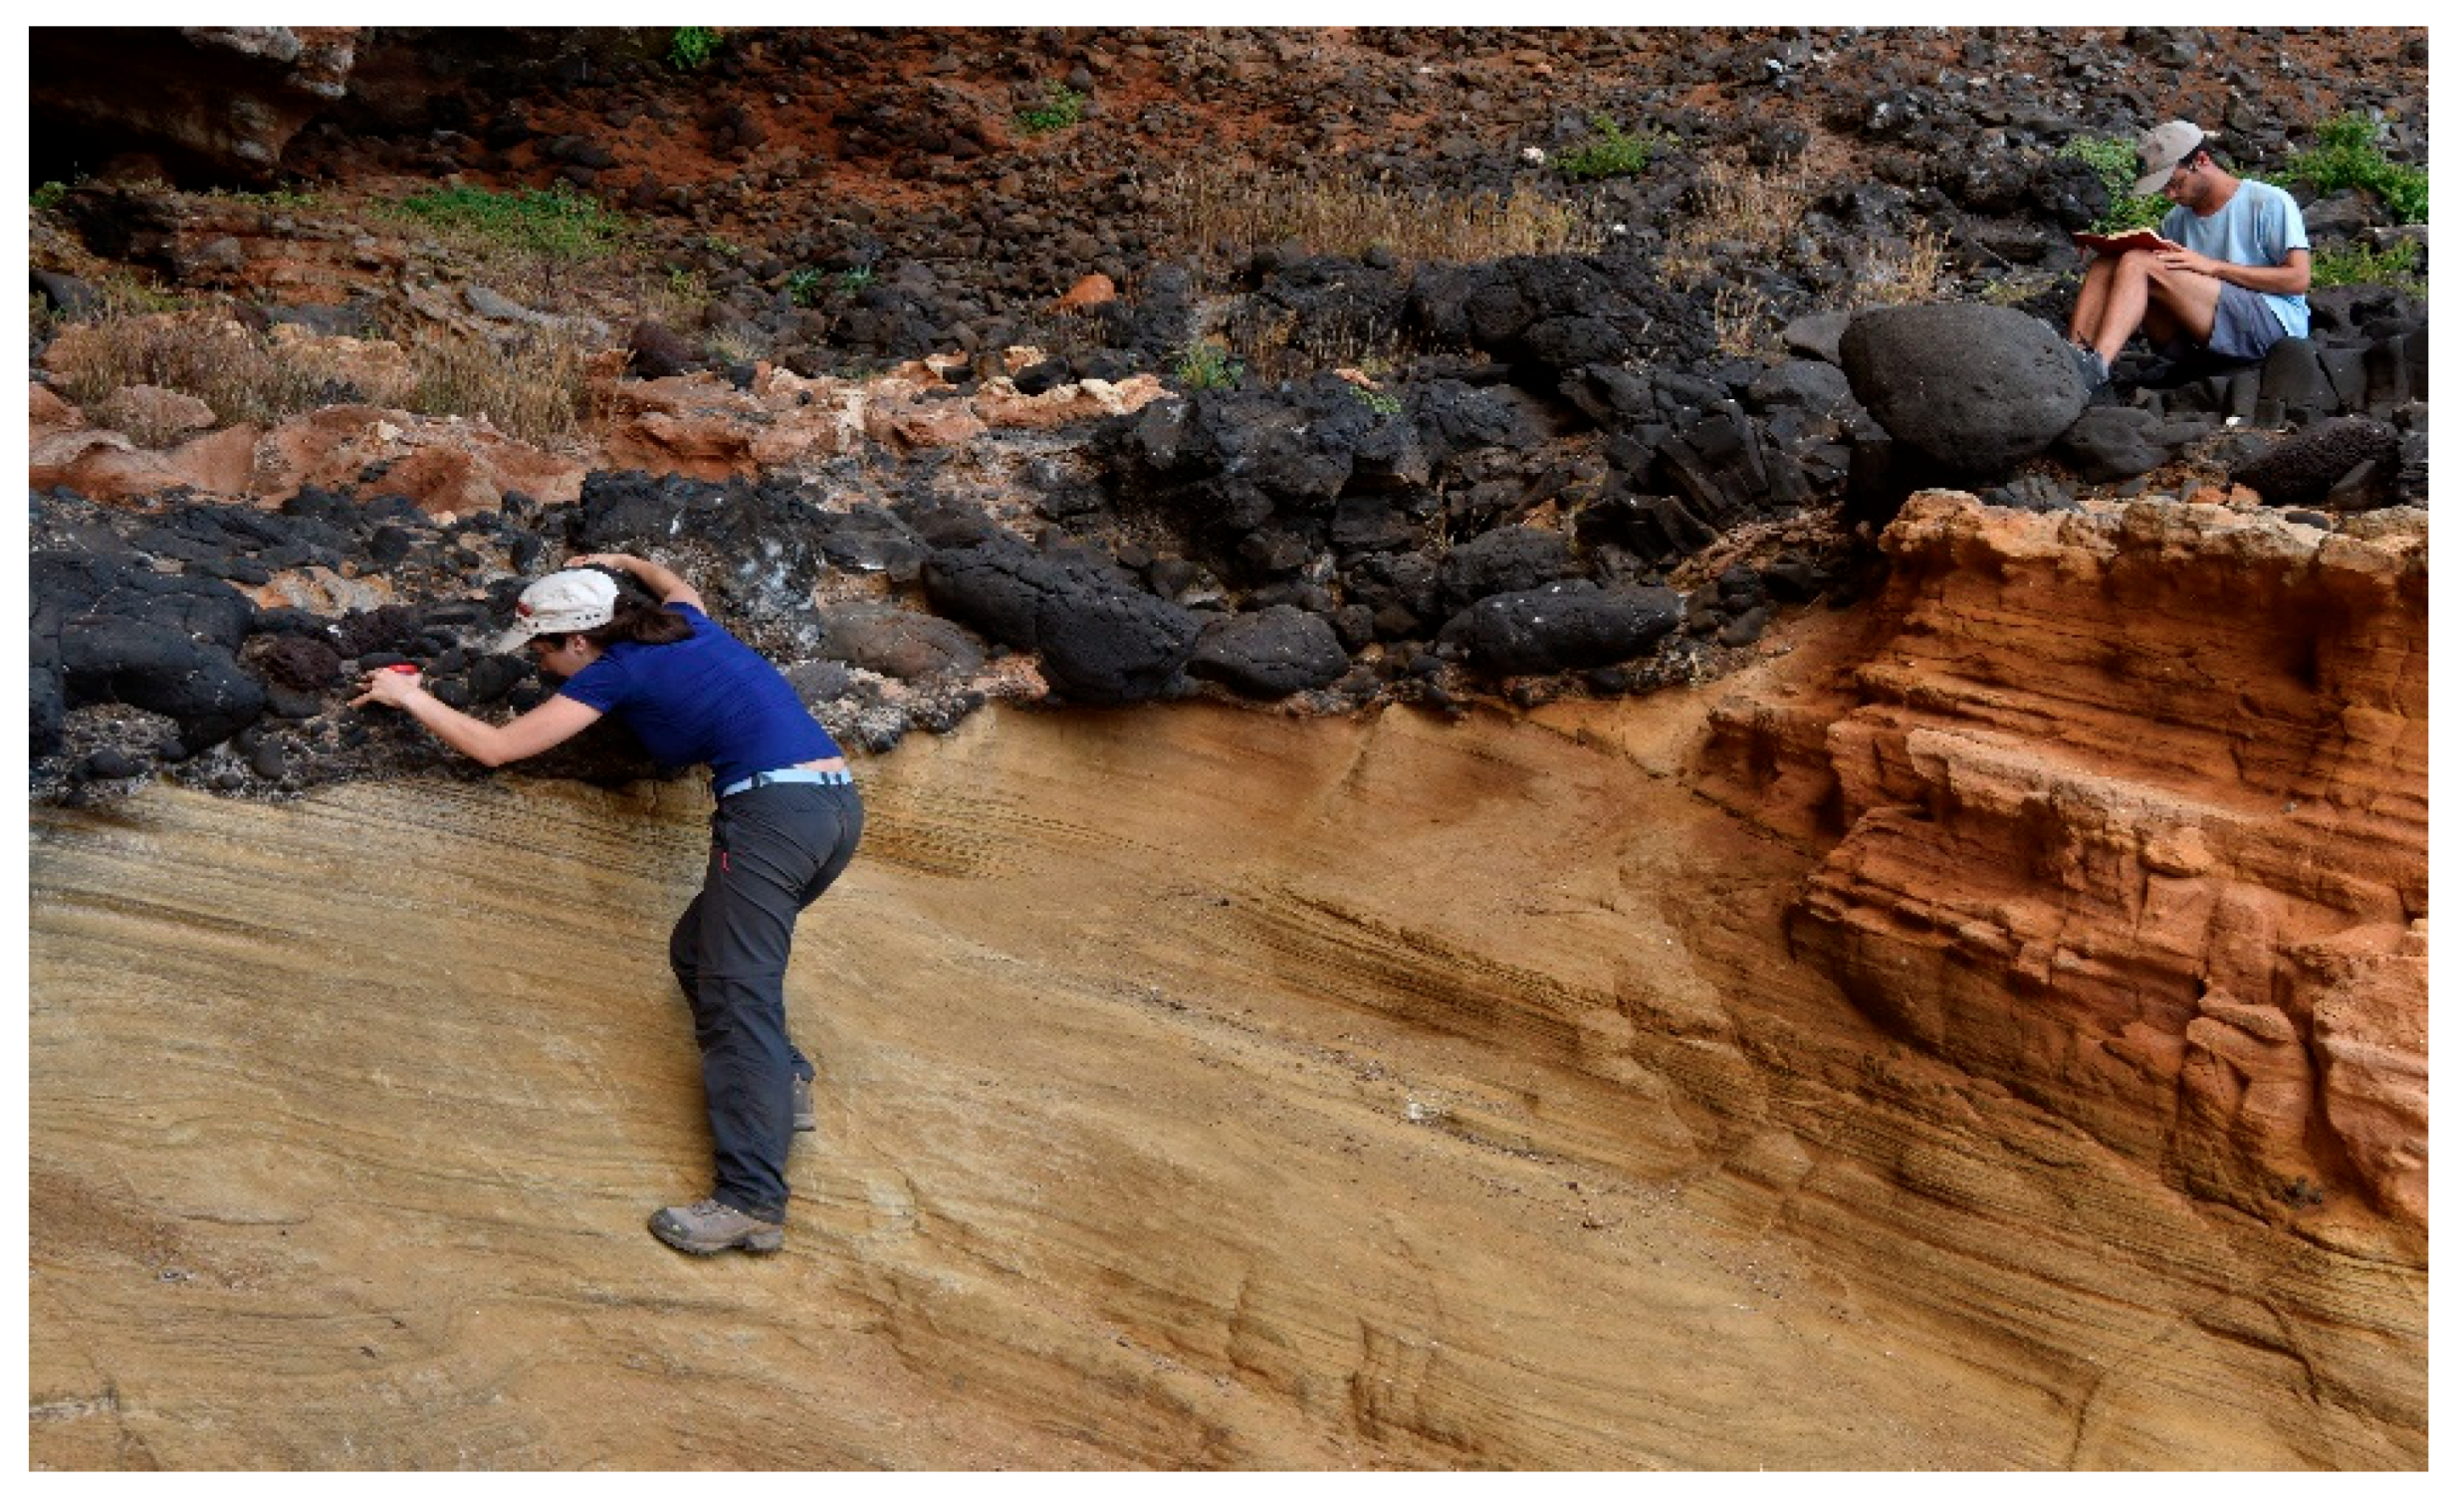
4.3. Ponta Do Castelo at the Island’s Southeast End

Located approximately 12 km farther east from Prainha (Figure 1b), the study site at Ponta do Castelo occupied the extreme southeast corner of Santa Maria Island. There, a modern CBD was entrained as a berm at mean sea level representing site 3, whereas the Pleistocene (MIS 5e) CBD was lodged above Pliocene strata at a height ~4.3 m amsl, representing site 4 (Figure 6).
The high exposure of this site to the main sea currents and the local morphology did not allow the deposition and maintenance of sand deposits. Raw data on clast size in three dimensions collected from the two parallel transects at this locality are available in Table 3 and Table 4.
Data points representing individual boulders grouped by transect were plotted on a set of Sneed-Folk triangular diagrams (Figure 4c,d), showing shape variations. Compared to the pair of Sneed-Folk diagrams from Prainha (Figure 4a,b), the Ponta do Castelo set was similar with regard to the slope of points angled to the lower-right corner (Figure 4c,d). The main difference was that the data set from the modern CBD at Ponta do Castelo (Figure 4c) was more diffuse throughout the same subdivisions represented by the modern CBD at Prainha (Figure 4a). A higher number of points registered in the top triangle marked a significant deviation in the Pleistocene (MIS 5e) CBD at Ponta do Castelo (Figure 4d) compared with Prainha (Figure 4b). Overall, there was a greater tendency towards equidimensional clasts in the Pleistocene (MIS 5e) CBD than in the modern CBD at Ponta do Castelo.
At Ponta do Castelo, variations in boulder size as a function of maximum and intermediate axis length were plotted using bar graphs (Figure 7), based on the raw data drawn from Table 3 and Table 4. The general congruence between the modern and Pleistocene (MIS 5e) CBDs at Ponta do Castelo was strong, especially compared to the marked difference in size variation observed between the modern and Pleistocene (MIS 5e) CBDs at Prainha (Figure 5). Of foremost significance, 50% of measurements for clast size through the long axis (Figure 7a) qualified as boulders based on the criteria of Wentworth [35]. The tendency towards elongated clasts in the modern CBD was shown by the higher frequency in the bin size 6–15 cm for the intermediate axis (Figure 7b), whereas that bin size was void with respect to the long axis (Figure 7a). Compared to the modern CBD, the Pleistocene CBD at Ponta do Castelo exhibited only a small shift of data points into the size interval of 6 to 15 cm, but otherwise was similar. The congruence between modern and Pleistocene CBDs at Ponta do Castelo was even more striking, taking into account clast size measured on the intermediate axes (Figure 7b,d).

4.4. Context of the Pleistocene Fauna at Ponta Do Castelo

The MIS 5e sedimentary sequence at Ponta do Castelo is extremely poor, with only two gastropod species reported: the limpet Patella aspera Röding, 1798, and the supra-littoral littorinid Tectarius striatus (P.P. King, 1832). Nevertheless, Ponta do Castelo is considered as a geosite of international relevance because of a set of specific conditions that allowed the preservation of a shelf tempestite deposit [21] for which a precise water depth could be estimated. Additionally, it provides a good proxy for island uplift/subsidence reconstructions [15,16].

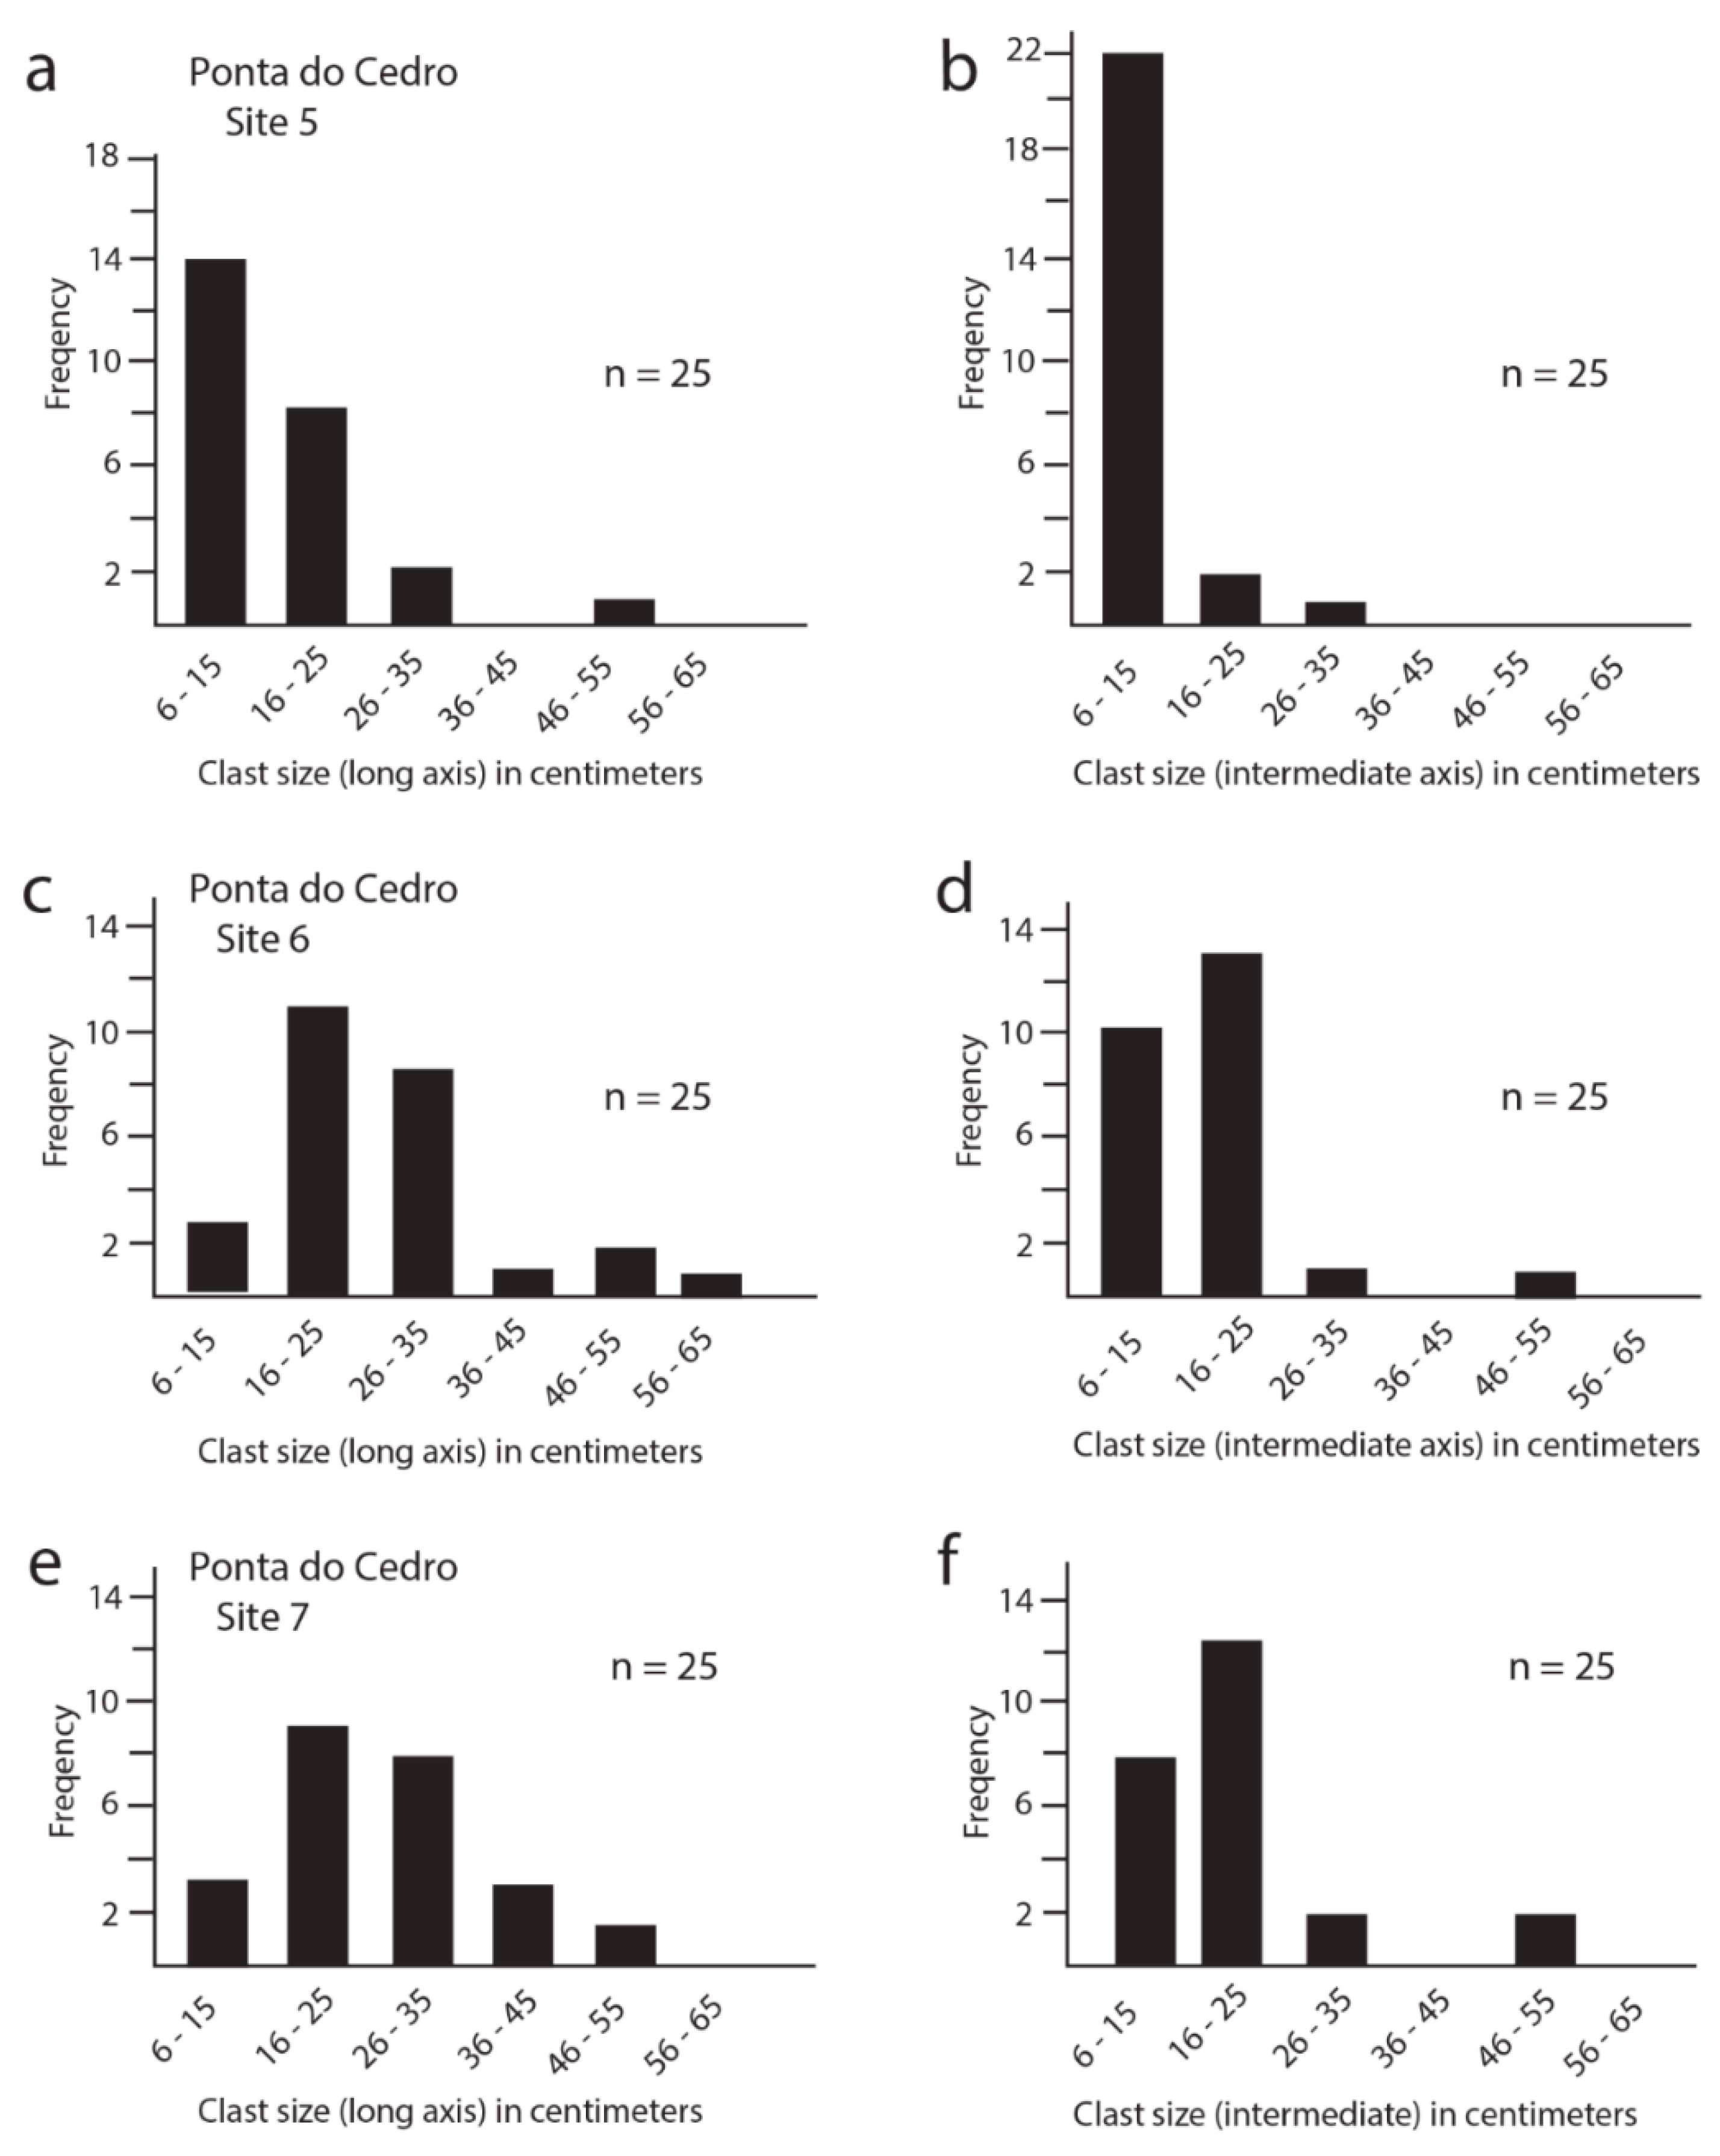
4.5. Ponta Do Cedro on the Island’s East Shore

Located 3.0 km north of Ponta do Castelo, the third study area treated herein occurred on the east shore of Santa Maria Island (Figure 1b). No modern CBDs occurred at this locality. However, a correlated line of Pleistocene CBDs might be traced laterally at elevations that ranged between ~2.65 m and ~9 m amsl, represented by study sites 5 to 7. Typically, the conglomerate at Ponta do Cedro was as much as ~0.75 m in thickness and laterally continuous (Figure 8, site 6).
Raw data on clast size in three dimensions collected from three study sites at this locality are available in Table 5, Table 6 and Table 7.
Overall, the distribution of clasts among the three Ponta do Cedro samples was highly consistent, with 68–78% of data points limited to the two central blocks within the triangular plot. The occurrence of data points in the top triangle, as well as the lower-right corner of the plot, were equally rare. Even so, there was a tendency for the data clusters to slope towards the right, indicative of a slight favorability towards elongated shapes. This trend was not nearly as strong as detected in modern CBDs at Prainha (Figure 4a) or Ponta do Castelo (Figure 4c), but entirely consistent with trends in the Pleistocene (MIS 5e) CBDs at Prainha (Figure 4b) or Ponta do Castelo (Figure 4d).
Variations in boulder size as a function of maximum and intermediate axis length were plotted using bar graphs (Figure 9), based on raw data drawn from Table 5, Table 6 and Table 7. The percentage of boulders in each Pleistocene sample was found to increase from the 20% (the more southern locality at site 5) to 48% (at site 6) up to the maximum value of 56% (the more northern locality at site 7). In each case, there was a marked shift in the abundance of clasts measured on the intermediate axis allocated to the size range between 6 and 15 cm (Figure 9b,d,f). Such a trend reinforced the impression that the Pleistocene (MIS 5e) basalt clasts conformed to a moderately oblong shape. Site 5 (Figure 9a,b) stood out among all the Pleistocene samples as most dominated by clasts defined by cobble size. In contrast, sites 6 and 7 were remarkably similar in their size distributions. Moreover, these samples were indistinguishable from the Pleistocene CBD sample at Ponta do Castelo, which also included a high concentration of boulders.

4.6. Context of the Pleistocene Fauna at Ponta Do Cedro

At Ponta do Cedro, preliminary work allowed us to report a total of 13 Last Interglacial mollusk taxa (12 gastropods and 1 bivalve species). As in other MIS 5e outcrops (e.g., Prainha, Vinha Velha, Lagoinhas), the thermophilic element was present through several species of Conus and of the Pisaniidae Gemophos viverratus (Kiener, 1834) (=Cantharus variegatus). Ponta do Cedro was classified as a fossiliferous geosite of regional relevance [15,16], a situation that would change in the near future, as a result of ongoing work.

4.7. Analysis of Calculated Storm-Wave Heights

A summary of key data was provided (Table 8), pertaining to average boulder size and maximum boulder size from the five Pleistocene (MIS 5e) transects and two modern transects as correlated with weight calculated on the basis of specific gravity for basalt, using the equations derived by Nott [37] and Pepe et al. [38]. These data were applied to estimate the wave heights required to transport boulders from the bedrock source in sea cliffs to their resting place, and variations in the results depended on the equations used.
First, we have discussed the estimates using Nott’s equation. The estimated wave height needed to move the largest boulder encountered in the Pleistocene (MIS 5e) transects (transect 6 at Ponta do Cedro) amounted to 6.1 m. The comparison between the Prainha and Ponta do Castelo modern and the Pleistocene (MIS 5e) CBD gave contrasting results; at Prainha, the average boulder size and weight and estimated average wave height were higher in the modern CBD in comparison with the Pleistocene CBD, whereas at Ponta do Castelo, it was the opposite trend. Moreover, the estimated maximum wave height required to shift boulders was very similar in all sites (ranging from 5.2 to 6.1 m) but Prainha (MIS 5e), where this value was about half (2.7 m). There was also a large difference between the largest boulders from Prainha (MIS 5e) and Ponta do Castelo (modern) CBDs, which were much smaller than those from the other sites (Table 8).
The results using the equation of Pepe et al. [38] were different from those using Nott’s equation [37], as the former consistently indicated that the maximum values for both the estimated average wave height (EAWH) and the estimated maximum wave height (EMWH) occurred at the MIS 5e transects (at Ponta do Castelo and Ponta do Cedro, in the case of the EAWH; at Ponta do Castelo, in the case of the EMWH; cf. Table 8).

5. Discussion

5.1. CBD: Tsunami Versus Storms, and the Use of Flawed Equations

A recently published field-test of the hydrodynamic equations, based on the Nott-Approach and their derivations [51,52,53,54], failed to validate estimations of the wave height from boulder dimensions and concluded that such equations were flawed because they yielded unrealistically large heights [55]. These authors also stated that the Nott-Approach analysis did not differentiate between storm and tsunami waves [55]. Such criticism might be valid, but acceptance in full threatens to nullify any attempt to engage in the quantification of CBDs from the geologic record. The Nott-Approach remains useful and is applied solely to compare the relative storminess imprint left in CBDs from different time-periods (MIS 5e vs. modern, as in our example), but located at the same site. For this particular case and question, it does not matter that equations may be flawed because the errors are uniformly carried through the exercise. What is important is that such equations function to detect consistent differences between the estimated wave heights for the past (MIS 5e) and for the modern situation. Moreover, they also provide the magnitude of possible differences.
CBDs should be portrayed as archives of extreme wave events, and their origin may be due to either storm waves or tsunamis. All CBDs studied in Santa Maria Island have no characteristics of tsunami deposits (e.g., imbrication of the boulders, erosive base (scour-and-fill features), rip-up clasts of the underlying substratum, downward-injected clastic dykes inside the palaeosol, traction figures; [56]), and we have, therefore, interpreted them as the result of storm waves.
The width of Santa Maria Island’s insular platform is larger in the N and W (although this is not apparent in the western shores, as a result of the uplift of the island) due to the higher offshore significant wave heights mainly coming from the NW, W, and N [24]; in contrast, at the south and eastern shores, the insular platform is quite narrow [25]. However, the most destructive storms (and, therefore, with higher wave heights) that impacted the Azores in recent times (and we assume a similar pattern in the past) were related to the passage of hurricanes. As these have a counter-clockwise rotation in the northern hemisphere, its passage most strongly affects precisely the southern and eastern shores of the islands, thus providing a possible explanation for the limited occurrence of CBD. Based on the historical record, recent hurricanes that struck the islands in the Azores Archipelago include “Hurricane 15” (1932), Hannah (1959), Debbie (1961), Fran (1973), Gordon (2006 and 2012), Gaston (2016), Ophelia (2017), and Lorenzo (2019). A direct hit on Santa Maria Island at 37° N entails a northward shift in the latitude of 10° and a longitudinal travel distance of roughly 2000 km. Hurricane frequency in the Azores is regarded as on the rise during the last 50 years [30]. The strong Pliocene sedimentary record on Santa Maria reflects some indication of hurricane activity on the southern coast [57], where the marine shelf is narrowest (Figure 1b). Moreover, the island’s geological record holds evidences of Pliocene deep wave interaction with the seafloor, reaching 50 m depth (Ponta do Castelo, [21]), thus suggesting a high likelihood of large-size boulder transport.
During the Last Interglacial, the average values for summer insolation were about 11% higher than those of today [58], the oceanic Polar Front was pushed north-westwards by the Gulf Stream warmer sea surface temperatures (SSTs) [59], and the summer position of the Azores High was forced E of its present location to around 35°N and 20–25°W, i.e., between the Azores and Iberia [60]. These oceanographic conditions induced a stronger North Atlantic storm track, shifted northward from its present location, and extended to the east [4]. Altogether, the storminess associated with tropical cyclones is expected to have been higher during the MIS 5e than today [1,3,61], as a result of the North Atlantic Subtropical High eastward shifting from its present location. However, the occurrence of “superstorms” during the Last Interglacial has been recently questioned by authors [62,63]. Therefore, probably, the higher storminess that most authors suggest for the Last Interglacial is related to a higher frequency of hurricanes and not necessarily with higher wave heights.

5.2. Comparison between Model Wave-Height Data and Inferred Modern Wave-Height

Our study yielded modern CBD estimated averages for wave heights varying from 2.8 to 3.6 m (using Nott’s Equation (1)) and from 2.0 to 2.9 (Pepe et al.’s Equation (2)) (Table 8). The former values were higher than the mean values presented by Rusu and Onea [31] for the archipelago, which varied from 2.23 to 2.55 m, a situation that other authors also reported [55], with Nott’s Equation consistently yielding wave height values higher than those registered by modern wave buoy. In contrast, the maximum calculated estimate wave heights of 5.5 m (Equation (1)) and 6.4 m (Equation (2)) (Table 8) did not get close to the lowest maximum value of Rusu and Onea [31] of 9.18 m.
The values obtained for the Pleistocene (MIS 5e) estimates were similar using both formulas, with wave height estimates varying from 1.3 to 2.9 m (Equation (1)) and from 1.3 to 3.3 m (Equation (2)); however, the maximum wave height estimates were quite different: 6.1 m (with Equation (1)) and 8.1 m (Equation (2)) (Table 8). These discrepancies highlighted the serious reserves [55], regarding the use of these formulas when solely targeted to the inference of modern (or past) wave heights, based on the dimensions/mass of the boulders.
Considering the general morphology of the sites, the nature of the boulders, and the processes that lead to its shaping, and albeit based on only two sites (Prainha and Ponta do Castelo; cf. Table 8), where it was possible to compare the modern CBD with the MIS 5e CBD, the results showed contrasting site-dependency. At Prainha, modern storminess was estimated to be higher during the Last Interglacial (independent of which equation was used), whereas at Ponta do Castelo, MIS 5e storminess should have been highly similar to the modern one (using Equation (1)) or higher (Equation (2)).
Further analysis is needed from other islands having similar MIS 5e/modern sites situation before sound conclusions might be reached regarding such a restrictive use of formulas, otherwise argued to be flawed [55]. Finally, a set of parallel profiles to the sea (at different heights) should be undertaken with respect to modern CBDs, as well as perpendicular profiles, in order to check for possible boulder size changes according to distance from present-day sea level. This analysis could also help to relate a mean boulder dimension to an average distance to the sea. An in-depth analysis of Pleistocene (MIS 5e) wave-cut surfaces will also enhance our knowledge of coastal retreat, average erosion rates, and wave activity.

5.3. Comparison with CBD Studies Elsewhere

A recent review [64] indicated that although significant studies have dealt with the Quaternary CBDs, only 21 papers studied the Neogene deposits (10 of Miocene and 9 of Pliocene age, plus 2 works dealing with both epochs), mostly due to their low preservation potential [64]. According to our literature survey, this was the first study on Pleistocene CBDs conducted on the Atlantic oceanic islands. Moreover, previous works using the same methodology dealt with the different rocky composition of the CBDs (limestone, rhyolite, and andesite) [17,18,19]; this paper being also the first to use the same kind of analyses in regard to basalt, which has higher specific gravity than any of the other rocks tested. Therefore, for similar size CBDs, basalt boulders will require a more energetic wave to be moved.

6. Conclusions

Limited to comparative results from modern and late Pleistocene (MIS 5e) boulder deposits on the southern and eastern shores of Santa Marina Island, the present study permitted the following conclusions:
1) Wave heights estimated on the basis of the largest modern boulders from CBDs on the modern south shore of Santa Maria Island indicated maximum values between 5.2 and 5.5 m (Equation (1)) and between 3.7 and 6.4 m (Equation (2)), which was 2 m higher than the expected average height experienced during winter storms, supporting the conclusions of [55] regarding the advice on the non-use of these formulas because of unrealistic, flawed estimates of wave heights;
2) Regarding storminess, our results were contradictory and did not allow any conclusion about possible higher storminess during the Last Interglacial when compared with the present-day, and recorded in the CBDs of Santa Maria Island;
3) Historical records of storm activity, coupled with the westerlies regime predominant in the Azores area, placed a stronger emphasis on the seasonal effect of winter storms that preferentially influence shore erosion on north-facing coasts. Although the historical record indicates that hurricane activity is less frequent in the islands, its erosional effect against a south- and eastern-facing shores must be considered. From the available data derived from CBDs and coastal geomorphology around Santa Maria Island, it was clear that wave action both today and approximately 125,000 years ago during MIS 5e remained consistently highest against the eastern and south-eastern coasts at Ponta do Cedro and Ponta do Castelo. These localities also correspond to areas where the island’s marine shelf is narrowest. Although the historical incidence of hurricanes passing through the Azores Archipelago is statistically low compared to the arrival of annual winter storms, the migration of hurricanes moving in a counter-clockwise rotation across the North Atlantic Ocean conforms to the evidence for excessive erosion rates in those districts beyond the capacity of winter storms.
The abundant fossil record on Santa Marina Island that makes accurate dating possible for the Late Pleistocene (MIS 5e) interglacial epoch is not available elsewhere in the Azores Archipelago, but future research on MIS 5e versus modern CBDs (whenever located in the same site) from other archipelagos is expected to apply the same formulaic techniques to extract information on storminess.

Author Contributions

Fieldwork in Santa Maria Island has occurred since 1999 by a large, multidisciplinary team led by S.P.Á. during the workshops “Palaeontology in Atlantic Islands”. Field data on CBDs was collected in July 2019 by A.C.R., L.B., and C.S.M., M.E.J. prepared the first draft of this contribution and drafted all figures, except for Figure 1 prepared by C.S.M., S.P.Á. was responsible for working out the mathematics related to storm hydrodynamics, produced all tables, and supplied all ground photos. S.P.Á. and C.S.M. summarized the literature on CBDs in the Azores region. In addition, C.S.M. contributed input on wave regimes and main directions within the study area. Authorship has been limited to those who contributed substantially to the work reported. All authors have read and agreed to the published version of the manuscript.

Funding

We thank Direcção Regional da Ciência e Tecnologia (Regional Government of the Azores), FCT (Fundação para a Ciência e a Tecnologia) of the Portuguese Government, and Câmara Municipal de Vila do Porto for financial support. S.P.Á. acknowledges his research contract (IF/00465/2015) funded by the Portuguese Science Foundation (FCT). A.C.R. was supported by a Post-doctoral grant SFRH/BPD/117810/2016 from FCT. L.B. acknowledges her Ph.D. Grant from FCT (SFRH/BD/135918/2018). C.S.M. acknowledges his Ph.D. Grant M3.1.a/F/100/2015 from Fundo Regional para a Ciência e Tecnologia (FRCT). This work was also supported by FEDER funds through the Operational Programme for Competitiveness Factors – COMPETE and by National Funds through FCT under the UID/BIA/50027/2013, POCI-01-0145-FEDER-006821, and under DRCT-M1.1.a/005/Funcionamento-C-/2016 (CIBIO-A) project from FRCT. This work was also supported by FEDER funds (in 85%) and by funds from the Regional Government of the Azores (15%) through Programa Operacional Açores 2020 under the project VRPROTO (ACORES-01-0145-FEDER-000078).

Acknowledgments

We acknowledge the field assistance of Manta Maria and Câmara Municipal de Vila do Porto. We are grateful to the organizers and participants of all editions of the international workshops “Palaeontology in Atlantic Islands”, who helped with fieldwork (2002–2019). We are grateful to Daniele Casalbore and two anonymous reviewers, whose comments greatly improved this manuscript.

Conflicts of Interest

The authors declare no conflict of interest.

References

  1. Hansen, J.; Sato, M.; Hearty, P.; Ruedy, R.; Kelley, M.; Masson-Delmotte, V.; Russell, G.; Tselioudis, G.; Cao, J.; Rignot, E.; et al. Ice melt, sea level rise and superstorms: Evidence from paleoclimate data, climate modeling, and modern observations that 2 °C global warming could be dangerous. Atmos. Chem. Phys. 2016, 16, 3761–3812. [Google Scholar] [CrossRef] [Green Version]
  2. Hearty, P.J.; Neumann, A.C. Rapid sea level and climate change at the close of the Last Interglaciation (MIS 5e): Evidence from the Bahama Islands. Quat. Sci. Rev. 2001, 20, 1881–1895. [Google Scholar] [CrossRef]
  3. Hearty, P.J.; Tormey, B.R. Sea-level change and super storms; geologic evidence from the last interglacial (MIS 5e) in the Bahamas and Bermuda offers ominous prospects for a warming Earth. Mar. Geol. 2017, 390, 347–365. [Google Scholar] [CrossRef]
  4. Ávila, S.P.; Melo, C.; Silva, L.; Ramalho, R.S.; Quatau, R.; Hipólito, A.; Cordeiro, R.; Rebelo, A.C.; Madeira, P.; Rovere, A.; et al. A review of the MIS 5e highstand deposits from Santa Maria Island (Azores, NE Atlantic): Palaeobiodiversity, palaeoecology and palaeobiogeography. Quat. Sci. Rev. 2015, 114, 126–148. [Google Scholar] [CrossRef]
  5. Naylor, L.A.; Stephenson, W.J. On the role of discontinuities in mediating shore platform erosion. Geomorphology 2011, 114, 89–100. [Google Scholar] [CrossRef]
  6. Borges, P. Ambientes Litorais nos Grupos Central e Oriental do Arquipélago dos Açores, Conteúdos e Dinâmica de Microescala. Ph.D. Thesis, Universidade dos Açores, Ponta Delgada, Portugal, 2003; pp. 1–412. [Google Scholar]
  7. Quartau, R.; Trenhaile, A.S.; Mitchell, N.C.; Tempera, F. Development of volcanic insular shelves: Insights from observations and modelling of Faial Island in the Azores Archipelago. Mar. Geol. 2010, 275, 66–83. [Google Scholar] [CrossRef]
  8. Ramalho, R.S.; Helffrich, G.; Madeira, J.; Cosca, M.; Thoas, C.; Quartau, R.; Hipólito, A.; Rovere, A.; Hearty, P.J.; Ávila, S.P. Emergence and evolution of Santa Maria Island (Azores)—The conundrum of uplifted islands revisited. Geol. Soc. Am. Bull. 2017, 129, 372–391. [Google Scholar] [CrossRef] [Green Version]
  9. Casalbore, D.; Romagnoli, C.; Bosman, A.; Anzidei, M.; Chiocci, F.L. Coastal hazard due to submarine canyons in active insular volcanoes: Examples from Lipari Island (southern Tyrrhenian Sea). J. Coast. Conserv. 2018, 22, 989–999. [Google Scholar] [CrossRef]
  10. Bosman, A.; Casalbore, D.; Romagnoli, C.; Chiocci, F.L. Formation of an ‘a’ā lava delta: Insights from time-lapse multibeam bathymetry and direct observations during the Stromboli 2007 eruption. Bull. Volc. 2014, 76, 838. [Google Scholar] [CrossRef]
  11. Rusu, L.; Soares, C.G. Wave energy assessments in the Azores islands. Renew. Energy 2012, 45, 183–196. [Google Scholar] [CrossRef]
  12. Ávila, S.P.; Melo, C.; Berning, B.; Sá, N.; Quartau, R.; Rijsdijk, K.F.; Ramalho, R.S.; Cordeiro, R.; De Sá, N.C.; Pimentel, A.; et al. Towards a ‘Sea-Level Sensitive’ dynamic model: Impact of island ontogeny and glacio-eustasy on global patterns of marine island biogeography. Biol. Rev. 2019, 94, 1116–1142. [Google Scholar]
  13. Melo, C.S.; Ramalho, R.S.; Quartau, R.; Hipólito, A.; Gil, A.; Borges, P.A.; Cardigos, F.; Ávila, S.P.; Madeira, J.; Gaspar, J.L. Genesis and morphological evolution of coastal talus-platforms (fajãs) with lagoons: The case study of the newly-formed Fajã dos Milagres (Corvo Island, Azores). Geomorphology 2018, 310, 138–152. [Google Scholar] [CrossRef] [Green Version]
  14. Madeira, P.; Kroh, A.; Cordeiro, R.; Meireles, R.; Ávila, S.P. The fossil echinoids of Santa Maria island, Azores (Northern Atlantic Ocean). Acta Geol Pol 2011, 61, 243–264. [Google Scholar]
  15. Ávila, S.P.; Cachão, M.; Ramalho, R.S.; Botelho, A.Z.; Madeira, P.; Rebelo, A.C.; Cordeiro, R.; Melo, C.; Hipólito, A.; Ventura, M.A.; et al. The Palaeontological heritage of Santa Maria Island (Azores: NE Atlantic): A re-evaluation of geosites in GeoPark Azores and their use in geotourism. Geoheritage 2016, 8, 155–171. [Google Scholar] [CrossRef]
  16. Raposo, V.; Melo, C.; Ventura, M.A.; Câmara, R.; Tavares, J.; Johnson, M.E.; Ávila, S.P. Comparing methods of evaluation of geosites: The fossiliferous outcrops of Santa Maria Island (Azores: NE Atlantic) as a case-study for sustainable Island tourism. Sustainability 2018, 10, 3596. [Google Scholar] [CrossRef] [Green Version]
  17. Johnson, M.E.; Ledesma-Vázquez, J.; Guardado-France, R. Coastal Geomorphology of a Holocene Hurricane Deposit on a Pleistocene Marine Terrace from Isla Carmen (Baja California Sur, Mexico). J. Mar. Sci. Eng. 2018, 6, 108. [Google Scholar] [CrossRef] [Green Version]
  18. Johnson, M.E.; Guardado-France, R.; Johnson, E.M.; Ledesma-Vázquez, J. Geomorphology of a Holocene Hurricane Deposit Eroded from Rhyolite Sea Cliffs on Ensenada Almeja (Baja California Sur, Mexico). J. Mar. Sci. Eng. 2019, 7, 193. [Google Scholar] [CrossRef] [Green Version]
  19. Johnson, E.M.; Johnson, E.M.; Guardado-France, R.; Ledesma-Vázquez, J. Holocene Hurricane Deposits Eroded as Coastal Barriers from Andesite Sea Cliffs at Puerto Escondido (Baja California Sur, Mexico). J. Mar. Sci. Eng. 2020, 8, 75. [Google Scholar] [CrossRef] [Green Version]
  20. Vogt, P.R.; Jung, W.-P. The “Azores Geosyndrome” and plate tectonics: Research history, synthesis, and unsolved puzzles. In Volcanoes of the Azores; Kueppers, U., Beier, C., Eds.; Active Volcanoes of the World Series; Springer: Berlin/Heidelberg, Germany, 2018; pp. 27–56. [Google Scholar]
  21. Meireles, R.P.; Quartau, R.; Ramalho, R.; Madeira, J.; Rebelo, A.C.; Zanon, V.; Ávila, S.P. Depositional processes on oceanic island shelves—Evidence from storm-generated Neogene deposits from the mid-North Atlantic. Sedimentology 2013, 60, 1769–1785. [Google Scholar] [CrossRef]
  22. Ávila, S.P.; Ramalho, R.; Habermann, J.; Quartau, R.; Kroh, A.; Berning, B.; Johnson, M.; Kirby, M.; Zanon, V.; Titschack, J.; et al. Palaeoecology, taphonomy, and preservation of a lower Pliocene shell bed (coquina) from a volcanic oceanic island (Santa Maria Island, Azores, NE Atlantic Ocean). Palaeogeogr. Palaeoclimatol. Palaeoecol. 2015, 430, 57–73. [Google Scholar] [CrossRef] [Green Version]
  23. Ávila, S.P.; Ramalho, R.; Habermann, J.; Titschack, J. The marine fossil record at Santa Maria Island (Azores). In Volcanoes of the Azores; Kueppers, U., Beier, C., Eds.; Active Volcanoes of the World Series; Springer: Berlin/Heidelberg, Germany, 2018; pp. 155–196. [Google Scholar]
  24. Ricchi, A.; Quartau, R.; Ramalho, R.S.; Romagnoli, C.; Casalbore, D.; Zhao, Z. Imprints of volcanic, erosional, depositional, tectonic and mass-wasting processes in the morphology of Santa Maria insular shelf. Mar. Geol. 2020, 424, 106163. [Google Scholar] [CrossRef]
  25. Ricchi, A.; Quartau, R.; Ramalho, R.S.; Romagnoli, C.; Casalbore, D.; da Cruz, J.V.; Fradique, C.R.; Vinhas, A. Marine terrace development on reefless volcanic islands: New insights from high-resolution marine geophysical data offshore Santa Maria Island (Azores Archipelago). Mar. Geol. 2018, 406, 42–56. [Google Scholar] [CrossRef] [Green Version]
  26. Lourenço, N.; Miranda, J.M.; Luis, J.F.; Ribeiro, A.; Mendes Victor, L.A.; Madeira, J.; Needham, H.D. Morpho-tectonic analysis of the Azores volcanic plateau from a new bathymetric compilation of the area. Mar. Geophys. Res. 1998, 20, 141–156. [Google Scholar] [CrossRef]
  27. Madeira, J.; Ribeiro, A. Geodynamic models for the Azores triple junction: A contribution from tectonics. Tectonophysics 1990, 184, 405–415. [Google Scholar] [CrossRef]
  28. Madeira, J. Estudos de Neotectónica nas Ilhas do Faial, Pico e S. Jorge: Uma Contribuição para o Conhecimento Geodinâmico da Junção Tripla dos Açores. Ph.D. Thesis, Lisbon University, Lisbon, Portugal, 1998; pp. 1–481. [Google Scholar]
  29. Brito de Azevedo, E. Condicionantes dinâmicas do clima do Arquipélago dos Açores: Elementos para o seu estudo. Açoreana 2001, 9, 309–317. [Google Scholar]
  30. Andrade, C.; Trigo, R.M.; Freitas, M.C.; Callego, M.C.; Borges, P.; Ramos, A.M. Comparing historic records of storm frequency and the North Atlantic Ocillation (NAO) chronology for the Azores region. Holocene 2008, 18, 745–754. [Google Scholar] [CrossRef] [Green Version]
  31. Rusu, E.; Onea, F. Estimation of the wave energy conversion efficiency in the Atlantic Ocean close to the European islands. Renew. Energy 2016, 85, 687–703. [Google Scholar] [CrossRef]
  32. Gould, W.J. Physical oceanography of the Azores front. Prog. Oceanogr. 1985, 14, 167. [Google Scholar] [CrossRef]
  33. Klein, B.; Siedler, G. On the origin of the Azores Current. J. Geophys. Res. 1989, 94, 6159–6168. [Google Scholar] [CrossRef] [Green Version]
  34. Quartau, R. The Insular Shelf of Faial: Morphological and Sedimentary Evolution. Ph.D. Thesis, Universidade de Aveiro, Aveiro, Portugal, 2007; pp. 1–326. [Google Scholar]
  35. Wentworth, C.K. A scale of grade and class terms for clastic sediments. J. Geol. 1922, 27, 377–392. [Google Scholar] [CrossRef]
  36. Sneed, E.D.; Folk, R.L. Pebbles in the lower Colorado River of Texas: A study in particle morphogenesis. J. Mar. Geol. 1958, 66, 114–150. [Google Scholar] [CrossRef]
  37. Nott, J. Waves, coastal bolder deposits and the importance of pre-transport setting. Earth Planet. Sci. Lett. 2003, 210, 269–276. [Google Scholar] [CrossRef]
  38. Pepe, F.; Corradino, M.; Parrino, N.; Besio, G.; Presti, V.L.; Renda, P.; Calcagnile, L.; Quarta, G.; Sulli, A.; Antonioli, F. Boulder coastal deposits at Favignana Island rocky coast (Sicily, Italy): Litho-structural and hydrodynamic control. Geomorphology 2018, 303, 191–209. [Google Scholar] [CrossRef]
  39. Nandasena, N.A.K.; Paris, R.; Tanaka, N. Reassessment of hydrodynamic equations: Minimum flow velocity to initiate boulder transport by high energy events (storms, tsunamis). Mar. Geol. 2011, 281, 70–84. [Google Scholar] [CrossRef]
  40. Ávila, S.P.; Rebelo, A.; Medeiros, A.; Melo, C.; Gomes, C.; Bagaço, L.; Madeira, P.; Borges, P.A.; Monteiro, P.; Cordeiro, R.; et al. Os Fósseis de Santa Maria (Açores). 1. A Jazida da Prainha; OVGA e Observatório Vulcanológico e Geotérmico dos Açores: Lagoa, Portugal, 2010; pp. 1–103. [Google Scholar]
  41. Zbyszewsky, G.; Ferreira, O.; da, V. La faune marine des basses plages quaternaires de Praia et Prainha dans l’ile de Santa Maria (Açores). Comunicações dos Serviços Geológicos de Portugal 1961, 45, 467–478. [Google Scholar]
  42. Zbyszewsky, G.; Ferreira, O.; da, V. Étude géologique de l’île de Santa Maria (Açores). Comunicações dos Serviços Geológicos de Portugal 1962, 46, 209–245. [Google Scholar]
  43. García-Talavera, F. Fauna tropical en el Neotirreniense de Santa Maria (I. Azores). Lavori S.I.M. 1990, 23, 439–443. [Google Scholar]
  44. Ávila, S.P.; Amen, R.; Azevedo, J.M.N.; Cachão, M.; García-Talavera, F. Checklist of the Pleistocene marine molluscs of Prainha and Lagoinhas (Santa Maria Island, Azores). Açoreana 2002, 9, 343–370. [Google Scholar]
  45. Ávila, S.P.; Madeira, P.; Mendes, N.; Rebelo, A.; Medeiros, A.; Gomes, C.; García-Talavera, F.; Marques da Silva, C.; Cachão, M.; Martins, A.M.F. Luria lurida (Mollusca: Gastropoda), a new record for the Pleistocene of Santa Maria (Azores, Portugal). Arquipélago 2007, 24, 53–56. [Google Scholar]
  46. Ávila, S.P.; Madeira, P.; Zazo, C.; Zazo Kroh, A.; Kirby, M.; Silva, C.M.; da Cachão, M.; Martins, A.M.F. Palaeocology of the Pleistocene (MIS 5.5) outcrops of Santa Maria Island (Azores) in a complex oceanic tectonic setting. Palaeogeogr. Palaeoclimatol. Palaeoecol. 2009, 274, 18–31. [Google Scholar] [CrossRef]
  47. Ávila, S.P.; Silva CM da Schiebel, R.; Cecca, F.; Backeljau, T.; Martins, A.M.F. How did they get here? Palaeobiogeography of the Pleistocene marine molluscs of the Azores. Bull. Geol. Soc. Fr. 2009, 180, 295–307. [Google Scholar] [CrossRef]
  48. Amen, R.G.; Neto, A.I.; Azevedo, J.M.N. Coralline-algal framework in the Quaternary of Prainha (Santa Maria Island, Azores). Rev. Española Micropaleontol. 2005, 37, 63–70. [Google Scholar]
  49. Ávila, S.P.; Azevedo, J.M.N.; Madeira, P.; Cordeiro, R.; Melo, C.S.; Baptista, L.; Torres, P.; Johnson, M.E.; Vullo, R. Pliocene and Late Pleistocene actinopterygian fishes from Santa Maria Island, Azores (NE Atlantic Ocean): Palaeoecological and palaeobiogeographical implications. Geol. Mag. 2020. [Google Scholar] [CrossRef]
  50. Ávila, S.P.; Cordeiro, R.; Rodrigues, R.; Rebelo, A.C.; Melo, C.; Madeira, P.; Pyenson, N.D. Fossil Mysticeti from the Pleistocene of Santa Maria Island, Azores (NE Atlantic Ocean), and the prevalence of fossil cetaceans on oceanic islands. Palaeontol. Electron. 2015, 18.2.27A, 1–12. [Google Scholar]
  51. Barbano, M.S.; Pirrotta, C.; Gerardi, F. Large boulders along the south-eastern Ionian coast of Sicily: Storm or tsunami deposits? Mar. Geol. 2010, 275, 140–154. [Google Scholar] [CrossRef]
  52. Benner, R.; Browne, T.; Brückner, H.; Kelletat, D.; Scheffers, A. Boulder transport by waves: Progress in physical modelling. Z. Geomorphol. 2010, 4 (Suppl. 3), 127–146. [Google Scholar] [CrossRef]
  53. Deguara, J.C.; Gauci, R. Evidence of extreme wave events from boulder deposits on the south-east coast of Malta (Central Mediterranean). Nat. Hazards 2017, 86, 543–568. [Google Scholar] [CrossRef]
  54. Engel, M.; May, S.M. Bonaire’s boulder fields revisited: Evidence for Holocene tsunami impact on the Leeward Antilles. Quat. Sci. Rev. 2012, 54, 126–141. [Google Scholar] [CrossRef]
  55. Cox, R.; Ardhuin, F.; Dias, F.; Autret, R.; Beisiegel, N.; Earlie, C.S.; Herterich, J.G.; Kennedy, A.; Paris, R.; Raby, A.; et al. Systematic review shows that work done by storm waves can be misinterpreted as tsunami-related because commonly used hydrodynamic equations are flawed. Front. Mar. Sci. 2020, 7, 4. [Google Scholar] [CrossRef]
  56. Paris, R.; Ramalho, R.S.; Madeira, J.; Ávila, S.P.; May, S.M.; Rixhon, G.; Engel, M.; Brückner, H.; Herzog, M.; Schukraft, G.; et al. Mega-tsunami conglomerates and flank collapses of ocean island volcanoes. Mar. Geol. 2018, 395, 168–187. [Google Scholar] [CrossRef] [Green Version]
  57. Johnson, M.E.; Uchman, A.; Costa, P.J.M.; Ramalho, R.S.; Ávila, S.P. Intense hurricane transports sand onshore: Example from the Plioclene Malbusca section on Stanta Maria Island (Azores, Portugal). Mar. Geol. 2017, 385, 244–249. [Google Scholar] [CrossRef] [Green Version]
  58. CAPE. Last Interglacial, Project Members. Last Interglacial Arctic warmth confirms polar amplification of climate change. Quat. Sci. Rev. 2006, 25, 1383–1400. [Google Scholar] [CrossRef]
  59. Knudsen, K.L.; Seidenkrantz, M.-S.; Kristensen, P. Last interglacial and early glacial circulation in the Northern North Atlantic Ocean. Quat. Res. 2002, 58, 22–26. [Google Scholar] [CrossRef] [Green Version]
  60. Kaspar, F.; Spangehl, T.; Cubasch, U. Northern hemisphere winter storm tracks of the Eemian interglacial and the last glacial inception. Clim. Past 2007, 3, 181–192. [Google Scholar] [CrossRef] [Green Version]
  61. Hearty, P.J. Boulder deposits from large waves during the last interglaciation on North Eleuthera Island, Bahamas. Quat. Res. 1997, 48, 326–338. [Google Scholar] [CrossRef]
  62. Engel, M.; Kindler, P.; Godefroid, F. Speculations on superstorms—Interactive comment on “Ice melt, sea level rise and superstorms: Evidence from paleoclimate data, climate modeling, and modern observations that 2 °C global warming is highly dangerous” by J. Hansen et al. Atmos. Chem. Phys. 2015, 15, C6270–C6281. [Google Scholar]
  63. Rovere, A.; Casella, E.; Harris, D.L.; Lorscheid, T.; Nandasena, N.A.K.; Dyer, B.; Sandstrom, M.R.; Stocchi, P.; D’Andrea, W.J.; Raymo, M.E. Giant boulders and Last Interglacial storm intensity in the North Atlantic. Proc. Natl. Acad. Sci. USA 2017, 114, 12144–12149. [Google Scholar] [CrossRef] [Green Version]
  64. Ruban, D.A. Coastal boulder deposits of the Neogene world: A synopsis. J. Mar. Sci. Eng. 2019, 7, 446. [Google Scholar] [CrossRef] [Green Version]
Figure 1. Maps covering the Azores Archipelago in the NE Atlantic Ocean: (a) Geographic and geotectonic setting of the Azores Archipelago (modified from [26,27,28]). NA—North American plate; Eu—Eurasian plate; Nu—Nubian (African) plate; MAR – Mid Atlantic Ridge; TR—Terceira Rift (grey area); EAFZ—East Azores Fracture Zone; GF—Gloria Fault; (b) Topography/bathymetry of Santa Maria Island. Black stars mark the studied sites. The bathymetric data was extracted from GEBCO 2019 (https://www.gebco.net); subaerial topography was generated from a 1:5000 scale digital altimetric database.
Jmse 08 00386 g001
Figure 2. Modern coastal boulder deposit (CBD) eroded from adjacent basalt sea cliffs at Prainha (site 1). Note that some boulders on the far inland end of the littoral boulder cordon were embedded within the sand.
Jmse 08 00386 g002
Figure 3. Pleistocene (MIS 5e, Marine Isotope Substage 5e) marine sequence, 2.5 m above the modern CBD at Prainha (site 2). Note that, as modern CBD, Pleistocene boulders were covered by Pleistocene fossiliferous sands.
Jmse 08 00386 g003
Figure 4. Set of triangular Sneed-Folk diagrams used to show variations in boulder and cobble shapes compared between modern and Pleistocene (MIS 5e) deposits. (a,b): Prainha. (c,d): Ponta do Castelo. (eg): Ponta do Cedro. (a,c): modern CBD at Prainha and Ponta do Castelo, respectively. (b,d), (eg): Pleistocene (MIS 5e) CBD at Prainha, Ponta do Castelo, and Ponta do Cedro, respectively.
Jmse 08 00386 g004
Figure 5. Bar graphs used to appraise variations in the long and intermediate axes on basalt clasts from modern and Pleistocene CBDs at Prainha; (a) Long-axis length from clasts in the modern CBD; (b) Intermediate-axis length from clasts in the modern CBD; (c) Long-axis length from clasts in the Pleistocene CBD; (d) Intermediate-axis length from clasts in the Pleistocene CBD.
Jmse 08 00386 g005
Figure 6. Modern coastal boulder deposit (CBD) eroded from basalt at Ponta do Castelo (site 3, see map in Figure 1b) and overlying Pleistocene CBD preserved at a level 4.3 m above mean sea level at the same locality (sites 4 and 5).
Jmse 08 00386 g006
Figure 7. Bar graphs used to appraise variations in the long and intermediate axes on basalt clasts from modern and Pleistocene CBDs at Ponta do Castelo; (a) Long-axis length from clasts in the modern CBD; (b) Intermediate-axis length from clasts in the modern CBD; (c) Long-axis length from clasts in the Pleistocene CBD; (d) Intermediate-axis length from clasts in the Pleistocene CBD.
Jmse 08 00386 g007
Figure 8. Pleistocene (MIS 5e) conglomerate 9 m above mean sea level at Ponta do Cedro (site 6).
Jmse 08 00386 g008
Figure 9. Bar graphs used to appraise variations in the long and intermediate axes on basalt clasts from three sites of correlated Pleistocene CBDs at Ponta do Cedro; (a) Long-axis length from clasts at site 5; (b) Intermediate-axis length from clasts at site 5; (c) Long-axis length from clasts at site 6; (d) Intermediate-axis length from clasts at site 6; (e) Long-axis length from clasts at site 7; (f) Intermediate-axis length from clasts at site 7.
Jmse 08 00386 g009
Table 1. Quantification of boulder size, volume, and estimated weight from the modern coastal boulder deposit at site 1 at Prainha, on the southern coast of Santa Maria Island (see Figure 1b). The standard density of basalt at 3.0 gm/cm3 was applied uniformly in order to calculate wave height for each boulder. EWH: estimated wave height (in meters), calculated according to equations from Nott [37] and Pepe et al. [38]. See the methods Section 3.2. (hydraulic model).
SampleLong Axis (cm)Intermediate Axis (cm)Short Axis (cm)Volume (cm3)Adjust. to 75%Weight (kg)EWH Nott [37]EWH Pepe et al. [38]
128.024.56.0411630879.33.11.5
232.024.08.06144460813.83.52.0
330.023.010.57245543416.33.32.6
426.017.58.0364027308.22.82.0
524.518.59.0407930599.22.72.2
628.024.58.05488411612.33.12.0
748.023.019.020,97615,73247.25.24.7
844.037.08.013,024976829.34.82.0
943.029.08.09976748222.44.72.0
1038.025.07.57125534416.04.11.8
1139.527.011.011,732879926.44.32.7
1231.023.06.54635347610.43.41.6
1323.018.58.5361727138.12.52.1
1431.028.012.010,416781223.43.43.0
1528.020.59.05166387511.63.12.2
1634.525.513.011,437857825.73.83.2
1732.026.09.07488561616.83.52.2
1826.017.016.07072530415.92.83.9
1924.519.08.0372427938.42.72.0
2043.027.026.030,18622,64067.94.76.4
2142.034.016.022,84817,13651.44.63.90
2232.023.022.016,19212,14436.43.55.4
2343.522.520.019,57514,68144.04.74.9
2431.024.017.012,648948628.53.44.2
2513.010.08.511058292.51.42.1
Table 2. Quantification of boulder size, volume, and estimated weight from the Pleistocene (MIS 5e, Marine Isotope Substage 5e) coastal conglomerate at site 2 at Prainha, on the southern coast of Santa Maria Island (see Figure 1b). The standard density of basalt at 3.0 gm/cm3 was applied uniformly in order to calculate wave height for each boulder. EWH: estimated wave height (in meters), calculated according to equations from Nott [37] and Pepe et al. [38]. See the methods Section 3.2. (hydraulic model).
SampleLong Axis (cm)Intermediate Axis (cm)Short Axis (cm)Volume (cm3)Adjust. to 75%Weight (kg)EWH Nott, [37]EWH Pepe et al. [38]
112.511.08.511698772.61.42.1
28.56.04.02041530.50.91.0
38.05.04.01601200.40.91.0
412.08.56.56634971.51.31.6
510.56.54.02732050.61.11.0
613.011.010.5150211263.41.42.6
79.08.03.02161620.51.00.7
825.013.513.0438832919.92.73.2
910.07.06.04203150.91.11.5
108.05.04.01601200.40.91.0
119.05.04.52031520.51.01.1
1210.08.06.04803601.11.11.5
1311.07.04.03082310.71.21.0
1416.510.55.08666501.91.81.2
158.55.52.094700.20.90.5
1615.06.05.04503381.01.61.2
1714.57.55.05444081.21.61.2
188.55.52.5117880.30.90.6
199.05.54.52231670.51.01.1
2010.58.04.53782840.91.11.1
217.05.53.0116870.30.80.7
2212.07.55.54953711.11.31.4
239.05.53.01491110.31.00.7
2414.58.54.04933701.11.61.0
2520.511.08.0180413534.12.22.0
Table 3. Quantification of boulder size, volume, and estimated weight from the modern coastal boulder deposit at site 3 at Ponta do Castelo, from the southeast end of Santa Maria Island (see map, Figure 1b). The standard density of basalt at 3.0 gm/cm3 was applied uniformly in order to calculate wave height for each boulder. EWH: estimated wave height (in meters), calculated from equations in Nott [37] and Pepe et al. [38]. See the methods Section 3.2. (hydraulic model).
SampleLong Axis (cm)Intermediate Axis (cm)Short Axis (cm)Volume (cm3)Adjust. to 75%Weight (kg)EWH Nott, [37]EWH Pepe et al. [38]
150.015.011.08250618818.65.52.7
235.014.014.06860514515.43.83.4
325.022.06.0330024757.42.71.5
427.513.05.0178813414.03.01.2
518.015.04.010808102.42.01.0
623.519.06.0267920096.02.61.5
722.520.010.04500337510.12.52.5
832.029.57.06608495614.93.51.7
932.017.011.05984448813.53.52.7
1031.016.012.56200465014.03.43.1
1125.016.05.0200015004.52.71.2
1222.020.09.0396029708.92.42.2
1327.018.55.0249818735.62.91.2
1420.014.09.0252018905.72.22.2
1523.015.56.0213916044.82.51.5
1621.013.54.312199142.72.31.1
1722.020.09.0396029708.92.42.2
1818.017.56.5204815364.62.01.6
1926.016.512.55363402212.12.83.1
2024.021.07.0352826467.92.61.7
2125.515.015.05738430312.92.83.7
2219.012.54.510698022.42.11.1
2321.012.55.013139843.02.31.2
2420.511.59.0212215914.82.22.2
2527.518.07.5371327848.43.01.8
Table 4. Quantification of boulder size, volume, and estimated weight from the Pleistocene (MIS 5e) conglomerate at site 4 at Ponta do Castelo, from the southeast end of Santa Maria Island (see map, Figure 1b). The standard density of basalt at 3.0 gm/cm3 was applied uniformly in order to calculate wave height for each boulder. EWH: estimated wave height (in meters), calculated from equations in Nott [37] and Pepe et al. [38]. See the methods Section 3.2. (hydraulic model).
SampleLong Axis (cm)Intermediate Axis (cm)Short Axis (cm)Volume (cm3)Adjust. to 75%Weight (kg)EWH Nott, [37]EWH Pepe et al. [38]
139.035.033.045,04533,784101.44.38.1
249.032.025.039,20029,40088.25.36.2
317.015.06.0153011483.41.91.5
415.08.07.59006752.01.61.8
532.030.016.015,36011,52034.63.53.9
622.015.010.0330024757.42.42.5
729.020.017.09860739522.23.24.2
811.010.08.59357012.11.22.1
925.017.014.05950446313.42.73.4
1025.022.519.010,688801624.02.74.7
1133.028.020.018,48013,86041.63.64.9
1223.016.010.0368027608.32.52.5
1320.014.09.0252018905.72.22.2
1430.020.014.08400630018.93.33.4
1514.012.010.0168012603.81.52.5
1618.520.013.04810360810.82.03.2
1714.010.57.010297722.31.51.7
1832.518.015.08775658119.73.53.7
1922.518.011.04455334110.02.52.7
2017.012.012.0244818365.51.93.0
2115.014.010.0210015754.71.62.5
2228.020.012.06720504015.13.13.0
2325.025.014.08750656319.72.73.4
2435.020.010.07000525015.83.82.5
2532.024.014.010,752806424.23.53.4
Table 5. Quantification of boulder size, volume, and estimated weight from the Pleistocene (MIS 5e) conglomerate at site 5 at Ponta do Cedro, on the east shore of Santa Maria Island (see map, Figure 1b). The standard density of basalt at 3.0 gm/cm3 was applied uniformly in order to calculate wave height for each boulder. EWH: estimated wave height (in meters), calculated from equations in Nott [37] and Pepe et al. [38]. See the methods Section 3.2. (hydraulic model).
SampleLong Axis (cm)Intermediate Axis (cm)Short Axis (cm)Volume (cm3)Adjust. to 75%Weight (kg)EWH Nott, [37]EWH Pepe et al. [38]
132.020.016.010,240768023.03.53.9
218.012.09.0194414584.42.02.2
315.010.09.0135010133.01.62.2
425.015.014.05250393811.82.73.4
525.019.012.05700427512.82.73.0
649.032.028.043,90432,92898.85.36.9
732.015.013.06240468014.03.53.2
815.012.07.012609452.81.61.7
911.06.05.03302480.71.21.2
1011.011.04.04843631.11.21.0
1116.09.08.011528642.61.72.0
1223.011.06.0151811393.42.51.5
1312.010.06.07205401.61.31.5
1423.014.514.04669350210.52.53.4
1510.06.53.01951460.41.10.7
168.06.03.01441080.30.90.7
1710.08.06.04803601.11.11.5
189.56.04.52571920.61.01.1
1911.09.05.04953711.11.21.2
2012.05.55.03302480.71.31.2
2111.05.55.53332500.71.21.4
2217.07.06.57745801.71.91.6
2321.013.010.0273020486.12.32.5
2415.58.56.07915931.81.71.5
2513.010.08.511058292.51.42.1
Table 6. Quantification of boulder size, volume, and estimated weight from the Pleistocene (MIS 5e) conglomerate at site 6 at Ponta do Cedro, on the east shore of Santa Maria Island (see map, Figure 1b, and field photo, Figure 9). The standard density of basalt at 3.0 gm/cm3 was applied uniformly in order to calculate wave height for each boulder. EWH: estimated wave height (in meters), calculated from equations in Nott [37] and Pepe et al. [38]. See the methods Section 3.2. (hydraulic model).
SampleLong Axis (cm)Intermediate Axis (cm)Short Axis (cm)Volume (cm3)Adjust. to 75%Weight (kg)EWH Nott, [37]EWH Pepe et al. [38]
120.018.09.0324024307.32.22.2
213.512.55.08446331.91.51.2
326.519.08.0402830219.12.92.0
429.011.510.0333525017.53.22.5
523.023.013.06877515815.52.53.2
620.019.010.0380028508.62.22.5
725.021.09.04725354410.62.72.2
820.010.58.0168012603.82.22.0
940.021.517.014,62010,96532.94.44.2
1018.013.012.0280821066.32.03.0
1119.017.012.0387629078.72.13.0
1228.021.015.08820661519.83.13.7
1328.519.016.08664649819.53.13.9
1435.518.015.09585718921.63.93.7
1526.024.015.09360702021.12.83.7
1619.012.08.0182413684.12.12.0
1714.08.07.58406301.91.51.8
1823.517.015.05993449413.52.63.7
1915.012.06.010808102.41.61.5
2030.026.026.020,28015,21045.63.36.4
2127.015.015.06075455613.72.93.7
2220.012.010.0240018005.42.22.5
2317.012.08.0163212243.71.92.0
2431.017.011.05797434813.03.42.7
2556.036.016.032,25624,19272.66.13.9
Table 7. Quantification of boulder size, volume, and estimated weight from the Pleistocene conglomerate at site 7 at Ponta do Cedro, on the east shore of Santa Maria Island (see map, Figure 1b). The standard density of basalt at 3.0 gm/cm3 was applied uniformly in order to calculate wave height for each boulder. EWH: estimated wave height (in meters), calculated from equations in Nott [37] and Pepe et al. [38]. See the methods Section 3.2. (hydraulic model).
SampleLong Axis (cm)Intermediate Axis (cm)Short Axis (cm)Volume (cm3)Adjust. to 75%Weight (kg)EWH Nott, [37]EWH Pepe et al. [38]
150.040.025.050,00037,500112.55.56.2
228.024.520.013,72010,29030.93.14.9
350.036.022.039,60029,70089.15.55.4
427.021.010.05670425312.82.92.5
538.021.020.015,96011,97035.94.14.9
626.018.513.06253469014.12.83.2
717.015.011.0280521046.31.92.7
827.023.013.58384628818.92.93.3
938.032.023.027,96820,97662.94.15.7
1020.016.07.5240018005.42.21.8
1141.026.025.026,65019,98860.04.56.2
1227.022.020.011,880891026.72.94.9
1326.020.015.07800585017.62.83.7
1425.016.09.0360027008.12.72.2
1520.015.09.0270020256.12.22.2
1619.016.010.0304022806.82.12.5
1715.010.510.0157511813.51.62.5
1816.513.06.012879652.91.81.5
1916.011.53.05524141.21.70.7
2014.09.07.59457092.11.51.8
2115.511.08.0136410233.11.72.0
2221.017.515.55696427212.82.33.8
2329.016.09.0417631329.43.22.2
2422.514.012.0378028358.52.53.0
2530.021.013.08190614318.43.33.2
Data points representing individual boulders sampled from the conglomerate layer at Ponta do Castelo, correlated at sites 5 to 7, were plotted on a set of Sneed-Folk triangular diagrams (Figure 4e–g).
Table 8. Summary data from Table 1, Table 2, Table 3, Table 4, Table 5, Table 6 and Table 7, showing maximum boulder size and estimated weight compared to the average values for all boulders (n = 25) from each of transects 1–7 together with calculated values for wave heights estimated as necessary for boulder mobility. Estimated average wave height (EAWH; in meters) and estimated maximum wave height (EMWH; in meters), calculated according to equations derived by Nott [37] and Pepe et al. [38]. (see the methods Section 3.2. (hydraulic model)). Maximum values for each Transect in bold.
TransectLocalityAge of the CBDAverage Boulder Size (cm3)Average Boulder Weight (kg)Max Boulder Weight (kg)EAWH Nott, [37]EAWH Pepe et al. [38]EMWH Nott, [37]EMWH Pepe et al. [38]
1PrainhaModern749022.567.93.62.95.26.4
2PrainhaMIS 5e4761.49.91.31.32.73.2
3Ponta do CasteloModern27138.118.62.82.05.53.7
4Ponta do CasteloMIS 5e673120.2101.42.73.35.38.1
5Ponta do CedroMIS 5e27728.398.81.92.15.36.9
6Ponta do CedroMIS 5e493314.872.62.72.96.16.4
7Ponta do CedroMIS 5e768023.0112.52.93.35.56.2

