Comparison of Two Models to Estimate Deposition of Fungi and Bacteria in the Human Respiratory Tract


1
Department of Environmental Sciences, Rutgers University, New Brunswick, NJ 08901, USA
2
Bureau of Public Health Statistics and Informatics, Division of Public Health Services, New Hampshire Department of Health and Human Services, Concord, NH 03301, USA
*
Author to whom correspondence should be addressed.
Atmosphere 2020, 11(6), 561; https://doi.org/10.3390/atmos11060561
Submission received: 26 April 2020
/
Revised: 23 May 2020
/
Accepted: 25 May 2020
/
Published: 28 May 2020
(This article belongs to the Special Issue Bioaerosol Exposure and Risk Assessment)
Abstract
:Understanding the deposition of bioaerosols in the respiratory system may help determine the risk of disease; however, measuring deposition fraction in-situ is difficult. Computational models provide estimates of particle deposition fraction for given breathing and particle parameters; however, these models traditionally have not focused on bioaerosols. We calculated deposition fractions in an average-sized adult with a new bioaerosol-specific lung deposition model, BAIL, and with two multiple-path models for three different breathing scenarios: “default” (subject sitting upright and breathing nasally), “light exercise”, and “mouth breathing”. Within each scenario, breathing parameters and bioaerosol characteristics were kept the same across all three models. BAIL generally calculated a higher deposition fraction in the extrathoracic (ET) region and a lower deposition fraction in the alveolar region than the multiple-path models. Deposition fractions in the tracheobronchial region were similar among the three models; total deposition fraction patterns tended to be driven by the ET deposition fraction, with BAIL resulting in higher deposition in some scenarios. The difference between deposition fractions calculated by BAIL and other models depended on particle size, with BAIL generally indicating lower total deposition for bacteria-sized bioaerosols. We conclude that BAIL predicts somewhat lower deposition and, potentially, reduced risk of illness from smaller bioaerosols that cause illness due to deposition in the alveolar region. On the other hand, it suggests higher deposition in the ET region, especially for light exercise and mouth-breathing scenarios. Additional comparisons between the models for other breathing scenarios, people’s age, and different bioaerosol particles will help improve our understanding of bioaerosol deposition.
1. Introduction
Understanding the pattern and probability with which airborne particles deposit in the human respiratory tract is important for characterizing the respiratory tract loading and the resulting risk of developing health problems due to inhalation exposures [1,2]. Of particular concern are airborne biological agents or bioaerosols—airborne particles of biological origin, including viruses, bacteria, molds, spores, and their fragments [3,4]. Exposure to bioaerosols may cause adverse respiratory conditions when such particles deposit in the respiratory tract in sufficient quantities. Workers who have been occupationally-exposed to bioaerosols have been found to have adverse health outcomes such as decreased lung function [5]. Furthermore, even low or background level exposure to bioaerosols may be associated with adverse health outcomes ([6] and references therein). For instance, the presence of Penicillium mold spores in indoor air has been associated with increased asthma risk [7]. Ubiquitous fungi genii such as Aspergillus and Penicillium may cause chronic sinusitis via an abnormal immune response [8], and one species of Aspergillus has been associated with increased severity of asthmatic reactions [9,10,11]. Furthermore, species such as Bacillus anthracis (anthrax-causing bacteria) can penetrate into the alveoli [12], survive in the macrophages [13], and may cause death [14,15].
Thus, given the health concerns, it is important to understand bioaerosol deposition in the respiratory system. However, until recently, the examination of particle deposition in the respiratory system was focused on overall aerosol particles, without a specific focus on bioaerosols. Such aerosol studies included experimental measurement of total particle deposition in the human respiratory system [16,17]. The total deposition informs us about the overall burden of the respiratory system, while information about a fractional deposition in individual regions of the respiratory system is important to recognize the risk of specific ailments [10,11,18]. Since the measurement of fractional deposition in different regions of the lungs requires distinguishing between inhaled and exhaled particles [19] and it is hard to perform experimentally, computational models have been developed and applied to aid our understanding of airborne particle deposition in the human respiratory system as a function of personal and exposure parameters, including subjects’ gender and age, their breathing patterns, and physical properties of airborne particles. A thorough discussion of the different classes of lung deposition models may be found in Hofmann’s 2011 review [20], and the updates in anatomical modeling of the lungs, airflow modeling using both laminar and turbulent flows, and the resulting changes to particle deposition [21]. One such type of model is the semi-empirical single path model, in which portions of the airways are considered discrete compartments, with particle-laden air flowing through them. The International Committee on Radiological Protection (ICRP) created such a model to estimate risk from inhalation of radioactive particles, with the most recent version updated in 1994 [22]. Recently, the Bioaerosol Adaptation of the ICRP Lung deposition model (BAIL) [23], has been introduced as an extension of the ICRP model specifically for bioaerosols. BAIL improves upon the ICRP’s representation of bioaerosols by assuming a Gaussian rather than the lognormal distribution of particle sizes and calculates breathing parameters based on the subject’s height rather than age [23]. Additionally, as many bioaerosol particles are non-spherical in shape, the BAIL model automatically calculates the shape factor based on dimensional inputs.
In contrast to single-path compartment models, which assume symmetric and same-sized airways within each branching generation, multiple-path models assume asymmetric branching in the airways. The Multiple-Path Particle Dosimetry (MPPD) model package was first developed to model regional deposition fraction in rats [24] and was later expanded to model deposition in the human lung [25]. The MPPD package includes two model options, generally accepted as “Yeh” and “age-specific” models, which both incorporate data from morphometric measurements of the human lung [26] to describe a symmetric-tree, single path. The Yeh model is a 5-lobe model generalized from measurements of a lung cast, whereas the age-specific model uses lung geometries measured in patients of different ages.
While BAIL was specifically developed in regards to bioaerosols, limited information is available on how its deposition predictions differ from those of other deposition models when applied to actual airborne microorganisms. Thus, in this study, we calculated and compared lung deposition fractions among the Yeh and age-specific multiple-path deterministic models and BAIL for four bioaerosols species: spores from two common fungal genera associated with health issues, Aspergillus and Stachybotrys [27], and bacteria as well as spores from Bacillus anthracis, which cause anthrax. Our goal is to understand how BAIL, which is designed with bioaerosols in mind, differs from the multiple-path models in deposition fraction prediction and what this may imply for estimating personal exposure to bioaerosols. In the following sections, the models and inputs, predicted regional and total deposition for three scenarios (the model default, light exercise, and mouth breathing), and a comparison between models and results are discussed.
2. Experiments
2.1. Models Used
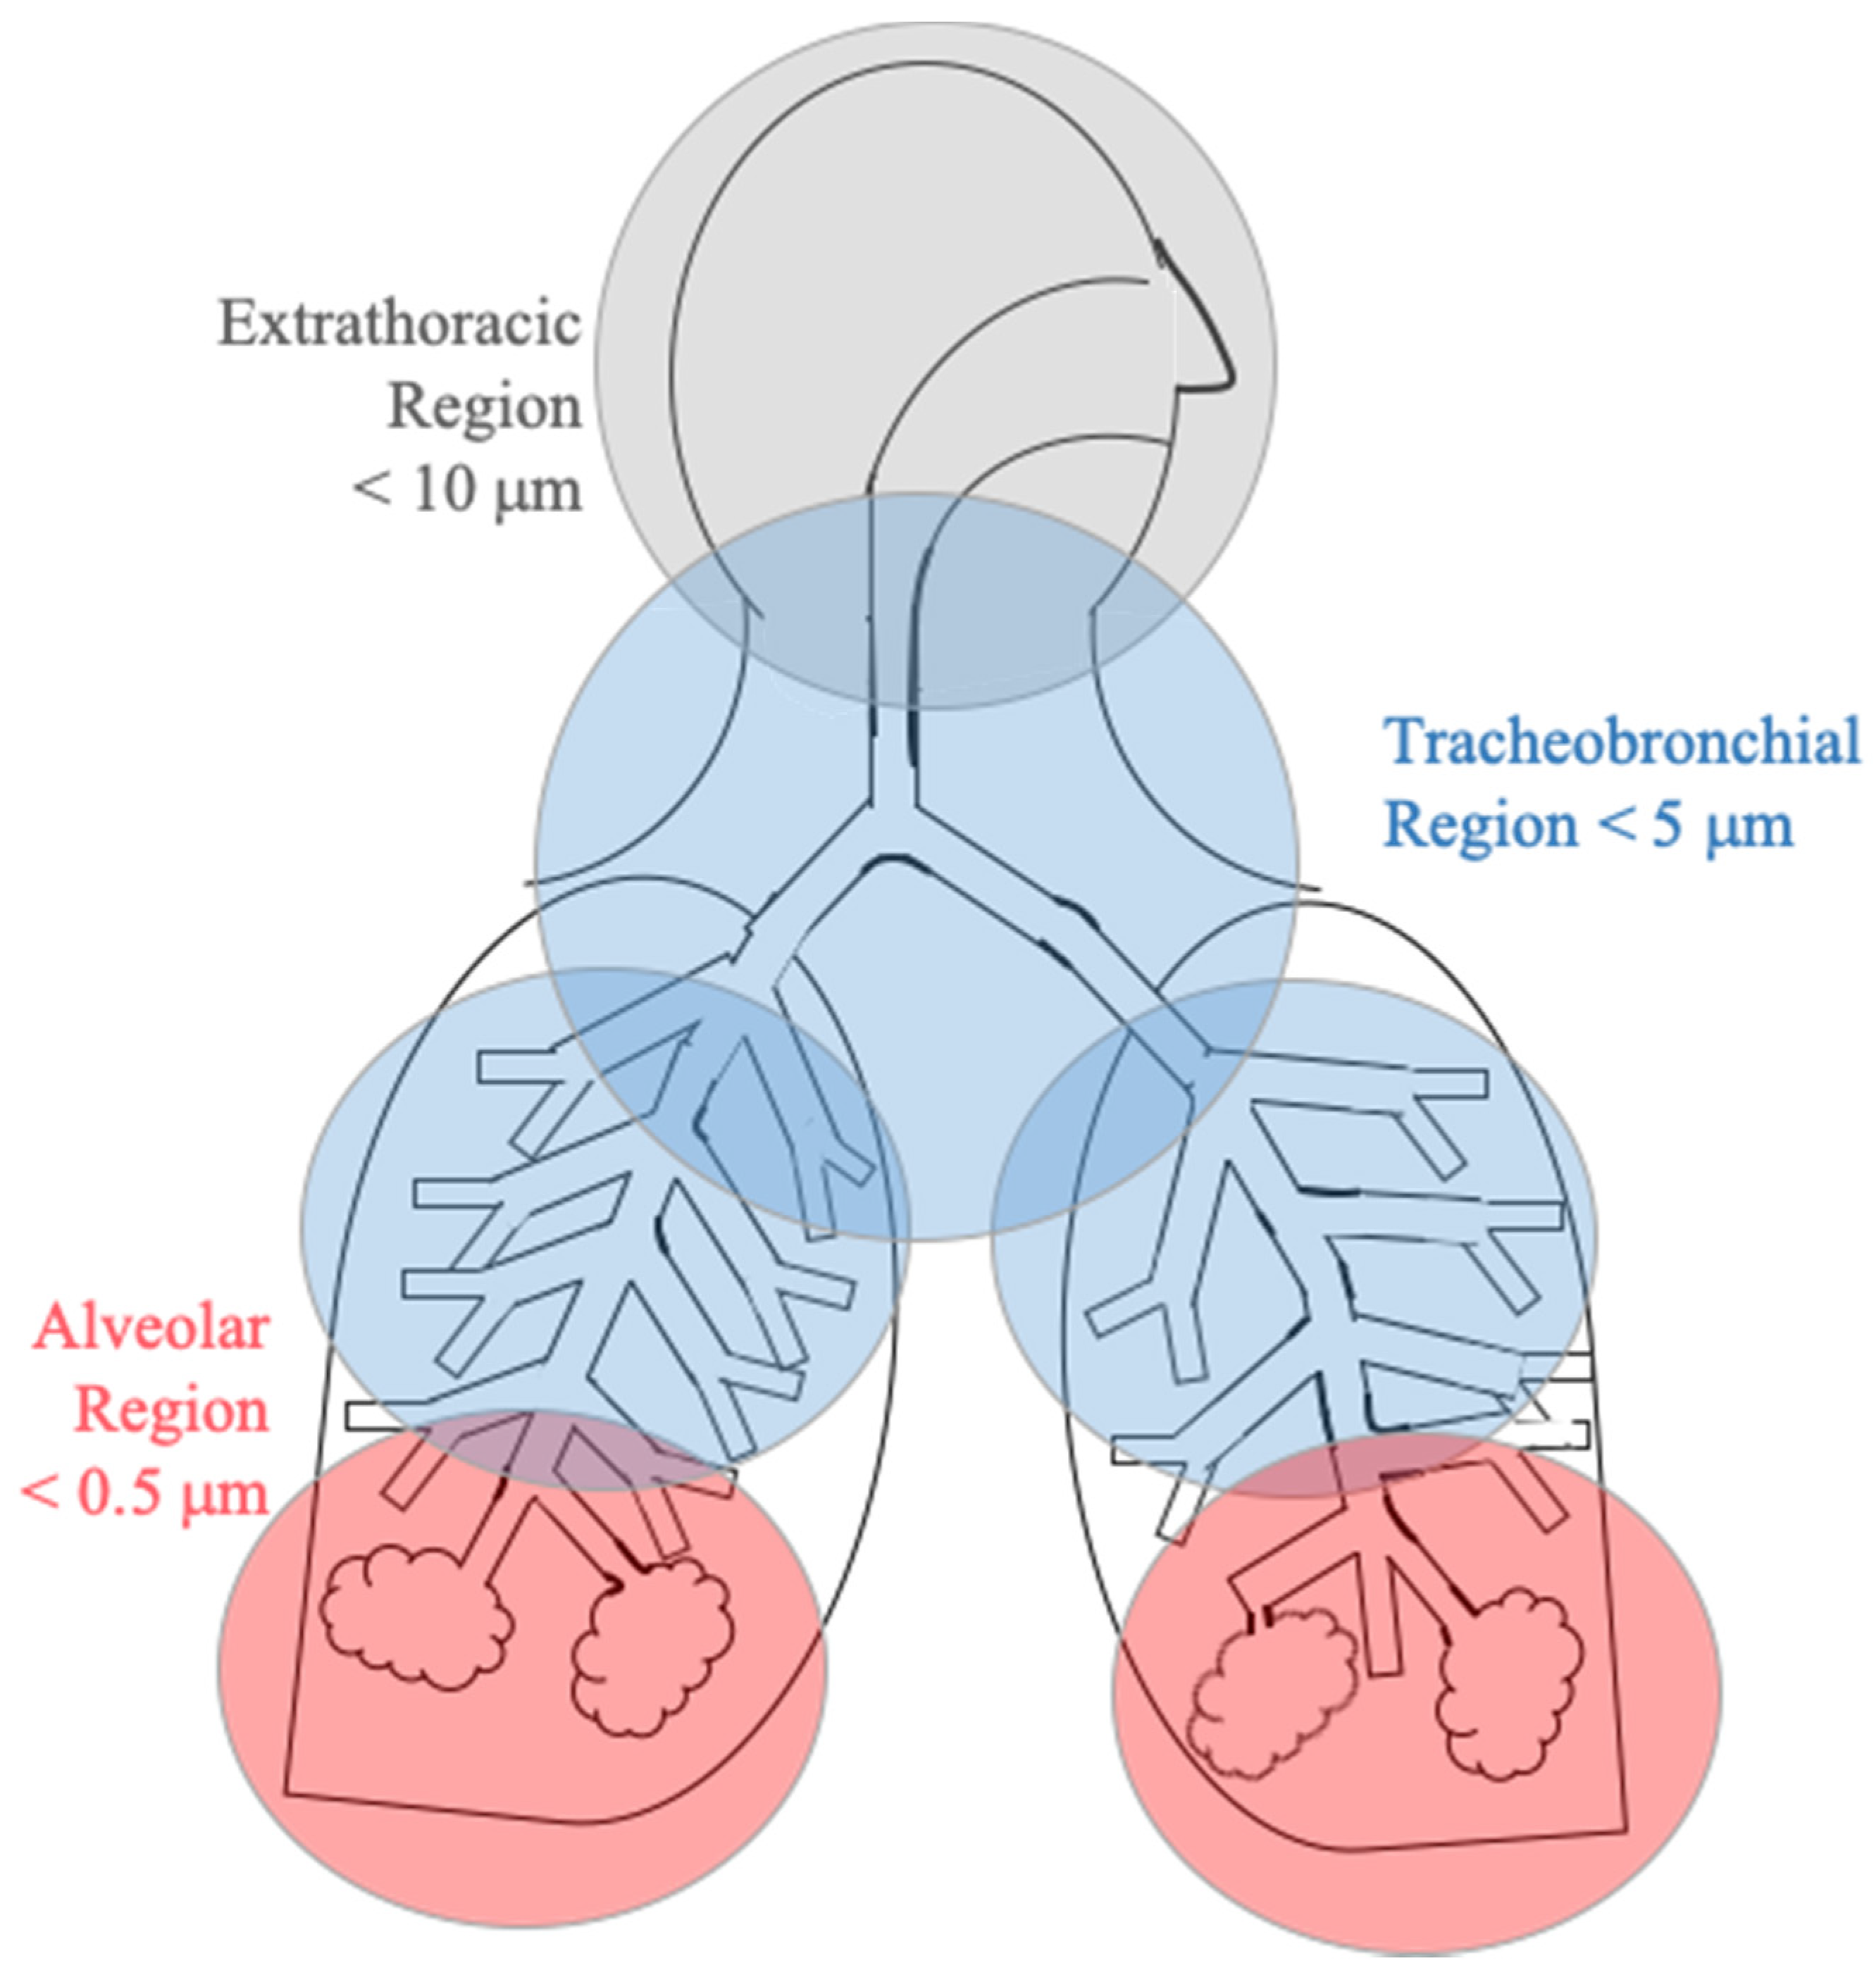
In addition to the BAIL model, we used two model options in the MPPD package: age-specific and Yeh models [25]. All three models calculate the fractional deposition of particles in the extrathoracic (ET), tracheobronchial (TB), and alveolar (AL) regions, observed in Figure 1. Total particle deposition is the sum of deposition in these three regions. All models take into account three major deposition mechanisms: impaction, Brownian diffusion, and particle settling [23,24,25].
2.2. Model Input Parameters
BAIL requires the following inputs: subject’s height (h), functional residual capacity (FRC), and tidal volume (V). BAIL prompts the user for the subject’s height (h); 170 cm was chosen to represent a typical adult. This value is a rounded mean between the average U.S. adult male and female height of 175.9 and 162.1 centimeters, respectively [28]. Based on this height, the subject’s FRC was calculated to be 3075.75 mL using Equation (1) from BAIL’s documentation [23]:
Tidal volume (V) was calculated to be 568.33 mL while sitting and 1122.88 mL during light exercise using Equations (2) and (3), respectively, from the BAIL documentation:
The same FRC and V values were also used as inputs in both MPPD options to reduce variation in the model runs.
Each model was run for three activity profiles: “default” (subject sitting and breathing through the nose), “light exercise” (with nasal breathing), and “mouth breathing” (subject sitting). For the light exercise case, tidal volume was increased to the light exercise value listed above, with all other parameters remaining the same. For the mouth breathing case, the tidal volume was kept the same as in the default case (i.e., sitting), but the breathing type was changed from nasal to oral in each of the three models. Input parameters are shown in Table 1.
The length and width of the four representative bioaerosols were obtained from the literature [29]. We followed BAIL’s convention of using an aerosol density of 1.0 g cm−3 for all particles since bioaerosols mainly consist of water [23]. Changes in the water content, and therefore density, and hydrophobicity of particles are not taken into account in the models are, therefore, are not included in this study. For the non-spherical bioaerosol particles (Bacillus anthracis bacteria, Bacillus anthracis spores, and Stachybotrys chartarum mold spores), aerodynamic diameters were calculated for the oblate and prolate orientations (Table 2) using values found in the literature [30,31,32]. The three models were run separately for each species assuming the orientation of 100% oblate as well as 100% prolate. The resulting lung deposition fractions for the oblate and prolate orientations were averaged to estimate the average deposition for a particular species. The fourth bioaerosol species, Aspergillus clavatus, is spherical, so only one set of model runs was necessary. As could be seen from Table 2, the chosen microorganisms span a relatively wide aerodynamic diameter range: from 1.47 µm (B. anthracis spores) to 7.95 µm (S. chartarum). Ambient particle concentration was left at the multiple-path models’ default value of 1 mg m−3 since it does not affect the deposition fraction. The size distribution was assumed to be monodisperse to take into account model capabilities. Due to the monodisperse size distribution of the particles, the particle concentration will not affect the predicted deposition fractions.
2.3. Uncertainty Analysis
BAIL calculates the 5th and 95th percentile confidence intervals for the deposition fraction in each region. The multiple-path models do not present any estimates of uncertainty in their results; thus, we undertook a series of sensitivity tests to understand better how sensitive the multiple-path models are to the choice of FRC and V. The multiple-path models were run with FRC and V increased and decreased 20% both individually and together from the default values for each activity profile. Deposition fraction was also calculated for changes of ± 20% for the upper respiratory tract volume while FRC and V were held constant.
Additionally, each model scenario was run with the characteristics of a person in the 5th and 95th percentile for height (156.95 and 180.56 cm, respectively) to investigate the dependence of deposition fraction on height.
3. Results
The results presented below show the calculated lung deposition fractions for three breathing cases listed above: a default case (subject sitting upright and breathing nasally, referred in text as “default case”), light exercise with nasal breathing (referred to as “light exercise”), and sitting with mouth breathing (referred to as “mouth breathing”).
3.1. Model Results
3.1.1. Default Case
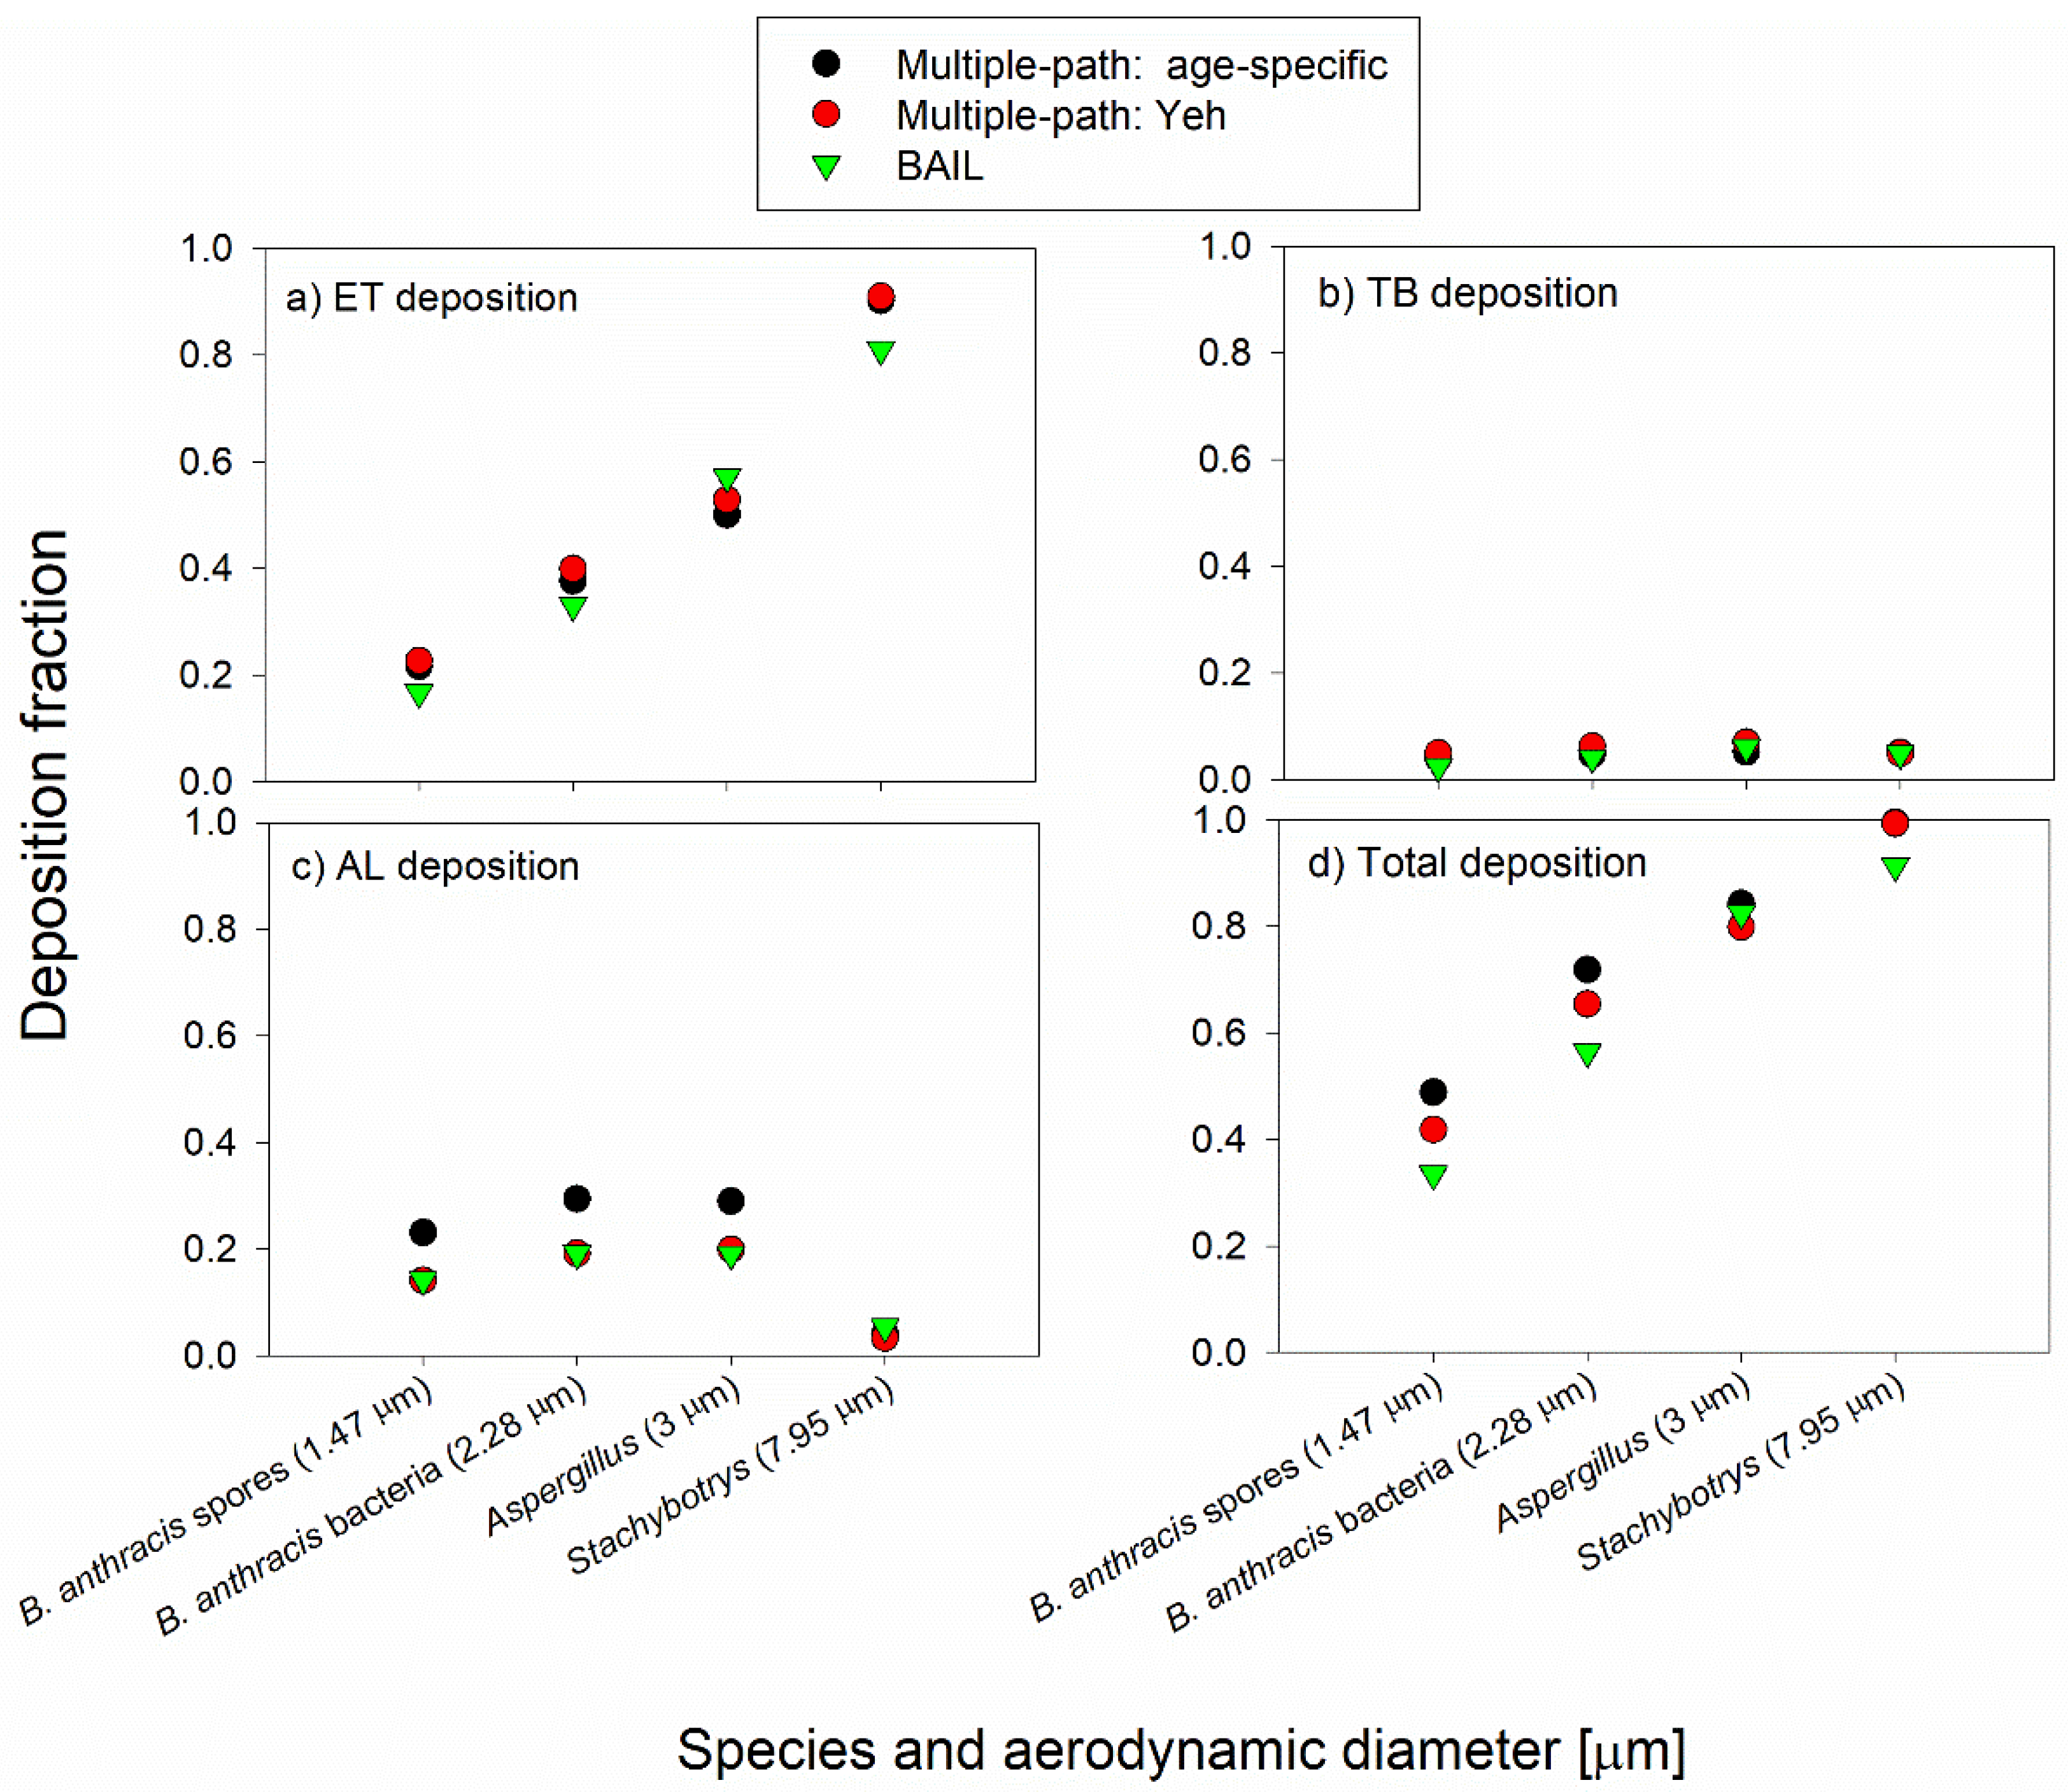
Results from the default case (assuming the subject was sitting and breathing nasally) are shown in Figure 2. For all three models, ET deposition fraction increases with an increased particle size (Figure 2a): from an average of 0.20 for Bacillus anthracis spores (aerodynamic diameter = 1.47 µm) to an average of 0.87 for Stachybotrys (aerodynamic diameter = 7.95 µm). ET deposition fractions calculated by BAIL are 10% to 26% lower than those calculated by the multiple-path models for Bacillus anthracis bacteria, Bacillus anthracis spores, and Stachybotrys spores, but 8% to 14% higher for Aspergillus spores.
The three models show strong agreement for TB deposition fraction for all four species (Figure 2b), and there is little apparent dependence of deposition fraction on size. For TB, the deposition fractions ranged from 0.023 (B. anthracis spores, BAIL) to 0.07 (Aspergillus spores, Yeh model).
For AL deposition (Figure 2c), all three models show maximum deposition occurring for particles near the size of Bacillus anthracis bacteria (aerodynamic diameter = 2.28 µm). “Age-specific” model shows the highest deposition fractions for the three smaller microorganisms (diameters between 1.47 and 3 µm), and they range from 0.25 to 0.3. BAIL closely matches the Yeh model for the same microorganisms, with deposition fractions ranging from 0.15 to 2.0. All three models are in good agreement for Stachybotrys spores, with deposition fractions ranging from 0.03 to 0.05.
Total deposition (Figure 2d) was driven mainly by the sum of ET deposition and AL deposition, with deposition patterns among the three models similar to those seen in Figure 2a. However, there is a “lift” for the deposition of smaller particles due to AL deposition. BAIL calculated total deposition values that were 20% to 31% lower than the multiple-path models for B. anthracis spores, 14% to 21% lower for B. anthracis bacteria, and 8.0% to 8.1% lower for Stachybotrys. For Aspergillus, the three models calculated very similar total deposition fractions, ranging from 0.80 to 0.84.
3.1.2. Light Exercise Case
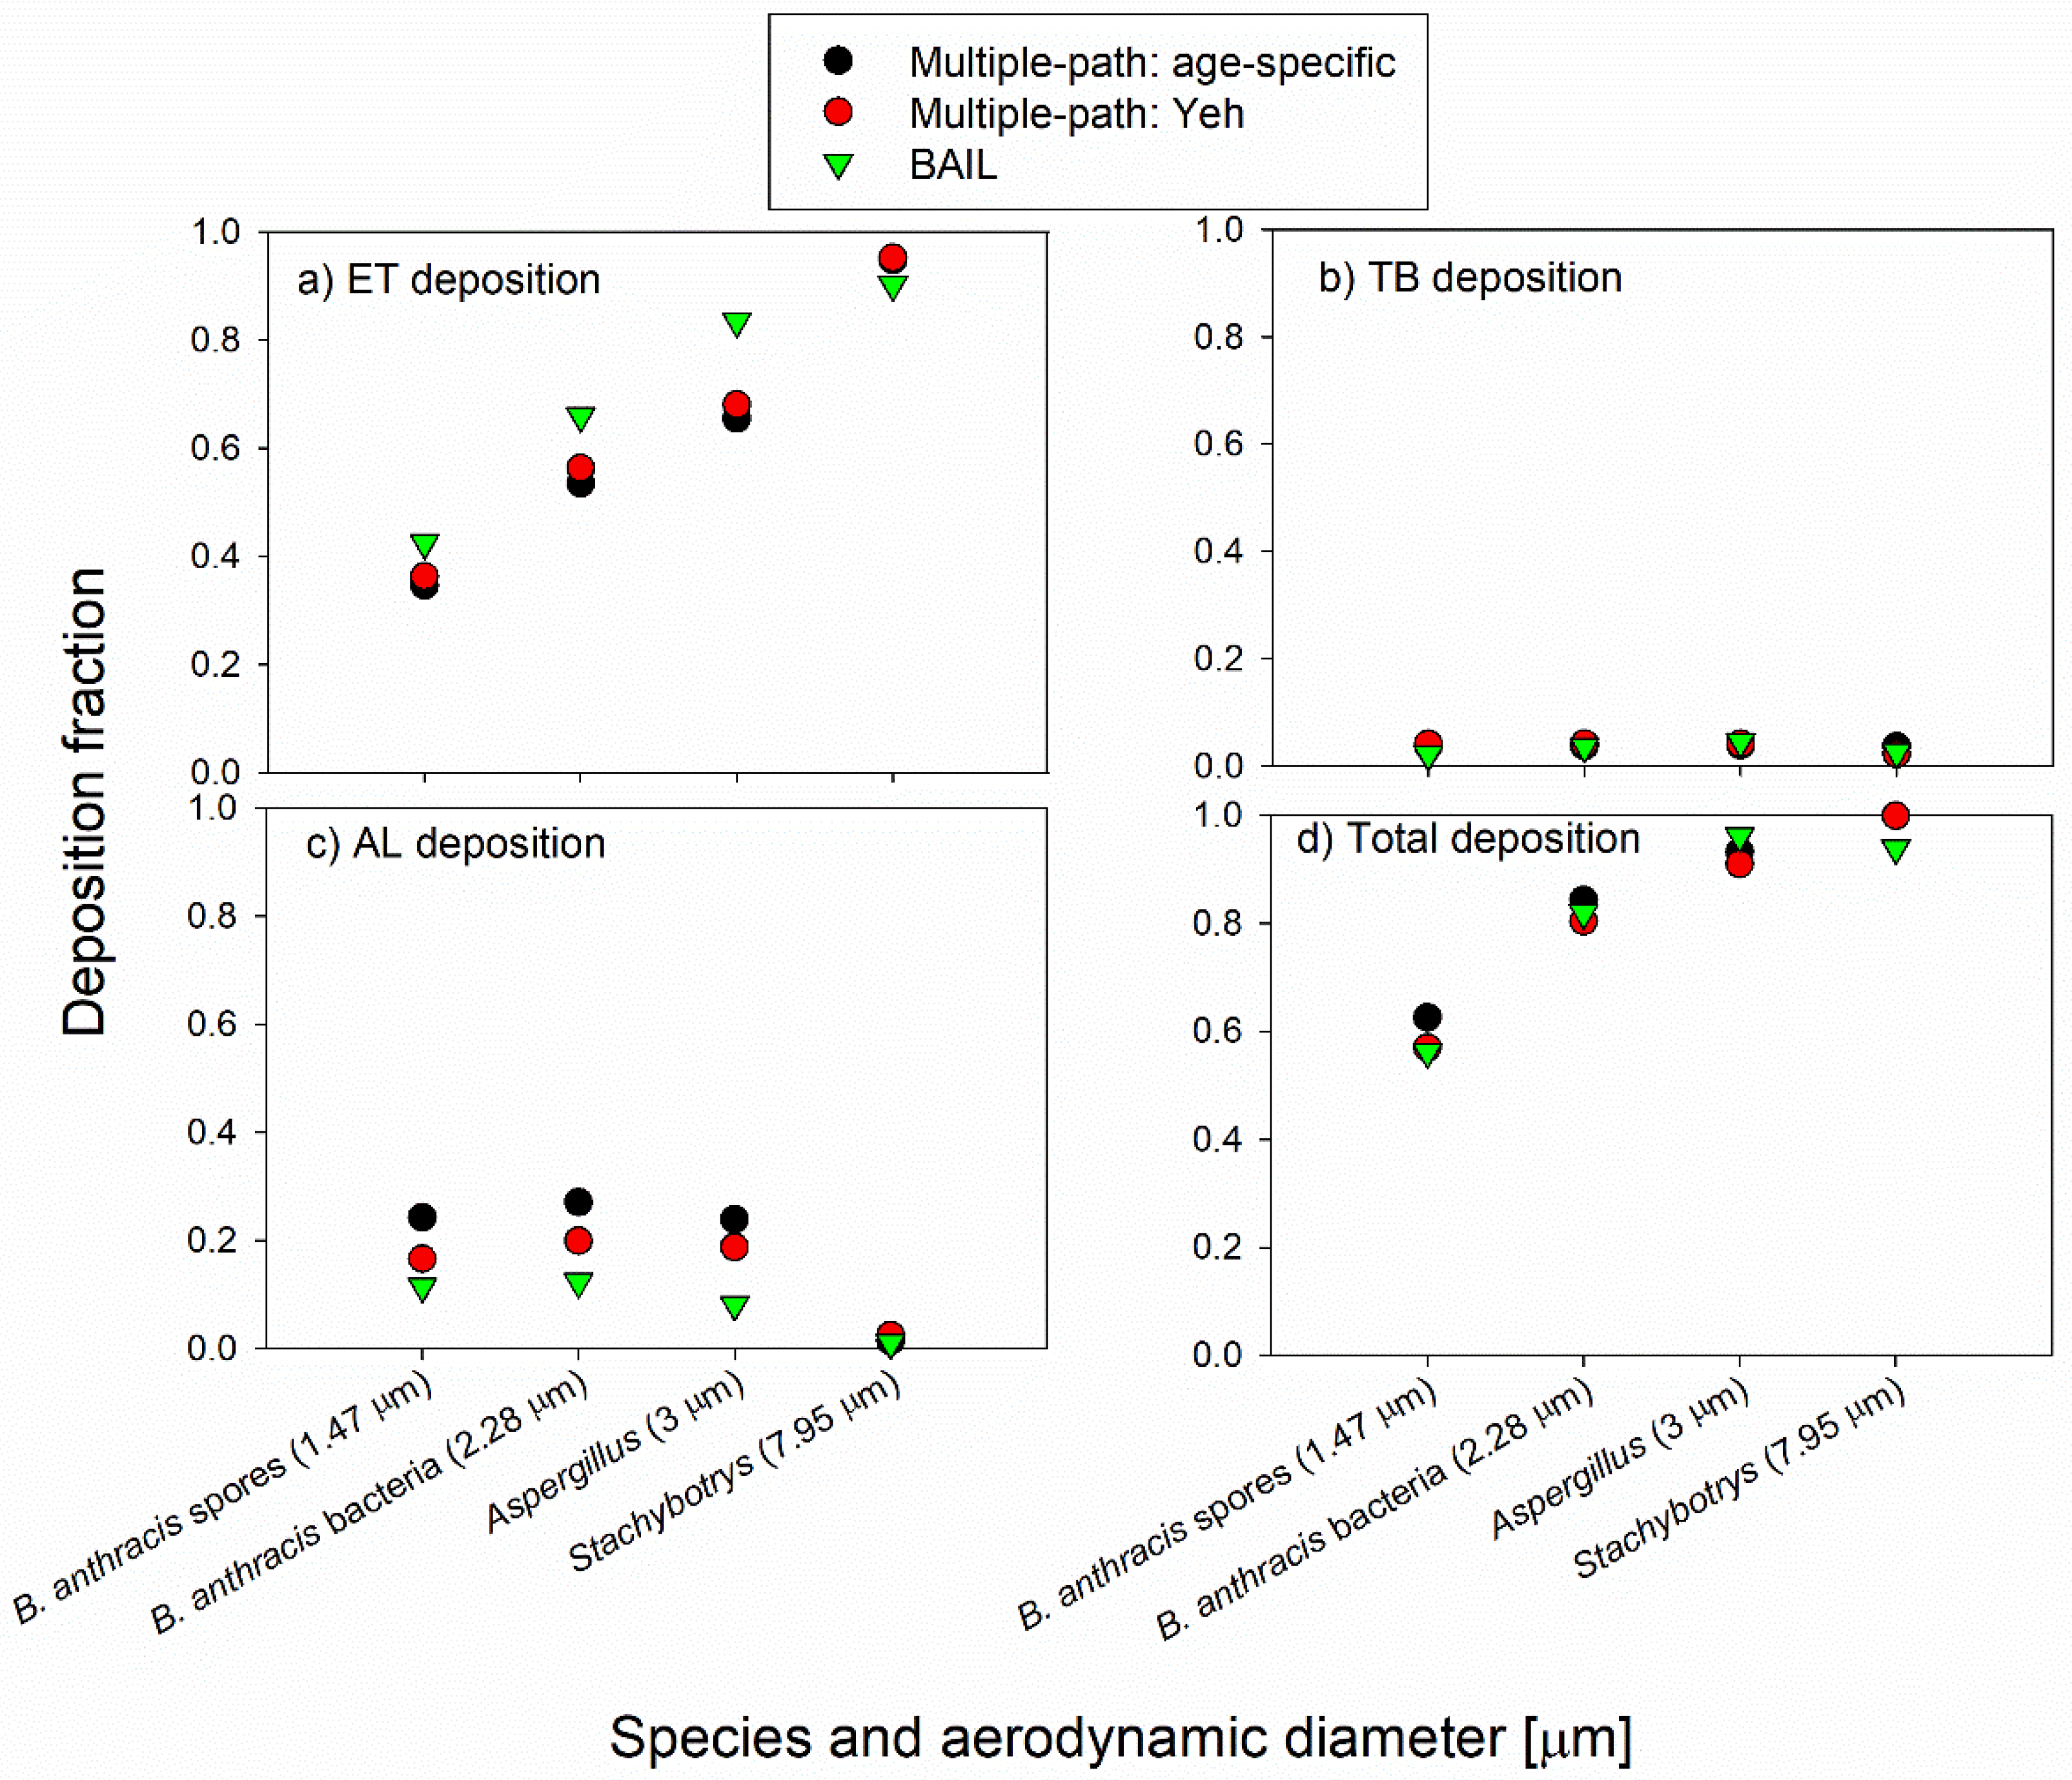
Figure 3a shows ET particle deposition for the light exercise case. All three models showed an increase in deposition fraction with increasing particle size. BAIL calculated ET deposition fractions that were 17% to 23% higher than those calculated by the multiple path models for aerodynamic particle diameter from 1.47 to 3µm, but about 5% lower for Stachybotrys spores. The deposition fraction in the tracheobronchial region again was low and very similar across all three models, with little dependence on particle size (Figure 3b). In the alveolar region (Figure 3c), each of the three models showed a slight increase in deposition fraction between 1.47 to 2.28 µm and decreased deposition with size increasing above 2.28 µm. For the alveolar region, BAIL calculated deposition fractions that were 31% to 66% lower than those calculated by the multiple path models for Bacillus anthracis bacteria and spores, and Aspergillus spores. Alveolar region deposition fraction for Stachybotrys was negligible (1% to 2% of particles deposited) among all three models.
The total deposition fraction (Figure 3d) was remarkably similar for the three smallest bioaerosols, with a range of no more than 0.06 between the highest and lowest calculated deposition among the three models. For Stachybotrys spores, BAIL calculated a total deposition fraction of 0.94 compared to deposition fraction over 0.99 for the two multiple-path models.
3.1.3. Mouth Breathing Case
Deposition fractions for the mouth-breathing model runs are shown in Figure 4. ET deposition fraction increases with increasing particle size and is markedly higher in BAIL than in the two multiple-path models, which are nearly identical (Figure 4a). In the TB region (Figure 4b), the three models agree closely for the smallest three particles. Still, BAIL calculates a much smaller deposition fraction (0.12) for Stachybotrys spores compared to the multiple-path models (0.26 to 0.27). AL deposition fraction calculated by BAIL is 7% to 23% lower than that calculated by the Yeh model for each bioaerosol particle and 39% to 45% lower than the age-specific model (Figure 4c). Total deposition fraction (Figure 4d) was considerably larger in BAIL for Aspergillus spores (18.4% higher than the age-specific model and 47.7% higher than the Yeh model) and slightly higher for Stachybotrys (2.2% higher than the age-specific model and 8.6% higher than the Yeh model). BAIL’s calculated deposition fraction fell in between the two multiple-path models for B. anthracis spores and bacteria.
3.2. Uncertainty Analysis
The chosen values for FRC and V were both found to exert an effect on some regional deposition fractions calculated by the two multiple-path models (Table 3). The original deposition fraction fell between the deposition fractions that resulted from increasing and decreasing FRC or V in nearly every case. In the few cases in which this did not happen (e.g., an increase in FRC and a decrease in FRC both resulted in an increase in deposition fraction compared to the deposition fraction calculated with the original FRC), the difference was very small (<0.01) and is likely attributable to rounding errors in the models.
3.2.1. Effect of Changing FRC on the Deposition Fractions
In the ET region, changes of 20% in FRC resulted in very little change in deposition fraction each of the three breathing scenarios (Table 3); the small changes that were seen were likely due to rounding error within the model, as FRC changes should not affect ET deposition.
In the TB region, increased FRC resulted in increased deposition fraction for the smallest three bioaerosols and decreased fraction for the largest bioaerosol in the default scenario. Lower FRC resulted in the opposite effect for the default case: decreased deposition for the three smaller particles and higher deposition for the largest bioaerosol particles. One has to keep in mind, however, that the absolute deposition fractions in the default case in the TB region are approximately 0.05. For the mouth-breathing scenario, an increase in FRC resulted in a decreased deposition fraction for all four bioaerosols. However, again, the absolute deposition fractions in the light exercise case in the TB region are less than 0.05. For the mouth breathing scenario, changes in FRC produced little change in the deposition of the three smallest bioaerosol particles; for Stachybotrys, a 20% increase and a decrease in FRC resulted in about 0.04 higher and 0.02 lower deposition fraction on the absolute scale, respectively.
The AL deposition fraction was reduced slightly for the smallest three bioaerosols in all three scenarios when FRC was increased. The opposite trend was observed when FRC was reduced by 20%. The AL deposition fraction of the largest bioaerosol, Stachybotrys, virtually did not change with changes in the FRC in either deposition model.
The total deposition was lowered slightly for the largest bioaerosol particle as a result of increased FRC in the default and mouth-breathing scenarios; the opposite trend was observed for lower FRC. Minimal to no changes were observed for Stachybotrys deposition in all scenarios with changes in FRC. The total deposition was also not affected by FRC changes in the light exercise scenario.
3.2.2. Effect of Changing V on the Deposition Fractions
Tidal volume (V) was also increased and decreased by 20% from the values calculated by BAIL and run in the multiple-path models with all other parameters unchanged.
For the ET region, the increased tidal volume (V) resulted in increased deposition fraction in the ET region for all four bioaerosols in all three breathing scenarios. However, the effect was less pronounced for B. anthracis spores and bacteria, as well as Aspergillus spores in the mouth-breathing scenario. The decreased total volume V produced the opposite effect. Again, the effect was minimal for the mouth breathing scenario and the three smallest bioaerosol particles.
The TB deposition fraction decreased with the 20% higher V for each bioaerosol and increased with the lower V for the default and light exercise scenario. The effect was especially pronounced for Stachybotrys. One has to keep in mind, however, that the TB deposition values in these two scenarios were in the range of 5%. The TB deposition in the mouth-breathing scenario was relatively unaffected by the changes in the tidal volume, except for Stachybotrys in the mouth-breathing scenario.
The AL deposition fraction in the default scenario virtually did not change with the increased V and was somewhat lower for B. anthracis at lower V. Minimal changes were seen for Stachybotrys with V adjusted in either direction. AL deposition fraction decreased with increased V for the light-exercise scenario but increased with increased V for the three smallest bioaerosols in the mouth-breathing scenario. The opposite trend was observed for both scenarios with decreased V. Changes were minimal for Stachybotrys for all four cases presented.
The total deposition fraction mirrored the ET deposition fraction results, with a positive correlation between V and deposition fraction for the three smaller bioaerosols for all cases. The total deposition of Stachybotrys did not change with changes in V for the default light-exercise scenarios. Still, it moved in the same direction as the change in V for the mouth-breathing scenario.
3.2.3. Effect of Changes in the Upper Respiratory Tract (URT) Volume on the Deposition Fractions
The upper respiratory tract (URT) volume was also changed by 20% in each direction, but the resulting change in deposition fraction was less than 1% on a relative scale (results not shown), so we do not consider variations in URT volume to be a major influencing factor on deposition fractions.
3.2.4. Effect of a Person’s Height on the Deposition Fractions
Changes in deposition fractions due to changes in person’s height (e.g., calculated for the 5th and 95th percentiles compared to average height) are shown in Supplementary Tables S2–S4. In the default scenario (Table S1), changes in deposition fractions due to changes in height were generally within 5% on the absolute scale (within 0.05% of deposition fraction). Some of the biggest changes could be observed in the ET region for the three smallest particles when age-specific or Yeh models are applied. In the TB region, the biggest changes are observed for B. anthracis bacteria and Aspergillus mold spores when BAIL and Yeh models are used. The changes in the total deposition were within 2%–3% on the absolute scale.
In the light exercise scenario (Table S2), deposition fraction depended most strongly on height for the three smaller bioaerosols in the ET region where deposition increase as high as ~12% on the absolute scale could be observed when the height increased from average to the 95th percentile. However, the decrease in the deposition was much less pronounced, less than 5% on an absolute scale and typically 2%–3%, when the height decreased from the 50th percentile to the 5th percentile. The total deposition fraction of smaller particles moved in the same direction as the change in height, but the change was less pronounced compared to the ET deposition. The deposition of the largest particle, Stachybotrys, changed rather minimally with changes in height.
The differences in deposition fractions in the mouth-breathing scenario (Table S3) were generally less than 5% on an absolute scale and, in most cases, 2%–3%. There was no clear dependency on bioaerosol size or the model used.
4. Discussion
Our results show that while TB deposition fractions are often similar between BAIL and the multiple path models, BAIL differs most markedly in its calculation of ET and AL deposition fraction for the bioaerosols investigated in this study. BAIL indicated a larger deposition fraction in the ET region for all four bioaerosols in the mouth-breathing case (Figure 4a), for the smaller three bioaerosols in the light exercise case (Figure 3a), and for Aspergillus spores in the default case (Figure 2a). Though Stachybotrys spores were calculated to have a higher deposition fraction in BAIL than in the multiple path models in only one of the three scenarios (the mouth-breathing case; Figure 4a), this may still represent an area of health concern. While human health problems associated with Stachybotrys remain unclear [33], Stachybotrys and its associated mycotoxin Satratoxin-G have been found to be associated with inflammation [34] and rhinitis [35] in animal studies using intratracheal or nasal instillation. Thus, overall, the use of BAIL, which is bioaerosol-focused, suggests a higher deposition of microorganisms in the ET region, especially under some exertion compared to multiple-paths models. The difference was most pronounced for the mouth-breathing case.
On the other hand, the alveolar deposition was usually lower in BAIL than in the multiple-path models. In the default scenario, BAIL’s AL region deposition fractions were almost identical to the Yeh model but lower than the deposition fractions from the age-specific model (Figure 2c). In the light exercise and mouth-breathing scenarios, BAIL calculated a lower deposition fraction in the AL region compared to the multiple path models (Figure 3c and Figure 4c). For bioaerosols such as B. anthracis spores, which are most dangerous when they reach the deep lungs, capable of causing inhalation anthrax [36], our results from BAIL imply that risk, based on this model, is reduced compared to the risk-based on the two multiple-path models since a smaller fraction of the inhaled spores may be reaching the AL region. Likewise, BAIL suggests a potentially reduced health risk from inhalation of A. clavatus, which is associated with inflammation of the alveoli in hypersensitivity pneumonitis [11]. However, as microorganisms may be part of larger, agglomerated particles, a lower predicted AL deposition does not preclude disease development [14,37]. Increasing and decreasing FRC and V in the multiple path models by 20% from the values calculated by BAIL resulted in some changes in regional deposition (Table 3) but did not affect the overall deposition profile as a function of particle size. The relative deposition fractions between BAIL and the multiple-path models remained largely unaffected, suggesting that the multiple-path models have a low degree of sensitivity to the subject breathing parameters used in this study.
In some bioaerosol deposition studies, modeling has been performed using semi-empirical models [38,39] or the lung dose evaluation program (LUDEP) [40,41]. In the alveolar region, in particular, it has been suggested that 30%–40% of fungal particles will deposit according to the semi-empirical model [38], which is a 20% increase compared to MPPD or BAIL. Alternatively, LUDEP predictions for total spore deposition of either Aspergillus versicolor or Stachybotrys chartarum were 84%–95%, similar to the MPPD and BAIL models. Previous studies of multiple-path models have shown a marked difference between deposition fraction calculations from multiple-path models and the ICRP model, from which BAIL is derived. Hofmann et al. (2011) compared TB and acinar (alveoli) deposition fraction among several types of models. Figure 12 in that work shows that for sitting, nasal-breathing subjects, multiple-path models (termed MPPD) calculated higher deposition fraction in the TB region for particles between 1 and 3 µm than deposition fraction calculated by ICRP, but between 3 and 10 µm ICRP calculated higher values than MPPD. Additionally, in the acinar (alveoli) region, MPPD calculated a slightly lower deposition fraction for particles from 1 to 4 µm compared to the ICRP, while the two models were nearly identical for particles from 4 to 10µm. Non-spherical particles in this work are shown to have a lower predicted deposition fraction based on the BAIL model. The best agreement between the all model types is observed for Aspergillus spores, which may be due to the spherical nature of this particle. The differences between model results suggest a lower risk associated from deposition through the BAIL modeling for non-spherical particles, whereas there is little risk difference (2%–3%) in the default model for spherical particles. However, these differences in deposition may affect the clearance mechanisms and pathogenicity of deposited species. For example, as presented by Thomas’ 2013 study, B. anthracis endospores in a 12 µm particle aerosol inhaled by mice promoted gastrointestinal infections [42].
To the best of our knowledge, there are currently no studies experimentally investigating the regional deposition of bioaerosols within the human lung. As deposition is predominantly controlled by particle aerodynamic diameter, results in this study may be compared to deposition of non-bioaerosol particles that have similar aerodynamic diameters. Three healthy subjects were studied by Heyder et al. [17] when inhaling monodisperse iron oxide particles either nasally or orally. FRC and tidal volume V were similar in the Heyder study and in this study, suggesting that the results may be compared. Overall, the results are very similar for total deposition and the regional deposition fractions. The default breathing scenario of our study compared to nasal breathing by Heyder et al. suggests the MPPD models may be more accurate as BAIL consistently underpredicts the measured deposition. In the ET region, the difference between the MPPD models and the nasal measurements is less than 0.01, whereas the difference to the BAIL predictions is as high as 0.12. In the TB region, the models are each within 0.05 deposition fraction for particle size less than 3 µm. The total deposition is underpredicted by all models, with the MPPD models at a less than 0.1 deposition fraction difference. However, comparing the mouth breathing scenario to Heyder et al. oral breathing, there is no model that best predicts the measured values. The ET region is best predicted by MPPD, a difference of less than 0.04 deposition fraction. The TB region is very similar for each model, a difference of 0.04 for MPPD and 0.05 for BAIL. The AL region is underpredicted by as much as 0.25 deposition fraction. The total depositition comparison, however, is very similar for both model types, MPPD and BAIL, providing a difference of less than 0.1 for each. Kim and Hu [43] investigated the regional deposition pattern of monodisperse di-2-ethylhexyl sebacate oil, at diameters of 1 µm, 3 µm, or 5 µm, delivered to healthy adults through serial bolus inhalation. The default scenario of this study is comparable to Kim and Hu’s evaultation at 150 mL/s breathing. Comparing the results of the Kim and Hu study to that of Apergillus in this study, the ET region is overpredicted, 0.534 compared to 0.033 ± 0.005, the TB region is underpredicted, 0.061 compared to 0.248 ± 0.002, and the AL region is underpredicted, 0.227 compared to 0.401 ± 0.010. Similar trends are observed between the sizes studied, as the deposition increases with increasing particle size up to 3 µm. Comparison to the experimental data available suggests that the fractional deposition in the AL region is underpredicted by current models and additional refinement is necessary to better predict deposition.
In future studies, additional steps could be taken to further refine modeling techniques to improve their predictive value for bioaerosol particles. Although bioaerosol particles might be highly charged, especially immediately after their release [44], the effects of charge on their deposition have not been included in models. Initial work has been done to investigate the effects of particle charge on total deposition [45,46,47]. Since BAIL uses a Gaussian distribution rather than lognormal to describe the inhaled aerosol, it could produce inaccurate results for polydisperse size distributions of bioaerosols. Furthermore, bioaerosols are often hydrophilic in nature, which promotes their hygroscopic growth following inhalation [48,49]. This growth will alter the deposition pattern in the human respiratory system. This phenomenon is not included in the BAIL model as well as the other lung deposition models discussed in this paper. Current models of hygroscopic growth [50,51] may be incorporated into the models discussed in this study as part of their refinement. Additionally, the subject weight, disease state, and dynamic breathing are not considered within these models. These variables will affect the deposition and, more importantly, the interactions of deposited particles with tissue and ability to promote adverse health effects. However, as the total deposition fraction is not 1, the authors assume there is exhalation of particles. Finally, no model currently accounts for microorganisms embedded in or agglomerated with other, often larger, particles. This will also affect the accuracy of predicting bioaerosol deposition patterns unless the size distribution of those agglomerates is known beforehand. As observed with viral-based bioaerosols, such as influenza or COVD-19, cough-generated aerosols can allow for the transmission of disease from person to person [52,53]. In addition to improving the deposition predictions of bioaerosols, refinements could be made to begin assessing the particle-cell interactions, including interactions with mucus, host tissues, subject disease state, and particle clearance. These steps would help build a foundation to evaluate a dose-response relationship of bioaerosols.
5. Conclusions
This study focused on the respiratory deposition of four common bioaerosols ranging in aerodynamic diameter from approximately 1 to 8 µm. The entire bioaerosol size spectrum ranges from 0.02 to 100 µm [54]; thus, additional work could evaluate BAIL at a greater range of sizes. We also defined three scenarios to study and used an average-height adult as our model. Further work is needed to evaluate BAIL for additional breathing scenarios and subject age ranges, especially for sensitive groups, e.g., the elderly. Non-spherical particles are often predicted at a lower deposition total than spherical in non-mouth breathing based scenarios using the BAIL model. Despite these differences, this study is the first to compare lung deposition fractions of common bioaerosols using BAIL—a model specifically developed to better represent bioaerosols—with two other commonly used modeling approaches. The understanding of these models will help in their application for bioaerosol exposure assessment using actual bioaerosol measurements. Future studies could also expand the application of bioaerosol-oriented models to other bioaerosol types, such as viruses and pollen and include experimental validation of predicted fractional deposition values using an artificial lung.
Supplementary Materials
The following are available online at https://www.mdpi.com/2073-4433/11/6/561/s1, Table S1: Deposition fractions due to the effect of Yeh model runs with input values ± 20% from value calculated by BAIL for each scenario. Table S2: Deposition fraction as a function of height and associated breathing parameters, default scenario. Table S3: Deposition fraction as a function of height and associated breathing parameters, light exercise scenario. Table S4: Deposition fraction as a function of height and associated breathing parameters, mouth breathing scenario.
Author Contributions
Conceptualization, G.M.; methodology, J.A.S. and G.M.; formal analysis, J.A.S.; investigation, J.A.S. and G.M.; writing—original draft preparation, J.A.S.; writing—review and editing, L.E.S. and G.M.; visualization, J.A.S. and L.E.S.; supervision, G.M.; project administration, G.M.; funding acquisition, G.M. All authors have read and agreed to the published version of the manuscript.
Funding
Drs. J.A. Sagona and L. Secondo were supported by NIH training grant in exposure science (1T32ES019854; PIs: C. Weisel and G. Mainelis).
Acknowledgments
We would like to thank Suvajyoti Guha and Owen Price for answering questions about BAIL and the multiple-path model inputs, respectively.
Conflicts of Interest
The authors declare no conflict of interest.
References
- Bünger, J.; Schappler-Scheele, B.; Hilgers, R.; Hallier, E. A 5-year follow-up study on respiratory disorders and lung function in workers exposed to organic dust from composting plants. Int. Arch. Occup. Environ. Health 2007, 80, 306–312. [Google Scholar] [CrossRef]
- Heldal, K.K.; Halstensen, A.S.; Thorn, J.; Diupesland, P.; Wouters, I.; Eduard, W.; Halstensen, T.S. Upper airway inflammation in waste handlers exposed to bioaerosols. Occup. Environ. Med. 2003, 60, 444–450. [Google Scholar] [CrossRef] [Green Version]
- Georgakopoulos, D.G.; Després, V.; Fröhlich-Nowoisky, J.; Psenner, R.; Ariya, P.A.; Pósfai, M.; Ahern, H.E.; Moffett, B.F.; Hill, T.C.J. Microbiology and atmospheric processes: Biological, physical and chemical characterization of aerosol particles. Biogeosciences 2009, 6, 721–737. [Google Scholar] [CrossRef] [Green Version]
- Mandal, J.; Brandl, H. Bioaerosols in Indoor Environment—A Review with Special Reference to Residential and Occupational Locations. Open Environ. Biol. Monit. J. 2011, 4, 83–96. [Google Scholar]
- Van Kampen, V.; Hoffmeyer, F.; Deckert, A.; Kendzia, B.; Casjens, S.; Neumann, H.D.; Buxtrup, M.; Willer, E.; Felten, C.; Schöneich, R.; et al. Effects of bioaerosol exposure on respiratory health in compost workers: A 13-year follow-up study. Occup. Environ. Med. 2016, 73, 829–837. [Google Scholar] [CrossRef] [PubMed]
- Farokhi, A.; Heederik, D.; Smit, L.A.M. Respiratory health effects of exposure to low levels of airborne endotoxin—A systematic review. Environ. Health 2018, 17, 1–20. [Google Scholar] [CrossRef] [PubMed] [Green Version]
- Garrett, M.H.; Rayment, P.R.; Hooper, M.A.; Abramson, M.J.; Hooper, B.M. Indoor airborne fungal spores, house dampness and associations with environmental factors and respiratory health in children. Clin. Exp. Allergy 1998, 28, 459–467. [Google Scholar] [CrossRef] [PubMed]
- Shin, S.H.; Ponikau, J.U.; Sherris, D.A.; Congdon, D.; Frigas, E.; Homburger, H.A.; Swanson, M.C.; Gleich, G.J.; Kita, H. Chronic rhinosinusitis: An enhanced immune response to ubiquitous airborne fungi. J. Allergy Clin. Immunol. 2004, 114, 1369–1375. [Google Scholar] [CrossRef]
- Vincent, M.; Corazza, F.; Chasseur, C.; Bladt, S.; Romano, M.; Huygen, K.; Denis, O.; Michel, O. Relationship between mold exposure, specific IgE sensitization, and clinical asthma: A case-control study. Ann. Allergy Asthma Immunol. 2018, 121, 333–339. [Google Scholar] [CrossRef]
- Richardson, M.; Bowyer, P.; Sabino, R. The human lung and Aspergillus: You are what you breathe in? Med. Mycol. 2019, 57, S145–S154. [Google Scholar] [CrossRef] [Green Version]
- Knutsen, A.P.; Slavin, R.G. Allergic bronchopulmonary aspergillosis in asthma and cystic fibrosis. Clin. Dev. Immunol. 2011, 2011, 1–13. [Google Scholar] [CrossRef] [PubMed] [Green Version]
- Guarner, J.; Jernigan, J.A.; Shieh, W.J.; Tatti, K.; Flannagan, L.M.; Stephens, D.S.; Popovic, T.; Ashford, D.A.; Perkins, B.A.; Zaki, S.R. Pathology and pathogenesis of bioterrorism-related inhalational anthrax. Am. J. Pathol. 2003, 163, 701–709. [Google Scholar] [CrossRef] [Green Version]
- Guidi-Rontani, C. The alveolar macrophage: The Trojan horse of Bacillus anthracis. Trends Microbiol. 2002, 10, 405–409. [Google Scholar] [CrossRef]
- Druett, H.A.; Henderson, D.W.; Packman, L.; Peacock, S. Studies on respiratory infection: I. The influence of particle size on respiratory infection with anthrax spores. J. Hyg. (Lond.) 1953, 51, 359–371. [Google Scholar] [CrossRef] [PubMed] [Green Version]
- Kim, K.H.; Kabir, E.; Jahan, S.A. Airborne bioaerosols and their impact on human health. J. Environ. Sci. (China) 2018, 67, 23–35. [Google Scholar] [CrossRef] [PubMed]
- Chan, T.L.; Lippmann, M. Experimental measurements and empirical modeling of the regional deposition of inhaled particles in humans. Am. Ind. Hygeine Assoc. 1980, 41, 399–408. [Google Scholar] [CrossRef]
- Heyder, J.; Gebhart, J.; Rudolf, G.; Schiller, C.F.; Stahlhofen, W. Deposition of particles in the human respiratory tract in the size range 0.005–15 μm. J. Aerosol Sci. 1986, 17, 811–825. [Google Scholar] [CrossRef]
- Dagenais, T.R.T.; Keller, N.P. Pathogenesis of Aspergillus fumigatus in invasive aspergillosis. Clin. Microbiol. Rev. 2009, 22, 447–465. [Google Scholar] [CrossRef] [Green Version]
- Heyder, J.; Blanchard, J.D.; Feldman, H.A.; Brain, J.D. Convective mixing in human respiratory tract—Estimates with aerosol boli. J. Appl. Physiol. 1988, 64, 1273–1278. [Google Scholar] [CrossRef]
- Hofmann, W. Modelling inhaled particle deposition in the human lung-A review. J. Aerosol Sci. 2011, 42, 693–724. [Google Scholar] [CrossRef]
- Islam, M.S.; Paul, G.; Ong, H.X.; Young, P.M.; Gu, Y.T.; Saha, S.C. A review of respiratory anatomical development, air flow characterization and particle deposition. Int. J. Environ. Res. Public Health 2020, 17, 380. [Google Scholar] [CrossRef] [PubMed] [Green Version]
- International Commission on Radiological Protection. Human Respiratory Tract Model for Radiological Protection. Ann. ICRP 1994, 24, 1–493. [Google Scholar] [CrossRef]
- Guha, S.; Hariharan, P.; Myers, M.R. Enhancement of ICRP’s lung deposition model for pathogenic bioaerosols. Aerosol Sci. Technol. 2014, 48, 1226–1235. [Google Scholar] [CrossRef]
- Anjilvel, S.; Asgharian, B. A multiple-path model of particle deposition in the rat lung. Fundam. Appl. Toxicol. 1995, 28, 41–50. [Google Scholar] [CrossRef] [Green Version]
- Asgharian, B.; Hofmann, W.; Bergmann, R. Particle deposition in a multiple-path model of the human lung. Aerosol Sci. Technol. 2001, 34, 332–339. [Google Scholar] [CrossRef]
- Yeh, H.-C.; Schum, G.M. Models of Human Lung Airways and Their Application to Inhaled Particle Deposition. Bull. Math. Biol. 1980, 42, 461–480. [Google Scholar] [CrossRef]
- Shelton, B.G.; Kirkland, K.H.; Flanders, W.D.; Morris, G.K. Profiles of airborne fungi in buildings and outdoor environments in the United States. Appl. Environ. Microbiol. 2002, 68, 1743–1753. [Google Scholar] [CrossRef] [Green Version]
- Fryar, C.D.C.; Gu, Q.; Ogden, C.L.; Flegal, K.M.; McDowell, M.A.; Fryar, C.D.C.; Ogden, C.L.; Flegal, K.M. Anthropometric Reference Data for Children and Adults: United States, 2003–2006. Vital Heal. Stat. 2010, 11, 2007–2010. [Google Scholar]
- Domsch, K.D.; Gams, W.; Anderson, T.-H. Compendium of Soil Fungi; Academic Press: London, UK, 1980. [Google Scholar]
- Spencer, R.C. Bacillus anthracis. J. Clin. Pathol. 2003, 56, 182–187. [Google Scholar] [CrossRef] [Green Version]
- Lamb, D.; Verlinde, J. Physics and Chemistry of Clouds; Cambridge University Press: Cambridge, UK, 2011; ISBN 9780521899109. [Google Scholar]
- Tian, L.; Ahmadi, G.; Wang, Z.; Hopke, P.K. Transport and deposition of ellipsoidal fibers in low Reynolds number flows. J. Aerosol Sci. 2012, 45, 1–18. [Google Scholar] [CrossRef]
- Sudakin, D.L. Stachybotrys chartarum: Current knowledge of its role in disease. MedGenMed Medscape Gen. Med. 2000, 2, E11. [Google Scholar]
- Islam, Z.; Harkema, J.R.; Pestka, J.J. Satratoxin G from the black mold Stachybotrys chartarum evokes olfactory sensory neuron loss and inflammation in the murine nose and brain. Environ. Health Perspect. 2006, 114, 1099–1107. [Google Scholar] [CrossRef] [PubMed] [Green Version]
- Carey, S.A.; Plopper, C.G.; Hyde, D.M.; Islam, Z.; Pestka, J.J.; Harkema, J.R. Satratoxin-G from the Black Mold Stachybotrys chartarum Induces Rhinitis and Apoptosis of Olfactory Sensory Neurons in the Nasal Airways of Rhesus Monkeys. Toxicol. Pathol. 2012, 40, 887–898. [Google Scholar] [CrossRef] [PubMed] [Green Version]
- CDC Inhalation Anthrax. Available online: https://www.cdc.gov/anthrax/basics/types/inhalation.html (accessed on 19 May 2020).
- Bartrand, T.A.; Weir, M.H.; Haas, C.N. Dose-response models for inhalation of Bacillus anthracis spores: Interspecies comparisons. Risk Anal. 2008, 28, 1115–1124. [Google Scholar] [CrossRef] [PubMed]
- Reponen, T. Aerodynamic Diameters and Respiratory Deposition Estimates of Viable Fungal Particles in Mold Problem Dwellings. Aerosol Sci. Technol. 1995, 22, 11–23. [Google Scholar] [CrossRef]
- Stahlhofen, W.; Rudolf, G.; James, A.C. Intercomparison of Experimental Regional Aerosol Deposition Data. J. Aerosol Med. Depos. Clear. Eff. Lung 1989, 2, 285–308. [Google Scholar] [CrossRef]
- Cho, S.H.; Seo, S.C.; Schmechel, D.; Grinshpun, S.A.; Reponen, T. Aerodynamic characteristics and respiratory deposition of fungal fragments. Atmos. Environ. 2005, 39, 5454–5465. [Google Scholar] [CrossRef]
- Birchall, A.; Bailey, M.R.; James, A.C. LUDEP: A lung dose evaluation program. Radiat. Prot. Dosim. 1991, 38, 167–174. [Google Scholar] [CrossRef]
- Thomas, R.J. Particle size and pathogenicity in the respiratory tract. Virulence 2013, 4, 847–858. [Google Scholar] [CrossRef] [PubMed] [Green Version]
- Kim, C.S.; Hu, S.C. Regional deposition of inhaled particles in human lungs; comparison between men and women. J. Appl. Physiol. 1998, 84, 1834–1844. [Google Scholar] [CrossRef]
- Mainelis, G.; Willeke, K.; Baron, P.; Reponen, T.; Grinshpun, S.A.; Górny, R.L.; Trakumas, S. Electrical charges on airborne microorganisms. J. Aerosol Sci. 2001, 32, 1087–1110. [Google Scholar] [CrossRef]
- Ali, M.; Reddy, R.N.; Mazumder, M.K. Electrostatic charge effect on respirable aerosol particle deposition in a cadaver based throat cast replica. J. Electrostat. 2008, 66, 401–406. [Google Scholar] [CrossRef]
- Prodi, V.; Mularoni, A. Electrostatic Lung Deposition Experiments. Ann. Occup. Hyg. 1985, 29, 229–240. [Google Scholar] [PubMed]
- Saini, D.; Gunamgari, J.; Zulaloglu, C.; Sims, R.A.; Mazumder, M.K. Effect of electrostatic charge and size distributions on respirable aerosol deposition in lung model. Conf. Rec. IAS Annu. Meet. IEEE Ind. Appl. Soc. 2004, 2, 948–952. [Google Scholar]
- Reponen, T.; Willeke, K.; Ulevicius, V.; Reponen, A.; Grinshpun, S.A. Effect of relative humidity on the aerodynamic diameter and respiratory deposition of fungal spores. Atmos. Environ. 1996, 30, 3967–3974. [Google Scholar] [CrossRef]
- Zhen, H.; Han, T.; Fennell, D.E.; Mainelis, G. A systematic comparison of four bioaerosol generators: Affect on culturability and cell membrane integrity when aerosolizing Escherichia coli bacteria. J. Aerosol Sci. 2014, 70, 67–79. [Google Scholar] [CrossRef]
- Ferron, G.A.; Oberdorster, G.; Henneberg, R. Estimation of the Deposition of Aerosolized Drugs in the Human Respiratory Tract Due to Hygroscopic Growth. J. Aerosol Med. 1989, 2, 271–284. [Google Scholar] [CrossRef]
- Broday, D.M.; Georgopoulos, P.G. Growth and deposition of hygroscopic particulate matter in the human lungs. Aerosol Sci. Technol. 2001, 34, 144–159. [Google Scholar] [CrossRef]
- Harapan, H.; Itoh, N.; Yufika, A.; Winardi, W.; Keam, S.; Te, H.; Megawati, D.; Hayati, Z.; Wagner, A.L.; Mudatsir, M. Coronavirus disease 2019 (COVID-19): A literature review. J. Infect. Public Health 2020, 13, 667–673. [Google Scholar] [CrossRef]
- Lindsley, W.G.; Pearce, T.A.; Hudnall, J.B.; Davis, K.A.; Davis, S.M.; Fisher, M.A.; Khakoo, R.; Palmer, J.E.; Clark, K.E.; Celik, I.; et al. Quantity and size distribution of cough-generated aerosol particles produced by influenza patients during and after illness. J. Occup. Environ. Hyg. 2012, 9, 443–449. [Google Scholar] [CrossRef]
- Cox, C.S.W.; Christopher, M. Bioaerosols Handbook; CRC Press: Boca Raton, FL, USA, 1995. [Google Scholar]
Figure 1.
Diagram of regions of interest in the respiratory tract. The extrathoracic (ET) region is shaded in gray, the tracheobronchial (TB) region is shaded in blue, and the alveolar (AL) region is shaded in red. The indicated sizes are an approximation, and the actual sizes of penetrating particles depend on a person’s physiology, breathing patterns, and other variables.

Figure 2.
Regional and total deposition fraction for the default scenario: (a) ET deposition, (b) TB deposition, (c) AL deposition, and (d) total deposition.
Figure 2.
Regional and total deposition fraction for the default scenario: (a) ET deposition, (b) TB deposition, (c) AL deposition, and (d) total deposition.

Figure 3.
Regional and total deposition fraction for the light exercise scenario: (a) ET deposition, (b) TB deposition, (c) AL deposition, and (d) total deposition.
Figure 3.
Regional and total deposition fraction for the light exercise scenario: (a) ET deposition, (b) TB deposition, (c) AL deposition, and (d) total deposition.

Figure 4.
Regional and total deposition fraction for the mouth-breathing scenario: (a) ET deposition, (b) TB deposition, (c) AL deposition, and (d) total deposition.
Figure 4.
Regional and total deposition fraction for the mouth-breathing scenario: (a) ET deposition, (b) TB deposition, (c) AL deposition, and (d) total deposition.


Table 1.
Breathing parameters used in model runs.
| Model Input Parameter | Value |
|---|---|
| Functional Residual Capacity (FRC) | 3075.75 mL |
| Upper Respiratory Tract (URT) volume | 48.2 mL |
| Tidal volume, sitting | 568.33 mL |
| Tidal volume, light exercise | 1122.88 mL |
| Breathing frequency | 12 breaths/minute for default and mouth-breathing cases 14 breaths/minute for light exercise case |
| Inhalation time fraction | 50% |
Table 2.
Size of microorganism species used in model runs [29].
Table 2.
Size of microorganism species used in model runs [29].
| Species | Shape and Approximate Dimensions (µm) | Aerodynamic Diameter (µm), Oblate | Aerodynamic Diameter (µm), Prolate | Average Aerodynamic Diameter (µm) |
|---|---|---|---|---|
| Bacillus anthracis spores | Ellipsoid; 0.5 × 0.5 × 1 | 1.39 | 1.55 | 1.47 |
| Bacillus anthracis cells | Long rod; 1.25 × 6.5 | 2.14 | 2.41 | 2.28 |
| Aspergillus clavatus | Spherical; 3 | 3 | 3 | 3 |
| Stachybotrys chartarum | Ellipsoid; 3 × 3 × 5 | 7.66 | 8.34 | 8 |
Table 3.
Deposition fractions as calculated by the effect of the age-specific model with input values ± 20% from values calculated by BAIL for each scenario.
Table 3.
Deposition fractions as calculated by the effect of the age-specific model with input values ± 20% from values calculated by BAIL for each scenario.
| Region | Tidal Volume | Functional Residual Capacity | ||||||
|---|---|---|---|---|---|---|---|---|
| −20% | Average | +20% | −20% | Average | +20% | |||
| B. anthracis spores | Default | ET | 0.1970 | 0.2165 | 0.2620 | 0.2130 | 0.2165 | 0.2190 |
| TB | 0.0414 | 0.0407 | 0.0386 | 0.0399 | 0.0407 | 0.0415 | ||
| AL | 0.1982 | 0.2312 | 0.2280 | 0.2557 | 0.2312 | 0.2087 | ||
| Total | 0.4366 | 0.4884 | 0.5285 | 0.5086 | 0.4884 | 0.4691 | ||
| Light Exercise | ET | 0.2980 | 0.3460 | 0.3895 | 0.9990 | 0.3460 | 0.3485 | |
| TB | 0.0377 | 0.0370 | 0.0366 | 0.0376 | 0.0370 | 0.0368 | ||
| AL | 0.2467 | 0.2421 | 0.2327 | 0.2524 | 0.2421 | 0.2307 | ||
| Total | 0.5823 | 0.6254 | 0.6587 | 0.6335 | 0.6254 | 0.6160 | ||
| Mouth Breathing | ET | 0.0095 | 0.0095 | 0.0095 | 0.0095 | 0.0095 | 0.0095 | |
| TB | 0.0478 | 0.0469 | 0.0465 | 0.0460 | 0.0469 | 0.0478 | ||
| AL | 0.2355 | 0.2666 | 0.2859 | 0.2948 | 0.2666 | 0.2406 | ||
| Total | 0.2928 | 0.3230 | 0.3419 | 0.3503 | 0.3230 | 0.2979 | ||
| B. anthracis bacteria | Default | ET | 0.3315 | 0.3765 | 0.4160 | 0.3705 | 0.3765 | 0.3820 |
| TB | 0.0521 | 0.0473 | 0.0439 | 0.0458 | 0.0473 | 0.0487 | ||
| AL | 0.2783 | 0.2944 | 0.2975 | 0.3184 | 0.2944 | 0.2710 | ||
| Total | 0.6618 | 0.7182 | 0.7574 | 0.7346 | 0.7182 | 0.7017 | ||
| Light Exercise | ET | 0.4805 | 0.5350 | 0.5810 | 0.5315 | 0.5350 | 0.5390 | |
| TB | 0.0399 | 0.0374 | 0.0361 | 0.0388 | 0.0374 | 0.0369 | ||
| AL | 0.2879 | 0.2706 | 0.2506 | 0.2778 | 0.2706 | 0.2613 | ||
| Total | 0.8082 | 0.8430 | 0.8677 | 0.8480 | 0.8430 | 0.8372 | ||
| Mouth Breathing | ET | 0.0180 | 0.0195 | 0.0210 | 0.0195 | 0.0195 | 0.0195 | |
| TB | 0.0671 | 0.0643 | 0.0628 | 0.0622 | 0.0643 | 0.0662 | ||
| AL | 0.3583 | 0.4000 | 0.4253 | 0.4325 | 0.4000 | 0.3683 | ||
| Total | 0.4434 | 0.4838 | 0.5091 | 0.5142 | 0.4838 | 0.4540 | ||
| Aspergillus clavatus | Default | ET | 0.4530 | 0.5010 | 0.5420 | 0.4940 | 0.5010 | 0.5080 |
| TB | 0.0593 | 0.0521 | 0.0470 | 0.0506 | 0.0521 | 0.0537 | ||
| AL | 0.2841 | 0.2900 | 0.2849 | 0.3090 | 0.2900 | 0.2708 | ||
| Total | 0.7964 | 0.8431 | 0.8739 | 0.8536 | 0.8431 | 0.8325 | ||
| Light Exercise | ET | 0.6050 | 0.6550 | 0.6950 | 0.6510 | 0.6550 | 0.6580 | |
| TB | 0.0413 | 0.0385 | 0.0374 | 0.0417 | 0.0385 | 0.0371 | ||
| AL | 0.2638 | 0.2386 | 0.2145 | 0.2419 | 0.2386 | 0.2334 | ||
| Total | 0.9101 | 0.9321 | 0.9469 | 0.9346 | 0.9321 | 0.9285 | ||
| Mouth Breathing | ET | 0.0330 | 0.0360 | 0.0400 | 0.0360 | 0.0360 | 0.0360 | |
| TB | 0.0887 | 0.0843 | 0.0819 | 0.0819 | 0.0843 | 0.0869 | ||
| AL | 0.4248 | 0.4693 | 0.4960 | 0.5000 | 0.4693 | 0.4382 | ||
| Total | 0.5465 | 0.5896 | 0.6179 | 0.6179 | 0.5896 | 0.5611 | ||
| Stachybotrys chartarum | Default | ET | 0.8825 | 0.9025 | 0.9165 | 0.9000 | 0.9025 | 0.9045 |
| TB | 0.0589 | 0.0509 | 0.0462 | 0.0560 | 0.0509 | 0.0480 | ||
| AL | 0.0487 | 0.0412 | 0.0335 | 0.0391 | 0.0412 | 0.0413 | ||
| Total | 0.9901 | 0.9946 | 0.9962 | 0.9951 | 0.9946 | 0.9938 | ||
| Light Exercise | ET | 0.9360 | 0.9485 | 0.9575 | 0.9485 | 0.9485 | 0.9495 | |
| TB | 0.0408 | 0.0366 | 0.0329 | 0.0406 | 0.0366 | 0.0332 | ||
| AL | 0.0217 | 0.0138 | 0.0088 | 0.0106 | 0.0138 | 0.0163 | ||
| Total | 0.9985 | 0.9988 | 0.9992 | 0.9997 | 0.9988 | 0.9990 | ||
| Mouth Breathing | ET | 0.3260 | 0.3540 | 0.3770 | 0.3540 | 0.3540 | 0.3540 | |
| TB | 0.2645 | 0.2732 | 0.2881 | 0.3004 | 0.2732 | 0.2576 | ||
| AL | 0.2170 | 0.2189 | 0.2067 | 0.2077 | 0.2189 | 0.2195 | ||
| Total | 0.8075 | 0.8462 | 0.8718 | 0.8621 | 0.8462 | 0.8311 | ||
© 2020 by the authors. Licensee MDPI, Basel, Switzerland. This article is an open access article distributed under the terms and conditions of the Creative Commons Attribution (CC BY) license (http://creativecommons.org/licenses/by/4.0/).
Share and Cite
MDPI and ACS Style
Sagona, J.A.; Secondo, L.E.; Mainelis, G. Comparison of Two Models to Estimate Deposition of Fungi and Bacteria in the Human Respiratory Tract. Atmosphere 2020, 11, 561. https://doi.org/10.3390/atmos11060561
AMA Style
Sagona JA, Secondo LE, Mainelis G. Comparison of Two Models to Estimate Deposition of Fungi and Bacteria in the Human Respiratory Tract. Atmosphere. 2020; 11(6):561. https://doi.org/10.3390/atmos11060561
Chicago/Turabian StyleSagona, Jessica A., Lynn E. Secondo, and Gediminas Mainelis. 2020. "Comparison of Two Models to Estimate Deposition of Fungi and Bacteria in the Human Respiratory Tract" Atmosphere 11, no. 6: 561. https://doi.org/10.3390/atmos11060561
Note that from the first issue of 2016, this journal uses article numbers instead of page numbers. See further details here.