Grapevine Phenology in Four Portuguese Wine Regions: Modeling and Predictions
by
 , , , , and
Samuel Reis
1,* ,
,
Helder Fraga
2 ,
,
Cristina Carlos
3,
José Silvestre
4,
José Eiras-Dias
4,
Pedro Rodrigues
5 and
João A. Santos
2 1
CoLAB VINES&WINES-National Collaborative Laboratory for the Portuguese Wine Sector, Associação para o Desenvolvimento da Viticultura Duriense (ADVID), Edifício Centro de Excelência da Vinha e do Vinho, Régia Douro Park, 5000-033 Vila Real, Portugal
2
Centre for the Research and Technology of Agro-Environmental and Biological Sciences, CITAB, Universidade de Trás-os-Montes e Alto Douro, UTAD, 5000-801 Vila Real, Portugal
3
ADVID, Associação para o Desenvolvimento da Viticultura Duriense, Parque de Ciência e Tecnologia de Vila Real–Régia Douro Park, 5000-033 Vila Real, Portugal
4
Instituto Nacional de Investigação Agrária e Veterinária, I.P., 2565-191 Dois Portos, Portugal
5
CERNAS-IPV Research Centre, Polytechnic Institute of Viseu, Campus Politécnico, Repeses, 3504-510 Viseu, Portugal
*
Author to whom correspondence should be addressed.
Appl. Sci. 2020, 10(11), 3708; https://doi.org/10.3390/app10113708
Submission received: 4 May 2020
/
Revised: 21 May 2020
/
Accepted: 25 May 2020
/
Published: 27 May 2020
(This article belongs to the Special Issue Climate Change Impact on Viticulture and Potential Adaptation Strategies)
Abstract
:Phenological models applied to grapevines are valuable tools to assist in the decision of cultural practices related to winegrowers and winemakers. The two-parameter sigmoid phenological model was used to estimate the three main phenological stages of the grapevine development, i.e., budburst, flowering, and veraison. This model was calibrated and validated with phenology data for 51 grapevine varieties distributed in four wine regions in Portugal (Lisboa, Douro, Dão, and Vinhos Verdes). Meteorological data for the selected sites were also used. Hence, 153 model calibrations (51 varieties × 3 phenological stages) and corresponding parameter estimations were carried out based on an unprecedented comprehensive and systematized dataset of phenology in Portugal. For each phenological stage, the centroid of the estimated parameters was subsequently used, and three generalized sigmoid models (GSM) were constructed (budburst: d = −0.6, e = 8.6; flowering: d = −0.6, e = 13.7; veraison: d = −0.5, e = 13.2). Centroid parameters show high performance for approximately 90% of the varieties and can thereby be used instead of variety-specific parameters. Overall, the RMSE (root-mean-squared-error) is < 7 days, while the EF (efficiency coefficient) is > 0.5. Additionally, according to other studies, the predictive capacity of the models for budburst remains lower than for flowering or veraison. Furthermore, the F-forcing parameter (thermal accumulation) was evaluated for the Lisboa wine region, where the sample size is larger, and for the varieties with model efficiency equal to or greater than 0.5. A ranking and categorization of the varieties in early, intermediate, and late varieties was subsequently undertaken on the basis of F values. These results can be used to more accurately monitor and predict grapevine phenology during a given season, thus supporting decision making in the Portuguese wine sector.
1. Introduction
Phenology can be understood as the study of the phenological events, or the stages of plant development that occur during their active lifecycle, in response to climatic conditions [1]. This is particularly important in agriculture, as crops are subject to continuously evolving environmental conditions. For a specific site and year, the farmer may vary strategies, such as irrigation, to adapt a particular crop to the current environmental conditions [2], aiming to maintain or even improve the annual productivity and income.
The development of grapevines is mainly influenced by climatic elements [3], such as temperature, solar radiation, and precipitation, which also influence the production and the quality of grape berries [4,5]. In effect, temperature is the main forcing element on the phenology of grapevines [6,7]. The projected increases in temperature under future likely climate change scenarios may lead to the advancement of 6 to 25 days for different grapevine varieties in Europe [8]. In addition, accelerated growth and a shortening of the phenological phases are expected [9], which may also affect the composition and the quality of grape berries and of the wine produced in a given region.
Grapevine varieties have a vast genetic variability within the species Vitis vinifera L., which is manifested in their different phenological timings. Although the varieties are usually well adapted to the specific climatic conditions of the sites where they traditionally grow [10,11], they do differ in the thermal accumulation required for a given phenological stage [12,13]. As an illustration, in a study carried out by Moncur et al. [14], the thermal requirement of ten varieties were compared, being within a certain range of base temperatures suitable for budburst (0.4 °C to 4.6 °C). Still in another study for five varieties, different responses to growth and development were found after budburst within a temperature range between 15 °C and 35 °C [15].
Temperature-driven phenological models can be used for forecasting and thus to better understand the temporal evolution of grapevines [16]. The models that integrate a dormancy phase typically include the sum of daily temperatures above a certain level at which the grapevine breaks dormancy. These models differ in the articulation between the thermal effects of the dormancy phase and the grapevine vegetative phase, being designated as alternating [17,18], sequential [19], parallel [20,21], unified [22], deepening rest [23], and four phases [21,24]. The thermal models of the vegetative cycle are based on the occurrence of a given phenological stage through a sum of temperatures, starting on a pre-defined date and needing reach a given threshold for each variety. For the phenological models on the basis of growing degree-days (GDD) or heat units, the temperatures are accumulated from a certain value called the base temperature (lower thermal limit). Although this value is conventionally considered of 10 °C for grapevine [25], Parker et al. [26] recommended 0 °C for the calculation of heat units. Furthermore, some authors suggest that the thermal accumulation should start on the first day of the year [27,28]. Despite being a very simple model, the degree-day model also has important constraints [29].
The two-parameter sigmoid model (SM henceforth) proposed by Hänninen [21] overcomes the limitation of imposing an artificial threshold for heat accumulation, as it allows a gradual change in the weights given to different temperatures within a transition range. The Wang and Engel [30] model also considers the potential negative effects of high temperatures on the development of a given crop. Nevertheless, an accurate estimation of these model parameters requires a sufficiently large sample of data on the upper side of the curve, which is not always feasible in temperate climates. A recent study on grapevine phenology in Portugal tested several phenological models applied to different regions and two main varieties cultivated in Portugal (cv. Touriga Nacional and cv. Touriga Franca) [31]. This study demonstrated that the SM tends to show higher performances in simulating budburst, flowering, and veraison than other commonly used models. Other studies have also selected this model and showed its relatively high performance [26,29].
The main objective of the present study is to develop tools to support the winegrower’s decision in Portugal. In that way, models were developed based on SM to predict three different stages of the grapevine phenology, that is, budburst, flowering, and veraison. These phenological models were calibrated and validated for a large number of grapevine varieties (51) and four major Portuguese wine regions: Douro, Dão, Vinhos Verdes and Lisboa. The points of the study were as follows: (1) calibration of the SM for each variety, region, and phenological stage, and (2) development of a GSM for each phenological stage and assessment of its representativeness among the set of selected grapevine varieties, envisioning its future application in a decision support platform.
2. Material and Methods
2.1. Study Area and Datasets
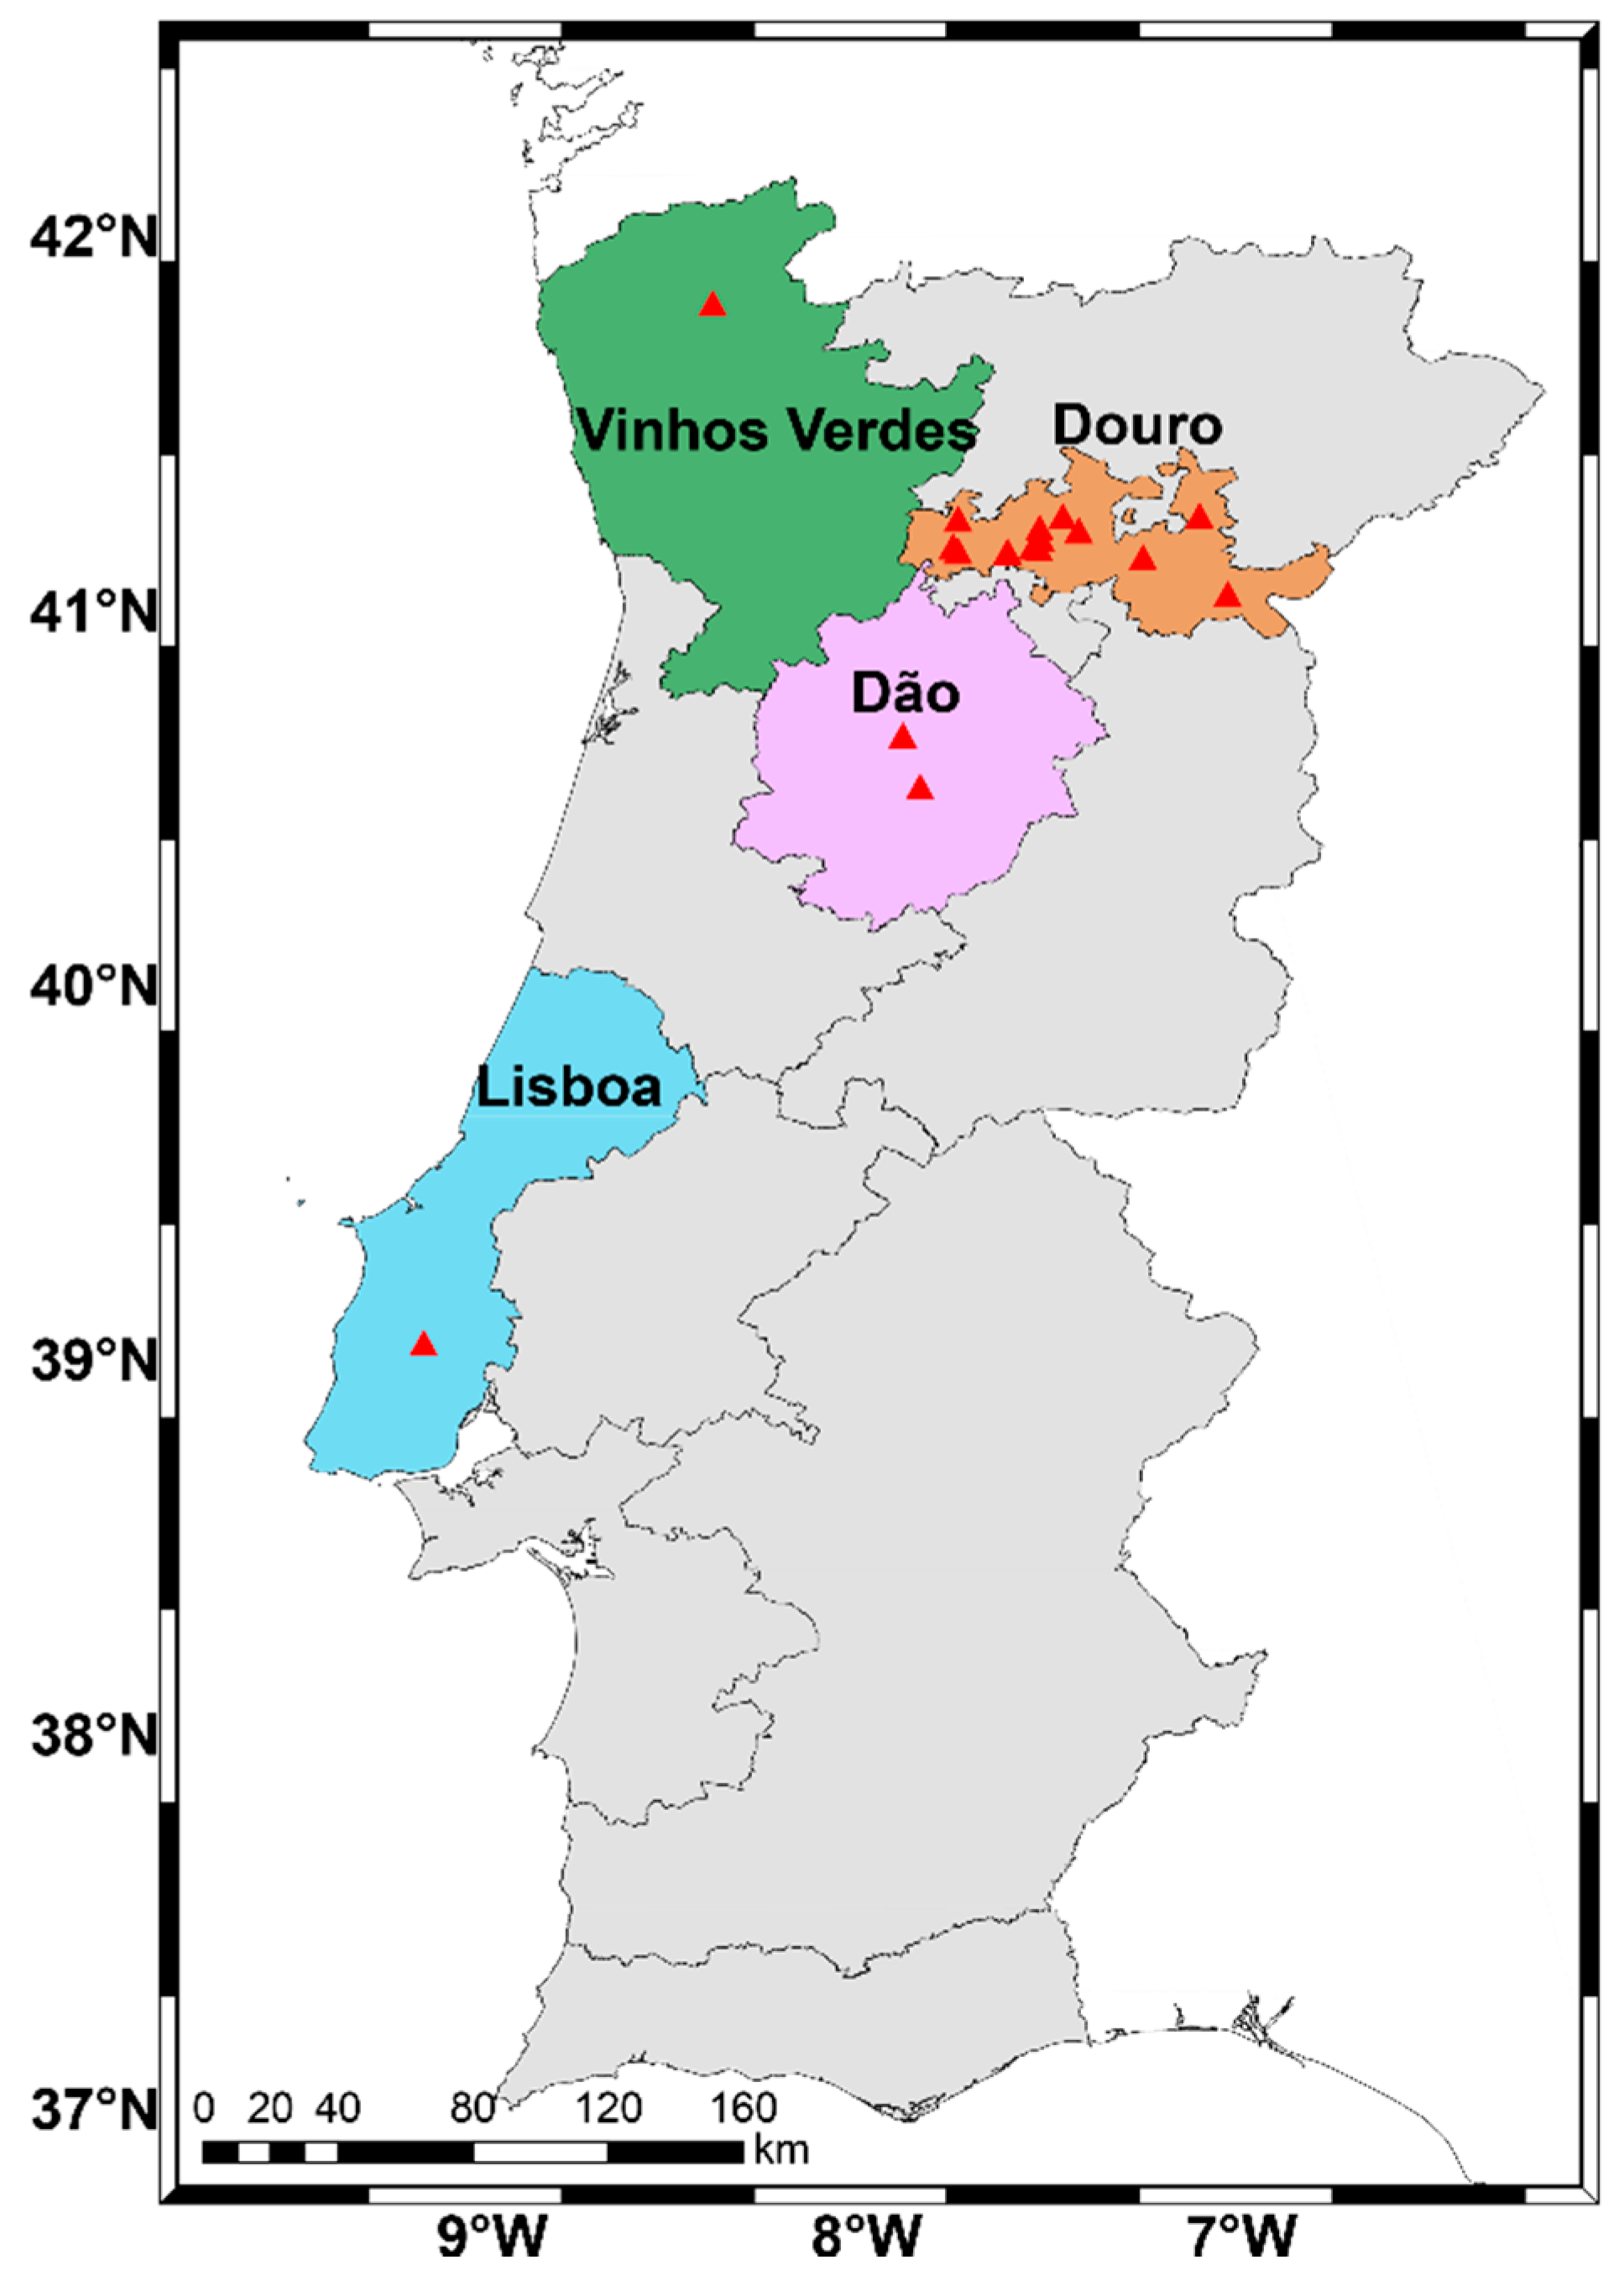
In the present study, phenological and meteorological data from four major winemaking regions and 19 vineyard plots in Portugal were used. Figure 1 depicts the map of Portugal with the location of the targeted wine regions: Douro, Dão, Vinhos Verdes, and Lisboa. The locations of the different vineyard plots and of their corresponding weather stations are shown in Figure 1. Weather stations are located in close proximity (a few meters) to the experimental plots. The available periods of phenological data for all the selected varieties are shown in Table 1. For these same periods, daily mean temperatures recorded in the local weather stations were retrieved for the analysis. A preliminary quality-checking was also carried out in the temperature time series at each location. Outlier values (e.g., values outside the interval ± three standard deviations from the corresponding daily climate-mean) were not detected in the series. Data gaps were subsequently filled in using linear regression estimations between weather station temperatures and the nearest grid point temperatures from a gridded observation dataset, available at 1 km spatial resolution over mainland Portugal [32,33]. In all cases, very high correlation coefficients were found between both datasets on the daily timescales (> 0.95, statistically significant at 99% confidence level). However, data gaps never represented more than 5% of the time series length.
Phenological stages were recorded through site observations based on the Baggiolini scale [34] and evaluated when at least 50% of a pre-defined and time-invariant (homogeneous) subsample of plants reached the corresponding stage. Subsequently, this scale was converted to the BBCH (Biologische Bundesanstalt, Bundessortenamt und CHemische Industrie) scale [35] as follows: budburst (BBCH 07), flowering (BBCH 65), and veraison (BBCH 81). The number of plants in each subsample varies according to the wine region, being as follows: seven (Vinhos Verdes), six (Dão), seven (Lisboa), and five to ten (Douro).
For the Douro wine region, a total of 14 farms were used, with data available from 1990 to 2018 (29 years). Meteorological and phenological data were collected through a network of plots from the viticultural observatory under the coordination of the technical team of ADVID (Associação para o Desenvolvimento da Viticultura Duriense, Vila Real, Portugal) and for three varieties: cv. Touriga Franca, Touriga Nacional and Moscatel Galego. Data collected in the region by DRAPN (Direção Regional de Agricultura e Pescas do Norte, Vila Real, Portugal) were also used, namely for cv. Aragonez and cv. Touriga Franca (Quinta de Santa Bárbara). For the Dão wine region, phenological data from 2014 to 2018 (5 years) were used as well as meteorological data recorded at three local weather stations. The collected phenological data are for the following five varieties: cv. Alfrocheiro, Baga, Bical, Jaen and Touriga Nacional. Data from the Vinhos Verdes wine region were provided by EVAG (Estação Vitivinícola Amândio Galhano, Arcos de Valdevez, Portugal), with both phenological and meteorological data available from 1996 to 2017 (22 years) and selecting the following six varieties: cv. Alvarinho, Arinto, Azal Branco, Espadeiro, Vinhão and Loureiro. Lastly, for the Lisboa wine region, data were provided by INIAV-DP (Instituto Nacional de Investigação Agrária e Veterinária - Dois Portos, Portugal), with phenological and meteorological data available from 1990 to 2018 (29 years) and for the following 36 varieties: cv. Alfrocheiro, Alvarinho, Antão Vaz, Aragonez, Arinto, Avesso, Azal Branco, Baga, Bastardo, Cabernet Sauvignon, Castelão, Chardonnay, Dona Maria, Encruzado, Espadeiro, Fernão Pires, Gouveio, Jaen, Loureiro, Malvasia Fina, Merlot, Moscatel de Setúbal, Moscatel Galego, Pinot, Riesling, Sauvignon, Síria, Syrah, Tinta Barroca, Tinta Francisca, Tinto Cão, Touriga Franca, Touriga Nacional, Trajadura, Vinhão, and Viosinho.
2.2. Phenological Model
In this study, the SM was applied to simulate the three main grapevine phenological stages (budburst, flowering, and veraison). The SM function (1) contains two parameters for the construction of the response graph [21]. The e parameter relates to the location of the model curve, whereas the d parameter determines the sharpness of the curve. The corresponding mathematical function is as follows:
where is the daily mean temperature, while e and d are the aforementioned SM parameters. The integral of this function from the onset date to the estimated date of the phenophase stage corresponds to the metric F, which is thus the critical thermal forcing (sum of units) required to complete a given phenophase. The onset date chosen for heat accumulation to complete the budburst is 1 January, while the accumulation for flowering and veraison started on the preceding phenophase, i.e., on budburst or flowering, respectively.
2.3. Modeling Software and Performance Parameters
In this study, the PMP (Phenology Modeling Platform) version 5.5 [16] was used to test and calibrate the SM. PMP is a user-friendly platform that allows applying and testing different phenological models for different purposes. On this platform, meteorological and phenological data are used to calibrate and validate models. The PMP estimates parameters based on the Metropolis annealing algorithm [36]. For each specific location, the input data are daily minimum, maximum and minimum two meter air temperatures, latitude, and the three observed phenological stages (in days of the year). The model performance is assessed by two metrics: the root-mean-squared-error (RMSE, Equation (2)) and the efficiency coefficient (EF, Equation (3)). Their respective formulations are as follows:
where means the observed phenological date, and denotes the average of the observed value over the full record period. is the simulated phenological date, n is the sample size (number of years), and k is the number of model parameters (two in the case of SM). The efficiency coefficient (EF) varies between –∞ and +1. A +1 score corresponds to a perfect fit, zero when the model has the same performance as the observed average and less than zero when the adjustment has a lower performance than the observed average. In order to avoid model overfitting, model calibration should be followed by model verification, preferentially using additional validation periods, which should also be randomly selected from the original time series to discard serial auto-correlation. Nonetheless, owing to the short sample sizes available for the present study, this methodology cannot be robustly applied. Therefore, a leave-one-out cross-validation was used for model validation. Equation (4) defines the adapted RMSE of prediction (RMSEP):
where is the predicted value by cross-validation [31].
3. Results
3.1. Characterization of the Phenological Stages
The average values observed for the three main phenological stages (budburst, flowering, and veraison) for each variety and wine region from 1990 to 2018 are represented in Figure 2. In the analysis of the average values of the different phenological stages, the grapevine varieties were split into early, intermediate, and late, which correspond to Quartile 1 (≤ 25%), Quartile 2 + Quartile 3 (between 25% and 75%), and Quartile 4 (≥ 75%), respectively. It should be highlighted that this classification depends on the phenological stage, that is, the same variety can be keyed to different classes.
Concerning budburst, the Lisboa wine region reveals 16 early varieties, ranging from cv. Moscatel Galego (DOY: 68), the earliest, to cv. Encruzado (DOY: 77). Between Q2 and Q3, 24 intermediate varieties are included in the three regions (Lisboa, Douro and Vinhos Verdes). In this case, the earliest varieties to complete this stage are cv. Aragonez/Douro and Touriga Nacional/Douro (DOY: 78), but some varieties need nine days more to achieve budburst, such as cv. Trajadura/Lisboa and cv. Azal Branco/Vinhos Verdes (DOY: 87). Regarding the late varieties (Q4), they vary from cv. Vinhão/Lisboa (DOY: 88) to cv. Baga/Dão (DOY: 100), thus showing a 12 day lag.
For flowering, they bear the accumulated effect of the budburst date, being cv. Touriga Nacional/Douro the earliest (DOY: 136). Furthermore, 27 intermediate red and white varieties are found in the different wine regions, with cv. Riesling/Lisboa (DOY: 143) reaching flowering six days earlier than cv. Arinto/Lisboa (DOY: 149). Among the late grape varieties, the earliest is cv. Bical/Dão (DOY: 150), whereas cv. Vinhão/Vinhos Verdes (DOY: 155) is five days delayed.
For veraison, there are 14 early grapevine varieties among the three regions (Lisboa, Dão and Douro), of which the earliest is cv. Touriga Franca/Douro (DOY: 201), whereas cv. Tinta Francisca/Lisboa (DOY: 215) needs 14 more days to fulfill veraison. For the 24 intermediate varieties, cv. Fernão Pires/Lisboa completes the stage in DOY 216, while cv. Trajadura/Lisboa needs eight more days on average. Regarding the late varieties, there is a greater precocity of cv. Encruzado/Lisboa (DOY: 225), the last variety to complete the stage being cv. Azal Branco/Lisboa (DOY: 232).
For the budburst-flowering phenophase, cv. Touriga Nacional/Dão shows the shortest length (50 days), while cv. Azal Branco/Lisboa (71 days) reveals the longest length. For the flowering-veraison phenophase, cv. Aragonez/Douro (58 days) depicts the shortest period, whereas cv. Avesso/Lisboa (91 days) shows the longest duration.
As for some major grapevine varieties growing in Portugal, there are data available in more than one wine region, and comparisons can still be made between regions based on the average phenological dates (Figure 2). For cv. Touriga Nacional, a widely known Portuguese variety with data available in three wine regions (Douro, Dão, and Lisboa) and for the three selected phenological stages, some regional differences can be found (Figure 2). This variety fulfills budburst, on average, in DOY 78 in both the Douro and the Lisboa wine regions, whereas it needs 21 more days in the Dão region (DOY: 99). Conversely, this variety presents a shorter budburst-flowering phenophase length in the Dão region (50 days), requiring eight more days in the Douro and 15 days in the Lisboa wine region. The flowering-veraison phenophase is also shorter in Dão (69 days), being one day longer in the Douro and more than that in Lisboa (78 days). Hence, the veraison occurs, on average, in DOY 206 (Douro), 218 (Dão), and 221 (Lisboa).
Concerning cv. Touriga Franca, phenological data are available in two wine regions (Douro and Lisboa). According to the mean observed values, there are also slight differences between regions (Figure 2). For budburst, it completes this stage in DOY 76 in Lisboa, while it needs four more days in the Douro region. The budburst-flowering phenophase length is shorter in the Douro (57 days), while it requires nine more days in the Lisboa wine region. For the flowering-veraison phenophase, the difference is of only one day between the Douro and the Lisboa regions (64 and 65 days, respectively). As such, veraison is observed, on average, in DOY 201 in Douro and in DOY 207 in Lisboa, respectively. Cv. Touriga Franca is an earlier variety when compared to cv. Touriga Nacional in the same regions.
With respect to cv. Baga and for the two regions (Dão and Lisboa) with data available, it achieves, on average, budburst first in the Lisboa wine region (DOY 84) and much later in Dão (DOY 100) (Figure 2). On the contrary, the budburst-flowering phenophase duration is 11 days shorter in the Dão region than in the Lisboa wine region. For the flowering-veraison phenophase, there is a difference of 13 days between Dão and Lisboa wine regions (59 and 72 days, respectively). Therefore, the average veraison dates are in DOY 210 in the Dão wine region and DOY 218 in the Lisboa wine region. Cv. Baga is also an earlier variety when compared to cv. Touriga Nacional in the same regions. For cv. Alfrocheiro, there are also some noteworthy differences between the Lisboa and the Dão wine regions (Figure 2). It accomplishes budburst in DOY 75 in Lisboa and takes 18 days more in the Dão region (DOY 93). The budburst-flowering phenophase length is 14 days shorter in Dão than in Lisboa (55 and 69 days, respectively). The flowering-veraison phenophase length is accomplished in 64 days in Dão and 71 days in Lisboa. Thus, the veraison timings are as follows: DOY 212 in Dão and DOY 215 in Lisboa, being a slightly earlier variety when compared with cv. Touriga Nacional.
Finally, regarding cv. Alvarinho with data for the Vinhos Verdes and the Lisboa wine regions (Figure 2), it completes budburst in DOY 79 in Lisboa and takes three days more in Vinhos Verdes (DOY 82). There is a difference of only two days in the budburst-flowering phenophase duration between Vinhos Verdes and Lisboa (64 and 66 days, respectively). The flowering-veraison phenophase length is fulfilled in 71 days in Vinhos Verdes and 78 days in Lisboa. As such, veraison occurs, on average, in DOY 217 in Vinhos Verdes and DOY 223 in the Lisboa wine region. It is thereby the later variety of the previous five.
Overall, these temporal lags in the phenological timings of the same variety grown in different wine regions can be largely attributed to their different climatic conditions. In fact, the existence of more continental climates (cooler winters and warmer summers) in the Douro or the Dão wine regions than in the Vinhos Verdes or the Lisboa wine regions, which have more maritime climates, explains the delay of budburst and the generally shorter budburst-flowering and flowering-veraison phenophase lengths in the former. Soils, rootstocks, cultural practices, and clonal diversity may also play an important role in these phenological heterogeneities among regions, though these assessments would require a substantially larger dataset of field measurements and experimental vineyards, which is out of the scope of the present study.
3.2. Performance Analysis of the Phenological Model
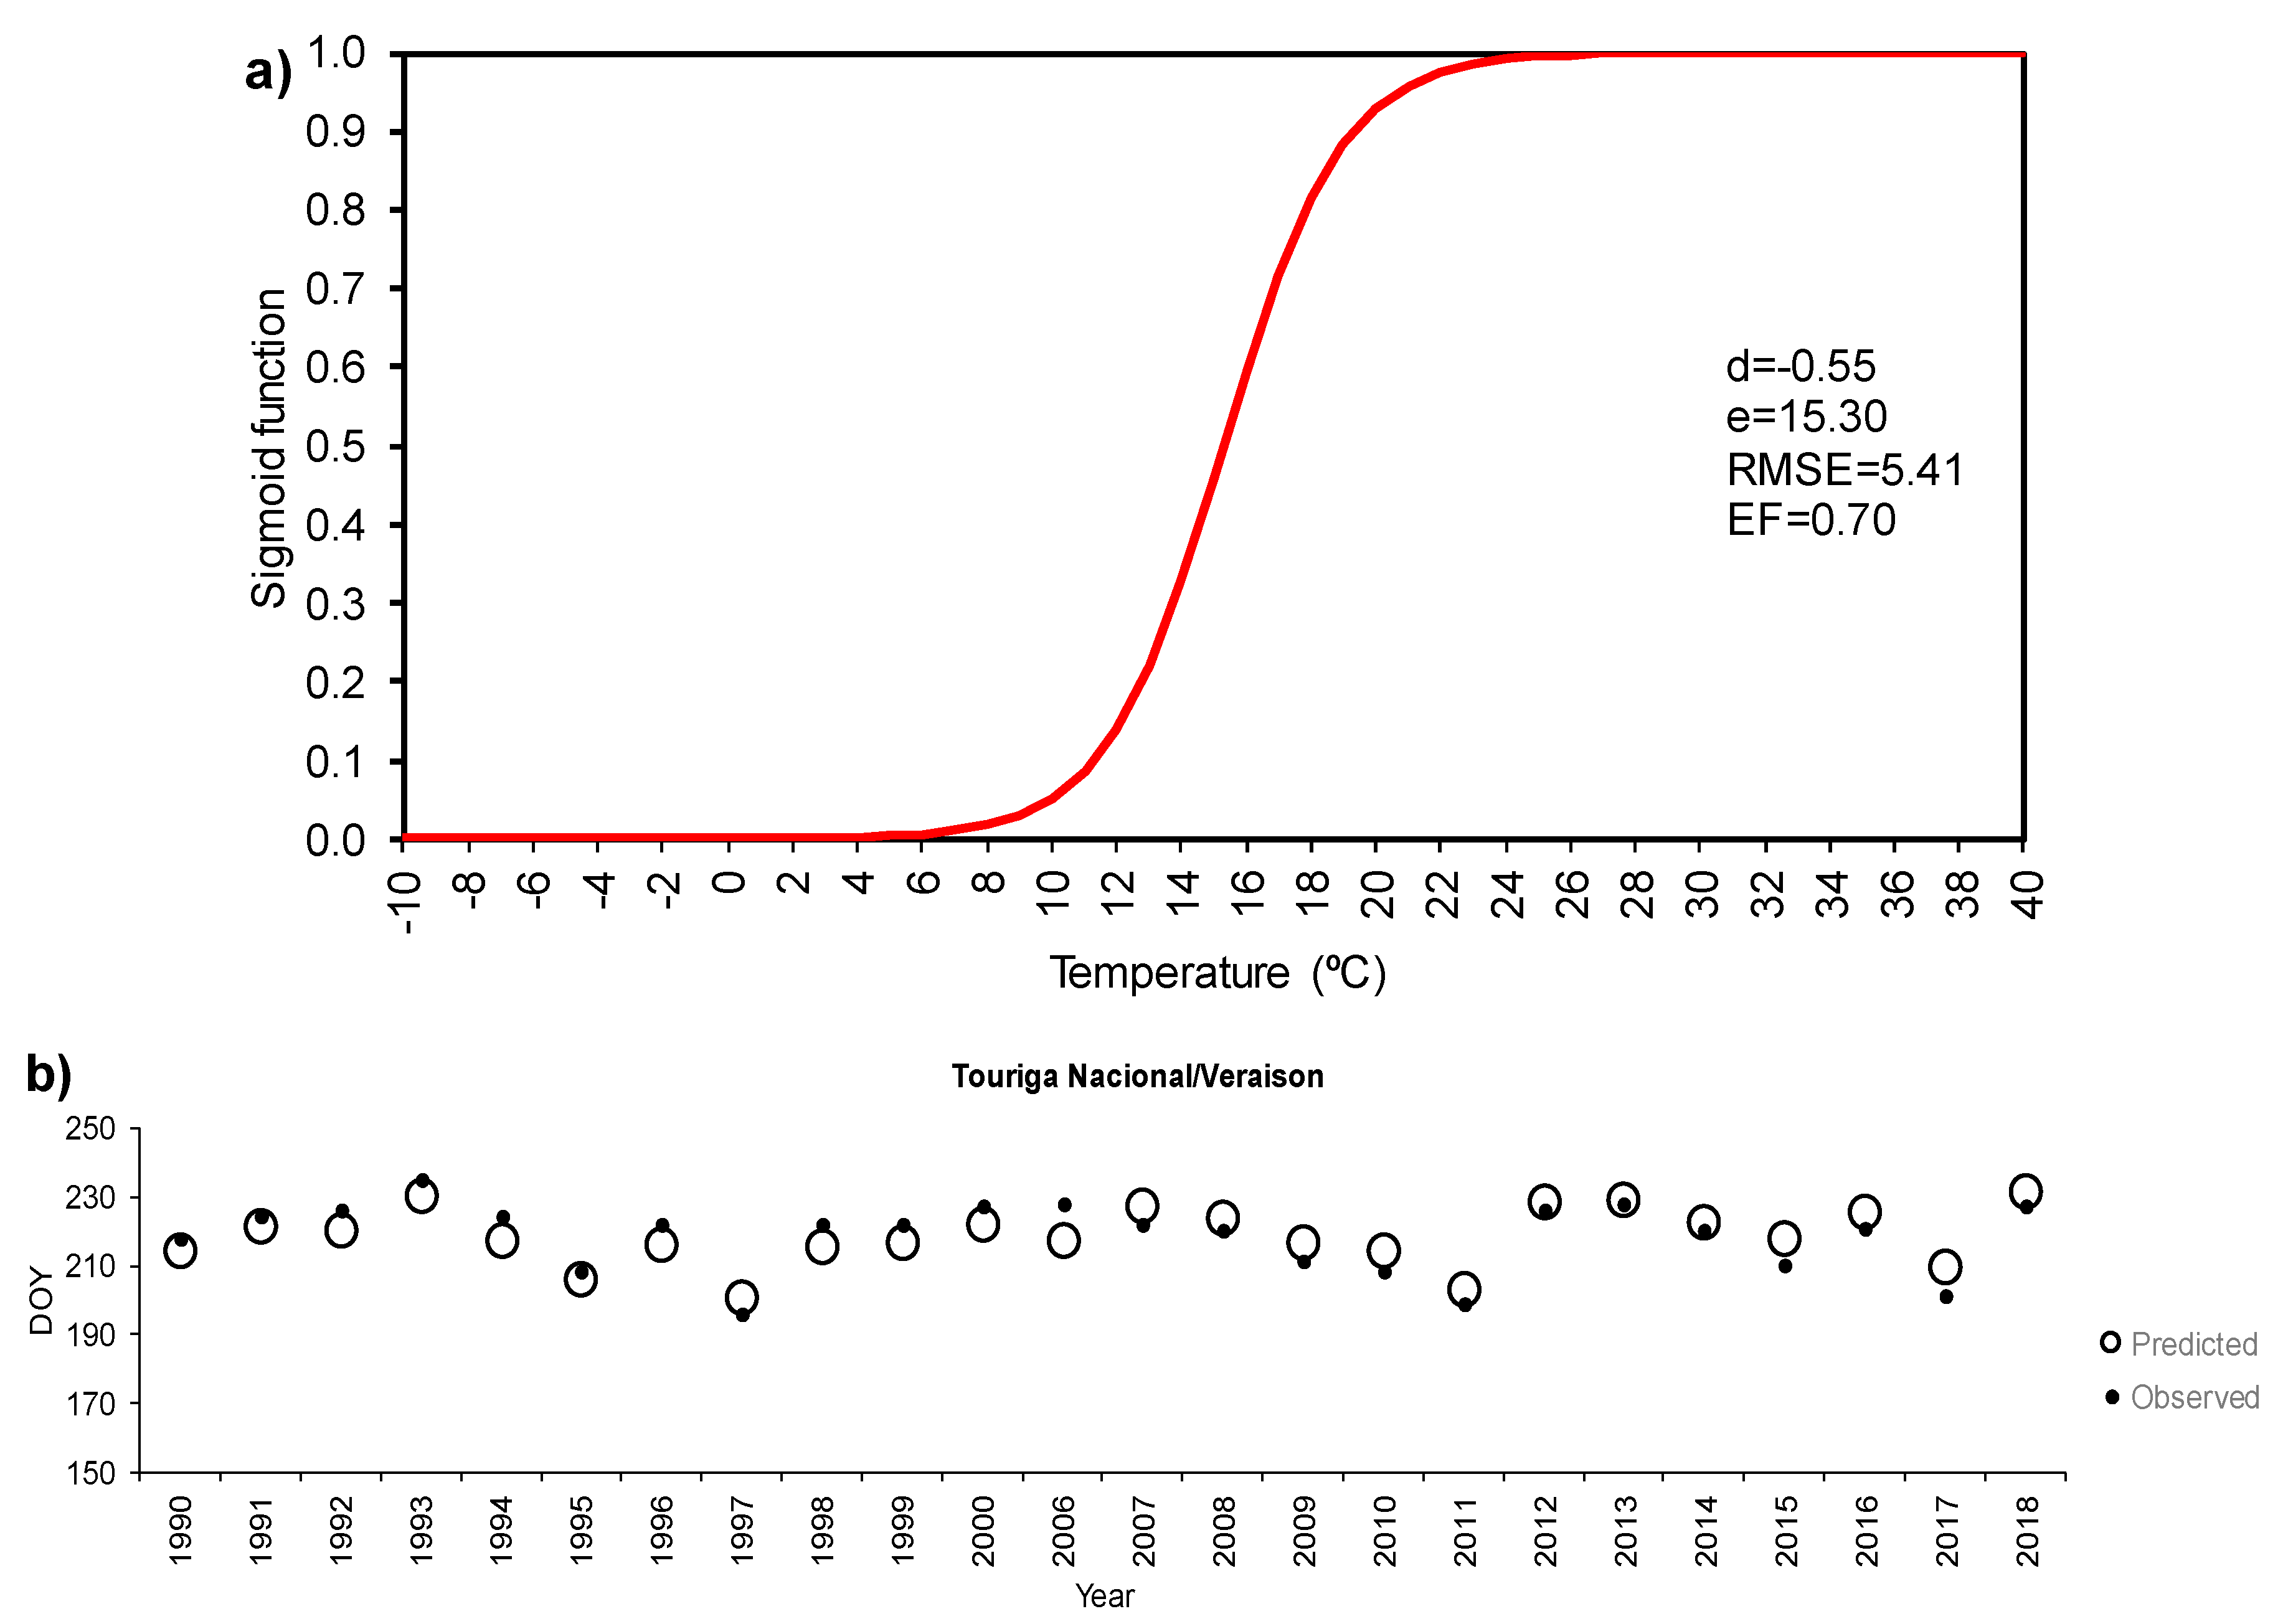
The calibration of the phenological model was carried out independently for each phenological stage (budburst, flowering, and veraison), variety, and region. As an illustration, the SM response function for the veraison of cv. Touriga Nacional from the Lisboa wine region is shown in Figure 3a, while the corresponding chronograms of observed and simulated veraison dates are displayed in Figure 3b. The parameters of the SM are also shown, along with model performance metrics. The SM was calibrated for each region, variety, and phenological stage (Table S1). In total, 153 calibrations were carried out (51 varieties × 3 phenological stages). The estimated parameters for all varieties and wine regions are shown in Table S1, along with the corresponding model performance metrics.
3.2.1. Budburst
For budburst, the SM reveals higher performance metrics for Lisboa compared to the other regions, with an RMSE average value of five days and EF of 0.53. Conversely, the Vinhos Verdes region shows poorer results. In general, all varieties have an RMSE below one week (< 7 days). The efficiency of the model is equal to or greater than 0.5 for 26 varieties (> 0.75 for one variety).
3.2.2. Flowering
For flowering, the SM also reveals higher performance metrics for the Lisboa region when compared to the other wine regions, with average RMSE of four days and EF of 0.75. As for budburst, the Vinhos Verdes wine region reveals less favorable results, with an RMSE of seven days and EF of 0.46. In general, the varieties have an RMSE < 7 days, except for cv. Aragonez (Douro) and cv. Azal Branco (Vinhos Verdes). The efficiency of the model is equal to or greater than 0.5 for 43 varieties and equal to or greater than 0.75 for 26 varieties.
3.2.3. Veraison
For veraison, the Dão wine region shows the higher performance metrics, with an RMSE of four days and EF of 0.82. However, the Lisboa wine region recorded the lowest values of its models, with an RMSE of five days and EF of 0.66. In general, there is an RMSE < 7 days in all varieties, according to the other two phenological stages, except for cv. Antão Vaz, Dona Maria, Fernão Pires, Gouveio, Loureiro, Malvasia Fina, Moscatel de setúbal, Siria and Trajadura. The efficiency of the model is equal to or greater than 0.5 for 43 varieties and equal to or greater than 0.75 for 23 varieties.
3.3. Development of Generalized Models
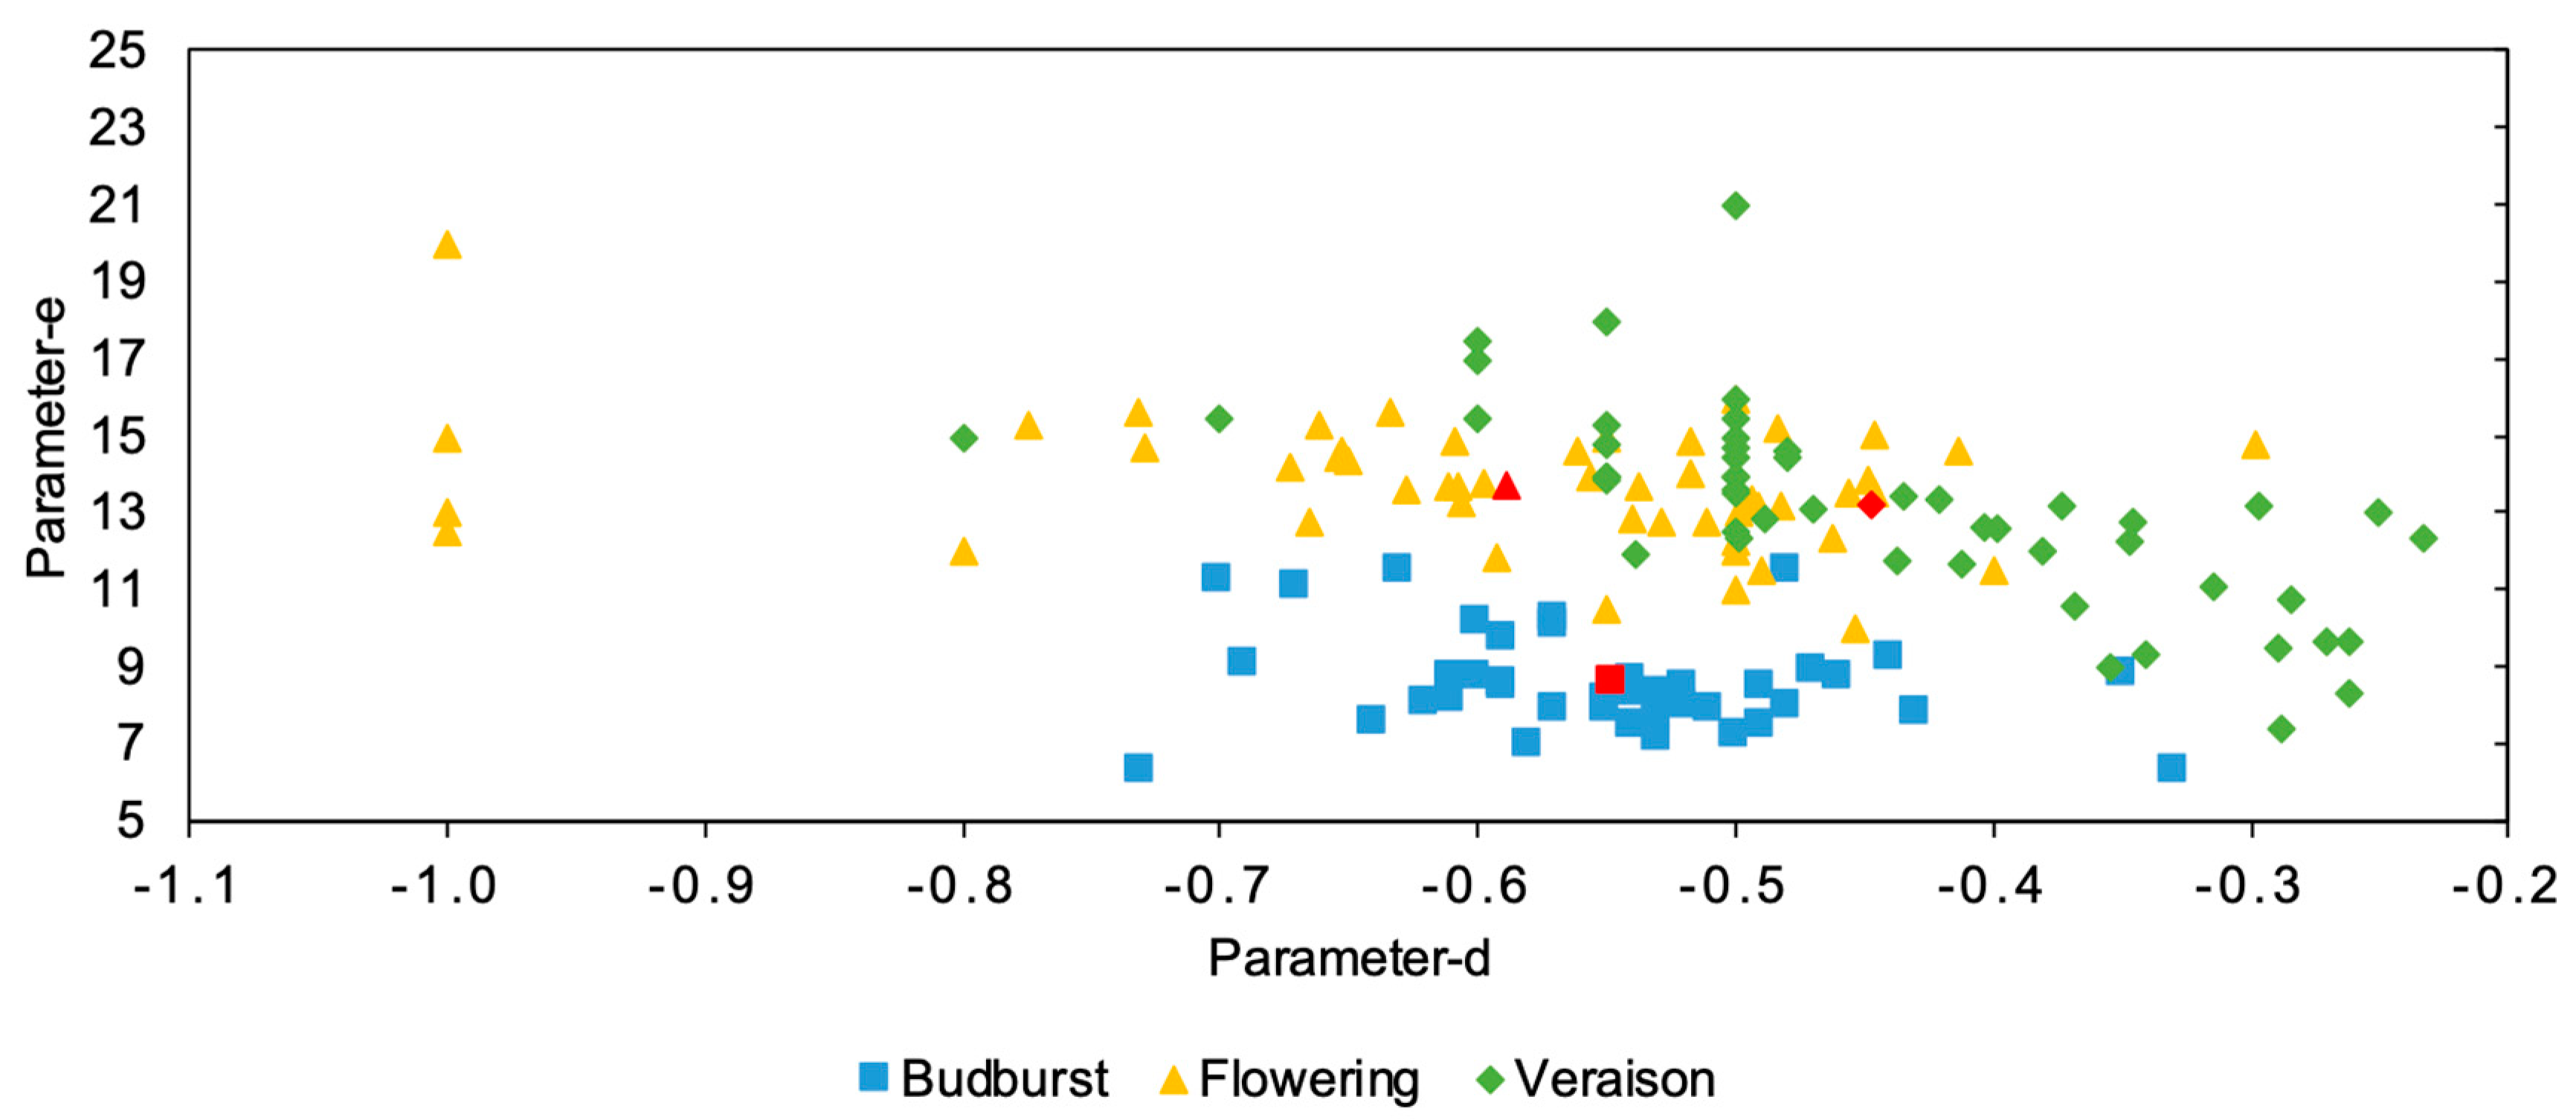
As previously mentioned, and according to Table S1, an individual model was estimated for each grape variety, phenological stage, and wine region. For the sake of succinctness, the parameters d and e for all of the studied varieties and wine regions are displayed in Figure 4, along with the corresponding centroids (averaged parameters d and e).
For budburst and for all the selected varieties, the parameter values are within the range from −0.3 to −0.7 (parameter−d) and from 6.3 to 11.6 (parameter−e). Hence, according to parameter−e, cv. Espadeiro/Lisboa and cv. Baga/Dão present the lowest mid-curve (sigmoid response function value of 0.5) temperature of 6.3 °C, while other varieties such as cv. Jaen/Dão present mid-curve temperatures as high as 11.6 °C. As expected, the intermediate varieties are closer to the centroid, such as cv. Dona Maria, Merlot and Tinta Francisca/Lisboa, with parameter−e of approximately 8.6 °C. For flowering, the parameters range between −0.3 and −1.0 (parameter−d) and 10.0 to 20.0 (parameter−e). The cv. Espadeiro/Vinhos Verdes shows the lowest parameter−e (10.0 °C), while cv. Aragonez/Douro shows a mid-curve temperature (parameter−e) of 20.0 °C. The varieties closer to the corresponding centroid are now cv. Trajadura, Sauvignon and Gouveio/Lisboa, with a mid-curve temperature of 13.7 °C. Lastly, for veraison, the range of the parameters is between −0.2 and −0.8 for parameter−d, and 7.5 and 21.0 for parameter−e. Therefore, there is a clear tendency for lower parameter−e values (mid-curve temperatures) for budburst when compared with flowering or veraison. On the other hand, flowering and veraison, which depict very similar mid-curves temperatures, reveal differences in terms of the parameter−d. In fact, there is a clear tendency for less steep response curves for veraison than for flowering, which suggests a less defined threshold for temperature accumulation in veraison than in flowering or in budburst, thus highlighting that step-models (e.g., GDD) are not suitable for simulating veraison.
The subsequent step was to test the application of the three GSM on the basis of the centroid parameters. The performance of the GSM was also compared to the individual SM so as to assess whether the former is still useful. The resulting GSM response functions are shown in Figure 5, which demonstrates the aforementioned differences between the response functions of the phenological stages (mid-curve temperature lower in budburst and less steep curve in veraison). For budburst, the GSM parameters d and e are equal to −0.6 and 8.6, respectively. For flowering, these same parameters are of −0.6 and 13.7. Finally, for veraison, they are of −0.5 and 13.2.
After applying these GSM and cross-validation, the model performance metrics (RSMEP and EF*) were assessed. As expected, a slight increase of the RMSEP exists for the GSM with respect to the individual SM, but most of the values are still below seven days. The model performances in terms of the EF* metrics (EF after cross-validation) remain above 0.05 in 140 out of 153 (51 varieties × 3 phenological stages) calibrated models (Table S2). The exceptions are: for budburst, all six varieties in the Vinhos Verdes wine region, cv. Touriga Franca, Moscatel Galego and Aragonez, in the Douro wine region, and Espadeiro/Lisboa; for flowering, cv. Aragonez/Douro and cv. Alvarinho/Vinhos Verdes; and for veraison, cv. Syrah/Lisboa. For budburst, it is important to highlight that 17 validated models have a performance greater than 50−75% relative to the observed average and three above or equal to 75%. Regarding flowering, 17 models are 50−75% more skillful than the observed average model, while 24 are above or equal to 75%. For veraison, 18 models show an efficiency 50−75% higher than the observed average and 26 ≥ 75%.
3.4. Ranking of Varieties
The F-forcing parameter was evaluated for 36 varieties, only in the Lisboa wine region, where the sample is significantly larger than in the other regions. Furthermore, only the phenology models for varieties with EF* above or equal to 0.5 are considered in this analysis, as they provide a better adjustment to the phenological data of a given variety and are thereby more likely to reveal the actual response of that variety to the accumulated thermal conditions (F-forcing). Therefore, 19 individual models were considered for budburst, 35 for flowering, and 28 models for veraison. As such, in the evaluation of the F parameter, a classification of grapevine varieties into early, intermediate, and late varieties was performed according to their thermal accumulation. As stated previously, this classification is based on the quartiles of the empirical distribution of the F-parameters (Q1: early, Q2 + Q3: intermediate, and Q4: late varieties).
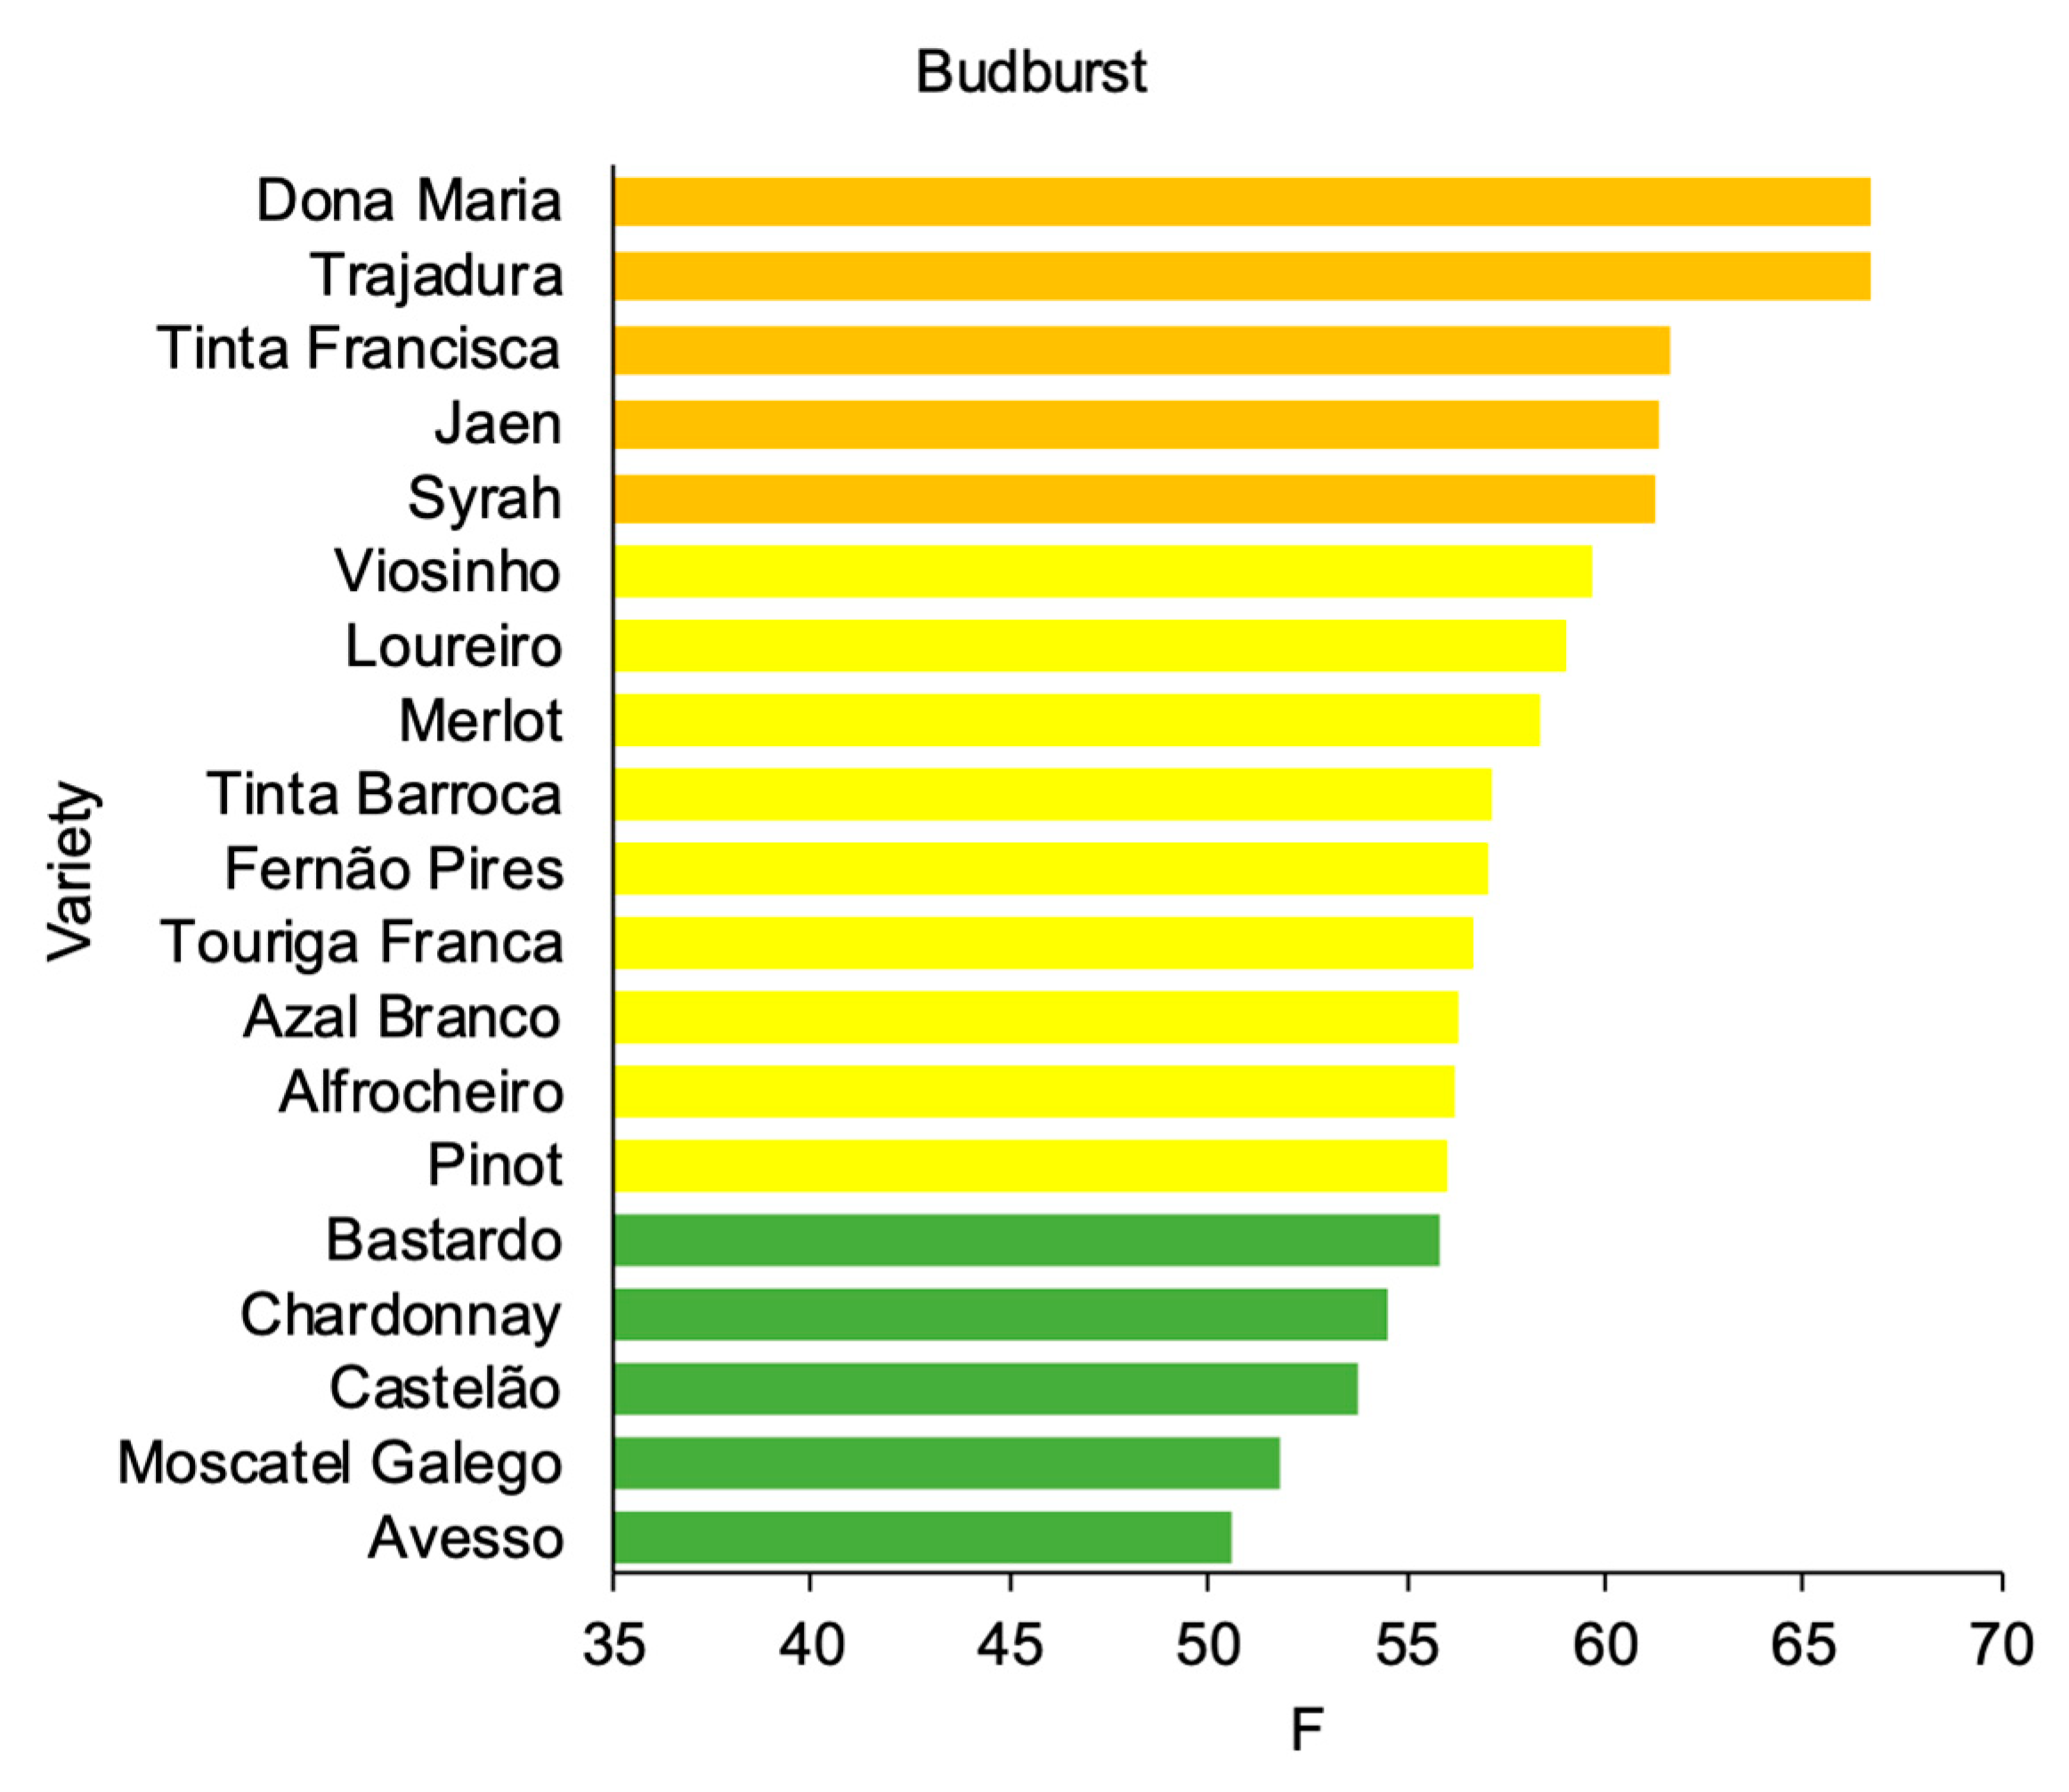
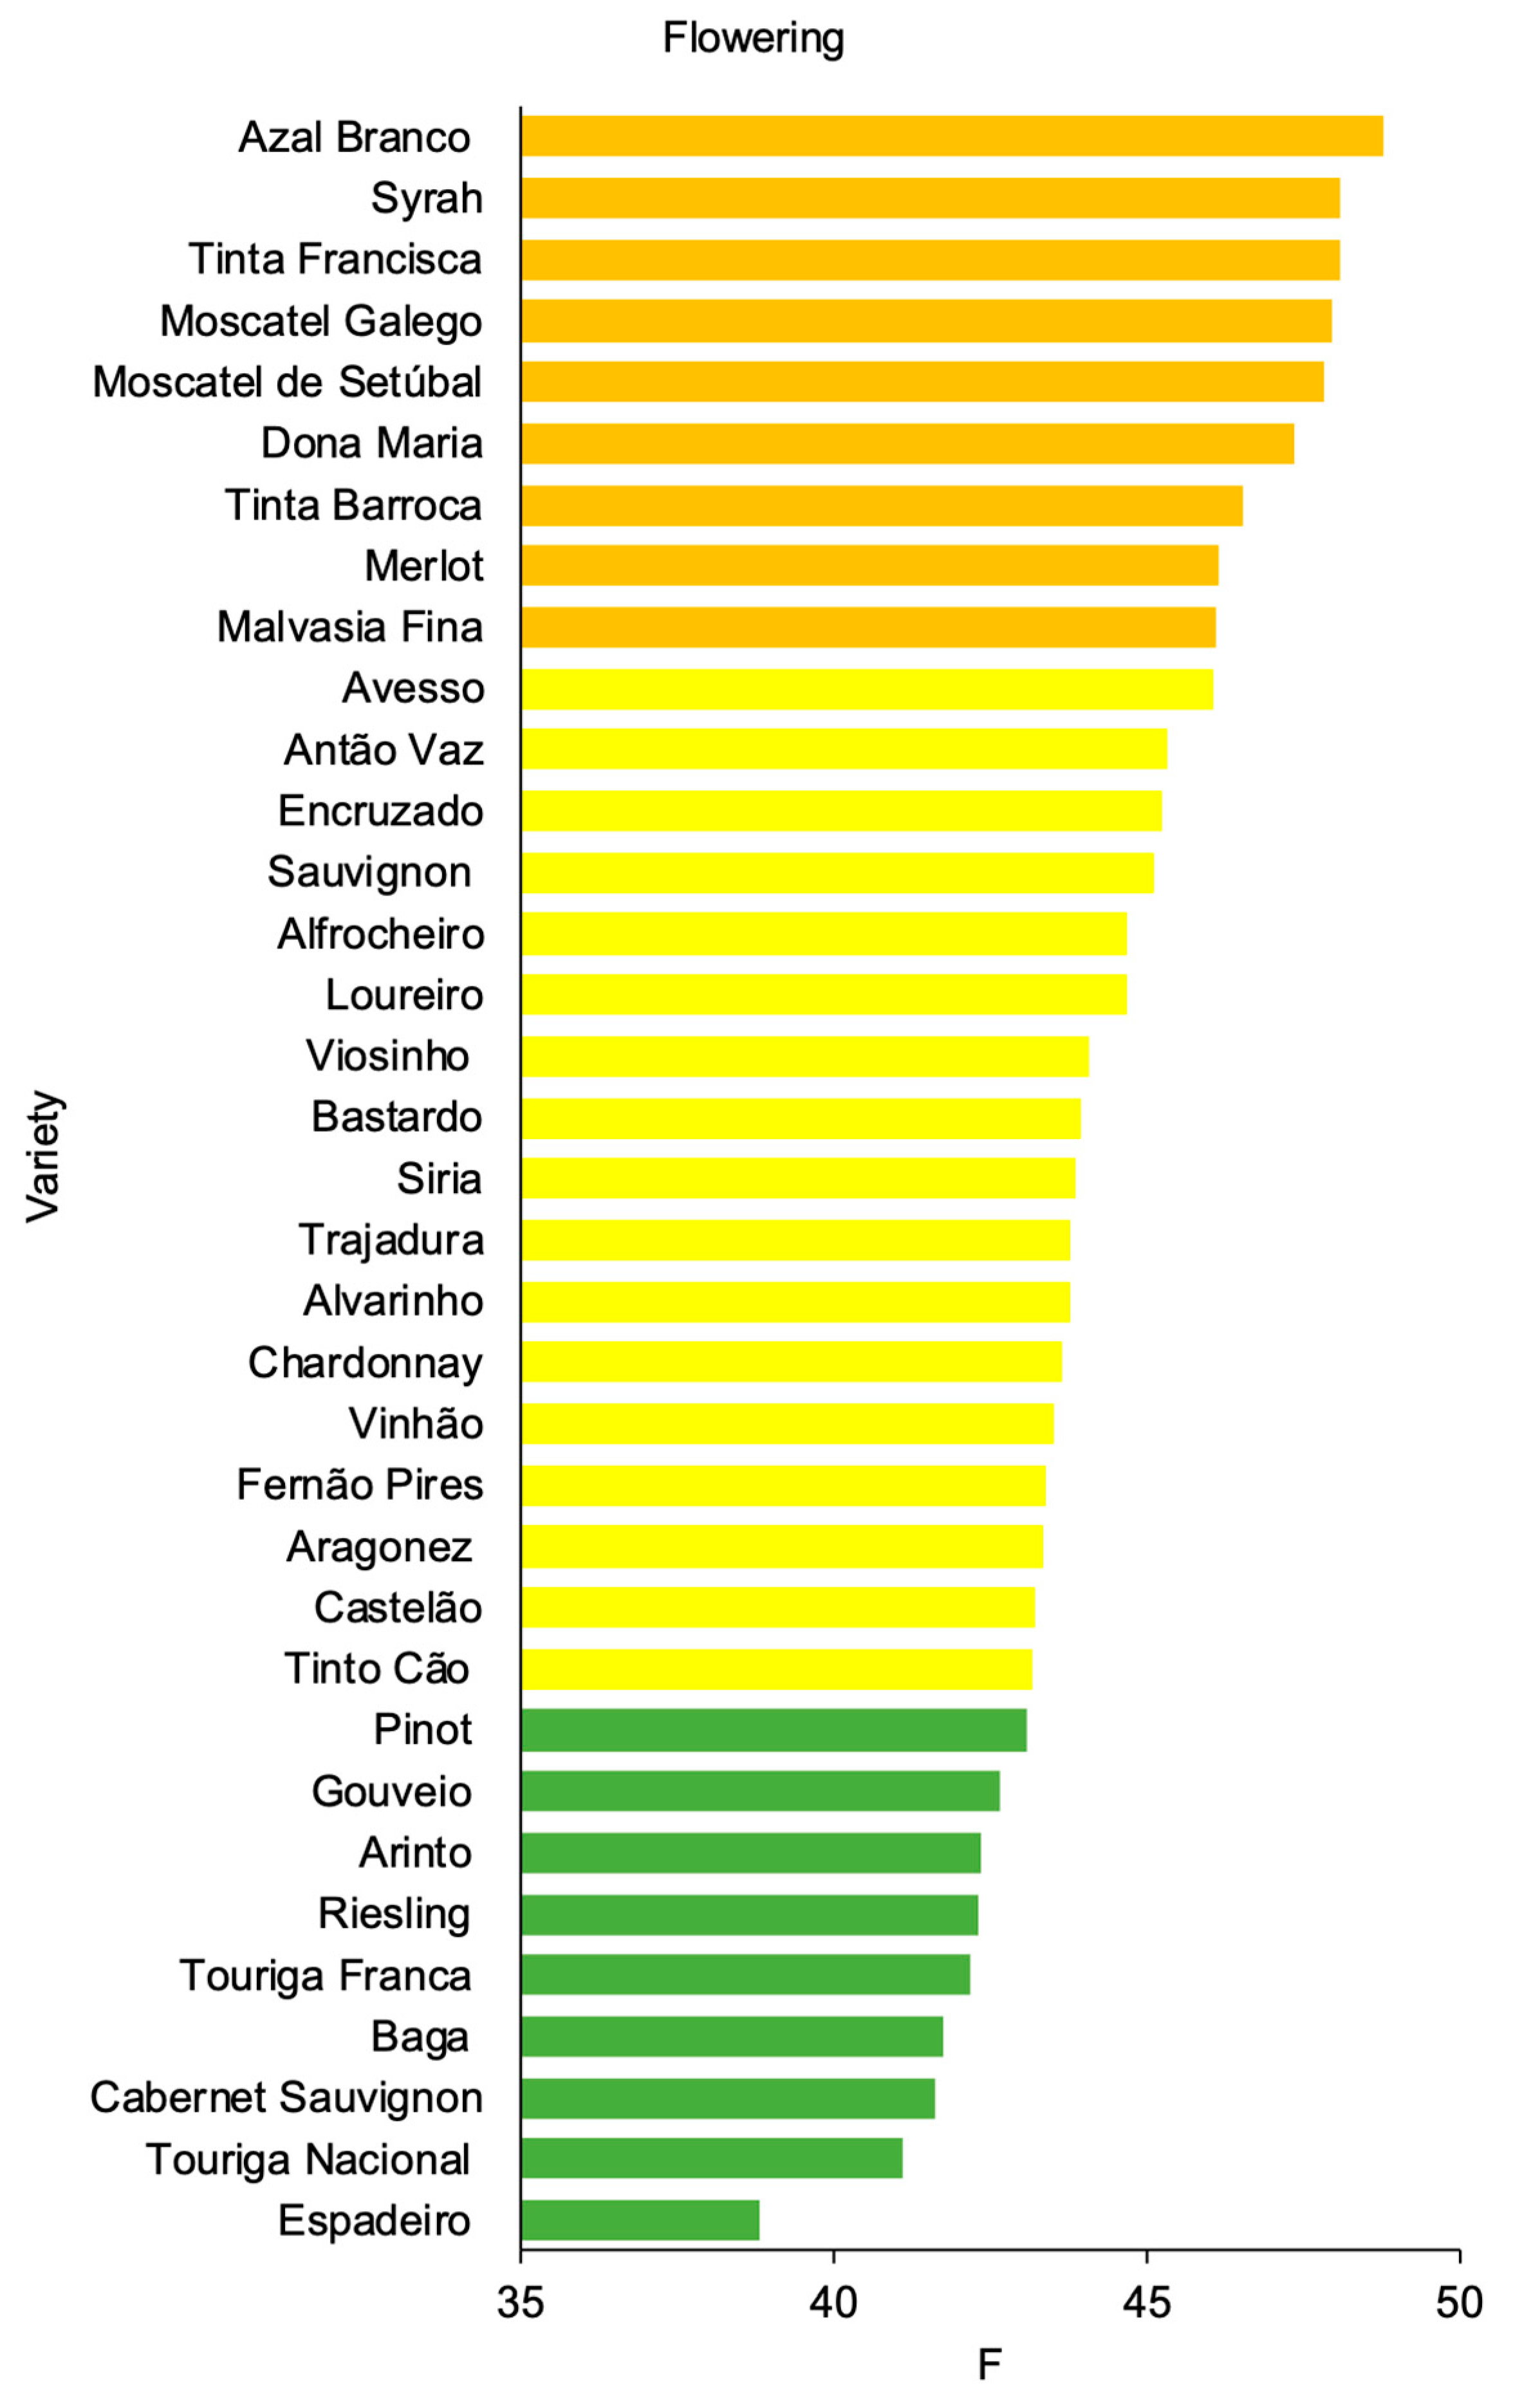
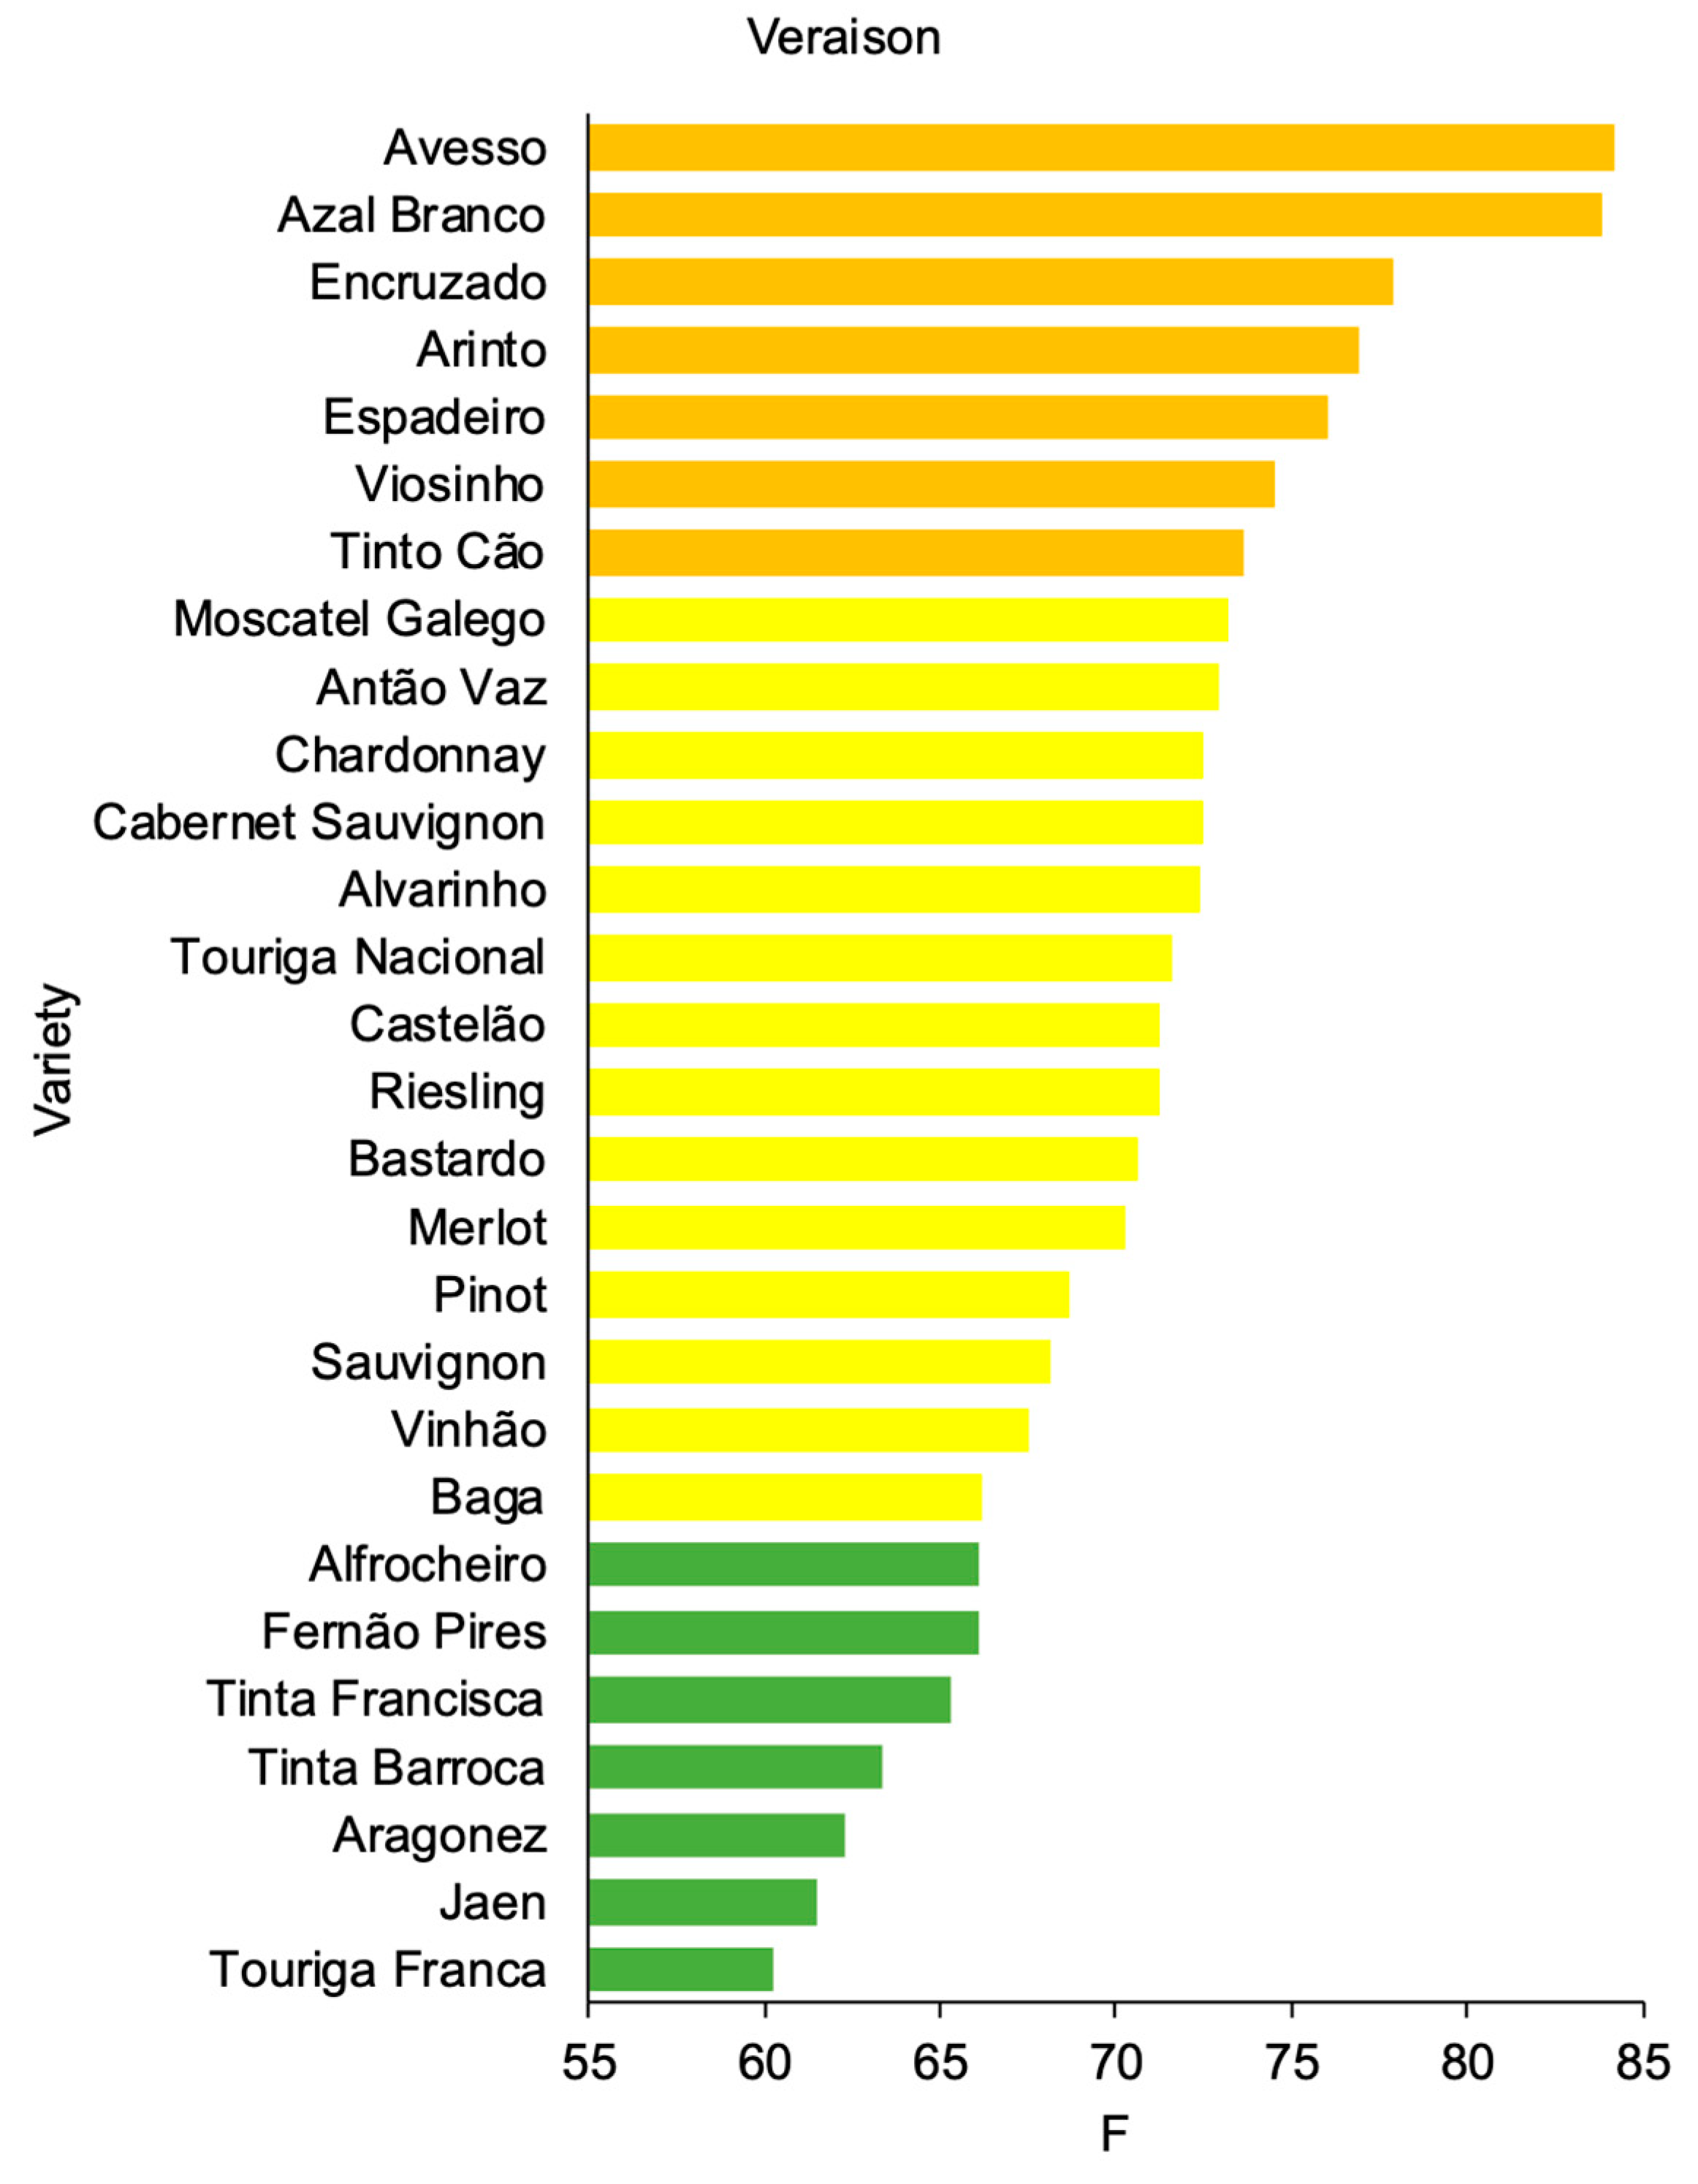
Figure 6 shows the grapevine varieties ranked as a function of their F-forcing parameter for budburst and in ascending order. For this case, cv. Avesso (F = 50.57) is the least thermally demanding. For the intermediate varieties, there are five red and four white varieties considered, being the red grape variety cv. Pinot Noir (F = 56.03) associated with the lowest forcing, whereas cv. Viosinho (F = 59.66) reveals the highest forcing. Amongst the late varieties, cv. Dona Maria (F = 66.70) is the most heat demanding. Overall, white varieties are earlier than red varieties, with lower accumulation values. For flowering (Figure 7), the earliest variety is cv. Espadeiro (F = 38.84). For the intermediate varieties, cv. Tinto Cão (F = 43.18) is the first to achieve flowering, whilst cv. Avesso (F = 46.06) is the latest. Among the late varieties, cv. Azal Branco (F = 48.78) is the most heat demanding. For veraison (Figure 8), cv. Touriga Franca (F = 60.27) is the least demanding variety. Early varieties are mostly red, except for cv. Fernão Pires (F = 66.11). For the intermediate varieties, cv. Baga (F = 66.22) is the least heat demanding, being cv. Moscatel Galego (F = 73.19). Concerning the late varieties, cv. Avesso (F = 84.23) is the most heat demanding among all the studied varieties. This outcome for cv. Avesso is remarkable, as it is the lest heat demanding variety regarding budburst but is also the most demanding variety when considering veraison.
4. Discussion and Conclusions
The results of the GSM reveal a greater predictive capacity for flowering or veraison than for budburst. GSM presents an efficiency coefficient after cross-validation (EF*) above or equal to 0.5 for 20 varieties, 41 for flowering and 44 for veraison. Regarding the RMSEP, the SM performance for the three phenological stages is in general agreement with previous studies [26,37,38], with values below seven days. According to Clímaco and Cunha [39], there is little information regarding the thermal requirement of the varieties. Besides, more valid information on table grape varieties is needed [40]. The objective was to fill the lack of information and determinate using the F parameter, the required thermal accumulation of each variety to complete each of the three phenological stages (Lisboa wine region). The varieties were classified into early, intermediate, and late according to the phenological stage. A study by Lopes et al. [41] allowed us to make some comparisons regarding the accumulation of the heat units of the varieties, where 34 varieties (19 white and 15 red) were selected, though only a few varieties were also used in the present study. For budburst, both studies agree that cv. Avesso, Castelão, and Chardonnay are early varieties, while cv. Viosinho is classified as intermediate. For flowering, both studies agree on the precocity of two red varieties and one white, namely cv. Touriga Nacional, Touriga Franca and Gouveio, respectively. For the intermediate varieties, the suitability of cv. Aragonez, Siria, Encruzado and Antão Vaz varieties are verified as having a similar behavior in response to temperature. The latest variety in both classifications is also cv. Moscatel de Setúbal, being more heat demanding. For veraison, the less demanding varieties with lower thermal accumulation are cv. Touriga Franca, Jaen, Tinta Barroca, and Alfrocheiro. For this stage, the intermediate varieties are also in agreement with the above-mentioned study in three red varieties, namely cv. Baga, Vinhão, and Tinto Cão. The varieties with the highest accumulated heat units are cv. Arinto and Encruzado. Another important feature is the ranking of varieties, which is in accordance with previous studies [42], highlighting that one given variety can shift from one quartile to the other for different phenological stages. Therefore, an early/late variety concerning a specific phenological stage can behave as a late/early variety for other phenological stages.
The skill of the SM in the prediction of the grapevine phenological stages with relatively high performance highlights its potential to be used as a decision support tool for the winegrowers, assisting them in adopting the best practices for the optimization of grapevine yield and quality [43,44,45]. In this study, phenology data were used and combined with meteorological data collected at different weather stations installed in several main Portuguese wine regions, namely Douro, Vinhos Verdes, Dão, and Lisboa. Meteorological stations provide essential data for the adequate calibration of the phenological models, thus improving their predictive capacity [46]. Additionally, the sample size is a critical factor for the robustness and the validation of the phenological models. In the present study data set, a large number of varieties were taken into account, 36 of which were from the Lisboa wine region complemented by four from the Douro, five from the Dão, and six from Vinhos Verdes. A generalized model was developed for each phenological stage (budburst, flowering, and veraison) using centroid (averaged) parameters and showing quite satisfactory results. The performance of the models is in line with other studies carried out in the same area [31,37,47,48,49,50,51,52,53]. In this way, this preliminary study provides relevant information for the operationalization of short-term predictions in the near future, but further research should be environed in order to enhance the robustness and the significance of the present study outcomes. Another aspect, the harvest date is not a phenological stage, and its prediction is also very useful for decision support. However, its prediction is very complex, as it comprises many non-climatic variables, which is out of the scope. In the future, the findings of the present study will be incorporated on a web platform, where the SM must convey valuable information regarding the development/evolution of the vineyard with short-term predictions. Nevertheless, more data in the future may significantly enhance the accuracy and the effectiveness of these predictions.
Supplementary Materials
The following are available online at https://www.mdpi.com/2076-3417/10/11/3708/s1, Table S1: List of calibrations with the sigmoid model for each variety, region, and phenological stage as well as the performance parameters of the model (RMSE, EF). "N" indicates the number of years with phenological and meteorological data, and the "n" is the number of observations. Table S2: The same as in Table S1 but with the generalized parameters and their validation (RMSEP and EF*) for each phenological stage, variety, and region. The F-forcing parameter (thermal accumulation) is also represented.
Author Contributions
Conceptualization, S.R., H.F., C.C., and J.A.S., Formal analysis, S.R., H.F., C.C., and J.A.S., Investigation, S.R., H.F., C.C., J.A.S., J.S., J.E.-D., and P.R., Methodology, S.R., H.F., C.C., J.A.S., J.S., J.E.-D., and P.R., Software, S.R., Supervision, H.F., C.C., and J.A.S., Validation, S.R., H.F., C.C., J.A.S., J.S., J.E.-D., and P.R., Writing—original draft, S.R., H.F., C.C., J.A.S., J.S., J.E.-D., and P.R., Writing—review and editing, S.R., H.F., C.C., J.A.S., J.S., J.E.-D., and P.R. All authors have read and agreed to the published version of the manuscript.
Funding
This research was funded by the operation nº NORTE-06-3559-FSE-000067 and by the Clim4Vitis project “Climate change impact mitigation for European viticulture: knowledge transfer for an integrated approach”, funded by European Union’s Horizon 2020 Research and Innovation Programme, under grant agreement nº810176.
Acknowledgments
The phenological and meteorological data were provided by ADVID, INIAV- Dois Portos, Estação Vitivinícola de Amândio Galhano, Centro de Estudos Vitivinícolas do Dão, Escola Superior Agrária de Viseu and DRAPN. Concerning the data from the Douro, the authors thank the ADVID members, for collecting phenological data, and to Maria do Carmo Val and Ricardo Menezes for the organization of the database used. We would like to thank João Garrido for providing the data from Vinhos Verdes and Pedro Rodrigues for providing the data from Dão. Helder Fraga also acknowledges the Portuguese Foundation for Science and Technology fellowship, contract CEECIND/00447/2017 and project COA/CAC/0030/2019. This work is also supported by FCT - Portuguese Foundation for Science and Technology, under the project UIDB/04033/2020.
Conflicts of Interest
The authors declare no conflict of interest. The funders had no role in the design of the study; in the collection, analyses, or interpretation of data; in the writing of the manuscript, or in the decision to publish the results.
References
- Gris, E.F.; Burin, V.M.; Brighenti, E.; Vieira, H.; Bordignon-Luiz, M.T. Phenology and ripening of Vitis vinifera L. grape varieties in São Joaquim, southern Brazil: A new South American wine growing region. Cienc. Investig. Agrar. 2010, 37, 61–75. [Google Scholar] [CrossRef] [Green Version]
- Ruml, M.; Vulic, T. Importance of phenological observations and predictions in agriculture. J. Agric. Sci. Belgrade 2005, 50, 217–225. [Google Scholar] [CrossRef]
- Fraga, H.; Atauri, I.G.D.; Malheiro, A.C.; Moutinho-Pereira, J.; Santos, J.A. Viticulture in Portugal: A review of recent trends and climate change projections. OENO One 2017, 51, 61–69. [Google Scholar] [CrossRef] [Green Version]
- Moriondo, M.; Ferrise, R.; Trombi, G.; Brilli, L.; Dibari, C.; Bindi, M. Modelling olive trees and grapevines in a changing climate. Environ. Model. Softw. 2015, 72, 387–401. [Google Scholar] [CrossRef]
- Andreoli, V.; Cassardo, C.; La Iacona, T.; Spanna, F. Description and preliminary simulations with the Italian Vineyard Integrated Numerical Model for estimating physiological values (IVINE). Agronomy 2019, 9, 94. [Google Scholar] [CrossRef] [Green Version]
- Gladstones, J. Wine, Terroir and Climate Change; Wakefield Press: Cambridge, MA, USA, 2011. [Google Scholar]
- Bock, A.; Sparks, T.; Estrella, N.; Menzel, A. Changes in the phenology and composition of wine from Franconia, Germany. Clim. Res. 2011, 50, 69–81. [Google Scholar] [CrossRef] [Green Version]
- Jones, G.V. Climate change: Observations, projections, and general implications for viticulture and wine production. Econ. Dep.-Work. Pap. 2007, 7, 14. [Google Scholar]
- Jones, G.V.; Davis, R.E. Climate influences on grapevine phenology, grape composition, and Wine production and quality for Bordeaux, France. Am. J. Enol. Vitic. 2000, 51, 249. [Google Scholar]
- Van Leeuwen, C.; Renouf, V.; Payan, J.; Trambouze, W.; Garnier, C.; Agut, C.; Garcia-Cortazar, I.; Bois, B.; Barbeau, G.; Boursiquot, J.M.; et al. Heat requirements for grapevine varieties is essential information to adapt plant material in a changing climate. In Proceedings of the VIIth International terroir Congress, Nyon, Switzerland, 19–23 May 2008; pp. 222–227. [Google Scholar]
- Schwartz, M.D. Phenology: An Integrative Environmental Science; Springer: Berlin/Heidelberg, Germany, 2003. [Google Scholar]
- McIntyre, G.N.; Lider, L.A.; Ferrari, N.L. The chronological classification of grapevine phenology. Am. J. Enol. Vitic. 1982, 33, 80–85. [Google Scholar]
- Sergio, V.C.; Rafael, N.S.; Ivan, M.H. Phenology and sum of temperatures above 10 deg. C, in 24 grape varieties. Agric. Tec. 1986, 46, 63–67. [Google Scholar]
- Moncur, M.W.; Rattigan, K.; Mackenzie, D.H.; Mc Intyre, G.N. Base temperatures for budbreak and leaf appearance of grapevines. Am. J. Enol. Vitic. 1989, 40, 21–26. [Google Scholar]
- Buttrose, M.S. Vegetative growth of grape-vine varieties under controlled temperature and light intensity. VITIS J. Grapevine Res. 1969, 8, 280. [Google Scholar]
- Chuine, I.; Cortázar-Atauri, I.; Kramer, K.; Hänninen, H. Plant development models. In Phenology: An Integrative Environmental Science; Schwartz, M.D., Ed.; Springer Netherlands: Dordrecht, The Netherlands, 2013; pp. 275–293. [Google Scholar] [CrossRef]
- Murray, M.B.; Cannell, M.G.R.; Smith, R.I. Date of budburst of fifteen tree species in Britain following climatic warming. J. Appl. Ecol. 1989, 26, 693–700. [Google Scholar] [CrossRef]
- Kramer, K. Selecting a model to predict the onset of growth of Fagus sylvatica. J. Appl. Ecol. 1994, 31, 172–181. [Google Scholar] [CrossRef]
- Hänninen, H. Effects of temperature on dormancy release in woody plants: Implications of prevailing. Silva Fenn. 1987, 21, 279–299. [Google Scholar] [CrossRef] [Green Version]
- Landsberg, J. Apple fruit bud development and growth; analysis and an empirical model. Ann. Bot. 1974, 38, 1013–1023. [Google Scholar] [CrossRef]
- Hänninen, H. Modelling bud dormancy release in trees from cool and temperate regions. Acta For. Fenn. 1990, 213, 1–47. [Google Scholar] [CrossRef] [Green Version]
- Chuine, I. A united model for budburst of trees. J. Theor. Biol. 2000, 2007, 337–347. [Google Scholar] [CrossRef]
- Kobayashi, K.D.; Fuchigami, L.H.; English, M.J. Modeling temperature requirements for rest development in Cornus sericea. Am. Soc. Hortic. Sci. 1982, 107, 914–918. [Google Scholar]
- Vegis, A. Dormancy in higher plants. Annu. Rev. Plant Physiol. 1964, 15, 185–224. [Google Scholar] [CrossRef]
- Winkler, A.J. General Viticulture; University of California Press: Berkeley, CA, USA, 1965. [Google Scholar]
- Parker, A.K.; Cortázar-Atauri, I.; Van Leeuwen, C.; Chuine, I. General phenological model to characterise the timing of flowering and veraison of Vitis vinifera L. Aust. J. Grape Wine Res. 2011, 17, 206–216. [Google Scholar] [CrossRef]
- Pouget, R. Etude du Rhythme végétative: Caractères physiologiques liées à la précocité de débourrement chez la vigne. Ann. l´amelior. Plantes 1966, 16, 81–100. [Google Scholar]
- Riou, C. The Effect of Climate on Grape Ripening: Application to the Zoning of Sugar Content in the European Community; European Commission: Luxembourg, 1994; p. 322. [Google Scholar]
- Cortazar-Atauri, I.; Brisson, N.; Gaudillere, J. Performance of several models for predicting budburst date of grapevine (Vitis vinifera L.). Int. J. Biometeorol. 2009, 53, 317–326. [Google Scholar] [CrossRef] [PubMed]
- Wang, E.; Engel, T. Simulation of phenological development of wheat crops. Agric. Syst. 1998, 58, 1–24. [Google Scholar] [CrossRef]
- Costa, R.; Fraga, H.; Fonseca, A.; García de Cortázar-Atauri, I.; Val, M.C.; Carlos, C.; Reis, S.; Santos, J.A. Grapevine phenology of cv. touriga franca and touriga nacional in the Douro wine region: Modelling and climate change projections. Agronomy 2019, 9, 210. [Google Scholar] [CrossRef] [Green Version]
- Fonseca, A.; Santos, J. A new very high-resolution climatological dataset in Portugal: Application to hydrological modeling in a mountainous watershed. Phys. Chem. Earth Parts A/B/C 2018. [Google Scholar] [CrossRef]
- Fonseca, A.R.; Santos, J.A. High-resolution temperature datasets in Portugal from a geostatistical approach: Variability and extremes. J. Appl. Meteorol. Climatol. 2018, 57, 627–644. [Google Scholar] [CrossRef]
- Baillod, M.; Baggiolini, M. Les stades repères de la vigne. Rev. Suisse Vitic. Arboric. Hortic 1993, 25, 7–9. [Google Scholar]
- Lorenz, D.H.; Eichhorn, K.W.; Bleiholder, H.; Klose, R.; Meier, U.; Weber, E. Growth stages of the grapevine: Phenological growth stages of the grapevine (Vitis vinifera L. ssp. vinifera)—Codes and descriptions according to the extended BBCH scale. Aust. J. Grape Wine Res. 1995, 1, 100–103. [Google Scholar] [CrossRef]
- Metropolis, N.; Rosenbluth, A.W.; Rosenbluth, M.N.; Teller, A.H.; Teller, E. Equation of state calculations by fast computing machines. J. Chem. Phys. 1953, 21, 1087–1092. [Google Scholar] [CrossRef] [Green Version]
- Parker, A.K.; Garcia de Cortazar-Atauri, I.; Chuine, I.; Barbeau, G.; Bois, B.; Boursiquot, J.M.; Cahurel, J.Y.; Claverie, M.; Dufourcq, T.; Gény, L.; et al. Classification of varieties for their timing of flowering and veraison using a modeling approach. A case study for the grapevine species Vitis vinifera L. Agric. For. Meteorol. 2013, 180, 249–264. [Google Scholar] [CrossRef]
- Zapata, D.; Salazar-Gutierrez, M.; Chaves, B.; Keller, M.; Hoogenboom, G. Predicting key phenological stages for 17 grapevine cultivars (Vitis vinifera L.). Am. J. Enol. Vitic. 2017, 68, 60. [Google Scholar] [CrossRef]
- Clímaco, P.; Cunha, J. Exigências térmicas de algumas castas cultivadas na região da Estremadura. Ciênc. Técnica Vitivinícola 2005, 21, 67–74. [Google Scholar]
- Almeida, J.L.; Grácio, A.M. Macrozonagem da Uva de mesa em Portugal Continental. De VINEA VINO Port. Doc. 1969, 68. [Google Scholar]
- Lopes, J.; Eiras-Dias, J.; Abreu, F.; Clímaco, P.; Cunha, J.P.; Silvestre, J. Exigências térmicas, duração e precocidade de estados fenológicos de castas da colecção ampelográfica nacional. Ciênc. Técnica Vitivinícola 2007, 23, 61–71. [Google Scholar]
- Bohm, J. Portugal Vitícola: O Grande Livro das Castas; Publicações, C.F., Ed.; Chaves-Ferreira Publicações: Lisboa, Portugal, 2007. [Google Scholar]
- Fraga, H.; Costa, R.; Moutinho-Pereira, J.; Correia, C.M.; Dinis, L.-T.; Gonçalves, I.; Silvestre, J.; Eiras-Dias, J.; Malheiro, A.C.; Santos, J.A. Modeling phenology, water status, and yield components of three portuguese grapevines using the STICS crop model. Am. J. Enol. Vitic. 2015, 66, 482–491. [Google Scholar] [CrossRef]
- Fraga, H.; Amraoui, M.; Malheiro, A.C.; Moutinho-Pereira, J.; Eiras-Dias, J.; Silvestre, J.; Santos, J.A. Examining the relationship between the Enhanced Vegetation Index and grapevine phenology. Eur. J. Remote Sens. 2014, 47, 753–771. [Google Scholar] [CrossRef]
- Cola, G.; Mariani, L.; Salinari, F.; Civardi, S.; Bernizzoni, F.; Gatti, M.; Poni, S. Description and testing of a weather-based model for predicting phenology, canopy development and source–sink balance in Vitis vinifera L. cv. Barbera. Agric. For. Meteorol. 2014, 184, 117–136. [Google Scholar] [CrossRef]
- Fraga, H.; Santos, J.A. Daily prediction of seasonal grapevine production in the Douro wine region based on favourable meteorological conditions. Aust. J. Grape Wine Res. 2017, 23, 296–304. [Google Scholar] [CrossRef]
- Verdugo-Vásquez, N.; Pañitrur-De la Fuente, C.; Ortega-Farías, S. Model development to predict phenological scale of table grapes (cvs. Thompson, Crimson and Superior Seedless and Red Globe) using growing degree days. OENO One 2017, 51. [Google Scholar] [CrossRef]
- Cuccia, C.; Bois, B.; Richard, Y.; Parker, A.K.; García de Cortázar-Atauri, I.; van Leeuwen, C.; Castel, T. Phenological model performance to warmer conditions: Application to Pinot noir in Burgundy. OENO One 2014, 48, 169–178. [Google Scholar] [CrossRef]
- Oliveira, M. Calculation of budbreak and flowering base temperatures for Vitis vinifera cv. Touriga Francesa in the Douro Region of Portugal. Am. J. Enol. Vitic. 1998, 49, 74–78. [Google Scholar]
- Molitor, D.; Junk, J.; Evers, D.; Hoffmann, L.; Beyer, M.; Molitor, D.; Junk, J.; Evers, D.; Hoffmann, L.; Beyer, M. A high resolution cumulative degree day based model to simulate the phenological development of grapevine. Am. J. Enol. Vitic. 2014, 65, 72–80. [Google Scholar] [CrossRef]
- Hlaszny, E.; Hajdu, E.; Bisztray, G.; Ladányi, M. Comparison of Budburst models predictions for kékfrankos. Appl. Ecol. Environ. Res. 2012, 10, 75–86. [Google Scholar] [CrossRef]
- Ortega-Farias, S.; Riveros-Burgos, C. Modeling phenology of four grapevine cultivars (Vitis vinifera L.) in Mediterranean climate conditions. Sci. Hortic. 2019, 250, 38–44. [Google Scholar] [CrossRef]
- Ortega-Farias, S.; Lozano, P.; Leon, L. Development of models for predicting phenology and evolution of maturity in cv. Cabernet Sauvignon and Chardonnay grapevines. Agric. Técnica 2002, 62, 27–37. [Google Scholar]
Figure 1.
Map of mainland Portugal with the four targeted wine regions (Douro, Dão, Vinhos Verdes, and Lisboa) and vineyard plot/weather station locations (red triangles).
Figure 1.
Map of mainland Portugal with the four targeted wine regions (Douro, Dão, Vinhos Verdes, and Lisboa) and vineyard plot/weather station locations (red triangles).

Figure 2.
Average day of the year (DOY) observed for each variety, phenological stage (budburst, flowering, and veraison, cf. legend) and wine region: Vinhos Verdes (1), Dão (2), Douro (3), and Lisboa (4). The average values are ranked according to the veraison date. The values outlined in the bars correspond to the mean duration of each phenophase (1 January–budburst; budburst–flowering; flowering–veraison).

Figure 3.
Simulation of the veraison of cv. Touriga Nacional from the Lisboa wine region. (a) sigmoid model response function. (b) Chronogram of the observed and predicted veraison dates (Julian calendar day of the year, DOY) from 1990 to 2018 (cf. legend).
Figure 3.
Simulation of the veraison of cv. Touriga Nacional from the Lisboa wine region. (a) sigmoid model response function. (b) Chronogram of the observed and predicted veraison dates (Julian calendar day of the year, DOY) from 1990 to 2018 (cf. legend).

Figure 4.
Scatterplot of the sigmoid model (SM) parameters d and e and the corresponding centroids for the three phenological stages (budburst, flowering, and veraison) in red.
Figure 4.
Scatterplot of the sigmoid model (SM) parameters d and e and the corresponding centroids for the three phenological stages (budburst, flowering, and veraison) in red.

Figure 5.
Representation of the generalized sigmoid models (GSM) for each phenological stage: budburst (blue), flowering (yellow), and veraison (green).
Figure 5.
Representation of the generalized sigmoid models (GSM) for each phenological stage: budburst (blue), flowering (yellow), and veraison (green).

Figure 6.
Ranking of the F measure for budburst by grapevine variety in the Lisboa wine region. Only models with efficiency coefficient (EF) ≥ 0.5 are shown.
Figure 6.
Ranking of the F measure for budburst by grapevine variety in the Lisboa wine region. Only models with efficiency coefficient (EF) ≥ 0.5 are shown.

Figure 7.
Ranking of the F measure for flowering by grapevine variety in the Lisboa wine region. Only models with EF ≥ 0.5 are shown.
Figure 7.
Ranking of the F measure for flowering by grapevine variety in the Lisboa wine region. Only models with EF ≥ 0.5 are shown.

Figure 8.
Ranking of the F measure for veraison by grapevine variety in the Lisboa wine region. Only models with EF ≥ 0.5 are shown.
Figure 8.
Ranking of the F measure for veraison by grapevine variety in the Lisboa wine region. Only models with EF ≥ 0.5 are shown.


Table 1.
Description of the selected phenological data for the three main phenological stages (budburst, flowering, and veraison) by wine region (Douro, Dão, Vinhos Verdes, and Lisboa) and for the selected varieties. The geographical location (latitude and longitude) of each pair wine region/vineyard plot are indicated. The same locations apply to their corresponding weather stations. The grapevine varieties and the corresponding periods of phenological data are also outlined.
| Region (Plot) (Weather Station) | Latitude (N) | Longitude (W) | Variety | Available Period |
|---|---|---|---|---|
| Budburst 1 Flowering 2 Veraison 3 | ||||
| Douro (A) | 41°8′15″ | 7°15′42″ | Touriga Nacional | 2014−2018 |
| Douro (B) | 41°12′55″ | 7°32′16″ | 2014−2018 | |
| Douro (C) | 41°14′22″ | 7°45′20″ | 2015−2018 | |
| Douro (D) | 41°9′16″ | 7°45′20″ | 2015−2018 | |
| Douro (E) | 41°12′34′′ | 7°25′58′′ | 2014−2018 | |
| Douro (A1) | 41°2′25″ | 7°2′12″ | Touriga Franca | 2014−2018 |
| Douro (B1) | 41°9′59″ | 7°33′21″ | 2014−2018 | |
| Douro (C1) | 41°9′56″ | 7°46′10″ | 2014−2018 | |
| Douro (D1) | 41°9′12″ | 7°37′24″ | 2014−2018 | |
| Douro (E1) | 41°11′21″ | 7°32′13″ | 2014−2018 | |
| Douro (F1) | 41°14′57″ | 7°6′42″ | 2014−2018 | |
| Douro (G1) | 41°10′23″ | 7°32′56″ | 2001−2012 | |
| Douro (A2) | 41°14′47″ | 7°28′33″ | Moscatel Galego | 2015−2018 |
| Douro (A3) | 41°9′40″ | 7°32′20″ | Aragonez | 1990−2000 |
| Dão (A) | 40°31′31″ | 7°51′22″ | Alfrocheiro, Baga, Bical, Jaen, and Touriga Nacional | 2014−2018 |
| Dão (B) | 40°38′20″ | 7°54′39″ | 2014−2017 | |
| Dão (C) | 40°39′46″ | 7°54′09″ | 2014−2017 | |
| Vinhos Verdes | 41°48′56″ | 8°24′38″ | Alvarinho, Arinto, Azal Branco, Espadeiro, Vinhão, and Loureiro | 1996−2017 |
| Lisboa | 39°2′28″ | 9°10′52″ | Alfrocheiro, Alvarinho, Antão Vaz, Aragonez, Arinto, Avesso, Azal Branco, Baga, Bastardo, Cabernet Sauvignon, Castelão, Chardonnay, Dona Maria, Encruzado, Espadeiro, Fernão Pires, Gouveio, Jaen, Loureiro, Malvasia Fina, Merlot, Moscatel de Setúbal, Moscatel Galego, Pinot, Riesling, Sauvignon, Síria, Syrah, Tinta Barroca, Tinta Francisca, Tinto Cão, Touriga Franca, Touriga Nacional, Trajadura, Vinhão, and Viosinho | 1990−2018 |
BBCH: Biologische Bundesanstalt, Bundessortenamt und CHemische Industrie scale. 1 BBCH 07; 2 BBCH 65; 3 BBCH 81.
© 2020 by the authors. Licensee MDPI, Basel, Switzerland. This article is an open access article distributed under the terms and conditions of the Creative Commons Attribution (CC BY) license (http://creativecommons.org/licenses/by/4.0/).
Share and Cite
MDPI and ACS Style
Reis, S.; Fraga, H.; Carlos, C.; Silvestre, J.; Eiras-Dias, J.; Rodrigues, P.; Santos, J.A. Grapevine Phenology in Four Portuguese Wine Regions: Modeling and Predictions. Appl. Sci. 2020, 10, 3708. https://doi.org/10.3390/app10113708
AMA Style
Reis S, Fraga H, Carlos C, Silvestre J, Eiras-Dias J, Rodrigues P, Santos JA. Grapevine Phenology in Four Portuguese Wine Regions: Modeling and Predictions. Applied Sciences. 2020; 10(11):3708. https://doi.org/10.3390/app10113708
Chicago/Turabian StyleReis, Samuel, Helder Fraga, Cristina Carlos, José Silvestre, José Eiras-Dias, Pedro Rodrigues, and João A. Santos. 2020. "Grapevine Phenology in Four Portuguese Wine Regions: Modeling and Predictions" Applied Sciences 10, no. 11: 3708. https://doi.org/10.3390/app10113708
Note that from the first issue of 2016, this journal uses article numbers instead of page numbers. See further details here.