Article

Scouring Depth Assessment Downstream of Weirs Using Hybrid Intelligence Models

by
Ahmad Sharafati
1,2,3,*,
Masoud Haghbin
3,
Seyed Babak Haji Seyed Asadollah
3,
Nand Kumar Tiwari
4,
Nadhir Al-Ansari
5 and
Zaher Mundher Yaseen
6
1
Institute of Research and Development, Duy Tan University, Da Nang 550000, Vietnam
2
Faculty of Civil Engineering, Duy Tan University, Da Nang 550000, Vietnam
3
Department of Civil Engineering, Science and Research Branch, Islamic Azad University, Tehran, Iran
4
Department of Civil Engineering, National Institute of Technology, Kurukshetra, Haryana, India
5
Civil, Environmental and Natural Resources Engineering, Lulea University of Technology, 97187 Lulea, Sweden
6
Sustainable Developments in Civil Engineering Research Group, Faculty of Civil Engineering, Ton Duc Thang University, Ho Chi Minh City, Vietnam
*
Author to whom correspondence should be addressed.
Appl. Sci. 2020, 10(11), 3714; https://doi.org/10.3390/app10113714
Submission received: 19 April 2020 / Revised: 19 May 2020 / Accepted: 21 May 2020 / Published: 27 May 2020
(This article belongs to the Special Issue Machine Learning Algorithms for Hydraulic Engineering)

Abstract

:
Considering the scouring depth downstream of weirs is a challenging issue due to its effect on weir stability. The adaptive neuro-fuzzy inference systems (ANFIS) model integrated with optimization methods namely cultural algorithm, biogeography based optimization (BBO), invasive weed optimization (IWO) and teaching learning based optimization (TLBO) are proposed to predict the maximum depth of scouring based on the different input combinations. Several performance indices and graphical evaluators are employed to estimate the prediction accuracy in the training and testing phase. Results show that the ANFIS-IWO offers the highest prediction performance (RMSE = 0.148) compared to other models in the testing phase, while the ANFIS-BBO (RMSE = 0.411) provides the lowest accuracy. The findings obtained from the uncertainty analysis of prediction modeling indicate that the input variables variability has a higher impact on the predicted results than the structure of models. In general, the ANFIS-IWO can be used as a reliable and cost-effective method for predicting the scouring depth downstream of weirs.

1. Introduction

Weirs are the grade-control structures for stabilizing the water level and flow velocity in channels and improving the efficiency of fish passages and enhancing river water quality [1,2]. The findings reported in the literature confirm the influence of vortex systems, especially horse-shoes vorticities on local scouring downstream of hydraulic structures [3,4,5]. The downflow, horseshoe and wake vortices cause the scouring phenomenon for unsubmerged obstacles like bridge piers. In contrast, for submerged obstacles like weirs, the size and strength of horseshoe vortex would be significantly decreased by increasing the submergence ratio [6]. The outlet jet causes local scouring downstream of weirs. Available evidence demonstrates that secondary flows and vortex systems caused by hydraulic jump could govern the scour depth downstream of a weir [7,8,9]. Therefore, a precise assessment of scour depth downstream of weirs is essential to provide adequate stability [10,11,12]. The depth scouring downstream of weirs is a highly complex phenomenon due to several effective factors such as flow depth, flow velocity, tailwater depth and geometry of weirs [1]. Figure 1 illustrates the graphical description of scour depth downstream of weirs.
An overview of previous studies shows that the methods used to estimate the scouring depth can be divided as; (i) numerical models, (ii) empirical formulas, (iii) soft computing techniques. Scour process can be assessed by different types of numerical schemes by solving the combination of Navier–Stokes equations and sediment transport formula [9]. Improvement of numerical models (e.g., ANSYS-FLUENT, Flow3D) make them the powerful alternative for simulating the scouring depth. However, the numerical models are limited because of the high cost of computation in complex problems. The empirical formulas have been developed based on laboratory experiments. A number of laboratory studies have been carried out in the last three decades using different flow conditions and bed properties. [13,14,15,16,17,18]. Several regression formulas have been obtained based on the laboratory investigations to estimate the scouring depth; however, those are associated with significant errors due to stochasticity and non-linearity of scouring phenomena [11].
Although the empirical formulas have been mostly adopted to predict the scouring depth due to its simplicity, the scale limitation causes inadequate accuracy in some cases [19]. Besides, those formulas are highly sensitive to the validity of the parameters ranges and the availability of adequate experiments. Hence, the application of empirical models for scouring modeling is not satisfactory due to its non-linearity and complexity [20]. In contrast, soft computing (SC) techniques offer attractive features to simulate complex relationships between input and output variables. SC models mimick the target trends based on the observational data to provide an adequate estimation when a simple empirical formula may not capture the complexity of scouring process [9,21,22]. Unlike the empirical formulas, the prediction modeling is generated automatically and is not dependent on user knowledge. These models can detect implicit interactions between attributes, whereas the empirical formulas are dependent on explicit information before building models to investigate the relations between different parameters. This benefit is one of the primary key strengths of SC models to provide cheaper and flexible solutions for analyzing complex problems in comparison with the empirical models [7,23]. Despite the capabilities mentioned above, SC models are closed box, and thus, it is difficult to determine the attributes of the modelling while it is an easy task in empirical formulas. As a consequence, the merits of SC models are significantly outweighed, although they are a reliable alternative for predicting the scouring depth.
The soft computing (SC) techniques provide required adequacy to explore a non-linear relation between target and input variables. The SC models are more cost-effective to give authentic relationships in comparison with numerical and empirical models. Hence, SC techniques are reliable alternatives for estimating the scour depth in hydraulic engineering [24,25,26]. The potential of SC models in predicting the scour depth have been extensively discussed over the previous studies [22]. A number of investigations have been conducted to improve the accuracy of depth scouring prediction using SC models such as genetic programming [27,28,29] support vector machines [10,11,30], adaptive neural fuzzy inference systems [31,32] and artificial neural networks [33]. Those techniques exhibit accurate performances to predict scour depth downstream of different types of hydraulic structures such as spillway, chutes, etc.
In recent years, the potential of SC models for prediction of scouring depth downstream of weirs have been assessed using different models like genetic expression programming, self-adaptive extreme learning machine and neuro-fuzzy [7,34,35,36]. The research findings indicated that the SC models provided better performance in comparison with regression formulas. The adequacy observed in SC models is originated from evolutionary algorithms and iterative procedures. However, the standalone SC models have been recently integrated with meta-heuristic optimizations to provide better predictive models [22]. The meta-heuristic algorithms which are inspired from nature such as ant colony optimization and particle swarm optimization are efficient tools for enhancing standalone models [37]. Jang [38] combined the neural networks with the fuzzy logic technique to provide the adaptive neural fuzzy inference systems (ANFIS), which includes the benefits of both methods. A number of studies indicated that the ANFIS model is a viable alternative to solve hydraulic engineering problems in comparison with the regression technique [32,39,40,41]. However, parameters tuning is a major limitation of ANFIS. To solve this problem, the standalone ANFIS has been integrated with meta-heuristic optimization algorithms to tackle this limitation [9].
This study aims to develop different hybrid ANFIS models integrated with meta-heuristic optimization algorithms for estimating the scour depth downstream of weirs. To the best of the authors’ knowledge, meta-heuristic algorithms (e.g., Cultural, BBO, TLBO and IWO) have not been combined yet with standalone ANFIS to estimate the scour depth around the different types of structures such as bridges, pipelines, dam spillways, grade control structures and piles. The approach proposed in the present study enhances the training phase of standalone ANFIS and provides better performance in this application of area.

2. Materials and Methods

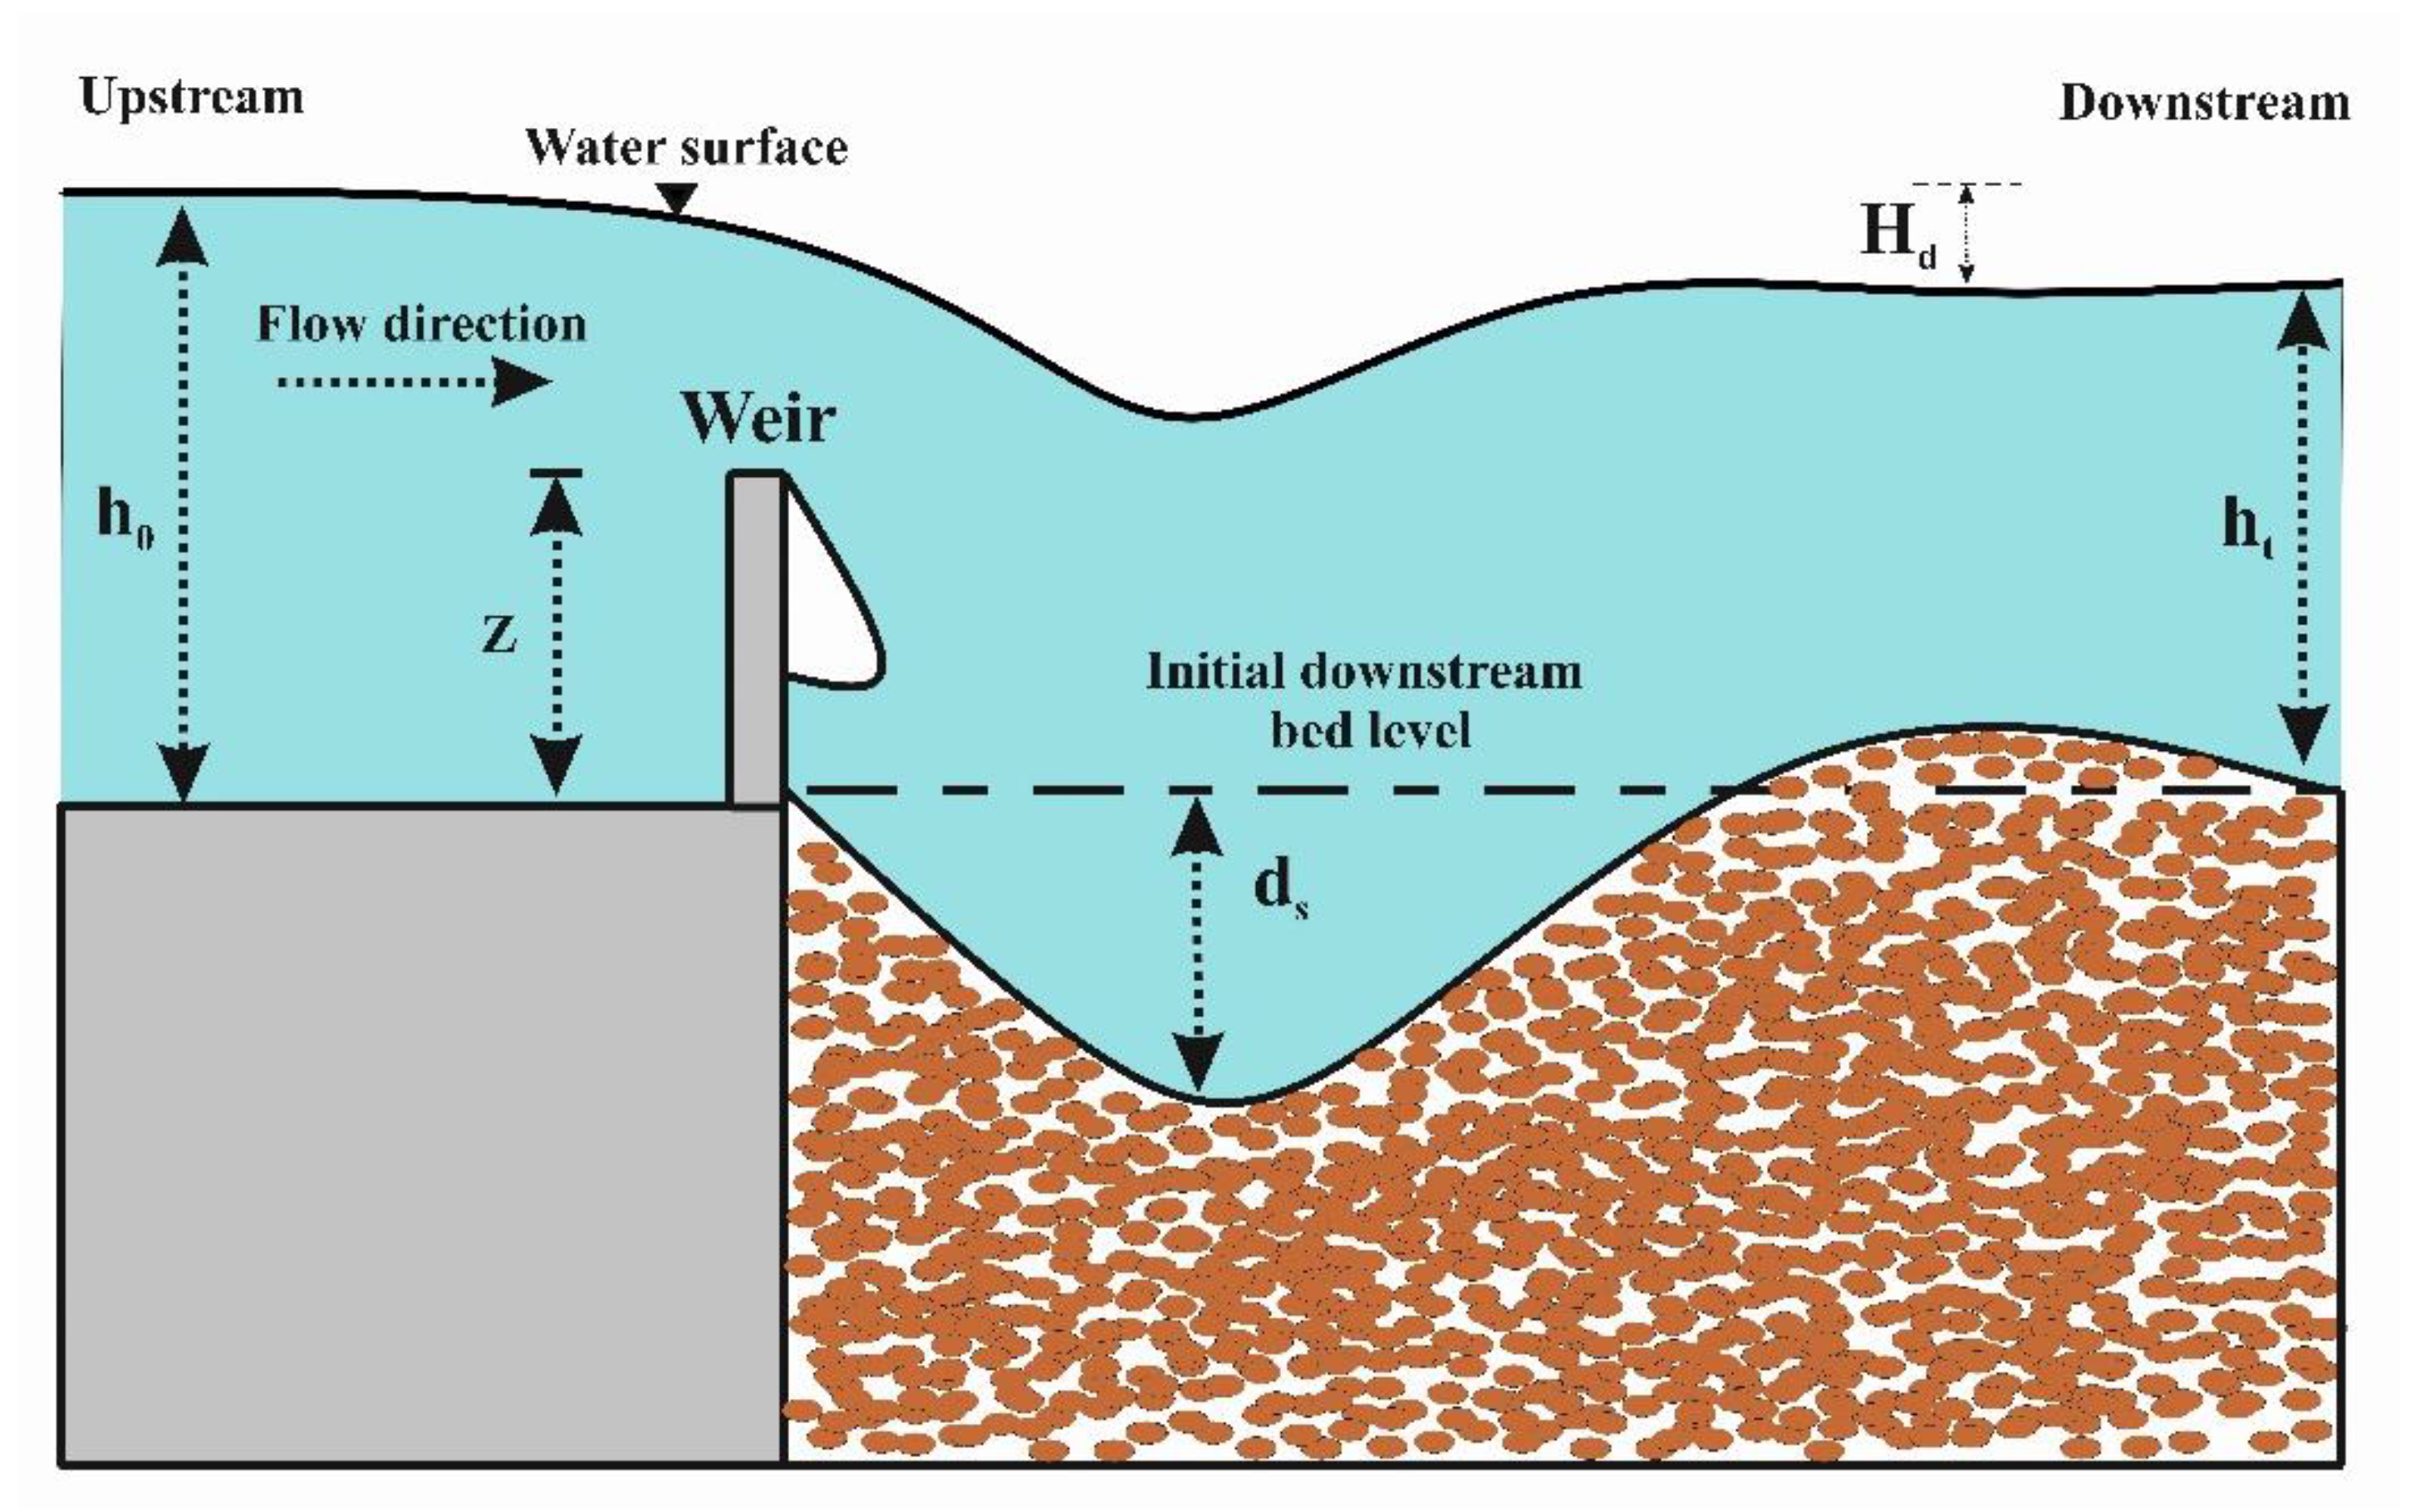
2.1. Laboratory Data for Estimating Scour Depth

Scour depth downstream of weirs depends on bed material, flow conditions, weir geometry and tailwater depth [7,11,42]. Hence, the following relation can be used for the scour depth estimation:
d s = f ( ρ , ν , h 0 , g , h t , U 0 , ρ s , d 50 , σ g , U c , b , z )
where, ρ is the density of water, ν stands for kinematic viscosity of fluid, h 0 refers to average approach flow depth, g is the acceleration of gravity, h t embodies tailwater depth, U 0 refers to average approach flow velocity, ρ s is bed particle density, d 50 denotes mean bed particle size, σ g is the standard deviation of bed particle size, U c identifies critical average approach flow velocity, b indicates weir width, z stands for weir height and d s is scouring depth. To estimate the scour depth, the non-dimensional parameters provide more performance in comparison with dimensional ones [43,44]. A number of investigations assessed the impact of the non-dimensional parameters (e.g., d 50 h t , z h t , U 0 U C ) on scouring depth downstream of weirs. Several studies indicated that the changes in the magnitude of approach flow and tailwater have significant impact on scour depth [1,45,46]. Wang et al. [2] found that downstream slope and flow intensity have a considerable effect on downstream scouring depth. Guan et al. [1] attained that scour depth increased with decreasing tailwater depth ( z h t ) and increasing flow intensity ( U 0 U C ). Other studies showed that the weir width ( b h t ) also has significant effect on scouring depth downstream of weirs [7,8]. Hence, the following equation is used based in dimensional analysis [1]:
d s h t = f ( d 50 h t , z h t , U 0 U C )
where, d 50 h t , U 0 U C , z h t , respectively quantify the effect of bed particle size, flow condition, and tailwater depth on scouring depth.
A dataset with 186 experimental data is gathered from four published papers [15,47,48,49] with different conditions of surveys to assess the capability of the new hybrid ANFIS techniques. In the following, the summary of gathered datasets is briefly discussed: Veronese [47] experimentally examined the scour depth downstream of weirs using a rectangular flume, where the width of weir and flume was 0.5 m. In all experimental runs, the difference between flow depth upstream and downstream of weir was kept as 1 m. Different bed properties with d 50 values of 9.1, 14.2, 21 and 36.2 mm were used. Additionally, the Q b was changed in the range of 0.001 and 0.083 m 2 s . The observed scour depths were reported between 0.055 and 0.22 m. Falciai and Giacomin [49] performed other laboratory experiments to assess the scour depth downstream of weir. They varied the specific discharge between 1.2 and 13.4 m 2 s . Several widths of rectangular channel were considered in the range of 0.4 to 3.5 m. The d 50 values were in the range of 0.019–0.1 m. The scour depth was observed within 0.4–3.5 m. D’agostino [15] conducted laboratory experiments to investigate local scour downstream of weirs. They designed two types of weirs with different b B ratio of 0.3 and 0.6 ( B is the flume width). The median diameters of bed particle were in the range 4.1 to 17.6 mm. In all experimental runs, discharge values were considered between 0.0167 and 0.167 m 2 s which caused the scour depth within 0.0450.280 m. Similar investigation has also been carried out by D’Agostino and Ferro [48] to assess scour depth downstream of weirs. The b B values were similar to previous study although d 50 values were in the range of 9.1 to 11.5 mm.
Guan et al. [1] carried out several experiments in a rectangular flume (12 m long, 0.44 m wide, and 0.58 m deep) with the different bed materials (fine and coarse) to assess scouring depth downstream of weirs. The d 50 values were considered to be between 0.26 and 0.85 m. They developed the empirical formulas to estimate scour depth downstream of a weir as follows:
d s h t = 17.42 × ( z h t ) 1.10 ( d 50 h t ) 0.07 ( U 0 U c 0.4 ) 0.4 < U 0 U c < 1
d s h t = 4.5 × ( z h t ) 1.10 ( d 50 h t ) 0.07 ( ( U 0 U c 0.9 ) 0.23 U 0 U c 0.9 ) 1 < U 0 U c < 3.65
Table 1 shows the range of input and output parameters employed in the present study.

2.2. Adaptive Neuro-Fuzzy Inference System

The adaptive neuro-fuzzy inference system (ANFIS) was first introduced by Jang [38]. The key strengths of ANFIS include its potential to estimate non-linear relations and less dependency on user knowledge [50]. The non-linear relationships between inputs and outputs are yielded through membership functions. Membership functions map each input correspondent to values between 0 and 1. The appropriate values of the parameters of membership functions and fuzzy rules are the major concerns to obtain a precise learning process using available knowledge and experiences [9]. Thus, it is essential to use the meta-heuristic algorithms to tune the ANFIS parameters. The core feature of ANFIS is fuzzy logic rules (if-then rules) as major parts of modeling.

2.3. Description of the Optimization Methods

To obtain the optimistic value of the ANFIS parameters, several optimization methods, including biogeography based optimization (BBO), cultural, invasive weeds optimization (IWO), and teaching learning-based optimization (TLBO) algorithms are used. A brief description of the optimization methods used in the present study is demonstrated as follows:
-
Biogeography based optimization
Simon [51] proposed the mathematical expression of migration behavior between species in different habitats for solving optimization problems. He employed two indices named Habitat-Suitability Index (HSI) and Suitability Index Variables (SIV). The HSI denotes the quality of living conditions in a suitable habitat. The living condition is related to many factors such as climate conditions, natural sources and richness of food sources. The SIV measures the suitability of living in a specific habitat utilizing several stated factors. The roulette wheel selection concept is used to enhance the quality of habitats with low living conditions. The basis of procedure in Biogeography based optimization (BBO) model is iterative computation. In each iteration, the fitness function is measured until the best solution with appropriate convergence is achieved, and then the computation procedure is terminated.
-
Cultural algorithm
Reynolds and Chung [52] proposed the cultural algorithm for solving non-linear problems. This algorithm includes two main search spaces as (i) population space, and (ii) belief space. The population space is similar to genetic algorithm procedure, while belief space depends on the culture of a specific population. The belief space simulates the knowledge about the culture of the population. In this space, the overall experiences from successful members are saved and will be transferred to the next generations. The belief space includes two types of knowledge as: (i) situational knowledge and (ii) normative knowledge. The belief and population spaces interact with each other through a pre-defined protocol. In this way, a mechanism is adopted to regenerate the population space based on cultures governed in belief space. For selecting a group to make belief space, the acceptance function is defined to choose the qualified members for new generations. Then, the influence function makes the belief of a total population similar to the one for solving the problem.
-
Invasive weeds optimization
Invasive weeds optimization (IWO) method was introduced by Mehrabian and Lucas [53] for solving engineering problems. This method employs the mechanism of generating weeds colonies and exploring appropriate position for growth. This method contains four main functions as follows:
i.
Generating primary population function: the seeds which are also named as prime solutions are dispersed randomly in search space for finding a fitting solution to tackle problems.
ii.
Reproduction function: the IWO employs the minimum and maximum quantity of weeds colony objective functions.
iii.
Spatial dispersal function: the primary duty of this function is to provide randomness in the model. This function helps to spread the seed around parental plants. In each iteration, this function measures the standard deviation of new produced results.
iv.
Competitive exclusion function: the main task of this function is to increase the chance of surviving for weak plants which contain a low level of fitness function. In this regard, after reaching to maximum number of population, the members of colonies are sorted, and colonies with the highest number of the population are selected for further calculations in the next iteration.
-
Teaching Learning Based Optimization
Rao et al., [54] proposed teaching learning based optimization (TLBO) algorithm based on the interaction among learners and teachers in a classroom. This method contains two significant stages: “teacher stage” and “learner stage”. In the first stage, the teacher attempts to enhance learner grades. In the next stage. The learners cooperate in obtaining higher grades. Teacher stage comprises two goals of (i) selecting a qualified person with the most information (such as a teacher) to find the best solution to tackle the problem in a classroom and (ii) sharing the information of the teacher to improve the student‘s grades. In this way, the average grade of all learners is computed, and the difference between teacher and average grade of learners can be determined. In the iterative procedure, the existing solution recomputed repeatedly using difference mean. The learner stage aims to enhance the grades of all learner with their collaboration. A random learner (Xi) selects another learner (Xj) to share their information. In each iteration, a new fitness value is obtained for learner (Xi) until the termination criterion is satisfied.

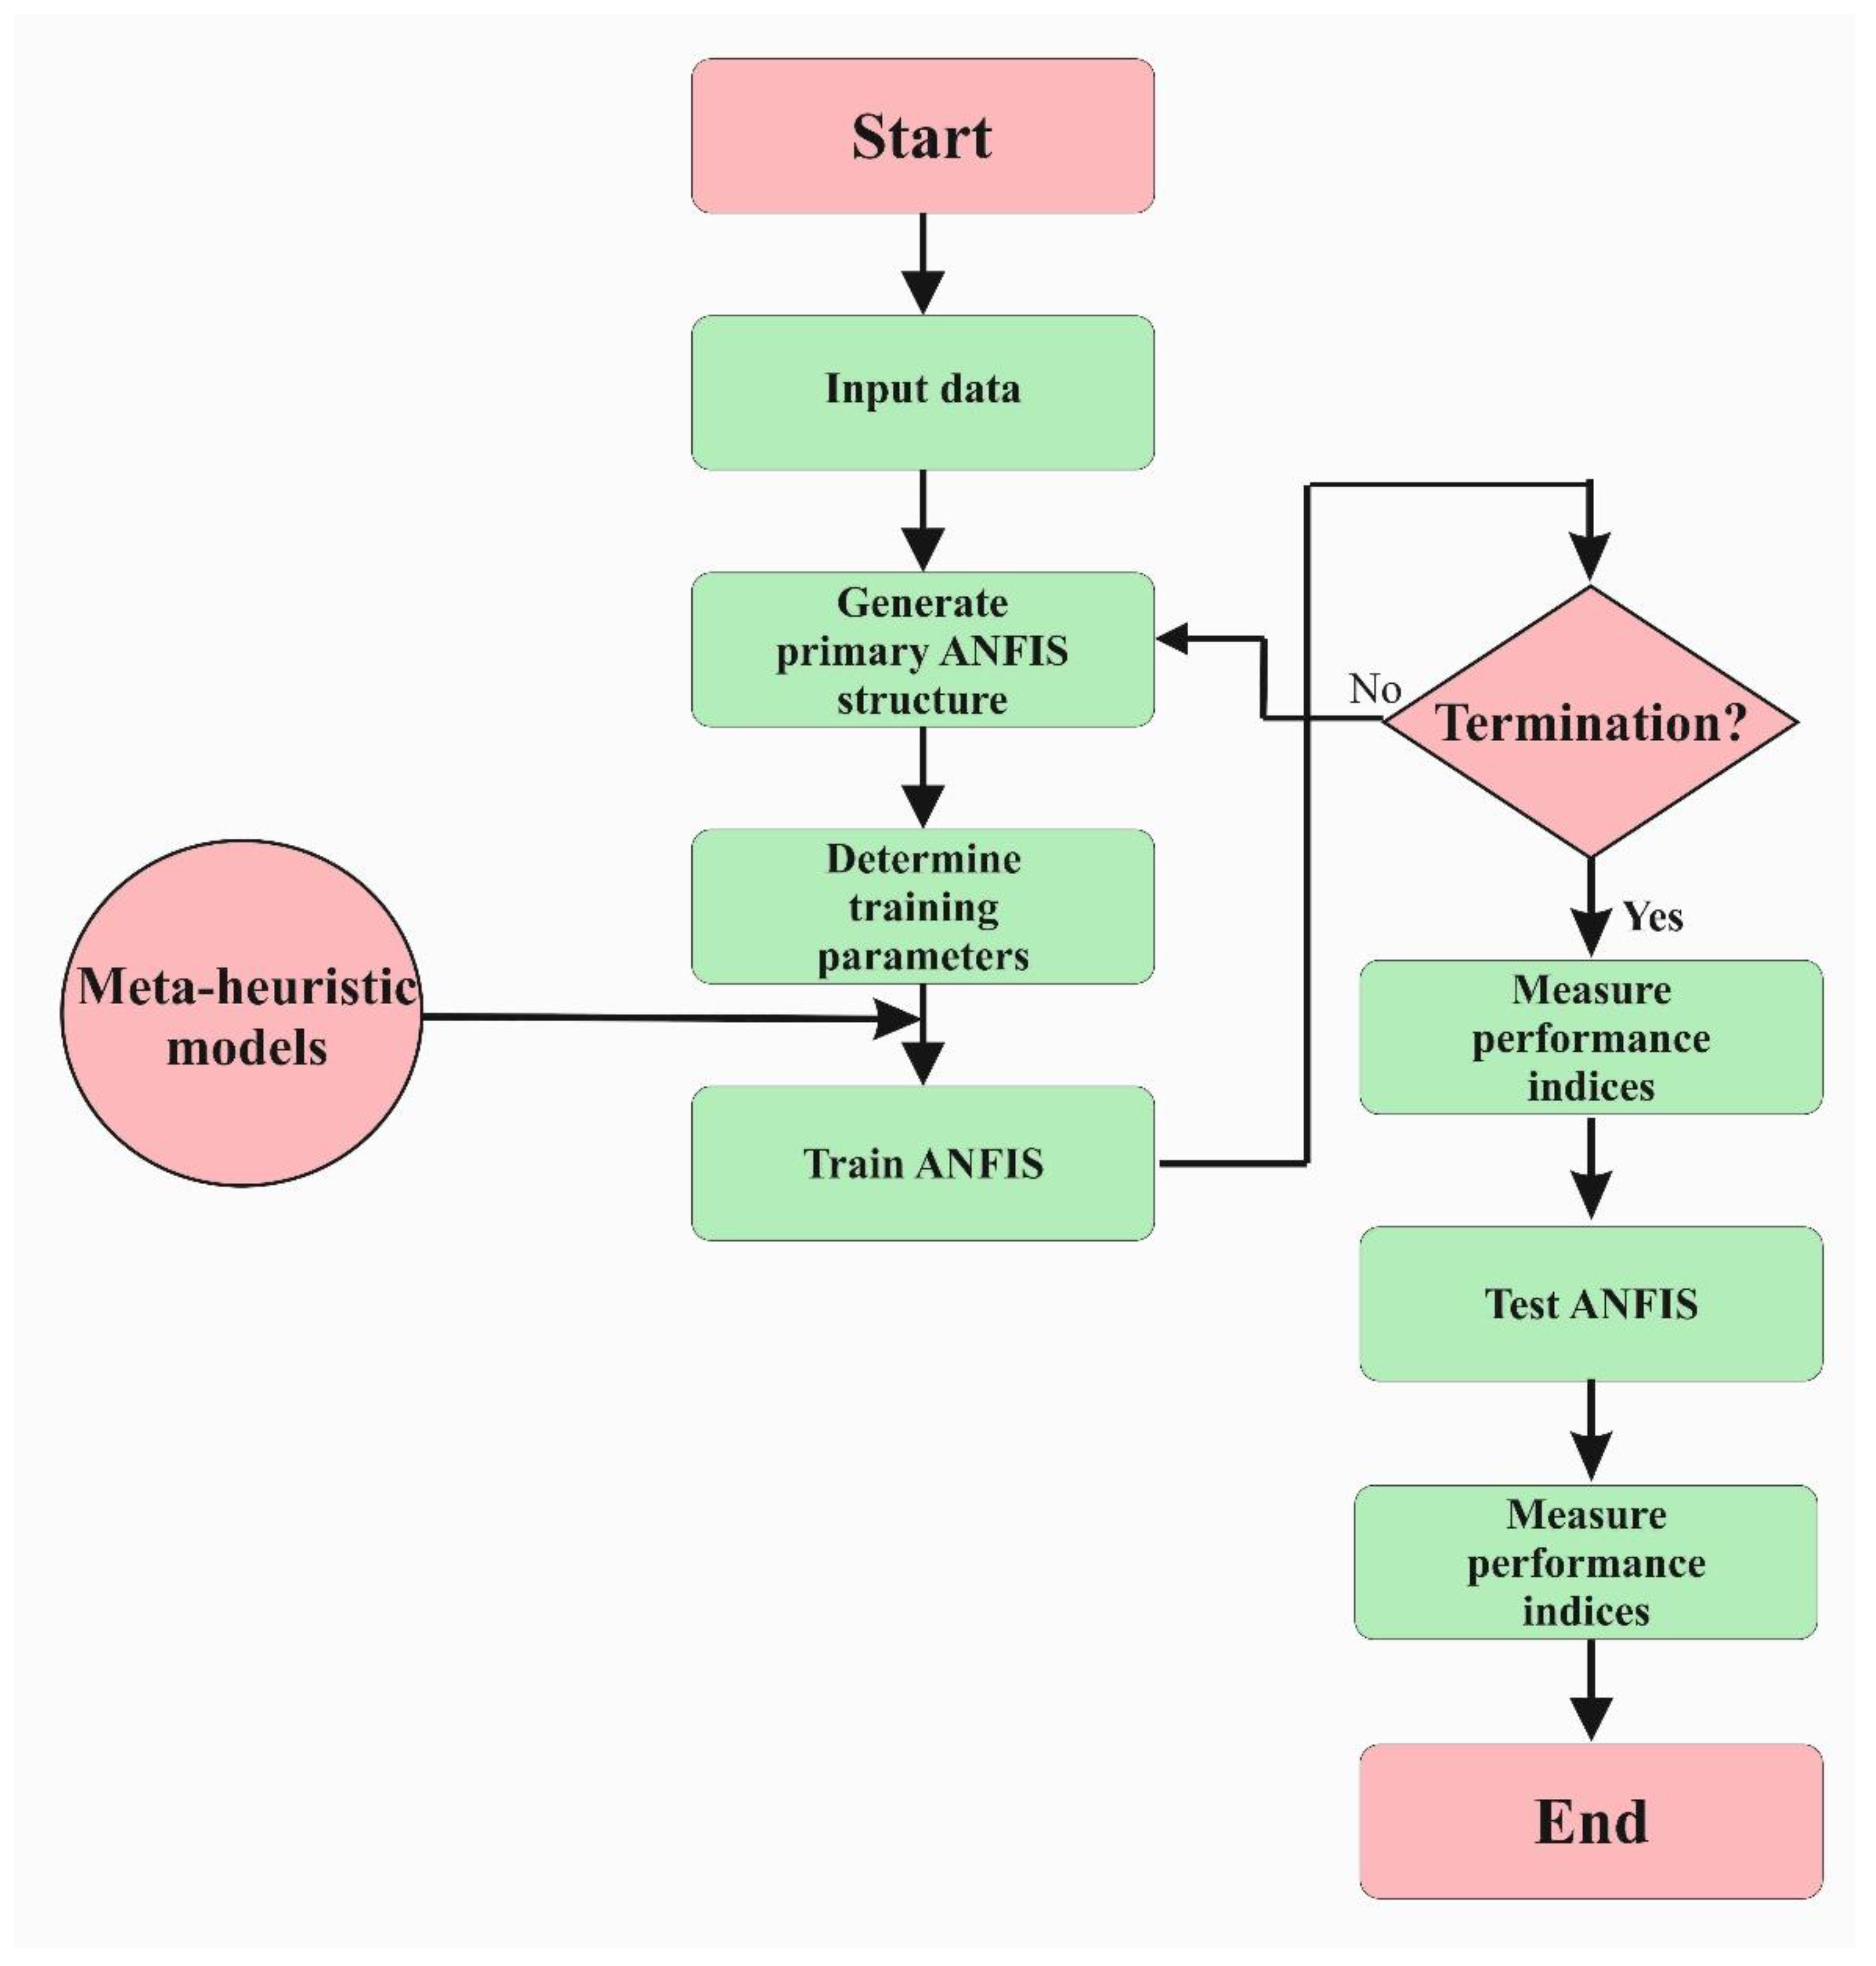
2.4. Optimizing the ANFIS Parameters

To tune the ANFIS parameters using the optimization algorithms proposed in the present study, the following hybridization process is performed.
i.
Divide the dataset into training and testing data with a portion of 66% and 34%, respectively.
ii.
Develop a basic ANFIS.
iii.
Adopt the optimization algorithms for tuning the parameters of membership functions and fuzzy logic rules.
iv.
Select the best hybrid ANFIS model with the highest performance for estimating scour depth downstream of weirs.
The procedure of hybridization is shown in Figure 2.

2.5. Description of Performance Indices

To evaluate the prediction performance of the hybrid models in forecasting the scouring depth downstream of a weir over both training and testing phases, several performance indices such as Mean Absolute Error ( M A E ), Root Mean Square Error ( R M S E ), Correlation Coefficient ( C C ) and Wilcox Index (WI) are employed as follows [26,55,56,57,58,59,60,61]:
M A E = 1 N T j = 1 N T | ( d s h t ) O b s ,   j ( d s h t ) P r e ,   j |
R M S E = 1 N T j = 1 N T ( ( d s h t ) O b s ,   j ( d s h t ) P r e ,   j ) 2
C C = j = 1 N T ( ( d s h t ) O b s ,   j ( d s h t ) O b s ¯ ) ( ( d s h t ) P r e ,   j ( d s h t ) P r e ¯ ) j = 1 N T ( ( d s h t ) O b s ,   j ( d s h t ) O b s ) 2 j = 1 N T ( ( d s h t ) P r e ,   j ( d s h t ) P r e ) 2
W I = 1 [ j = 1 N T ( ( d s h t ) O b s ,   j ( d s h t ) P r e ,   j ) 2 j = 1 N T ( | ( d s h t ) P r e ,   j ( d s h t ) O b s ¯ | + | ( d s h t ) O b s ,   j ( d s h t ) O b s ¯ | ) 2 ]
where the ( d s h t ) O b s ,   j and ( d s h t ) P r e ,   j are the j-th observed and predicted non-dimensional value of scour depth, ( d s h t ) O b s ¯ and ( d s h t ) P r e ¯ shows the corresponding mean value of observed and predicted scour depth and NT denotes the dataset number.

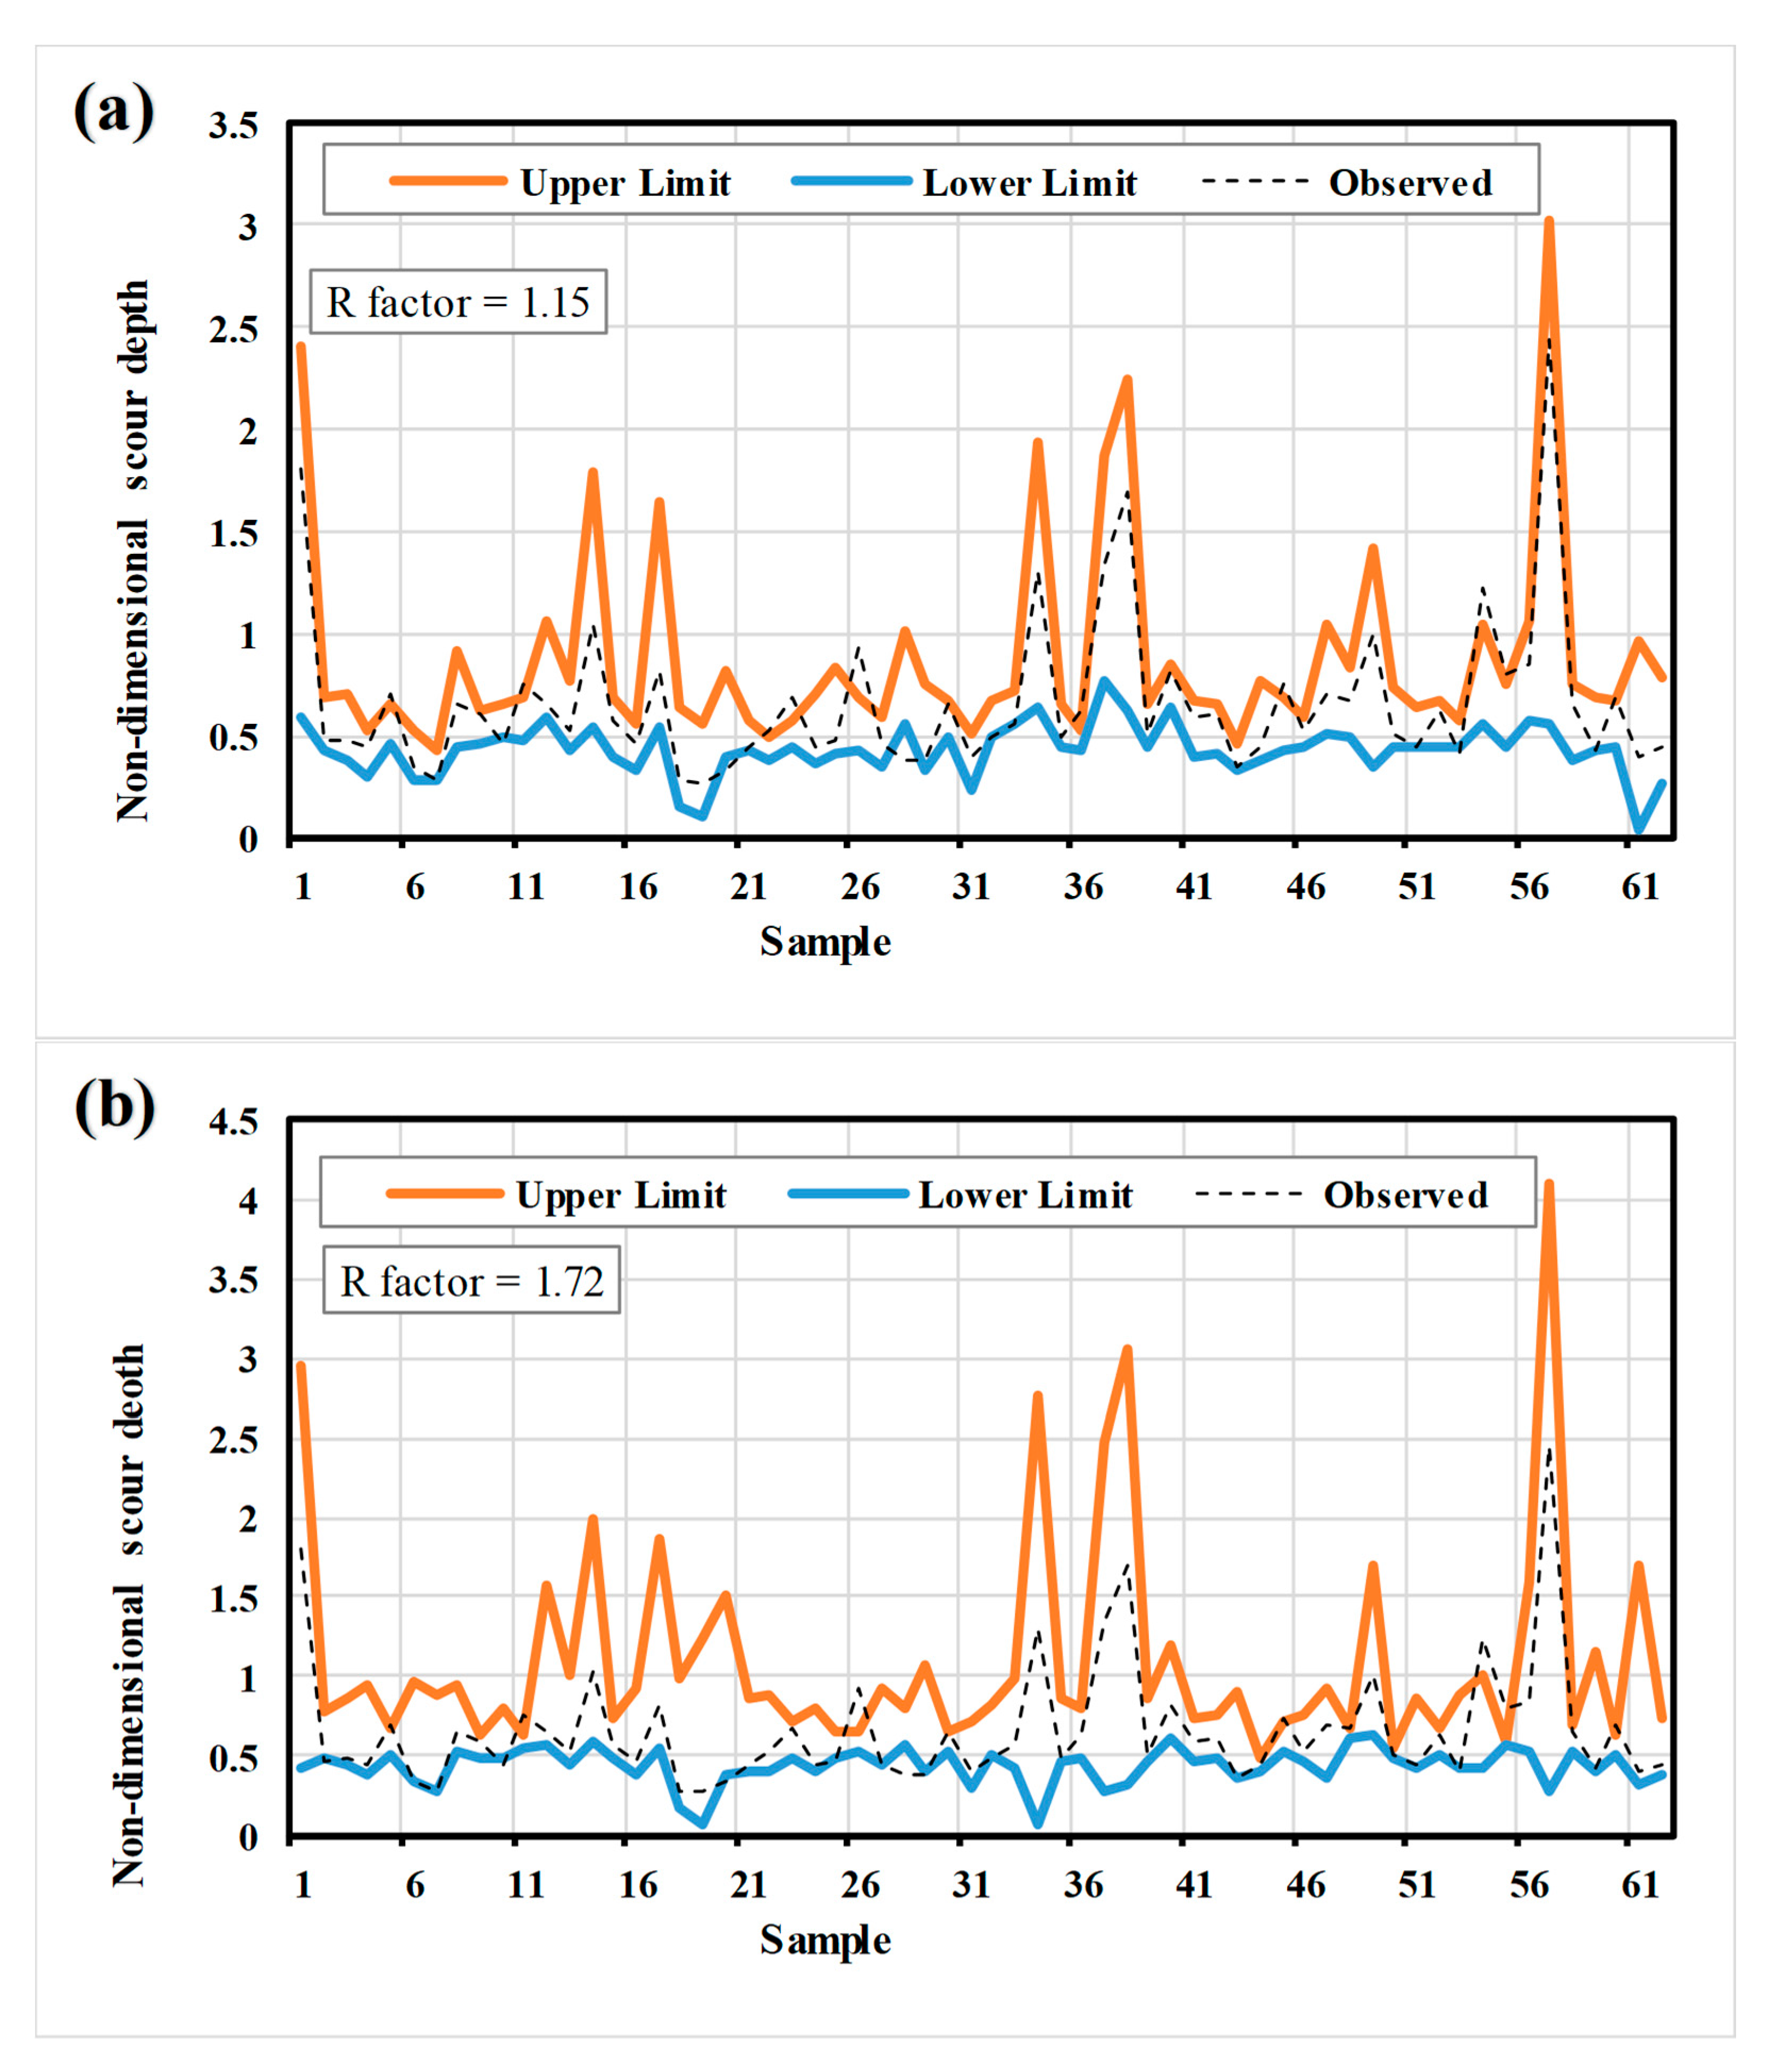
2.6. Uncertainty Analysis

The uncertainty associated with the input parameters and model structure for estimating the scour depth downstream of weir is quantified. The following procedure is used to measure the model structure uncertainty:
i.
All of the results obtained by the best estimator models (e.g., ANFIS-BBO, ANFIS-TLBO, ANFIS-Cultural, ANFIS-IWO) are considered for each computed scouring depth.
ii.
A normal distribution function is assigned to each predicted set.
iii.
To quantify the variability of predicted scouring depth, many samples (1000 generation), corresponding each predicted scouring depth, are generated by Monte Carlo simulation using the probability density function (PDF) obtained in step ii.
iv.
Using the scouring depths generated in step iii, the 95% confidence interval band, which is the interval between the 2.5% and 97.5% percentiles can be obtained.
v.
To quantify the uncertainty associated with the model structure in the prediction of scouring depth, the R factor can be computed as follows [62,63]:
vi.
R   f a c t o r = X m X s
In the above relation, X s represents the standard deviation which computed for observed scouring depth and X m measured by:
X m = i = 1 n ( U L L i L L L i ) / n
The term n is referred to number of total observed data and U L L i and L L L i represent the values of the Upper (97.5%) and lower (2.5%) limits of the ith value, respectively.
To evaluate the input parameters uncertainty, the scour depths measured from different types of input combinations through the superior model are utilized for each computed scouring depth. Then, the steps ii to v should be applied to measure the uncertainty related to input parameters.

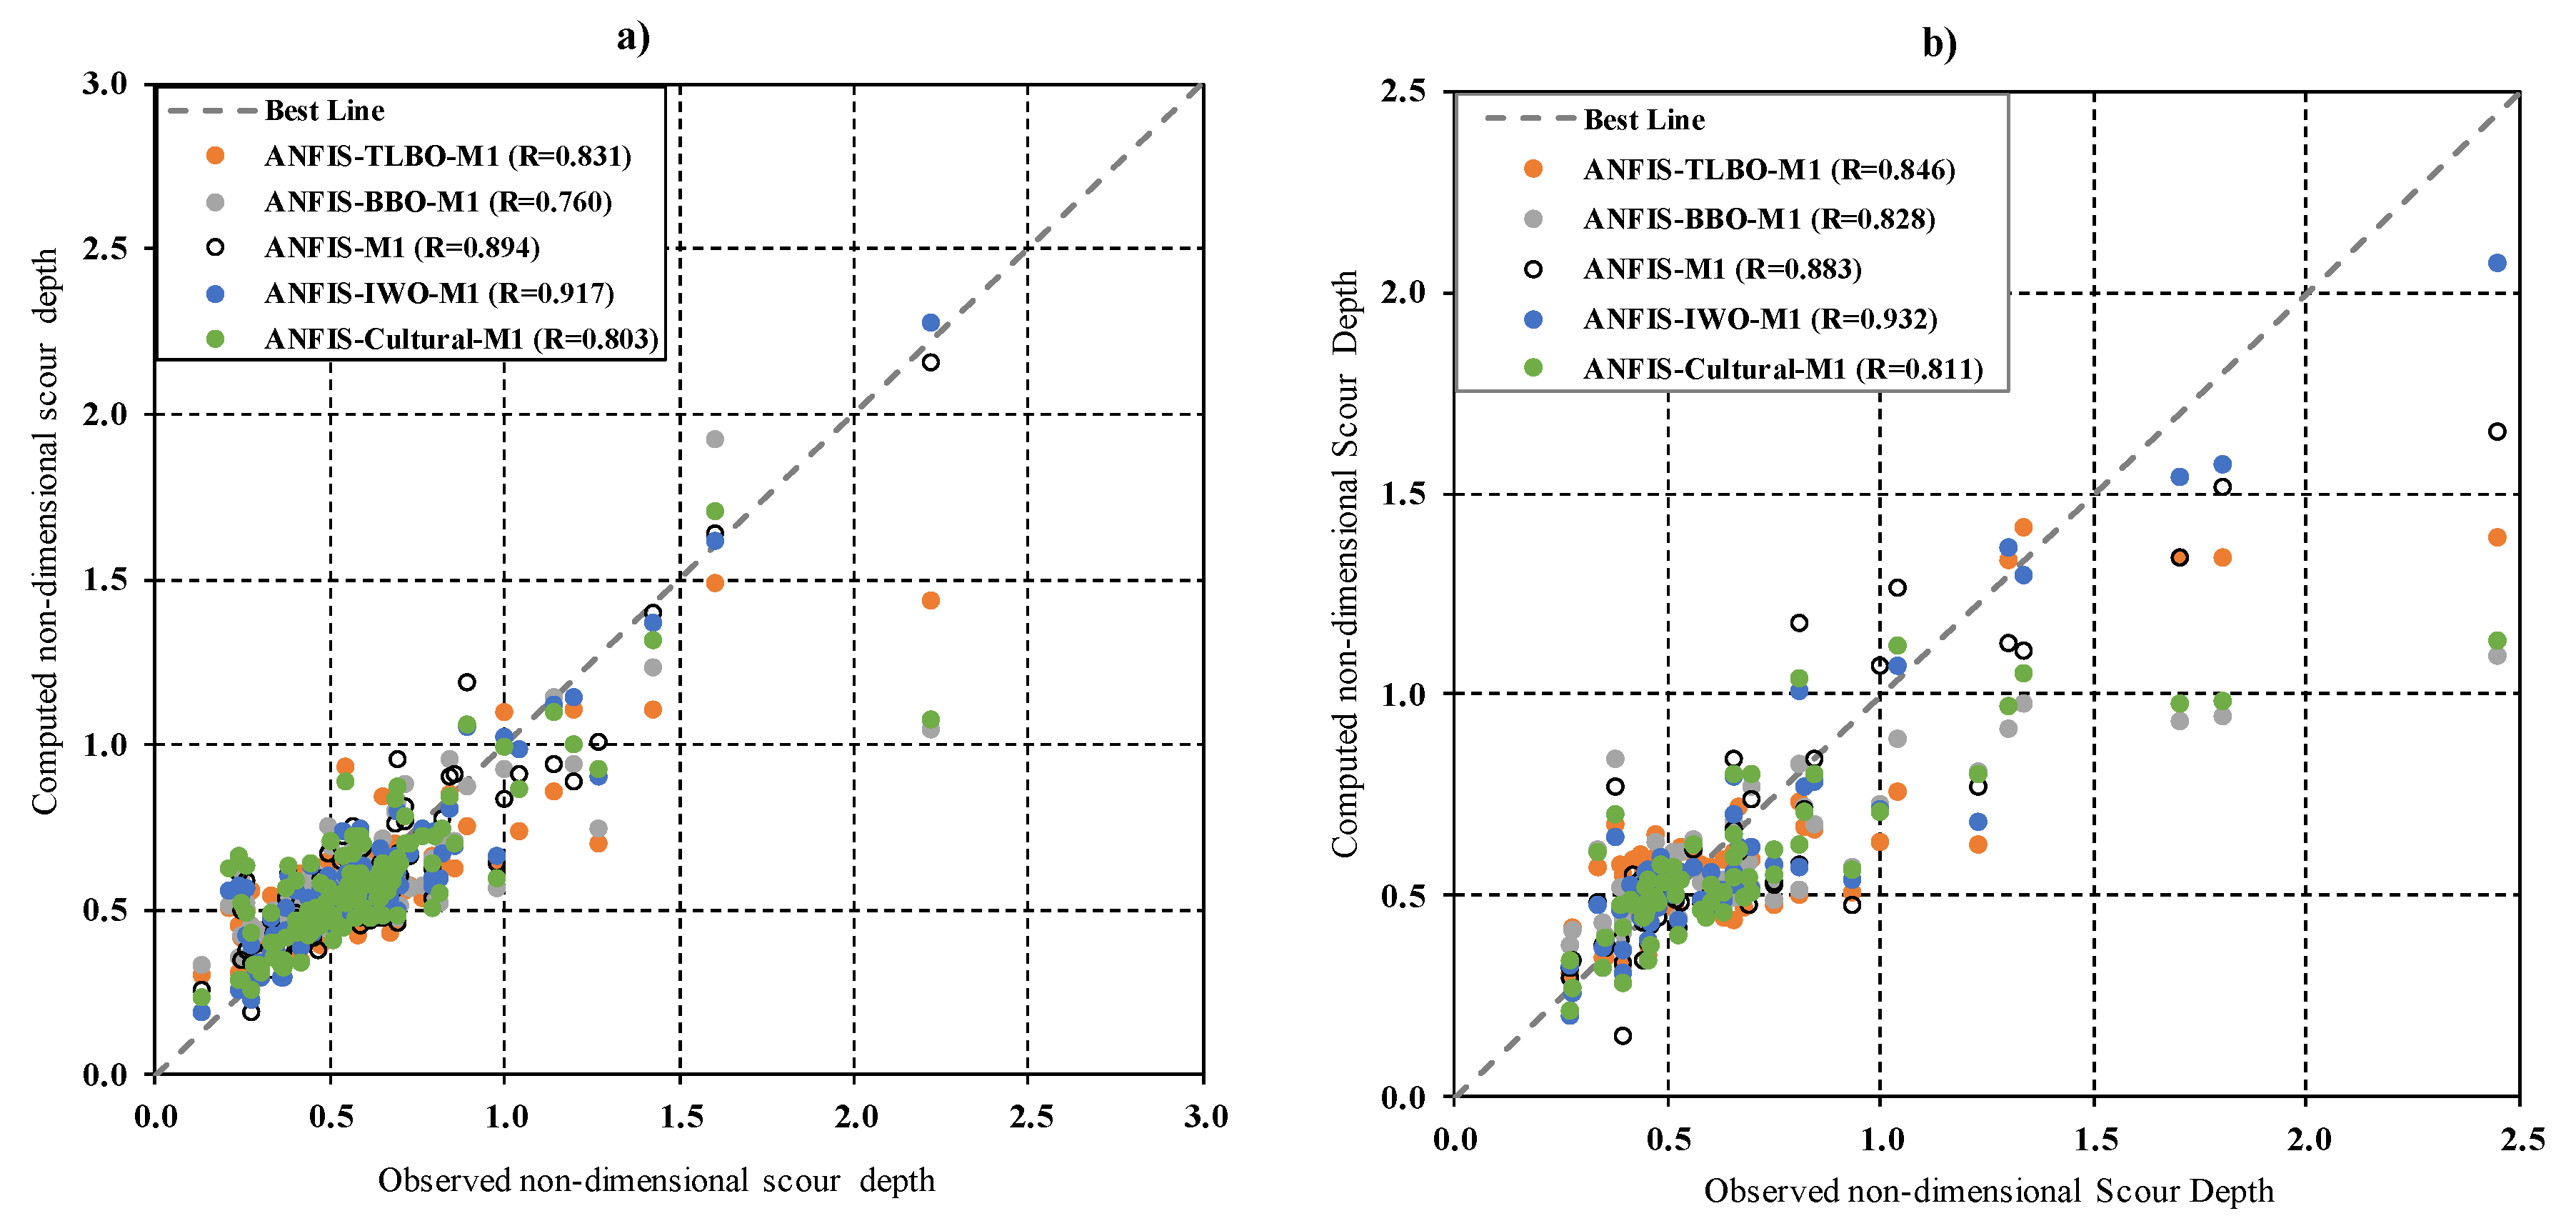
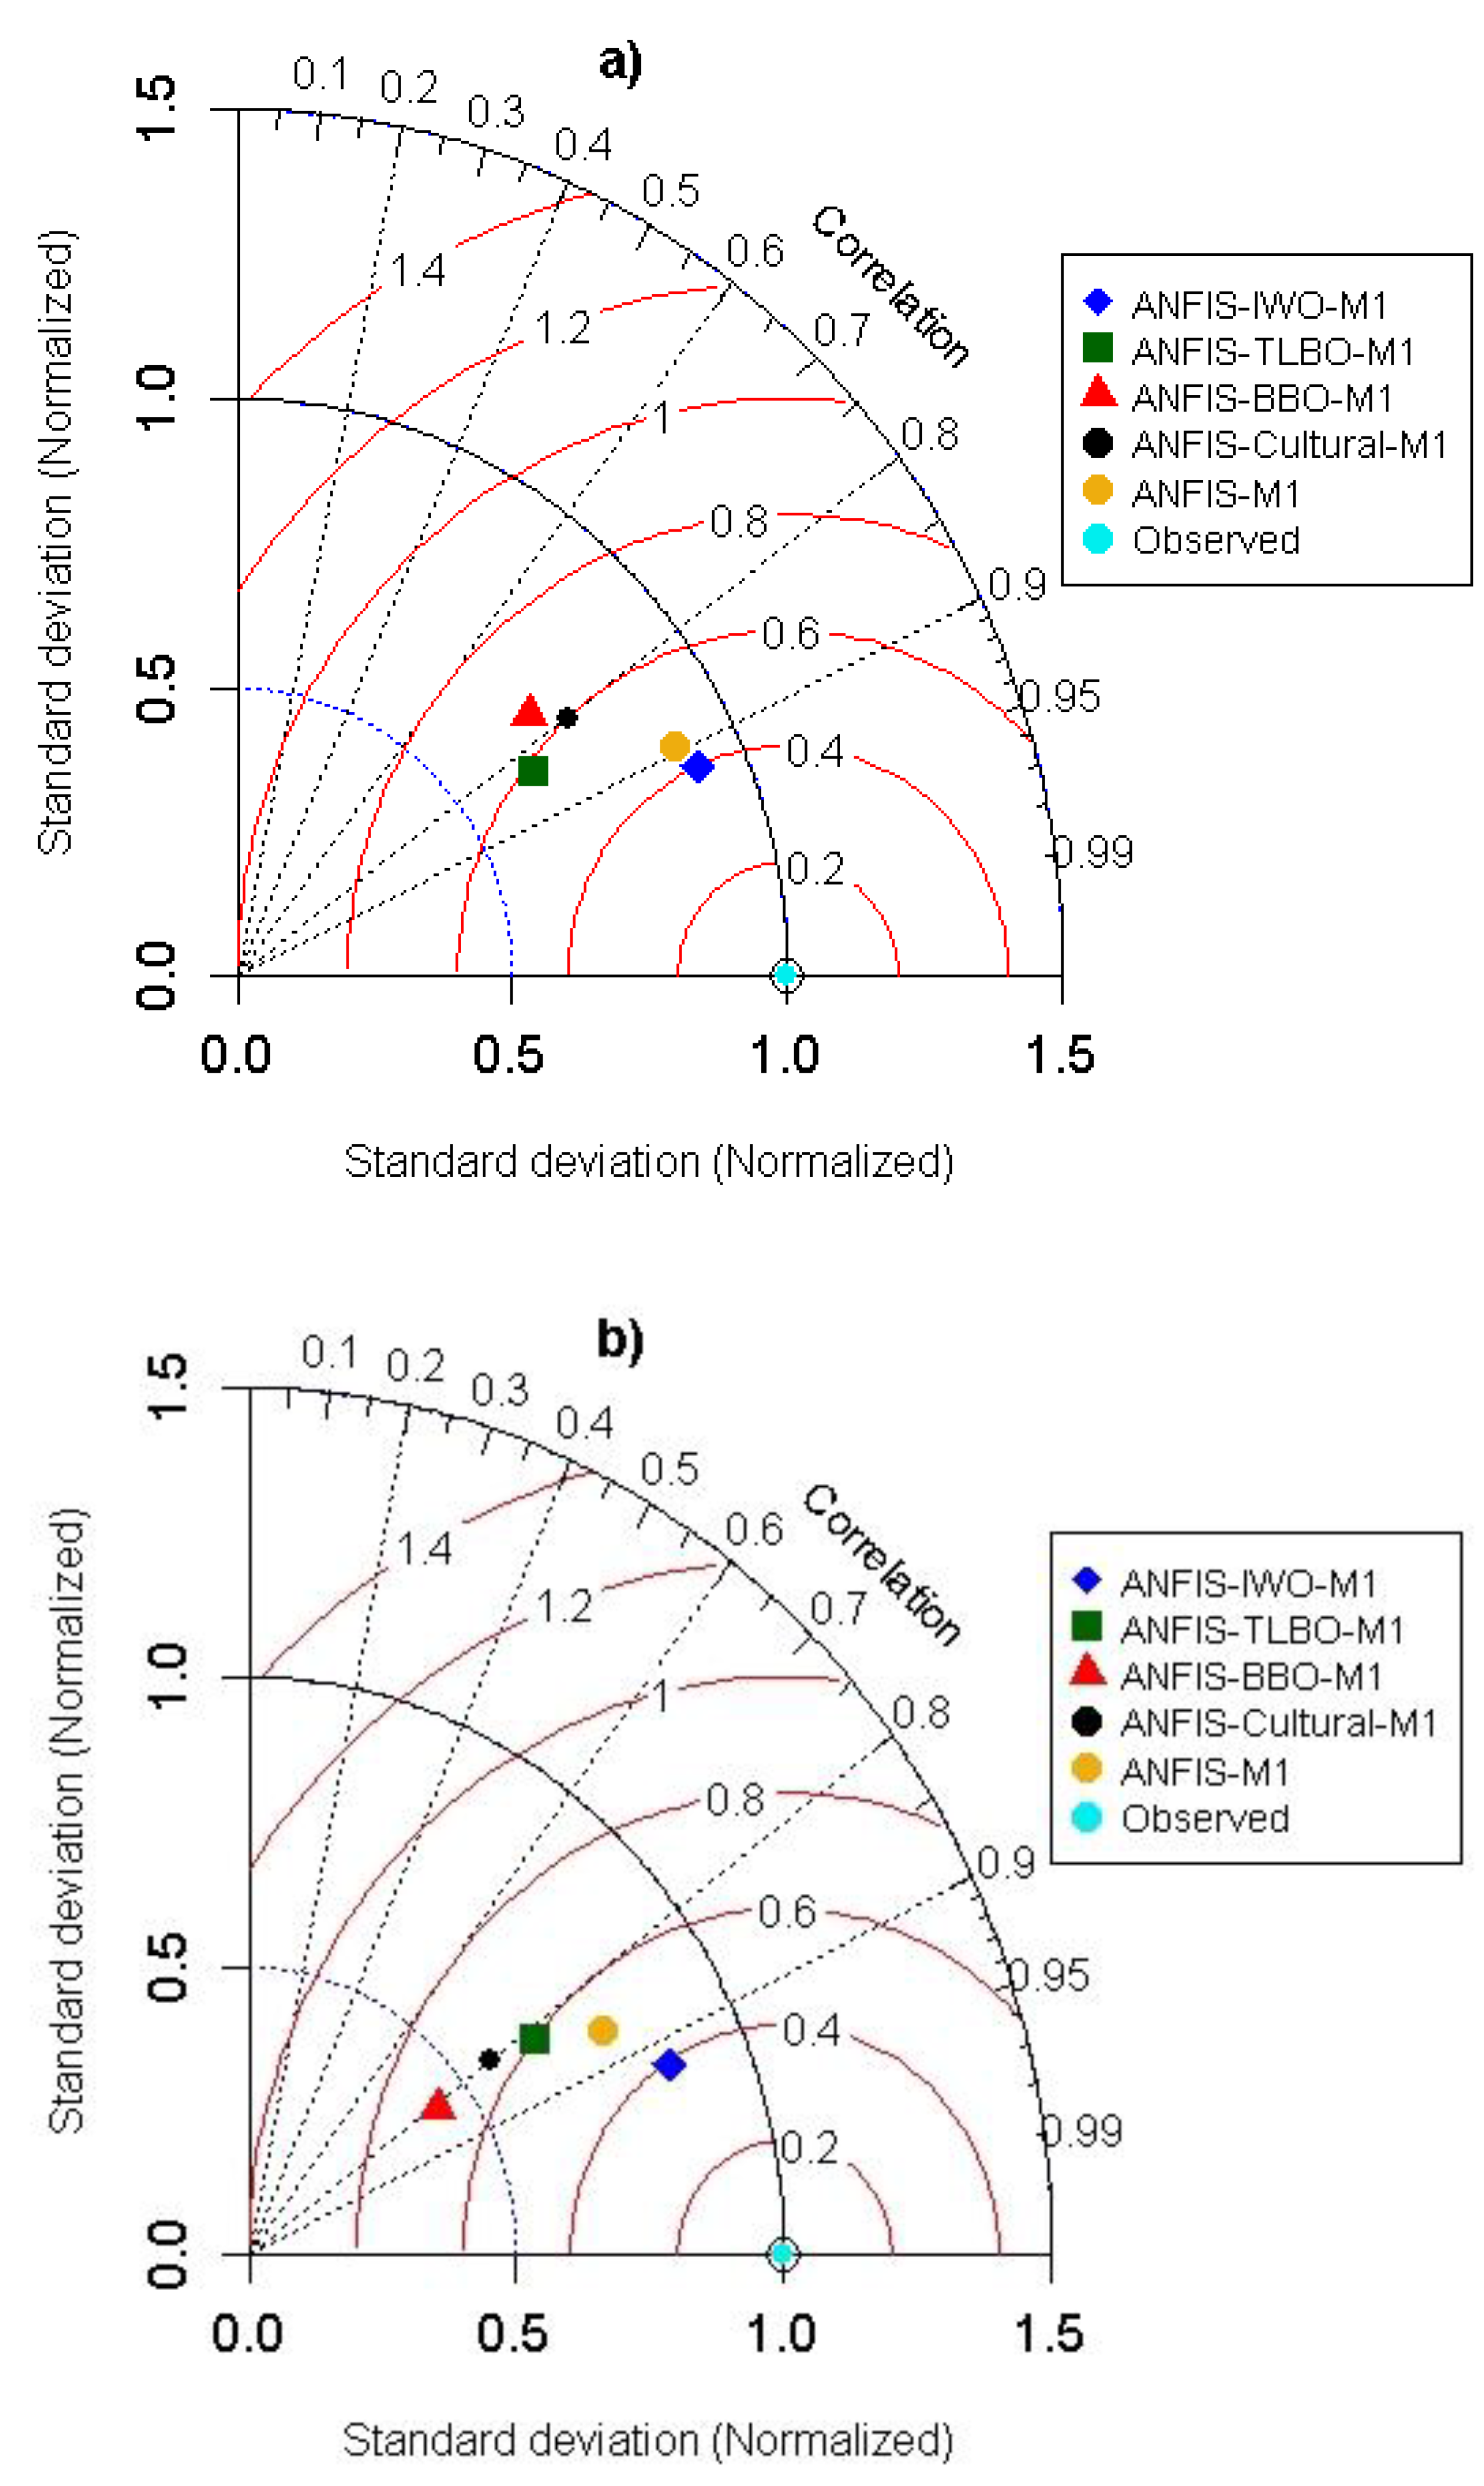
3. Results and Discussion

To achieve the best predictive model for estimation of maximum scour depth, some predictive models are proposed with different combinations of input variables. In this study, three parameters are considered to predict the d s h t value as follows:
d s h t = f ( d 50 h t , z h t , U 0 U C )
Table 2 shows the Pearson’s correlation between the d s h t as target variable and d 50 h t , z h t , U 0 U C as predictor parameters. From Table 2, it is evident that z h t provides the highest correlation (R = 0.55) with the target variable ( d s h t ) while U 0 U C offers the lowest.
Table 3 demonstrates the structure of input combinations proposed in the current study, where M1 consists of all three parameters ( d 50 h t , z h t , U 0 U C ) , M2 removes z h t from input variables and M3 uses only U 0 U C as the input variable.
Meanwhile, by considering five ANFIS algorithms and the three combinations, 15 different predictive scenarios are proposed to predict maximum scour depth. Table 4 demonstrates the outcome of the predictive model performance based on the R M S E ,   M A E ,   C C   and   W I criteria in the training and testing phases for the proposed models.
From Table 4, it is clear that the A N F I S I W O M1 ( M A E t e s t i n g = 0.108 ,   R M S E t e s t i n g = 0.148 ), which contains all of the input parameters, provides the highest performance prediction compared to other models. Moreover, A N F I S M1 ( M A E t e s t i n g = 0.133 ,   R M S E t e s t i n g = 0.192 ) shows very close competition with the best model and ranked as the second-best predictive model, while A N F I S M3 ( M A E t e s t i n g = 0.679 ,   R M S E t e s t i n g = 3.400 ) is selected as the worst model to predict the scouring depth.
Considering the aspect of input combination, the prediction accuracy of all five algorithms in both the training and testing phase shows a decreasing trend from M1 to M3. At the same time, the M1 exhibits absolute superiority over both training and testing phases. I W O algorithm with performance indices of ( M A E t e s t i n g = 0.108 ~ 0.239 ,   R M S E t e s t i n g = 0.148 ~ 0.400 ) demonstrates the highest performance for three combinations compared to other alternative optimization models. Besides, both training and testing outcomes show similar performance behavior.
For further comparison between the optimization model results, several graphical evaluation methods are utilized to investigate prediction performance between the observed and predicted values. The scatter plot, which measures the A N F I S models’ accuracy by visualizing the proximity of predicted and observed scour depth values and the corresponding linear correlation, is adopted in Figure 3.
Figure 3 indicates that all of the hybrid models provide the acceptable ranges of performance prediction in both training and testing phases, where the A N F I S I W O M1 model offers the highest correlation ( C C t r a i n i n g = 0.917 , C C t e s t i n g = 0.932 ). It can be noted that all the A N F I S algorithms, including standalone and hybrids, have an excellent capability in scour depth prediction, as demonstrated by the close proximity of a large portion of the prediction points to the best line.
As a statistical comparison method, a boxplot (Figure 4) shows the variability of observed and predicted scouring depth by measuring their 25%, 50%, 75% quartile values and the interquartile range ( I Q R ).
From Figure 4a, it can understood that A N F I S M1 and A N F I S C u l t u r a l M1 models ( I Q R = 0.18 ) are closer to the observed values ( I Q R = 0.24 ) in the training phase. Similar results are obtained in the testing phase (Figure 4b), where the A N F I S I W O M1 and A N F I S C u l t u r a l M1 ( I Q R = 0.16 ) exhibit very similar results to the interquartile range of the observed data ( I Q R = 0.26 ) .
As another comprehensive graphical presentation, a Taylor diagram is employed to make a further comparison between the observed and predictive values by using three statistical parameters, namely the CC (black dot lines), the RMSE (red contours) and the standard deviation (black contours) simultaneously (Figure 5).
The best model is the one which has less distance to the observed point, which is showed by the cyan circle. The results demonstrate that in both training and testing phase A N F I S I W O M1 is the closet point to the observed one which is an indicator of this model’s performance in the prediction of scouring depth. The outcome of this diagram also confirms the previous graphical methods results which nominated the A N F I S I W O M1 as a model with the highest accuracy.
Prediction using AI methods always come with some uncertainties, which their assessment and analyzing is a crucial matter and have significant impact on outcome results. In this study, two major types of uncertainty which include model structure and input variable are evaluated.
To measure the effectiveness of predictive model selection on forecasting the scouring depth, the M1 selected in the previous section is chosen as the reference combination. In the next step, five ANFIS algorithms predicted values in the nominated combination and are utilized to quantify the corresponding uncertainty. As for the uncertainty related to the selection of input parameters, A N F I S I W O was the best predictive model employed as the reference algorithm. Figure 6 illustrates the generated uncertainty band with the related observed values for both model structure and input variable in the testing phase.
From Figure 6, it can be understood that the uncertainty related to input parameter selection ( R f a c t o r = 1.72 ) has a higher impact on the outcome of scouring depth prediction than the model structure ( R f a c t o r = 1.15 ) .
To verify the prediction performance obtained in the present study, the results of the best metaheuristic algorithm result (ANFIS-IWO) is compared with those obtained by Guan et al. [1] through the empirical formulas presented in Equations (3) and (4). In this way, the error metrics obtained by those models are outlined in Table 5.
From Table 5, it is evident that the ANFIS-IWO offers the RMSE of 0.147 and MAE of 0.107, while the Guan et al. [1] formula attains the RMSE of 0.447 and MAE of 0.395. Hence, the ANFIS-IWO model enhances the RMSE and MAE indices by 67.1% and 72.9%, respectively.
To demonstrate the mathematical formulation of the best predictive model (ANFIS-IWO), its fuzzy if-then rules developed in prediction modeling of the scouring depth downstream of weirs and the validity range of each membership function are presented in the Supplementary Materials (Table S2 and Figure S1, respectively).
To make a trade-off between the complexity of the predictive model and accuracy obtained in prediction modeling, another version of the ANFIS-IWO with five rules (ANFIS-IWO-5r) is compared with that obtained by ten rules (ANFIS-IWO-10r) which is mentioned earlier as the best predictive model. The fuzzy if-then rules and validity ranges of the membership functions of the ANFIS-IWO-5r are presented in the Supplementary Materials (Table S3, and Figure S2, respectively). The results indicate that the ANFIS-IWO-5r provides the RMSE of 0.1557, MAE of 0.1, and CC of 0.829 in the training phase. Furthermore, this model offers the RMSE of 0.239, MAE of 0.144, and CC of 0.838 in the testing phase. In general, the performance prediction is reduced (RMSE: −51%, MAE: −27%, and CC: −9.7%) by decreasing the number of membership functions.
Although numerical, statistical, and artificial intelligence approaches have become more common in hydraulic engineering, open questions have remained about the influences of experimental conditions on obtained results. These approaches are restricted due to several simplifications in geometry properties, and hydraulic conditions which directly affect the flow conditions. Besides, most of these approaches use one- or two-dimensional flow properties which cause under or overestimation of results [64,65]. Therefore, a deeper understanding of these factors on generated results is required. Furthermore, prediction of scouring depth, as a hydraulic sciences problem, is limited by several uncertainties, in which the turbulent nature of water as a dynamic fluid seems to be the most crucial modelling problem. The imperfection of predictive models, ambiguous initial conditions and their important role in describing the phenomena, the unanticipated occurrence of external forces and many more issues are the other uncertainty sources. The existence of such limitations may result in negative impacts on prediction modeling.

4. Conclusions

In the current study, several algorithms consist of standalone ANFIS as well as four hybrid models, namely ANFIS-Cultural, ANFIS -BBO, ANFIS-IWO and ANFIS-TLBO are used to predict the maximum depth of scouring. Three input parameters consist of d 50 h t , z h t and U 0 U C , extracted from Veronese (1937), Falciai and Giacomin (1978) and D’agostino (1994) experimental studies are employed to established three corresponding combinations which are noted as M1 (all input parameters included), M2 (all input parameters without z h t ) and M3 (only U 0 U C as input parameters). Several statistical indices (namely M A E ,   R M S E ,   C C and W I ) along with graphical performance evaluators (namely scatterplot, heat map, Taylor diagram and boxplot) are utilized to measure the models’ prediction accuracy in both the training and testing phase.
Overall, prediction outcomes show the high prediction performance of the A N F I S I W O M1 model in both training ( R M S E = 0.111 ,   C C = 0.917 ) and testing ( R M S E = 0.147 ,   C C = 0.932 ) phases compared to other models. The A N F I S M1 results ( R M S E t e s t i n g = 0.192 ,   C C t e s t i n g = 0.883 ) correspond to the second rank of accuracy. The M1 input combination which involves all parameters is considered as the best combination, while M3 shows the poorest prediction performance. All graphical performance assessments also confirm the adequacy of A N F I S I W O M1 to predict the scouring depth downstream of weirs. Additionally, the uncertainty analysis shows that the selection of input parameters with R f a c t o r index of 1.72 has a higher impact on predicted results than choosing of the predictive model with R f a c t o r of 1.15. In conclusion, the proposed ANFIS model hybrid with I W O optimization algorithms demonstrates a strong predictive model to measure the maximum scour depth.
To conduct the further investigations for scouring depth downstream of weirs, the authors propose the following insights: (i) it is possible to compare the results of optimized ANFIS models with either classic AI algorithms such as Artificial Neural Networks and Support vector Machines or novel hybrid models. (ii) The other predictive variables such as geometric standard deviation of sediment grain size ( σ g ), Reynolds number ( R e ) and densimetric Froude number ( F r d ) can be included to predict the scouring depth downstream of weirs. (iii) The improvement of modelling strategy could be obtained using information theory to determine mostly correlated input variables. (iv) Assessing the scouring depth downstream of weirs in compound channels is more complicated than simple rectangular channels. The complexity is raised due to site-specific geometry, and hydraulic characteristics in compound channels. In future, similar studies can be conducted to estimate the scouring depth downstream of weirs in compound channels using artifice intelligence models.

Supplementary Materials

The following are available online at https://www.mdpi.com/2076-3417/10/11/3714/s1, Figure S1: The validity ranges of the ten membership functions of the predictive variables employed in the present study, (a) U 0 U C , (b) d 50 h t , and (c) z h t , Figure S2: The validity ranges of the five membership functions of the predictive variables employed in the present study, (a) U 0 U C , (b) d 50 h t , and (c) z h t , Table S1: Description of the dataset employed in the present study, Table S2: The fuzzy if-then rules obtained based on the ten membership functions, Table S3: The fuzzy if-then rules obtained based on the five membership functions.

Author Contributions

Z.M.Y., and A.S.; Data curation, Z.M.Y.; Formal analysis, S.B.H.S.A., M.H.; Investigation, Z.M.Y., M.H.; Methodology, A.S. and M.H., S.B.H.S.A.; Project administration, A.S.; Software, M.H., and S.B.H.S.A.; Supervision, N.A.-A.; Validation, N.A.-A., and N.K.T.; Visualization, Z.M.Y., and N.K.T., Writing—original draft, M.H., S.B.H.S.A.; Writing—review and editing, Z.M.Y., A.S., N.K.T. and N.A.-A. All authors have read and agreed to the published version of the manuscript.

Funding

This research received no external funding.

Conflicts of Interest

The authors declare no conflict of interest.

References

  1. Guan, D.; Melville, B.; Friedrich, H. Local scour at submerged weirs in sand-bed channels. J. Hydraul. Res. 2016, 54, 172–184. [Google Scholar] [CrossRef]
  2. Wang, L.; Melville, B.W.; Guan, D.; Whittaker, C.N. Local scour at downstream sloped submerged weirs. J. Hydraul. Eng. 2018, 144, 4018044. [Google Scholar] [CrossRef]
  3. Wang, L.; Melville, B.W.; Whittaker, C.N.; Guan, D. Effects of a downstream submerged weir on local scour at bridge piers. J. Hydro-Environ. Res. 2018, 20, 101–109. [Google Scholar] [CrossRef]
  4. Das, S.; Das, R.; Mazumdar, A. Circulation characteristics of horseshoe vortex in scour region around circular piers. Water Sci. Eng. 2013, 6, 59–77. [Google Scholar]
  5. Cheng, N.-S.; Wei, M. Scaling of Scour Depth at Bridge Pier Based on Characteristic Dimension of Large-Scale Vortex. Water 2019, 11, 2458. [Google Scholar] [CrossRef] [Green Version]
  6. Dey, S.; Raikar, R.V.; Roy, A. Scour at submerged cylindrical obstacles under steady flow. J. Hydraul. Eng. 2008, 134, 105–109. [Google Scholar] [CrossRef]
  7. Najafzadeh, M. Neuro-fuzzy GMDH based particle swarm optimization for prediction of scour depth at downstream of grade control structures. Eng. Sci. Technol. Int. J. 2015, 18, 42–51. [Google Scholar] [CrossRef] [Green Version]
  8. Roushangar, K.; Akhgar, S.; Erfan, A.; Shiri, J. Modeling scour depth downstream of grade-control structures using data driven and empirical approaches. J. Hydroinform. 2016. [Google Scholar] [CrossRef] [Green Version]
  9. Sharafati, A.; Tafarojnoruz, A.; Shourian, M.; Yaseen, Z.M. Simulation of the depth scouring downstream sluice gate: The validation of newly developed data-intelligent models. J. Hydro-Environ. Res. 2019. [Google Scholar] [CrossRef]
  10. Goel, A. Estimation of scour downstream of spillways using SVM modeling. In Proceedings of the World Congress on Engineering and Computer Science WCECS, San Francisco, CA, USA, 22–24 October 2008; pp. 22–24. [Google Scholar]
  11. Goel, A.; Pal, M. Application of support vector machines in scour prediction on grade-control structures. Eng. Appl. Artif. Intell. 2009. [Google Scholar] [CrossRef]
  12. Azamathulla, H.M. Gene expression programming for prediction of scour depth downstream of sills. J. Hydrol. 2012. [Google Scholar] [CrossRef]
  13. Bormann, N.E.; Julien, P.Y. Scour downstream of grade-control structures. J. Hydraul. Eng. 1991, 117, 579–594. [Google Scholar] [CrossRef] [Green Version]
  14. Chinnarasri, C.; Kositgittiwong, D. Laboratory study of maximum scour depth downstream of sills. In Proceedings of the Institution of Civil Engineers-Water Management; Thomas Telford Ltd.: London, UK, 2008; Volume 161, pp. 267–275. Available online: https://www.icevirtuallibrary.com/doi/abs/10.1680/wama.2008.161.5.267 (accessed on 5 April 2020).
  15. D’agostino, V. Indagine sullo scavo a valle di opere trasversali mediante modello fisico a fondo mobile. L’Energia Elettr. 1994, 71, 37–51. [Google Scholar]
  16. Marion, A.; Lenzi, M.A.; Comiti, F. Effect of sill spacing and sediment size grading on scouring at grade-control structures. Earth Surf. Process. Landforms J. Br. Geomorphol. Res. Gr. 2004, 29, 983–993. [Google Scholar] [CrossRef]
  17. Mossa, M. Experimental study on the scour downstream of grade-control structures. In Proceedings of the 26th Convegni di Idraulica e Costruzioni, Idrauliche, Catania, 9–12 September 1998; pp. 581–594. [Google Scholar]
  18. Sattar, A.M.A.; Plesiński, K.; Radecki-Pawlik, A.; Gharabaghi, B. Scour depth model for grade-control structures. J. Hydroinform. 2017. [Google Scholar] [CrossRef]
  19. Tafarojnoruz, A. Discussion of “Genetic programming to predict bridge pier scour”. J. Hydraul. Eng. 2012, 138, 669–671. [Google Scholar] [CrossRef]
  20. Parsaie, A.; Haghiabi, A.H.; Moradinejad, A. Prediction of Scour Depth below River Pipeline using Support Vector Machine. KSCE J. Civ. Eng. 2019. [Google Scholar] [CrossRef]
  21. Najafzadeh, M.; Tafarojnoruz, A.; Lim, S.Y. Prediction of local scour depth downstream of sluice gates using data-driven models. ISH J. Hydraul. Eng. 2017, 23, 195–202. [Google Scholar] [CrossRef]
  22. Sharafati, A.; Haghbin, M.; Motta, D.; Yaseen, Z.M. The Application of Soft Computing Models and Empirical Formulations for Hydraulic Structure Scouring Depth Simulation: A Comprehensive Review, Assessment and Possible Future Research Direction. Arch. Comput. Methods Eng. 2019, 1–25. [Google Scholar] [CrossRef]
  23. Gholami, A.; Bonakdari, H.; Zaji, A.H.; Michelson, D.G.; Akhtari, A.A. Improving the performance of multi-layer perceptron and radial basis function models with a decision tree model to predict flow variables in a sharp 90 bend. Appl. Soft Comput. 2016, 48, 563–583. [Google Scholar] [CrossRef]
  24. Azmathullah, H.M.; Deo, M.C.; Deolalikar, P.B. Estimation of scour below spillways using neural networks. J. Hydraul. Res. 2006. [Google Scholar] [CrossRef]
  25. Azamathulla, H.M.; Ab Ghani, A.; Azazi Zakaria, N. Prediction of scour below flip bucket using soft computing techniques. In Proceedings of the AIP Conference Proceedings, Portland, OR, USA, 21–22 July 2010. [Google Scholar]
  26. Abdulelah Al-Sudani, Z.; Salih, S.Q.; Sharafati, A.; Yaseen, Z.M. Development of multivariate adaptive regression spline integrated with differential evolution model for streamflow simulation. J. Hydrol. 2019, 573, 1–12. [Google Scholar] [CrossRef]
  27. Guven, A.; Azamathulla, H.M. Gene-expression programming for flip-bucket spillway scour. Water Sci. Technol. 2012. [Google Scholar] [CrossRef] [PubMed]
  28. Guven, A.; Gunal, M. Genetic Programming Approach for Prediction of Local Scour Downstream of Hydraulic Structures. J. Irrig. Drain. Eng. 2008. [Google Scholar] [CrossRef]
  29. Azamathulla, H.; Ghani, A.; Zakaria, N.A.; Lai, S.H.; Chang, C.K.; Leow, C.S.; Abuhasan, Z. Genetic programming to predict ski-jump bucket spill-way scour. J. Hydrodyn. 2008. [Google Scholar] [CrossRef]
  30. Goyal, M.K.; Ojha, C.S.P. Estimation of scour downstream of a ski-jump bucket using support vector and M5 model tree. Water Resour. Manag. 2011, 25, 2177–2195. [Google Scholar] [CrossRef]
  31. Zakaria, N.A.; Ghani, A.A.; Azamathulla, H.M. ANFIS-based approach to predicting scour location of spillway. Proc. ICE Water Manag. 2009. [Google Scholar] [CrossRef] [Green Version]
  32. Muzzammil, M.; Alam, J. Scour prediction at the control structures using adaptive neuro-fuzzy inference system. Water Energy Int. 2016, 59, 44–52. [Google Scholar]
  33. Azamathulla, H.M. Neural Networks to Estimate Scour Downstream of Ski-Jump Bucket Spillway. Ph.D. Thesis, Indian Institutes of Technology, Delhi, India, 2005. [Google Scholar]
  34. Rashki Ghaleh Nou, M.; Azhdary Moghaddam, M.; Shafai Bajestan, M.; Azamathulla, H.M. Estimation of scour depth around submerged weirs using self-adaptive extreme learning machine. J. Hydroinform. 2019, 21, 1082–1101. [Google Scholar] [CrossRef]
  35. Riahi-Madvar, H.; Dehghani, M.; Seifi, A.; Salwana, E.; Shamshirband, S.; Mosavi, A.; Chau, K. Comparative analysis of soft computing techniques RBF, MLP, and ANFIS with MLR and MNLR for predicting grade-control scour hole geometry. Eng. Appl. Comput. Fluid Mech. 2019, 13, 529–550. [Google Scholar] [CrossRef] [Green Version]
  36. Abdollahpour, M.; Dalir, A.H.; Farsadizadeh, D.; Shiri, J. Assessing heuristic models through k-fold testing approach for estimating scour characteristics in environmental friendly structures. ISH J. Hydraul. Eng. 2019, 25, 239–247. [Google Scholar] [CrossRef]
  37. Grosan, C.; Abraham, A. Hybrid evolutionary algorithms: Methodologies, architectures, and reviews. In Hybrid Evolutionary Algorithms; Springer: Berlin/Heidelberg, Germany, 2007; pp. 1–17. [Google Scholar]
  38. Jang, J.-S. ANFIS: Adaptive-network-based fuzzy inference system. IEEE Trans. Syst. Man. Cybern. 1993, 23, 665–685. [Google Scholar] [CrossRef]
  39. Najafzadeh, M.; Etemad-Shahidi, A.; Lim, S.Y. Scour prediction in long contractions using ANFIS and SVM. Ocean Eng. 2016. [Google Scholar] [CrossRef]
  40. Bateni, S.M.; Jeng, D.-S. Estimation of pile group scour using adaptive neuro-fuzzy approach. Ocean Eng. 2007. [Google Scholar] [CrossRef]
  41. Firat, M. Scour depth prediction at bridge piers by Anfis approach. Proc. ICE Water Manag. 2009. [Google Scholar] [CrossRef]
  42. Khan, N.; Shahid, S.; Ismail, T.B.; Wang, X.J. Spatial distribution of unidirectional trends in temperature and temperature extremes in Pakistan. Theor. Appl. Climatol. 2018, 1–15. [Google Scholar] [CrossRef]
  43. Karbasi, M.; Azamathulla, H.M. Prediction of scour caused by 2D horizontal jets using soft computing techniques. Ain Shams Eng. J. 2017. [Google Scholar] [CrossRef] [Green Version]
  44. Najafzadeh, M.; Saberi-Movahed, F.; Sarkamaryan, S. NF-GMDH-Based self-organized systems to predict bridge pier scour depth under debris flow effects. Mar. Georesour. Geotechnol. 2018. [Google Scholar] [CrossRef]
  45. Guven, A. A multi-output descriptive neural network for estimation of scour geometry downstream from hydraulic structures. Adv. Eng. Softw. 2011. [Google Scholar] [CrossRef]
  46. Onen, F. Prediction of Scour at a Side-Weir with GEP, ANN and Regression Models. Arab. J. Sci. Eng. 2014. [Google Scholar] [CrossRef]
  47. Veronese, A. Erosion of a Bed Downstream from an Outlet; Colorado A & M College: Fort Collins, CO, USA, 1937. [Google Scholar]
  48. D’Agostino, V.; Ferro, V. Scour on alluvial bed downstream of grade-control structures. J. Hydraul. Eng. 2004, 130, 24–37. [Google Scholar] [CrossRef]
  49. Falciai, M.; Giacomin, A. Indagine sui gorghi che si formano a valle delle traverse torrentizie. Ital. For. Mont. 1978, 23, 111–123. [Google Scholar]
  50. Bateni, S.M.; Borghei, S.M.; Jeng, D.S. Neural network and neuro-fuzzy assessments for scour depth around bridge piers. Eng. Appl. Artif. Intell. 2007. [Google Scholar] [CrossRef]
  51. Simon, D. Biogeography-based optimization. IEEE Trans. Evol. Comput. 2008, 12, 702–713. [Google Scholar] [CrossRef] [Green Version]
  52. Reynolds, R.G.; Chung, C. A self-adaptive approach to representation shifts in cultural algorithms. In Proceedings of the IEEE International Conference on Evolutionary Computation, Nagoya, Japan, 20–22 May 1996; pp. 94–99. [Google Scholar]
  53. Mehrabian, A.R.; Lucas, C. A novel numerical optimization algorithm inspired from weed colonization. Ecol. Inform. 2006, 1, 355–366. [Google Scholar] [CrossRef]
  54. Rao, R.V.; Savsani, V.J.; Vakharia, D.P. Teaching–learning-based optimization: A novel method for constrained mechanical design optimization problems. Comput. Des. 2011, 43, 303–315. [Google Scholar] [CrossRef]
  55. Salih, S.Q.; Sharafati, A.; Ebtehaj, I.; Sanikhani, H.; Siddique, R.; Deo, R.C.; Bonakdari, H.; Shahid, S.; Yaseen, Z.M. Integrative stochastic model standardization with genetic algorithm for rainfall pattern forecasting in tropical and semi-arid environments. Hydrol. Sci. J. 2020, 65, 1145–1157. [Google Scholar] [CrossRef]
  56. Malik, A.; Kumar, A.; Kim, S.; Kashani, M.H.; Karimi, V.; Sharafati, A.; Ghorbani, M.A.; Al-Ansari, N.; Salih, S.Q.; Yaseen, Z.M. Modeling monthly pan evaporation process over the Indian central Himalayas: Application of multiple learning artificial intelligence model. Eng. Appl. Comput. Fluid Mech. 2020, 14, 323–338. [Google Scholar] [CrossRef] [Green Version]
  57. Mohammed, M.; Sharafati, A.; Al-Ansari, N.; Yaseen, Z.M. Shallow Foundation Settlement Quantification: Application of Hybridized Adaptive Neuro-Fuzzy Inference System Model. Adv. Civ. Eng. 2020, 2020, 7381617. [Google Scholar] [CrossRef] [Green Version]
  58. Salih, S.Q.; Sharafati, A.; Khosravi, K.; Faris, H.; Kisi, O.; Tao, H.; Ali, M.; Yaseen, Z.M. River suspended sediment load prediction based on river discharge information: Application of newly developed data mining models. Hydrol. Sci. J. 2019. [Google Scholar] [CrossRef]
  59. Hai, T.; Sharafati, A.; Mohammed, A.; Salih, S.Q.; Deo, R.C.; Al-Ansari, N.; Yaseen, Z.M. Global solar radiation estimation and climatic variability analysis using extreme learning machine based predictive model. IEEE Access 2020, 8, 12026–12042. [Google Scholar] [CrossRef]
  60. Sharafati, A.; Tafarojnoruz, A.; Yaseen, Z.M. New stochastic modeling strategy on the prediction enhancement of pier scour depth in cohesive bed materials. J. Hydroinform. 2020. [Google Scholar] [CrossRef]
  61. Sharafati, A.; Asadollah, S.B.H.S.; Hosseinzadeh, M. The potential of new ensemble machine learning models for effluent quality parameters prediction and related uncertainty. Process Saf. Environ. Prot. 2020, 140, 68–78. [Google Scholar] [CrossRef]
  62. Sharafati, A.; Azamathulla, H.M. Assessment of Dam Overtopping Reliability using SUFI Based Overtopping Threshold Curve. Water Resour. Manag. 2018, 32, 2369–2383. [Google Scholar] [CrossRef]
  63. Sharafati, A.; Yasa, R.; Azamathulla, H.M. Assessment of Stochastic Approaches in Prediction of Wave-Induced Pipeline Scour Depth. J. Pipeline Syst. Eng. Pract. 2018, 9, 4018024. [Google Scholar] [CrossRef]
  64. Toombes, L.; Chanson, H. Numerical limitations of hydraulic models. In Proceedings of the 34th World Congress of the International Association for Hydro-Environment Research and Engineering: 33rd Hydrology and Water Resources Symposium and 10th Conference on Hydraulics in Water Engineering; Engineers Australia, Brisbane, Australia, 26 June–1 July 2011; p. 2322. [Google Scholar]
  65. Heller, V. Scale effects in physical hydraulic engineering models. J. Hydraul. Res. 2011, 49, 293–306. [Google Scholar] [CrossRef]
Figure 1. Sketch of the scouring process downstream of a weir.
Applsci 10 03714 g001
Figure 2. The hybridization procedure for providing an optimistic adaptive neural fuzzy inference systems (ANFIS) model.
Applsci 10 03714 g002
Figure 3. Scatter plots of the predicted values of scour depths against the observed ones: (a) training phase, (b) testing phase.
Applsci 10 03714 g003
Figure 4. Boxplots of the predicted against observed scouring depth: (a) training phase, (b) testing phase.
Applsci 10 03714 g004
Figure 5. Normalized Taylor diagrams of predicted and observed scour depths values: (a) training phase, (b) testing phase. The iso-correlation, iso-RMSE, and iso-normalized standard deviation lines, respectively, are the black-dotted, red-solid, and black-solid contours.
Applsci 10 03714 g005
Figure 6. Generated prediction uncertainty band against observed values of scouring depth over testing phase based on (a) model structure and (b) input variables.
Applsci 10 03714 g006
Table 1. Range of the target and input variables employed in the present study.
ParametersTraining PhaseTesting Phase
U 0 U C 0.0069–0.91970.0108–0.866
d 50 h t 0.0096–0.3620.00945–0.226
z h t 0.179–20.280.1613–11.344
d s h t 0.271–2.4440.1359–2.222
Table 2. Pearson correlation between the predictive variables and scouring depth downstream of weirs.
Parameters U 0 U C d 50 h t z h t d s h t
U 0 U C 1
d 50 h t −0.36041
z h t −0.48910.72181
d s h t −0.05320.38100.55511
Table 3. Input parameters combination for prediction of scouring depth downstream of weirs.
Input CombinationNon-Dimensional Variables
d 50 h t U 0 U C z h t
M1
M2-
M3--
Table 4. The performance indices obtained through different predictive models for predicting the scouring depth downstream of weirs.
NoPredictive ModelInput CombinationPhaseMAERMSECCWI
Model 1ANFIS-M1All parametersTraining0.0920.1240.8950.942
Testing0.1330.1920.8830.916
Model 2ANFIS-CULTURAL-M1All parametersTraining0.1000.1660.8030.873
Testing0.1510.2600.8160.800
Model 3ANFIS-BBO-M1All parametersTraining0.1250.1820.7610.836
Testing0.1670.2760.8290.735
Model 4ANFIS-IWO-M1All parametersTraining0.080.1110.9160.954
Testing0.1080.1480.9320.955
Model 5ANFIS-TLBO-M1All parametersTraining0.1200.1640.8310.863
Testing0.1530.2260.8460.866
Model 6ANFIS-M2Without z h t Training0.1640.2340.5430.628
Testing0.2190.3530.4220.452
Model 7ANFIS-CULTURAL-M2Without z h t Training0.1610.2400.5070.622
Testing0.2130.3660.3340.389
Model 8ANFIS-BBO-M2Without z h t Training0.1780.2530.4140.507
Testing0.2260.3660.3550.365
Model 9ANFIS-IWO-M2Without z h t Training0.1440.2100.6560. 760
Testing0.2020.3400.4820.573
Model 10ANFIS-TLBO-M2Without z h t Training0.1380.2280.5740.681
Testing0.2260.3790.2510.379
Model 11ANFIS-M3Only U 0 U C Training0.1530.2080.6650.775
Testing0.6793.4000.1060.052
Model 12ANFIS-CULTURAL-M3Only U 0 U C Training0.1790.2720.2140.242
Testing0.2360.3940.0020.226
Model 13ANFIS-BBO-M3Only U 0 U C Training0.1800.2780.0780.023
Testing0.2340.3920.0000.214
Model 14ANFIS-IWO-M3Only U 0 U C Training0.1620.2290.5980.625
Testing0.2390.4000.0260.260
Model 15ANFIS-TLBO-M3Only U 0 U C Training0.1710.2620.3430.408
Testing0.2460.4110.0000.225
Table 5. Comparison between the prediction performance achieved by the best predictive model in the present study and empirical formulas proposed by Guan et al. [1].
TechniqueRMSEMAE
ANFIS-IWO (testing phase)0.147550.107
Guan et al. (2016).0.44650.3951

