A Reliable Automated Sampling System for On-Line and Real-Time Monitoring of CHO Cultures


1
Research Area Biochemical Engineering, Institute of Chemical, Environmental and Biological Engineering, Vienna University of Technology, Gumpendorferstrasse 1a-166/4, 1060 Vienna, Austria
2
CD Laboratory on Mechanistic and Physiological Methods for Improved Bioprocesses, Vienna University of Technology, Gumpendorferstrasse 1a-166/4, 1060 Vienna, Austria
3
Securecell AG, In der Luberzen 29, 8902 Urdorf, Switzerland
*
Author to whom correspondence should be addressed.
Processes 2020, 8(6), 637; https://doi.org/10.3390/pr8060637
Submission received: 30 April 2020
/
Revised: 22 May 2020
/
Accepted: 23 May 2020
/
Published: 27 May 2020
(This article belongs to the Special Issue Measurement Technologies for up- and Downstream Bioprocessing)
Abstract
:Timely monitoring and control of critical process parameters and product attributes are still the basic tasks in bioprocess development. The current trend of automation and digitization in bioprocess technology targets an improvement of these tasks by reducing human error and increasing through-put. The gaps in such automation procedures are still the sampling procedure, sample preparation, sample transfer to analyzers, and the alignment of process and sample data. In this study, an automated sampling system and the respective data management software were evaluated for system performance; applicability with HPLC for measurement of vitamins, product and amino acids; and applicability with a biochemical analyzer. The focus was especially directed towards the adaptation and assessment of an appropriate amino acid method, as these substances are critical in cell culture processes. Application of automated sampling in a CHO fed-batch revealed its potential with regard to data evaluation. The higher sampling frequency compared to manual sampling increases the generated information content, which allows easier interpretation of the metabolism, extraction of e.g., ks values, application of smoothing algorithms, and more accurate detection of process events. A comparison with sensor technology shows the advantages and disadvantages in terms of measurement errors and measurement frequency.
1. Introduction
The performance of even complex bioprocesses depends on their control. Often, the bottleneck is how and if relevant process variables can be monitored. In red biotechnology, for example, complex expression systems such as Chinese hamster ovary (CHO) cells are widely used for the production of biopharmaceuticals. These processes are very sensitive to small variations caused by known and unknown disturbances such as raw material, process, and biological variances. In order to ensure acceptable reliable process performance, powerful monitoring is the key [1]. Regarding mammalian cell culture processes, a variety of substances such as glucose (as the main C-source), amino acids, fatty acids, product (mAb), and metabolites are involved. Each one of them could affect process performance by limiting or inhibiting effects. In addition, the often very low concentration of the analytes may be a challenge or even an exclusion criterion for established monitoring technologies [2]. This results in a huge complexity during process development, scale up, and production. To overcome such limitations, monitoring strategies based on automated sampling seem promising [3]. For the realization of timely measurements, a combination of automated sampling, sample processing, and sample analysis is required [4]. Such a monitoring system must be robust (processing of on-line and off-line samples), accurate, flexible, and easy to use. The acquired data should lead to the possibility for improvement, resulting in an increase of process robustness.
In order to fulfill these requirements, a system for automated sampling as well as the analytical methodology are crucial. Common ways for automated sampling include a membrane immersion nozzle, which is prone to membrane fouling and protein adsorption [5,6,7]. A reliable system must take a culture broth sample and process it in the reactor environment. This can also facilitate the flexibility of analyzing the culture broth itself or the supernatant. The analytical method chosen should best be the reference method, which is normally bound to the analytical stream and can just be applied off-line. High performance liquid chromatography (HPLC) is a common reference analyzer used for the analysis of substrates, metabolites, and product or product quality attributes. Consequently, it also delivers a high amount of flexibility.
In terms of Process Analytical Technology (PAT), critical process parameters (CPP) must be monitored and controlled [8]. In CHO processes, important parameters for process performance are often amino acids [9,10,11]. Investigation of the amino acid profile during cultivation is essential to establish an efficient feeding strategy. The limiting amino acids differ from process to process. If assessed at all, state-of-the-art is off-line HPLC analysis using sample derivatization, which is often performed manually. On-line availability of these data would allow faster generation of process understanding to establish feeding and control strategies and finally reduce time-to-market.
With the evaluation of a system for automated sampling and sample processing, we want to close the gap between reference analytics and the process stream to enable process monitoring in terms of PAT. The system was evaluated by a CHO process, applying on-line HPLC and a biochemical analyzer for analysis of substrates, metabolites, and products.
The following four points sum up the investigated challenges of the sample-based monitoring system:
- Quantification of the automated liquid handling and analysis
- Optimization and adaptation of an HPLC method for amino acid measurement
- Application on a mammalian cell culture fed batch
- Comparison to other real-time monitoring systems
2. Materials and Methods
2.1. Chemicals and Reagents
All chemicals and substances were of analytical grade and purchased from either Carl Roth (Karlsruhe, Germany) or Sigma Aldrich (St. Louis, MO, USA). For analytical methods, ultra-pure water was used, derived from a Milli-Q system from Merck Millipore (Billerica, MA, USA).
2.2. HPLC Methods
Vitamins were analyzed according to Hofer et al. [12].
The chromatographic separation as well as the principle for sample derivatization of amino acids were performed as described in Hofer et al. [13]. In order to facilitate automated on-line analysis, a fraction collector autosampler was used. Hence, the derivatization protocol had to be implemented for in-well derivatization by user defined programming (UDP). In order to reach reliable results, some parameters were evaluated as described in Section 3.1.
IgG was analyzed with a protein A cartridge (Applied Biosystems, Bedford, MA, USA) and detected at 210 nm.
2.3. Biochemical Methods
Glucose, lactate, ammonium, IgG and glutamine were analyzed by the biochemical analyzer Cedex® Bio HT (Roche Diagnostics, Mannheim, Germany).
2.4. Set-Up
The set-up consists of a 3.6 L bioreactor (Labfors 5, Infors HT, Bottmingen, Switzerland) equipped with a pH and a pO2 (Hamilton, Reno, NV, USA) probe, an off-gas sensor (BlueInOne, BlueSens gas sensor GmbH, Herten, Germany), six scales, and three additional peristaltic pumps. One port is occupied by an immersion nozzle, which is directly connected to the multiplexer module (MUX) of the automated sampling system Numera (Securecell AG, Urdorf, Switzerland). The automated sampler is a modular system that was equipped with the MUX, a dilution module (SDU), a filtration module (TFU), a routing module (SRU), a control panel (CPU), and an autosampler (ASX). The implemented SRU allows various combinations of sample processing, i.e., dilution and filtration. The Numera was connected to two analyzers, namely an HPLC and a Cedex® Bio HT (Roche Diagnostics, Mannheim, Germany) (Figure 1). The Ultimate 3000 HPLC (Thermo Fisher Scientific, Waltham, MA, USA) was equipped with a pump (LPG-3400SD), an autosampler (WPS-3000FC), a column compartment (TCC-3000SD), a diode array detector (DAD-3000), and a fluorescence detector (FLD-3400RS). The connection between the Numera and the HPLC depends on the methods applied at the HPLC. For methods that require a simple direct injection of the particle free sample, the tubings of the pump and column compartment are directly connected with the injection valve of the ASX. The HPLC autosampler is not used in that case. If the method requires some preprocessing of the particle free samples, the valve of the ASX is linked with the fraction collector valve of the HPLC autosampler. This way, the sample can be transported into deep well-plates in the HPLC autosampler and sample processing can be performed there in the same way as with off-line samples. The Cedex® Bio HT is connected via a liquid path between the SRU module and a fixed cuvette in one of the sample racks.
2.5. The Automated Sampling System
The sterility of the bioprocess was maintained as follows: the immersion nozzle coupled to a sampling line was connected to the bioreactor and sterilized by autoclavation with the bioreactor. After autoclavation, the sampling line is inserted in a pinch valve at the multiplexer module and connected to the module. The pinch valve opens only when the sample is drawn, preventing unsterile liquid to cross the sterile barrier (i.e., the pinch valve). The Numera system supports different sampling procedures. In this study, one sampling procedure was performed and the sample was then transferred to two different analyzers, namely HPLC and Bio HT (Figure 2). The inner diameter of the immersion nozzle of 0.8 mm, the ability of the MUX to backflush excessive sample with sterile air, and the proximity of reactor to Numera ensure minimal sampling volume.
2.6. Software and Data Management
The combination of three software programs was applied for the set-up: (i) Chromeleon 7.2.7 (Thermo Fisher Scientific, USA) to control the HPLC and to quantify the peak areas (ii) the Cedex® BioHT Analyzer Application Software Version 5.0.0.1206 (Roche Diagnostics, Germany) to control the Bio HT, and (iii) the Process Information Management System Lucullus PIMS (Securecell AG, Switzerland). In order to facilitate the handling of the set-up, the overall control was applied via Lucullus PIMS. All devices attached to the process were connected to Lucullus PIMS, including probes, scales, and pumps as well as the Numera and both analyzers. Hence, automated sampling and sample analysis were triggered via Lucullus PIMS (Figure 3). An analytical trigger initiated the measurements by automatically starting the respective control software for HPLC and Bio HT. Overall, Lucullus was applied for data recording, data sorting and control.
2.7. Cultivations
CHO cultivations were performed using the set-up described above. The system was supplied with air, O2, CO2 and N2 to control dissolved O2 at 40.0% and CO2 at 12.5%, respectively. The pH was controlled at 7.00 with acid and base, and temperature was controlled at 37 °C. In fed-batch mode, three closed-loop feeds were applied. Automated sampling and analysis were applied every 2 or 3 h. Manual sampling was performed every 12 h.
2.8. Technical Run
Sterility was evaluated by a technical bioreactor run after simulation in Matlab® 2017a. The bioreactor was filled with a complex medium and the main process parameters were controlled and set as usual in a CHO process, i.e., pH 7.00, temperature of 37 °C and pO2 of 40%. After 60 h, a water feed was started, followed by a glucose feed after 120 h. Automated sampling was performed every 6 h and manual sampling every 24 h. The experiment was aborted after 370 h of sterile run time. Sterility was evaluated by microscopic analysis as well as by process parameters such as oxygen inflow.
3. Results
3.1. System Performance
The sample handling of the system was evaluated in experiments without cells testing for system sterility, accuracy, and precision. Microscopic analysis as well as an unchanged pO2 and oxygen inflow demonstrated sterility over the complete run of 370 h.
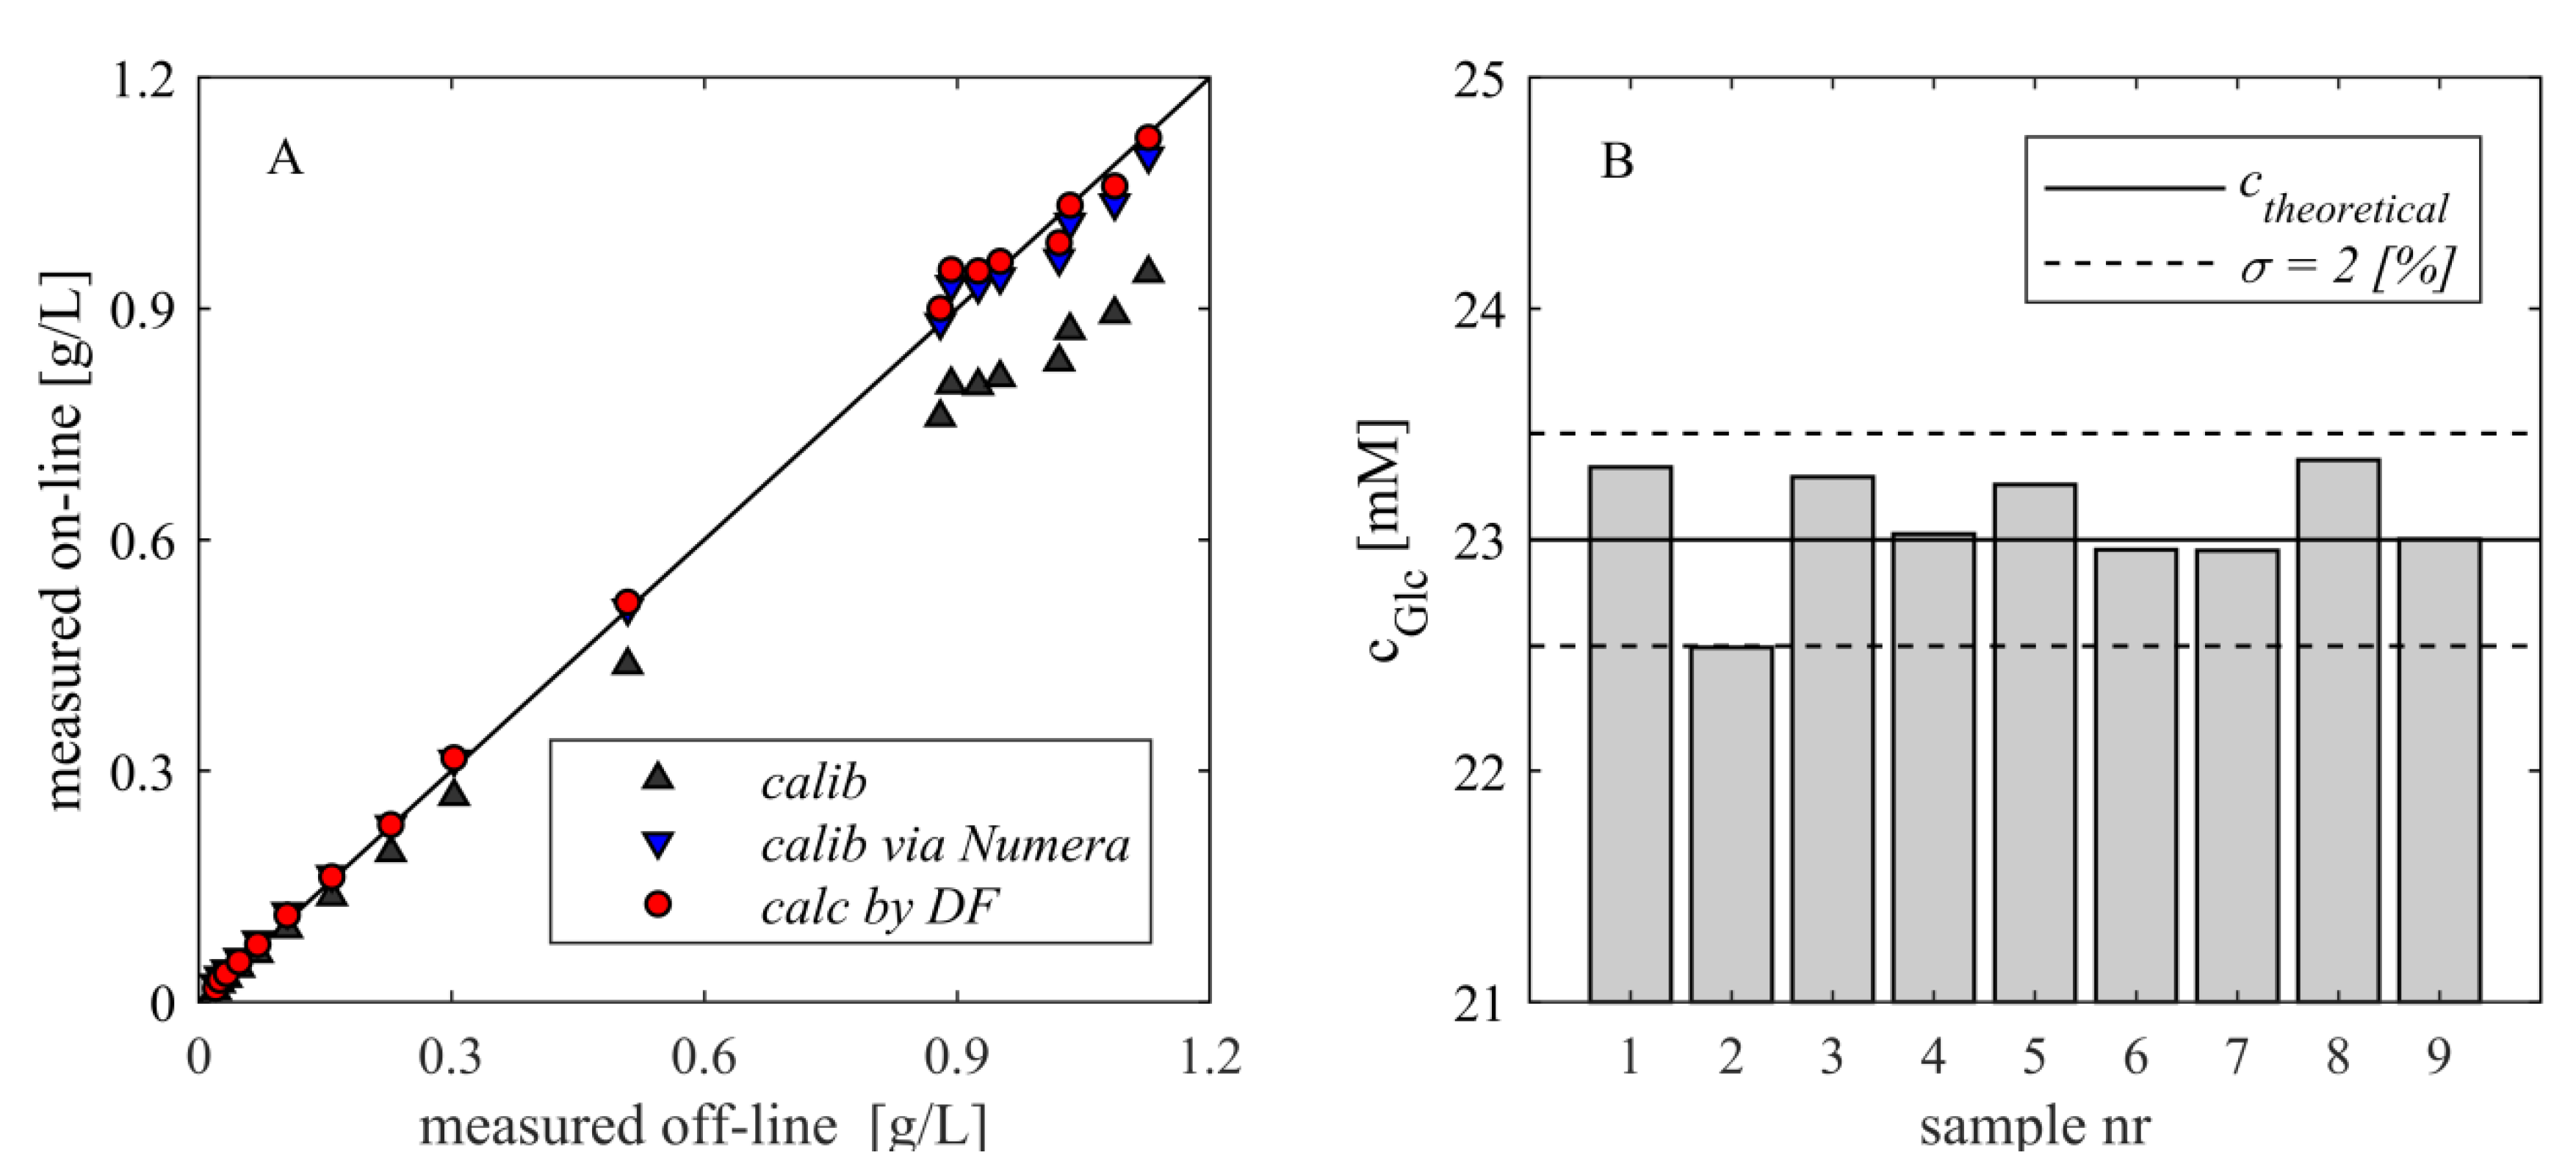
The sampling system is equipped with tubings having an inner diameter of 0.75 mm in order to facilitate low sample volumes. Hence, the volume-to-surface ratio is predestined for small liquid residues that might have a high impact on accuracy. This sample dilution was evaluated by comparing on-line and off-line measured samples by HPLC. A distinct sample dilution could be observed when applying the sampling system. Nevertheless, the systematic error can be eliminated by two approaches: (i) calculation of the dilution factor (DF) and inclusion in the sample analysis or (ii) calibration of the analytical device via the Numera system, i.e., the standard solutions are processed via Numera and automatically injected into the HPLC. Both approaches showed high accuracy with a relative deviation from the true value of 0.1% and 3%, respectively (Figure 4A). The differences in the linear correlations between all approaches are listed in Table 1, showing a slope of nearly 1 for both correction methods. It should be noted that the degree of dilution depends both on the number of applied modules and the applied analyzer. With the application of a 1:1 dilution to the drawn sample, the dilution module produces the highest unwanted DF. For dilutions between 1:2 and 1:25, the DF can be reduced to <1% by being integrated into the qualification of the module. Finally, the precision of the system was evaluated. Therefore, a glucose standard was repeatedly sampled, processed, and analyzed with the Cedex® Bio HT. The results show a high precision and reproducibility of the measurement with a bias of 0.31% and relative deviation of 1.1%. The relative deviation is a combination of the deviation caused by the Numera and the Bio HT analyzer (Figure 4B).
3.2. Monitoring—HPLC Autosampler Required
Amino acids play an important role in various bioprocesses, especially in CHO cultivations [9,10,11]. Thus, the monitoring of amino acids might be crucial for process performance. Analysis via HPLC methods require a derivatization step, which can be performed manually, or by automatization via in-needle or in-vial derivatization. In order to facilitate on-line amino acid measurements with the Numera system, an HPLC autosampler (WPS-3000FC, Thermo Fisher Scientific) was included in the set-up. Additionally, an in-needle derivatization method was assessed regarding its feasibility with the system.
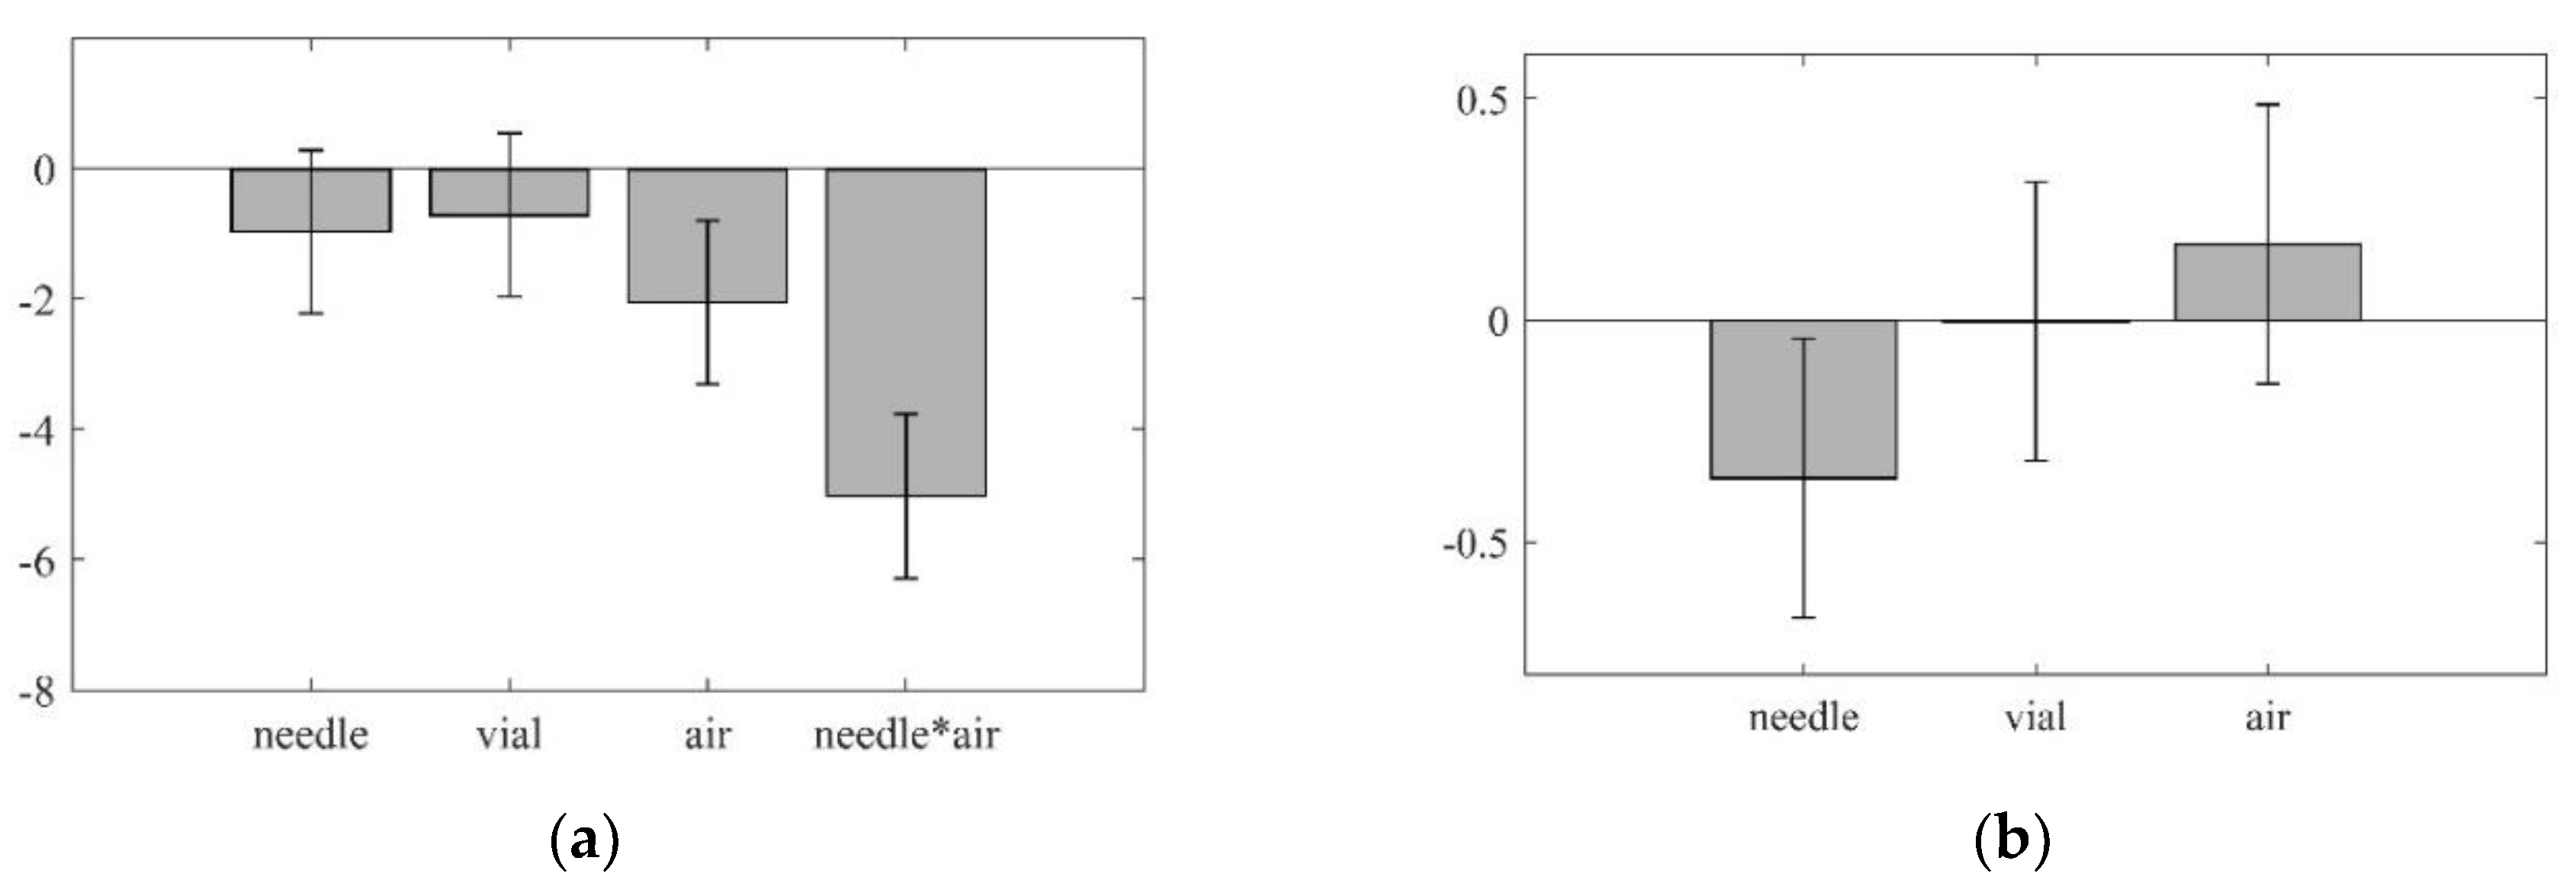
First, basic steps within the derivatization method were assessed. Different approaches for the partial loop filling were programmed and tested for highest reproducibility. The method drawing 10 µL water and 30 µL sample resulted in a relative deviation of 0.09%, which was assessed by a twelvefold measurement. The needle of the applied autosampler was split in a capillary and a needle puncturer. This set-up is prone to drops that stick to the capillary and affect the accuracy of the dilutions. Hence, a Design of Experiment (DoE) was performed to evaluate the best washing procedure for the in-vial derivatization. As every additional step increases measurement time and therefore reduces the possible on-line measurement frequency, a compromise between washing and time must be made. The DoE was performed using acetate as test substances to assess the washing procedure of the derivatization method. The factors in the DoE were needle wash, dipping needle in two water vials, and air draw before drawing the next reagent. A fractional factorial design with two levels (on/off) was chosen, resulting in eight experiments and three center points. Every experiment was run in threefold with a water sample after each injection. The responses were (i) precision (i.e., relative standard deviation of each experiment), (ii) carry-over (i.e., average concentration of substance in water sample), and (iii) accuracy (i.e., average offset between measured value and known concentration). The evaluation of the DoE showed that the air draw and an interaction term of needle wash and air draw correlated negatively with precision (Figure 5a). This means that the relative standard deviation is smaller when an air draw or air draw and needle wash were performed. The effect on carry-over showed no significant correlations between any factor and the carry-over. The mean carry-over of all experiments was 0.0040 +/− 0.0049 g/L, which is under the limit of quantification (LOQ) of the analytical method. The evaluation of accuracy resulted in one significant coefficient, the needle wash (Figure 5b). Air draw and two water vial wash showed no significant correlation. As a result, the wash procedure of the derivatization method includes the needle wash as well as the air draw. An additional washing procedure in two water vials was excluded from the final method.
The final derivatization method was assessed by using a method for organic acids. Lactate, acetate, and succinate were pipetted together and diluted with water, mimicking the steps of the derivatization step. Special attention was paid to the step adding the internal standard. Usually, this is performed manually before the automated derivatization starts in the autosampler. In our case, the part had to be included in the derivatization step chain as no manual interference was applied. Reproducibility of the derivatization was evaluated, resulting in a deviation of approx. 2.8% for lactate, acetate, and succinate.
For the final derivatization method, the deviations of the different amino acids were accessed, ranging between 1.35% and 2.68%. Finally, the deviation resulting from the automated sampling system Numera without the method error was determined as 4.5% (Figure 6).
In order to be able to transfer the sample via the Numera automated sampling system from the bioreactor to the HPLC autosampler, an HPLC fraction collector autosampler (WPS-3000FC) was used. The injection valve of the autosampler belonging to the Numera automated sampling system was connected with the second injection valve of the WPS-3000FC autosampler of the HPLC, which is normally dedicated to collect fractions after the chromatographic separation. The transfer was performed with a time parameter defining the amount of transferred sample. Along with the transfer, a new injection in the current sequence in Chromeleon was created by the overarching software Lucullus PIMS, coordinating the devices. The instrument method started mixing the sample with the internal standard, followed by the rest of the derivatization procedure and final injection on the column.
Another critical point in the automatization of this analysis is the specific sample dilution needed in order to be within the measurement range of the method. In the beginning, a dilution of 1:50 is required, which exceeds the capabilities of the SDU of the automated sampling system (declared as maximum 1:25 in order to keep a 2% error). Accordingly, for each dilution, a new instrument method was created, applying a dilution step in the beginning of the derivatization procedure and taking into account adjusted amounts of needed internal standard. During the cultivation, the applied instrument method was changed via Lucullus PIMS.
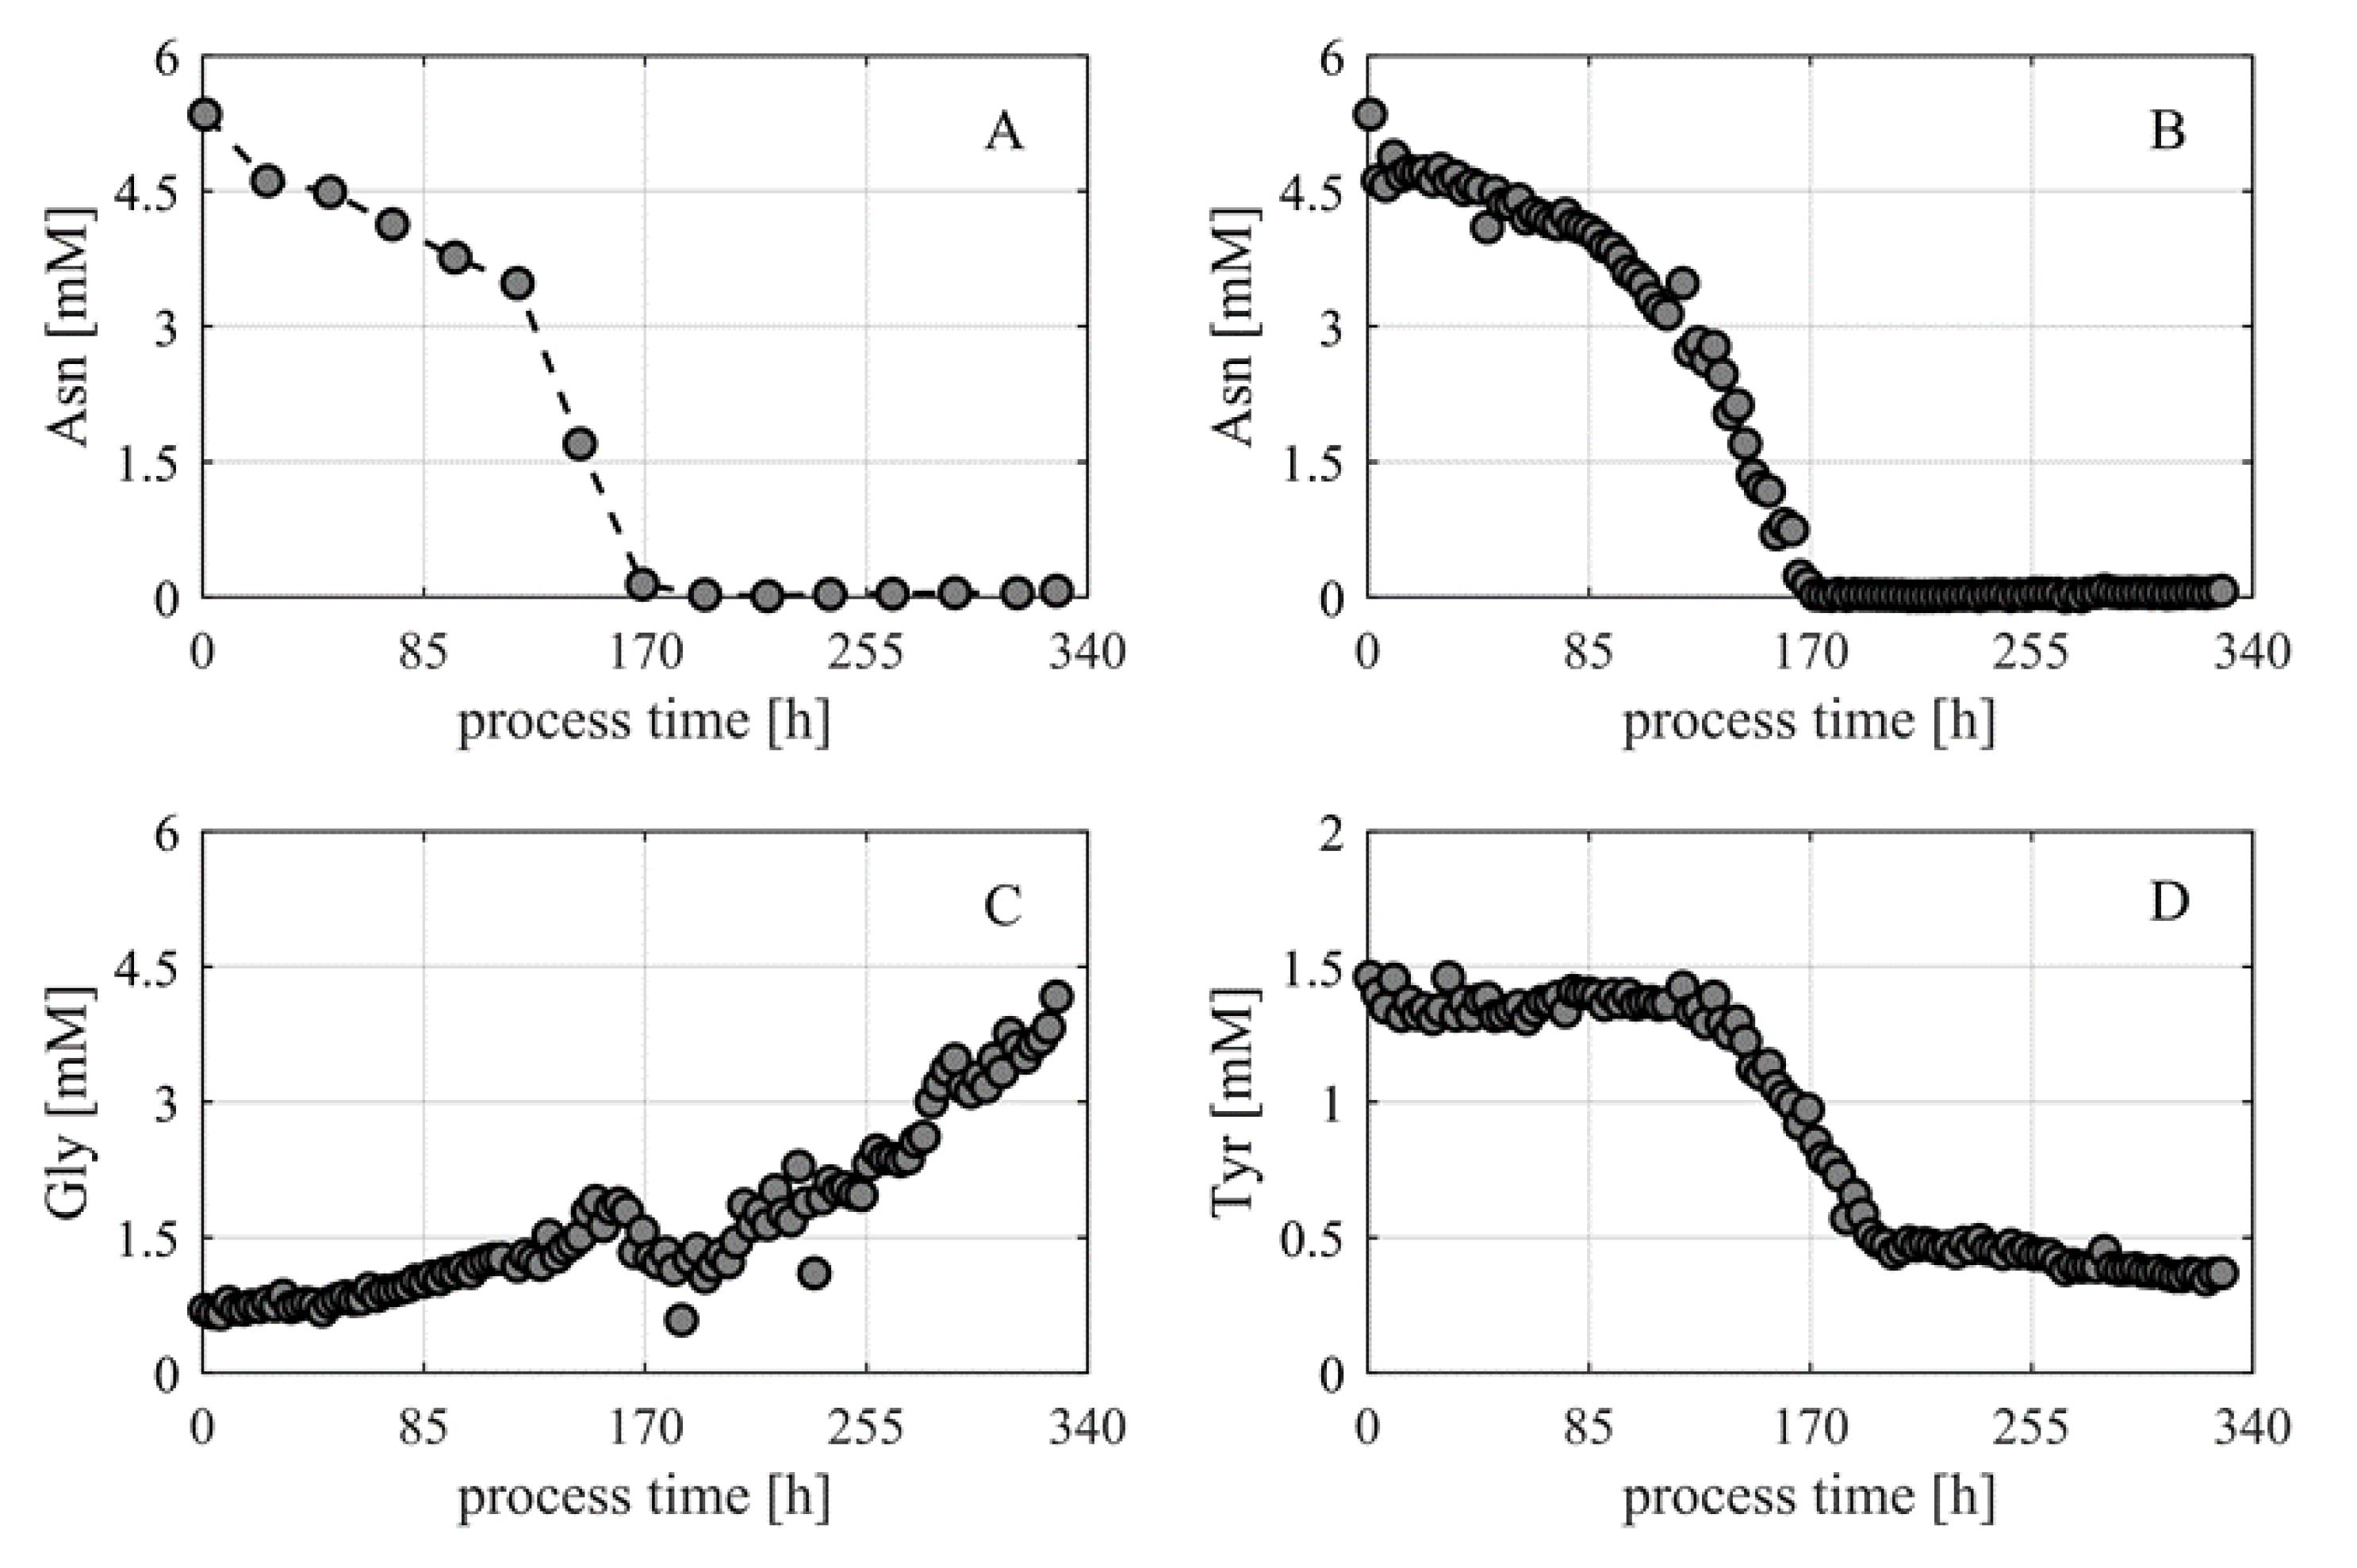
Finally, the method was applied in a CHO process delivering information about the current concentration of 18 different amino acids with a time delay of 45 min after the automated sample draw. Samples were drawn and measured every 3 h. Figure 7 shows the time courses of asparagine (Asn), glycine (Gly), and tyrosine (Tyr) exemplary. For asparagine, the typical sample frequency of once per day and the high frequency of 8 per day are displayed. From a purely visual point of view, it can already be proven at this point that a concentration curve typical of bioprocesses is achieved by a high measuring frequency (second-order kinetic). This cannot be derived from a low-frequency measurement. The reason for this is the information content, which can be explained by the fisher information matrix (1). The parameter nSP represents the number of sampling points. From this follows the simple conclusion that the information about a system increases with the number of observations.
Not only does this allow more precise statements about the reaction kinetics, but also about the extraction of any process-critical parameters such as kS values or, with regard to process control, the more accurate detection of process events.
In the process examined, tyrosine was sublimed in an additional feed. The success of the addition can be seen in Figure 7D. The concentration of tyrosine remains almost constant at a level of 0.5 mM (~90 mg/L). Monitoring in this concentration range in a complex mixture of substances is currently not possible with any other on-line technology. As an example, it can be compared with the monitoring of four amino acids with an in-line Raman sensor, which showed a root mean square error of estimation (RMSEE) of the calibration model of 0.41 mM for tyrosine, 0.24 mM for tryptophan, 0.35 mM for phenylalanine, and 0.27 mM for methionine [14]. Unfortunately, the publication shows no concentration of the amino acids over process time.
3.3. Monitoring—HPLC Direct Transfer
HPLC is often applied as reference analytic for product or metabolite analysis. Hence, on-line availability could have a huge impact on process control and time-to-market. If standard HPLC methods are applied that need no addition of internal standard or any other steps such as derivatization, a direct transfer of the sample to the analyzer can be performed. This means that the pump of the HPLC as well as the column are directly connected to the injection valve of the Numera autosampler. The injection is triggered via Lucullus PIMS, the syringe of the Numera autosampler is transferring the sample in the sample loop, and the injection is initiated. Thereby, a full-loop injection is performed, which requires approximately 350 µL of sample to ensure complete filling of the 50 µL sample loop.
The system was applied to generate on-line data of product (IgG) in a fed-batch experiment (Figure A1) and of vitamins in a batch experiment (Figure A2). The product measurement had a runtime of 3 min resulting in a possible sampling frequency of once every 15 min (i.e., time for sample drawing, sample processing, sample injection, and completed HPLC analysis). The vitamin measurement runtime was 26 min, including column washing, resulting in a possible sampling frequency of once every 30 min (sampling and sample processing can be performed while HPLC is still running).
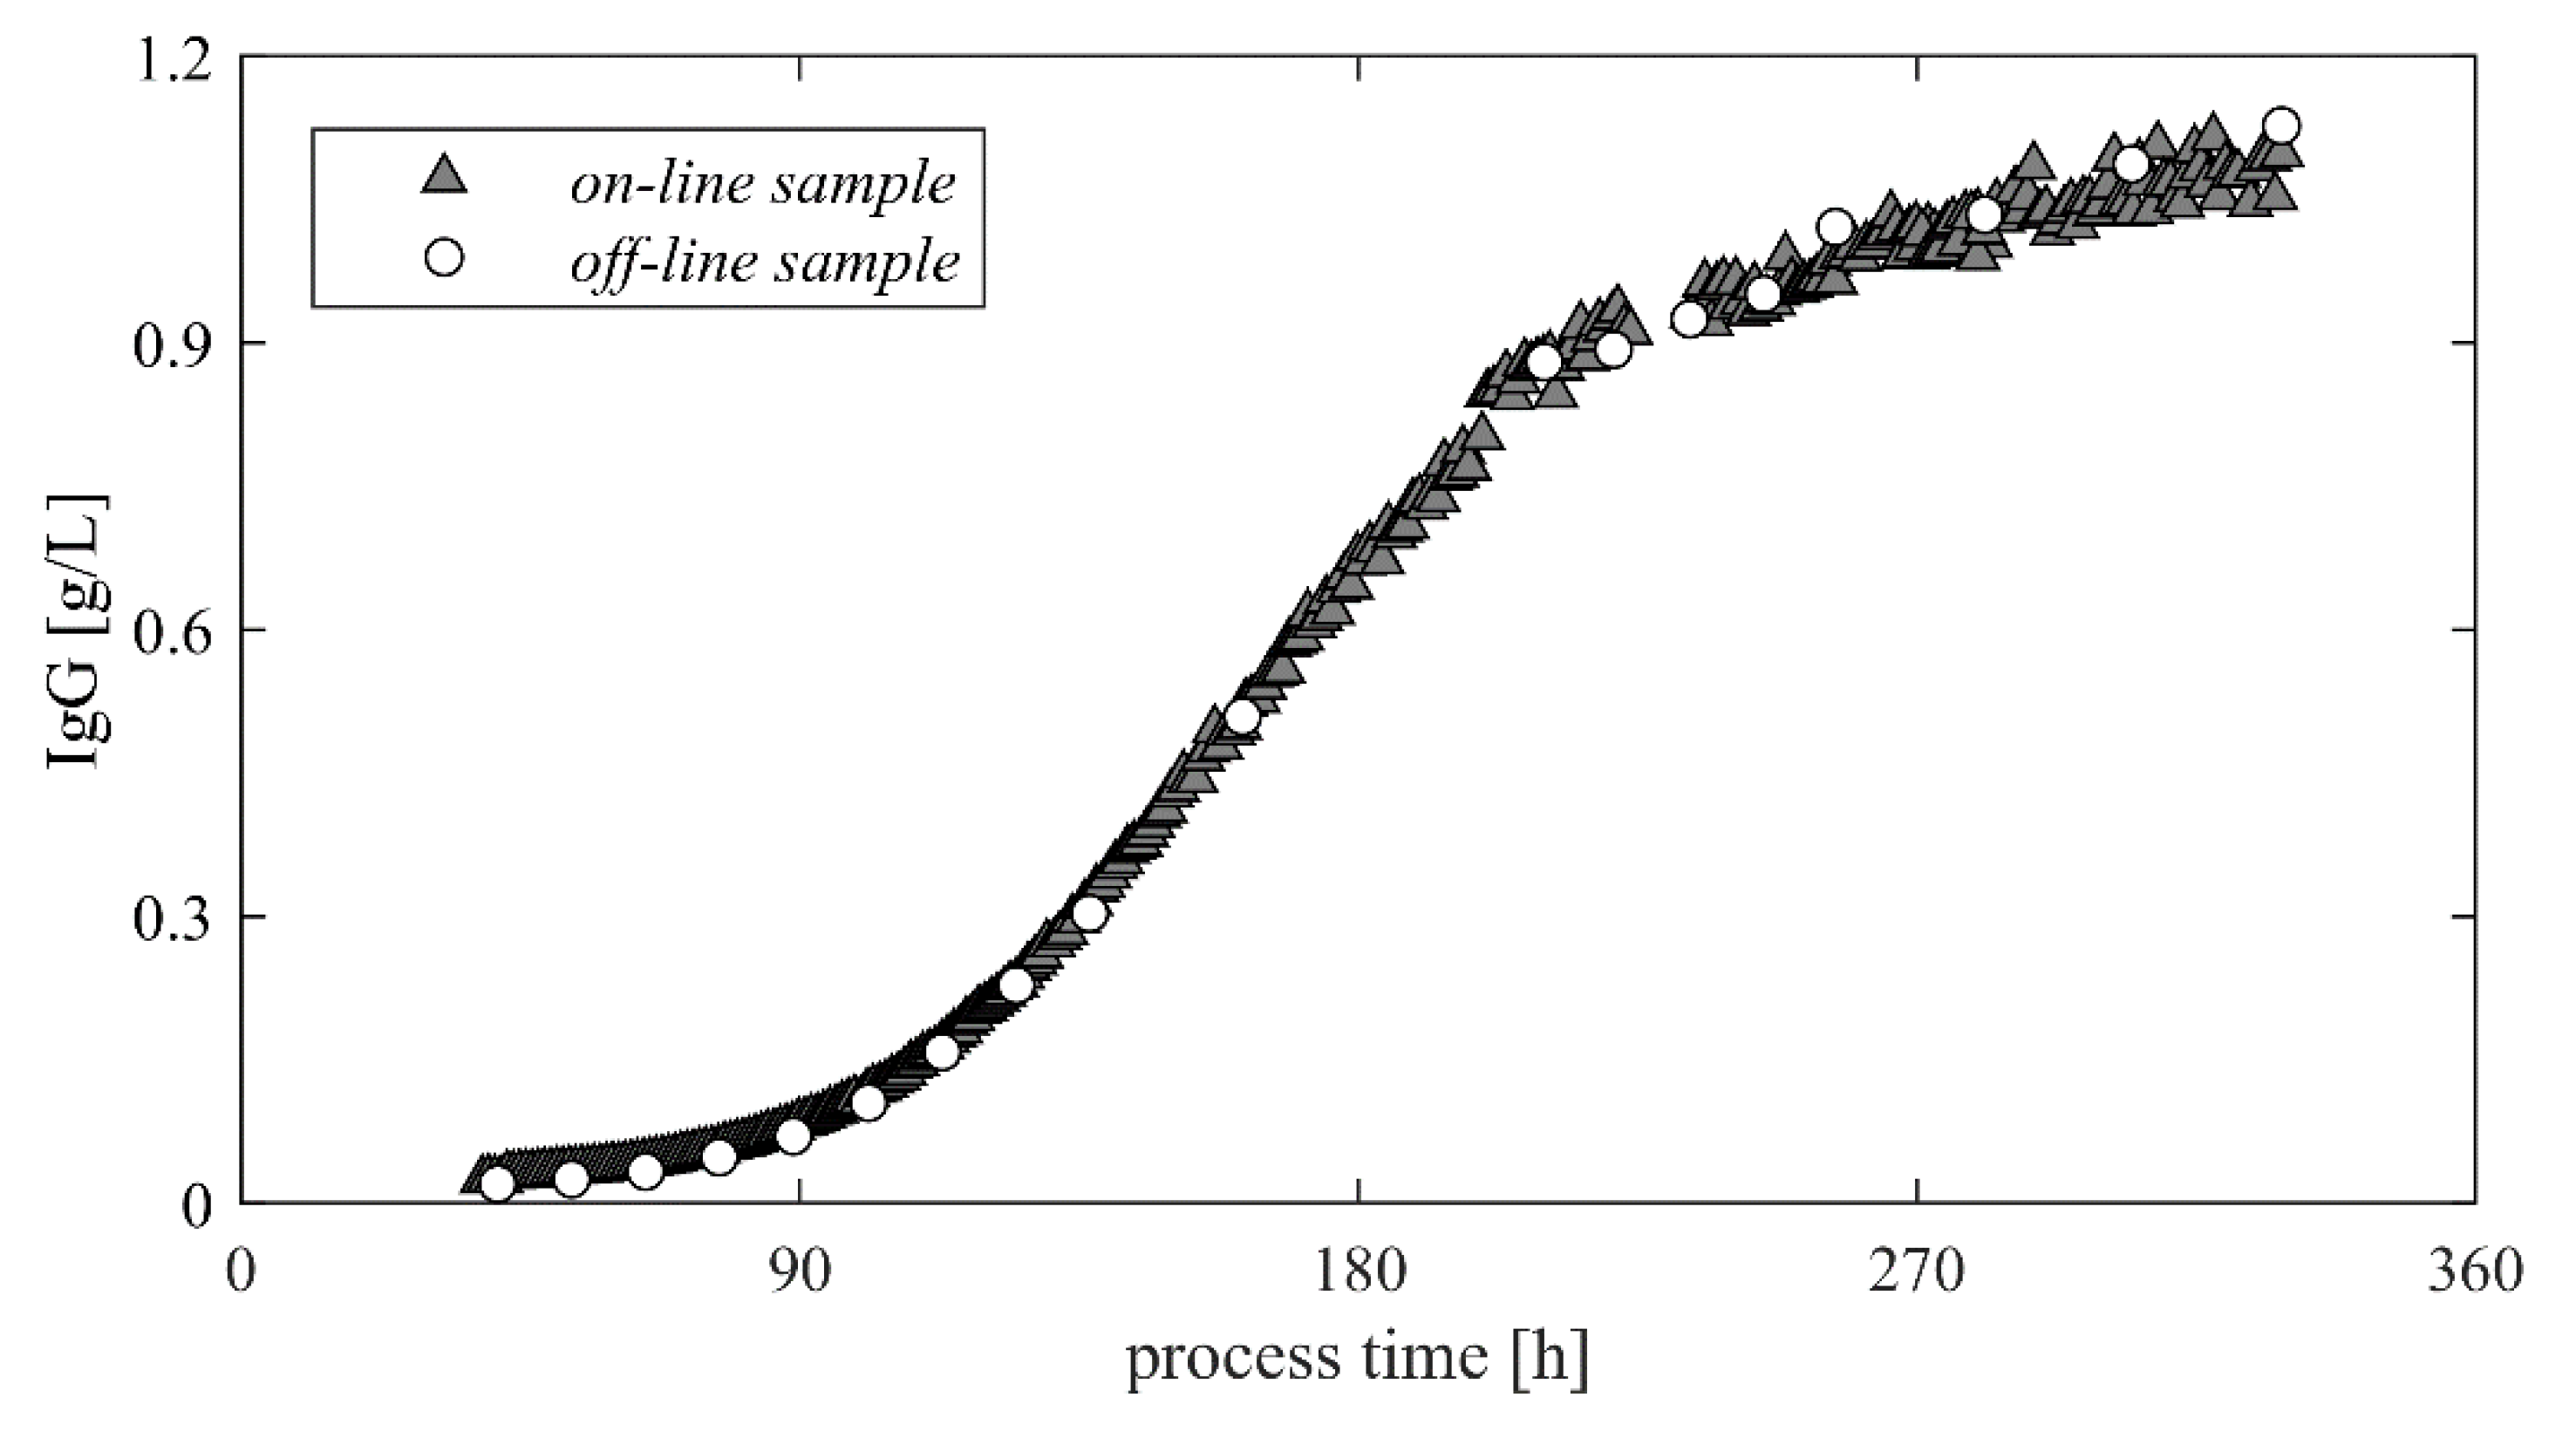
The reliability of the system could be demonstrated in the product analysis. No manual sampling was applied for 50 h during the experiment, relying on automated sampling and on-line analysis.
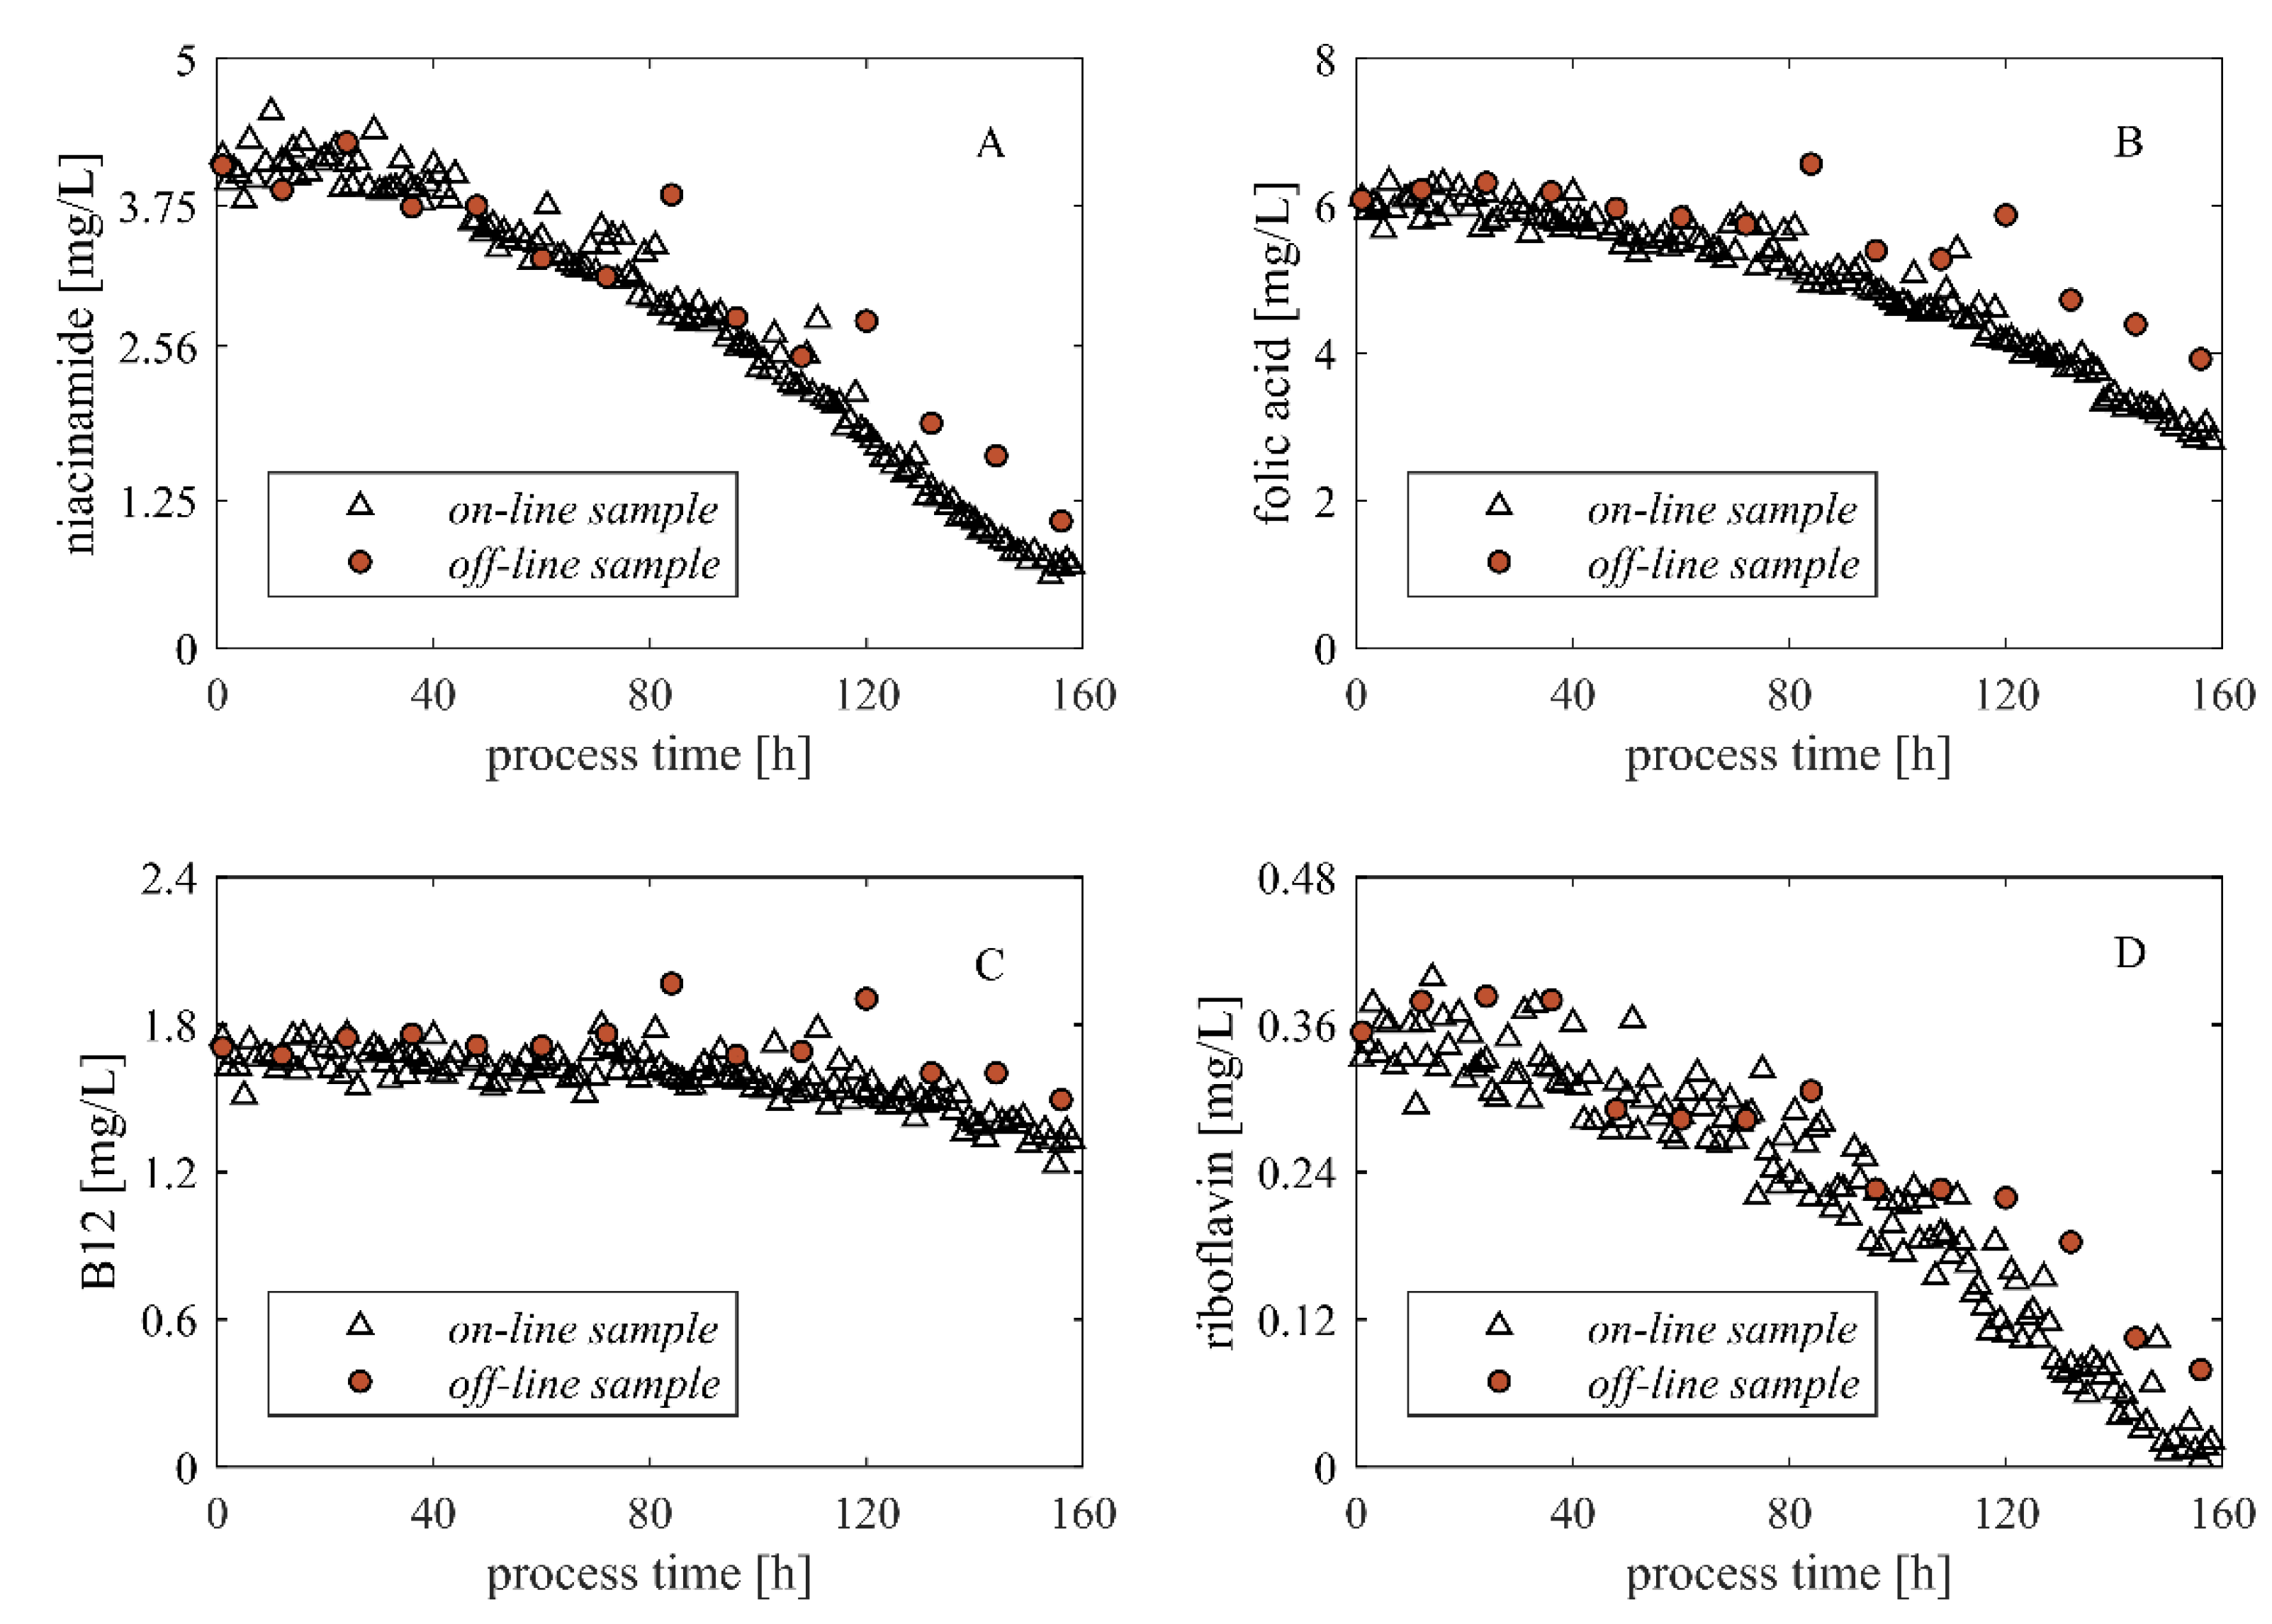
The possible advantage of high frequency sampling could be shown with the vitamin data. In total, four different B-vitamins could be detected, namely niacinamide, folic acid, B12, and riboflavin. They were available in very low concentrations, complicating the physiological interpretation over process time. For niacinamide, folic acid, and riboflavin, the high frequent on-line data indicated a clear uptake of the substances by the cells, whereas the interpretation of the manual off-line samples is ambiguous. The high data frequency of the on-line samples allows the application of smoothing algorithms without a bias of the result, which eases the calculation of physiological rates.
3.4. Monitoring—Bio HT Direct Transfer
The connection between the sampling system and the Bio HT was realized by a cuvette that was located in a fixed position in one rack of the Bio HT reserved for automated samples. The cuvette has dimensions of 16 × 10 mm. Taking the needle height into account, this results in a minimal volume of 200 µL necessary for several measurements, which is twice the volume compared to a regular measurement using a 1.5 mL reagent tube. In addition, the settings of the Bio HT had to be adapted to allow around the clock analysis, i.e., the begin of day action starts at 01:00 a.m., standby mode and sleep mode were initialized after 60 min each (which is the maximum that can be set). Hence, analysis of the automated samples had to be performed every 2 h as the system is not reachable by Lucullus PIMS when in sleep mode.
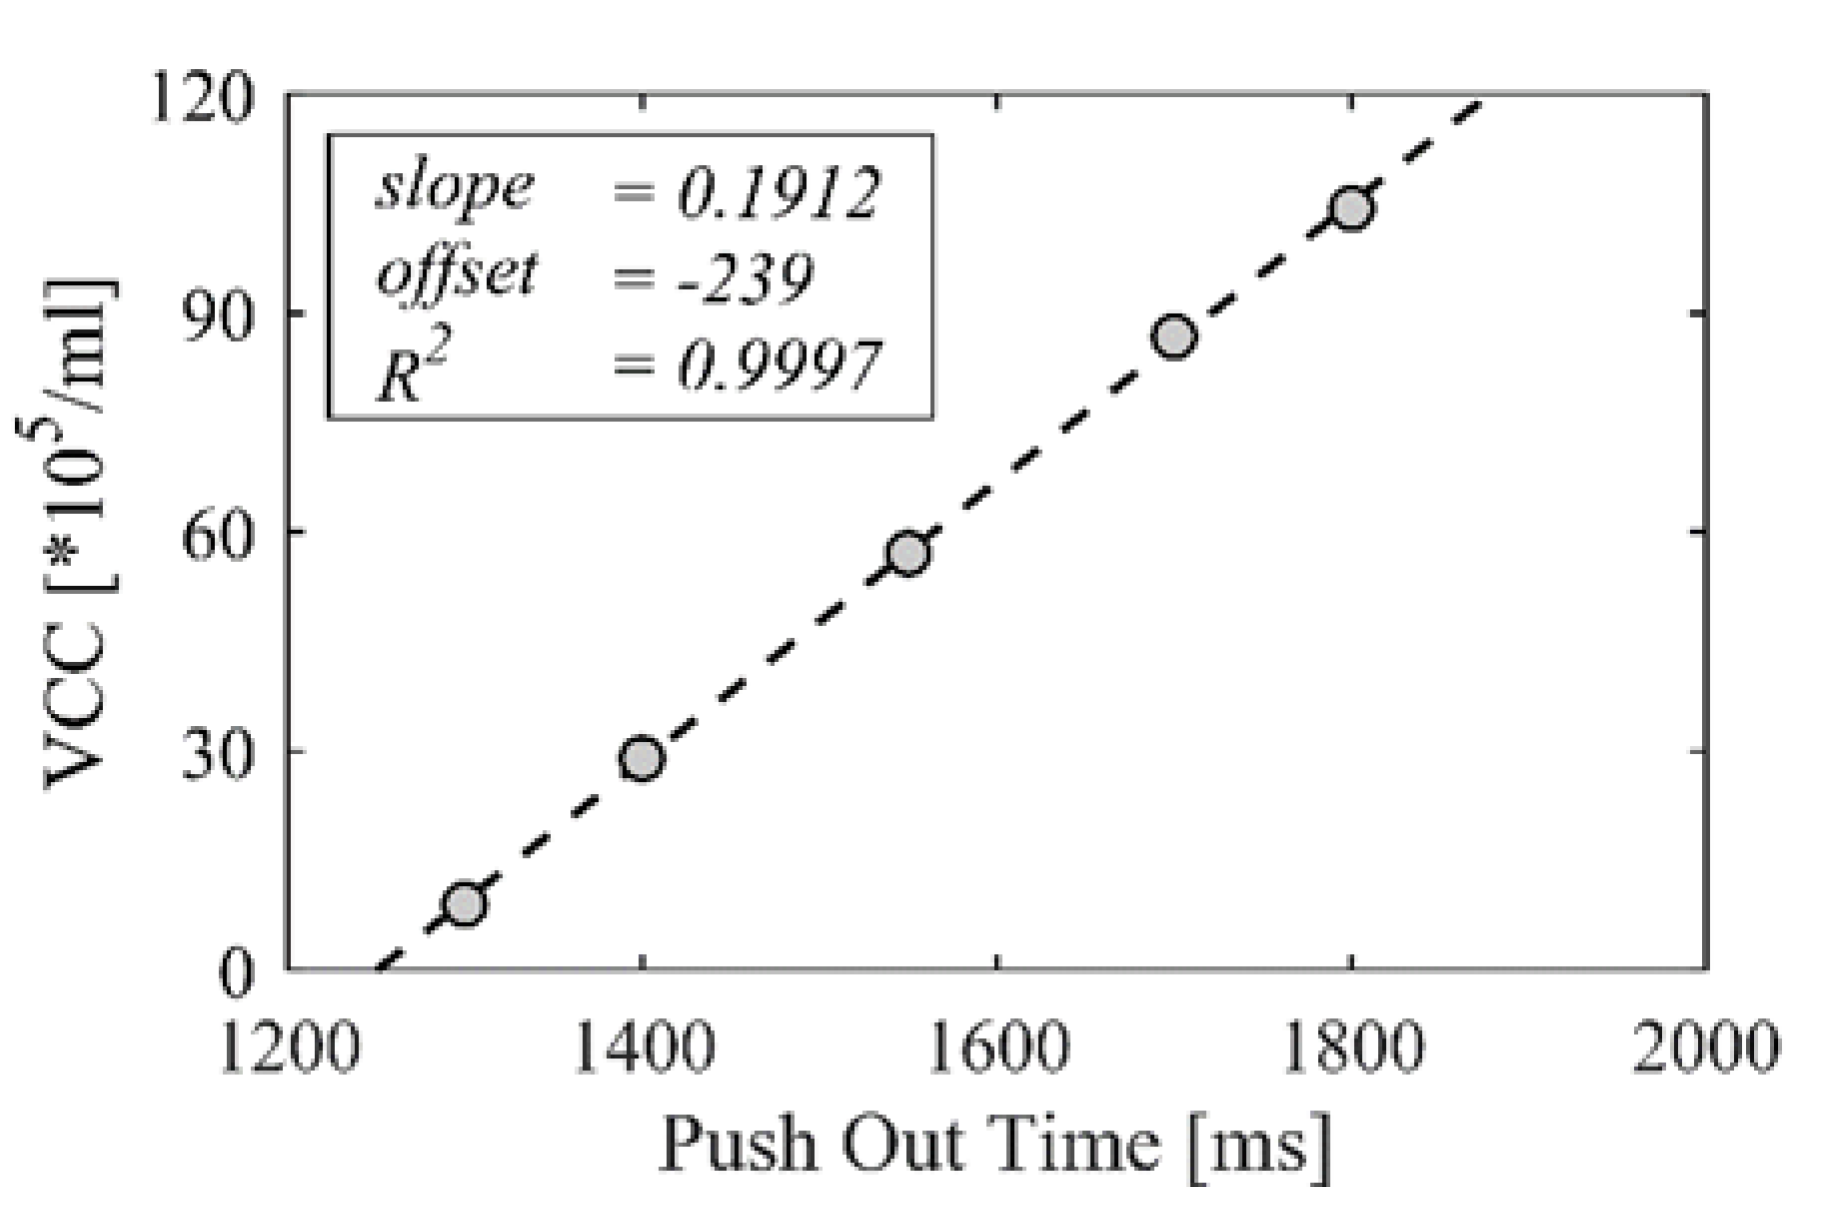
Our goal was to achieve a reliable automated measurement of important parameters and at the same time to take as little volume as possible from the bioreactor. Therefore, 3 mL culture broth was taken, resulting in 1.2 mL filtered sample in vials stored in the autosampler of the Numera. It was noted that the filtration settings deliver different volumes, depending on the cell density of the culture broth. A correlation between the so-called Push Out Time (POT) of the filter and the final volume in the vial could be observed. The dependency of viable cell count (VCC) of CHO cells and required POT to achieve a sample volume of 1.2 mL was assessed experimentally. A linear correlation was obtained, which allows to adapt the POT during the process in a reasonable manner (Figure 8). This way it can be guaranteed that enough sample is available for the Bio HT measurement over the whole process. The adaptation of the POT was applied manually but could be automated either by realizing on-line availability of VCC data or by a model estimating the actual VCC.
The Bio HT does not necessarily need particle free samples for analysis. Hence, another solution could be the direct transfer of cell suspension to the Bio HT by the automated sampling system without the inclusion of a filtration step.
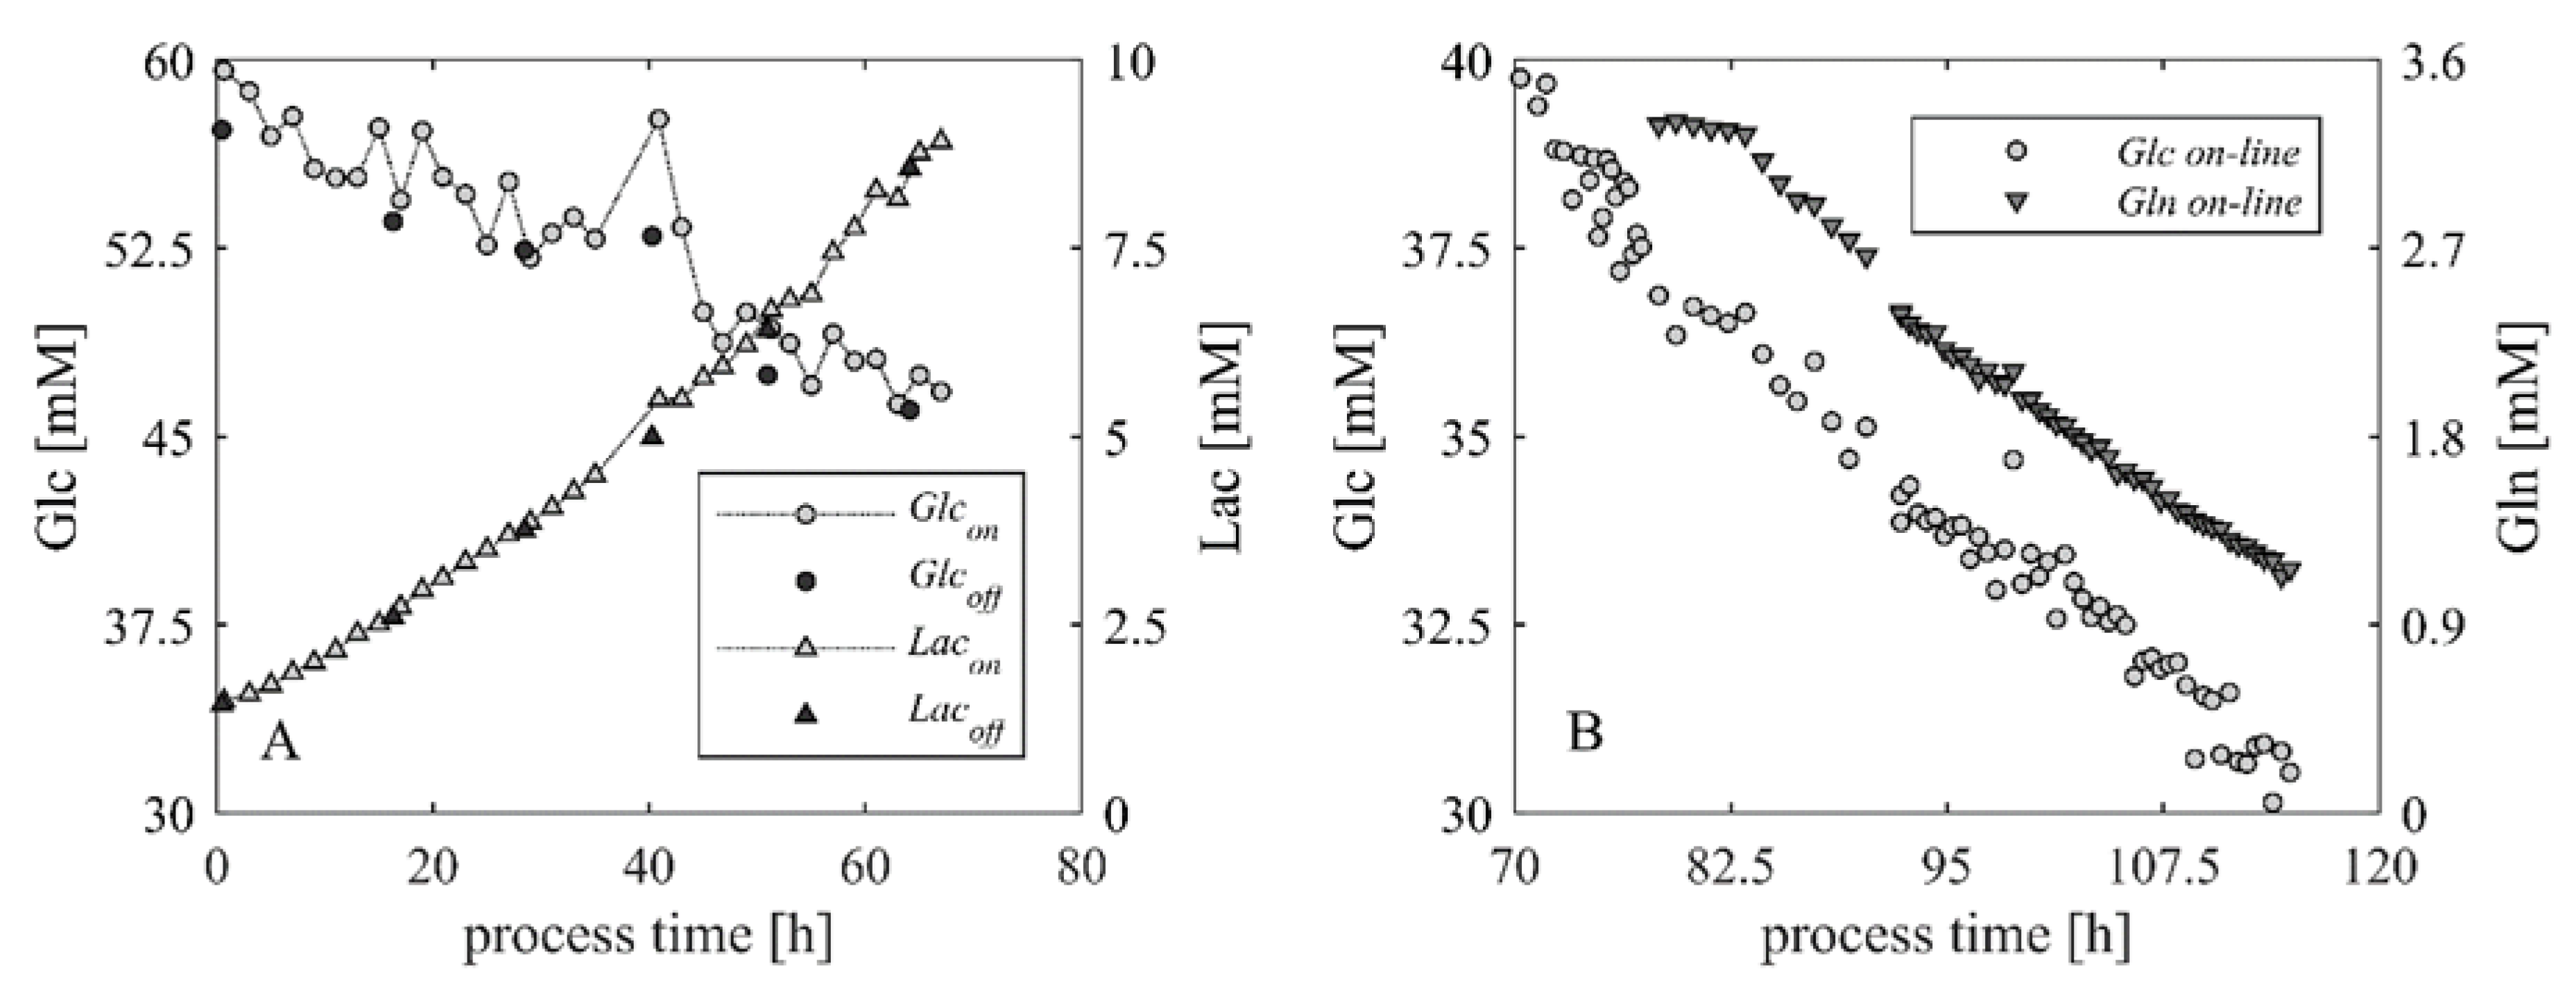
On-line Bio HT analysis was finally applied in a CHO batch process, monitoring glucose, lactate, ammonium, and IgG at a 2 h interval (glucose and lactate shown in Figure 9A). To show the limits of the system on-line analysis was performed every 30 min over 24 h (Figure 9B). As no status feedback of the Bio HT can be sent to Lucullus PIMS by the applied software version of the Bio HT, the 30-min interval is the minimum sampling frequency possible to receive reliable results. A further reduction of the interval could result in a washing of the Bio HT cuvette before the measurement is over and finally in a Bio HT error, interrupting the automated analysis. For the applied sampling intervals, the combination of Numera and Bio HT delivered reliable and precise results, demonstrating its applicability for process monitoring. The variability of the data is linked to measurement error. High concentrations of glucose, which are diluted by the Bio HT, show a greater variance than lactate or glutamine measurements. Nevertheless, the accuracy is high enough to facilitate control actions based on the measurements, especially because control often requires the lower concentration range of glucose.
4. Discussion
4.1. Automated Sampling in General
There are a few scientific contributions available dealing with automated sampling for on-line HPLC [5,6,15,16,17,18]. Most of them apply in-situ membrane probes to receive a particle free sample that can be directly injected into an HPLC. The major advantage of these membrane probes is that the membrane is also the sterility barrier. In comparison, the applied system uses a pinch valve in the multiplexer module as sterility barrier, which is in general more prone to failure than a 0.22 µm membrane. On the other hand, a huge disadvantage of the in-situ membrane probes is the membrane fouling that occurs during cultivation as well as the adsorption of proteins, which affects analytical results. A comparison of different membrane probes tackling these challenges was performed by Spadiut et al. [7].
The applied system Numera does not only draw samples but also acts as a liquid handling system. A comparable system, the BaychroMAT®, was presented by Chong et al. [3]. For the BaychroMAT® too, manual and automated samples were compared for glucose, lactate, and viable cell density, resulting in errors between 8.2–14.4%. However, the errors are either higher or comparable to the Numera system.
When applying an automated sampling system, there are a few important points that need to be considered, which were assessed for the commercial automated sampling system Numera:
- (1)
- Does the system impact the sterility of the bioprocess?—No.
- (2)
- How much volume and how much dead volume are drawn from the bioreactor?—The sample volume is approx. 3.5 mL, of which about 1 mL is dead volume.
- (3)
- Does the system support sample processing (i.e., dilution, cell removal etc.)?—Yes.
- (4)
- Does the automated procedure impact the analytical result (i.e., dilution effects)?—There is a constant dilution factor observable, which can be included in final calculations.
- (5)
- How is the communication between process, sampling system, and analyzers realized?—The communication was achieved with one software (Lucullus PIMS) that coordinated the sample draw as well as the transfer of the sample to the analyzer and the initiation of the measurement.
4.2. Assessment of the Presented Liquid Handling System
In summary, the liquid handling system Numera performed very satisfyingly for the required task. The filtration module for cell removal follows an approach using a tape filtration technology and shows some advantages over in-situ filtration probes. However, there are three main aspects that need to be mentioned:
- (1)
- The system was tested for CHO cells with a maximum viable cell density of about 12∙106 cells/mL, resulting in a required adaptation of the POT to reach the desired volume of permeate after filtration. Currently, the trend is towards high cell density cultivations in perfusion mode, which were not tested in this contribution. The actual filter area in the filtration module is 3.14 cm2, which is filtering 2.5 mL of cell suspension. An increase of the filter area might have a positive impact on the permeate volume.
- (2)
- During the operation of the system (especially when applying the Protein A HPLC method), it was observed that the precolumn had to be changed approximately 8–10 times during one cultivation run. The required changing frequency increased with progress of the process. This leads to the conclusion that the load of particles of the samples after the automated filtration is higher than after manual cell removal. A reason could be the filtration procedure per se or the applied pore size of the filter of 0.45 µm. Possible solutions to overcome this problem are (i) the use of a membrane with 0.22 µm pore size or (ii) the introduction of a prefiltration step or a dual filtration.
- (3)
- 1–2% of the samples resulted in empty vials after the filtration step.
Another issue that needs further discussion is software communication. In this work, the communication was performed by the software Lucullus PIMS, which coordinated the sample draw via Numera, the transfer to the analyzer, the initiation of the measurement, and the feedback of the analytical results to the other process data. The complexity of the experimental setup used is relatively high, caused by the large number of devices. This requires intensive and frequent support. Common errors were communication problems between the devices. Furthermore, an update of the software of one of the involved devices can lead to communication failure and consequently, system failure. This means that intensive care is needed for the whole setup to guarantee its functionality.
4.3. Comparison with In-Line Sensors
The recent trend for monitoring strategies of substrates and metabolites is towards in-line sensors, especially focusing on spectroscopic methods like Raman [1,2,18,19]. In general, these sensors have some obvious advantages over sample-based monitoring: (i) the methods are non-invasive, (ii) the data frequency is much higher, (iii) the current values of the analytes are available faster, and (iv) the probes have a smaller footprint than for example the described set-up of this contribution. However, there are also some disadvantages that must be considered: (i) in order to interpret spectral data, multivariate tools are needed (e.g., PLS regression models), which require a significant amount of data for model calibration [20]. Hence, a lot of experiments have to be performed that still require manual sampling as well as sample analysis with the respective reference method (e.g., HPLC). (ii) If the calibration model is generated, a continuous validation of the model is necessary, as process disturbances like little variations in the raw material or media may impact the measurement background and with it the calibration model.
In 2018, a contribution was published using Raman spectroscopy for monitoring of four amino acids in a cell culture process [14]. This allows direct comparison of the method using the presented sample-based on-line HPLC approach. First, it should be noted that the sample-based HPLC approach allows monitoring of 18 amino acids in parallel using an established and frequently used methodology, whereas the Raman approach was designed to monitor four amino acids of interest only. Amino acids are typically occurring in the culture supernatant in low concentration (mM range). Comparing the errors of the different methods, it can be shown that the automated HPLC approach leads to an increase in the error by a factor of 3.5 compared to the error of the reference method only, whereas the Raman measurement increased the error 20-fold (Table 2).
With regard to an application of the monitoring method for control purposes, not only the error but also the measurement frequency is decisive. The chosen frequency for the Raman measurements was once every 12.5 min (one measurement consisting of 75 scans with an exposure of 10 s per scan) [14]. In comparison, the automated sample-based HPLC method requires approximately 45 min from the beginning of the sample draw till the availability of the analytical result in the process management software. It should be noted that the described sampling system is capable of multiplexing, i.e., up to 16 bioreactors can be connected and sampling procedure is then performed subsequently. Assuming that 16 bioreactors are connected and only sampled to monitor the amino acids by HPLC as described, this decreases the sampling frequency to once every 12 h.
The authors believe that both methods are highly valuable monitoring tools with different fields of application. Raman spectroscopy is well suited for monitoring manufacturing processes that are designed to be congruent without deviations. The automated sampling approach delivers the opportunity to create more process understanding by applying various methods and is therefore better suited for process development. Furthermore, we believe that a combination of both e.g., by automation of the validation and recalibration of the Raman calibration models could finally be very beneficial.
4.4. Outlook
This contribution focuses on the application of analytical methods with the automated sampling system Numera rather than on the evaluation of the effect of the automated dilution and filtration on cell integrity. A short evaluation has been performed, suggesting that the dilution procedure has no impact on cell viability and the amount of cell debris (Table A1). However, a detailed analysis focusing on e.g., lactate dehydrogenase (LDH) as marker substance for cell integrity should be performed for both preprocessing steps in a further study. Especially, if LDH is a critical process parameter, it must be assured that the automated sampling system has no impact on the analytical result.
Although the application of the sampling system allowed to measure substrates, metabolites, and product in an automated manner, manual samples were still needed to monitor and control the process: (i) Manual samples were needed for the analysis of the viable cell density by a cell counter (Cedex® HiRes, Roche Diagnostics, Germany). The cell count was further used for correlation with a permittivity signal, which was involved in the calculation and control of the feed rates. (ii) Directly after the manual sample draw, pH was measured to check if the calibration of the in-line pH probe requires adjustment.
With regard to product quality, both analyses are essential for nearly every cultivation with mammalian cells [21,22,23,24,25,26]. Hence, for complete automation of the sampling procedure without any need for additional manual sampling, the analyses of cell count and pH must be automated. In terms of pH measurement, the recalibration procedure of the in-line pH sensor must be automated as well.
5. Conclusions
An advanced PAT set-up was built up including an automated sampling and sample processing system (Numera) enabling HPLC and Cedex® Bio HT as on-line analyzers and applied for CHO cultivations. With regard to the investigated challenges of the sample-based monitoring system, the following conclusions were taken:
- Depending on the preprocessing and the applied analytical method, systematic deviations were observed. They were mainly caused by dilution effects and can be assumed to be constant. On the other hand, the random error seems to be significantly reduced.
- An existing HPLC method for amino acid analysis was successfully adapted in a way that it can now be applied for full automated on-line monitoring.
- The automated sampling and analytic system was successfully tested in mammalian cell culture fed-batch processes. The monitoring of various analytes was performed without significant errors or system failures. The higher measurement frequency and strongly reduced random errors resulted in a larger information content per experiment.
- The accuracy of the system is an order of magnitude better than the compared methods.
Author Contributions
Funding acquisition, C.H.; Investigation, A.H. and P.K.; Methodology, A.H. and M.B.; Resources, C.H.; Supervision, C.H.; Visualization, A.H.; Writing—original draft, A.H. and P.K.; Writing—review & editing, P.K., M.B. and C.H. All authors have read and agreed to the published version of the manuscript.
Funding
This research was funded by Christian Doppler Forschungsgesellschaft, Grant/Award-Number: 171.
Acknowledgments
The authors would like to thank Securecell AG for providing the automated sampling system Numera and the Process Information Management System Lucullus PIMS and Kathrin Oberhuber for English proof reading. The authors acknowledge TU Wien Bibliothek for financial support through its Open Access Funding Program.
Conflicts of Interest
The authors declare no conflict of interest. The funders had no role in the design of the study; in the collection, analyses, or interpretation of data; in the writing of the manuscript, or in the decision to publish the results.
Appendix A
Figure A1.
Concentration of product (IgG) in a CHO fed-batch over process time. The grey triangles represent measurements that were performed by the automated sampling and liquid handling system and an on-line HPLC. This data was available in real-time in process management software. The white circles display the corresponding results of the manual samples. Calibration of the HPLC was performed via the Numera system, as described in Section 3.1.

Figure A2.
Vitamins were monitored on-line via HPLC. The plots display the concentrations over process time of four different vitamins, i.e., niacinamide in plot A, folic acid in plot B, B12 in plot C and riboflavin in plot D. On-line results (white triangles) and analytical results of manual samples measured off-line (red circles) are compared in each plot. The concentration ranges are very low; hence, high frequency on-line results support interpretation of metabolic behavior of the cells with regard to the analytes.


Table A1.
The automated sampling system Numera, especially the dilution module, was roughly evaluated for its impact on cell integrity. CHO cells cultivated in shake flasks were directly analyzed with a cell counter (Cedex® HiRes, Roche Diagnostics, Germany) 5-fold. The same cell suspension was then processed with the Numera system, i.e., drawn from the shake flask, transferred via multiplexer and dilution module, and manually captured after the dilution step. Subsequently, the samples were analyzed with the cell counter. The procedure with Numera was performed two times and each captured sample was analyzed in duplicate. The sample was analyzed for viable cell count (VCC), total cell count (TCC), viability, and cell debris. The results showed no noticeable impact of the Numera system on cell integrity.
| Sample | VCC [106 Cells/mL] | TCC [106 Cells/mL] | Viability [%] | Debris * [106 Cells/mL] |
|---|---|---|---|---|
| Manual 1 | 3.34 | 3.44 | 97.00 | 0.35 |
| Manual 2 | 3.45 | 3.69 | 93.00 | 0.48 |
| Manual 3 | 3.25 | 3.51 | 92.70 | 0.37 |
| Manual 4 | 3.40 | 3.62 | 94.00 | 0.42 |
| Manual 5 | 2.79 | 3.01 | 92.60 | 0.48 |
| Numera 1.1 | 3.68 | 3.91 | 94.00 | 0.47 |
| Numera 1.2 | 3.29 | 3.50 | 94.10 | 0.57 |
| Numera 2.1 | 3.27 | 3.55 | 92.30 | 0.43 |
| Numera 2.2 | 3.14 | 3.32 | 94.50 | 0.45 |
* debris is defined as cells/particles <7 µm.
References
- Sonnleitner, B. Automated Measurement and Monitoring of Bioprocesses: Key Elements of the M 3 C Strategy. In Measurement, Monitoring, Modelling and Control of Bioprocesses; Springer: Berlin/Heidelberg, Germany, 2012; pp. 1–33. [Google Scholar]
- Claßen, J.; Aupert, F.; Reardon, K.F.; Solle, D.; Scheper, T. Spectroscopic sensors for in-line bioprocess monitoring in research and pharmaceutical industrial application. Anal. Bioanal. Chem. 2017, 409, 651–666. [Google Scholar] [CrossRef] [PubMed]
- Chong, L.; Saghafi, M.; Knappe, C.; Steigmiller, S.; Matanguihan, C.; Goudar, C.T. Robust on-line sampling and analysis during long-term perfusion cultivation of mammalian cells. J. Biotechnol. 2013, 165, 133–137. [Google Scholar] [CrossRef] [PubMed]
- Kroll, P.; Sagmeister, P.; Reichelt, W.; Neutsch, L.; Klein, T.; Herwig, C. Ex situ online monitoring: Application, challenges and opportunities for biopharmaceuticals processes. Pharm. Bioprocess. 2014, 2, 285–300. [Google Scholar] [CrossRef]
- Cimander, C.; Bachinger, T.; Mandenius, C.-F. Integration of distributed multi-analyzer monitoring and control in bioprocessing based on a real-time expert system. J. Biotechnol. 2003, 103, 237–248. [Google Scholar] [CrossRef]
- Foley, D.A.; Wang, J.; Maranzano, B.; Zell, M.T.; Marquez, B.L.; Xiang, Y.; Reid, G.L. Online NMR and HPLC as a reaction monitoring platform for pharmaceutical process development. Anal. Chem. 2013, 85, 8928–8932. [Google Scholar] [CrossRef]
- Spadiut, O.; Dietzsch, C.; Posch, A.; Herwig, C. Evaluating online sampling probes for substrate concentration and protein production by a Design of Experiments screening approach. Eng. Life Sci. 2012, 12, 507–513. [Google Scholar] [CrossRef]
- US FDA. Guidance for industry PAT-A Framework for Innovative Pharmaceutical Development, Manufacturing, and Quality Assurance. Available online: www.fda.gov/downloads/Drugs/Guidances/ucm070305.pdf (accessed on 29 April 2020).
- Duarte, T.M.; Carinhas, N.; Barreiro, L.C.; Carrondo, M.J.; Alves, P.M.; Teixeira, A.P. Metabolic responses of CHO cells to limitation of key amino acids. Biotechnol. Bioeng. 2014, 111, 2095–2106. [Google Scholar] [CrossRef]
- Crowell, C.K.; Grampp, G.E.; Rogers, G.N.; Miller, J.; Scheinman, R.I. Amino acid and manganese supplementation modulates the glycosylation state of erythropoietin in a CHO culture system. Biotechnol. Bioeng. 2007, 96, 538–549. [Google Scholar] [CrossRef]
- Zalai, D.; Hevér, H.; Lovász, K.; Molnár, D.; Wechselberger, P.; Hofer, A.; Párta, L.; Putics, Á.; Herwig, C. A control strategy to investigate the relationship between specific productivity and high-mannose glycoforms in CHO cells. Appl. Microbiol. Biotechnol. 2016, 100, 7011–7024. [Google Scholar] [CrossRef] [Green Version]
- Hofer, A.; Herwig, C. Quantitative determination of nine water-soluble vitamins in the complex matrix of corn steep liquor for raw material quality assessment. J. Chem. Technol. Biotechnol. 2017, 92, 2106–2113. [Google Scholar] [CrossRef]
- Hofer, A.; Hauer, S.; Kroll, P.; Fricke, J.; Herwig, C. In-depth characterization of the raw material corn steep liquor and its bioavailability in bioprocesses of Penicillium chrysogenum. Process Biochem. 2018, 70, 20–28. [Google Scholar] [CrossRef]
- Bhatia, H.; Mehdizadeh, H.; Drapeau, D.; Yoon, S. In-line monitoring of amino acids in mammalian cell cultures using raman spectroscopy and multivariate chemometrics models. Eng. Life Sci. 2018, 18, 55–61. [Google Scholar] [CrossRef] [Green Version]
- Larson, T.M.; Gawlitzek, M.; Evans, H.; Albers, U.; Cacia, J. Chemometric evaluation of on-line high-pressure liquid chromatography in mammalian cell cultures: Analysis of amino acids and glucose. Biotechnol. Bioeng. 2002, 77, 553–563. [Google Scholar] [CrossRef]
- Cimander, C.; Mandenius, C.-F. Online monitoring of a bioprocess based on a multi-analyser system and multivariate statistical process modelling. J. Chem. Technol. Biotechnol. 2002, 77, 1157–1168. [Google Scholar] [CrossRef]
- Van de Merbel, N.C.; Lingeman, H.; Brinkman, U.A. Sampling and analytical strategies in on-line bioprocess monitoring and control. J. Chromatogr. A 1996, 725, 13–27. [Google Scholar] [CrossRef]
- Esmonde-White, K.A.; Cuellar, M.; Uerpmann, C.; Lenain, B.; Lewis, I.R. Raman spectroscopy as a process analytical technology for pharmaceutical manufacturing and bioprocessing. Anal. Bioanal. Chem. 2017, 409, 637–649. [Google Scholar] [CrossRef] [Green Version]
- Lee, H.L.T.; Boccazzi, P.; Gorret, N.; Ram, R.J.; Sinskey, A.J. In situ bioprocess monitoring of Escherichia coli bioreactions using Raman spectroscopy. Vib. Spectrosc. 2004, 35, 131–137. [Google Scholar] [CrossRef]
- Müller, J.; Knop, K.; Wirges, M.; Kleinebudde, P. Validation of Raman spectroscopic procedures in agreement with ICH guideline Q2 with considering the transfer to real time monitoring of an active coating process. J. Pharm. Biomed. Anal. 2010, 53, 884–894. [Google Scholar] [CrossRef]
- Borys, M.C.; Linzer, D.I.H.; Papoutsakis, E.T. Culture pH affects expression rates and glycosylation of recombinant mouse placental lactogen proteins by Chinese hamster ovary (CHO) cells. Biotechnology 1993, 11, 720–724. [Google Scholar] [CrossRef] [PubMed]
- Kim, S.H.; Lee, G.M. Differences in optimal pH and temperature for cell growth and antibody production between two Chinese hamster ovary clones derived from the same parental clone. J. Microbiol. Biotechnol. 2007, 17, 712–720. [Google Scholar] [PubMed]
- Yoon, S.K.; Choi, S.L.; Song, J.Y.; Lee, G.M. Effect of culture pH on erythropoietin production by Chinese hamster ovary cells grown in suspension at 32.5 and 37.0 °C. Biotechnol. Bioeng. 2005, 89, 345–356. [Google Scholar] [CrossRef] [PubMed]
- Franco, R.; Daniela, G.; Fabrizio, M.; Ilaria, G.; Detlev, H. Influence of osmolarity and pH increase to achieve a reduction of monoclonal antibodies aggregates in a production process. Cytotechnology 1999, 29, 11–25. [Google Scholar] [CrossRef] [PubMed]
- Birch, J.R.; Racher, A.J. Antibody production. Adv. Drug. Deliv. 2006, 58, 671–685. [Google Scholar] [CrossRef] [PubMed]
- Kroll, P.; Stelzer, I.V.; Herwig, C. Soft sensor for monitoring biomass subpopulations in mammalian cell culture processes. Biotechnol. Lett. 2017, 39, 1667–1673. [Google Scholar] [CrossRef] [PubMed] [Green Version]
Figure 1.
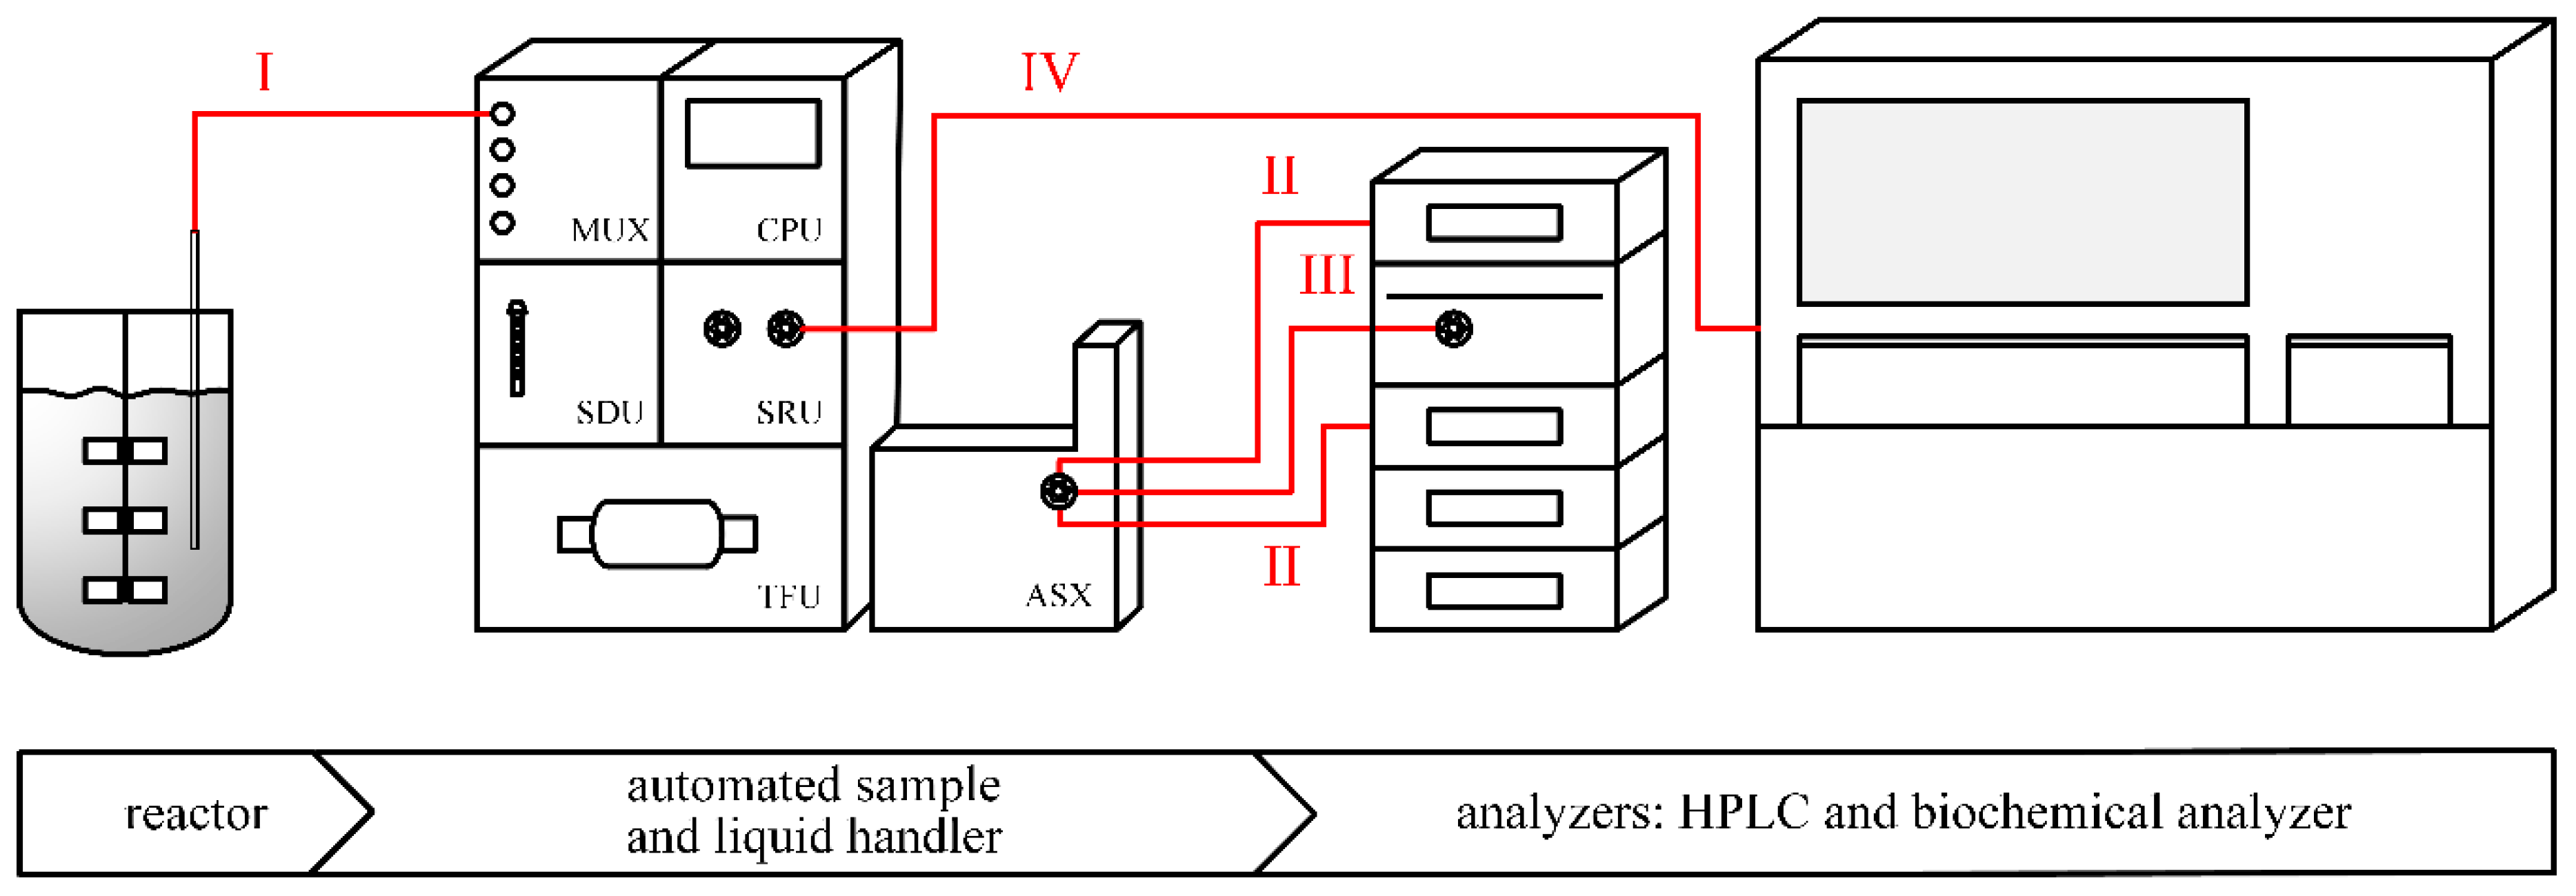
The set-up applied for the experiments consisted of a bioreactor, an automated sampling system (Numera), an HPLC, and a Cedex® Bio HT. The red lines indicate the path of the sample in a very simplified manner. In path I, the sample is drawn from the bioreactor to the sterile barrier of the MUX via an immersion nozzle. According to applied sample processing, the paths in the Numera between the modules can differ, but finally all end in the ASX for sample collection. The injection valve of the ASX can directly connect the HPLC pump and column, hence it can directly inject the sample into the HPLC (path II). If an autosampler is required at the HPLC, both sampler injection valves can be connected and the sample is transferred to the HPLC sampler (path III). A sample for the Cedex® Bio HT is transported from the ASX to the SRU, which is connected with a sample rack of the Bio HT for sampler transfer (path IV).
Figure 1.
The set-up applied for the experiments consisted of a bioreactor, an automated sampling system (Numera), an HPLC, and a Cedex® Bio HT. The red lines indicate the path of the sample in a very simplified manner. In path I, the sample is drawn from the bioreactor to the sterile barrier of the MUX via an immersion nozzle. According to applied sample processing, the paths in the Numera between the modules can differ, but finally all end in the ASX for sample collection. The injection valve of the ASX can directly connect the HPLC pump and column, hence it can directly inject the sample into the HPLC (path II). If an autosampler is required at the HPLC, both sampler injection valves can be connected and the sample is transferred to the HPLC sampler (path III). A sample for the Cedex® Bio HT is transported from the ASX to the SRU, which is connected with a sample rack of the Bio HT for sampler transfer (path IV).

Figure 2.
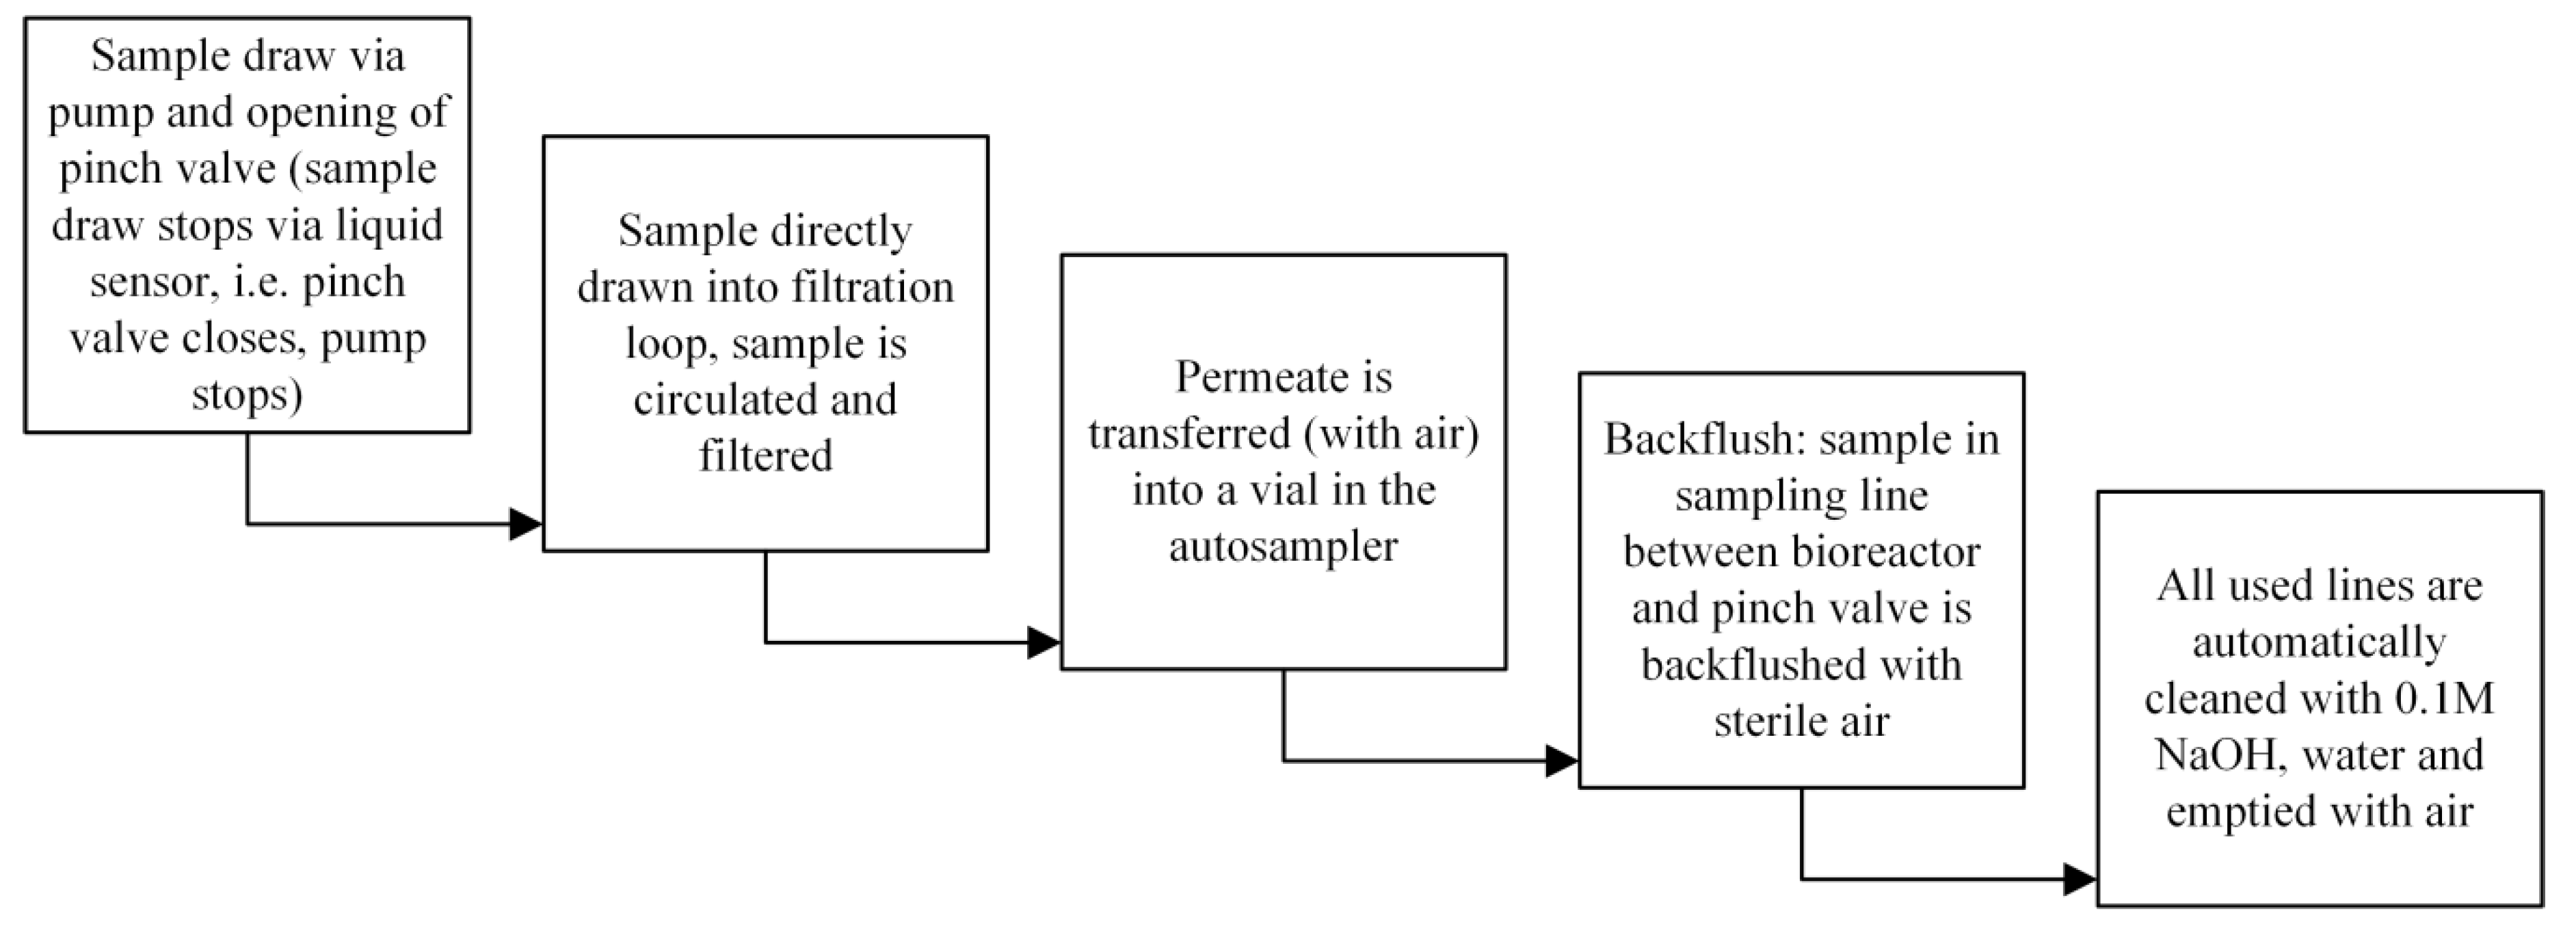
Sampling sequence performed with the system for storage of a cell free sample on the autosampler without dilution. Samples were then transferred via the injection valve on the autosampler to the HPLC or the samples were transferred via a pump on the routing module to the Bio HT.
Figure 2.
Sampling sequence performed with the system for storage of a cell free sample on the autosampler without dilution. Samples were then transferred via the injection valve on the autosampler to the HPLC or the samples were transferred via a pump on the routing module to the Bio HT.

Figure 3.
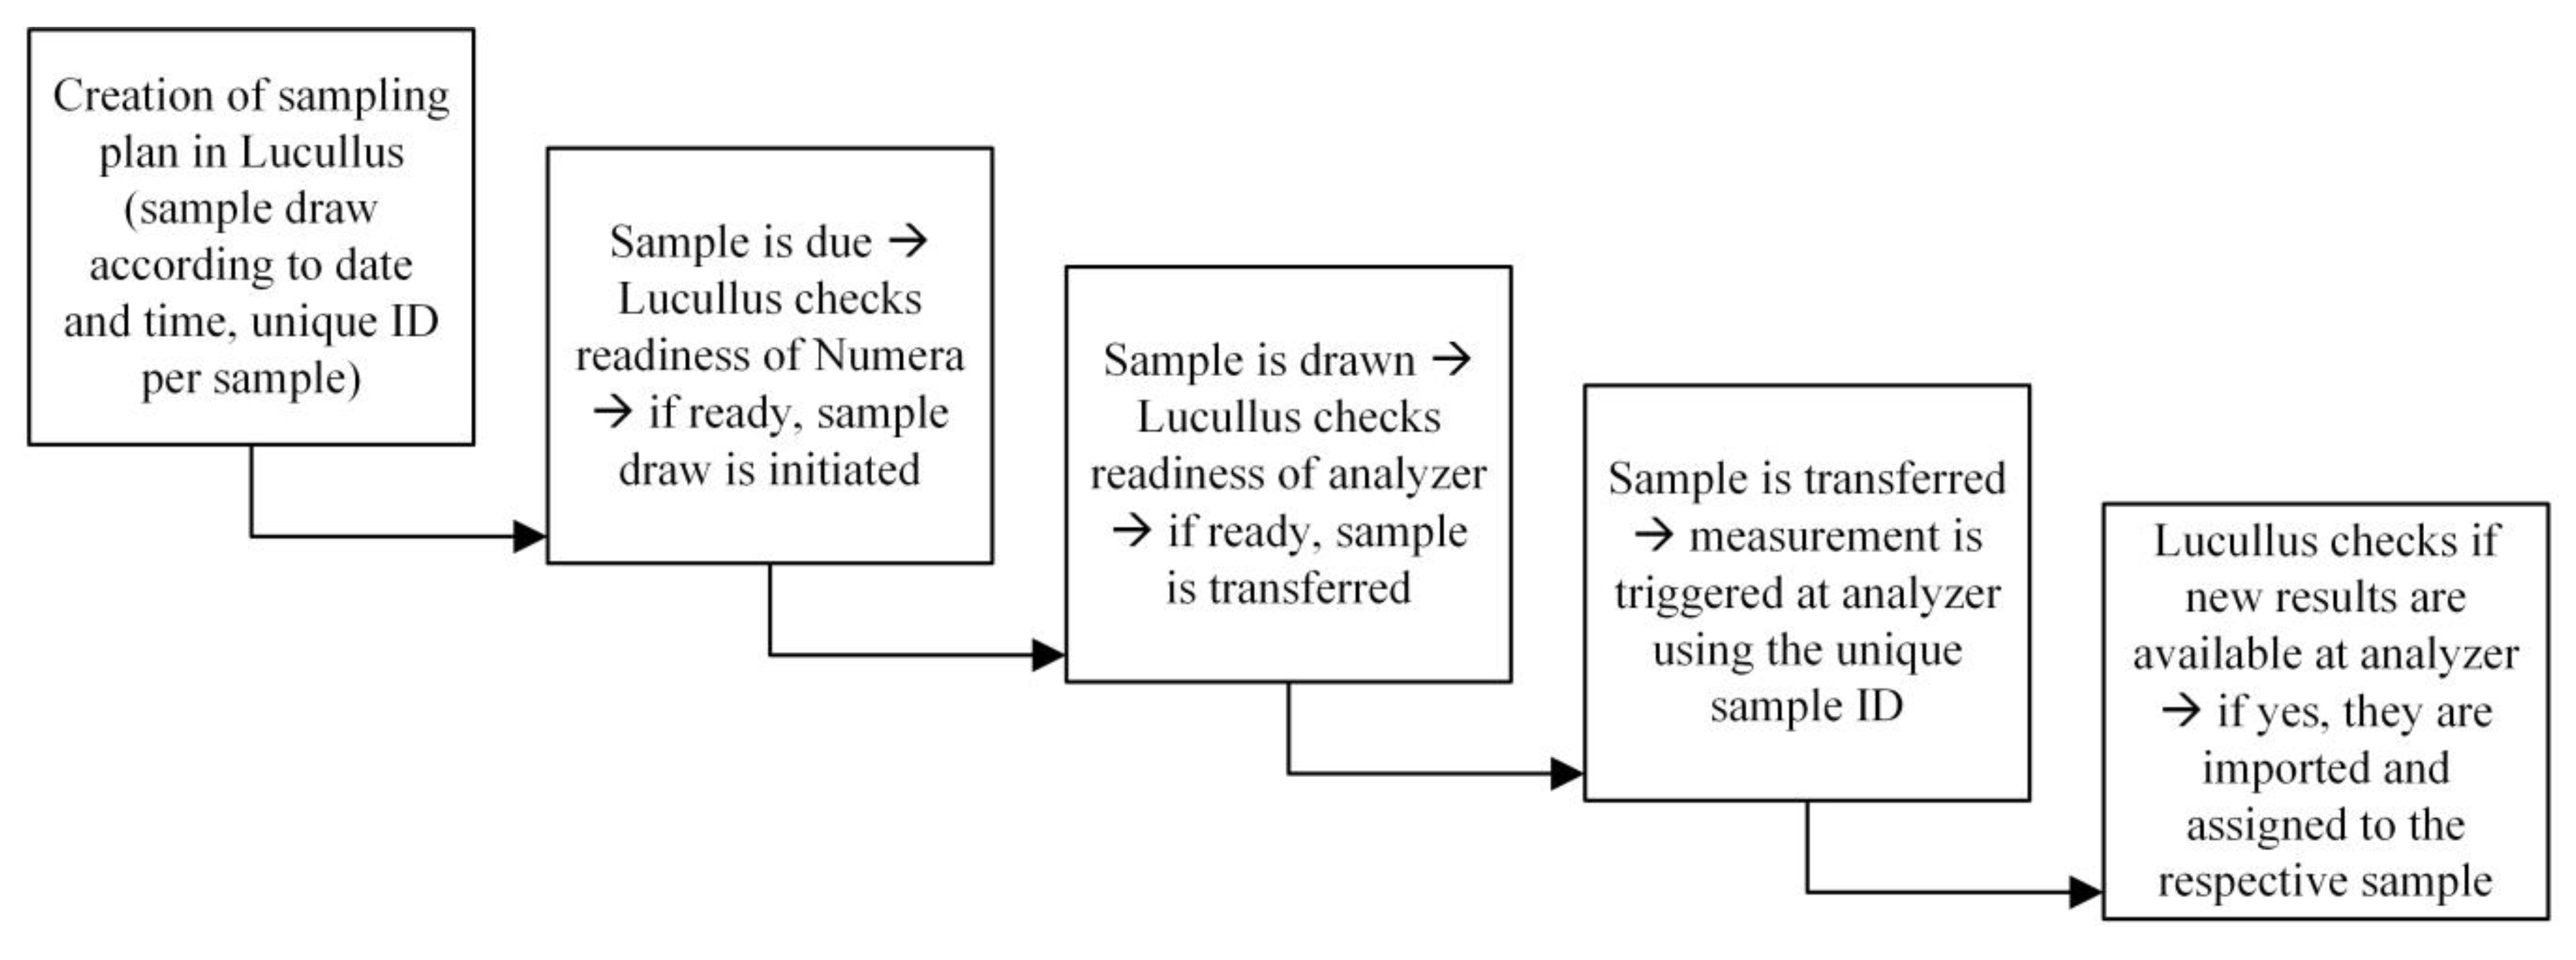
Coordination of the sampling procedure performed by the software Lucullus PIMS.

Figure 4.
The automated sampling system was assessed for accuracy and precision. (Plot A) shows a high accuracy if the systematic error of the occurring sample dilution is considered. This can be achieved by calculating the actual value with a dilution factor or by calibrating the analytical device via the automated sampler. (Plot B) illustrates the precision of the measurement after processing the sample with the Numera system with a relative standard deviation of 1%. Additionally, all measurements are located within a 2% interval around the true value.

Figure 5.
The coefficient plot (a) of the Partial Least Squares (PLS) regression shows the correlation of the different washing procedures on the precision of the derivatization method. The air draw before addition of the next reagent as well as an interaction term of needle wash and air draw show a negative correlation, i.e., these washing procedures result in a higher precision of the method. The underlying model has an R2 of 0.962 and a Q2 of 0.477. The coefficient plot (b) shows the correlation with the method accuracy. Only needle wash shows a significant negative correlation, i.e., a positive impact on accuracy. The underlying model has an R2 of 0.590 and a Q2 of −0.200.

Figure 6.
Evaluation of the error of the automated sampling system taking into account the sample draw, filtration, and transfer to the HPLC autosampler. Six standard concentrations of asparagine were analyzed with the developed amino acid derivatization method. The samples were once transferred to the HPLC via Numera (black upside-down triangles) and once injected directly from the HPLC autosampler (grey circles). Comparing the slopes, we receive an error of 4.5% resulting from the transfer and filtration (HPLC slope = 0.9926; Numera + HPLC slope = 0.9475).

Figure 7.
Examples of amino acid concentrations monitored in an automated manner during a CHO cultivation. Plot (A) shows the asparagine concentrations received when sampled once per day; plot (B) when sampled 8 times per day. High-frequency sampling allows better interpretation of the underlying uptake kinetics. Plot (C) shows glycine over time and plot (D) tyrosine over time, which was fed.

Figure 8.
The required POT of the Numera filtration in dependency of the VCC in order to obtain 1.2 mL filtered culture supernatant was assessed experimentally. The linear relationship allows adaptation of the POT during the process to keep the received sample volume constant.
Figure 8.
The required POT of the Numera filtration in dependency of the VCC in order to obtain 1.2 mL filtered culture supernatant was assessed experimentally. The linear relationship allows adaptation of the POT during the process to keep the received sample volume constant.

Figure 9.
On-line monitoring of substrates and metabolite in a CHO batch process. Plot (A) shows the time course of glucose and lactate in the first 70 h of the process with a sampling interval of 2 h. Plot (B) shows glucose and glutamine reducing the sampling interval to the minimum of 30 min for 24 h (between 92 h and 116 h of process time).

Table 1.
Parameters of the correlations between off-line and on-line measured samples, (i) applying common calibration of the HPLC, (ii) processing calibration standards via Numera or (iii) adjusting the analytical result by multiplying with the calculated DF.
Table 1.
Parameters of the correlations between off-line and on-line measured samples, (i) applying common calibration of the HPLC, (ii) processing calibration standards via Numera or (iii) adjusting the analytical result by multiplying with the calculated DF.
| Correlation | Slope | Offset | Confidence Interval Slope (95%) | R2 |
|---|---|---|---|---|
| Off-line vs on-line | 0.8409 | 0.0056 | 0.8216–0.8602 | 0.9981 |
| Off-line vs on-line calibrated via Numera | 0.9696 | 0.0133 | 0.9474–0.9918 | 0.9981 |
| Off-line vs on-line considering DF | 0.9973 | 0.0067 | 0.9745–1.0202 | 0.9981 |
Table 2.
Comparison of the cv (root mean square error (RMSE)) for four amino acids, with regard to the standard HPLC reference method, the automated sampling with on-line HPLC, and Raman spectroscopy [14].
Table 2.
Comparison of the cv (root mean square error (RMSE)) for four amino acids, with regard to the standard HPLC reference method, the automated sampling with on-line HPLC, and Raman spectroscopy [14].
| Reference Method (HPLC) | Automated Sampling and On-Line HPLC | Raman Spectroscopy | |
|---|---|---|---|
| cv(RMSE) [-] | cv(RMSE) [-] | cv(RMSE) [-] | |
| Tyrosine | 0.012 | 0.058 | 0.53 * |
| Tryptophan | 0.020 | 0.066 | 0.27 * |
| Phenylalanine | 0.016 | 0.062 | 0.47 * |
| Methionine | 0.025 | 0.071 | 0.29 * |
* cv(RMSE) taken from [14].
© 2020 by the authors. Licensee MDPI, Basel, Switzerland. This article is an open access article distributed under the terms and conditions of the Creative Commons Attribution (CC BY) license (http://creativecommons.org/licenses/by/4.0/).
Share and Cite
MDPI and ACS Style
Hofer, A.; Kroll, P.; Barmettler, M.; Herwig, C. A Reliable Automated Sampling System for On-Line and Real-Time Monitoring of CHO Cultures. Processes 2020, 8, 637. https://doi.org/10.3390/pr8060637
AMA Style
Hofer A, Kroll P, Barmettler M, Herwig C. A Reliable Automated Sampling System for On-Line and Real-Time Monitoring of CHO Cultures. Processes. 2020; 8(6):637. https://doi.org/10.3390/pr8060637
Chicago/Turabian StyleHofer, Alexandra, Paul Kroll, Matthias Barmettler, and Christoph Herwig. 2020. "A Reliable Automated Sampling System for On-Line and Real-Time Monitoring of CHO Cultures" Processes 8, no. 6: 637. https://doi.org/10.3390/pr8060637
Note that from the first issue of 2016, this journal uses article numbers instead of page numbers. See further details here.