Utilization of Geodetic Methods Results in Small Open-Pit Mine Conditions: A Case Study from Slovakia

 , , , and
Abstract
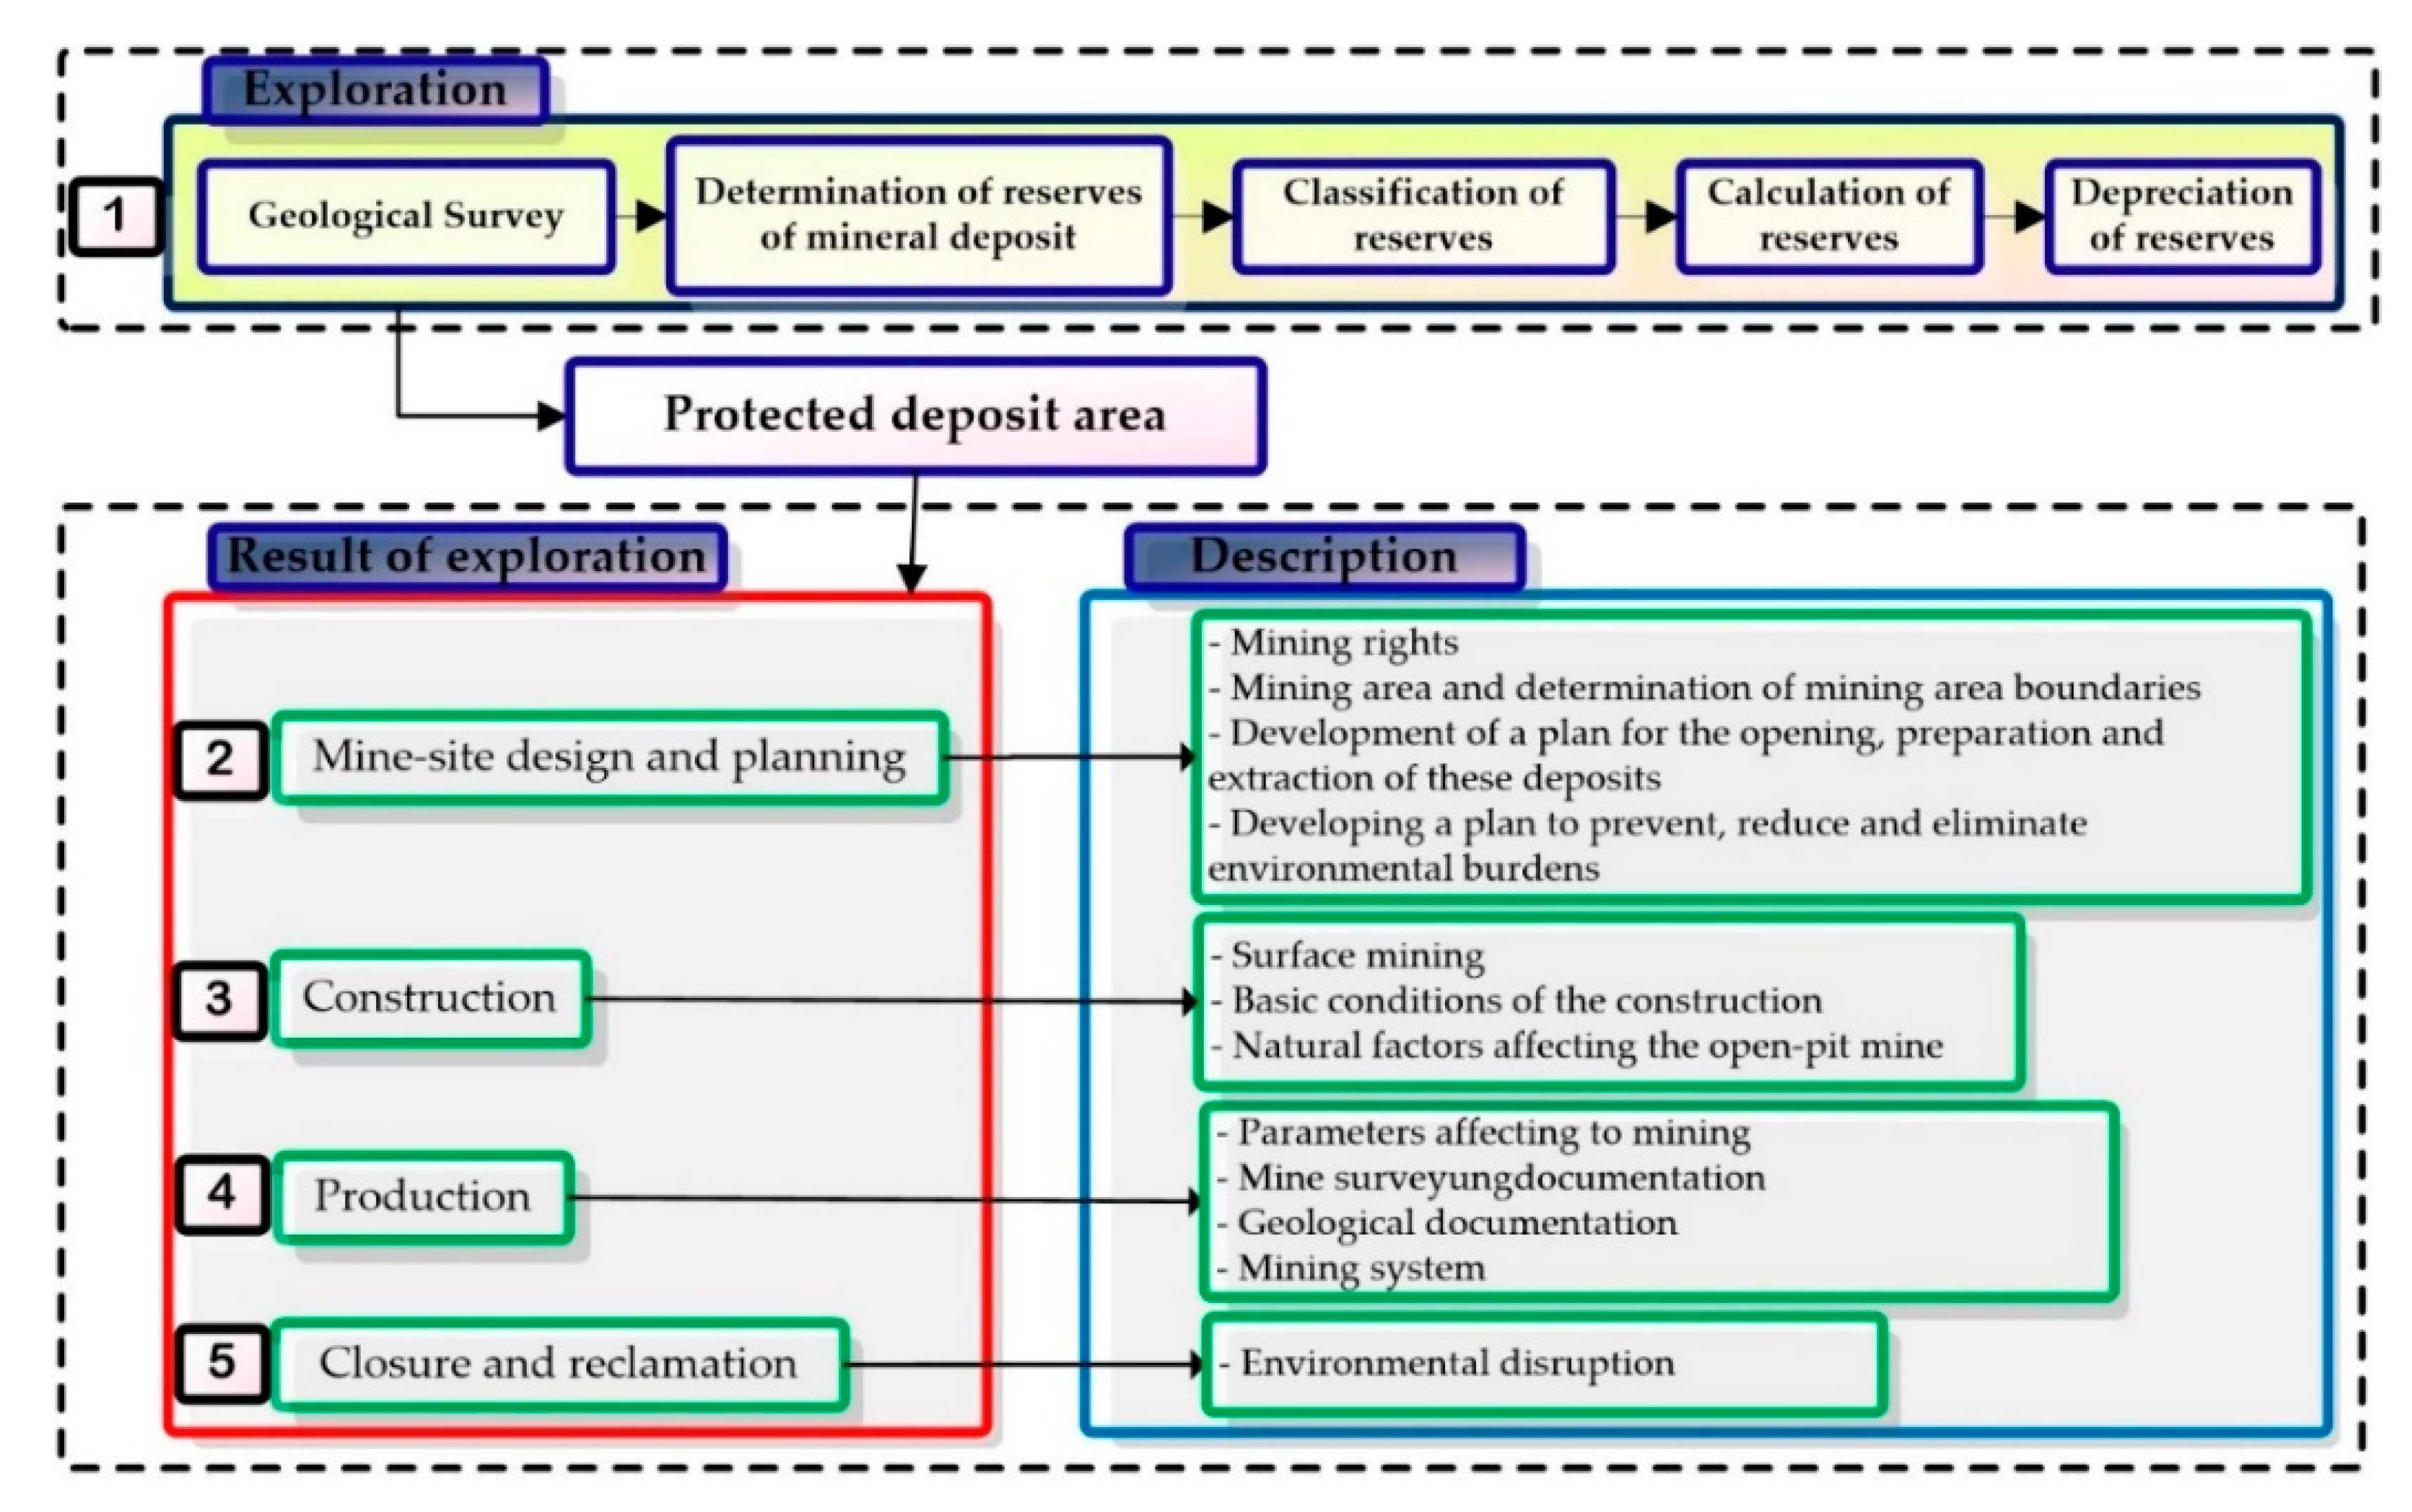
:1. Introduction
- static method (not absolute positioning) that uses long observation (only among tens of minutes or a few hours) with accuracy in a horizontal position is mp = ± 3 + 0.5·b ppm [mm] and in the vertical position, it is mh = ± 5 + 0.5·b ppm [mm] (where parameter b is the distance of the baseline measurement expressed in km),
- real-time network (RTN) relative positioning, where the rover has built-in software that instantly processes collected information from a permanent station and satellites. It is a relative positioning of points to the permanent station. The accuracy achieved in determining the horizontal position is mp = ± 8 + 0.5·b ppm [mm] and in the vertical position, it is mh = ± 15 + 0.5·b ppm [mm] (where parameter b is the distance between the rover and the reference station expressed in km).
2. Materials and Methods
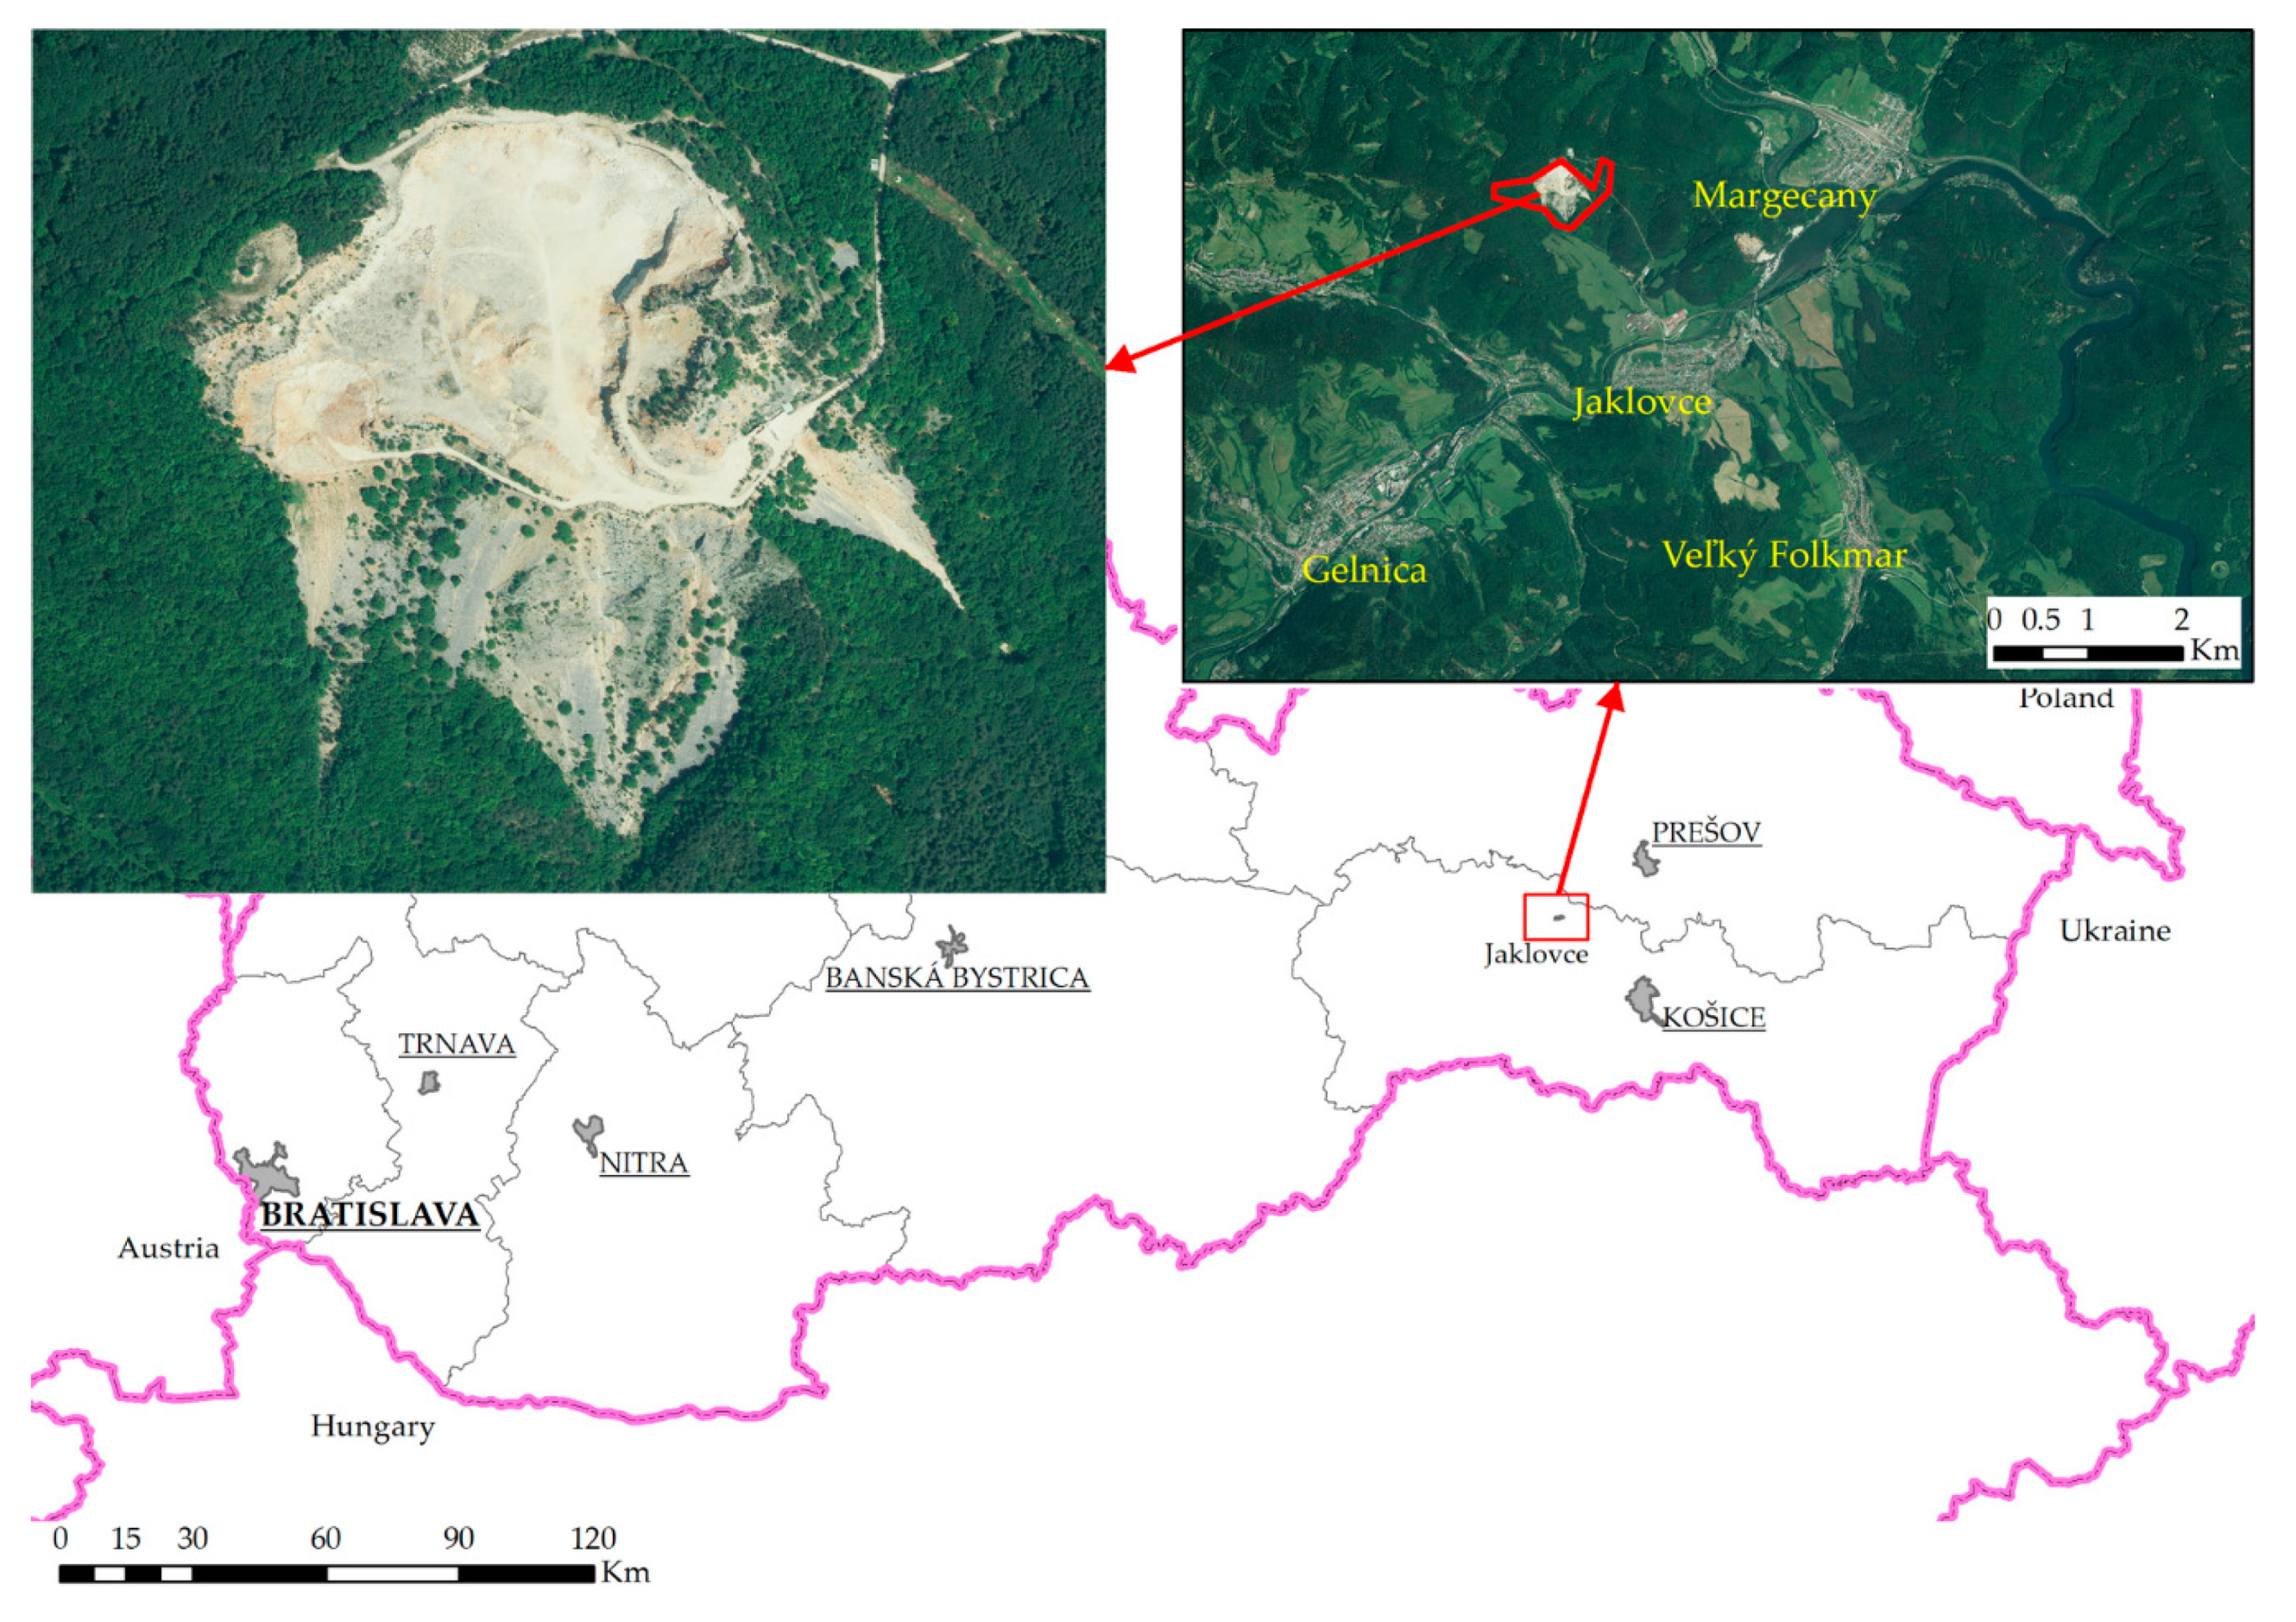
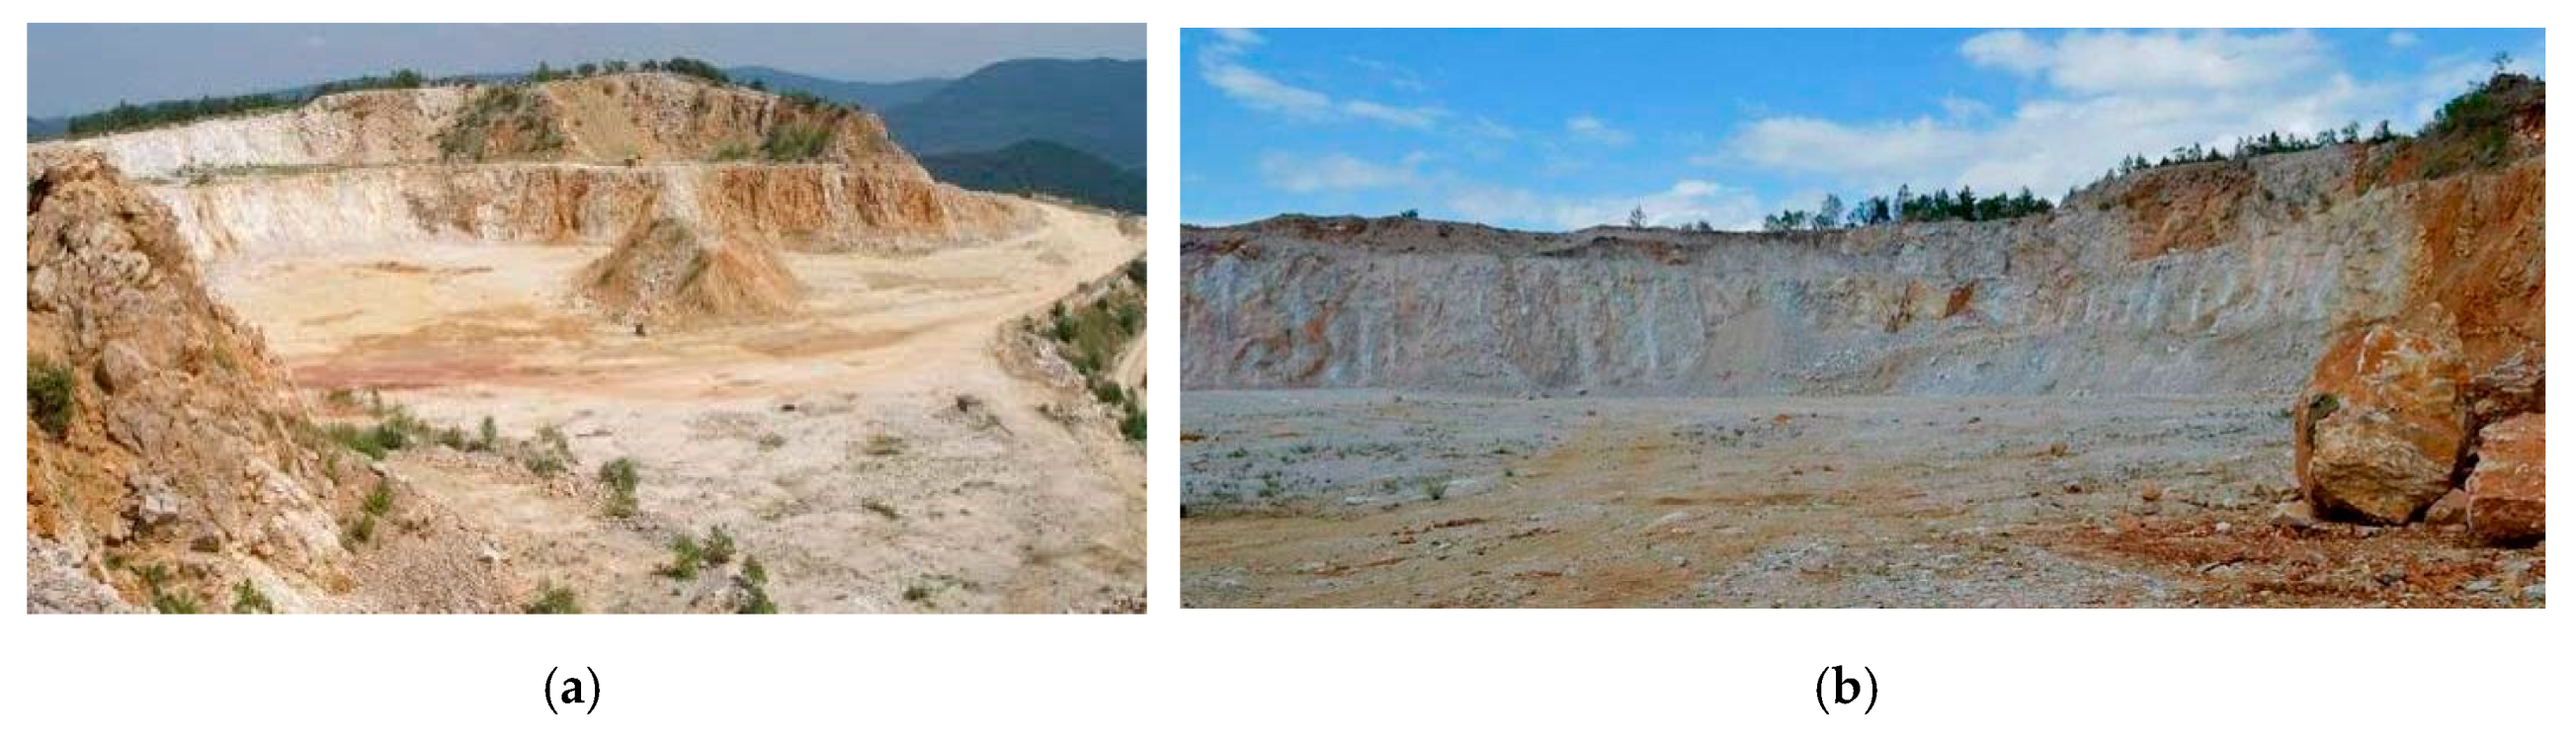
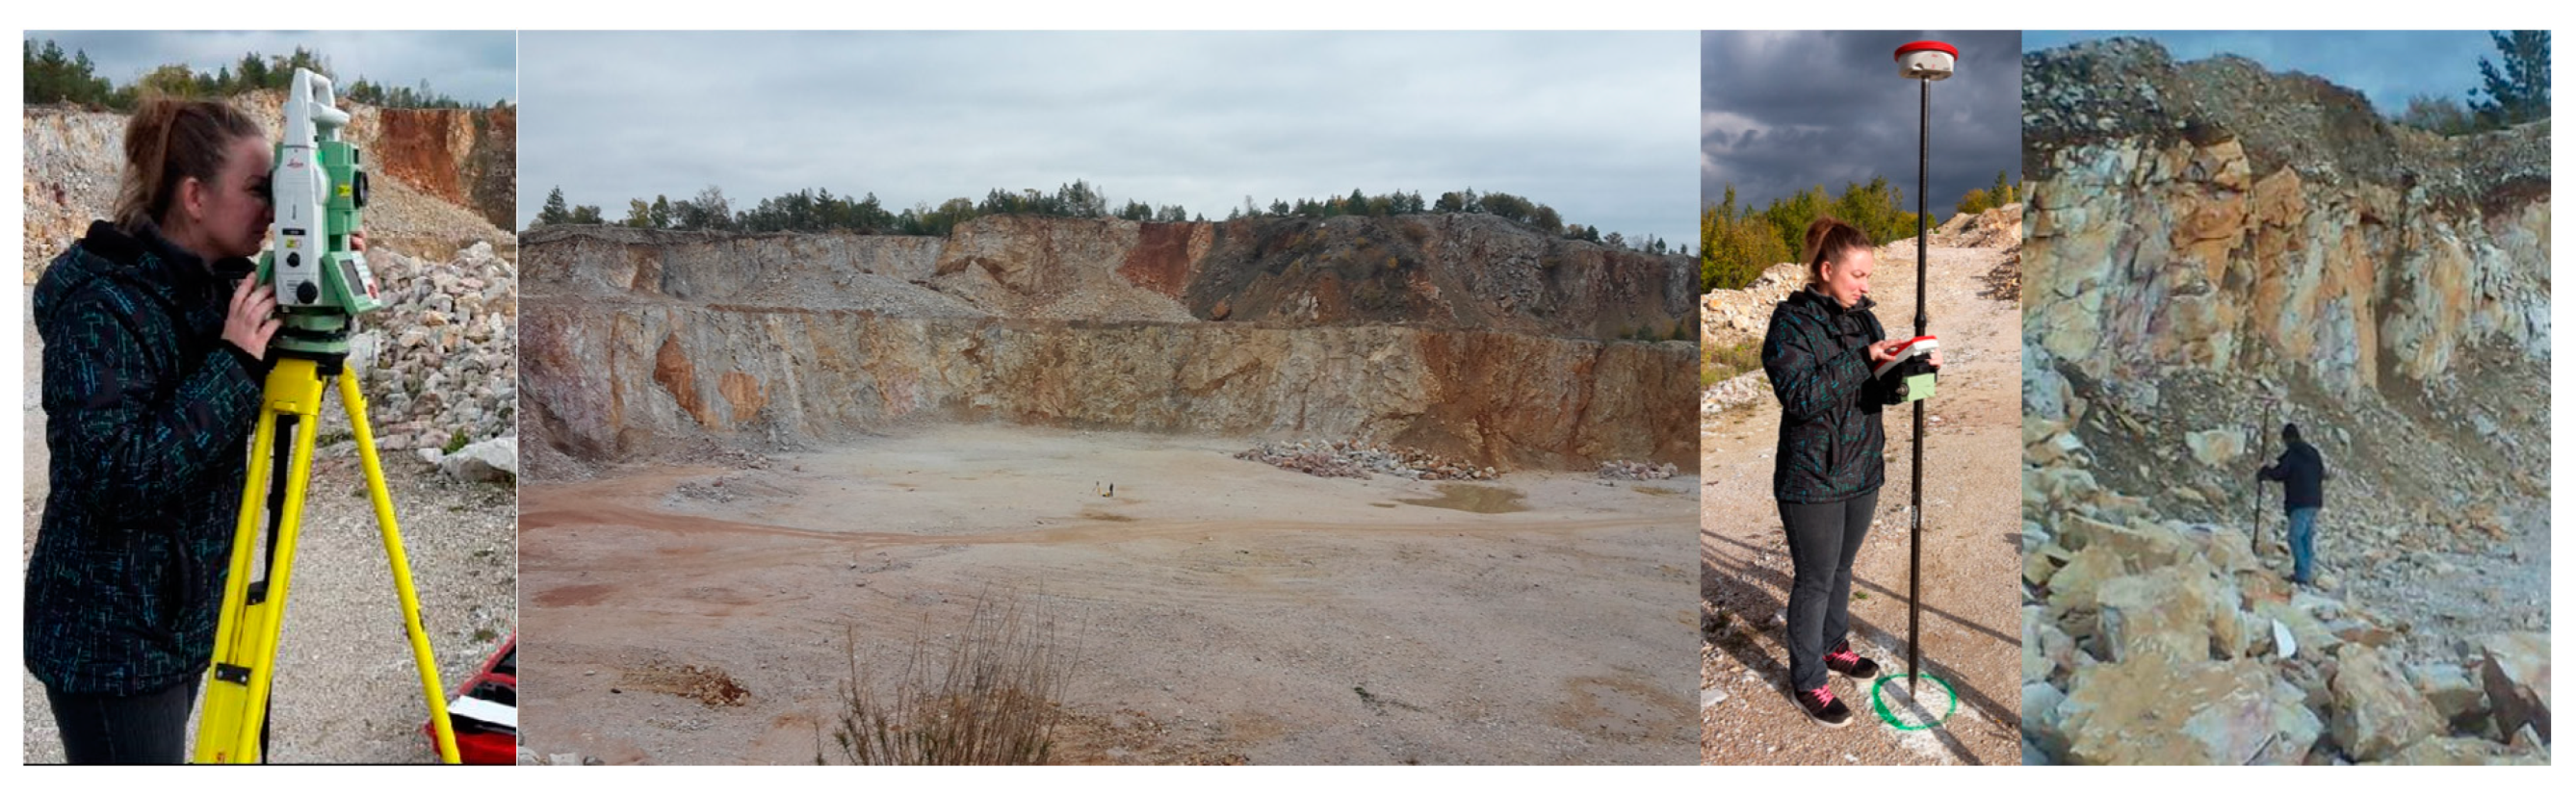
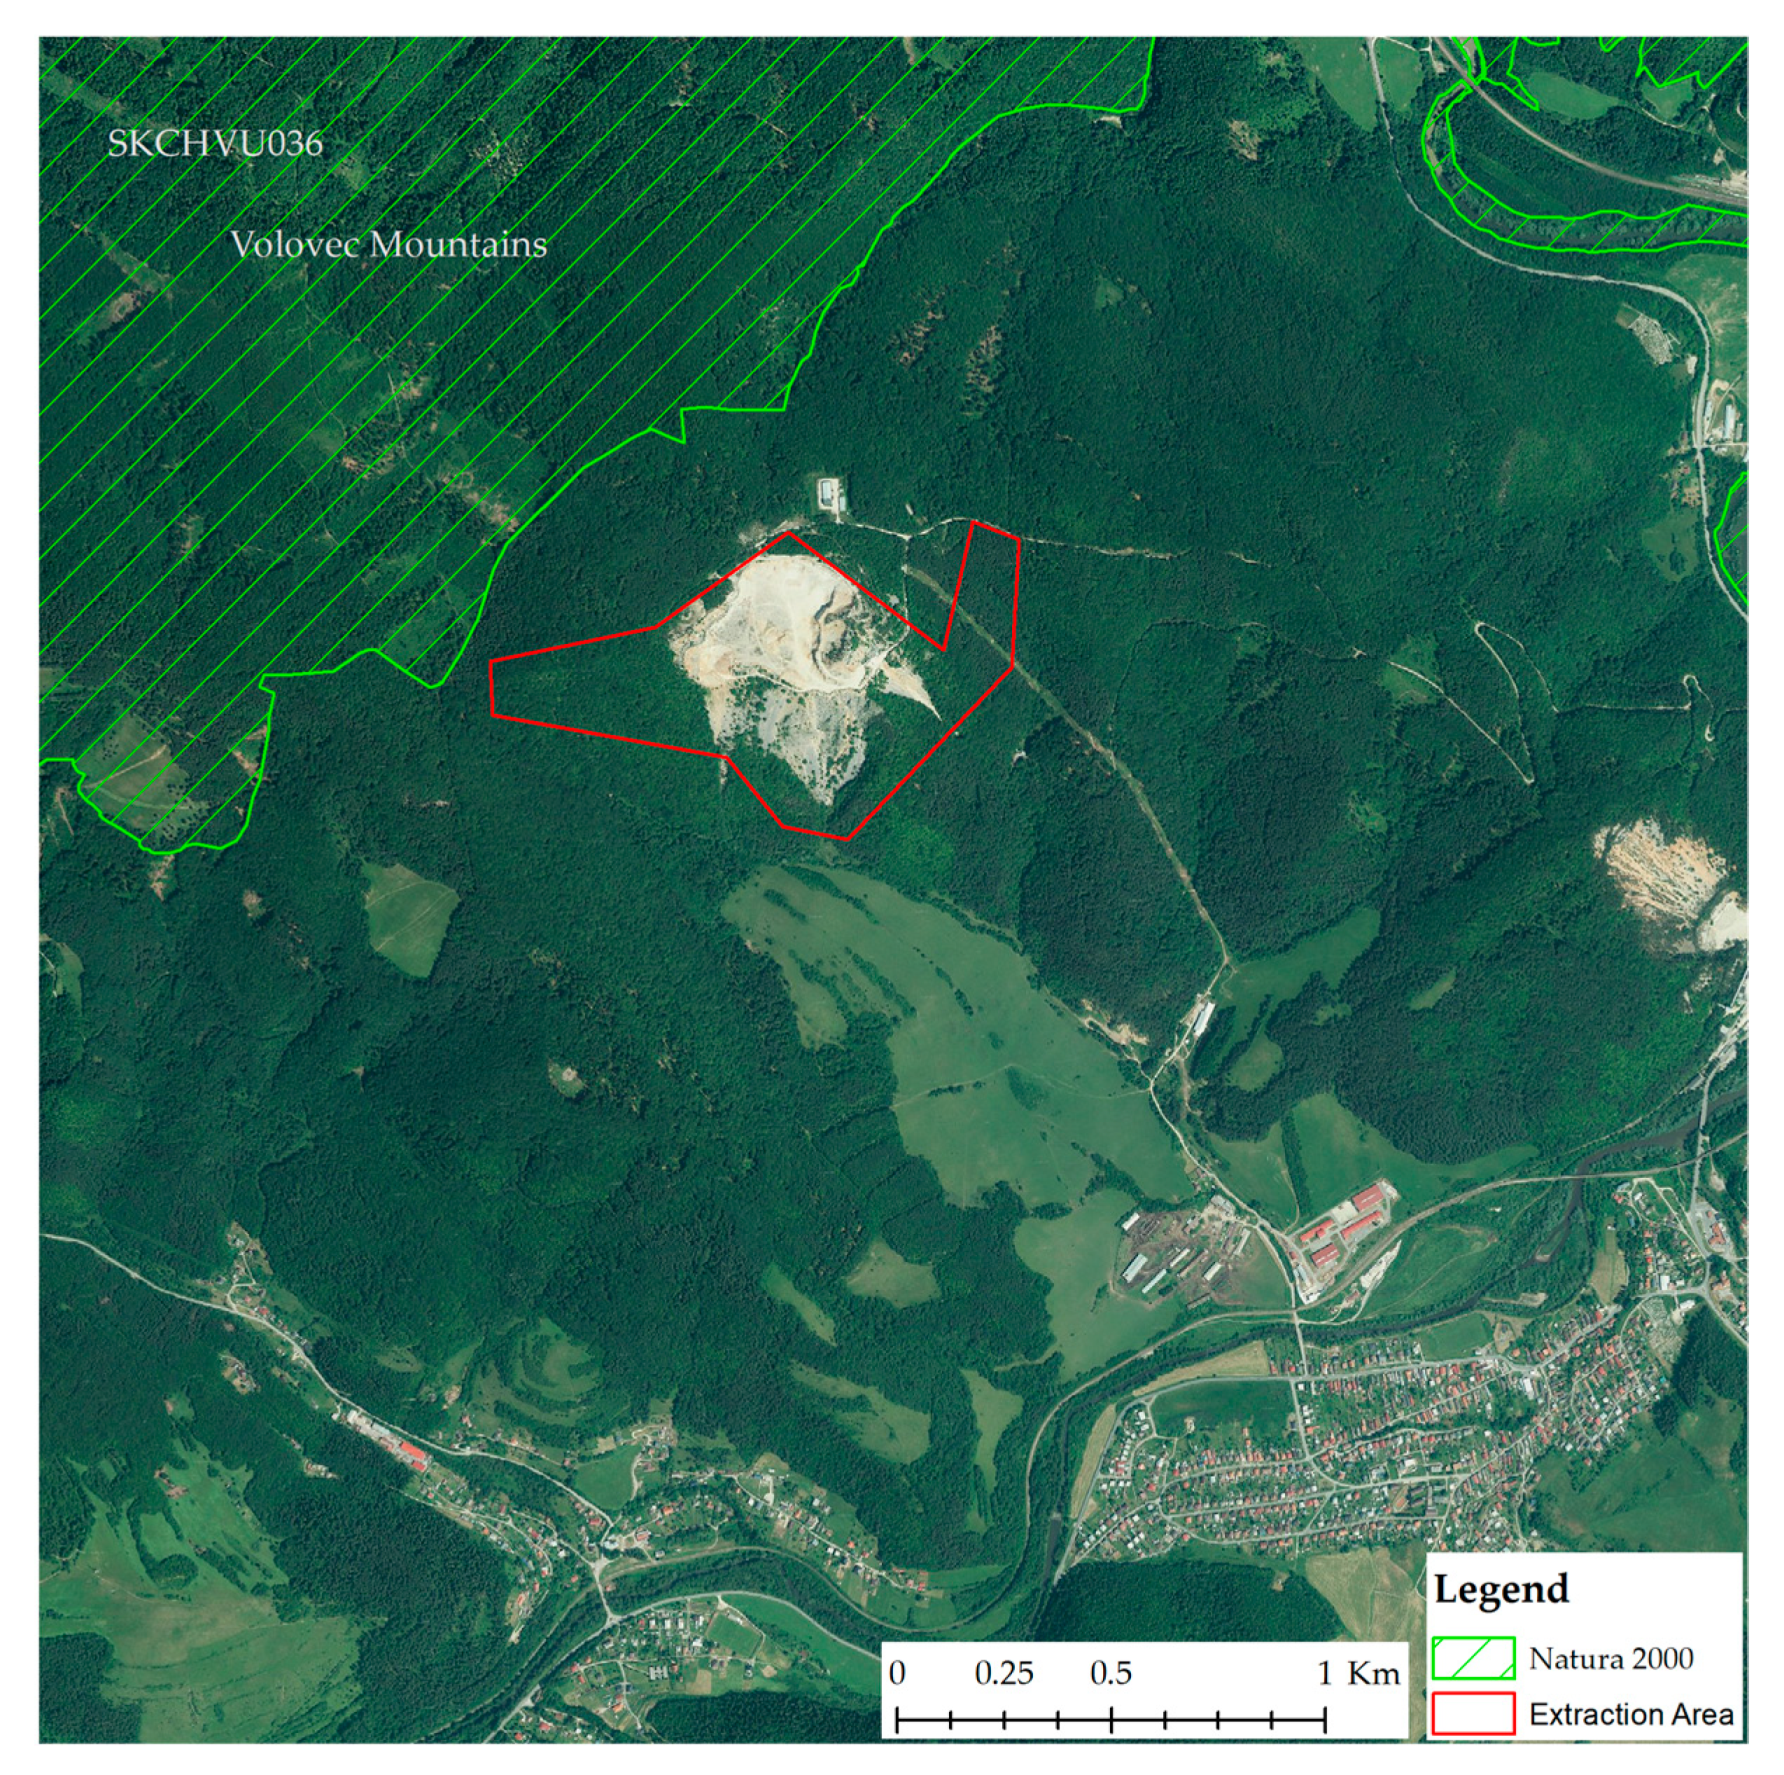
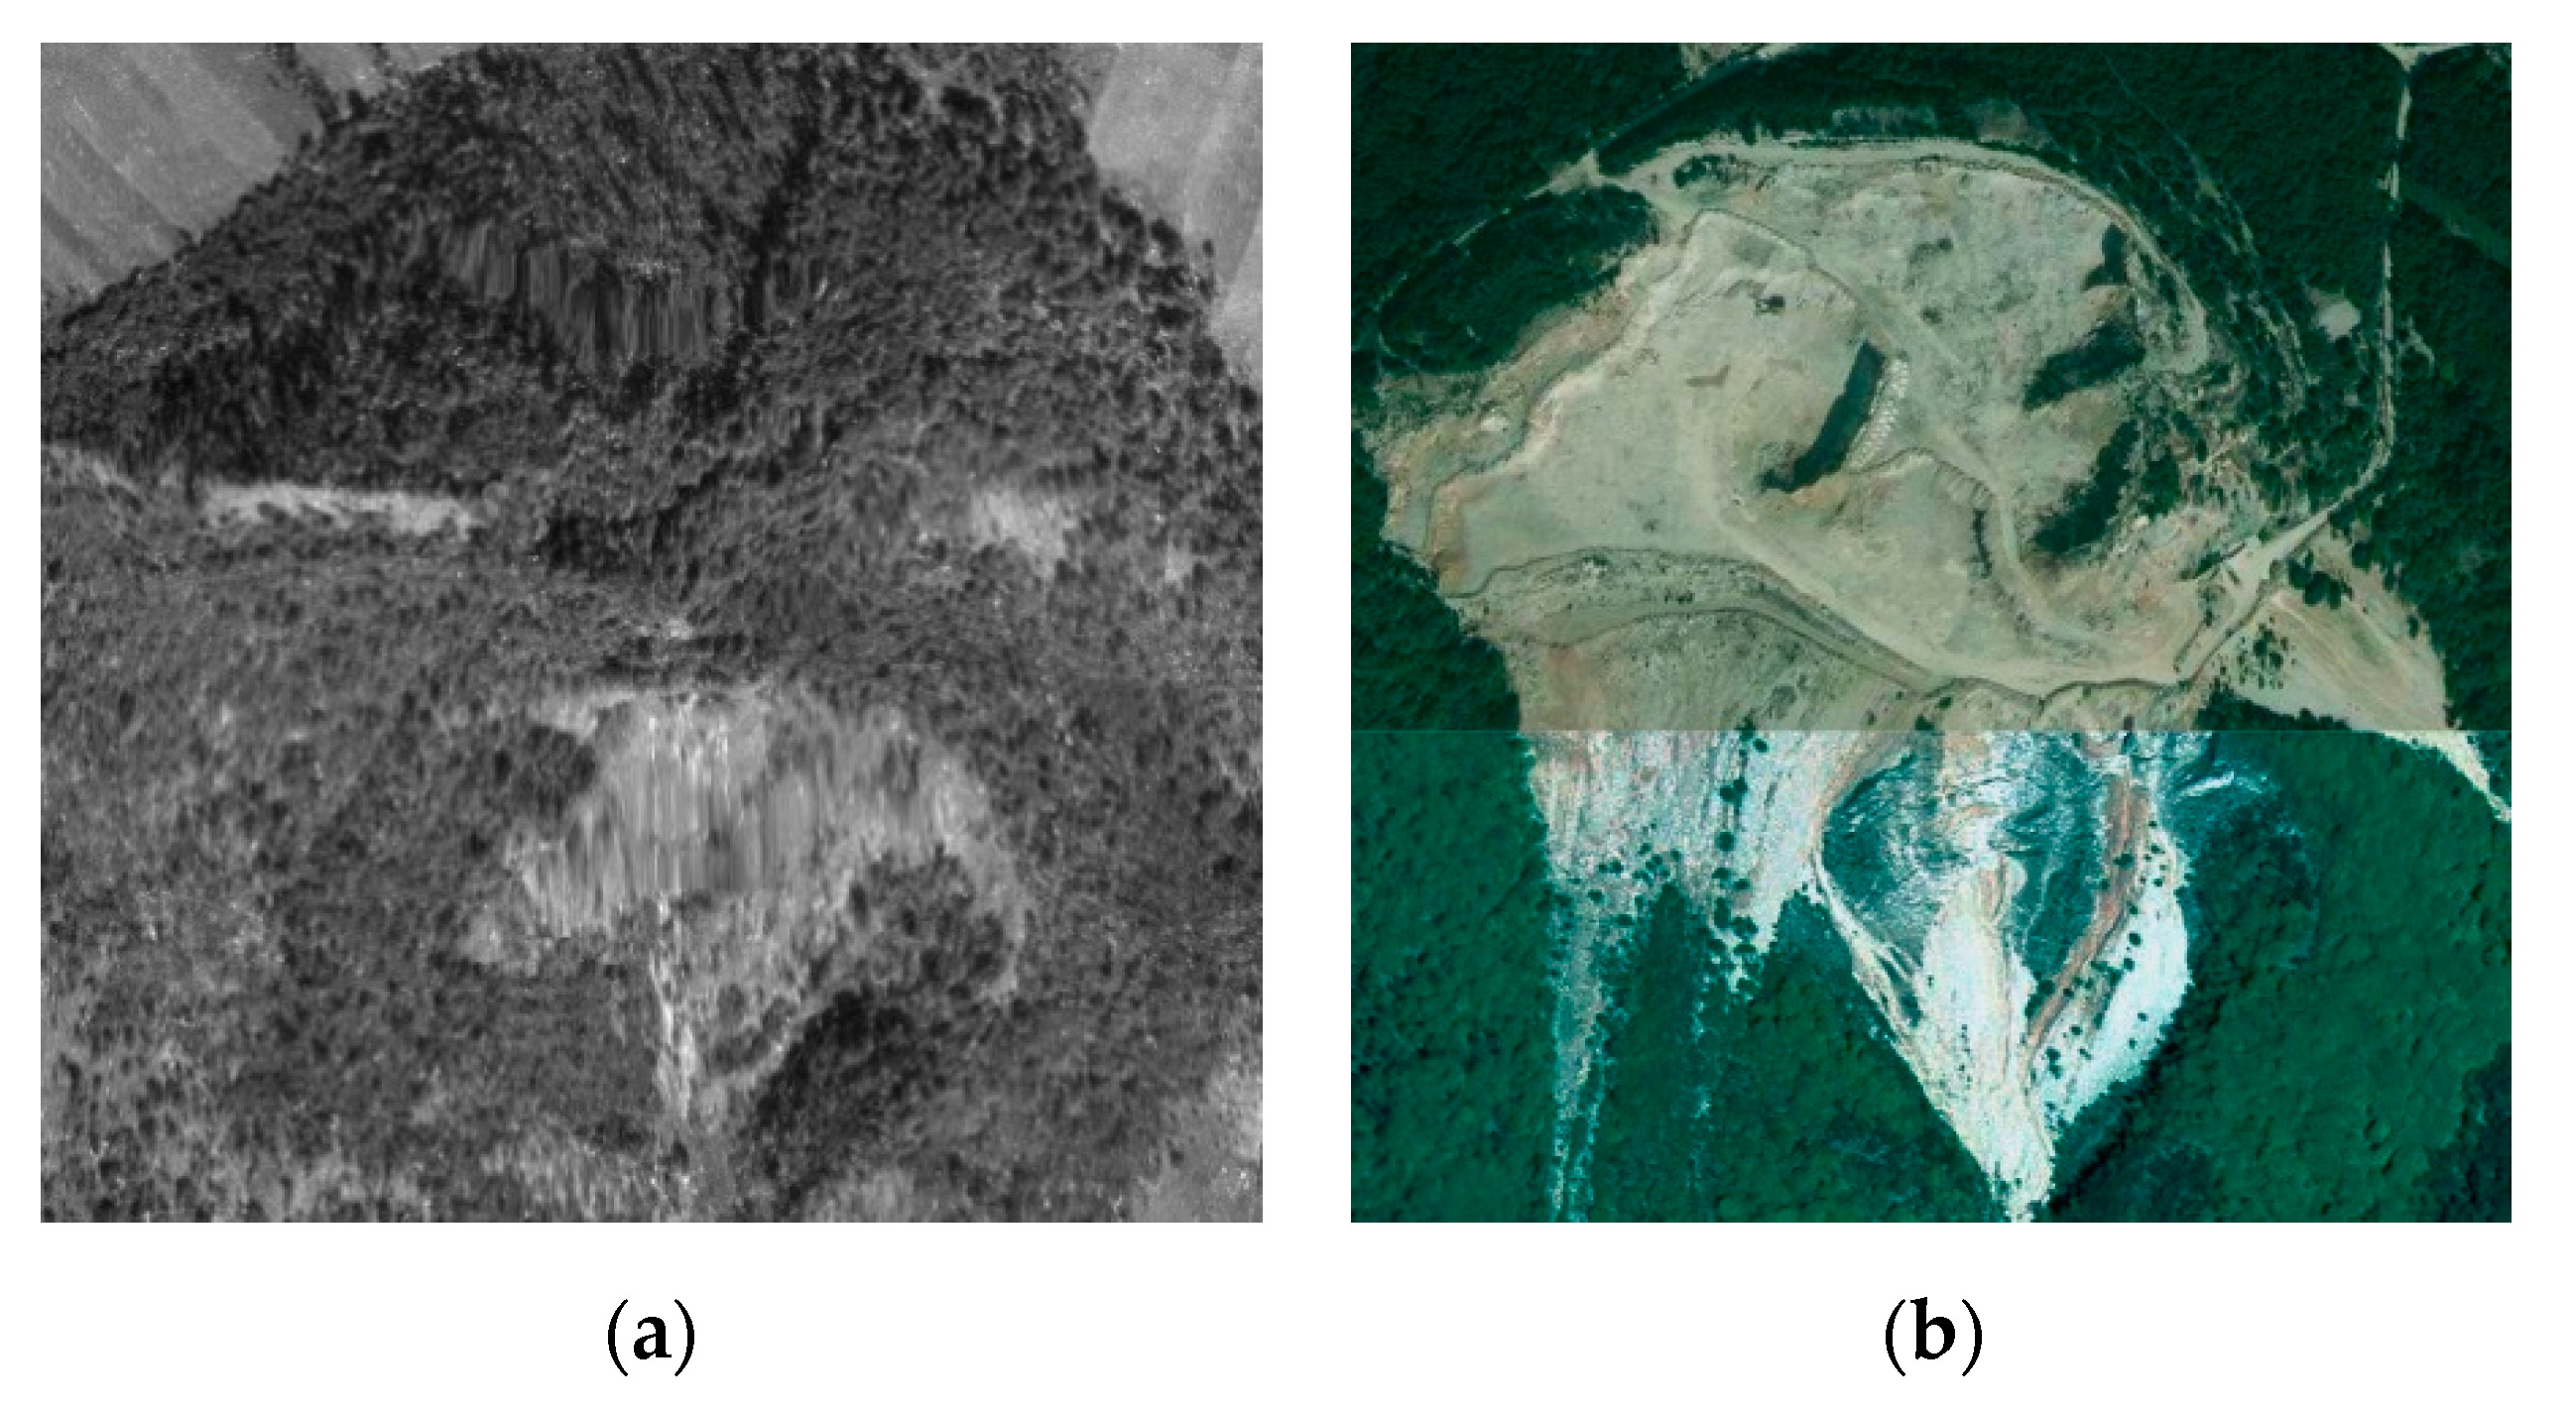
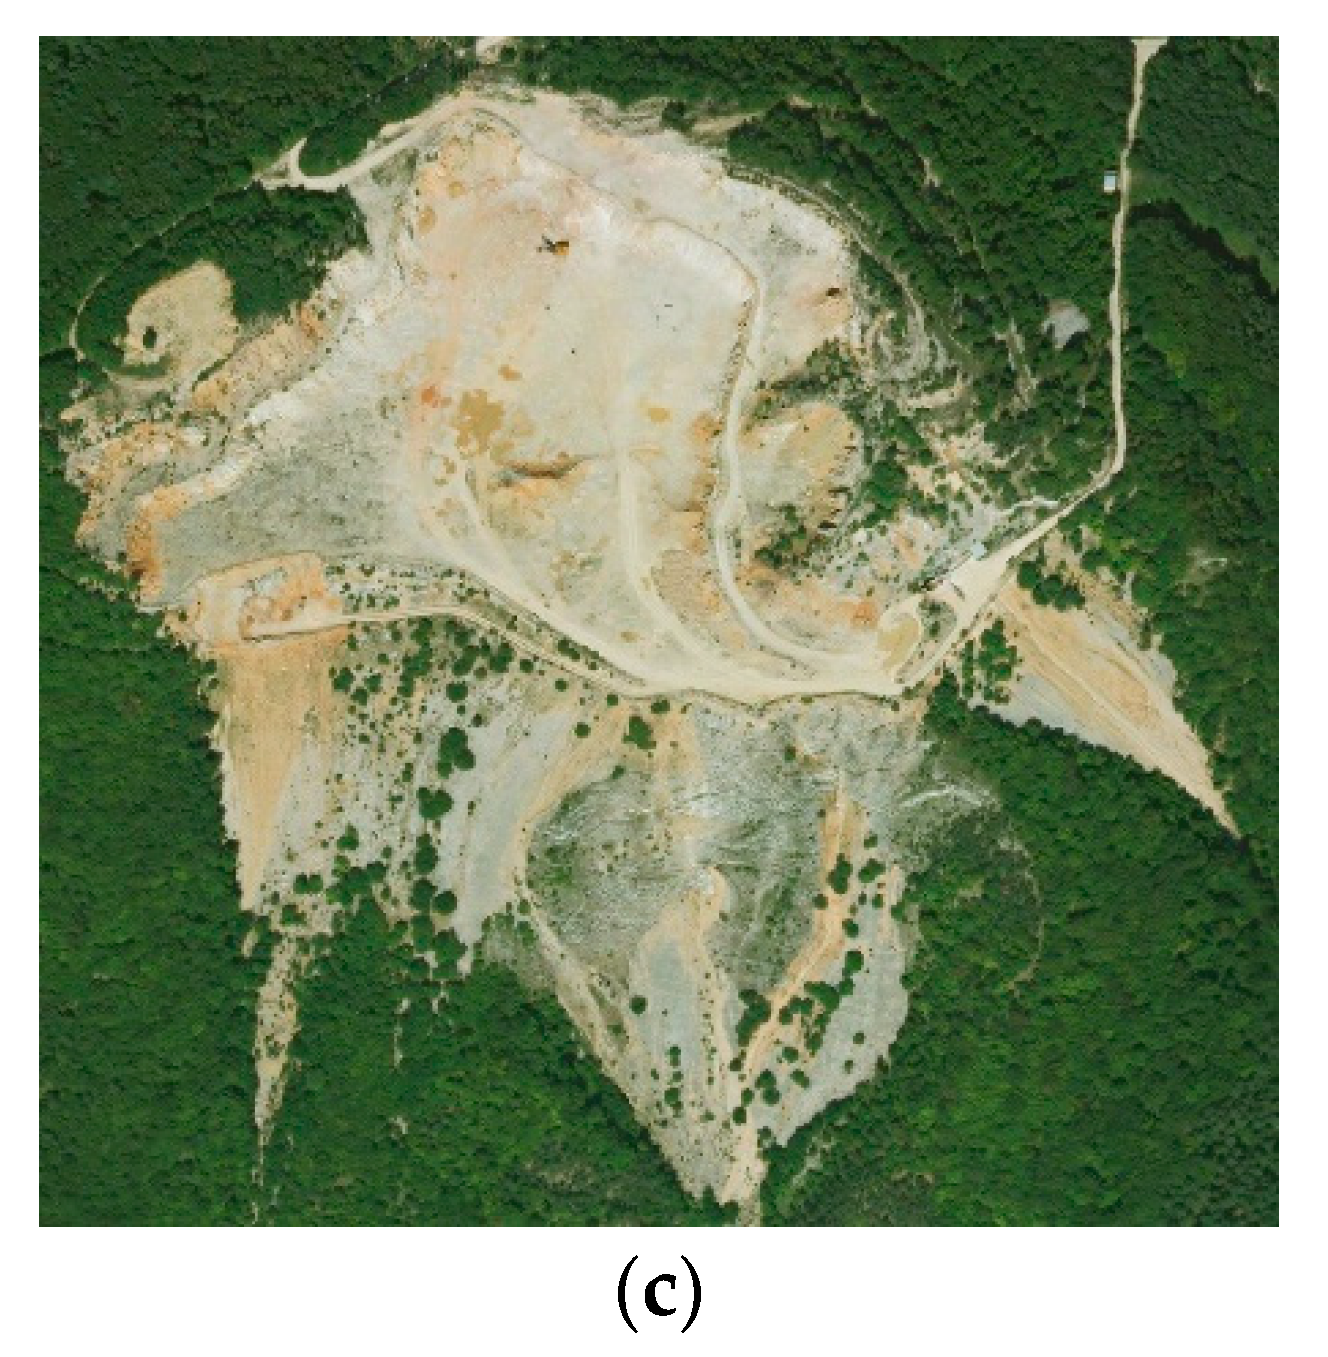
2.1. Study Area
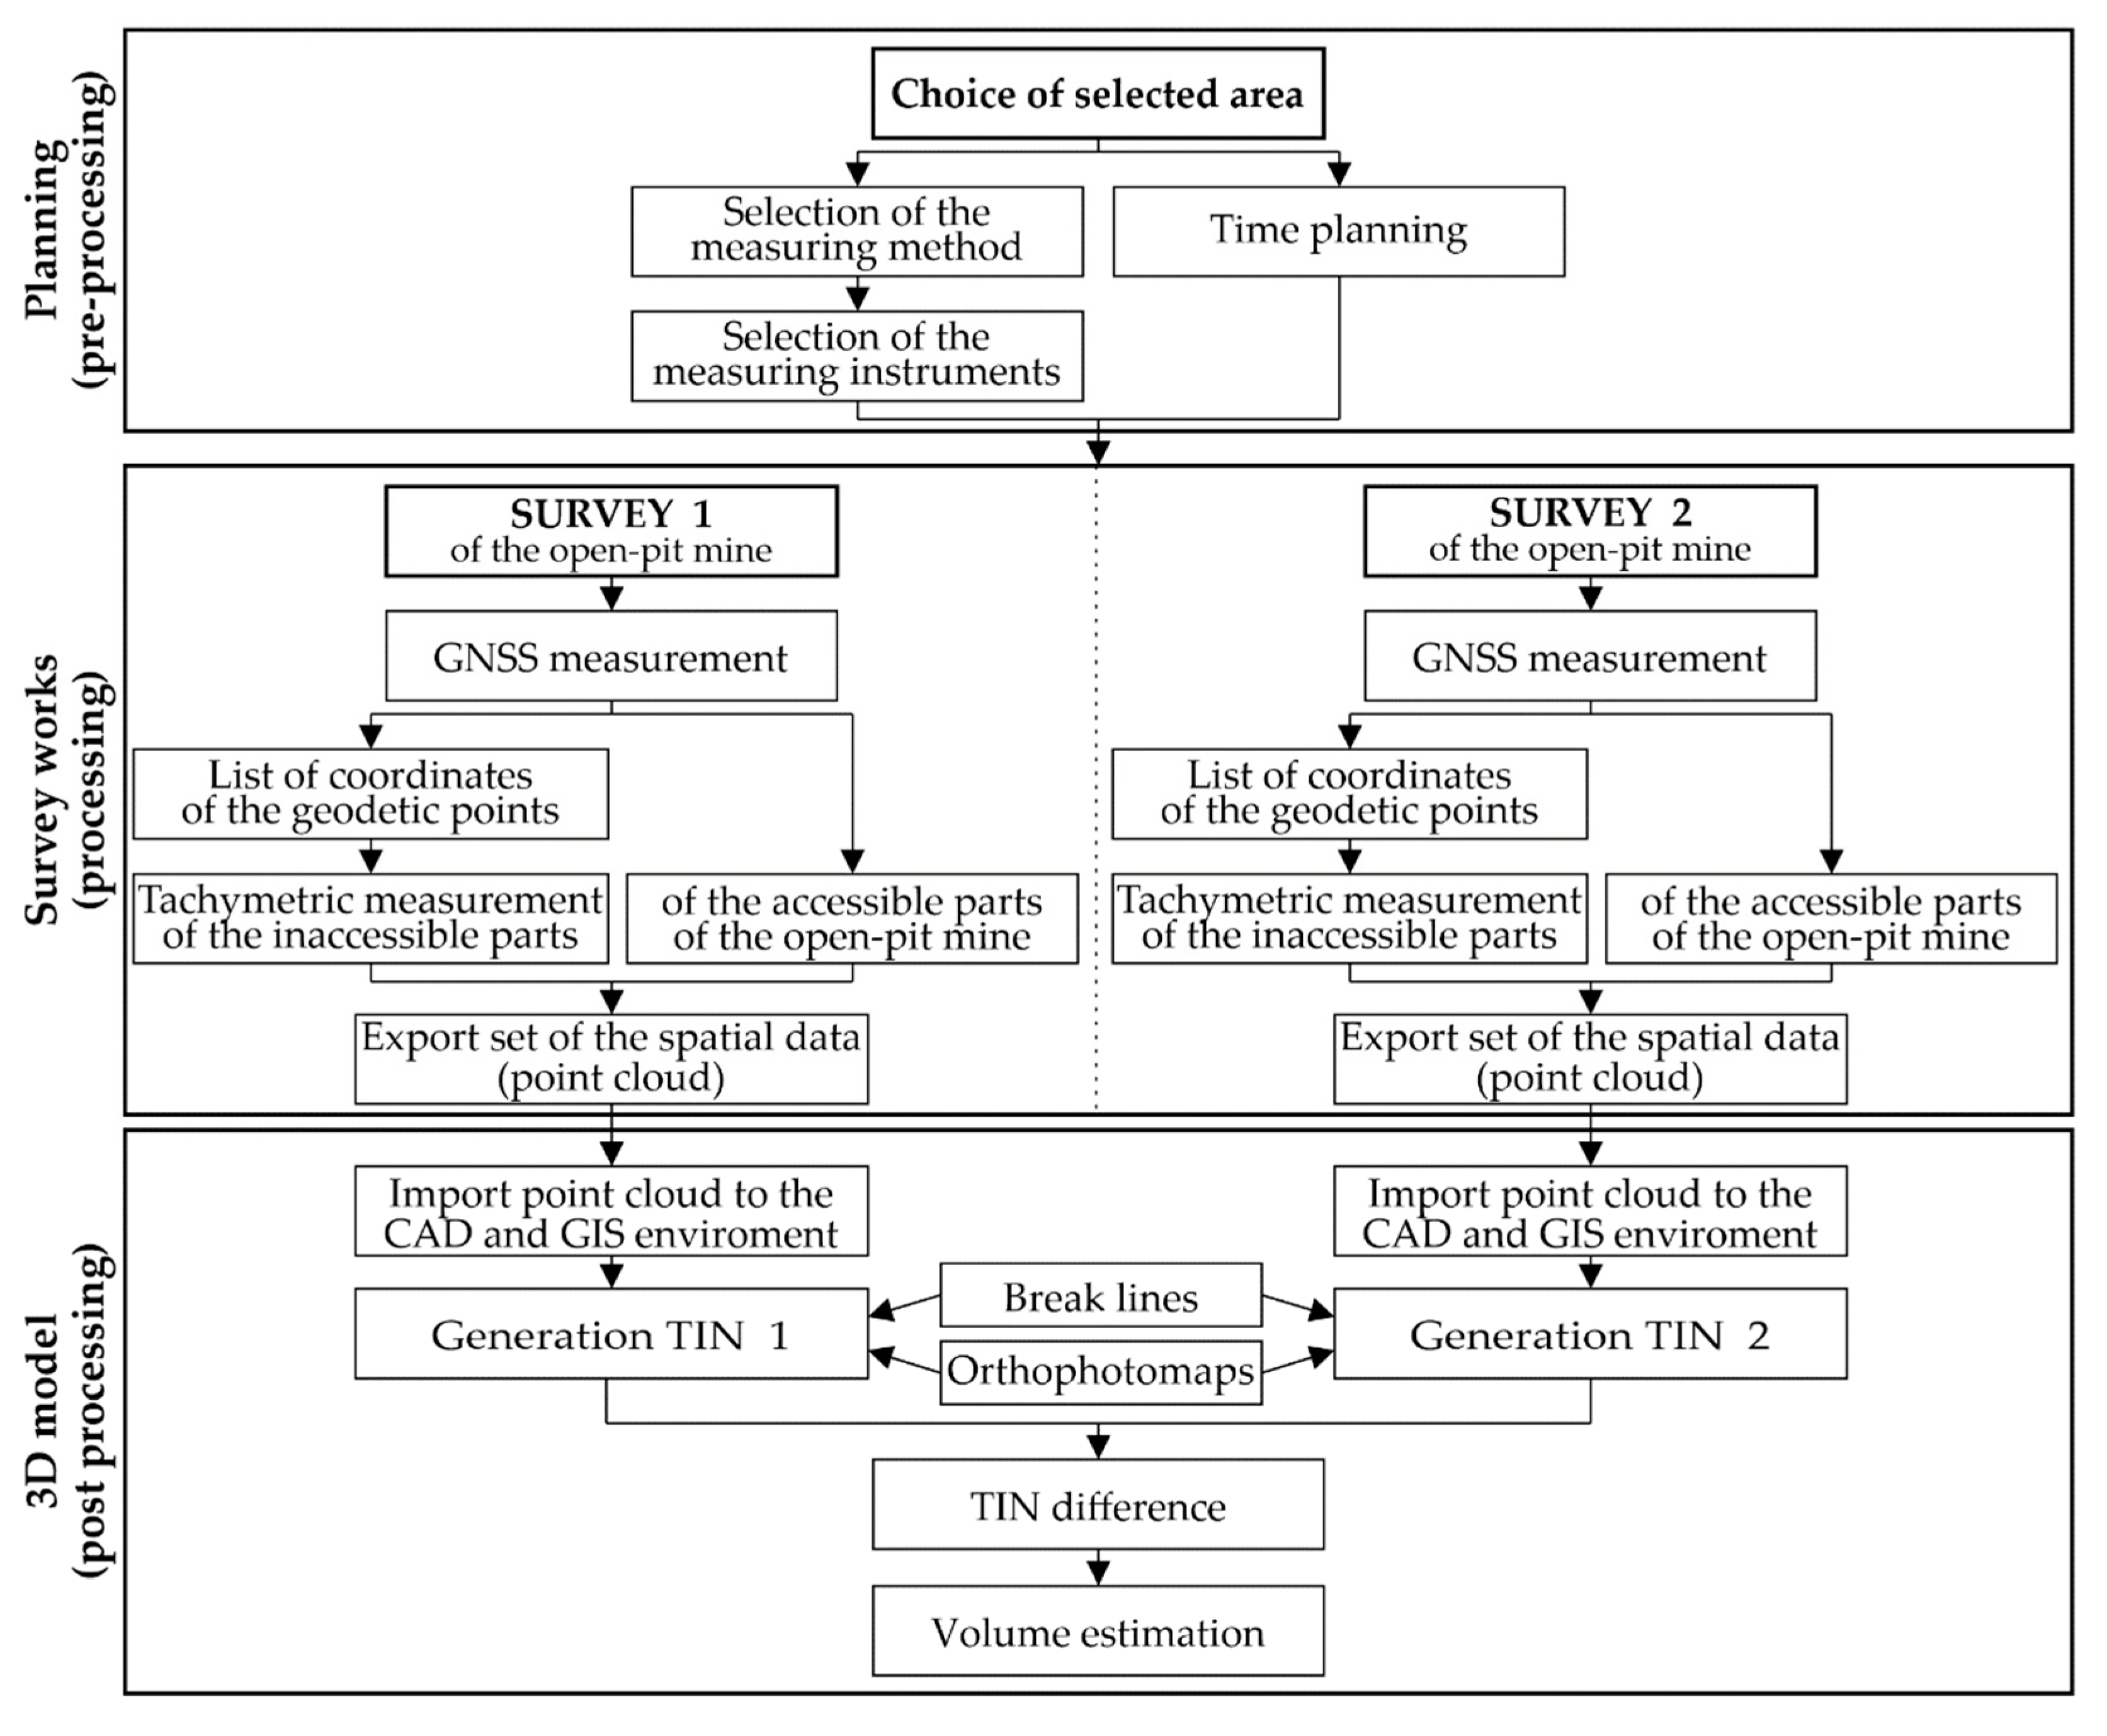
2.2. Measurement Methods
2.3. Measurement and Processing
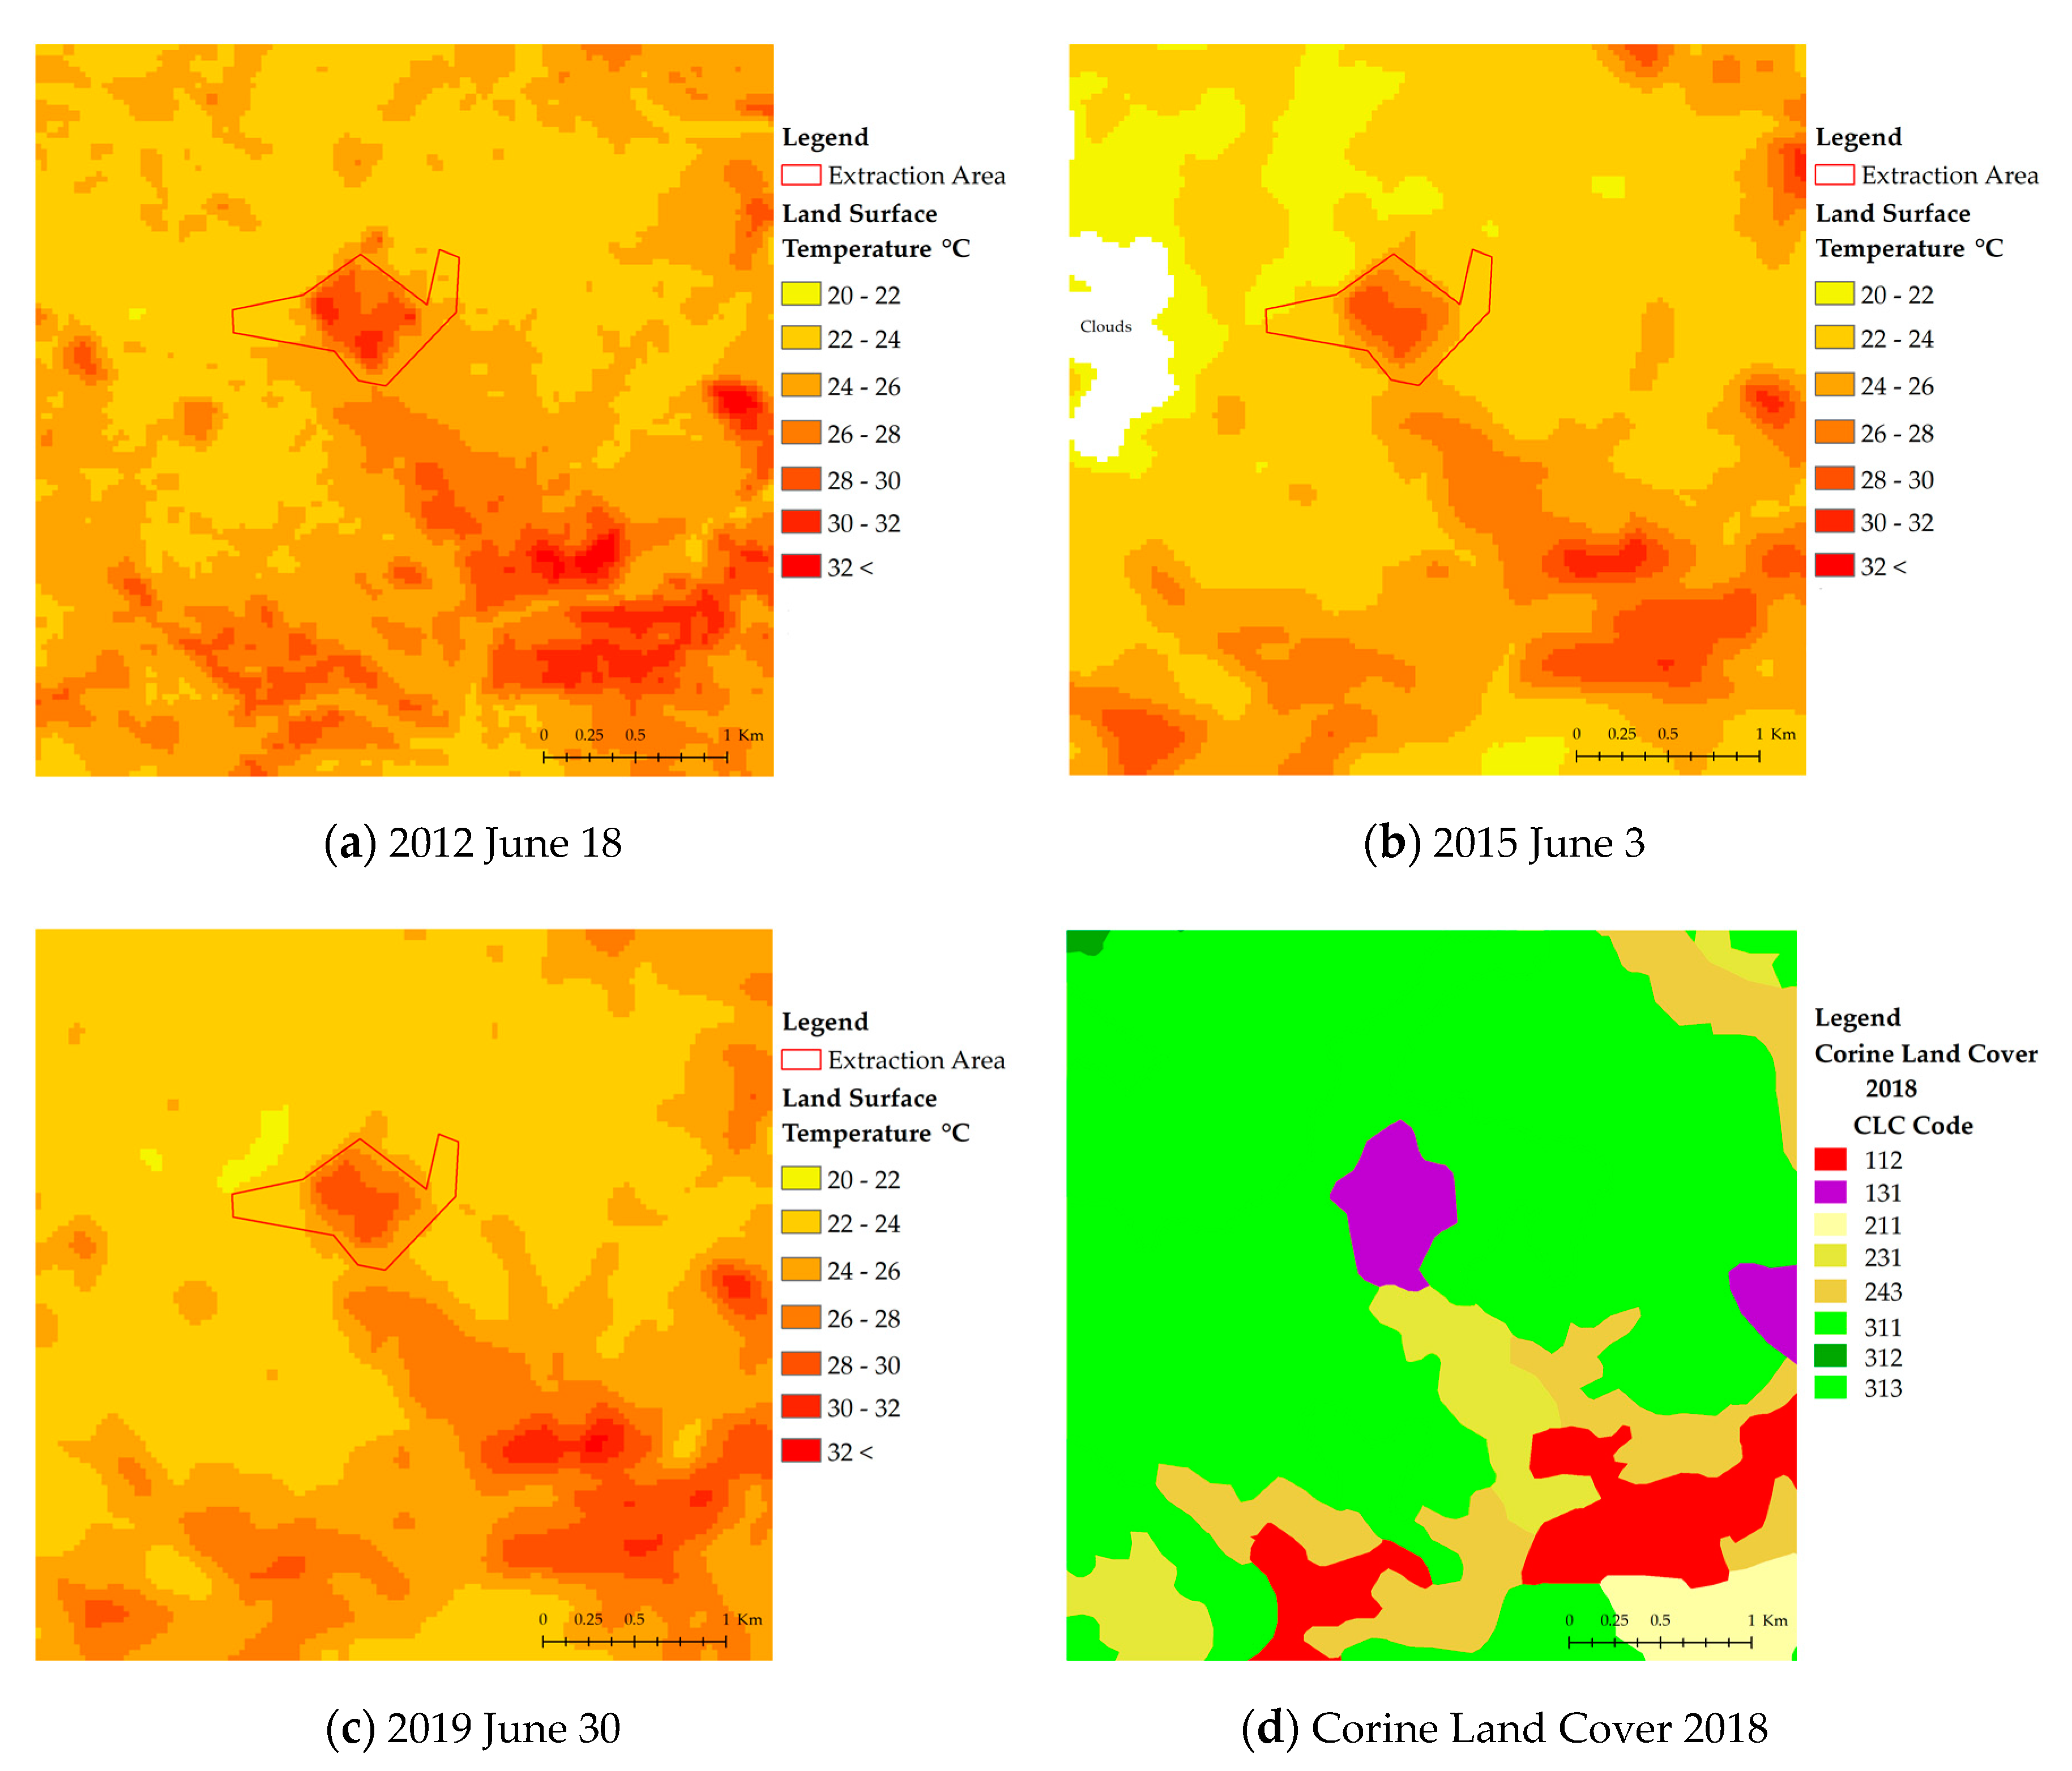
2.4. Calculation of Normalized Difference Vegetation and Land Surface Temperature
3. Results and Discussion
- (1)
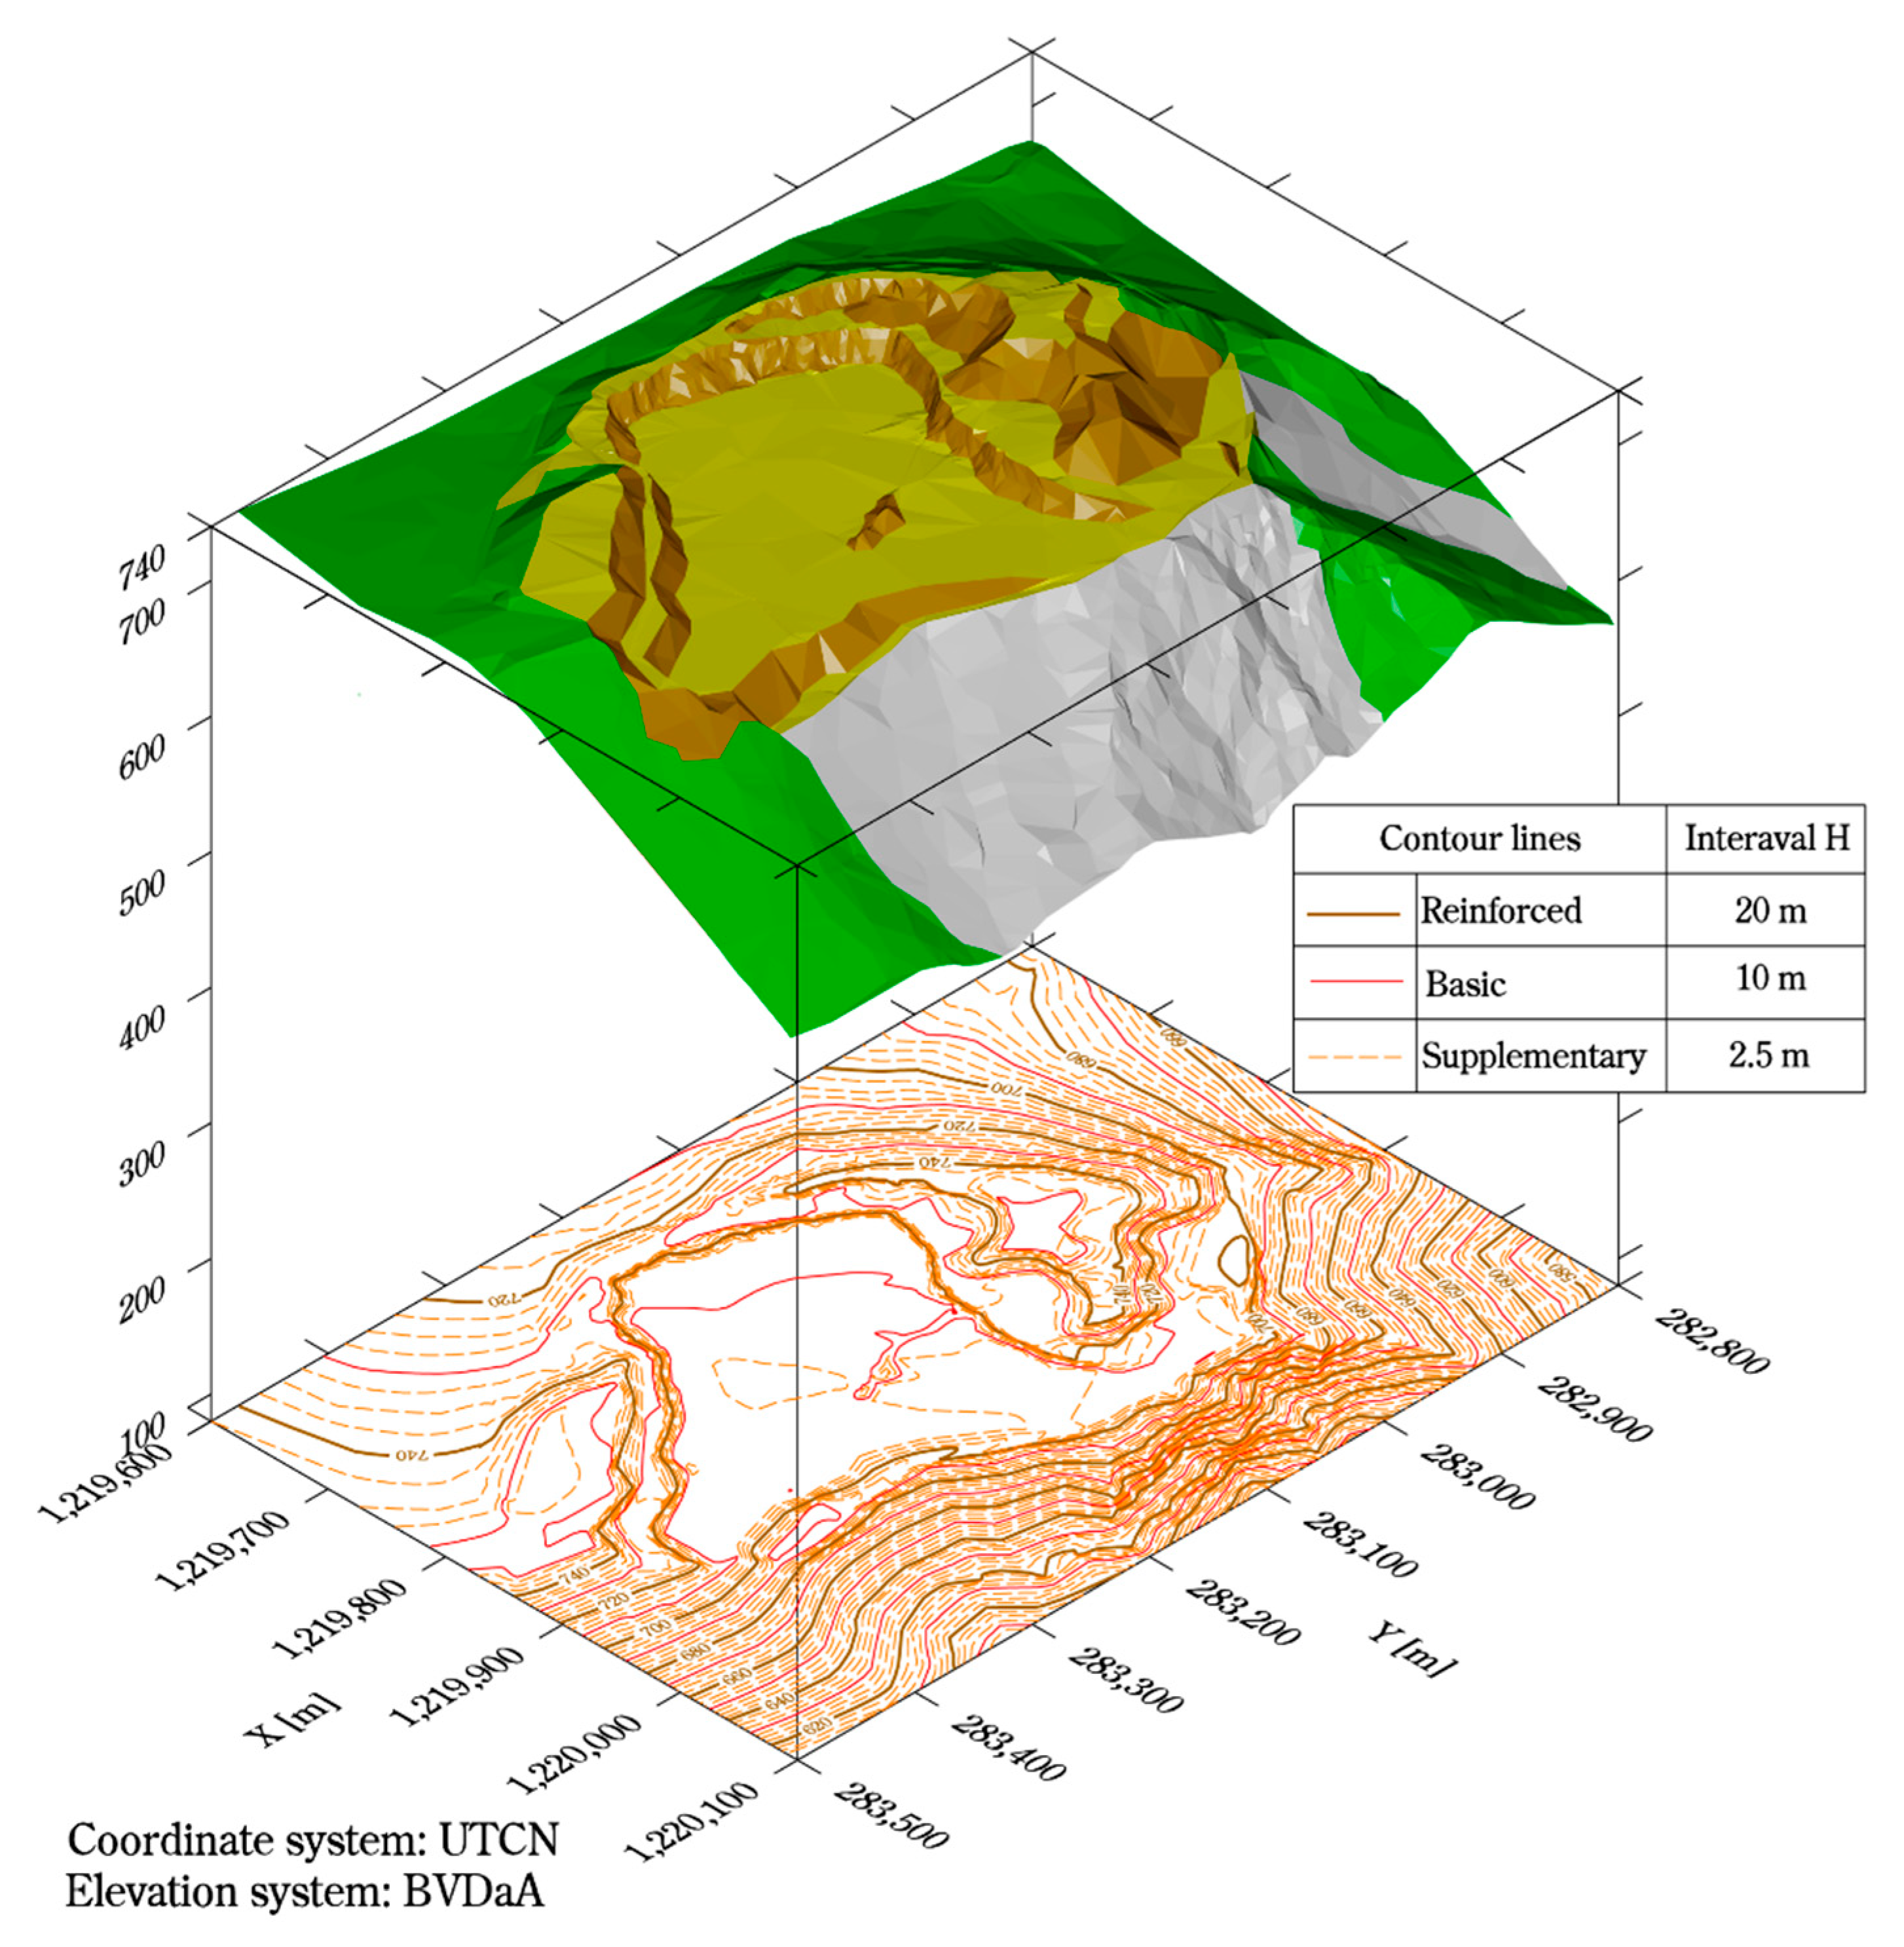
- Creation of the 3D drawing (*.dgn).
- (2)
- Creating at least two terrains (DTM) by importing coordinate lists.
- (3)
- Visualization individual of the models, their checking and editing of triangles using breaklines.
- (4)
- Calculate the volume of an irregular body between two surfaces/terrains.
- The method of measurement and measuring instruments chosen are more accurate,
- a greater number of points are suitably morphologically distributed on the 3D solid,
- the surface of the 3D solid is more geometric,
- the more appropriate mathematical relationship is the approximated surface of the 3D solid,
- there is a greater number of elementary solid on which the 3D solid is broken down as a result of geometry.
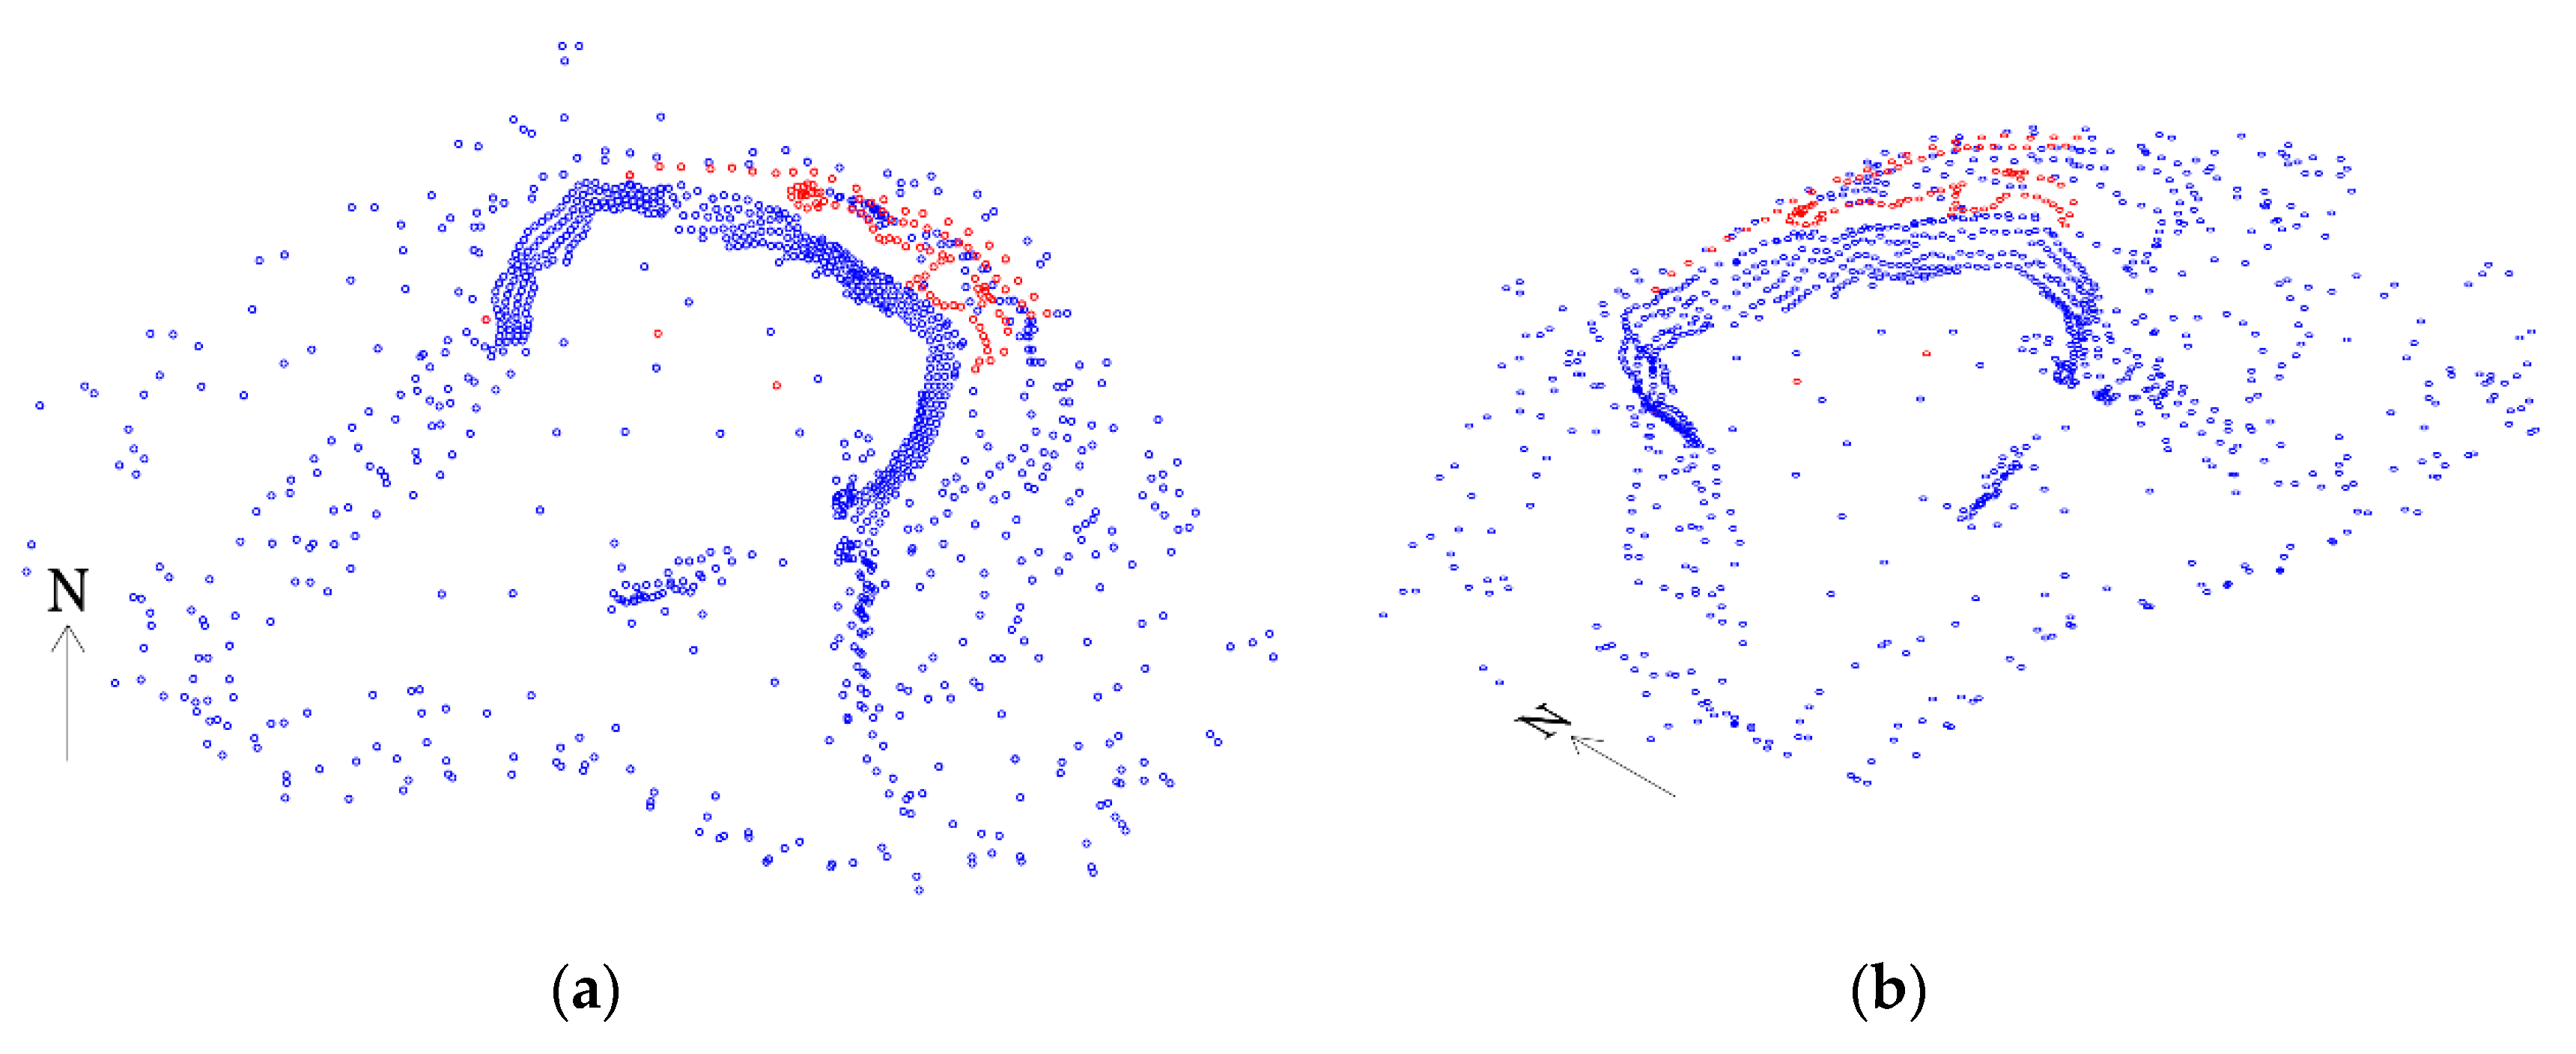
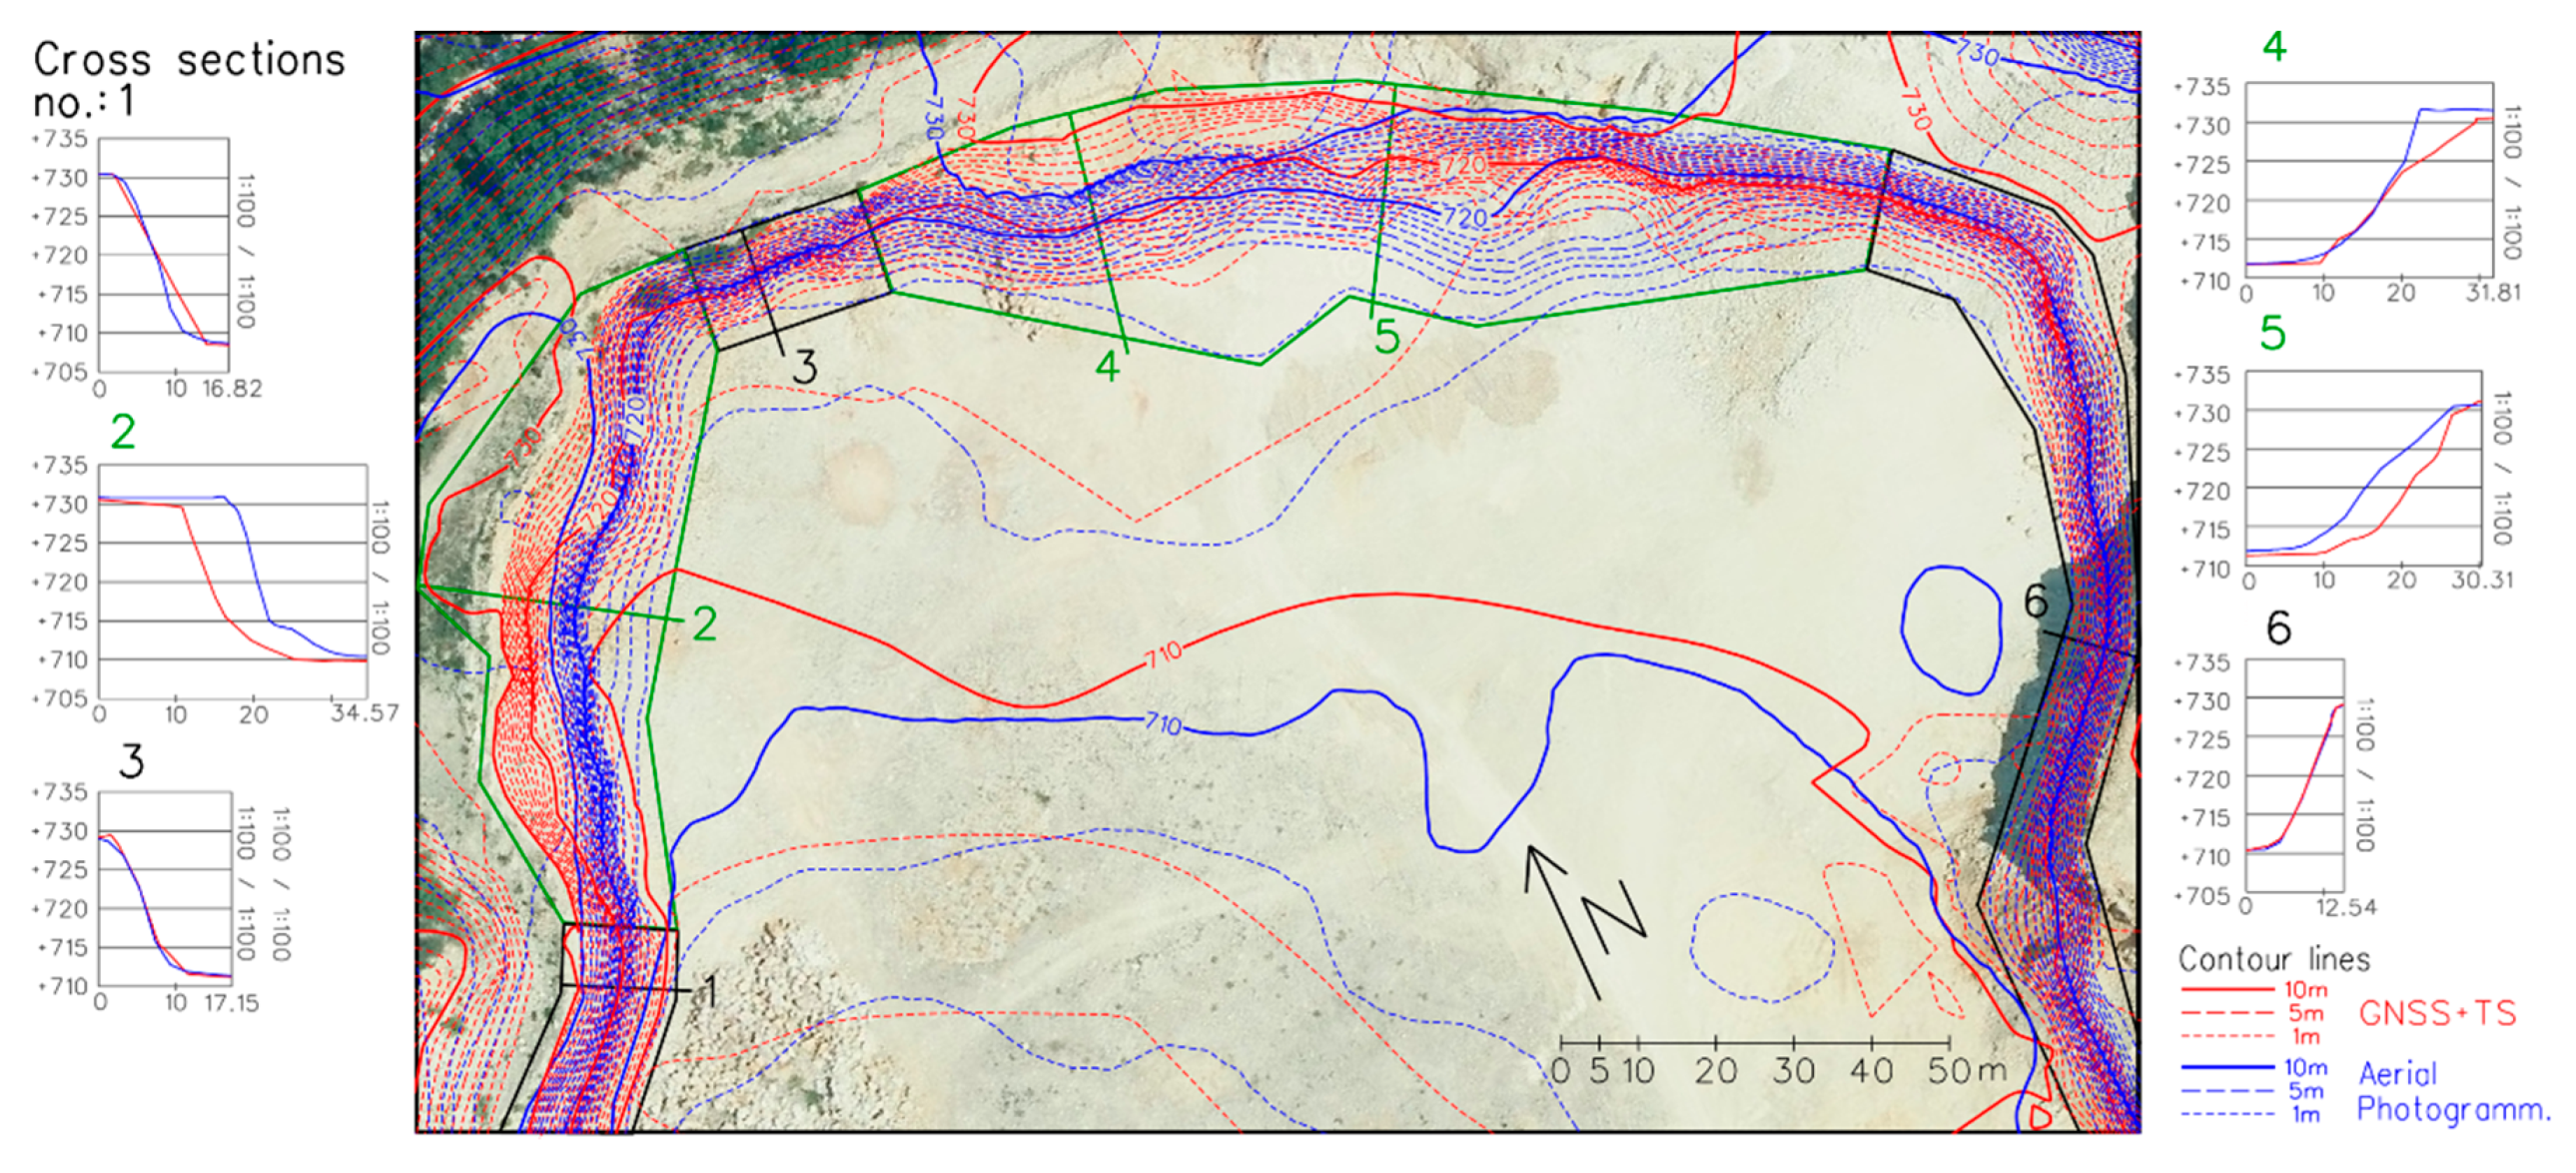
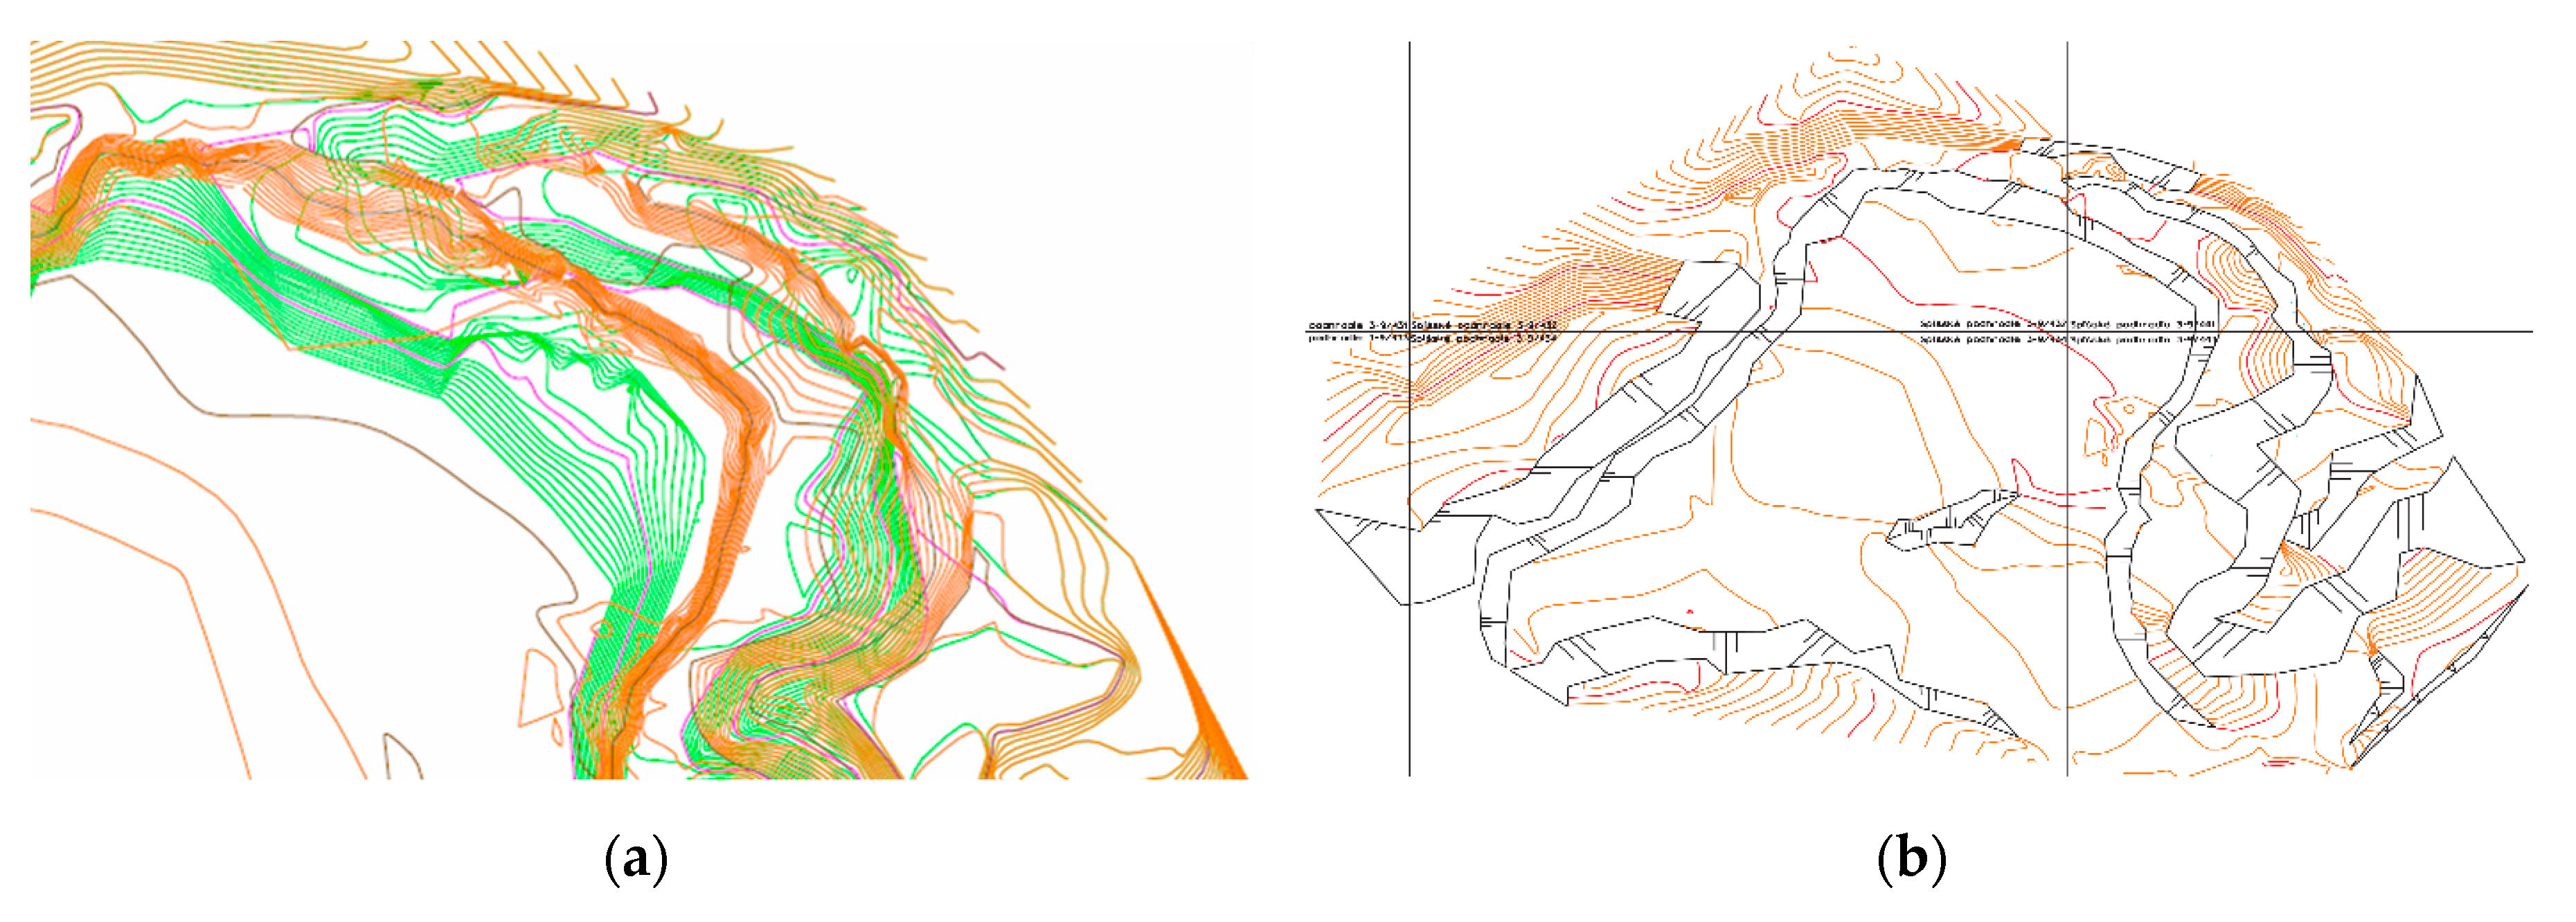
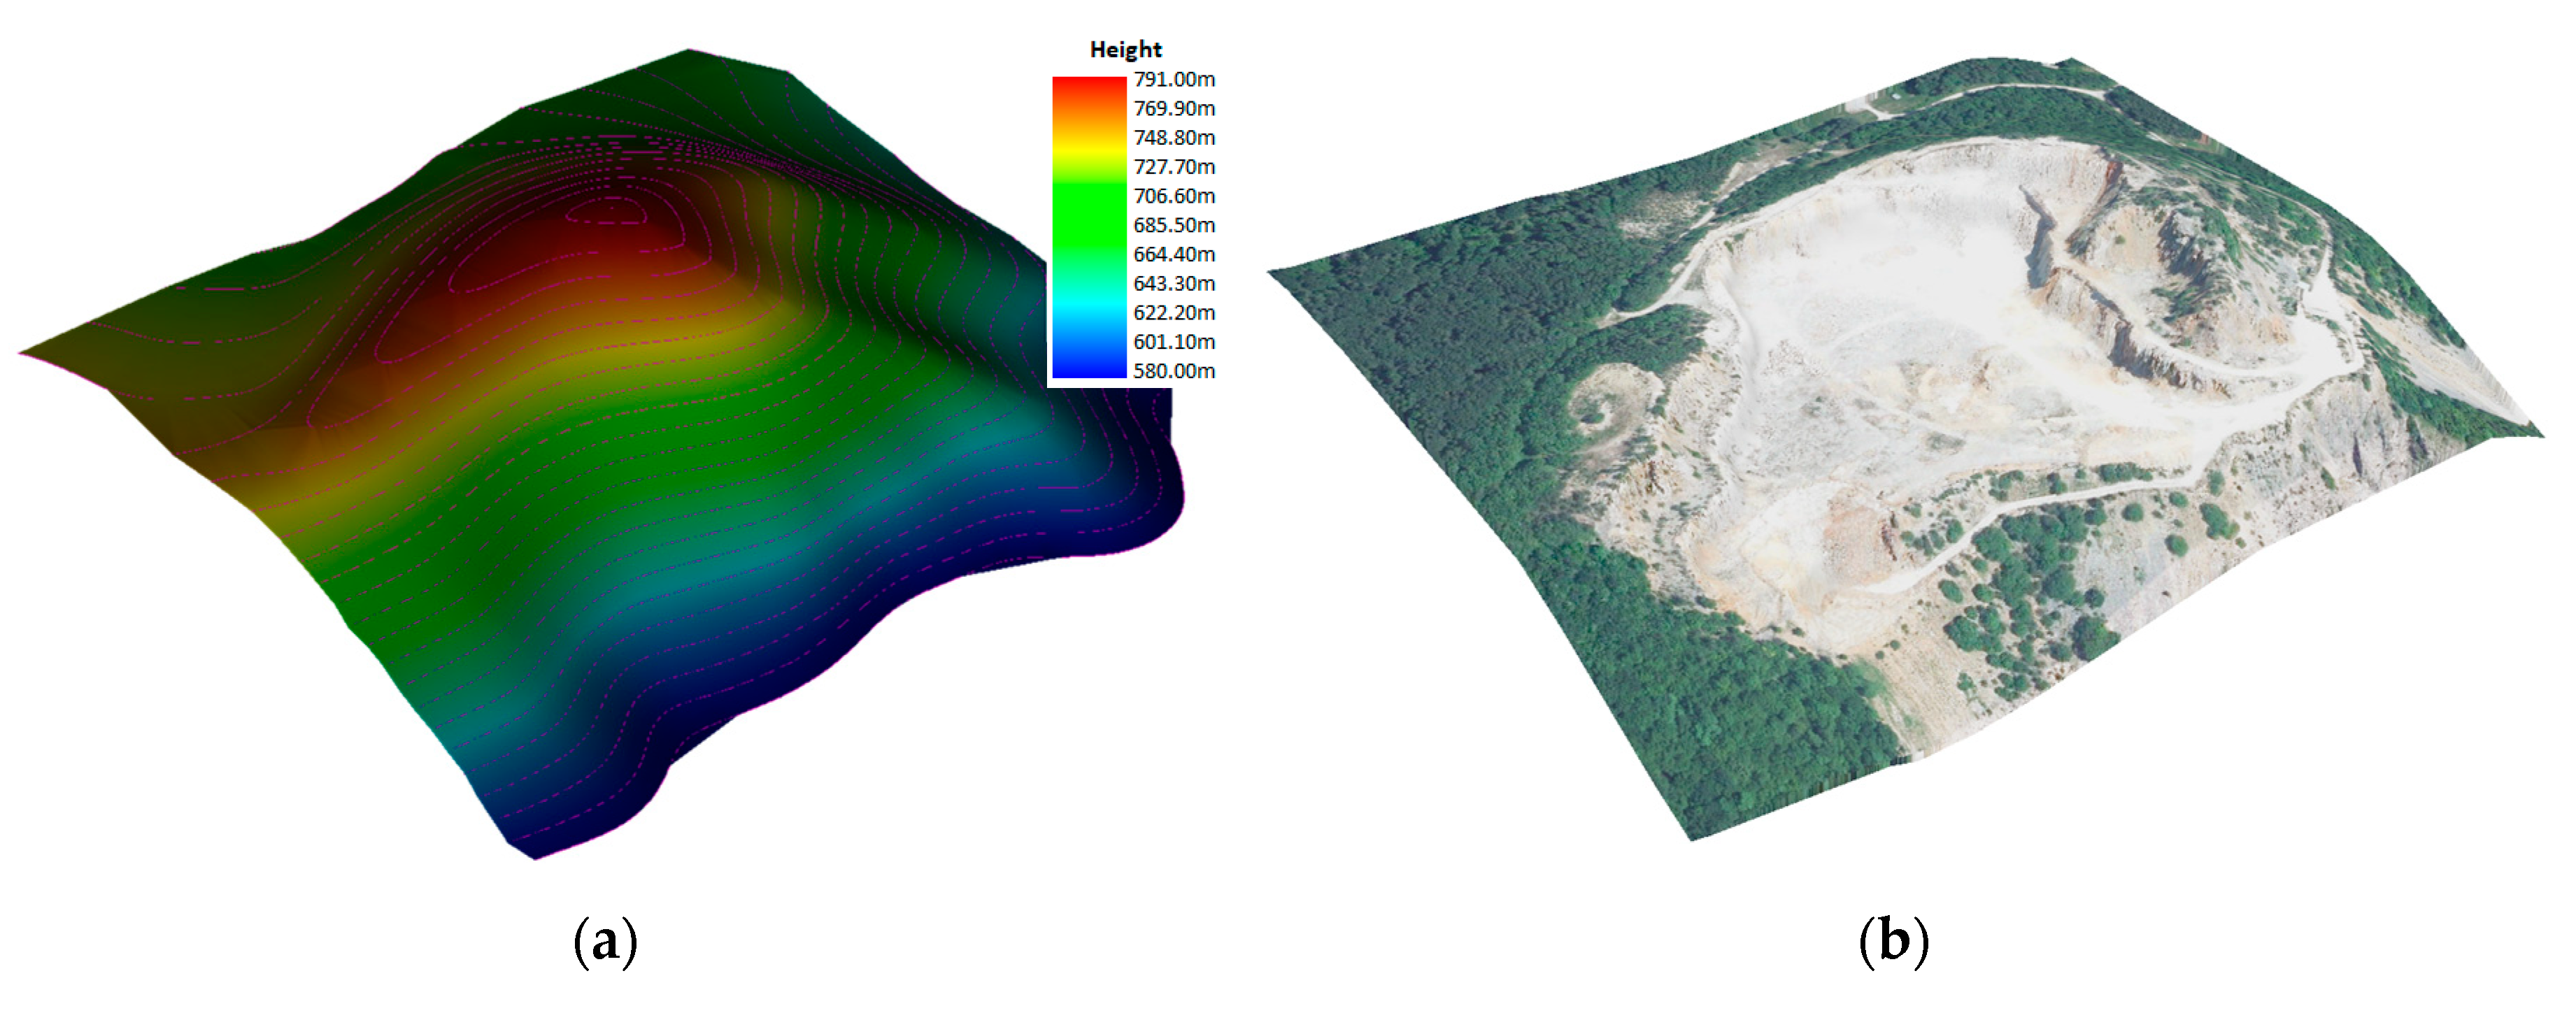
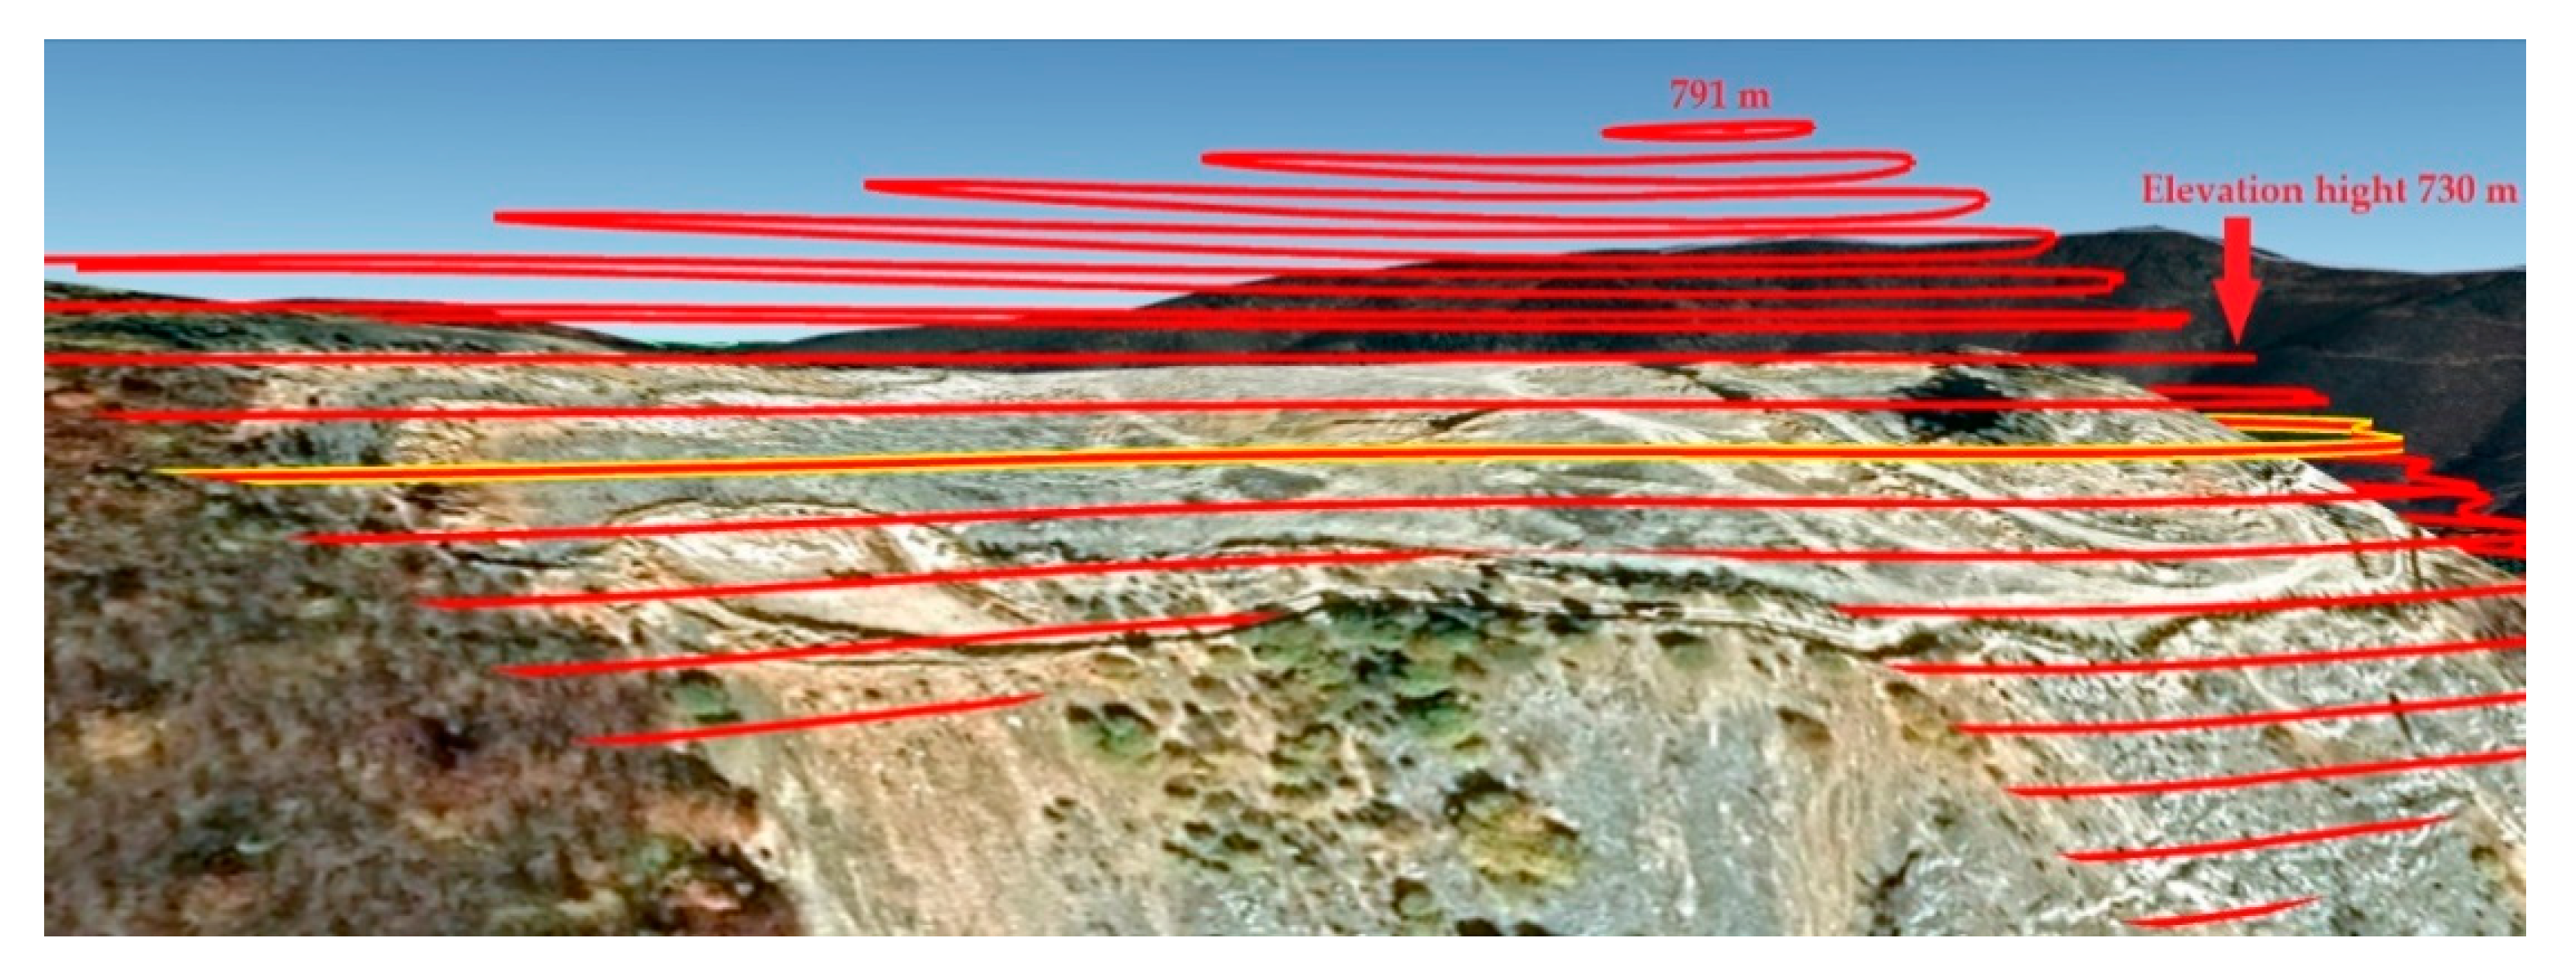
3.1. Visualisation of the Geodetic Measurement in the Open-Pit Mine
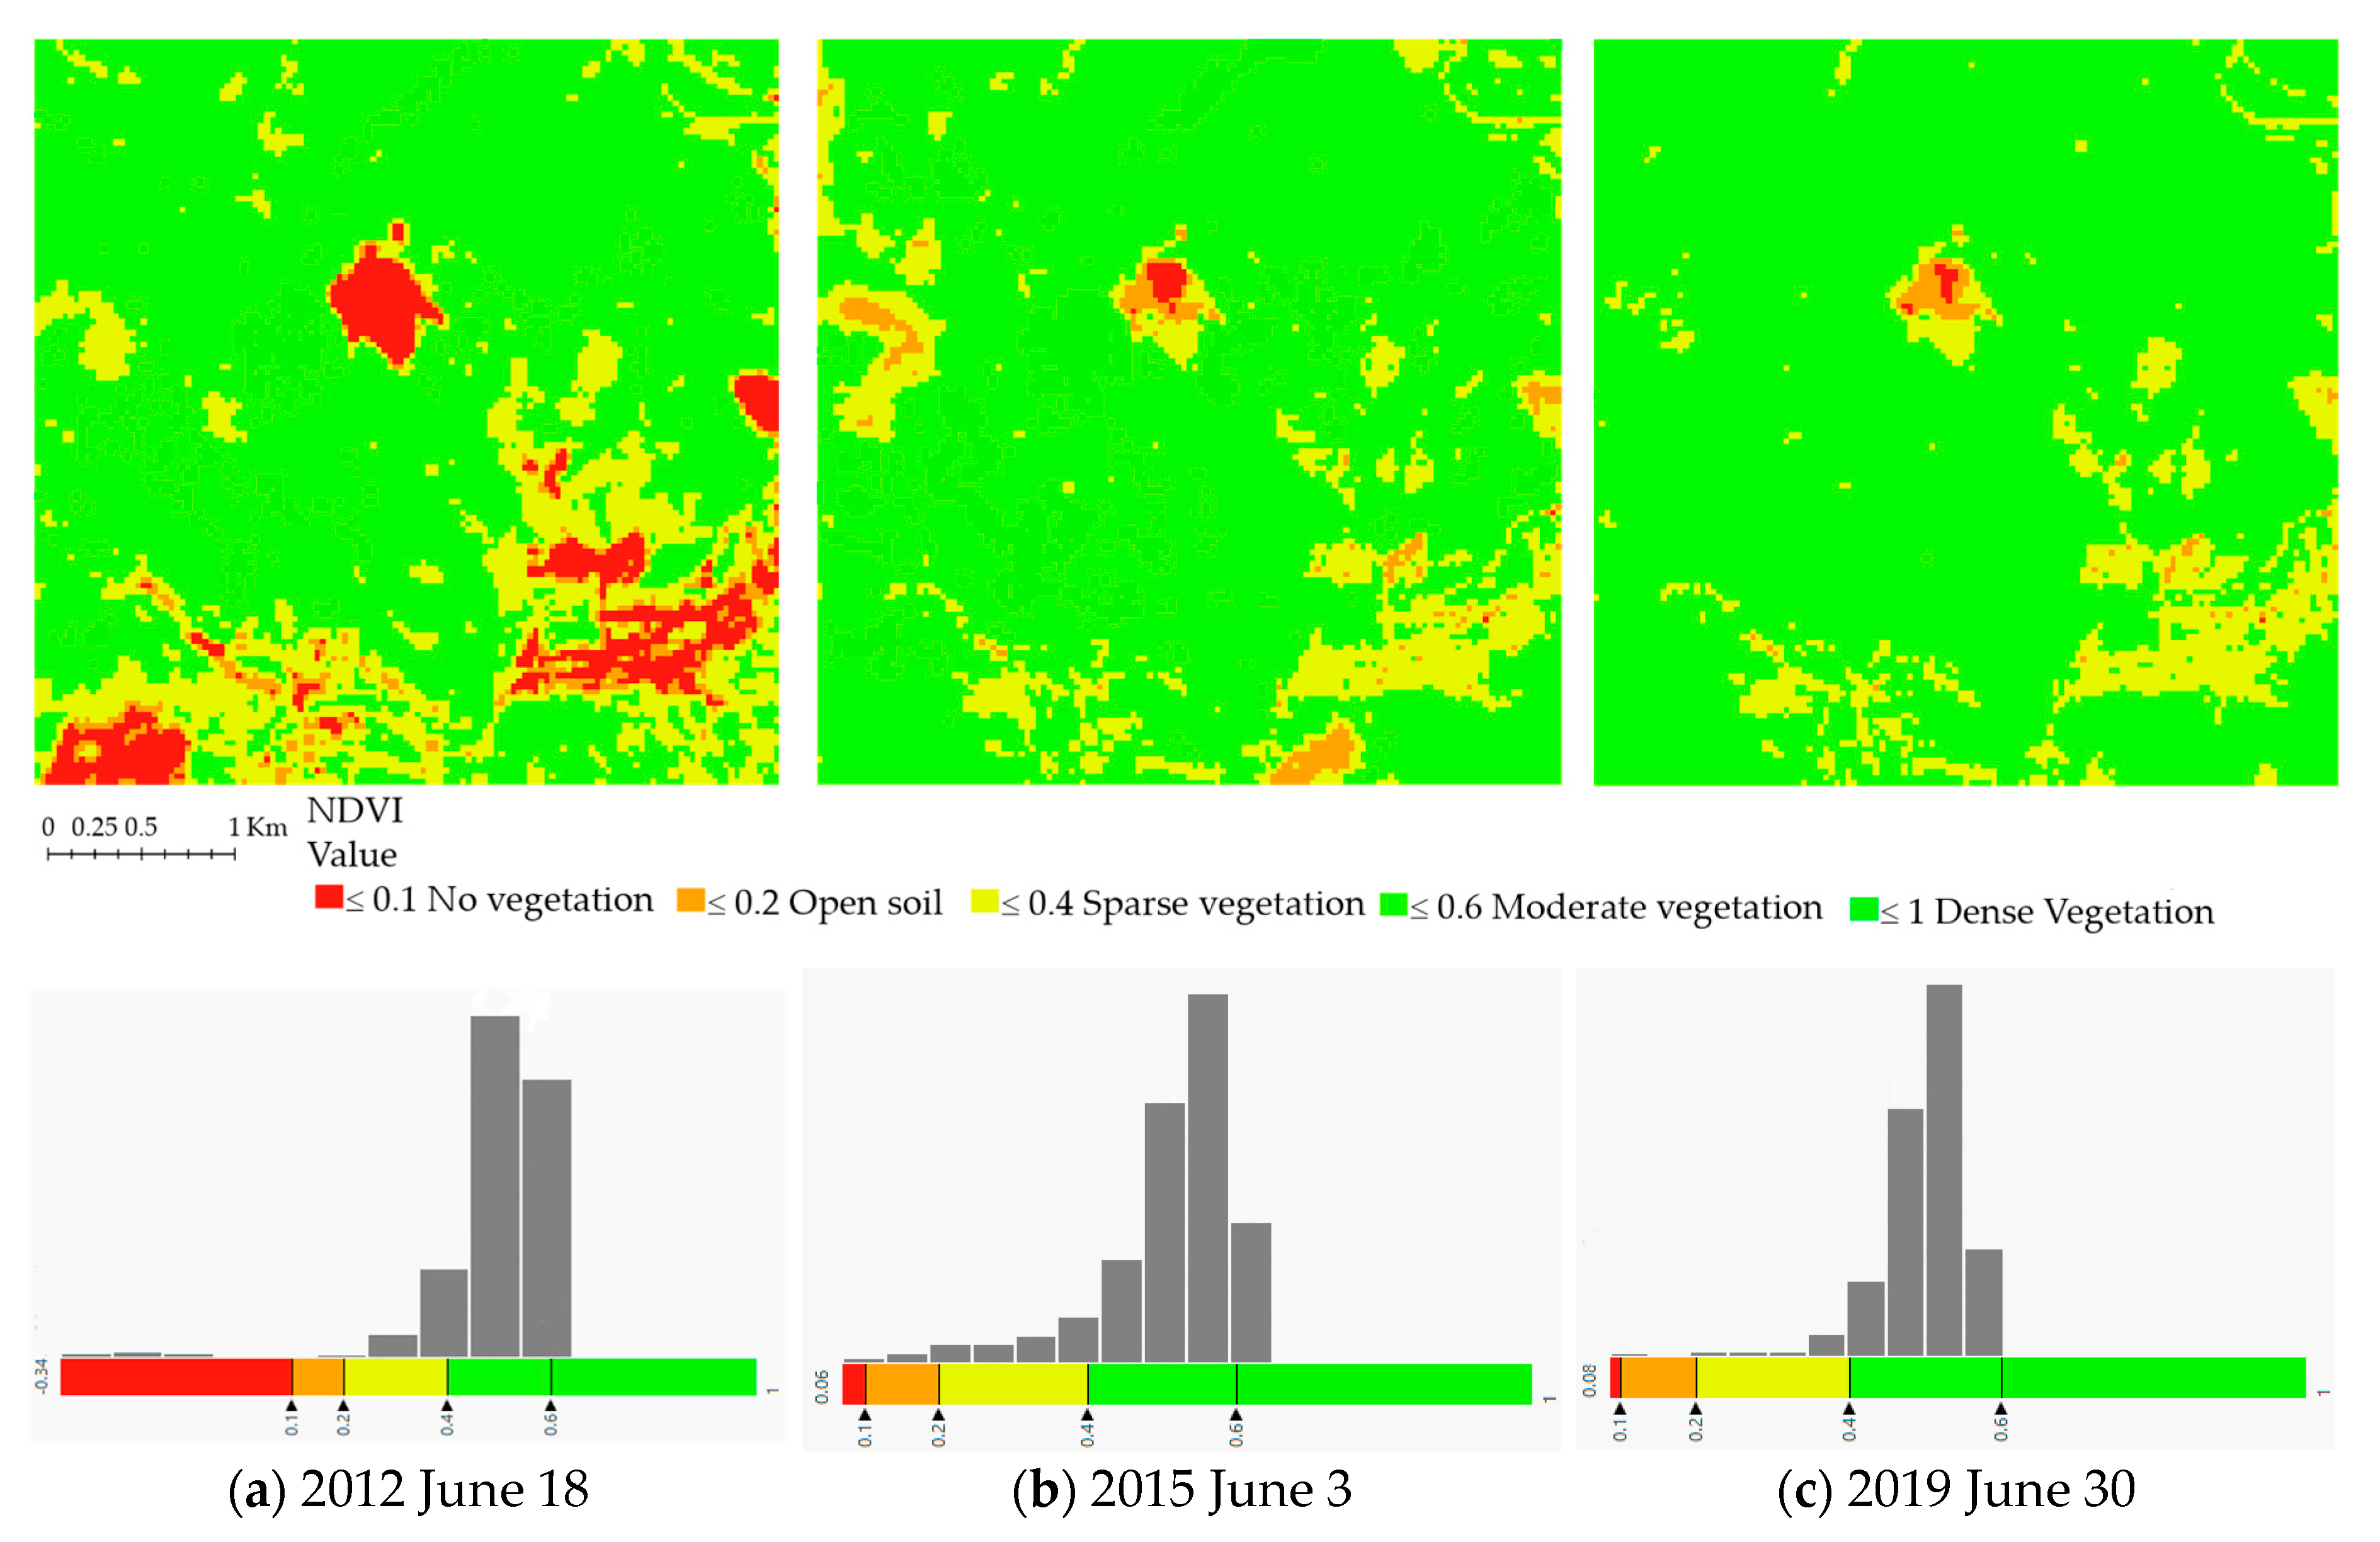
3.2. The Spatial Changes in Vegetation Cover Area
4. Conclusions
- (1)
- Verification of the situation, if the mining at the present open-pit mine is provided under to legal provisions in force,
- (2)
- optimization of open-pit mining processes which could lead to increased safety and economy of the processes of surface mining,
- (3)
- identification and elimination of adverse impacts of the processes of surface mining to environmental,
- (4)
- settlement of possible legal disputes in the field of mineral resource extractions for the field real estate cadastre.
- the angle of inclination of the newly formed solid shall be stable,
- safe drainage of surface water,
- preventing the area from drying out,
- separation of rock pieces from the walls of the open-pit mine must be controlled.
Author Contributions
Funding
Conflicts of Interest
References
- Lukáčová, K.; Badida, M.; Moravec, M.; Liptai, P. Particulate Matters Propagation by the Surface Winning. Solid State Phenom. 2015, 244, 197–202. [Google Scholar] [CrossRef]
- Zvijáková, L.; Zelenakova, M.; Purcz, P. Evaluation of environmental impact assessment effectiveness in Slovakia. Impact Assess. Proj. Apprais. 2014, 32, 150–161. [Google Scholar] [CrossRef] [Green Version]
- Wu, Z.; Lei, S.; Lu, Q.; Bian, Z.; Ge, S. Spatial distribution of the impact of surface mining on the landscape ecological health of semi-arid grasslands. Ecol. Indic. 2020, 111, 105996. [Google Scholar] [CrossRef]
- Huang, X.; Sillanpää, M.; Gjessing, E.T.; Peräniemi, S.; Vogt, R.D. Environmental impact of mining activities on the surface water quality in Tibet: Gyama valley. Sci. Total Environ. 2010, 408, 4177–4184. [Google Scholar] [CrossRef]
- Hendryx, M. The public health impacts of surface coal mining. Extr. Ind. Soc. 2015, 2, 820–826. [Google Scholar] [CrossRef]
- Cianciolo, T.R.; McLaughlin, D.L.; Zipper, C.E.; Timpano, A.J.; Soucek, D.J.; Schoenholtz, S.H. Impacts to water quality and biota persist in mining-influenced Appalachian streams. Sci. Total Environ. 2020, 717, 137216. [Google Scholar] [CrossRef]
- Ranjan, R. Assessing the impact of mining on deforestation in India. Resour. Policy 2019, 60, 23–35. [Google Scholar] [CrossRef]
- Kahhat, R.; Parodi, E.; Larrea-Gallegos, G.; Mesta, C.; Vázquez-Rowe, I. Environmental impacts of the life cycle of alluvial gold mining in the Peruvian Amazon rainforest. Sci. Total Environ. 2019, 662, 940–951. [Google Scholar] [CrossRef]
- Werner, T.T.; Bebbington, A.; Gregory, G. Assessing impacts of mining: Recent contributions from GIS and remote sensing. Extr. Ind. Soc. 2019, 6, 993–1012. [Google Scholar] [CrossRef]
- Krümmelbein, J.; Horn, R.; Raab, T.; Bens, O.; Hüttl, R.F. Soil physical parameters of a recently established agricultural recultivation site after brown coal mining in Eastern Germany. Soil Tillage Res. 2010, 111, 19–25. [Google Scholar] [CrossRef]
- Moomen, A.-W.; Bertolotto, M.; Lacroix, P.; Jensen, D. Inadequate adaptation of geospatial information for sustainable mining towards agenda 2030 sustainable development goals. J. Clean. Prod. 2019, 238, 117954. [Google Scholar] [CrossRef]
- Labant, S.; Stanˇková, H.; Weiss, R. Geodetic Determining of Stockpile Volume of Mineral Excavated in Open Pit Mine. Geosci. Eng. 2013, 59, 30–40. [Google Scholar] [CrossRef]
- Vrublová, D.; Kapica, R.; Gibesová, B.; Mudrunˇka, J.; Strus’, A. Application of GNSS technology in surface mining. Geod. Cartogr. 2016, 42, 122–128. [Google Scholar] [CrossRef] [Green Version]
- Gao, J.X.; Hu, H. Advanced GNSS technology of mining deformation monitoring. Procedia Earth Planet. Sci. 2009, 1, 1081–1088. [Google Scholar]
- Xu, H. Extraction of Urban Built-up Land Features from Landsat Imagery Using a Thematicoriented Index Combination Technique. Photogramm. Eng. Remote Sens. 2007, 73, 1381–1391. [Google Scholar] [CrossRef] [Green Version]
- Deliormanli, A.; Norbert, M.; Otoo, J. Using terrestrial 3D laser scanning and optical methods to determine orientations of discontinuities at a granite quarry. Int. J. Rock Mech. Min. Sci. 2014, 66, 41–48. [Google Scholar] [CrossRef]
- Gama, F.; Cantone, A.; Mura, J.; Pasquali, P.; Paradella, W.; Ribeiro, A.; Silva, G. Monitoring subsidence of open pit iron mines at Carajás Province based on SBAS interferometric technique using TerraSAR-X data. Remote Sens. Appl. Soc. Environ. 2017, 8, 199–211. [Google Scholar] [CrossRef]
- Wang, J.; Wang, L.; Jia, M.T.; He, Z.; Bi, L. Construction and Optimization Method of the Open-pit Mine DEM Based on the Oblique Photogrammetry Generated DSM. Measurement 2019, 152, 107322. [Google Scholar] [CrossRef]
- Agüera-Vega, F.; Carvajal-Ramírez, F.; Martínez-Carricondo, P. Assessment of Photogrammetric Mapping Accuracy Based on Variation Ground Control Points Number Using Unmanned Aerial Vehicle. Measurement 2016, 98, 221–227. [Google Scholar] [CrossRef]
- Niethammer, U.; James, M.; Rothmund, S.; Travelletti, J.; Joswig, M. UAV-based remote sensing of the Super-Sauze landslide: Evaluation and results. Eng. Geol. 2012, 128, 2–11. [Google Scholar] [CrossRef]
- Stanek, V.; Hostinová, G.; Kopacik, A. Geodesy in Construction; Jaga Group: Bratislava, Slovakia, 2007. [Google Scholar]
- Rakay, S.; Zuzik, J.; Weiss, G.; Labant, S. Surveying of inaccessible rock faces and volume calculation of the irregular solids using robotic total station. Acta Montan. Slovaca 2013, 18, 164–171. [Google Scholar]
- Long, N.Q.; Buczek, M.M.; Hien, L.P.; Szlapin’ska, S.A.; Nam, B.X.; Nghia, N.V.; Cuong, C.X. Accuracy assessment of mine walls’ surface models derived from terrestrial laser scanning. Int. J. Coal Sci. Technol. 2018, 5, 328–338. [Google Scholar] [CrossRef]
- Armstrong, B.; Blackwood, A.; Penzokajewski, P.; Menter, C.; Herries, A. Terrestrial laser scanning and photogrammetry techniques for documenting fossil-bearing palaeokarst with an example from the Drimolen Palaeocave System, South Africa. Archaeol. Prospect. 2017, 25, 45–58. [Google Scholar] [CrossRef]
- Schmitz, B.; Holst, C.; Medic, T.; Lichti, D.; Kuhlmann, H. How to Efficiently Determine the Range Precision of 3D Terrestrial Laser Scanners. Sensors 2019, 19, 1466. [Google Scholar] [CrossRef] [Green Version]
- Shahbazi, M.; Sohn, G.; Théau, J.; Menard, P. Development and Evaluation of a UAV-Photogrammetry System for Precise 3D Environmental Modeling. Sensors 2015, 15, 27493–27524. [Google Scholar] [CrossRef] [Green Version]
- Ali-Sisto, D.; Gopalakrishnan, R.; Kukkonen, M.; Savolainen, P.; Packalen, P. A method for vertical adjustment of digital aerial photogrammetry data by using a high-quality digital terrain model. Int. J. Appl. Earth Obs. Geoinf. 2020, 84, 101954. [Google Scholar] [CrossRef]
- Keawaram, B.; Dumrongchai, P. Comparisons of Surveying with Terrestrial Laser Scanner and Total Station for Volume Determination of Overburden and Coal Excavations in Large Open-Pit Mine. Int. J. Geol. Environ. Eng. 2017, 11, 1031–1039. [Google Scholar]
- Tong, X.; Liu, X.; Chen, P.; Liu, S.; Luan, K.; Li, L.; Liu, S.; Liu, X.; Xie, H.; Jin, Y.; et al. Integration of UAV-Based Photogrammetry and Terrestrial Laser Scanning for the Three-Dimensional Mapping and Monitoring of Open-Pit Mine Areas. Remote Sens. 2015, 7, 6635–6662. [Google Scholar] [CrossRef] [Green Version]
- Nunoo, S.; Tannant, D.D.; Newcomen, H.W. Slope monitoring practices at open pit porphyry mines in British Columbia, Canada. Int. J. Min. Reclam. Environ. 2016, 30, 245–256. [Google Scholar] [CrossRef]
- Xu, Z.; Xu, E.; Wu, L.; Liu, S.; Mao, Y. Registration of Terrestrial Laser Scanning Surveys Using Terrain-Invariant Regions for Measuring Exploitative Volumes over Open-Pit Mines. Remote Sens. 2019, 11, 606. [Google Scholar] [CrossRef] [Green Version]
- Wajs, J. Research on surveying technology applied for DTM modelling and volume computation in open pit mines. Min. Sci. 2016, 22, 75–83. [Google Scholar]
- Correia Neto, J.; Mariz, J.; de Souza, J.; Vasconcelos, S.; Rocha, S. Elaboration of planimetric model of open pit with multiple benchs through the conventional methodology and the use of unmanned aerial vehicles (UAV). Tecnologia em Metalurgia, Materiais e Mineração 2020, 16, 439–446. [Google Scholar] [CrossRef] [Green Version]
- Török, Á.; Bögöly, G.; Somogyi, A.; Lovas, T. Application of UAV in Topographic Modelling and Structural Geological Mapping of Quarries and Their Surroundings—Delineation of Fault-Bordered Raw Material Reserves. Sensors 2020, 20, 489. [Google Scholar] [CrossRef] [Green Version]
- Tucci, G.; Gebbia, A.; Conti, A.; Fiorini, L.; Lubello, C. Monitoring and Computation of the Volumes of Stockpiles of Bulk Material by Means of UAV Photogrammetric Surveying. Remote Sens. 2019, 11, 1471. [Google Scholar] [CrossRef] [Green Version]
- Drabiková, E.; Svetlík, J. Improving management of the company through Cranfield process model. MM Sci. J. 2018, 2153–2157. [Google Scholar] [CrossRef]
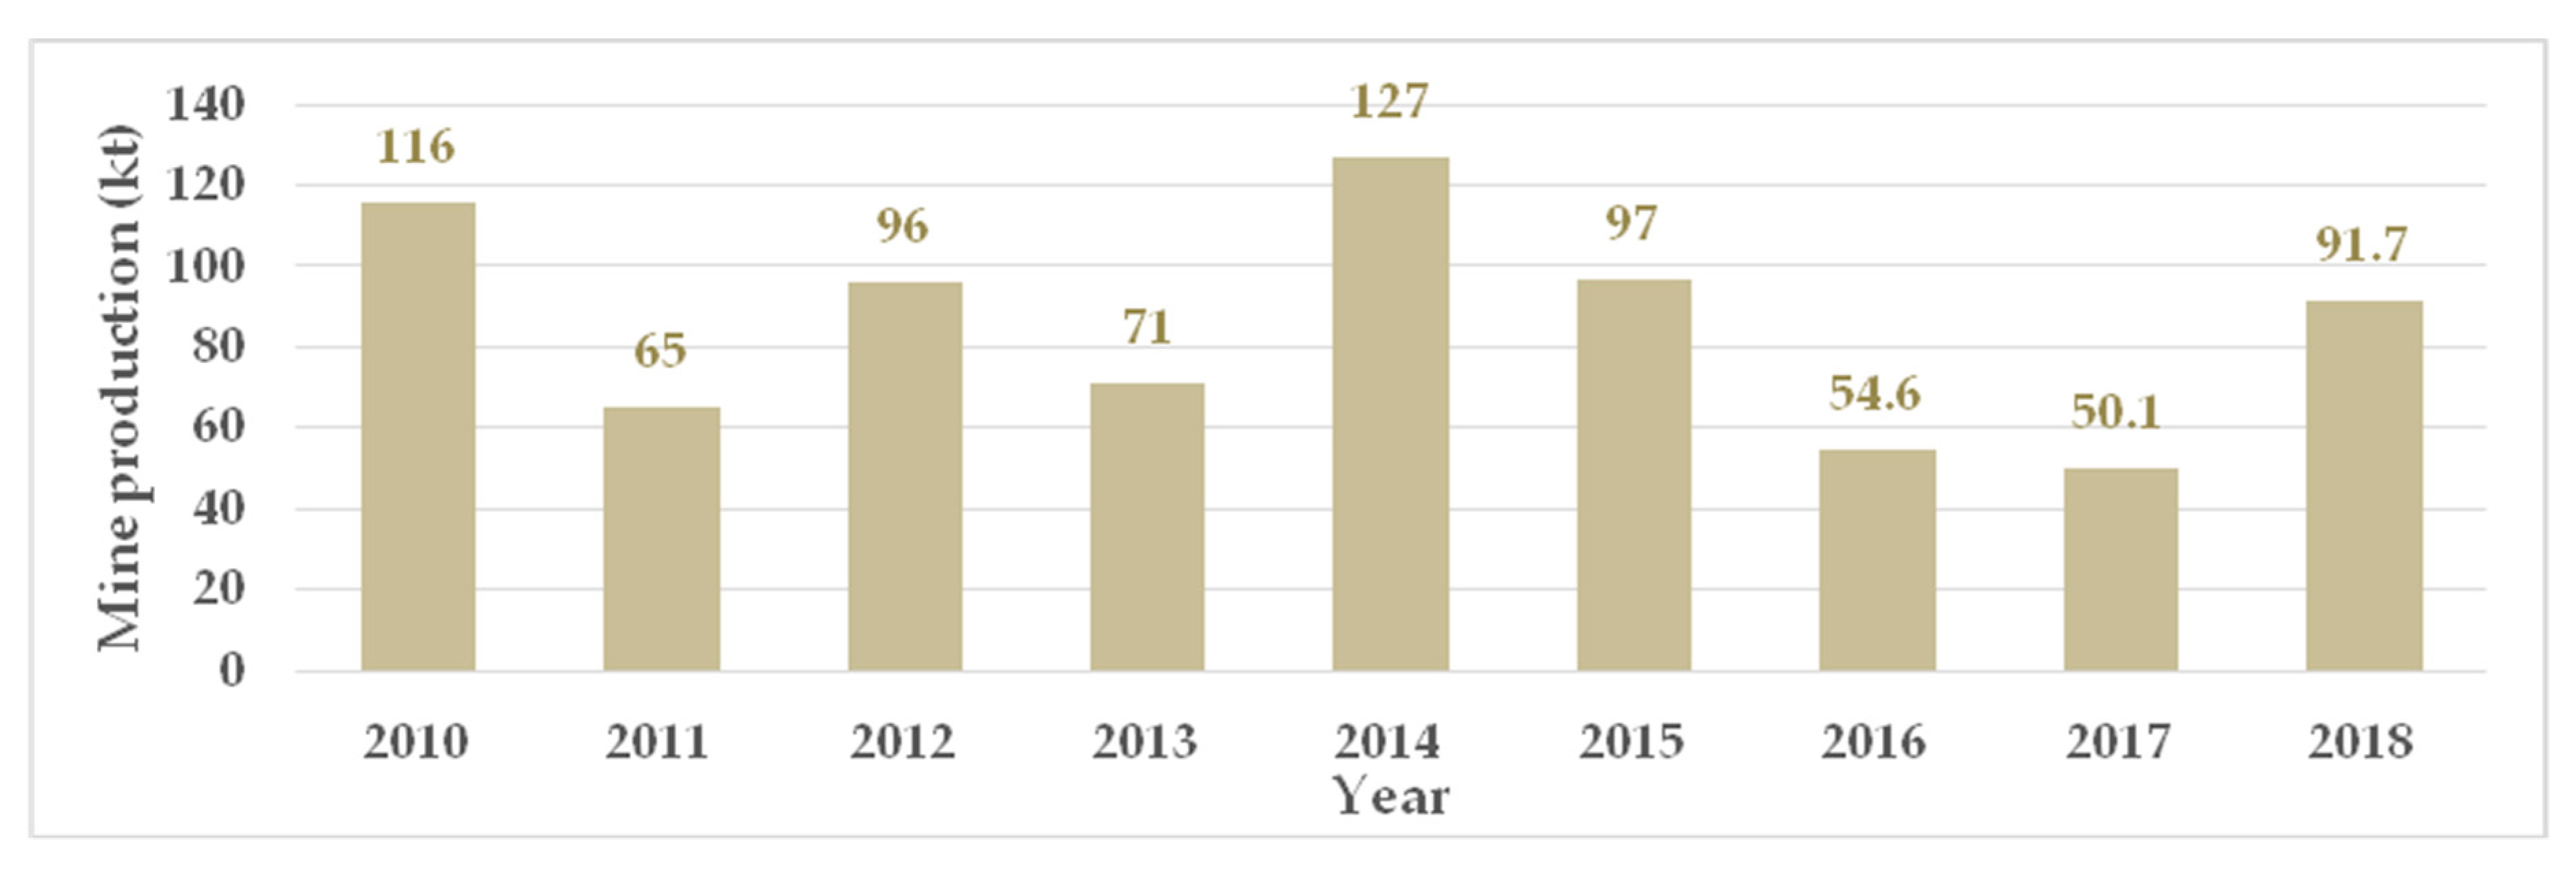
- Baláž, P.; Kúšik, D. Nerastné Suroviny Slovenskej Republiky 2015 (Stav 2014). In Slovak Minerals Yearbook 2015 (State 2014); State Geological Institute of Dionyz Stur: Bratislava, Slovakia, 2015. [Google Scholar]
- Fawzi, N.I.; Jatmiko, R. Heat Island Detection in Coal Mining Areas Using Multitemporal Remote Sensing. In Proceedings of the 36th Asian Conference on Remote Sensing, Metro Manila, Philippines, 24–28 October 2015; pp. 1–9. [Google Scholar]
- Sun, W.; Zhang, H.; Cao, Y.; Zhang, X.; Ji, X.; Li, F. Monitoring the ecological environment of open-pit coalfields in cold zones of Northeast China using Landsat time series images of 2000–2015. Tehnicki Vjesnik/Technical Gazette 2017, 24, 129–140. [Google Scholar]
- Wang, S.; Huang, J.; Yu, H.; Ji, C. Recognition of Landscape Key Areas in a Coal Mine Area of a Semi-Arid Steppe in China: A Case Study of Yimin Open-Pit Coal Mine. Sustainability 2020, 12, 2239. [Google Scholar] [CrossRef] [Green Version]
- Landsat 8 (L8) Science Data Users Handbook Version 2; Department of the Interior U.S. Geological Survey: Washington, DC, USA, 2016.
- Landsat 7 (L7) Science Data Users Handbook Version 2; Department of the Interior U.S. Geological Survey: Washington, DC, USA, 2019.
- Avdan, U.; Jovanovska, G. Algorithm for automated mapping of land surface temperature using Landsat 8 satellite data. J. Sens. 2016, 2016, 1–8. [Google Scholar] [CrossRef] [Green Version]
- Kuzevicˇová, Ž.; Gergel’ová, M.; Kuzevicˇ, Š.; Palková, J. Spatial interpolation and calculation of the volume an irregular solid. Int. J. Eng. Appl. Sci. 2014, 4, 14–21. [Google Scholar]
- Klimánek, M. Digitální Modely Terénu; Mendelova Zemědělská a Lesnická Univerzita: Brno, Czech Republic, 2006; ISBN 80-7157-982-3. [Google Scholar]
- Passalacqua, P.; Hillier, J. Innovative analysis and use of high resolution DTMs for understanding Earth-surface processes. Earth Surf. Process. Landf. 2014, 39, 1400–1403. [Google Scholar] [CrossRef] [Green Version]
- Menegaki, M.E.; Kaliampakos, D.C. Evaluating mining landscape: A step forward. Ecol. Eng. 2012, 43, 26–33. [Google Scholar] [CrossRef]
- Wycisk, P.; Hubert, T.; Gossel, W.; Neumann, C. High-resolution 3D spatial modelling of complex geological structures for an environmental risk assessment of abundant mining and industrial megasites. Comput. Geosci. 2009, 35, 165–182. [Google Scholar] [CrossRef]
- Bharath, S.; Rajan, K.S.; Ramachandra, T.V. Land surface temperature responses to land use land cover dynamics. Geoinfor. Geostat. Overv. 2013, 54, 50–78. [Google Scholar]
- Xue, J.; Su, B. Significant remote sensing vegetation indices: A review of developments and applications. J. Sens. 2017, 2017, 1–17. [Google Scholar] [CrossRef] [Green Version]
- Saini, V.; Gupta, R.P.; Arora, M.K. Chapter 17—Environmental Monitoring in the Jharia Coalfield, India: Vegetation Indices and Surface Temperature Measurements. In Coal and Peat Fires: A Global Perspective; Elsevier: Amsterdam, The Netherlands, 2019; pp. 359–385. ISBN 978-0-12-849885-9. [Google Scholar]


| Specification | DTM | ||
|---|---|---|---|
| Coordinate system, realization | Uniform Trigonometric Cadastral Network (UTCN); UTCN03 | ||
| Vertical Datum | Baltic Vertical Datum-After Adjustment (BVDaA) | ||
| Vertical accuracy-RMSEh | 0.3 m | ||
| Point cloud | X, Y, h [m] | ||
| Arrangement point cloud | Square grid | ||
| Resolution—grid size | 0.5 m | Resolution—grid size | 2.0 m |
| Coverage of SR | Capital city—Bratislava | Regional cities | The rest of the Slovakia |
| Comparison Parameters | Compared Measuring Technologies | |||
|---|---|---|---|---|
| GNSS, RTK | TS | TLS | APhg | |
| Price of the new instrument | ≥5000 € | ≥10,000 € | ≥30,000 € | ≥300,000 € |
| Usability level | basic | basic | higher | higher |
| Point determination accuracy | ≥20 mm (3D) | ≥1.5 mm (3D) | ≥3 mm (3D) | ≥50 mm (3D) |
| Point measurement speed | ≤5 pt./min | ≤5 pt./min | ≤50,000 pt./s | ≤20 photo/min |
| Average points | 1–500 | 1–1000 | 1–100 Mio. | 1–100 Mio. |
| Number of points on the area | ≤250 | ≤250 | ≤20 Mio. | ≤20 Mio. |
| Average distance from the area | 0–2 m | 5–100 m | 5–100 m | 100–2000 m (height) |
| Average distance of points | ≤5 m | ≤5 m | ≥0.01 m | ≥0.1 m |
| Duration of measurement | 3 h | 4 h | 1.5 h | 1.5 h |
| 3D model processing | 1 h | 1 h | 2 h | 4 h |
| Hardware demands of PC | low | low | high | high |
| Comparison Parameters | 1st Period | 2nd Period |
|---|---|---|
| Weather conditions | favourable | cloudy, then cleared |
| Surveyors | 3 | 3 |
| Geodetic points using Leica GPS900CS | 5 | 5 |
| Terrain points using Leica GPS900CS | 87 | 103 |
| Terrain points using Leica Viva TS15I | 939 | 1022 |
| CLC | ||||
|---|---|---|---|---|
| CLC Code | 2012 | 2018 | ||
| Area [ha] | Area [%] | Area [ha] | Area [%] | |
| 112 Discontinuous urban fabric | 119.89 | 7.49 | 119.80 | 7.49 |
| 131 Mineral extraction sites | 54.46 | 3.40 | 54.42 | 3.40 |
| 211 Non-irrigated arable land | 19.74 | 1.23 | 47.24 | 2.95 |
| 231 Pastures | 103.86 | 6.49 | 103.77 | 6.49 |
| 243 Land principally occupied by agriculture, with significant areas of natural vegetation | 185.44 | 11.59 | 185.29 | 11.58 |
| 311 Broad-leaved forest | 362.02 | 22.63 | 405.55 | 25.35 |
| 312 Coniferous forest | 2.63 | 0.16 | 2.63 | 0.16 |
| 313 Mixed forest | 709.38 | 44.35 | 681.30 | 42.58 |
| 324 Transitional woodland-shrub | 42.58 | 2.66 | 0.00 | 0.00 |
| Sum | 1600.00 | 100 | 1600.00 | 100 |
| NDVI Index | ||||||
|---|---|---|---|---|---|---|
| Color | 2012 | 2015 | 2019 | |||
| Area [ha] | Area [%] | Area [ha] | Area [%] | Area [ha] | Area [%] | |
 | 94.05 | 5.91 | 3.87 | 0.24 | 1.80 | 0.11 |
 | 44.10 | 2.77 | 28.26 | 1.78 | 11.52 | 0.72 |
 | 278.91 | 17.52 | 193.86 | 12.18 | 159.39 | 10.01 |
 | 1123.56 | 70.57 | 1216.71 | 76.43 | 1419.12 | 89.14 |
 | 51.39 | 3.23 | 149.31 | 9.38 | 0.18 | 0.01 |
© 2020 by the authors. Licensee MDPI, Basel, Switzerland. This article is an open access article distributed under the terms and conditions of the Creative Commons Attribution (CC BY) license (http://creativecommons.org/licenses/by/4.0/).
Share and Cite
Labant, S.; Bindzarova Gergelova, M.; Kuzevicova, Z.; Kuzevic, S.; Fedorko, G.; Molnar, V. Utilization of Geodetic Methods Results in Small Open-Pit Mine Conditions: A Case Study from Slovakia. Minerals 2020, 10, 489. https://doi.org/10.3390/min10060489
Labant S, Bindzarova Gergelova M, Kuzevicova Z, Kuzevic S, Fedorko G, Molnar V. Utilization of Geodetic Methods Results in Small Open-Pit Mine Conditions: A Case Study from Slovakia. Minerals. 2020; 10(6):489. https://doi.org/10.3390/min10060489
Chicago/Turabian StyleLabant, Slavomir, Marcela Bindzarova Gergelova, Zofia Kuzevicova, Stefan Kuzevic, Gabriel Fedorko, and Vieroslav Molnar. 2020. "Utilization of Geodetic Methods Results in Small Open-Pit Mine Conditions: A Case Study from Slovakia" Minerals 10, no. 6: 489. https://doi.org/10.3390/min10060489