Issues of Healthcare Planning and GIS: A Review


Department of Urban and Regional Planning, Faculty of Architecture and Planning, King Abdulaziz University, Jeddah 80210, Saudi Arabia
*
Author to whom correspondence should be addressed.
ISPRS Int. J. Geo-Inf. 2020, 9(6), 352; https://doi.org/10.3390/ijgi9060352
Submission received: 3 March 2020
/
Revised: 21 May 2020
/
Accepted: 25 May 2020
/
Published: 27 May 2020
(This article belongs to the Special Issue GIS in Healthcare)
Abstract
:Introduction: For the past 2400 years, the spatial relationship between health and location has been a concern for researchers. Studies have been conducted for decades to understand such a relationship, which has led to the identification of a number of healthcare planning issues. Geographic Information Systems (GIS) technology has contributed to addressing such issues by applying analytical approaches at the level of epidemiological surveillance and evaluating the spatial inequality of access to healthcare. Consequently, the importance of reviewing healthcare planning issues and recognition of the role of GIS are integral to relevant studies. Such research will contribute to increasing the understanding of how to apply analytical approaches for dealing with healthcare planning issues using GIS. Methods: This paper aims to provide an examination of healthcare planning issues and focuses on reviewing the potential of GIS in dealing with such issues by applying analytical approaches. The method of a typical literature review was used through collecting data from various studies selected based on temporal and descriptive considerations. Results: Researchers have focused on developing and applying analytical approaches using GIS to support two important aspects of healthcare planning: first, epidemic surveillance and modeling, despite a lack of health information and its management, and, second, evaluating the spatial inequality of access to healthcare in order to determine the optimum distribution of health resources. Conclusion: GIS is an effective tool to support spatial decision-making in public health through applying the evolving analytical approaches to dealing with healthcare planning issues. This requires a literature review before preparing relevant studies, particularly because of the continuous development of GIS technologies.
1. Introduction
The relationship between health and place has long been acknowledged [1] and a concern of scientists and researchers. The Hippocratic treatise was written 2400 years ago, to describe “Airs, Waters, and Places” [2]. Intensive research continued to examine the relationship between health and place by producing maps of disease over 200 years ago [3], which led to the founding of epidemiology in the early 19th century by geographers [2].
However, there are many major issues affecting public health, which have led to geographical studies with an important and effective role in understanding a spatial relationship between the place and health, and enhancing aspects of community health, in addition to planning healthcare services [4]. In addition, understanding the relationship between health and place has led to the emergence of a number of healthcare planning issues that affect the public health of people. In general, the incompatibility between supply and demand is the basis for issues of healthcare service planning, where the disparity between supply and demand creates an imperfect healthcare system. In other words, spatial planners should represent the healthcare services in geographical areas in line with the size of demand in such areas. Truthfully, it cannot be said that there is an ideal healthcare system globally; for example, there is no ideal healthcare system in the southern-world countries. Furthermore, when looking at the northern-world countries that are more developed than the southern-world countries, we find that there is similar inequality, where many urban areas are disadvantaged in terms of utilizing healthcare services [5]. Hence, the interest of researchers and spatial planners has focused on how to deliver healthcare services equitably and effectively to all individuals of society. Fortunately, the recent emergence of GIS has enhanced the understanding of the spatial relationship between health and place, thus, it is considered as an effective tool for dealing with healthcare planning issues [6].
From this standpoint, before starting work on any study of healthcare planning, a review should be undertaken of the most important issues that have attracted the interest of researchers and spatial planners during the past three decades, and that remain a focus today. In addition, what is the role of GIS, as a helpful tool, in dealing with these issues? A literature review will be a useful contribution in providing a a broad understanding of how analytical approaches related to GIS are applied to dealing with healthcare planning issues.
This paper seeks to provide a useful contribution in addition to what has been presented within previous studies and research, where it demonstrates in a different way a number of healthcare planning issues, and highlights analytical approaches using GIS in dealing with these issues. The paper will contribute to reaching the most important issues that need further investigation, analysis and visualization to be considered as future trends that health organizations and officials should deal with using GIS technology. Moreover, the paper will discuss the most important challenges and obstacles that health organizations and officials face in applying GIS. The focus of the presented paper will be on a number of issues that have not been extensively discussed in most of the previous studies and research as the authors have believed. Accordingly, the objectives of this paper are as follows:
- Identifying the most important historical gaps related to health geomatics based on understanding the spatial relationship between health and place. This will contribute to defining the most important healthcare planning issues that health organizations, institutions and researchers have been dealing with using GIS technology.
- Discussing five independent issues related to healthcare planning, unlike most previous studies and research that focused on reviewing one or two major issues (e.g., epidemiological planning or health resources allocation).
- Presenting a largest possible number of useful GIS analytical approaches related to each discussed issue of healthcare planning. This will contribute to defining the gaps that need further investigation, analysis and visualization under each issue.
2. Methods
This paper aims to provide a literature and critical review to examine healthcare planning issues, and the potential of GIS in dealing with those issues. The method of a typical literature review was used in this paper to recognize how to use GIS in applying analytical approaches for decision-making associated with healthcare planning. In addition, this method will help in identifying recent trends, the written research regarding the use of GIS in dealing with healthcare planning issues, and the issues that require further investigation. The literature review included a set of studies, articles, and papers about public health, healthcare planning, and GIS modeling that were published between 1978 and 2020. The literary review was undertaken between October 2019 and mid-March 2020, when the authors of the present paper reviewed 132 titles. After review, this paper focussed on 73 titles, while 59 titles were excluded because they lacked at least one of these attributes: (1) focus on the healthcare aspect; (2) focus on the GIS aspect; (3) available full text or (4) a detailed description supporting results and recommendations. However, the reader is first introduced to a brief history of health geomatics and the emergence of GIS. This will contribute to understanding the relationship between health and place, and the developments of this relationship over history. This follows a review of the health concept, in addition to a review of the spatial planning concept, and its role in providing an effective healthcare system. Finally, we discuss healthcare planning issues, and present the role of GIS in dealing with these according to development of GIS technologies. In addition, we classify the spatial distribution of studies reviewed that included the use of GIS technology in dealing with relevant issues.
3. Results
3.1. Brief History of Health Geomatics and GIS
The relationship between health and place was discovered in the distant past. The identifcation and study of this relationship began with the father of medicine, Hippocrates. In his treatise, which is about airs, waters, and places, he mentions that people who live in rough, mountainous country at high elevation, which is characterized by well water and great differences of climate associated with the various seasons, will have large physiques and display hardiness and bravery, with no small degree of wildness in their character. On the other hand, he mentioned that people who live in low, stifling lands that have cold winds and warm water, will be neither large nor slight but rather broad, and bravery and hardiness are not an integral part of their natural characters. Consequently, he deduced that people who live on lowlands near waterways were more likely to develop malaria. In addition, Hippocrates (Figure 1) also wrote about topics such as the different characteristics of cities and how they influence the public health of people [1].
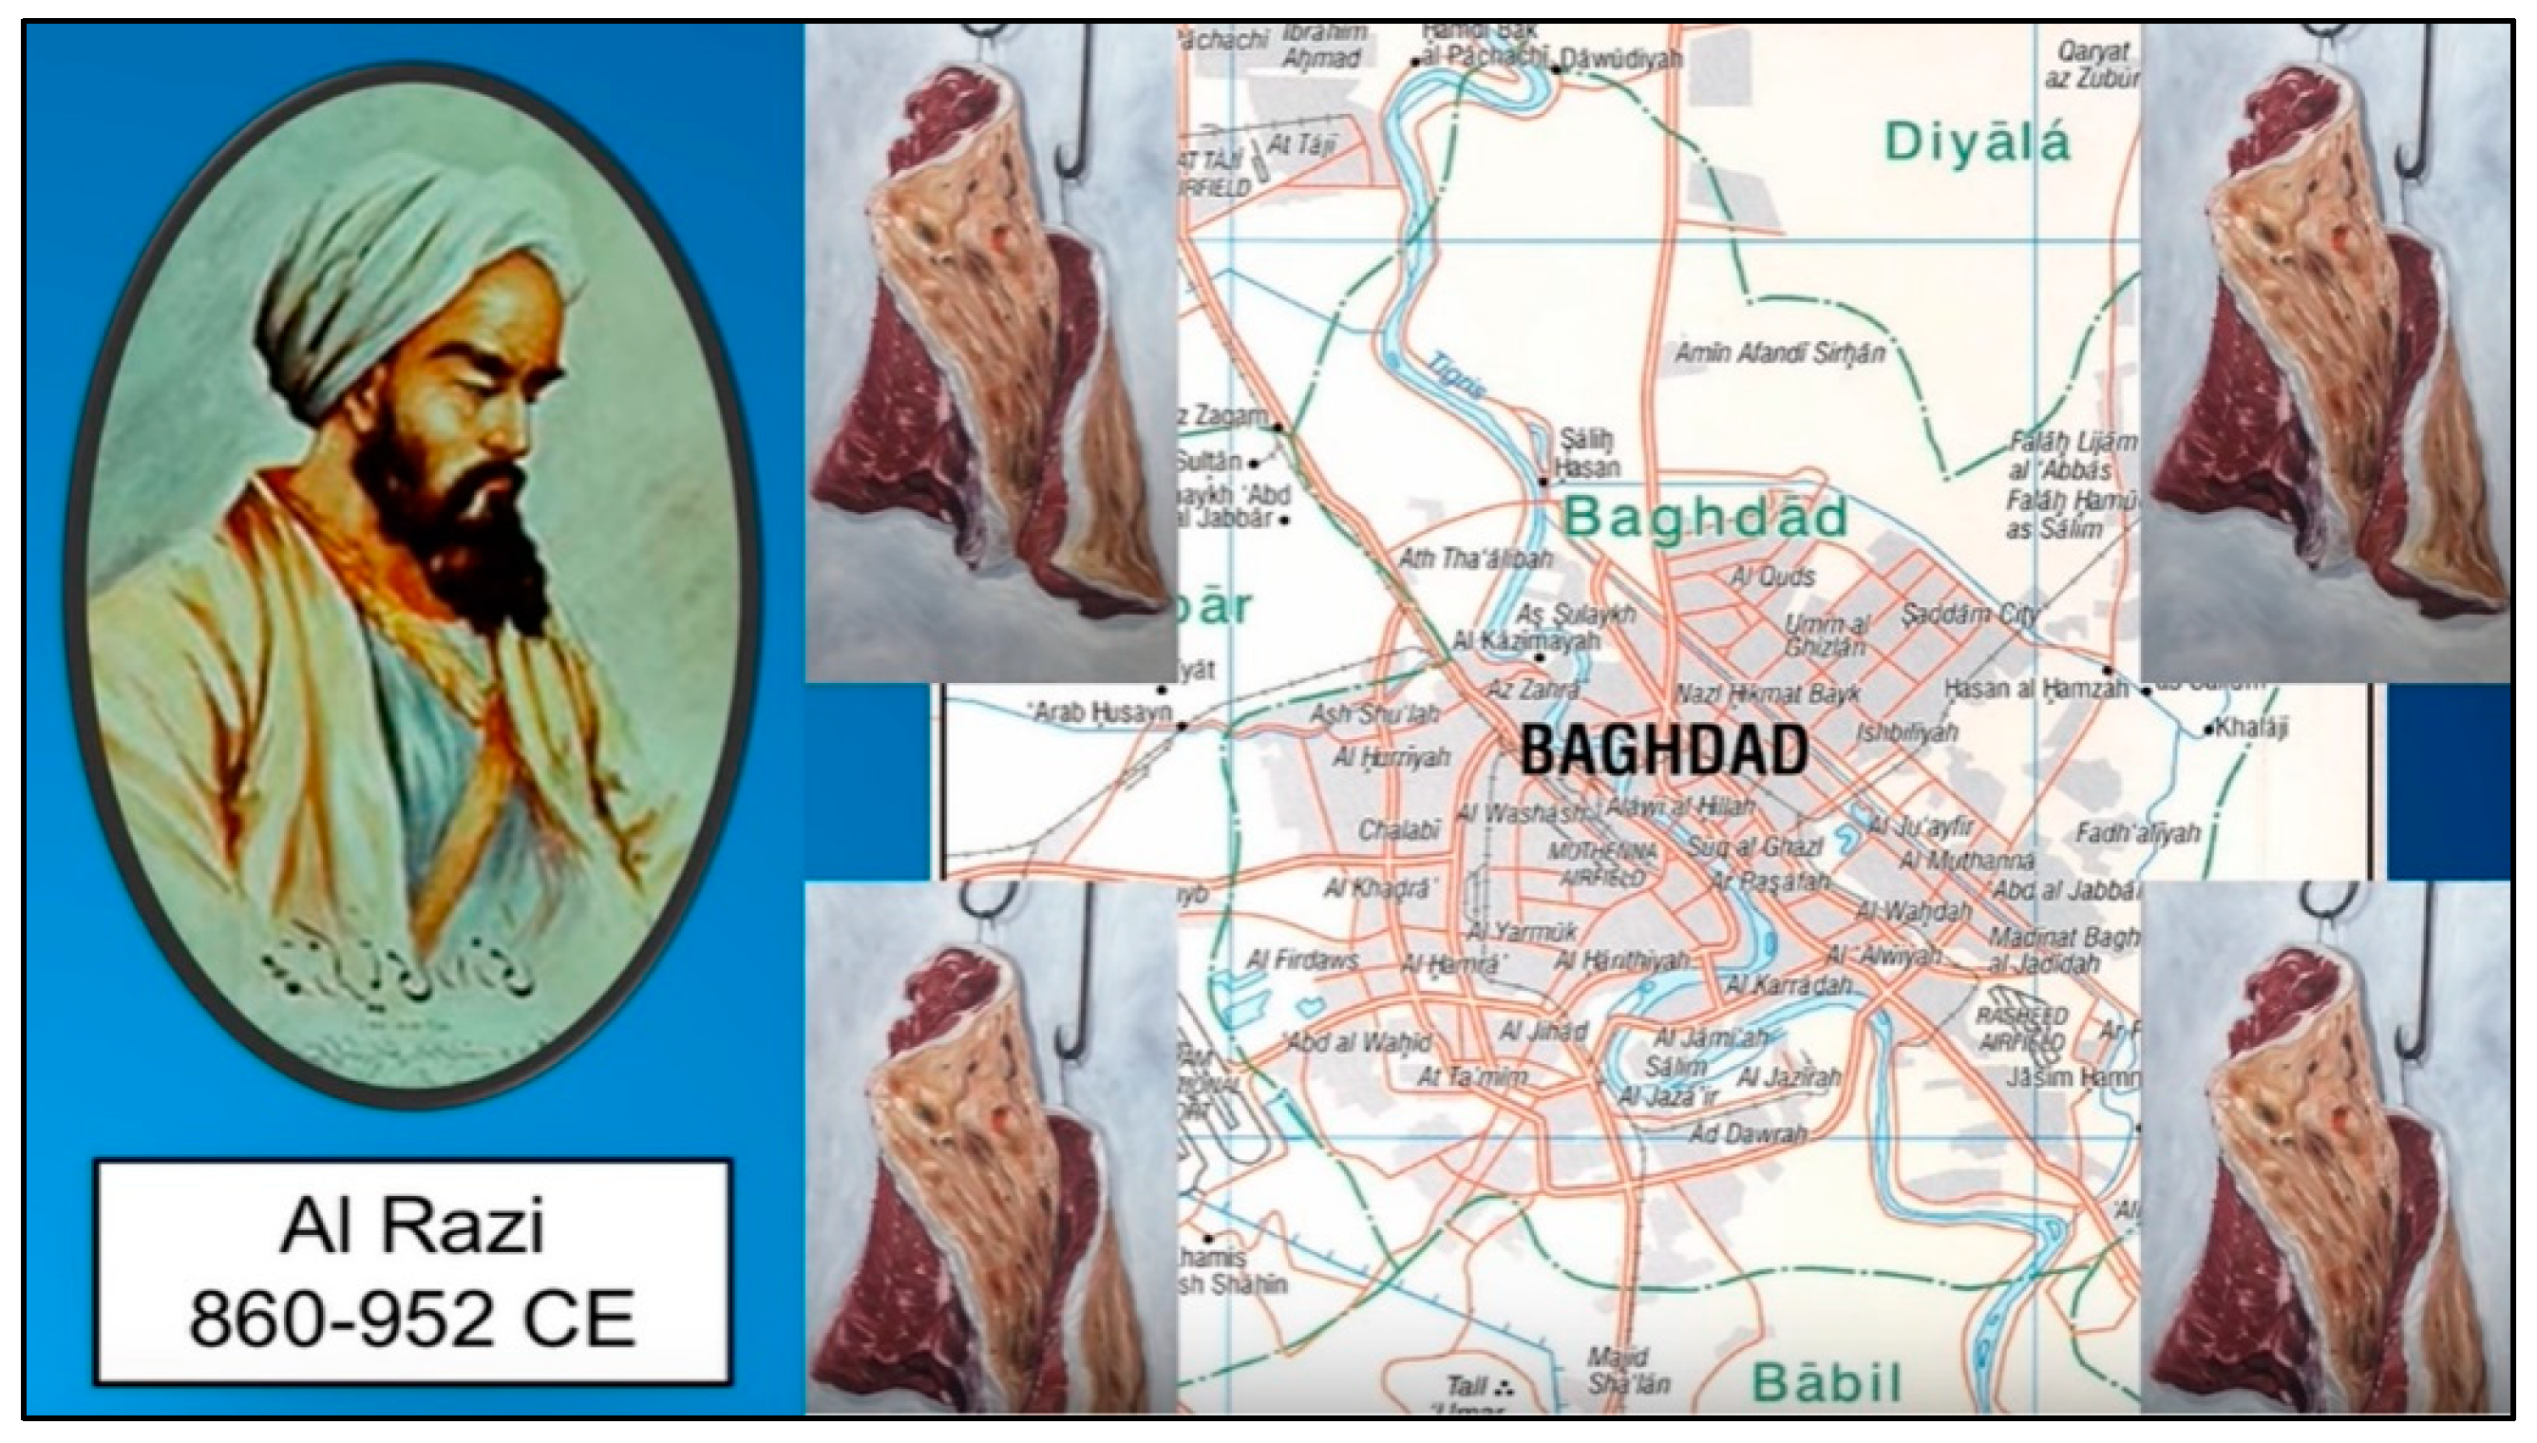
Another example dates to almost 1500 years ago, specifically to the Persian physician and spatial thinker, Al-Razi (Figure 2), who found the best location to build a hospital in Baghdad City. Al-Razi made his spatial decision by placing pieces of meat in wooden columns in different places in Baghdad City. He checked the pieces to determine where the last piece became spoiled. He then decided to build the hospital in the location of that piece because it was free from smoke and dirt, and thus was the cleanest and healthiest of the options, providing a space for patients in need of air that was fresh and free from contaminants [1].
However, according to Koch and Tom [7] and Geraghty [1], the first spatial health map of plague disease spread was produced in Bari, Italy, 1694 (Figure 3). The plague is considered one of the most fearful diseases of all. At that time, nothing was known of what caused the plague disease or its spread. The plague was contained through three spatial decisions. These decisions were designed within the health map produced by the royal auditor Philip Arrieta. First, there was a coastal patrol to contain the active disease. Second, a wall separated the active area of the disease from healthy areas, with tents placed to symbolize troops to enforce the quarantine. Third, there was a general cordon to protect the full province, and this cordon was also monitored by troops. As shown in the figure below, cities were represented using simple drawings of either a church (with a cross) or a hospital (without a cross), and trees were used to show uninhabited areas.
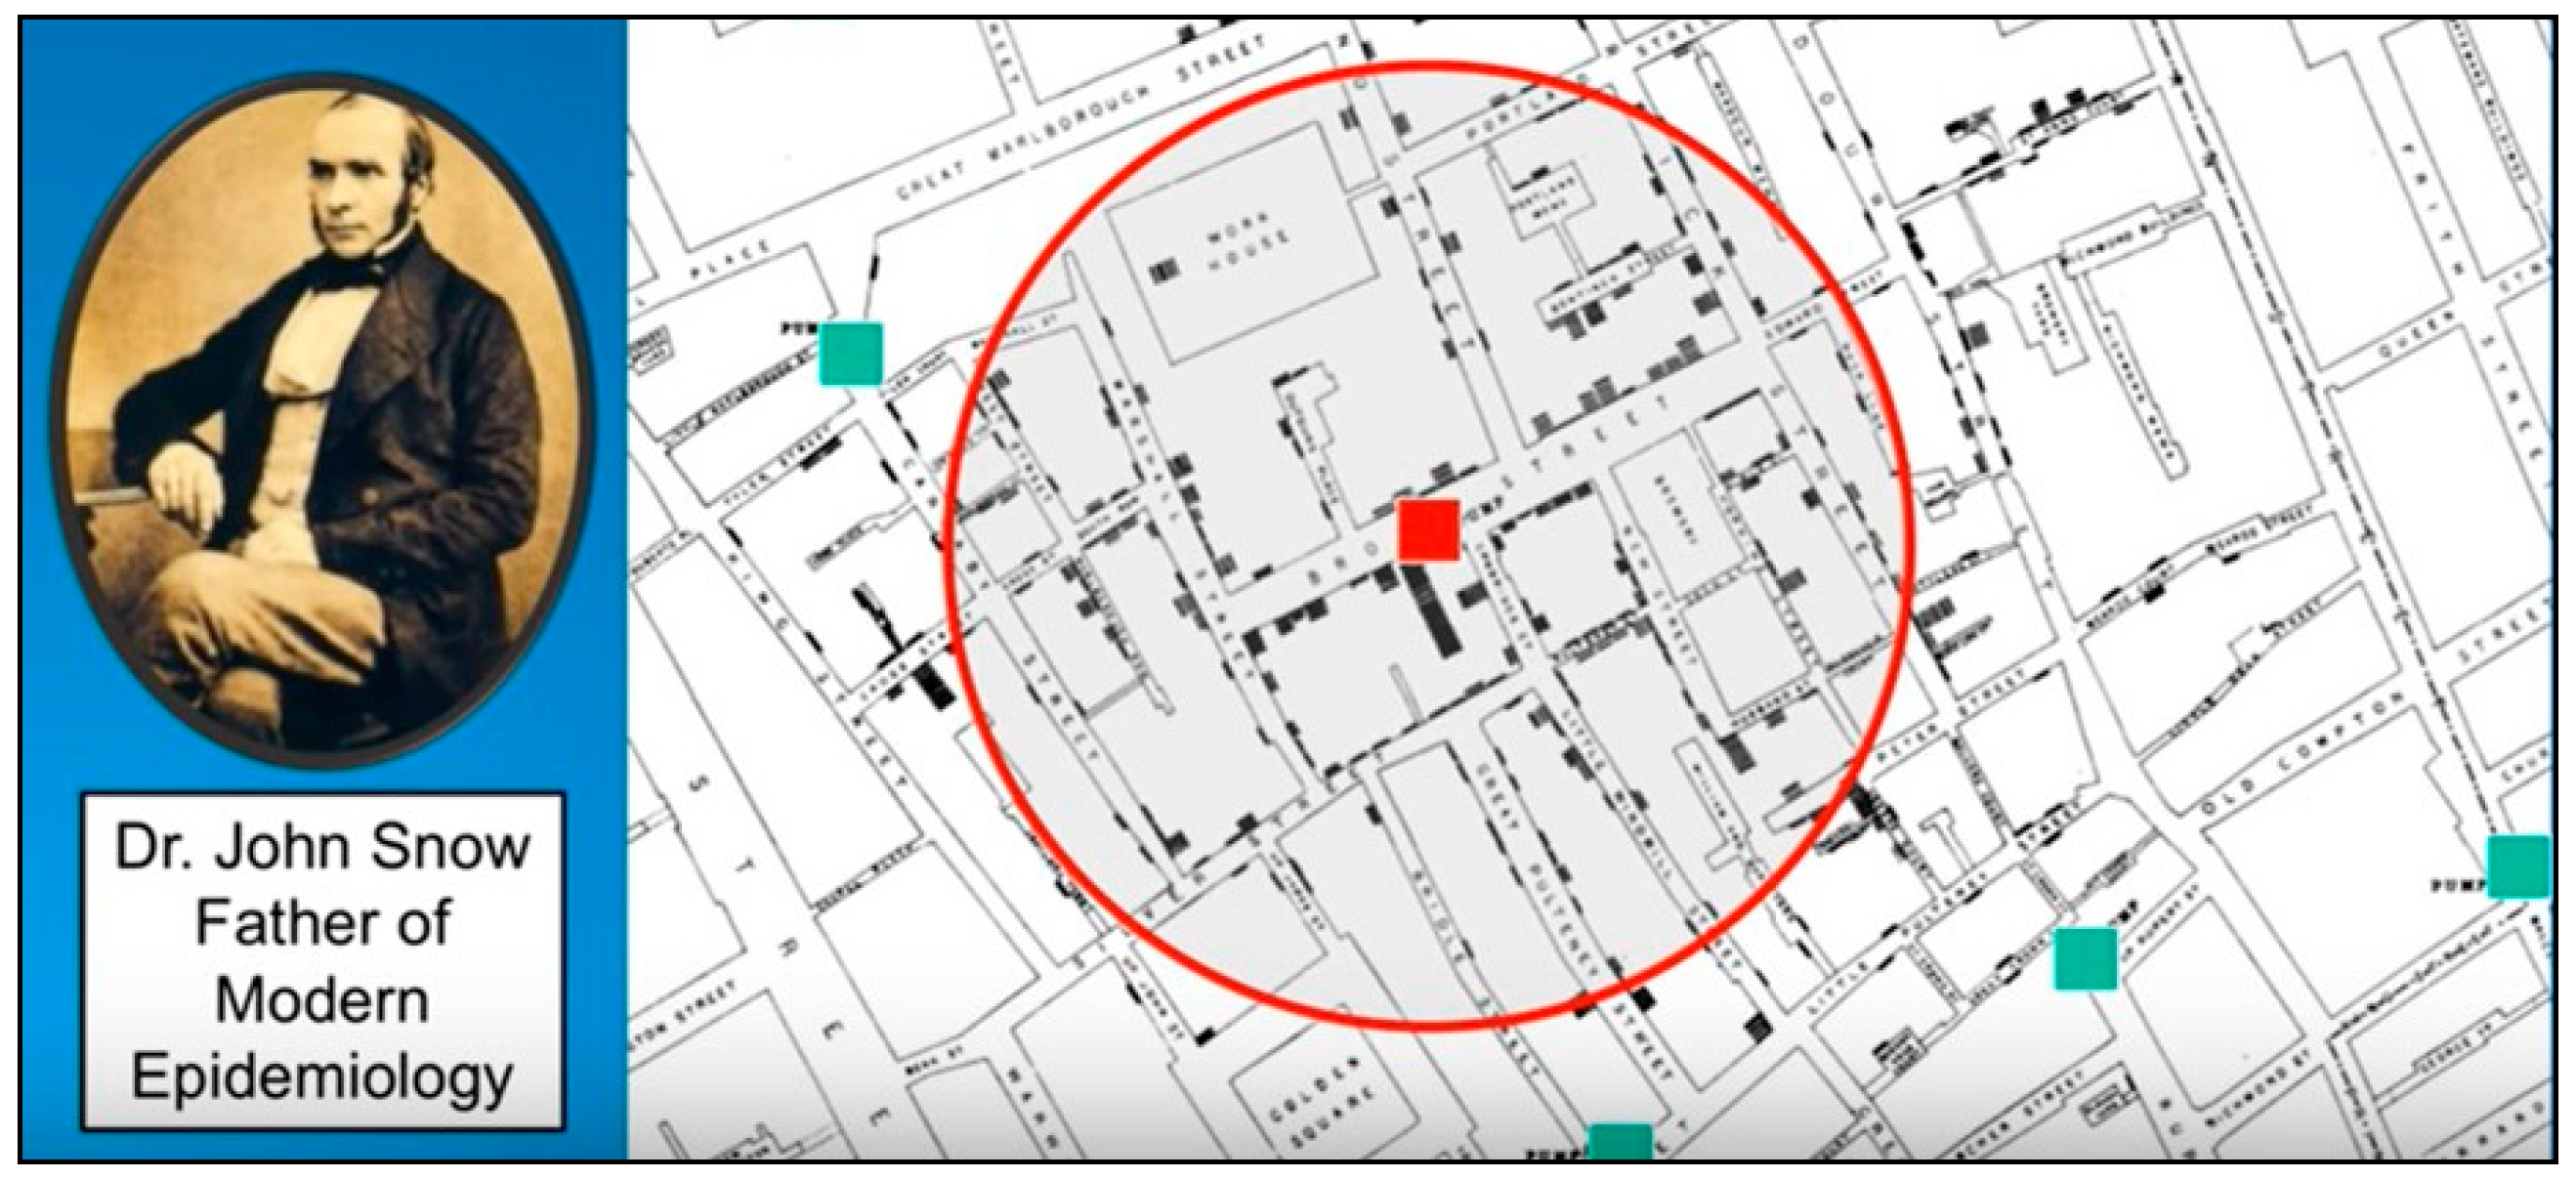
The history of GIS in the field of spatial health actually began in 1854 when the cholera epidemic hit the city of London, England. Indeed, this epidemic killed at a rate of 500 people per week. The hero of this issue was Dr. Snow, who is known as the father of modern epidemiology. Dr. Snow took a different approach in dealing with this epidemic through drawing spatial maps that included a number of represented features relevant to the disease (e.g., outbreak locations, roads, property boundaries, and water lines). As shown in Figure 4, when he added these features to the map, he discovered that cholera cases existed along water lines, with a significant number of deaths (black color on the map) centered around the water pump. Hence, spatial maps proved that cholera cases were spreading through water, while many believed that the disease was spreading through air [1,8]. According to GisGeography [8], Dr. Snow’s cholera epidemic map was an effective bridge linking geography and public health; in other words, he emphasized that there was a relationship between the place and health. This map is considered to be the beginning of the spatial analysis that later supported the field of epidemiology, specifically in studying the spread of diseases. Dr. Snow’s work proved that GIS is an effective tool for solving problems and making spatial decisions.
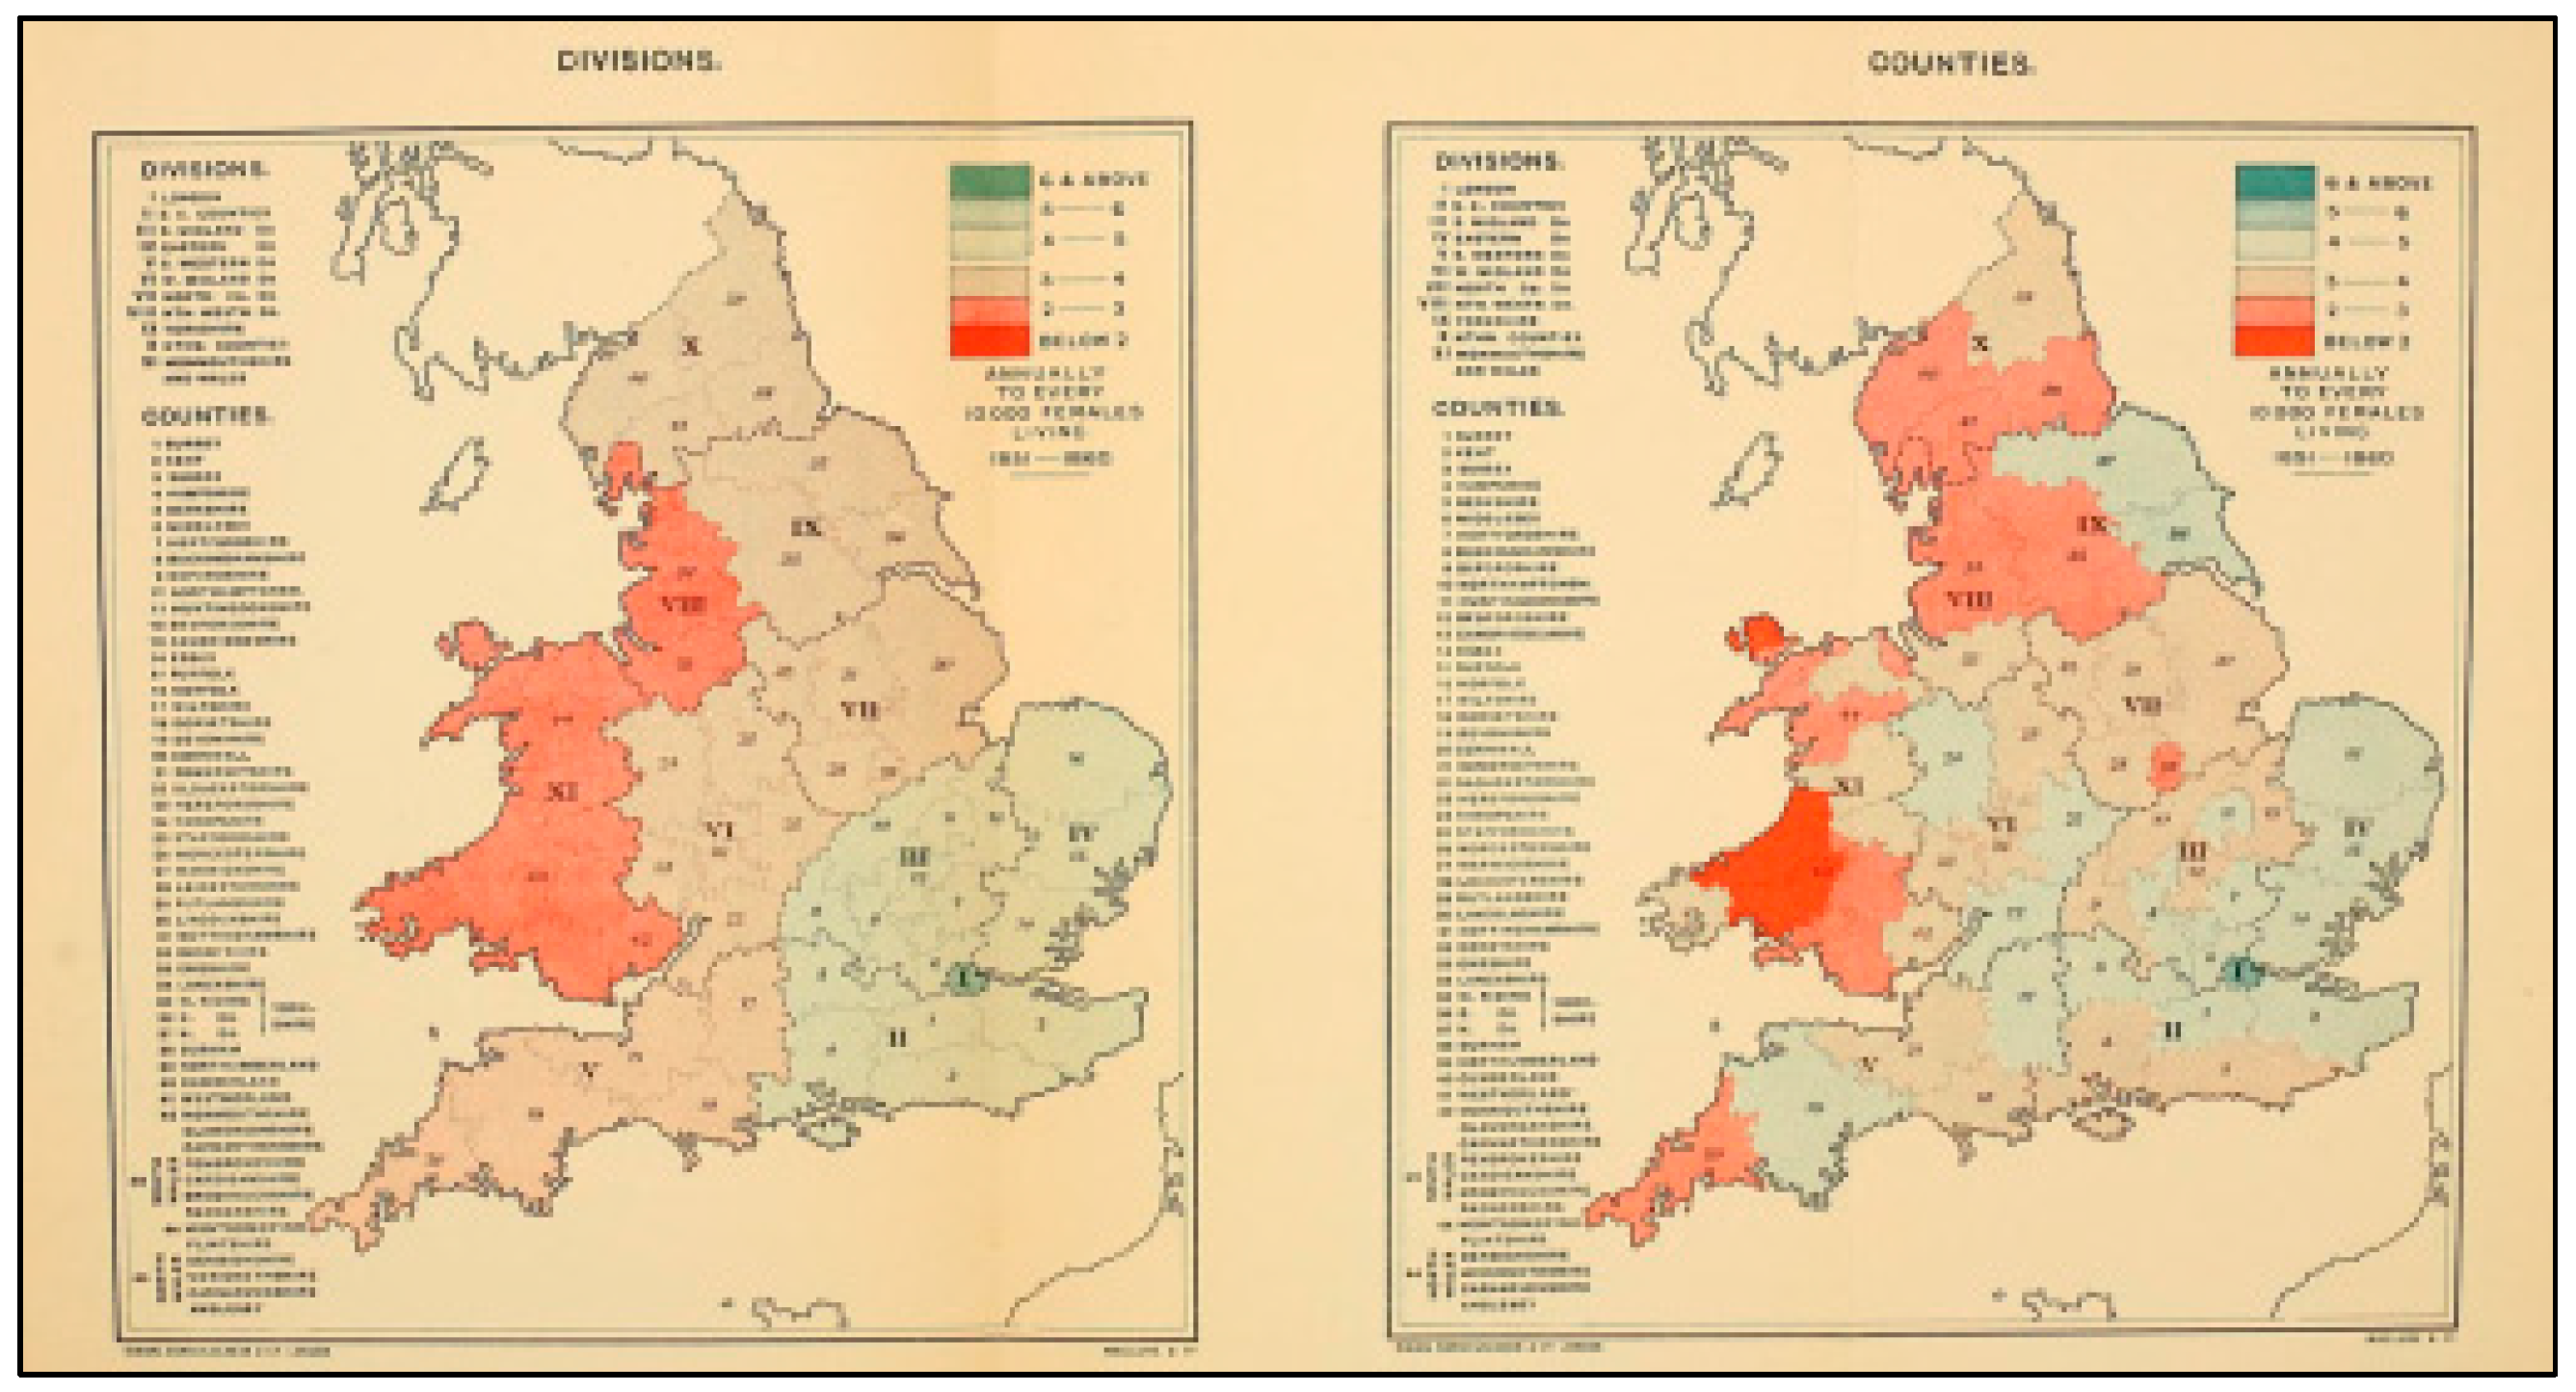
The work of Dr. Snow enhanced a continuation of the GIS concept to support public health, especially in epidemiology [9]. Historically, one of the leading works in the history of GIS and health was published in 1875 when Alfred Haviland produced the first atlas of color maps for cancer disease in the Divisions and Counties of England and Wales to locate areas with a high cancer rate. He used the maps to prepare an argument based on environmental risk factors of the disease, of which the most important was mineral production [10,11]. Later, the work of Haviland (Figure 5), reflected the importance of GIS in studying cancer, where it contributed to enhancing the analytical capabilities of epidemiologists and health officials. Thus, his work has enabled officials to detect environmental risk factors and their relationship to cancer, especially in the 1970s. In the present day, GIS can be used to produce cancer maps with a set of statistical and spatial analyses [12].
The spatial maps produced by the preceding works were printed on paper. The transition from paper maps to digital maps ocurred after the emergence of computer systems, specifically in the period between 1960 and 1990, during which the leading GIS systems were developed and marketed, including the software of Esri [8]. According to Clarke et al. [14], computer systems were applied to geographical sciences during the 1960s, while GIS was applied to scientific fields during the 1970s. That contributed to producing maps easily, and facilitated the overlap of urban and health planning maps for selecting suitable areas and locations for expansion based on several criteria. Moreover, the process of managing spatial (geographic) databases was also facilitated.
However, one of the leading global organizations that has used GIS software in healthcare planning and disease control is the Center for Disease Control and Prevention (CDC), which began using GIS in the 1990s [15]. The CDC was established on July 1, 1946, in Atlanta, Georgia, USA. Initially, the primary mission of this center was to prevent malaria from spreading across the nation. The center faced major challenges to overcome mosquitoes with a budget of USD 10 million and only 400 employees, while the healthcare services provided were few. In addition, there was a scarcity of medical epidemiologists in the USA during that period. However, despite these challenges, disease control was the primary goal of the CDC, and gradually the center overcame its difficulties to contribute to improving people’s public health [16].
During the 1990s, GIS technology became a major tool at the CDC. The center used this technology for improving people’s public health by surveillance of diseases, allocation of health resources, assessment of environmental risks, and management, analysis and modeling of spatial data [15]. However, according to the WHO [17], nearly 17 million people die from heart disease and stroke annually, with smoking and an unhealthy diet among the most important factors leading to these diseases. Consequently, at the beginning of the millennium, the CDC, in cooperation with the WHO, launched the “Atlas of Heart Disease and Stroke” based on ArcGIS technology (Figure 6). This project is considered one of the leading and most successful models in improving public health globally. The purpose of designing this atlas was to provide an accessible reference for decision-makers in public health, ultimately leading to the reduction of heart disease and stroke-related deaths in the US by allocating health resources according to needs within specific geographic areas.
GIS technology and software have evolved since 2000, especially in methods of spatial analysis and modeling of public health [19]. For example, according to Aghajani [20], the International Health Organization in Europe proposed the use of GIS to detect diseases in contaminated water areas in 2003. GIS contributed to caring for patients and managing their movements to ensure that they avoid disease areas. In addition, in 2006, the Environmental Protection Agency proposed a strategic plan for GIS to investigate a West Nile virus outbreak in Pennsylvania, USA. By studying and analyzing a number of factors that contributed to spreading the virus easily, such as mosquitoes, blood transfusion, breastfeeding, and hospital infection, the agency succeeded in determining the original location and extent of transmission of the virus through healthcare centers using GIS. However, development of GIS technology and software in the period since 2000 has also contributed to emerging new trends that enhance using GIS as a tool for improving public health. These trends are considered as issues in health planning, the most important of which are the monitoring of epidemic diseases, accessibility and utilization of healthcare, disease mapping and its spread patterns, health information management, and allocation of health resources [21]. Although the examples covered in this section may not cover the entire history of GIS development, they identify individuals and institutions that have played a major role in the development of GIS and its relationship with public health.
3.2. Overview of Healthcare Planning
Health is a basic human right that every individual should be able to enjoy at the highest possible level [22]. However, it is an elusive term and can be defined in different ways; according to the WHO, health is the foundation upon which physical and mental strength and social well-being is based [23]. In light of this definition, it is clear that a healthy society can contribute to supporting social and economic development, where its individuals will be more productive and effective due to their good mental and physical ability and high social well-being. However, there is a strong correlation between economic growth and healthcare; whenever rate of economic growth increases, governments will provide equitable and balanced healthcare that meets all the needs of society’s individuals. On the other hand, economic growth may not support the provision of equitable healthcare due to several reasons, the most important of which are the lack of available health resources and the weak preparation and implementation of short- and long-term plans for distributing healthcare services across geographic areas that have different population densities [24].
During the 1970s, the WHO and UNICEF adopted the “Health for All” strategy globally due to weakening health levels of people caused by a number of factors, the most important being poverty, and poor living conditions and nutrition. This strategy sought to achieve the highest possible level of health for people, taking into account how to maintain that level, so that people can work well with effective social participation. Therefore, such a strategy consists of a set of services that contribute to protecting people from diseases, and enhancing their treatment options with low costs. This strategy sought to achieve the highest possible level of health for people according to five basic principles: (a) adopting several sectoral programs; (b) preventing an outbreak of disease; (c) making decisions by community; (d) using suitable technologies; and (e) achieving equitable accessibility and spatial distribution of healthcare services [23].
Spatial equality in access to healthcare can be achieved by understanding a concept of spatial planning, and its role in providing an effective and equitable healthcare system for all [25]. However, spatial planning is a set of methods used to address the distribution of individuals and activities in different places and periods [26]. In other words, it is a set of structured actions that can be implemented in a specific period of time at one or several spatial levels (national, regional, local). A range of tools and methods are used over spatial planning to make the best sustainable use of available natural and human resources. This type of planning seeks to create the desired change in the society with the guidance, control, and follow-up of this change in different aspects of life to prevent any negative effects. At the health level, the spatial planning of the healthcare system can be defined as a detailed policy to provide healthcare services to all individuals; for example, programs and projects aimed at achieving the perfect health level of the individual and society with specific characteristics in an given period of time, by making the best use of the available materials and human resources [23].
The healthcare system consists of organizations, institutions, and resources aimed primarily at improving public health. Such a system must provide services that meet existing and future needs, that all individuals can access equitably. Nevertheless, there are a number of issues relating to healthcare systems of both developing and developed countries, the most important of which is that there are population groups with poor utilization and access to healthcare services because the equality principle is not taken into account in the planning of healthcare services. The inequality of spatial distribution of healthcare services can be overcome by practicing standards-based spatial planning for such services, thus eventually contributing to improving the spatial performance of the healthcare services system in general [23].
In light of the above, when agencies or ministries intend to adopt strategies or plans related to the allocation of healthcare services, consideration must be given for how to provide equitable access and to overcome spatial disparities. This requires taking into account spatial planning standards for the distribution of healthcare services in a specific geographical area, thus highlighting the importance of studying the spatial distribution of population densities and estimating demand for the services. Moreover, spending financial resources on healthcare services must ensure health benefits are achieved for people that equal the real value of spending. In other words, there must be a balance between the fair provision of such services and their operation at high efficiency.
3.3. Issues of Healthcare Planning and GIS Role
Several references, such as [4,27], identified the most important major issues affecting the health of societies. These issues will be reviewed, in light of the role of GIS in dealing with them, over the past three decades. In addition, the concentration will be on reviewing and discussing only empirical issues that are concerned with how to plan and organize healthcare services (spatially) within a specific geographical area.
3.3.1. Epidemiological Planning and Disease Mapping
One of the most important research areas during the past two decades is the study of spatial epidemiology by GIS [28]. However, the study of spatial epidemiology requires answering a number of important inquiries, the most important of which are: Where do these epidemics occur? What are the environmental factors that lead to outbreaks of epidemics? What is the evolution of the spatial patterns of these epidemics? [29]. These questions can be answered through the GIS tool. For instance, GIS can determine the locations of epidemics, and uses demographic, economic, and environmental data to study and analyze spatial relationships within the affected area [30].
The epidemiological planning issue has been supported by various GIS studies in the healthcare planning area [31]. Geographers and spatial planners have focused on modeling epidemic diseases in many studies [32]. The socioeconomic characteristics of the population are considered one of the most important factors on which epidemiology studies are based. Mapping the spatial distribution of epidemic diseases can be implemented by a number of methods, the most important of which is the method of choropleth GIS maps. Through these maps, disease rates are drawn on a basic map in order to determine the severity of and vulnerability to an epidemic disease. Moreover, the spatial distribution of epidemic diseases can also be implemented by modeling the prediction of disease risk using the kernel estimation method [33].
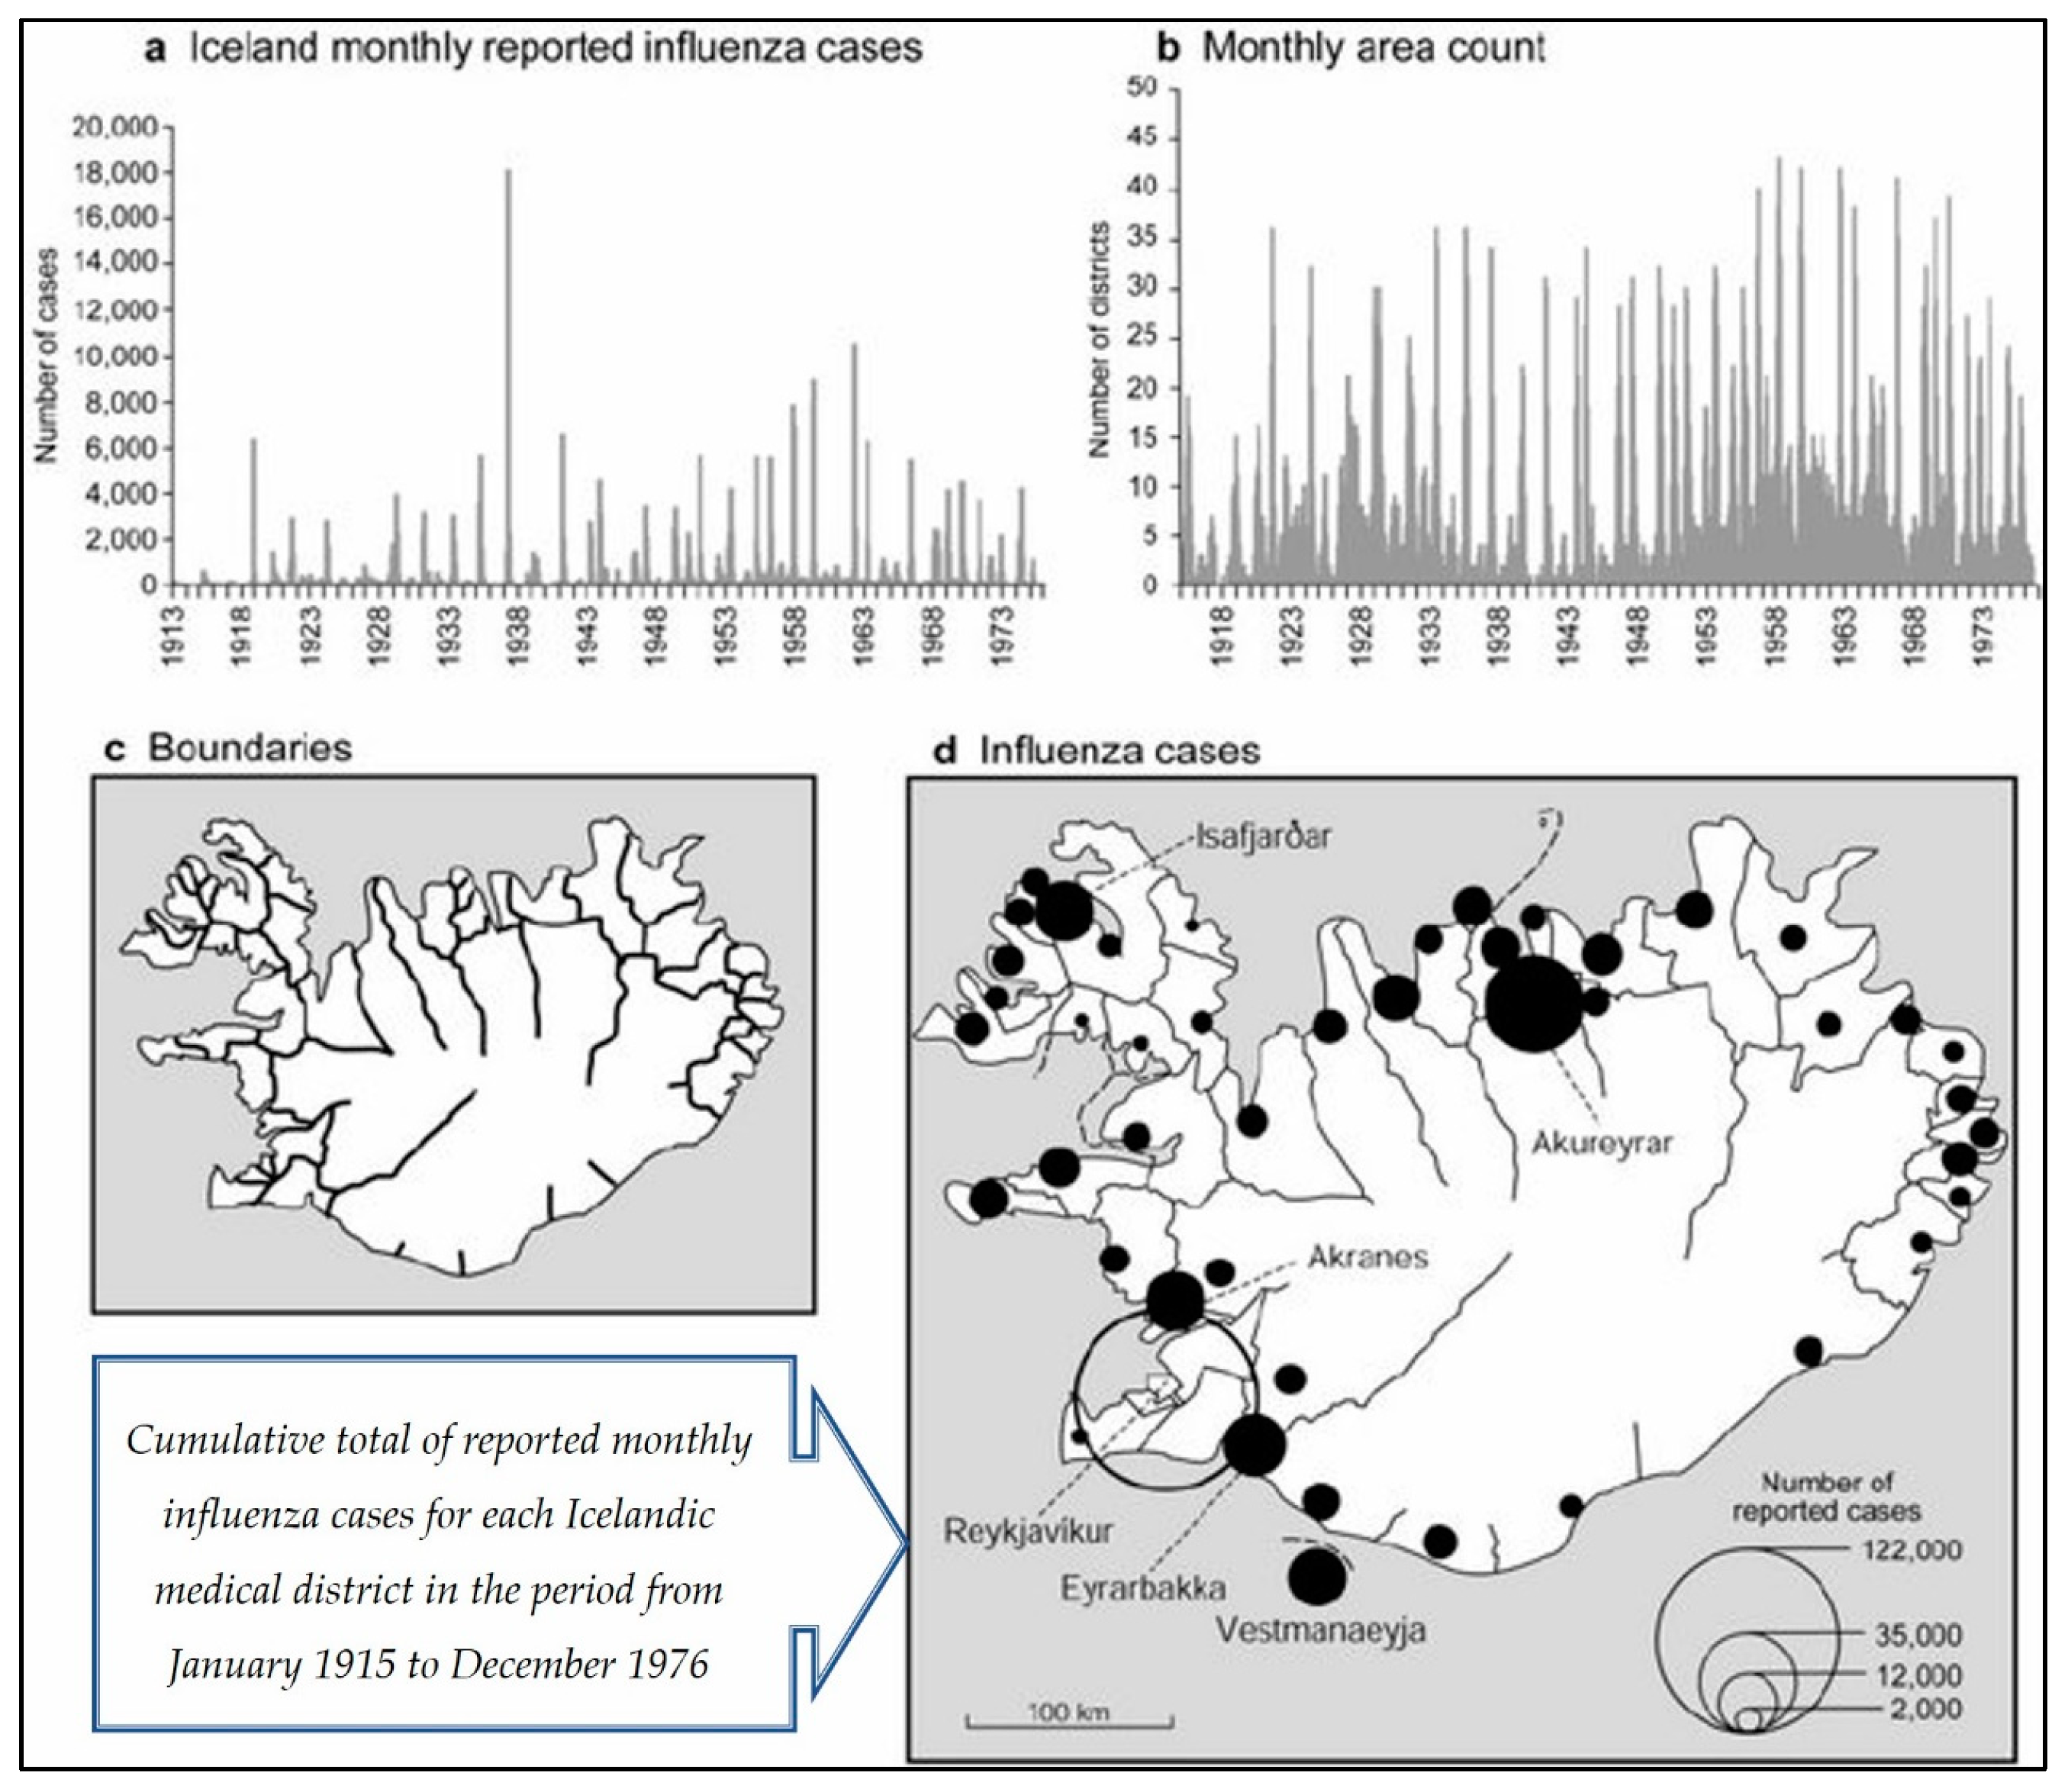
There are a number of studies that have shown that GIS is a useful tool for epidemiological planning [19]. Cliff, Haggett and Ord [34] studied and analyzed influenza outbreaks in Iceland (see Figure 7). Before 1900, there were no records of this disease in Iceland. In contrast, the outbreak of the disease over a period of three decades contributed to providing a useful mapping test related to spatial patterns of disease spread. They found that the infection moved and spread hierarchically through the air. It moved from Reykjavik (the capital) to the smaller provinces, and then to the small towns, and eventually to the rural areas. When looking at the map outputs, it became clear that the hierarchical and spatial aspects of the patterns of disease spread were useful to spatial planners. This eventually contributed to overcome the influenza disease across urban and rural areas. Gould and Wallace [35] also used a hierarchical process to observe that HIV/AIDS began to spread in the United States in the early 1980s. To remedy the situation and manage the spread of the disease, they used GIS to map the current status and potential future in terms of disease spread. Moreover, they tried to map the disease spread as clusters to contain and understand the disease.
In another work, Braga et. al [36] mapped lung cancer clusters in the cities of Viterbo and Lucca, Italy. Standard methods, such as kernel and Bayesian, were used to determine disease rates at the cluster level. Brown et al., [37] used GIS as an effective tool in investigating spatial inequality of the delivery of healthcare services in Merseyside, UK. Furthermore, Wrigley [38] used GIS to model the disease-affected areas according to the demographic characteristics and the socioeconomic variables of the population. In Johnson’s work [39], prostate cancer incidence rates were modeled using GIS in New York State. In this work, infection rates (SIRs) of prostate cancer were subjected to the hierarchical modeling of Bayesian by zip code to determine the relative performance of spatial data. In this work, spatial data were linked to air quality data.
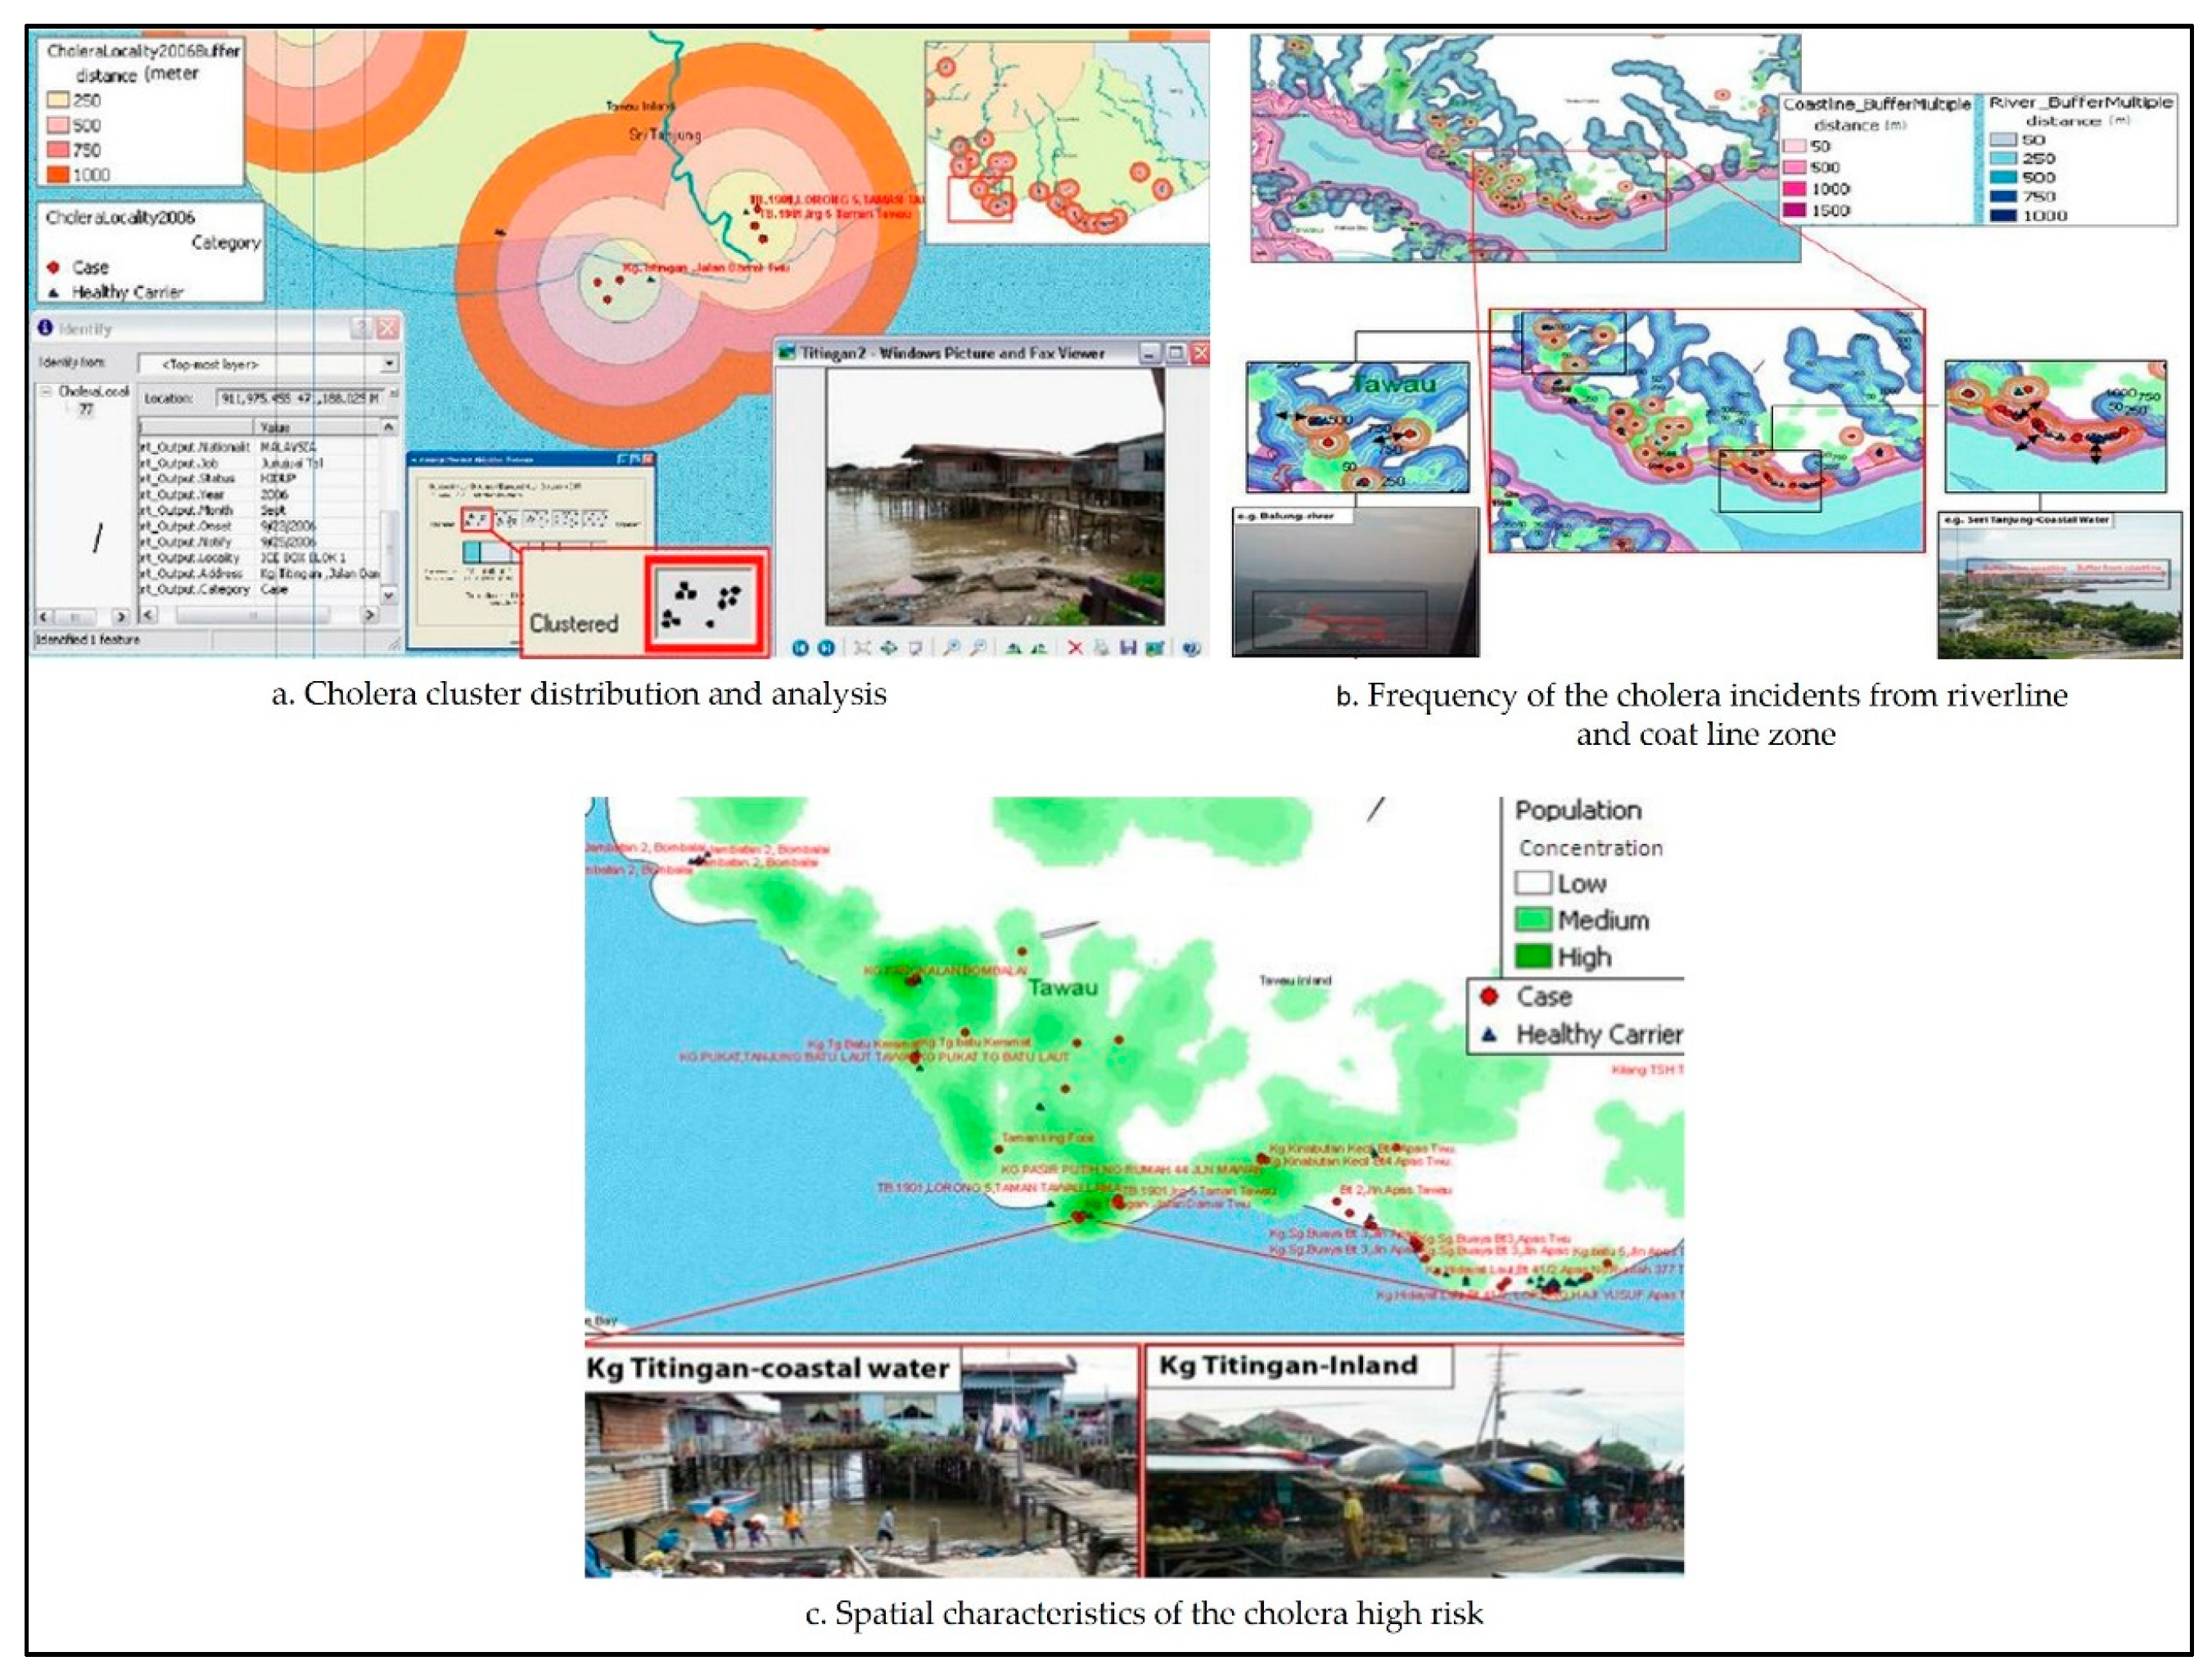
In the area of integration between GIS and epidemiological techniques, Rasam et al. [40] used an exploratory analysis approach to identify patterns of spatial distribution of cholera in the Sabah area of Malaysia. In this study, cholera cases were mapped using spatial statistics within a GIS enviroment (see Figure 8). An epidemiological technique (i.e., a cohort technique) was also used to examine the disease’s spread. As a result, it became clear that the disease was easily transferred from person to person, especially in the area within 1500 meters from the patient location and with contaminated water. Hence, this study showed that GIS is considered an effective epidemiological technique for mapping patterns of the spatial distribution and directions of disease.
Recently, the management of outbreaks of diseases such as Ebola and measles has become one of the most advanced practices in the epidemiological planning area. For example, during a measles outbreak in Disneyland in December of 2014, GIS maps played a large role in developing a general perception of the locations where children with the disease live, and the potential spatial directions for the spread of this disease. In addition, these maps have been recently used in the field of vaccination in various countries and throughout the United States to identify the locations that need higher rates of vaccination, as well as to identify the locations that seriously suffer from outbreaks of this type of disease [41].
According to Sones [42], GIS can map outbreak of diseases. In the USA, measles was thought to be eradicated in 2000. However, measles returned in 2019, with the CDC reporting at least 764 cases in 23 states. GIS maps related to the spread of measles were used by the Washington Post newspaper, where it appeared that most cases did not receive a vaccination, while 10% of those who were infected were vaccinated. However, it became clear through GIS maps that the incidence of measles has risen in geographical areas that contained children who had not received vaccination for the disease, and particularly of parents in 17 US states who were free to choose whether to vaccinate their children. Therefore, public health officials considered such areas as sources for the spread of measles. On the other hand, it became clear that measles may be transferred from one area to another through airborne hosts, especially in unvaccinated areas. Hence, decision-makers used GIS as a tool to compute measles cases and track the directions of disease outbreaks by mapping the disease. These maps helped decision-makers to reduce gaps in health services by identifying a number of factors (e.g., locations of patients, number of disease cases, and time period of the disease spread). Analysis of such data contributed to detecting areas of population suffering from a deficit of health services, and to identify optimal locations for these services in the future.
To sum up, many references were reviewed here to reveal what was written about the issue of epidemiological planning and disease mapping. A total of 12 studies were used to investigate the role of GIS in dealing with such issues. The studies focused on the United States, England, Italy, Saudi Arabia, India, and Malaysia. In addition, they included a total of 33 authors (range: from one author to seven authors), with half of the studies conducted by one author. Moreover, they were published by a total of seven core journals in the period from 1991 to 2019.
3.3.2. Accessibility and Utilization of Healthcare Services
GIS is an effective tool for dealing with issues of healthcare services, espicially those related to service location [43]. The WHO and the World Bank [44] emphasized that nearly half the world’s population faces difficulty in accessing healthcare. Thus, it is essential that easy and equitable access to healthcare services be available to all areas of the population, including those without private transportation [45]. However, there are many areas related to this issue, with the most important of them being: (1) identifying the optimal location for health care services; (2) understanding the relationship between the current locations of services and actual healthcare needs; and (3) evaluating spatial accessibility to healthcare services. There is also another very important question, namely, what are the healthcare needs for population, as well as how should authorities allocate healthcare resources to serve the population? Hence, GIS has the answer to this question [30]. For example, Jonhs and Bentham [46] used GIS to examine the relationship between healthcare and accessibility. Furthermore, Forbes and Todd [47] proposed the possible locations of new centers to treat cancer patients in England using GIS. Therefore, finding the optimum location of healthcare service is one of the resource optimization tasks for the health authority. However, there are a number of GIS models that help determine the best location for healthcare services, such as the models of location allocation that modern GIS software provides. Through these models, spatial planners can evaluate accessibility to healthcare service after identifying areas with poor accessibility to services locations. Then, they can provide planning proposals and interventions that contribute to improving poor accessibility to healthcare service locations [30].
Any study on accessibility and utilization of healthcare should be aware of a number of important factors, such as socioeconomic variables, need, equity, supply, and demand [48]. Many researchers and spatial planners have used these factors to enhance their spatial data for modeling accessibility and utilization of healthcare services [49]. For example, supply can be represented by the number of healthcare services provided in a specific geographical area or catchment area, as well as the spatial distribution patterns of service locations and their relevant operational capacity [50]. In the study of Khan and Bardwaj [51], socioeconomic variables were entered into their spatial data for developing a comprehensive understanding of accessibility. For example, they took into account the income, education, social class, insurance, and other variables that affect how people access and use healthcare services. Practically, to reach an integrated spatial model, the variables were linked to the spatial aspects of the location, supply, demand, time, and distance.
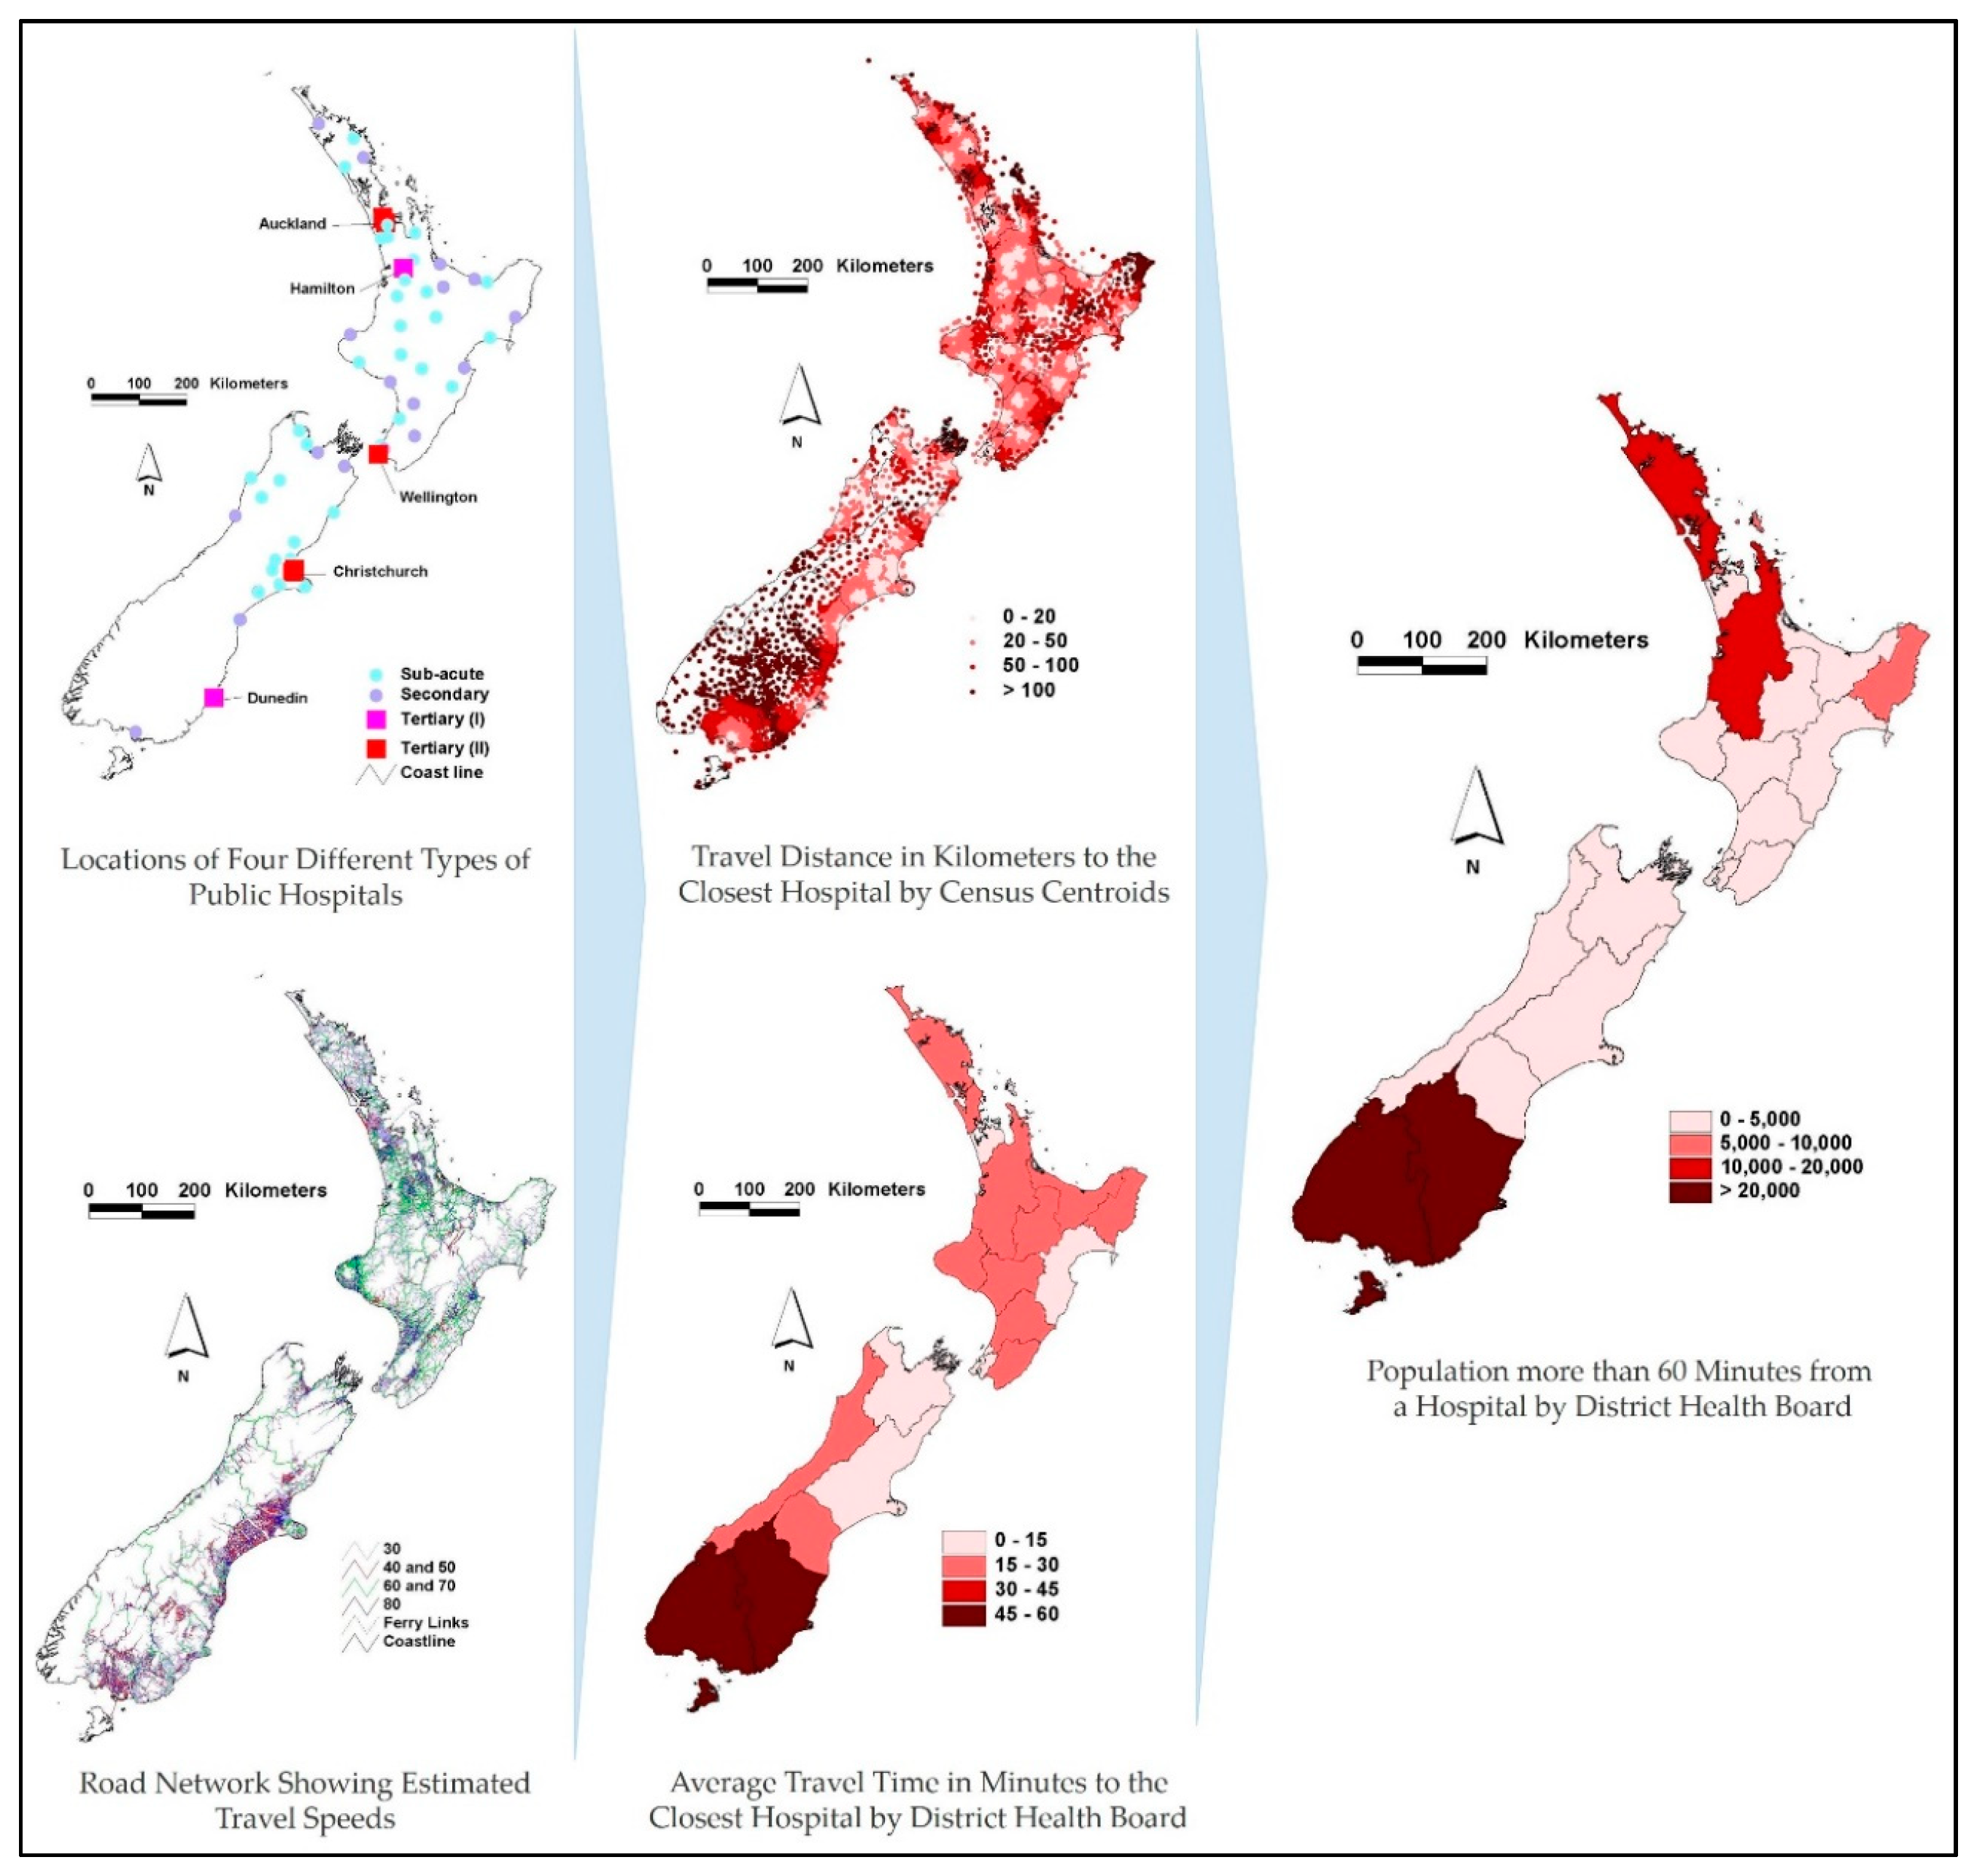
Before the advent of GIS, researchers and spatial planners used the traditional approach based on the Euclidean distance to model accessibility to healthcare services. Due to GIS, modeling accessibility to healthcare services has become more efficient and effective through using a new set of analytical approaches based on distance and travel time [49]. This modeling is based on the following spatial data layers: (1) the layer of healthcare service locations and their spatial distribution (supply) [52]; (2) the layer of population distribution and their demographic data (demand/need); and (3) layer of the transportation network linking potential patients and healthcare services [53,54,55]. These three preceding layers have become the most important basic spatial data that can be merged and overlapped in a GIS environment to model accessibility for the planning of healthcare services [4]. For instance, Brabyn and Skelly [56] merged the preceding layers in a vector (linear) GIS for modeling accessibility to public hospitals by distance and travel time across New Zealand. The accessibility scores were determined per area and population. As a result, they found that there are some locations with low accessibility to hospitals in New Zealand, particularly in northern and southern areas with high average travel times to hospitals (Figure 9). In addition, via GIS, Murad [57] created a geo-database including health center locations, population distribution, and road network to identify accessibility to healthcare centers in the city of Jeddah, Saudi Arabia. By the drive-time analysis technique, the study revealed that there are areas of Jeddah with low accessibility to healthcare centers since they fall outside the 30 min drive-time service area.
Furthermore, in a comprehensive study, Christie and Fone [58] used GIS for modeling accessibility to hospital services in Wales. They identified the travel time per social group (weighted by deprivation score). The study found inequality in the provision of hospital services, where there were many parts (disadvantaged areas) with poor accessibility and utilization of services, in contrast to the rich population areas. However, when looking at the preceding studies, we find that they focused on using distance and travel time as techniques to model accessibility to healthcare services. In other words, with the advent of GIS, most studies have moved on from focusing on using Euclidean distance, which had been used to model accessibility, to using distance and travel time techniques, thus increasing the effectiveness and precision of accessibility modeling.
With recent developments in GIS techniques, many researchers have developed models of accessibility to healthcare services. Luo and Wang [50] developed a model of accessibility to primary care in the Chicago area. They adopted the raster travel friction approach for modeling accessibility. In the area of GIS-based accessibility analysis, Mokgalaka [59] measured accessibility to primary healthcare services to assist in spatial planning. To do this, facility utilization rates in the form of headcounts were combined with GIS-based accessibility analysis. In this study, GIS was used to define three different scenarios to identify the level of demand for primary healthcare services, where it became clear that databases and patient records are not available. These GIS-based scenarios were tested to model catchment areas. As a result, the levels of demand for primary healthcare services varied across the three scenarios, where it appeared that the number of headcounts in the facility contributed to this difference in demand; that is, the higher the number of headcounts in the facility, the higher the demand for it. Hence, spatial distribution plans for primary healthcare services can be developed by incorporating GIS-based accessibility analysis and facility utilization rates.
In addition, Luo and Wang [50] developed a gravity model approach using GIS, where they adopted the floating catchment area (FCA) weighted by location and population. In a similar study on the accessibility of primary healthcare in Washington DC, the gravity model approach was developed by Guagliardo [60] via incorporating a kernel density element. The last decade has witnessed a new wave of progress in location-based accessibility theory, especially through developing the method of the two-step floating catchment area (2SFCA), which is considered an FCA method. This method can help spatial planners to evaluate spatial inequality of providing healthcare services. For example, Kanugantia, Sarkarb and Singh [61] studied the spatial performance of the healthcare system in the Alwar district of Rajasthan. Through GIS, a two-step floating catchment area (2SFCA) was used to measure accessibility to healthcare facilities in rural areas that mainly suffer from spatial isolation from the facilities. This study contributed to recognizing areas that have low accessibility to healthcare facilities. Hence, this study helped to improve the road network and propose new healthcare facility locations in order to enhance the spatial performance of healthcare system in the region.
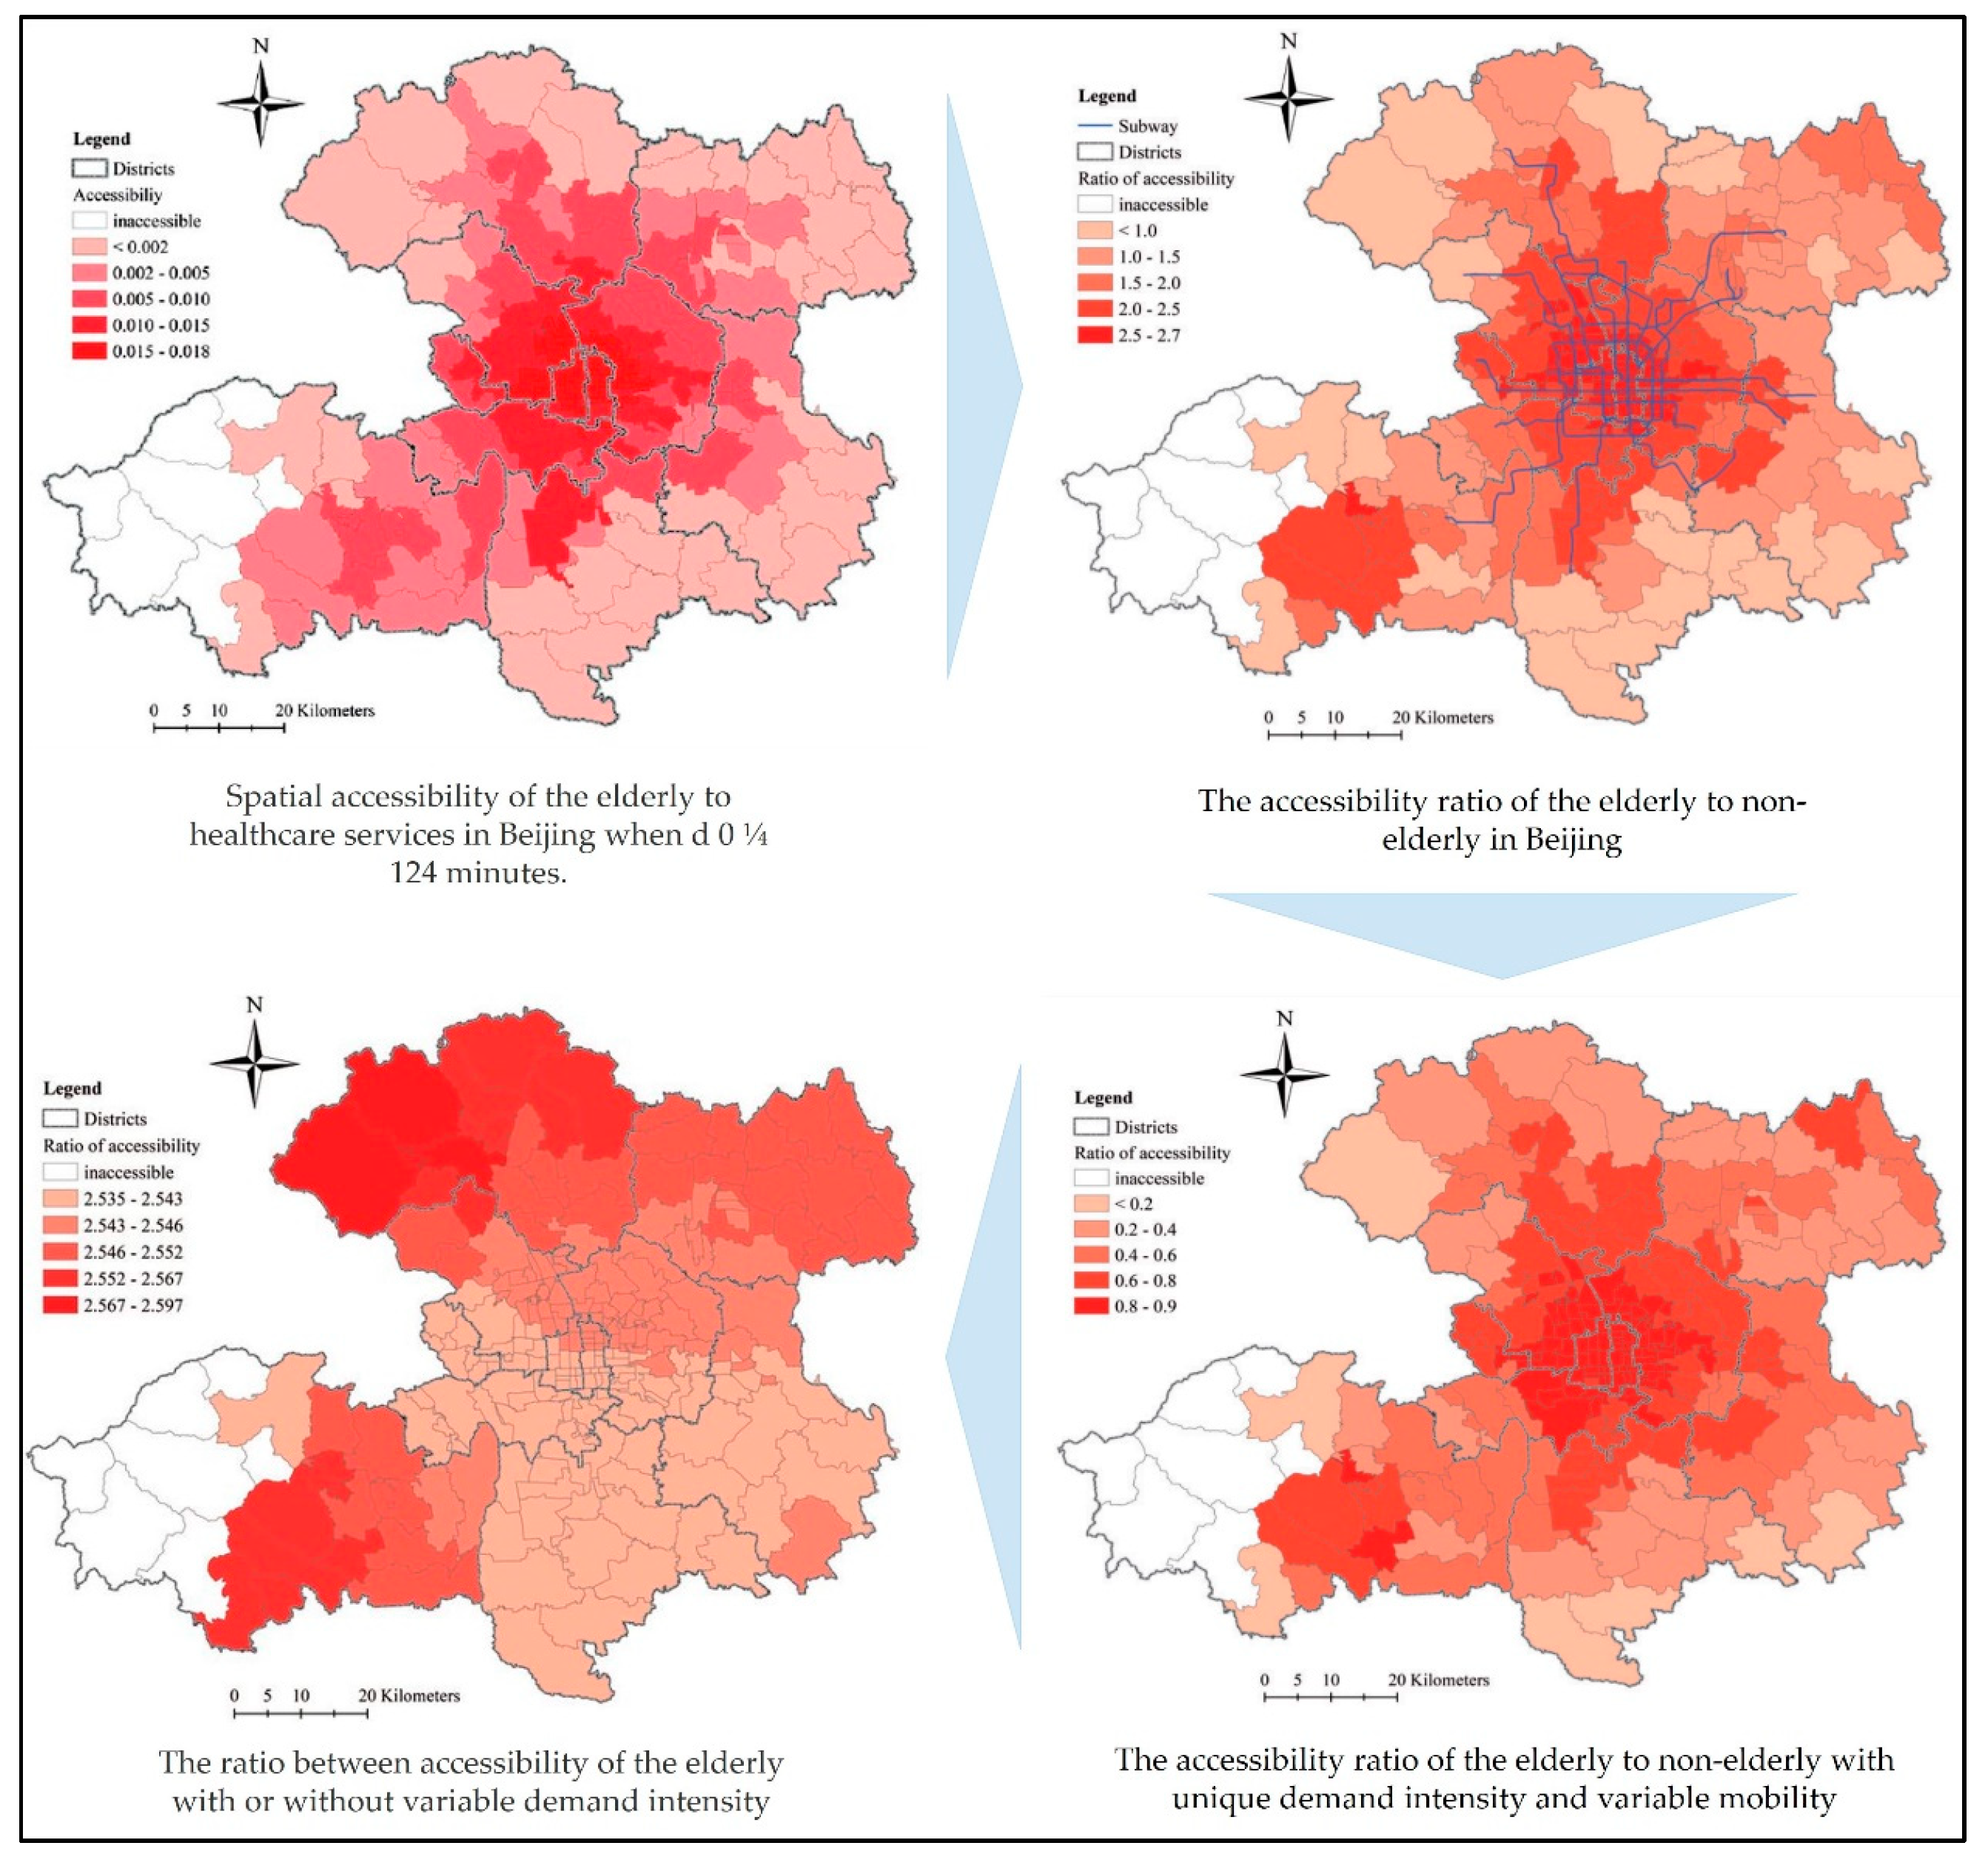
Another example is the work of Tao and Cheng [62], who studied accessibility to healthcare services by elderly people in Beijing (see Figure 10). A multimode and variable-demand two-step floating catchment area (2SFCA) model based on travel time technique was developed to measure the elderly’s accessibility to healthcare services in Beijing, taking into account that the challenge was competition among elderly and nonelderly people for accessing services. As a result, it appeared that there is a high demand on healthcare services by the elderly, who are considered deprived of private mobility, and rely on public transportation to access services, unlike the nonelderly, who have private mobility with low demand on services. Hence, new health resources should be allocated to improving accessibility to services via public mobility, especially in areas that have low accessibility to services. In addition, Ni et al. [63] benefited from the 2SFCA method in effectively identifying more realistic details of accessibility to healthcare services. They used an improved method to integrate all modes of transportation with the 2SFCA in order to estimate accessibility to services of healthcare in Nanjing City. They used the travel-mode technique depending on distance to define the complicated multi-mode travel behavior of the population. Door-to-door approaches were proposed to define each aspect of the primary transportation. Moreover, open data was processed to compute the origin–destination time cost. In a last step, the improved method was applied to estimate the population’s accessibility to healthcare services by comparing it with three single-mode 2SFCA methods.
To summarize, many references were reviewed here to reveal what was written about the issue of accessibility and utilization of healthcare services. A total of 21 studies were used to investigate the role of GIS in dealing with such issues. The studies focused on the United States, England, Ireland, Scotland, Saudi Arabia, South Africa, China, Moldova, and India. In addition, they included a total of 42 authors (range: from one author to five authors), and half of studies were conducted with two authors. Moreover, the studies were published by a total of 17 core journals in the period from 1984 to 2018.
3.3.3. Public Health and Information Management
GIS is considered a useful tool in the Health Management Information System (HMIS); furthermore, it can make a healthcare delivery system more effective and efficient. GIS includes health planning, mapping of the risk service area, database management, and location identification [64]. During the 1980s in the UK, technical staff in the Local Health Units (LHU) looked for methods and techniques to help plan healthcare services and resources. They used GIS to develop information systems to link data attributes to each other, such as services, population, health outcomes, and socioeconomic data. This process was activated by GIS at the country level, and particularly in Italian provinces [4]. With the development of Internet platforms, healthcare information is presented and easily accessible [65]. For example, the WHO and the CDC in the US contributed to publishing several types of data and information relating to spatial healthcare during the last decade. In contrast, there is a lack of interactive information that enables the public to make spatial inquiries or analyses, since, at present, most spatial information relating to healthcare is in the form of traditional flat maps [66].
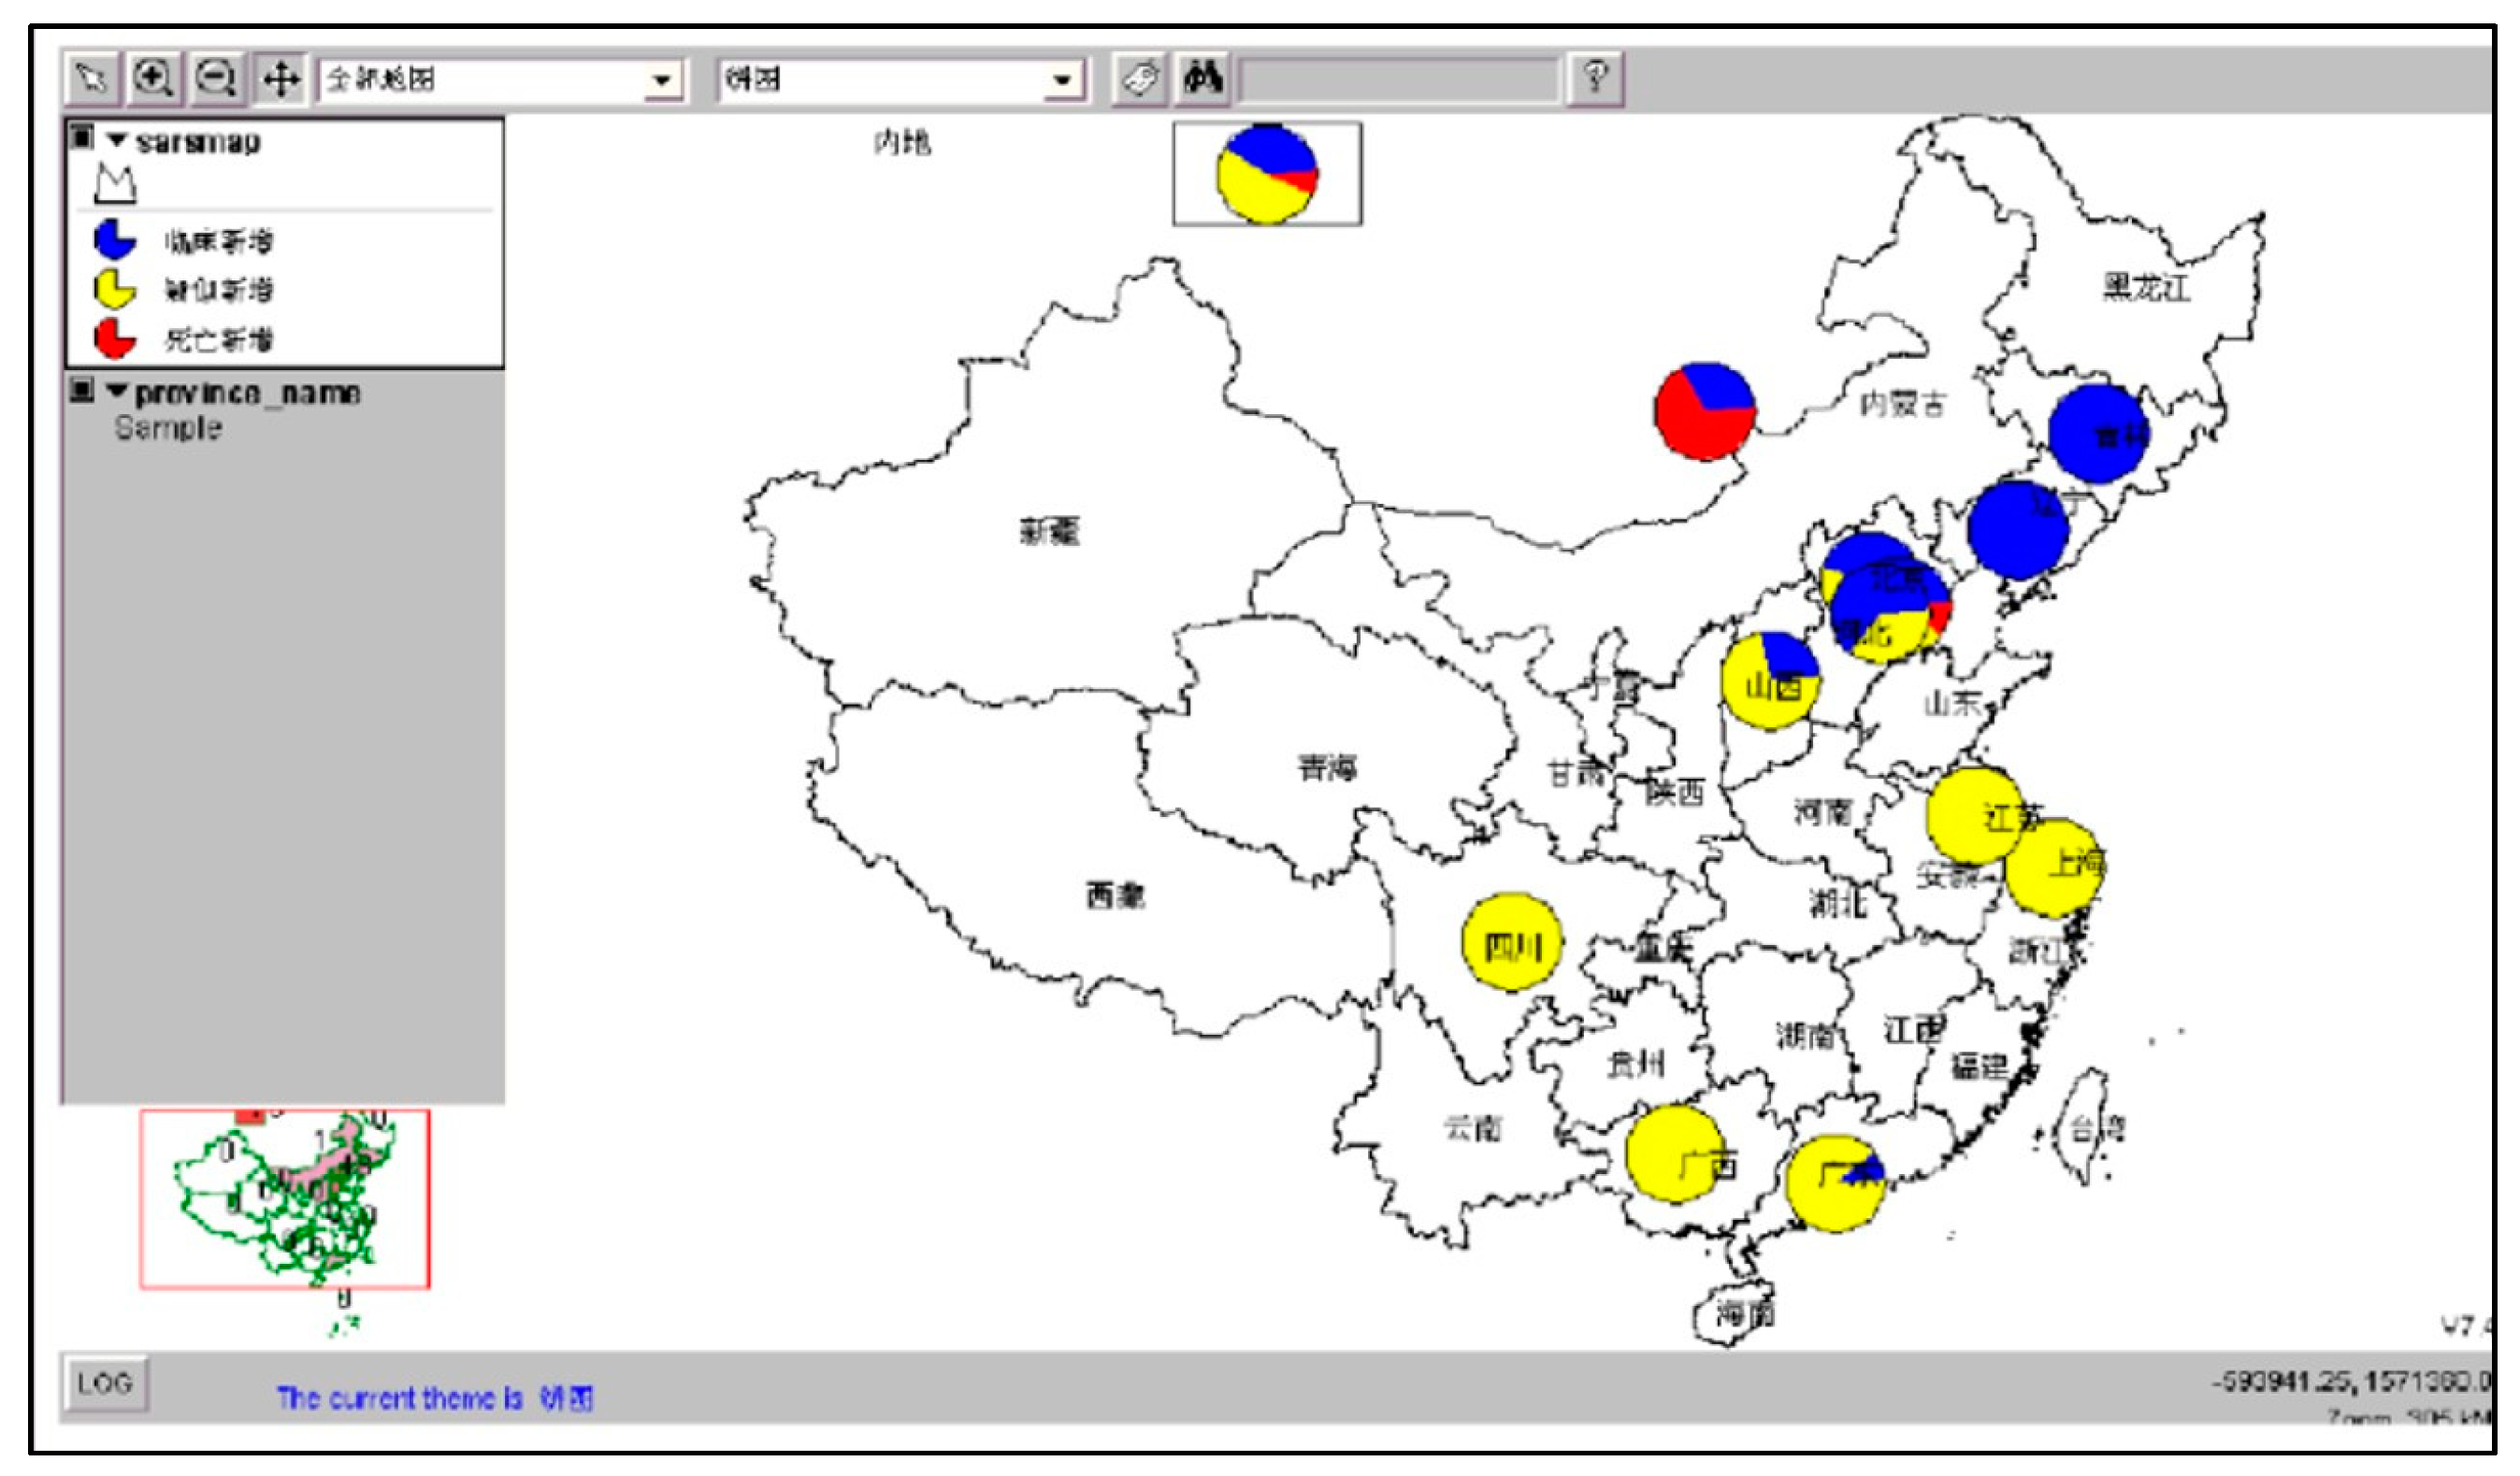
GIS has the ability to disseminate and manage the tools and base data via Internet platforms [67]. For instance, the health maps produced by the WHO are a model for addressing public health issues, and managing growing infectious diseases [66]. Moreover, the work of Singhasivanon et al. [68] is an example of the ability of GIS in sharing data and monitoring disease. They provided a spatial model and management analysis of drug-resistant malaria in the Mekong Delta. In addition, one effective and successful example is the Health Atlas produced by the Health Observatories in the UK and Ireland, which is considered a new online product [69]. In 2003, the SARS information system was managed via the development of a Web-based interactive GIS, which enabled the public to participate in preventing relevant activities (see Figure 11) [70]. In another work related to GIS on the Internet, Abdullahi, Lawal and Agushaka [71] designed a Web-based GIS for the health system. This allowed workers in the health sector to share and manage data, and access information that enables them to find the nearest hospitals that provide improved healthcare services in Zaria, Nigeria.
In addition, there is a relationship between epidemiological mapping and healthcare information management. For example, Masimalai [72] used GIS in analyzing the spatial directions associated with the spread of filariasis in India, taking advantage of the potential of GIS in managing health information related to the disease. As a result, it appeared that GIS is an effective tool in mapping epidemiological information of filariasis, and therefore, management and surveillance of the disease is easier for decision-makers in India. In the area of linking management of patient information and GIS, according to Moore et al. [73], the Ministry of Health coordinated with stroke centers in Kentucky to implement a project to improve the quality of stroke encounters. From 2008 to 2018, there were 23 hospitals that inserted 76,222 records of stroke patients using the Patient Management Tool (PMT). The aim of this project was to link stroke patient records with GIS to improve patient care management. As a result, the use of GIS maps has helped public health officials and hospital stroke coordinators to develop possible interventions to improve stroke care.
To sum up, many references were reviewed here to reveal what was written about the issue of public health and information management. A total of nine studies were used to investigate the role of GIS in dealing with such an issue. The studies focused on the United States, England, Ireland, Nigeria, and India. In addition, they included a total of 34 authors (range: from one author to 12 authors), and nearly half of studies were written by three authors. Moreover, they were published by a total of seven core journals in the period from 1999 to 2019.
3.3.4. Public Health Surveillance
This area is closely related to public health by collecting, analyzing, and interpreting health data to plan and evaluate public health practices. Public health surveillance helps in: (1) following up progress in achieving public health goals; (2) detecting the impact of interventions aimed at upgrading public health; (3) monitoring epidemic diseases and identifying associated problems; (4) identifying public health priorities, policies, and strategies; and (5) predicting sudden emergency cases [74]. However, in recent years, outbreaks of disease have increased in terms of number and complexity, and the threat of such diseases to the public health of societies has reached dangerous levels [75]. According to Wiafe and Davenhall [76], new diseases such as Severe Acute Respiratory Syndrome SARS have emerged, while other diseases, such as tuberculosis, have returned. These diseases have appeared for a number of reasons, the most important of which is the large increase in travel and international trade in recent years, which has led to the spread of diseases across geopolitical and international borders at large rates (for example, the outbreaks of SARS and bird flu). These diseases threaten societies, which leads to the need to establish an effective system for disease surveillance. Through this system, the information necessary will be available for public health officials to identify and manage outbreaks of disease. Successful disease surveillance requires a standardized methodology, as well as appropriate tools for collecting data rapidly and accurately, with timely dissemination. Hence, the best current system that can monitor disease is GIS, which is the preferred technology for collecting, analyzing, displaying, and sharing specific spatial data at the right time [43].
Public health surveillance is mainly based on a number of important elements, the most important of which are: (1) tracking epidemics; (2) evaluating potential infection; and (3) designing health interventions [77]. GIS is an effective tool in managing and analyzing data in health surveillance. For example, GIS has been used to successfully monitor and analyze reproductive outcomes for mothers who live near hazardous waste locations [78]. Moreover, GIS can monitor infectious diseases that basically spread by disease vectors because it has the ability to identify the environmental factors of disease vectors. GIS has contributed to the monitoring and spread limitation of a number of diseases, the most important of which are: (1) malaria; (2) onchocerciasis; and (3) Lyme disease [4].
There are many successful instances of disease surveillance using GIS. One study was the work of the WHO and UNICEF in 1993. They developed the Public Health Mapping Program to overcome Guinea worm disease, which has spread in the rural poor. They used GIS as tool to monitor the spread of disease infection and eradication efforts, and to identify populations at risk. This work is considered an effective example of how GIS could be used to control Guinea worm disease [79]. In addition, and with more advanced work, DC Health in 2016 responded to the outbreak of Zika disease. It used ArcGIS Online to accurately map mosquito trap locations and breeding grounds, leading to a more thorough understanding of mosquito populations, as well as potential health risks in the area [80].
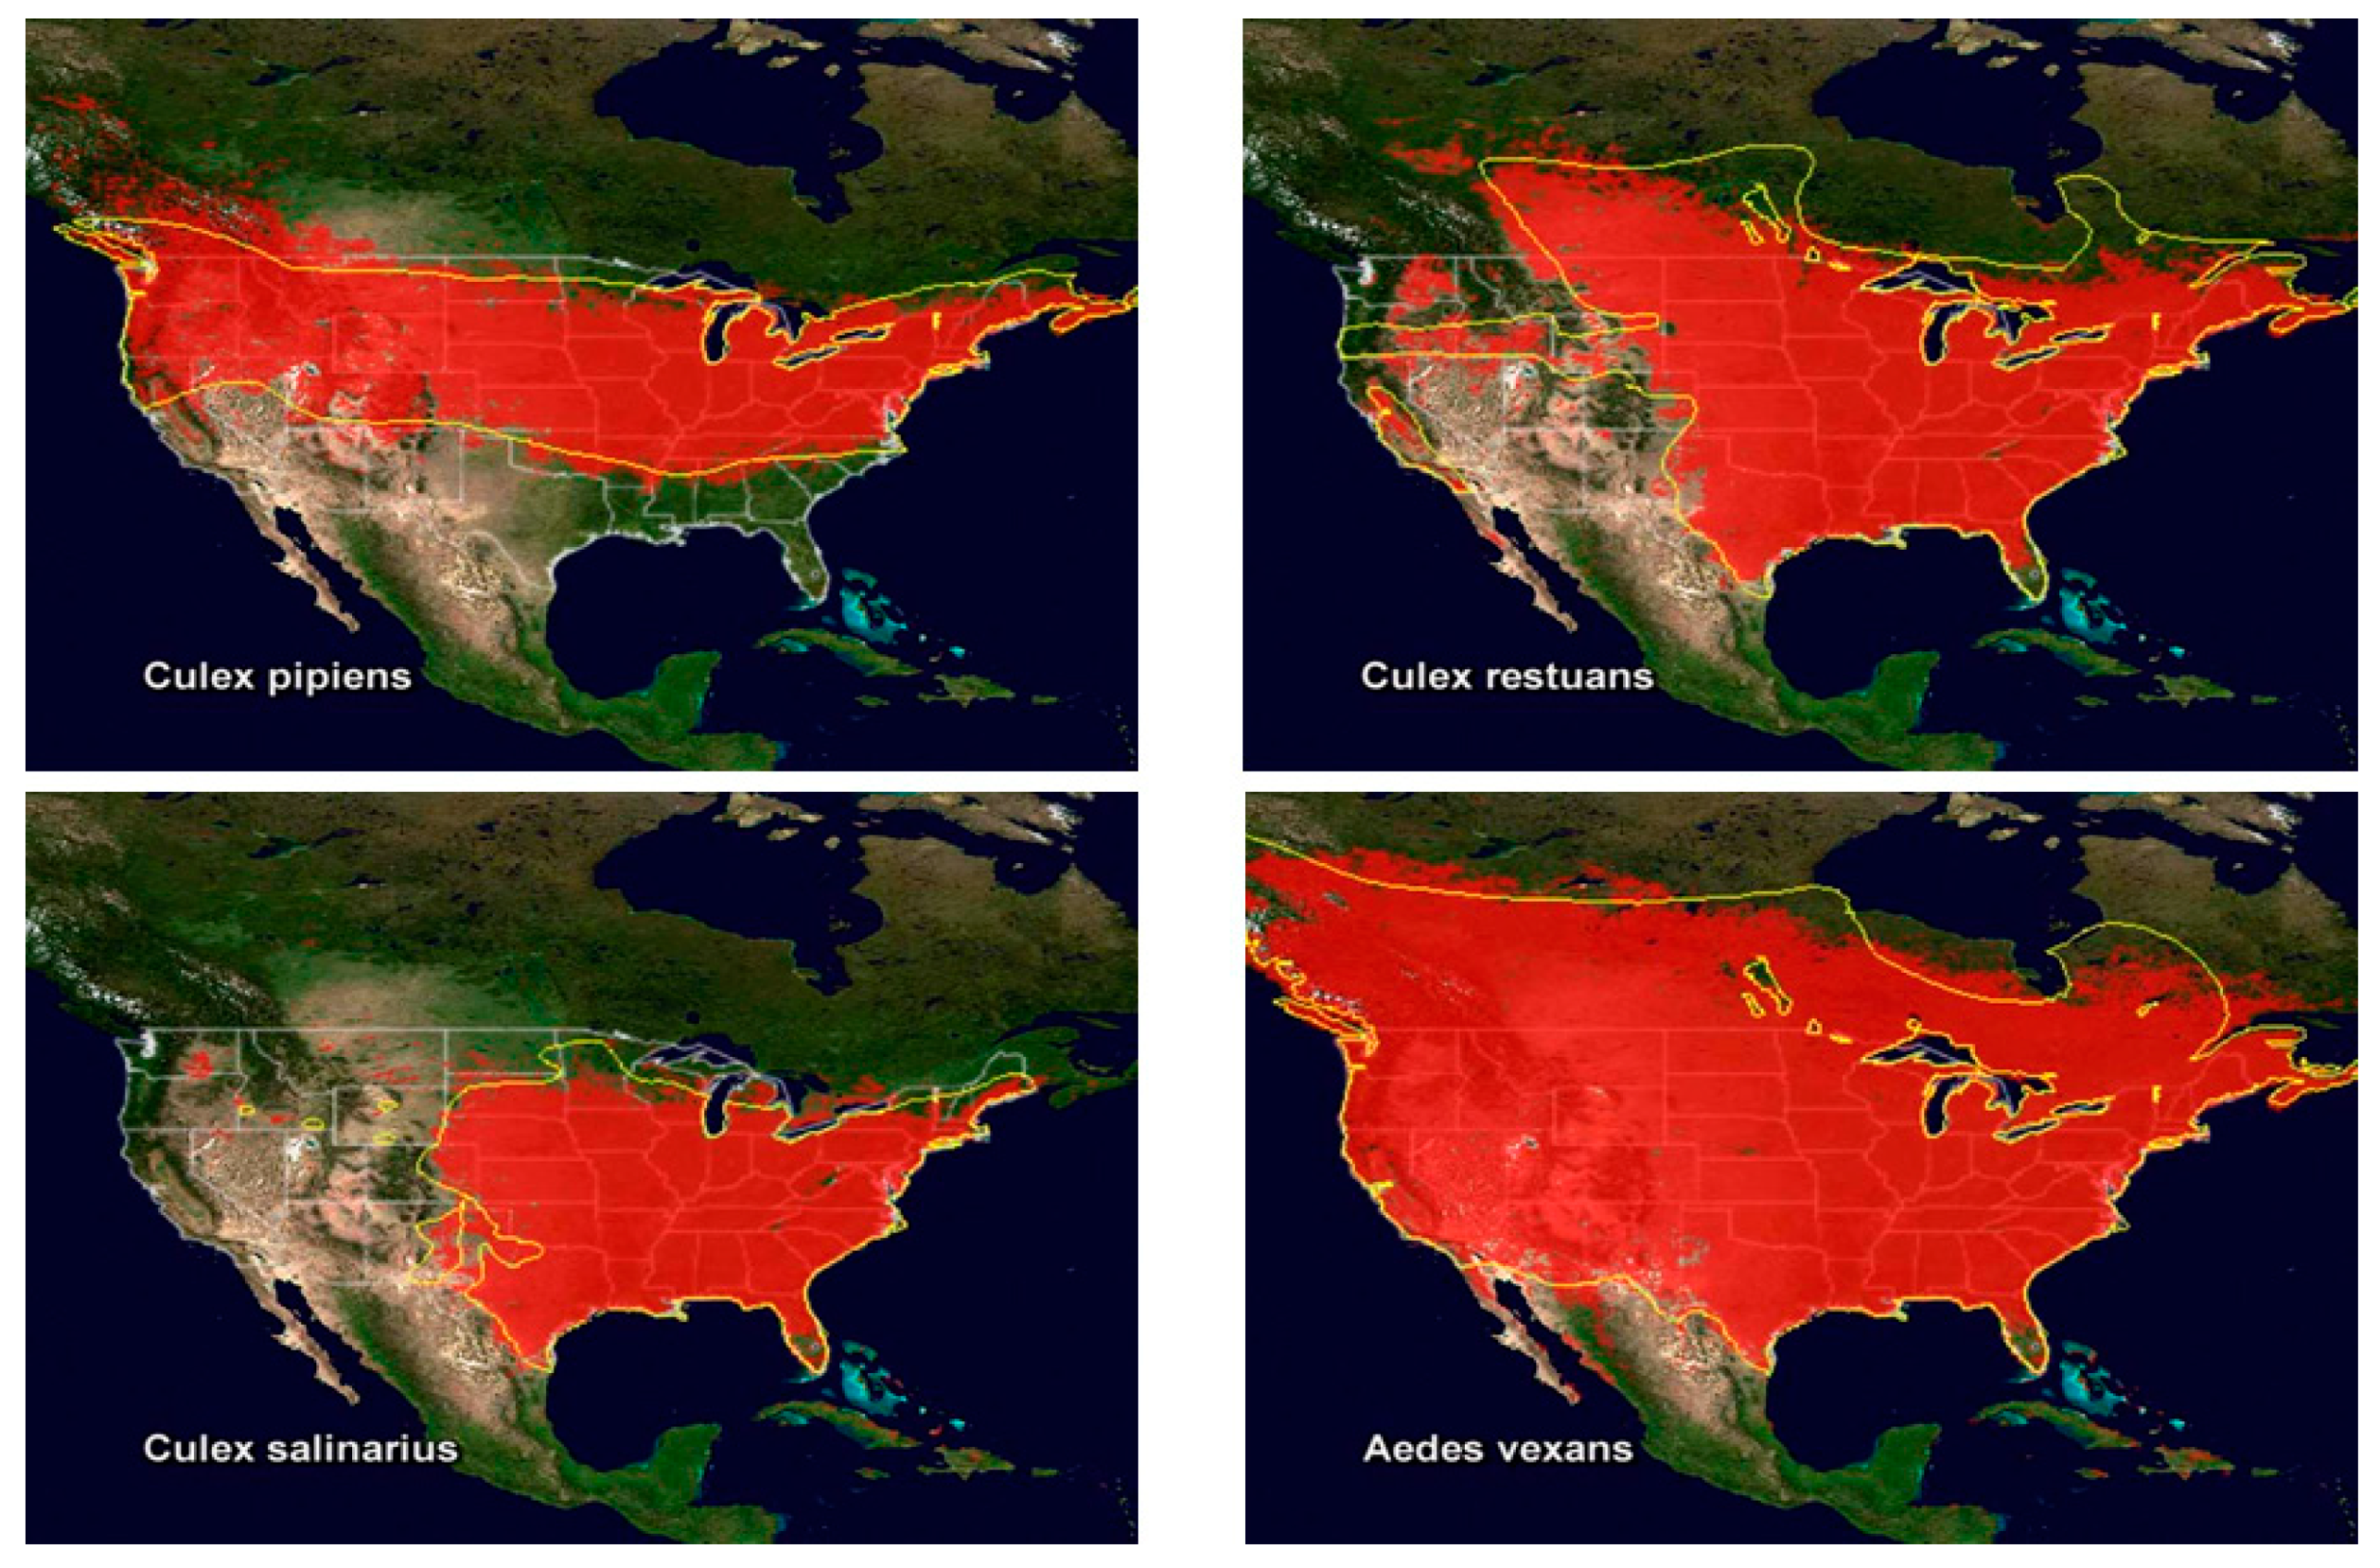
Disease surveillance with GIS and remote sensing functions can be effective via risks maps that include areas suffering from environmental conditions that contribute to the spread of diseases [81]. According to Pam et al. [82], combining GIS and remote sensing techniques is considered an exciting development in epidemiological studies, particularly in the surveillance of vector-borne diseases. For example, Kalluri et al. [83] used GIS and remote sensing as a tool for surveillance of vector-borne diseases. In this study, remote sensing techniques were discussed for studying mosquitoes (see Figure 12), ticks, flies, and sandflies. GIS maps were used to track the climate change that may affect the abundance of vectors. As a result, the combination of GIS and remote sensing was an effective method in the surveillance of potential vector-borne diseases, and evaluating the human environmental damage. In addition, the study discovered that one of the most important contributors to vector-borne diseases is wildlife environment. Moreover, in another study related to eliminating malaria in the Solomon Islands, the government implemented a program for surveillance of the spread of the disease, and its elimination, by integrating GIS and remote sensing functions. As a result, this program significantly contributed to decreasing the incidence of malaria cases in Solomon Islands; consequently, the malaria disease-based death rate also decreased [84].
In addition, many countries have made significant progress in using infectious disease surveillance systems through GIS. These systems could somewhat control disease outbreaks. However, countries face a number of challenges that affect the operation of these systems effectively and efficiently. The most important of these challenges are: (1) weak infrastructure and coordination between relevant health organizations; (2) weak technical systems of health organizations and facilities; (3) weak financial resources for systems development; and (4) untrained human resources to use such systems. Consequently, the number of diseases and deaths may not decrease over time. These challenges will negatively contribute to the decision-making process and interventions aimed at eliminating and controlling infectious diseases effectively and efficiently [85].
To sum up, many references were reviewed here to reveal what was written about the issue of public health surveillance. A total of 11 studies were used to investigate the role of GIS in dealing with such an issue. The studies focused on the United States, Canada, Japan, Solomon Islands, India, and Zambia. In addition, they included a total of 36 authors (range: from two authors to nine authors), and nearly half of studies were written by two authors. Moreover, they were published by a total of eight core journals in the period from 1992 to 2019.
3.3.5. Location Allocation and Optimal Location Modelling
One of the important issues associated with healthcare planning is modeling the optimal allocation of healthcare service locations [86]. Therefore, this issue has been a theoretical problem facing spatial planners for some time, especially in the predigital period, when the focus was on planning the location of healthcare services efficiently, ensuring the spatial performance of healthcare systems was improved within urban and rural areas [87]. Location–allocation models are used to select optimal locations for new services, including healthcare services; for example, selecting a new location for a primary healthcare center or diabetes center taking into account existing locations for available healthcare, as well as the basic demand for services. Location–allocation models are represented in mathematical programming approaches that can be described as a set of numerical methods that contribute to solving optimization problems associated with public health scenarios. In addition to planning new locations for services, location–allocation models can contribute to evaluating service delivery in a specific geographic area [88].
The spatial decision-making associated with allocating healthcare service locations depends on a set of various scenarios, such as: (1) planning a new service location; (2) adding a new service into existing services; and (3) removing existing services. Due to the emergence of GIS in the digital period, and the discovery of geographic computational methods, analysis of spatial data for health care service locations has been enhanced, assessment of various scenarios can be undertaken more quickly, and the optimum allocation of services is much simpler [66]. Historically, several studies addressed the location–allocation models of healthcare using GIS. One of the successful examples of the location–allocation problem is the work of Forbes and Todd [47], which used GIS to assess possible locations for allocating new units to treat disease of cancer in England. This study estimated travel time for a number of potential locations by assuming specific speeds within the road network, combined with population areas to determine travel time zones. Population and patient numbers were calculated for different periods by recording population and cancer case data. The best location was the one that had the maximum population for the desired maximum travel times.
It is also possible to investigate the use of health services, and to improve or propose new services, by combining accessibility models and location–allocation models within the GIS environment [86]. For example, Abdelkarim [89] also integrated accessibility and location–allocation models into GIS to improve spatial planning and environmental sustainability of healthcare services in Al-Madinah Al-Munawwarah, Saudi Arabia. The study aimed to support the spatial allocation of health services in Al-Madinah Al-Munawwarah. The study also included many types of health services, the most important of which were hospitals and healthcare centers. The researcher used the network analysis method to measure the accessibility to health services through different time periods (i.e., 5 min, 10 min, and 15 min). Moreover, the maximum coverage model was used during a response period of no more than 15 min. As a result, the study’s findings revealed that residents suffer from poor accessibility to healthcare service coverage areas due to poor spatial distribution of healthcare services. The study also proposed providing 24 new healthcare service locations to cover a lack in some areas of the city. In another work, Polo et al. [90] combined location-allocation models and accessibility models within a GIS environment in order to support health service planning (i.e., dog and cat sterilization services) in Bogota, Colombia (Figure 13). Moreover, they modified the 2SFCA method based on a set of considerations to measure the spatial accessibility to health services without modifying location–allocation models. As a result, they discovered that there were disadvantaged areas in accessing health services, especially those in central, western, and northern Bogota. Consequently, the spatial accessibility to health services was increased by moving the locations proposed by the maximum coverage model.
To sum up, many references were reviewed here to reveal what was written about the issue of location–allocation and optimal location modelling. A total of seven studies were used to investigate the role of GIS in dealing with such an issue. The studies focused on the United States, England, Finland, Saudi Arabia, and Colombia. In addition, they included a total of 18 authors (range: from one author to four authors), and nearly half of studies were written by two authors. Moreover, they were published by a total of five core journals in the period from 1995 to 2019.
4. Discussion
In this paper, our literature review briefly surveyed the literature related to a number of key issues that fall under the field of healthcare planning. In other words, the previous research and studies related to healthcare planning were summarized and presented from the perspective of a number of key issues with examining the role of GIS in dealing with such issues. This literature contains a rich context of theoretical, analytical, and quantitative aspects that can be recognized by reviewing them fully. It was clear from the literature survey that the relationship between GIS and healthcare planning issues is constantly evolving at the global level. The tremendous and vital development of GIS technologies has contributed to understanding such issues, and its relationship with different geographical areas. Consequently, this development of GIS technologies has been efficiently supporting health professionals in studying and analyzing issues of healthcare planning by a number of applications based on analytical approaches.
Before the emergence of GIS, the spatial relationship between place and health was an important issue for scientists and researchers. This relationship was explained by simple spatial analysis based on paper maps that described the spread of epidemic diseases and were used to support spatial decisions for dealing with diseases. Ever since Dr. Snow’s work aimed at overcoming cholera in London in 1854, monitoring diseases has depended on maps-based spatial analysis, including features such as disease outbreak locations, road networks, and property boundaries. Thus, making spatial decisions to address epidemic diseases was more effective and accurate, and the spatial relationship between place and health was better understood and more obvious. Over time, Dr. Snow’s work has promoted the continued development of GIS, especially in the field of epidemiology, which has contributed to enhancing health officials’ capabilities in terms of spatial planning, analysis, and monitoring epidemic diseases and their spread. Identifying factors of environmental risk and their role in emerging diseases has been enhanced, especially with the development of statistical and spatial analysis methods within the GIS environment. The emergence of computer systems in the 1960s led to the birth of a growth era for GIS, specifically with regard to producing digital maps, applying spatial analysis methods, and managing spatial databases. This contributed to supporting healthcare planning and responding to epidemic diseases by allocating health resources, assessing environmental risks, and managing, analyzing, and modeling spatial data.
It was clear from the literature review that there are many healthcare planning issues that have gradually emerged with the development and understanding of the relationship between health and place, which are considered the main two factors in the planning of healthcare. Based on the review and its findings regarding the recent trends in this subject, the most important issues were found to be epidemiological modeling and disease mapping, the evaluation of the accessibility and utilization of healthcare, disease surveillance, and health information management, as well as location-allocation modeling for healthcare services. These issues must be taken into consideration before working on any study of healthcare planning. Scientists and researchers have investigated these issues during the past three decades in order to develop analytical approaches that support the field of human public health. However, based on the literature examined in this paper, it appears that the analytical approaches of spatial studies associated with healthcare planning have reached an acceptable level of maturity and rationality, and it is possible to apply these approaches to more complex issues related to healthcare planning, particularly with the recent development of GIS technologies. But in contrast, the literature review confirmed that geographic researchers and spatial planners have been highly focusing on developing and applying analytical approaches to support two important issues of healthcare planning: first, modeling epidemics in order to monitor and prevent their spread, and, second, to assess inequalities in access to healthcare in order to determine the optimal allocation of health resources. Achieving these two aspects depends on robust analysis, which mainly depends on the availability of a valuable base of spatial and attribute data. Moreover, analytical statistics processes within GIS environments require a high quality and accuracy of data that facilitates comparison between scenarios and outputs of the analysis. In contrast, the development of models and analytical approaches has contributed to improving the accuracy and quality of spatial data that are processed and analyzed within the GIS environment.
Studies reviewed in this paper emphasized that GIS has a positive role in addressing a reasonable area of healthcare planning issues. It has contributed to creating an appropriate environment for utilizing analytical approaches to address healthcare planning issues, especially in terms of issues related to optimal allocation of health resources based on set spatial behaviors between supply and demand. Thus, GIS can be an effective tool for dealing with healthcare planning issues, especially with (1) the continued significant development of GIS technologies worldwide, and (2) the cognitive development of planners and health professionals in practicing applications based on analytical approaches that have been supported by advanced technologies of GIS. GIS is now used in epidemiology, specifically relating to environmental epidemics, where GIS can assist in understanding and analyzing patterns of disease spread, and modeling relevant environmental exposure factors, effects, and risks, provided that an effective system is available to manage health data and information. GIS can also help achieve equality of access to healthcare by examining and evaluating use patterns of demand for healthcare, and allocating optimal locations for healthcare facilities based on population distribution, locations of health facilities, transportation and road networks, and other factors.
Although GIS has been contributing to supporting healthcare planning using analytical approaches and statistical methods, the application of these approaches and methods to GIS-based healthcare planning faces a number of key challenges. The most important of these are, first, the lack of availability and weak management of health information, and, second, the lack of maps of spatial behaviors observed between supply and demand. Third, and most importantly, the lack of spatial data is one of the most important key challenges facing the healthcare planning process based on GIS. GIS deals with healthcare planning issues through a set of analytical approaches and statistical methods that require availability of several types of spatial data. For example, good modeling and planning of epidemics requires data on environmental risk areas and their descriptive characteristics, and this is difficult to acquire in many countries. This is particularly true of developing countries, which may also have fertile environments for the spread of epidemics and diseases, thus complicating the issue. In addition, a successful health information management system requires the availability of spatial data that allows accurate inquiries and analyses of the public and workers in the health sector. These challenges are considered as obstacles for any practical task in healthcare planning to ensure theoretical and quantitative work is logical in a real world environment.
5. Conclusions
GIS is an effective tool to support spatial decision-making in public health through applying the evolving analytical approaches to dealing with healthcare planning issues. This requires a literature review before preparing relevant studies, particularly because of the continuous development of GIS technologies. However, it is clear from the literature reviewed that there are aspects that need further investigation to be considered as future directions that health organizations and officials should deal with using GIS-based analytical approaches and statistical methods. First, the GIS-based analytical approaches used for modeling epidemics depend highly on the availability of census data to give a more realistic representation of the disease spread and prediction of locations of populations at risk. In addition, the census data used for the modeling epidemics should be of high quality and accuracy in order to be in line with the requirements of recent GIS techniques, and this is a major challenge, especially in developing countries. Second, the GIS-based analytical approaches used for modeling of accessibility to healthcare services depend on the availability of a set of spatial data (e.g., distance from origin to healthcare service) and nonspatial data (e.g., estimation of demand based on demographic characteristics of the population). Nevertheless, the biggest challenge consisted in how to estimate the demand for healthcare services in light of the low quality and accuracy of the demographic and socioeconomic data of population that can describe patients’ behavior in seeking the appropriate service. Third, the GIS-based analytical approaches used for developing health information systems including epidemiology management, disease surveillance and health risk analysis require the availability of precise enviromental risk data. Nevertheless, health organizations and specialized researchers face a difficulty in using these approaches to develop their health information systems due to the lack of enviromental risk data entered into interactive information systems for disease management and surveillance. This represents a major challenge, especially at the level of conducting inquiries and spatial analyses by specialists and the public. Fourth, many health organizations and specialized researchers have been using the GIS-based analytical approaches to monitor outbreak of epidemic diseases, assess potential infections, map disease risks, and predict sudden emergencies. Public health surveillance systems need the accurate data about the surrounding environment of the population at risk. Consequently, the application of analytical approaches to improve public health surveillance facing difficulty due to the poor organization, collection, analysis and interpretation of such data. Hence, that requires the development of health information systems in general.
Author Contributions
Conceptualization, Abdulkader Murad; methodology, Abdulkader Murad; formal analysis, Bandar Fuad Khashoggi; writing—original draft preparation, Bandar Fuad Khashoggi; writing—review and editing, Abdulkader Murad; visualization, Bandar Fuad Khashoggi; supervision, Abdulkader Murad; All authors have read and agreed to the published version of the manuscript.
Funding
This research received no external funding.
Conflicts of Interest
The authors declare no conflict of interest.
References
- Geraghty, E. Why Health is so Spatial. Available online: https://www.youtube.com/watch?v=3p7OFICg9Ak (accessed on 30 January 2020).
- Krieger, N. Place, Space, and Health: GIS and Epidemiology. Epidemiology 2003, 14, 384–385. [Google Scholar] [CrossRef]
- Pickle, L.W. Spatial Analysis of Disease. Cancer Treat. Res. 2002, 113, 113–150. [Google Scholar] [CrossRef] [PubMed]
- Gatrell, A.C.; Masser, I.; Salgé, F. GIS and Health; Informa UK Limited: London, UK, 1998; pp. 179–187. [Google Scholar]
- Curtis, S. Health and Inequality; SAGE Publications: Thousand Oaks, CA, USA, 2004. [Google Scholar]
- Yuan, M. Adding Time into Geographic Information System Databases. In The Handbook of Geographic Information Science; Wiley: Hoboken, NJ, USA, 2008; pp. 169–184. [Google Scholar]
- Koch, T. Mapping the Miasma: Air, Health, and Place in Early Medical Mapping. Cartogr. Perspect. 2005, 4–27, 4–27. [Google Scholar] [CrossRef]
- GisGeography. The Remarkable History of GIS. Available online: https://gisgeography.com/history-of-gis/ (accessed on 3 February 2020).
- ESRI. GIS for Public Health Today and Tomorrow. Available online: https://www.esri.com/news/arcuser/0499/umbrella.html (accessed on 3 February 2020).
- Koch, T. Disease Maps; The University of Chicago Press: Chicago, IL, USA, 2011; p. 247. [Google Scholar]
- D’Onofrio, A.; Mazzetta, C.; Robertson, C.; Smans, M.; Boyle, P.; Boniol, M. Maps and atlases of cancer mortality: A review of a useful tool to trigger new questions. Ecancermedicalscience 2016, 10, 670. [Google Scholar] [CrossRef] [PubMed] [Green Version]
- Yomralioglu, T.; Colak, E.H.; Aydinoglu, A.C. Geo-Relationship between Cancer Cases and the Environment by GIS: A Case Study of Trabzon in Turkey. Int. J. Environ. Res. Public Health 2009, 6, 3190–3204. [Google Scholar] [CrossRef] [Green Version]
- Altonen, B. Alfred Haviland—1875 (2ed. 1893)—Cancer in Great Britain. Public Health, Medicine and History. 2019. Available online: https://brianaltonenmph.com/gis/historical-disease-maps/alfred-haviland-1875-2ed-1893-disease-in-great-britain/ (accessed on 3 February 2020).
- Clarke, K.; McLafferty, S.L.; Tempalski, B. On epidemiology and geographic information systems: A review and discussion of future directions. Emerg. Infect. Dis. 1996, 2, 85–92. [Google Scholar] [CrossRef] [Green Version]
- Croner, C. Public Health Geographic Information Systems (Gis) News and Information; 1994–1997. Center of Disease Control and Prevention. Available online: https://stacks.cdc.gov/view/cdc/13298 (accessed on 6 February 2020).
- CDC. Our History—Our Story. Available online: https://www.cdc.gov/about/history/index.html (accessed on 6 February 2020).
- World Health Organization. The Atlas of Heart Disease and Stroke. Available online: https://www.who.int/cardiovascular_diseases/resources/atlas/en/ (accessed on 17 February 2020).
- CDC. Heart Disease Death Rates, Total Population Ages 35+. Available online: https://www.cdc.gov/dhdsp/maps/national_maps/hd_all.htm (accessed on 8 February 2020).
- Musa, G.J.; Chiang, P.-H.; Sylk, T.; Bavley, R.; Keating, W.; Lakew, B.; Tsou, H.-C.; Hoven, C. Use of GIS Mapping as a Public Health Tool—From Cholera to Cancer. Health Serv. Insights 2013, 6, 111–116. [Google Scholar] [CrossRef]
- Farnia, P.; Aghajani, J.; Velayati, A. Impact of geographical information system on public health sciences. Biomed. Biotechnol. Res. J. 2017, 1, 94. [Google Scholar] [CrossRef]
- Briney, A. Overview of Public Health and GIS. Gislounge. Available online: https://www.gislounge.com/overview-public-health-gis/ (accessed on 8 February 2020).
- CESCR—Committee on Economic, Social and Cultural Rights. The Right to the Highest Attainable Standard of Health. United Nations Human Rights. Available online: https://www.refworld.org/pdfid/4538838d0.pdf (accessed on 26 May 2020).
- Sherif, A. Towards Spatial Justice in Urban Health Services Planning. Ph.D. Thesis, University of Utrecht, Utrecht, The Netherlands, 2007. [Google Scholar]
- Drissy, A. The Evolution of Health Expenditure in Algeria and its Effectiveness in the Reform of the Health System During the Period (2013–2004). Algerian J. Glob. Econ. Policies. 2015, 6, 137–145. [Google Scholar]
- Mokgalaka, H. Measuring Access to Primary Health Care: Use of a GIS-Based Accessibility Analysis. Semantic Scholar. Available online: https://pdfs.semanticscholar.org/5a16/14e0c2db094958a992a2b8a30c335b55d22b.pdf?_ga=2.240499466.883523912.1577652254-1188223766.1576187194 (accessed on 29 December 2019).
- Dallhammer, E.; Gaugitsch, R.; Neugebauer, W. Spatial Planning and Governance within EU Policies and Legislation and Their Relevance to the New Urban Agenda (p. 2); European Committee of the Regions: Bruxelles, Belgium, 2018; Available online: https://cor.europa.eu/en/engage/studies/Documents/Spatial-planning-new-urban-agenda.pdf (accessed on 26 May 2020).
- McLafferty, S.L. GIS and Health Care. Annu. Rev. Public Health 2003, 24, 25–42. [Google Scholar] [CrossRef]
- Kirby, R.S.; Delmelle, E.; Eberth, J.M. Advances in spatial epidemiology and geographic information systems. Ann. Epidemiol. 2016, 27, 1–9. [Google Scholar] [CrossRef] [PubMed]
- Nicol, J. Geographic information systems within the national health service: The scope for implementation. Plan. Outlook 1991, 34, 37–42. [Google Scholar] [CrossRef]
- Murad, A. Using GIS for Planning Public General Hospitals at Jeddah City. J. King Abdulaziz Univ. Des. Sci. 2005, 3, 3–22. [Google Scholar] [CrossRef]
- Datta, D.; S G, R.K.; Mb, A.N.; Bapilus, L.; Anandan, S. Spatial Epidemiology: Geostatistical Tool for Disease Mapping. World J. Pharm. Res. 2017, 6523, 1771–1780. [Google Scholar] [CrossRef]
- Little, M.; Meade, M.; Florin, J.; Gesler, W. Medical Geography. Geogr. Rev. 1989, 79, 247. [Google Scholar] [CrossRef]
- Gatrell, A.; Senior, M. Health and health care application in Longley P, Goodchild M, Maguire D and Rhind D, Geographical Information System Principles and Application; John Wiley & Sons: Hoboken, NJ, USA; pp. 925–938.
- Cliff, A.D.; Haggett, P.; Ord, J.K. Spatial Aspects of Influenza Epidemics; Pion: London, UK, 1986. [Google Scholar]
- Gould, P.; Wallace, R. Spatial Structures and Scientific Paradoxes in the AIDS Pandemic. Geografiska Annaler 1994, 76, 105–116. [Google Scholar] [CrossRef]
- Braga, M.; Cislaghi, C.; Luppi, G.; Tasco, C. A Multipurpose. Interactive Mortality Atlas of Italy. In GIS and Health; Gatrell, A.C., Löytönen, M., Eds.; Taylor and Francis: London, UK, 1998; pp. 125–138. [Google Scholar]
- Brown, P.J.B.; Hirschfield, A.; Batey, P.W.J. Applications of geodemographic methods in the analysis of health condition incidence data. Pap. Reg. Sci. 1991, 70, 329–344. [Google Scholar] [CrossRef]
- Wrigley, N. Market-based systems of health-care provision, the NHS Bill, and geographical information systems. Environ. Plan. A. 1991, 23, 5–8. [Google Scholar]
- Johnson, G.D. Small area mapping of prostate cancer incidence in New York State (USA) using fully Bayesian hierarchical modelling. Int. J. Health Geogr. 2004, 3, 29. [Google Scholar] [CrossRef] [Green Version]
- Rasam, A.A.R.; Ghazali, R.; Noor, A.M.M.; Naim, W.M.; Hamid, J.R.A.; Bazlan, M.J.; Ahmad, N. Spatial epidemiological techniques in cholera mapping and analysis towards a local scale predictive modelling. In Proceedings of the IOP Conference Series: Earth and Environmental Science; IOP Publishing: Bristol, UK, 2014; Volume 18, p. 12095. [Google Scholar]
- Brown, B. 5 Benefits of Geographic Information Systems in Healthcare. Hitconsultant. Available online: https://hitconsultant.net/2015/10/29/5-benefits-of-geographic-information-systems-in-healthcare/#.Xe0UX-jXJPY (accessed on 8 December 2019).
- Sones, M. Reveal: Mapping and Tracking the Spread of Deadly Diseases. Available online: https://www.esri.com/about/newsroom/blog/reveal-mapping-and-tracking-the-spread-of-deadly-diseases/ (accessed on 18 December 2019).
- Fradelos, E.C.; Papathanasiou, I.V.; Mitsi, D.; Tsaras, K.; Kleisiaris, C.F.; Kourkouta, L. Health Based Geographic Information Systems (GIS) and their Applications. Acta Inform. Medica 2014, 22, 402–405. [Google Scholar] [CrossRef] [Green Version]
- WHO. World Bank and WHO: Half the World Lacks Access to Essential Health Services, 100 Million Still Pushed Into Extreme Poverty Because of Health Expenses. Available online: https://www.who.int/news-room/detail/13-12-2017-world-bank-and-who-half-the-world-lacks-access-to-essential-health-services-100-million-still-pushed-into-extreme-poverty-because-of-health-expenses (accessed on 21 December 2019).
- Bhatt, J.; Bathija, P. Ensuring Access to Quality Health Care in Vulnerable Communities. Acad. Med. 2018, 93, 1271–1275. [Google Scholar] [CrossRef] [PubMed] [Green Version]
- Jones, A.P.; Bentham, G. Emergency medical service accessibility and outcome from road traffic accidents. Public Health 1995, 109, 169–177. [Google Scholar] [CrossRef]
- Forbers, H.; Todd, P. Review of Cancer Services, Northwest Regional Health Authority, Urban Research and Policy Evaluation Regional Research Laboratory. University of Liverpool: Liverpool, UK, 1995. [Google Scholar]
- World Health Organization. Barriers and Facilitating Factors in Access to Health Services in the Republic of Moldova. Health Policy Paper; WHO: Moldova, 2012; pp. 4–22. Available online: http://www.euro.who.int/__data/assets/pdf_file/0018/183510/e96775-final.pdf (accessed on 21 December 2019).
- Mohan, J.; Joseph, A.E.; Phillips, D.R. Accessibility and Utilization: Geographical Perspectives on Health Care Delivery. Trans. Inst. Br. Geogr. 1986, 11, 121. [Google Scholar] [CrossRef]
- Luo, W.; Wang, F. Measures of Spatial Accessibility to Health Care in a GIS Environment: Synthesis and a Case Study in the Chicago Region. Environ. Plan. B Plan. Des. 2003, 30, 865–884. [Google Scholar] [CrossRef] [Green Version]
- Khan, A.A.; Bhardwaj, S.M. Access to Healthcare: A Conceptual framework and its relevance to Health Care Planning. Eval. Health Prof. 1994, 17, 60–76. [Google Scholar] [CrossRef]
- Foley, R. Assessing the applicability of GIS in a health and social care setting: Planning services for informal carers in East Sussex, England. Soc. Sci. Med. 2002, 55, 79–96. [Google Scholar] [CrossRef] [Green Version]
- Teljeur, C.; Barry, J.; Kelly, A. The potential impact on travel times of closure and redistribution of A&E units in Ireland. Ir. Med J. 2004, 97, 6. [Google Scholar]
- Kumar, N. Changing geographic access to and locational efficiency of health services in two Indian districts between 1981 and 1996. Soc. Sci. Med. 2004, 58, 2045–2067. [Google Scholar] [CrossRef]
- Parker, E.B.; Campbell, J.L. Measuring access to primary medical care: Some examples of the use of geographical information systems. Health Place 1998, 4, 183–193. [Google Scholar] [CrossRef]
- Brabyn, L.; Skelly, C. Modeling population access to New Zealand public hospitals. Int. J. Health Geogr. 2002, 1, 3. [Google Scholar] [CrossRef] [Green Version]
- Murad, A. Using GIS for Determining Variations in Health Access in Jeddah City, Saudi Arabia. ISPRS Int. J. Geo-Inf. 2018, 7, 254. [Google Scholar] [CrossRef] [Green Version]
- Christie, S.; Fone, D. Equity of access to tertiary hospitals in Wales: A travel time analysis. J. Public Health Med. 2003, 25, 344–350. [Google Scholar] [CrossRef] [PubMed] [Green Version]
- Mokgalaka, H. GIS-Based Analysis of Spatial Accessibility: An Approach to Determine Public Primary Healthcare Demand in Metropolitan Areas. Master’s Thesis, University of Cape Town, Cape Town, South Africa, 2015. [Google Scholar]
- Guagliardo, M.F. Spatial accessibility of primary care: Concepts, methods and challenges. Int. J. Health Geogr. 2004, 3, 3. [Google Scholar] [CrossRef] [PubMed] [Green Version]
- Kanuganti, S.; Sarkar, A.; Singh, A.P. Quantifying Accessibility to Health Care Using Two-step Floating Catchment Area Method (2SFCA): A Case Study in Rajasthan. Transp. Res. Procedia 2016, 17, 391–399. [Google Scholar] [CrossRef]
- Tao, Z.; Cheng, Y. Modelling the spatial accessibility of the elderly to healthcare services in Beijing, China. Environ. Plan. B: Urban Anal. City Sci. 2018, 46, 1132–1147. [Google Scholar] [CrossRef]
- Ni, J.; Liang, M.; Lin, Y.; Wu, Y.; Wang, C. Multi-Mode Two-Step Floating Catchment Area (2SFCA) Method to Measure the Potential Spatial Accessibility of Healthcare Services. ISPRS Int. J. Geo-Inf. 2019, 8, 236. [Google Scholar] [CrossRef] [Green Version]
- Sharma, A.K. Role of GIS in Health Management Information System and Medical Plan: A Case Study of Gangtok area, Sikkim, India. Int. J. Environ. Geoinform. 2015, 2, 16–24. [Google Scholar] [CrossRef]
- Cockerham, W. International Encyclopedia of Public Health, 2nd ed.; Elsevier: Birmingham, UK, 2017; p. 414. [Google Scholar]
- Foley, R.; Charlton, M.; Fotheringham, S. GIS in Health and Social Care Planning. Available online: https://www.semanticscholar.org/ (accessed on 12 December 2019).
- Gong, H.; Simwanda, M.; Murayama, Y. An Internet-Based, IS Platform Providing Data for Visualization and Spatial Analysis of Urbanization in Major Asian and African Cities. ISPRS Int. J. Geo-Inf. 2017, 6, 257. [Google Scholar] [CrossRef] [Green Version]
- Singhasivanon, P.; Kidson, C.; Supavej, S. Mekong Malaria. Malaria, multi-drug resistance and economic development in the Greater Mekong sub-region of South-East Asia, incorporating geographical information systems databases. Southeast Asian J. Trop. Med. Public Health 1999, 30, 4. [Google Scholar]
- Pringle, D.; Johnson, H.; Cullen, C.; Boyle, E.; Doyle, D.; Brazil, J.; McKeown, P.; Staines, A.; Beaton, D.; McIntyre, M.; et al. Health Atlas Ireland: An Open-Source Mapping, Database and Statistical System; GeoComputation 2007; National University of Ireland: Maynooth, Ireland, 2008. [Google Scholar]
- Lu, X. A Framework of Web GIS Based Unified Public Health Information Visualization Platform. In Applications of Evolutionary Computation; Springer Science and Business Media LLC: Berlin, Germany, 2005; Volume 3482, pp. 256–265. [Google Scholar]
- Abdullahi, F.; Lawal, M.; Agushaka, J. Design and Implementation of A Web-Based Gis for Public Healthcare Decision Support System in Zaria Metropolis. Ijrras, 4(4), p. 1. Available online: https://core.ac.uk/download/pdf/25731372.pdf (accessed on 21 December 2019).
- Masimalai, P. GIS for rapid epidemiological mapping and health-care management with special reference to filariasis in India. Int. J. Med. Sci. Public Health 2015, 4, 1. [Google Scholar] [CrossRef]
- Moore, K.; Merritt, A.; Bobo, B.; Graham, A.; Kuhn, A. Kentucky Stroke Encounter Quality Improvement Project (SEQIP) Abstract 141: Using Geographic Information Systems (GIS) to Analyze Statewide Regional Data—A Feasibility Project from the Kentucky Stroke Encounter Quality Improvement Project (SEQIP). Circ. Cardiovasc. Qual. Outcomes 2019, 12, 1. [Google Scholar] [CrossRef]
- World Health Organization. Public Health Surveillance. Available online: https://www.who.int/topics/public_health_surveillance/en/ (accessed on 24 December 2019).
- Morens, D.M.; Fauci, A.S. Emerging Infectious Diseases: Threats to Human Health and Global Stability. PLoS Pathog. 2013, 9, e1003467. [Google Scholar] [CrossRef] [PubMed] [Green Version]
- Wiafe, S.; Davenhall, B. Extending Disease Surveillance with GIS. ESRI. Available online: https://www.esri.com/news/arcuser/0405/disease_surveil1of2.html (accessed on 13 December 2019).
- Lee, L.M.; Teutsch, S.M.; Thacker, S.B.; Louis, M.E.S. Principles & Practice of Public Health Surveillance; Oxford University Press (OUP): Oxford, UK, 2010. [Google Scholar]
- Stallones, L.; Nuckols, J.R.; Berry, J.K. Surveillance around hazardous waste sites: GIS and reproductive outcomes. Environ. Res. 1992, 59, 81–92. [Google Scholar] [CrossRef]
- Law, D.; Wilfert, R. Infectious Disease Surveillance and Outbreak Investigation using GIS. Focus, Volume 5, p. 3. Available online: https://nciph.sph.unc.edu/focus/vol5/issue2/5-2Mapping_issue.pdf (accessed on 13 December 2019).
- ASTHO Organization Technologies for Vector-Borne Disease Surveillance. p. 3. Available online: https://astho.org/Programs/Environmental-Health/Natural-Environment/VBD-Tech-Surveillance-Scan/ (accessed on 13 December 2019).
- Kazmi, S.J.H.; Usery, E.L. Application of remote sensing and gis for the monitoring of diseases: A unique research agenda for geographers. Remote Sens. Rev. 2001, 20, 45–70. [Google Scholar] [CrossRef]
- Pam, D.D.; Omalu, I.C.J.; Akintola, A.A.; Dan, A.Y.; Kalesanwo, A.O.; Babagana, M.; Muhammad, S.A.; Ocha, I.M.; Adeniyi, K.A. The Role of GIS And Remote Sensing in the Control of Malaria. Online J Health Allied Scs. 2017, 16, 7. Available online: http://www.ojhas.org/issue63/2017-3-7.html (accessed on 26 May 2020).
- Kalluri, S.; Gilruth, P.; Rogers, D.; Szczur, M. Surveillance of Arthropod Vector-Borne Infectious Diseases Using Remote Sensing Techniques: A Review. PLoS Pathog. 2007, 3, e116. [Google Scholar] [CrossRef]
- Jeanne, I.; Chambers, L.E.; Kazazic, A.; Russell, T.L.; Bobogare, A.; Bugoro, H.; Otto, F.; Fafale, G.; Amjadali, A. Mapping a Plasmodium transmission spatial suitability index in Solomon Islands: A malaria monitoring and control tool. Malar. J. 2018, 17, 381. [Google Scholar] [CrossRef] [PubMed]
- Mandyata, C.B.; Olowski, L.K.; Mutale, W. Challenges of implementing the integrated disease surveillance and response strategy in Zambia: A health worker perspective. BMC Public Health 2017, 17, 746. [Google Scholar] [CrossRef] [Green Version]
- Rahman, S.-U.; Smith, D.K. Use of location-allocation models in health service development planning in developing nations. Eur. J. Oper. Res. 2000, 123, 437–452. [Google Scholar] [CrossRef]
- Afshari, Q.P.H.; Peng, H.A.A.Q. Challenges and Solutions for Location of Healthcare Facilities. Ind. Eng. Manag. 2014, 3. [Google Scholar] [CrossRef]
- Kotavaara, O.; Pohjosenperä, T.; Juga, J.; Rusanen, J. Accessibility in designing centralised warehousing: Case of health care logistics in Northern Finland. Appl. Geogr. 2017, 84, 83–92. [Google Scholar] [CrossRef]
- Abdelkarim, A. Integration of Location-Allocation and Accessibility Models in GIS to Improve Urban Planning for Health Services in Al-Madinah Al-Munawwarah, Saudi Arabia. J. Geogr. Inf. Syst. 2019, 11, 633–662. [Google Scholar] [CrossRef] [Green Version]
- Polo, G.; Acosta, C.M.; Ferreira, F.; Dias, R.A. Location-Allocation and Accessibility Models for Improving the Spatial Planning of Public Health Services. PLoS ONE 2015, 10, e0119190. [Google Scholar] [CrossRef] [PubMed] [Green Version]
Figure 1.
Hippocrates and relationship between health and place. (Source: [1]).
Figure 1.
Hippocrates and relationship between health and place. (Source: [1]).

Figure 2.
Al-Razi and the best location for building a hospital in Baghdad City (Source: [1]).
Figure 2.
Al-Razi and the best location for building a hospital in Baghdad City (Source: [1]).

Figure 3.
The first spatial health map of the plague disease in Bari, Italy, 1694. (Source: [1]).
Figure 3.
The first spatial health map of the plague disease in Bari, Italy, 1694. (Source: [1]).

Figure 4.
Spatial distribution of cholera cases in London, England, produced by Dr. Snow, 1854.(Source: [1]).
Figure 4.
Spatial distribution of cholera cases in London, England, produced by Dr. Snow, 1854.(Source: [1]).

Figure 5.
One of the atlas maps of geographical distribution of cancer disease in the Divisions and Counties of England and Wales, produced by Haviland, 1875 (Source: [13]).
Figure 5.
One of the atlas maps of geographical distribution of cancer disease in the Divisions and Counties of England and Wales, produced by Haviland, 1875 (Source: [13]).

Figure 6.
Example of atlas maps of heart disease and stroke produced by the Center for Disease Control and Prevention (CDC). (Source: [18]).
Figure 6.
Example of atlas maps of heart disease and stroke produced by the Center for Disease Control and Prevention (CDC). (Source: [18]).

Figure 7.
Reported influenza morbidity in Iceland in the period from January 1915 to December 1976. (Source: [34]).
Figure 7.
Reported influenza morbidity in Iceland in the period from January 1915 to December 1976. (Source: [34]).

Figure 8.
Spatial mapping and analysis of cholera in the Sabah area, Malaysia. (Source: [40]).
Figure 8.
Spatial mapping and analysis of cholera in the Sabah area, Malaysia. (Source: [40]).

Figure 9.
Modeling population access to New Zealand public hospitals. (Source: [56]).
Figure 9.
Modeling population access to New Zealand public hospitals. (Source: [56]).

Figure 10.
Modeling the spatial accessibility of the elderly to healthcare services in Beijing, China using a multimode and variable-demand two-step floating catchment area (2SFCA) model. (Source: [62]).
Figure 10.
Modeling the spatial accessibility of the elderly to healthcare services in Beijing, China using a multimode and variable-demand two-step floating catchment area (2SFCA) model. (Source: [62]).

Figure 11.
Web-based Geographic Information Systems (GIS) for public health information visualization: distribution map with pie chart to express public health information. (Source: [70]).
Figure 11.
Web-based Geographic Information Systems (GIS) for public health information visualization: distribution map with pie chart to express public health information. (Source: [70]).

Figure 12.
Maps showing the potential distribution of four species of mosquito in the United States. (Source: [83]).
Figure 12.
Maps showing the potential distribution of four species of mosquito in the United States. (Source: [83]).

Figure 13.
Spatial accessibility to sterilization sites arising from the location–allocation models in Bogota, Colombia. (Source: [90]).
Figure 13.
Spatial accessibility to sterilization sites arising from the location–allocation models in Bogota, Colombia. (Source: [90]).

© 2020 by the authors. Licensee MDPI, Basel, Switzerland. This article is an open access article distributed under the terms and conditions of the Creative Commons Attribution (CC BY) license (http://creativecommons.org/licenses/by/4.0/).
Share and Cite
MDPI and ACS Style
Khashoggi, B.F.; Murad, A. Issues of Healthcare Planning and GIS: A Review. ISPRS Int. J. Geo-Inf. 2020, 9, 352. https://doi.org/10.3390/ijgi9060352
AMA Style
Khashoggi BF, Murad A. Issues of Healthcare Planning and GIS: A Review. ISPRS International Journal of Geo-Information. 2020; 9(6):352. https://doi.org/10.3390/ijgi9060352
Chicago/Turabian StyleKhashoggi, Bandar Fuad, and Abdulkader Murad. 2020. "Issues of Healthcare Planning and GIS: A Review" ISPRS International Journal of Geo-Information 9, no. 6: 352. https://doi.org/10.3390/ijgi9060352
Note that from the first issue of 2016, this journal uses article numbers instead of page numbers. See further details here.