Geovisualization and Geographical Analysis for Fire Prevention


Department of Human Geography, Faculty of Social Sciences, Lund University, Sölvegatan 12, S-223 62 Lund, Sweden
ISPRS Int. J. Geo-Inf. 2020, 9(6), 355; https://doi.org/10.3390/ijgi9060355
Submission received: 30 April 2020
/
Revised: 22 May 2020
/
Accepted: 25 May 2020
/
Published: 27 May 2020
Abstract
:Swedish emergency services still have relatively limited resources and time for proactive fire prevention. As a result of this, there is an extensive need for strategic working methods and knowledge to take advantage of spatial analyses. In addition, decision-making based on visualizations and analyses of their own collected data has the potential to increase the validity of strategic decisions. The objective of this paper is to critically examine how some different geovisualization techniques—point data, kernel density and choropleth mapping—actively can complement each other and be applied in fire preventive work. The results show that each technique itself has limitations, but that, in combination, they increase the scope for interpretation and the possibilities of targeting different forms of preventive measures. The investigated geovisualization techniques facilitate various forms of fire prevention such as identifying which areas to prioritize for outreach, home visits, identification and targeting of different risk groups and customized information campaigns about certain types of fires in risk-prone areas. Furthermore, fairly simple mapping techniques can be utilized directly to evaluate incident reports and increase the quality of geocoded fire incidents. The study also shows how some of these techniques can be applied when analyzing residential fire incidents and their relation to underlying structural and socio-economic factors as well as spatio-temporal dimensions of fire incident data. The spatial analyses and supporting maps can help find and predict risk areas for residential fires or be used directly to formulate hypotheses on fire patterns. The generic functionality of the visualization methods makes them also useful for visual analysis of other types of incidents, such as reported crimes and accidents. Finally, the results are applicable to a work process adapted to the Swedish legislation on confidential data.
1. Introduction
The Swedish Civil Contingencies agency has a stated goal for fire safety in Sweden through Vision Zero aiming to eliminate citizen casualties and deaths [1]. In practice, the task for Swedish emergency services, is to reduce the number of fires and increase the ability to handle them when they arise. Beyond technical fire protection, the Swedish emergency services work actively with different fire safety outreach strategies. Such efforts cover everything from spreading information through campaigns, websites and social media to collaboration with other professionals such as the police or social services. The outreach methods also include educational fire safety demonstrations in schools, workplaces and retirement homes [2]. An effective way to improve fire safety work and the identification of fire-exposed areas and risk groups is to make better use of the fire statistics the emergency services have available in their databases. In this context, georeferenced fire data and various forms of visualizations are becoming increasingly important.
Geographical visualizations of urban fire incidents are relatively common in scientific contexts [3,4,5]. Spatial techniques are also widely used to visualize and analyze crimes, fires or other incidents over a specific urban area [6,7]. The aims with these spatial methods can vary, but the spatial dimension often gives the user an opportunity to reveal possible spatial patterns of incidents. Such information can be used for both theoretical and practical purposes, such as risk modeling, linking to socio-economic variables, theorizing causes of crimes and fires and developing hypotheses and approaches. These techniques can also be applied to analyze specific types of fire incidents on different geographical scales and in various areas.
The magnitude of different types of fire incidents tends to vary in different areas. This is particularly significant for intentional fires, which often seem to be overrepresented in disadvantaged urban areas [8,9]. To highlight and understand the spatial dynamics and complexity of spatial phenomena, such as residential fires, often more than one spatial technology is needed [10]. An overall concern is thus how different spatial visualization techniques can be combined and develop the analysis of fire incidents on different geographic scales, and how these techniques can be applied by researchers and practitioners in a more structured way. Thus, there is a need for more in-depth knowledge and structured approaches of combined (geo) data-driven methods and visualization techniques in fire prevention processes.
In the scientific literature, there is a general lack of spatial methods and strategies targeting the emergency services’ preventive fire work. Some of the existing and related GIS-based approaches include spatio-temporal analysis of structural fire incidents for fire prevention planning and fire response [6] as well as analysis of spatio-temporal distribution of intentional fires and living conditions as a basis for fire safety policies and fire prevention measures [9]. Other related approaches encompass explorative spatial analysis methods for rescue services [11], space-time patterns of residential structure fires and theory-based fire prevention [12] and spatial modeling of community fire risks for fire prevention activities [13]. Additional relevant studies cover risk mitigation strategies to support safety and emergency planning in case of urban fire [14,15], and the development of a methodology for risk assessment to handle territorial data [16]. Many of these spatial methods and visualization techniques are data-driven, and the reliability of the results is often influenced by the quality of the input data [7]. The reliability of the result is also affected by different settings such as scale, bandwidth, spatial analysis method and choice of visualization techniques. Geovisualization can thus be seen as a powerful strategy to present large spatial datasets, and the visual analysis offers a fast and interactive insight into the data without prior theoretical skills [7,10].
Swedish emergency services personnel have access to large amounts of data on fires and accidents collected from several national systems such as Daedalos or IDA [17,18]. Some systems, such as Daedalos, contain simple support for visualizations of fire data, e.g., point and heat maps. However, there is limited knowledge among emergency services personnel of the influence of basics map settings, and consequently, how the maps can be interpreted and used in their fire prevention work. Despite good access to large amounts of temporal and spatial data, the use is often far from adequate, and the map applications are limited in their functionality.
Another important and relevant aspect related to the data management and spatial visualization process is how personal data should be processed and presented. The General Data Protection Regulation (GDPR) regulates the processing and flow of personal data in order to maintain privacy and anonymity rights for citizens within the European Union [19]. In a spatial data context, it is therefore essential to consider location-based information, geo-location methods and presentations forms that reduce the possibilities to identify and reveal private information about individuals. However, the scientific debate about individual exposure to location-enabled technologies is far from new, and has grown with social media and other ubiquitous positioning devices [20]. In addition to legal issues, geo-privacy also covers technological, ethical and educational aspects [21]. The coordination of privacy laws within EU to GDPR strengthens the restrictions and strongly influences the way organizations and authorities can process personal data. For emergency services, the use of private data is largely legal by exercise of authority according to the Civil Protection Act [22]. When it comes to data and presenting data on maps to be shared within and outside the emergency services organization, an appropriate method is to apply different spatial strategies depending on the type of fire preventive action.
Consequently, there is a need for co-organized approaches using geographical visualizations and spatial analytical techniques in order to prevent fire incidents in different residential areas. The aim of this paper is within the scope of a more structured and user-friendly spatial visualization approach. The objective of this paper is to critically examine how different geovisualization techniques—in this case point data, kernel density and choropleth (map with colored and bounded areas) mapping—can complement each other and be applied in fire preventive work.
The paper focuses on residential fires, which are defined broadly as fire incidents in residential buildings leading to emergency service interventions [23]. The examination includes a brief discussion on different subtypes of residential fires, such as intentional fires, accidental (unintentional) fires and fires related to technical failures or work processes. Furthermore, the paper also discusses the appropriateness (or not) of using different visualization techniques in relation to the General Data Protection Regulation (GDPR) and the protection of individuals [19].
A main conclusion from the paper are that the combination of several spatial techniques for visualizations of residential fires tend to increase the scope for interpretation and the possibilities of targeting various forms of preventive measures to specific neighborhoods, or even residential buildings with higher risk of residential fires.
2. Materials and Methods
This section presents the study area, material, methodological aspects and the process of applying different geovisualization techniques to fire prevention.
2.1. Study Area
In this paper, the geographical visualizations of residential fire data are demonstrated using the adjacent municipalities of Malmö and Burlöv as examples. Malmö is the fourth most densely populated city in Sweden, with more than 2159 inhabitants per km². Burlöv is the twelfth densest area, with more than 968 inhabitants per km². The municipalities have about 359,000 inhabitants (2018) and 160,000 households. About 70% of these are 1–2 people’s households. Over 80% of the residences are co-operative or rented apartments in apartment buildings [24,25]. Since the 1990s, the municipalities have gone through a substantial population increase owing to relatively high birth rates and a high influx of immigrants and young people.
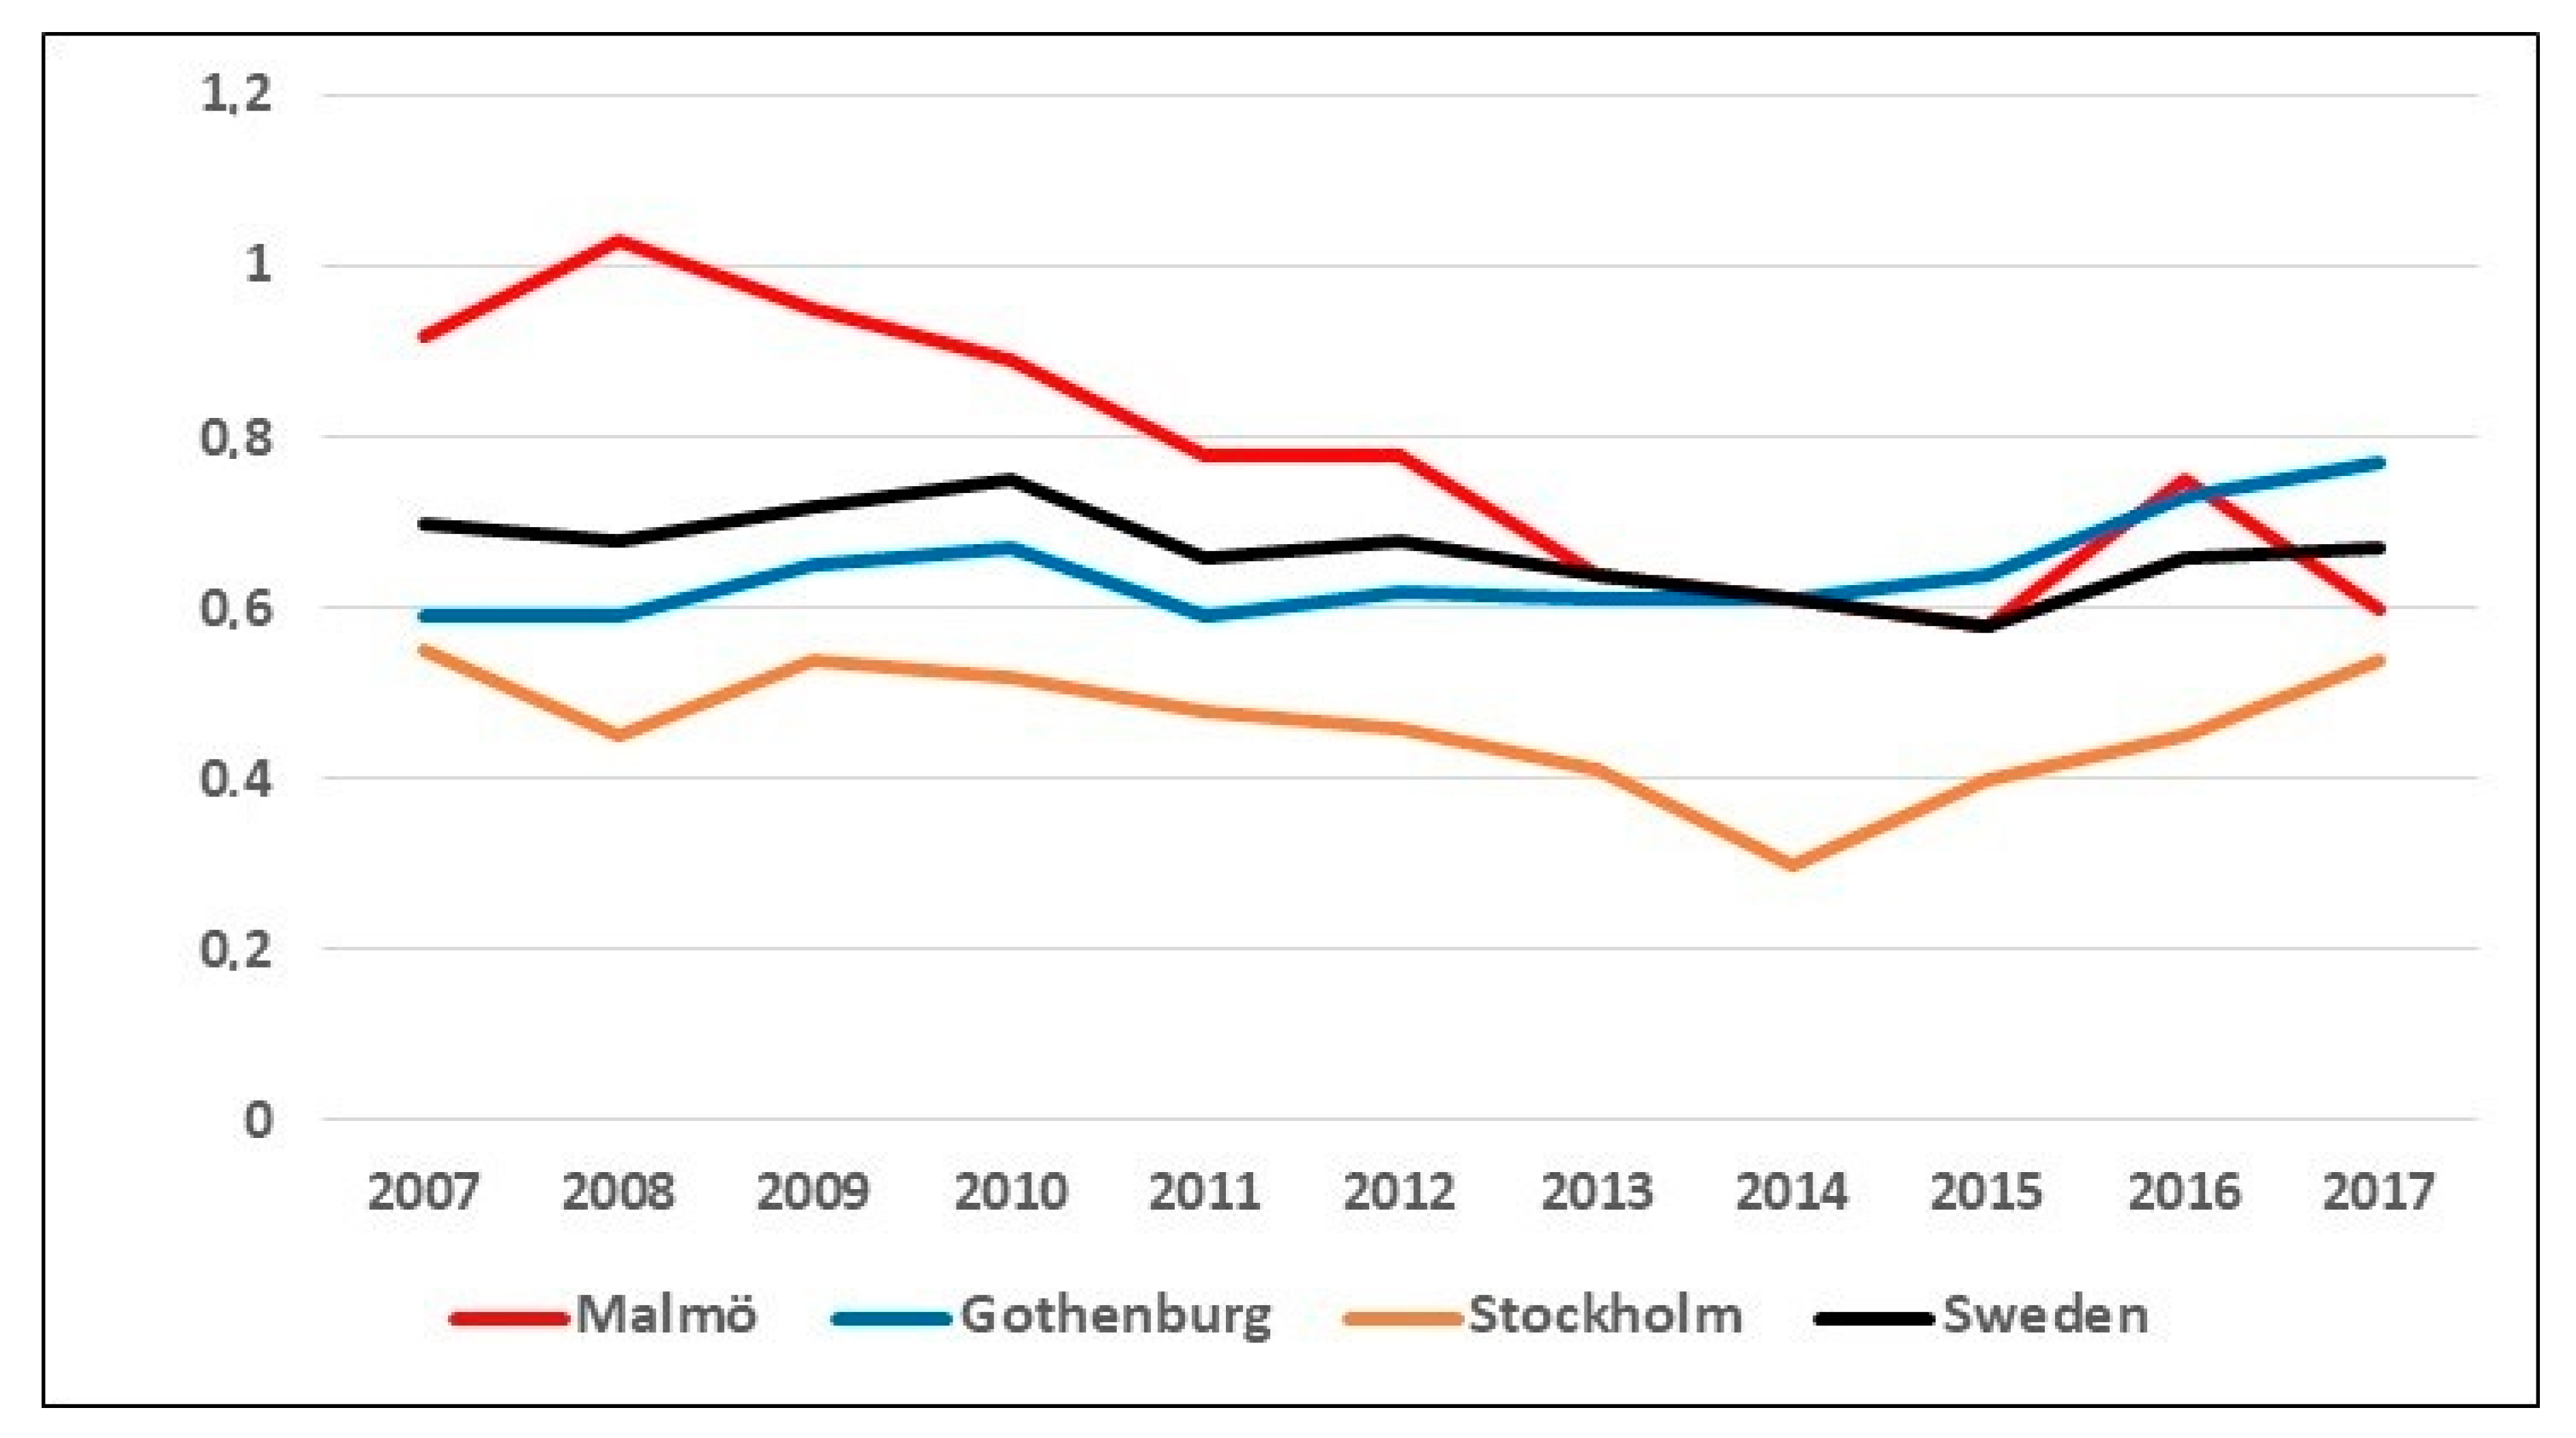
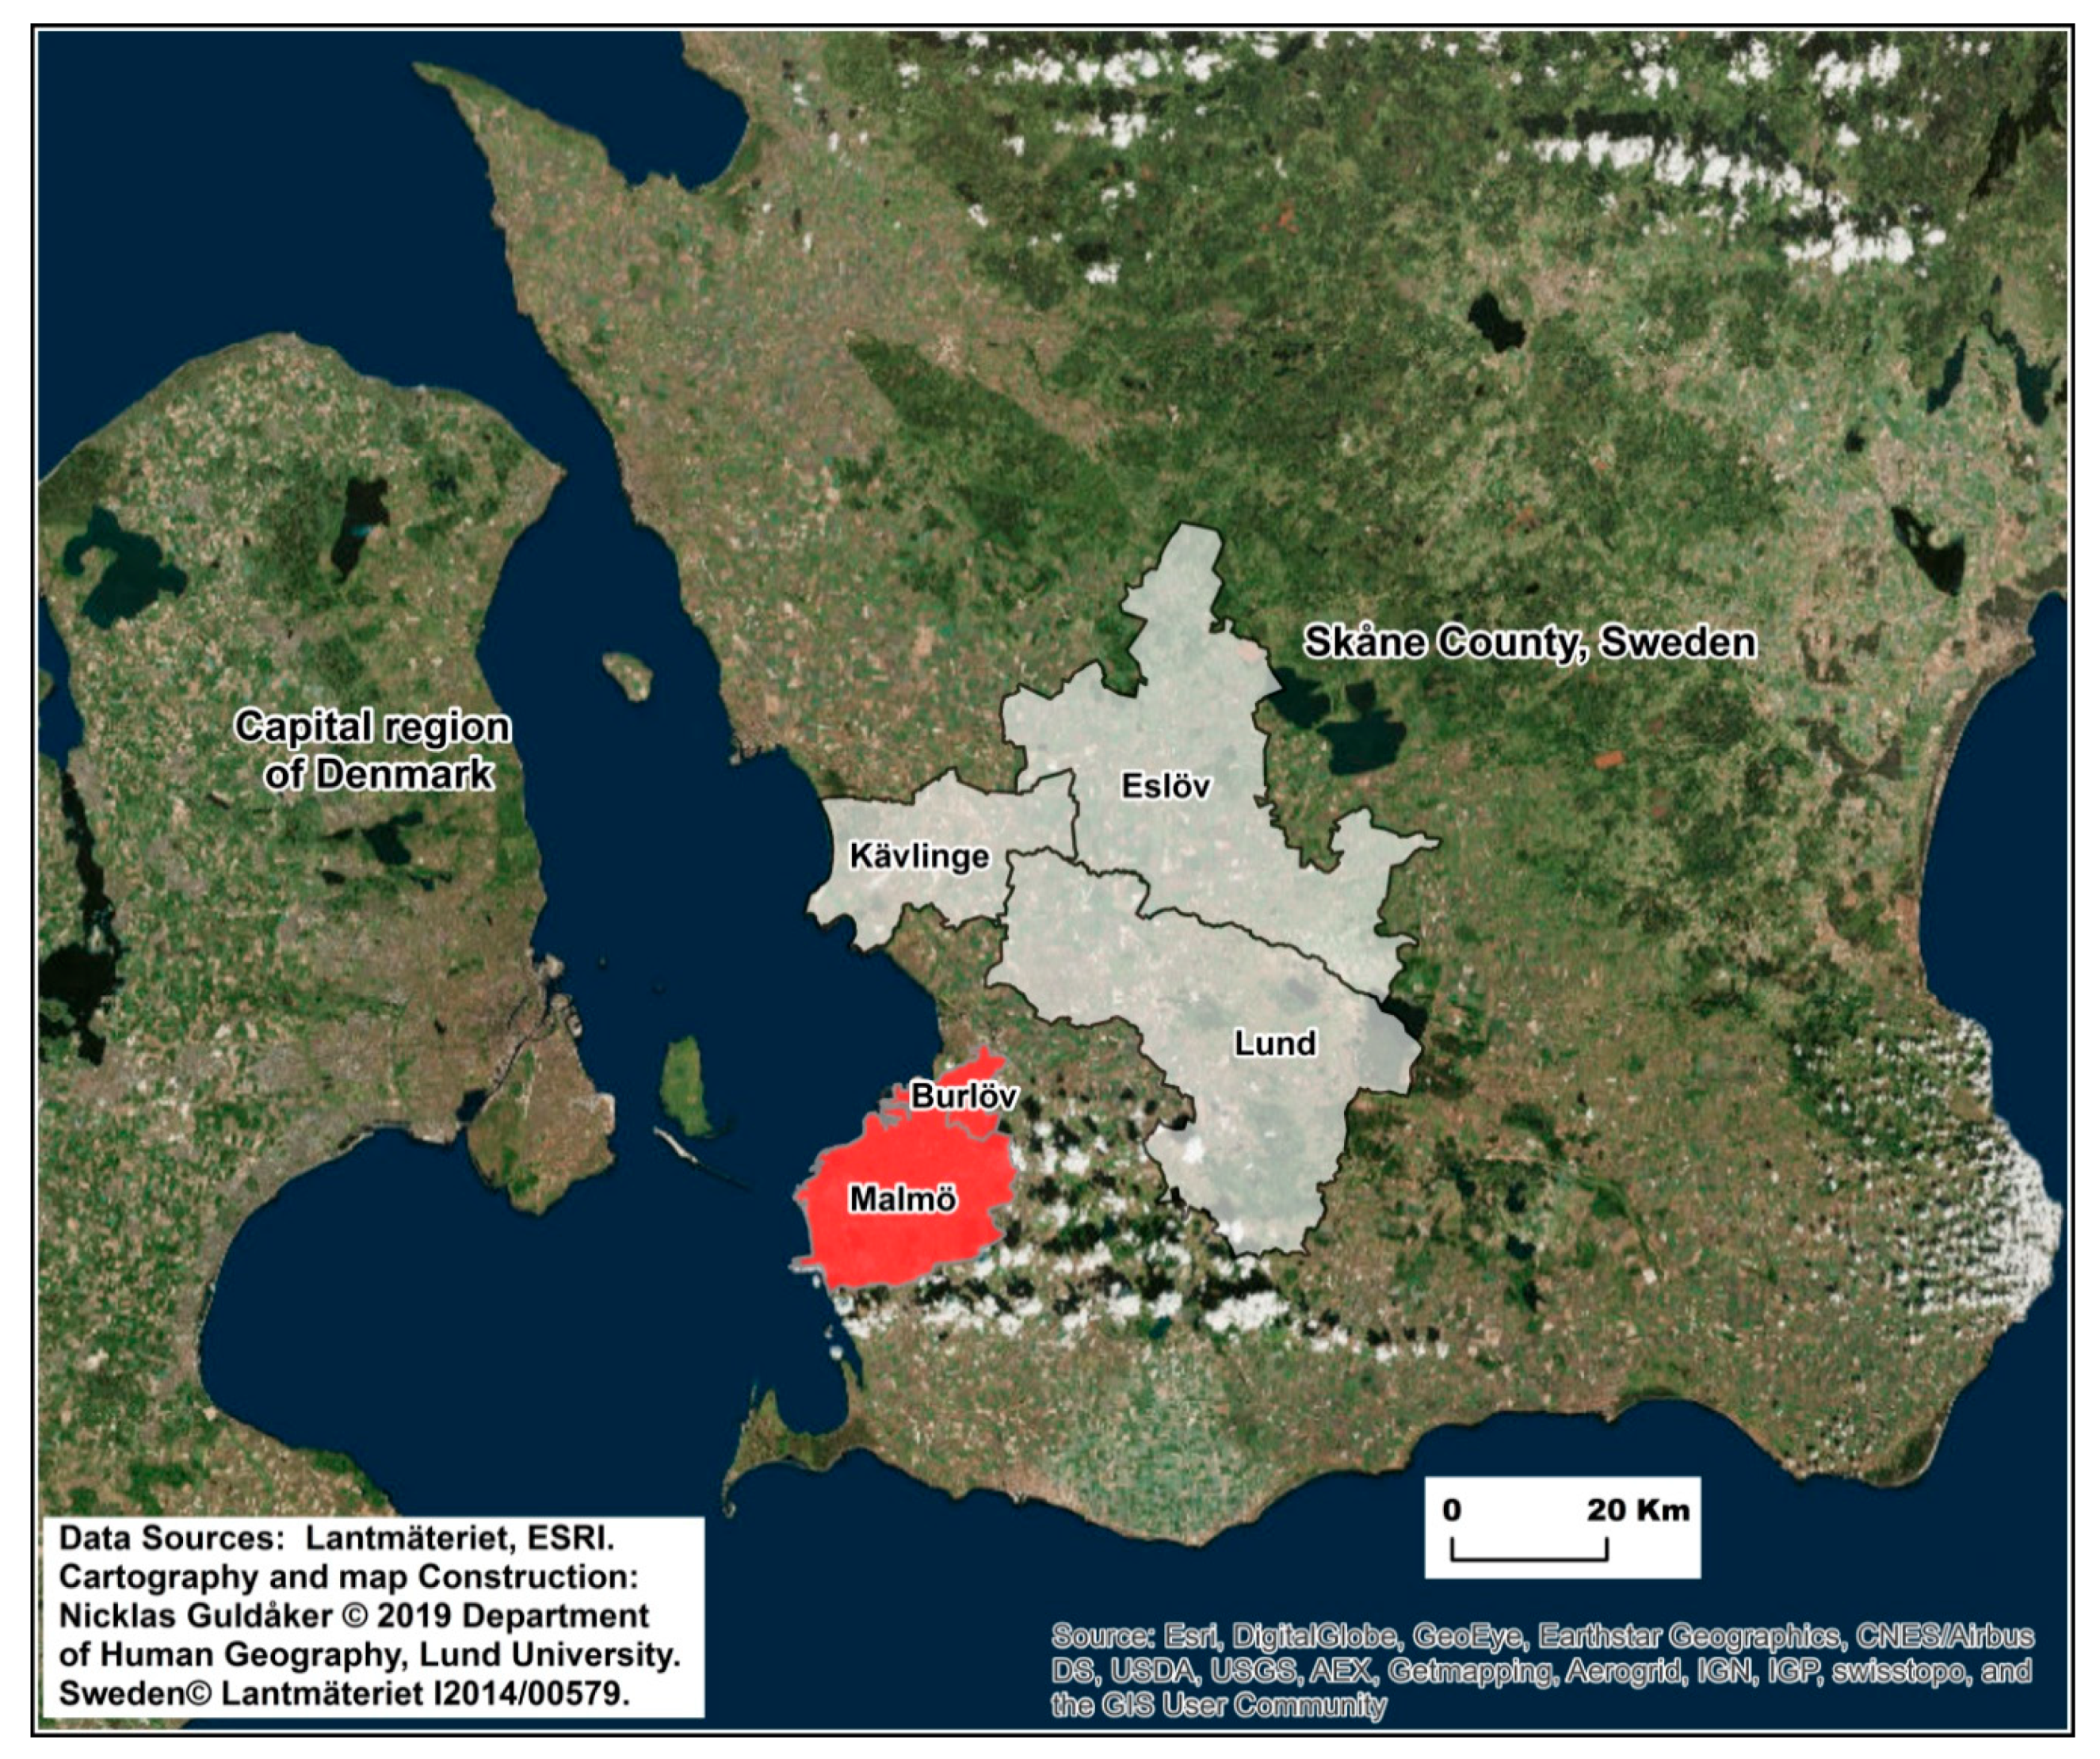
The city of Malmö is also characterized by an increasingly spatial, social and economic division. Statistics on residential fires from 2007–2017 shows a downward trend, especially for Malmö, which goes from a peak of 1.03 residential fires per 1000 inhabitants in 2008 to 0.58 in 2017. As shown in Figure 1, Malmö also goes from having a significantly higher average than all of Sweden and the other metropolitan areas of Gothenburg and Stockholm in 2008, to falling under the national average in 2017. The main reason for the declining trend is a significant decrease of intentional residential fires from 2008–2015. Intentional fires, both outdoor and in residential buildings, were particularly frequent in socioeconomically disadvantaged neighborhoods in Malmö during the period 2007–2012 [2,9]. Malmö and Burlöv are two out of five municipalities within the Emergency Services South’s geographical area of responsibility (Figure 2).
2.2. Data and Process
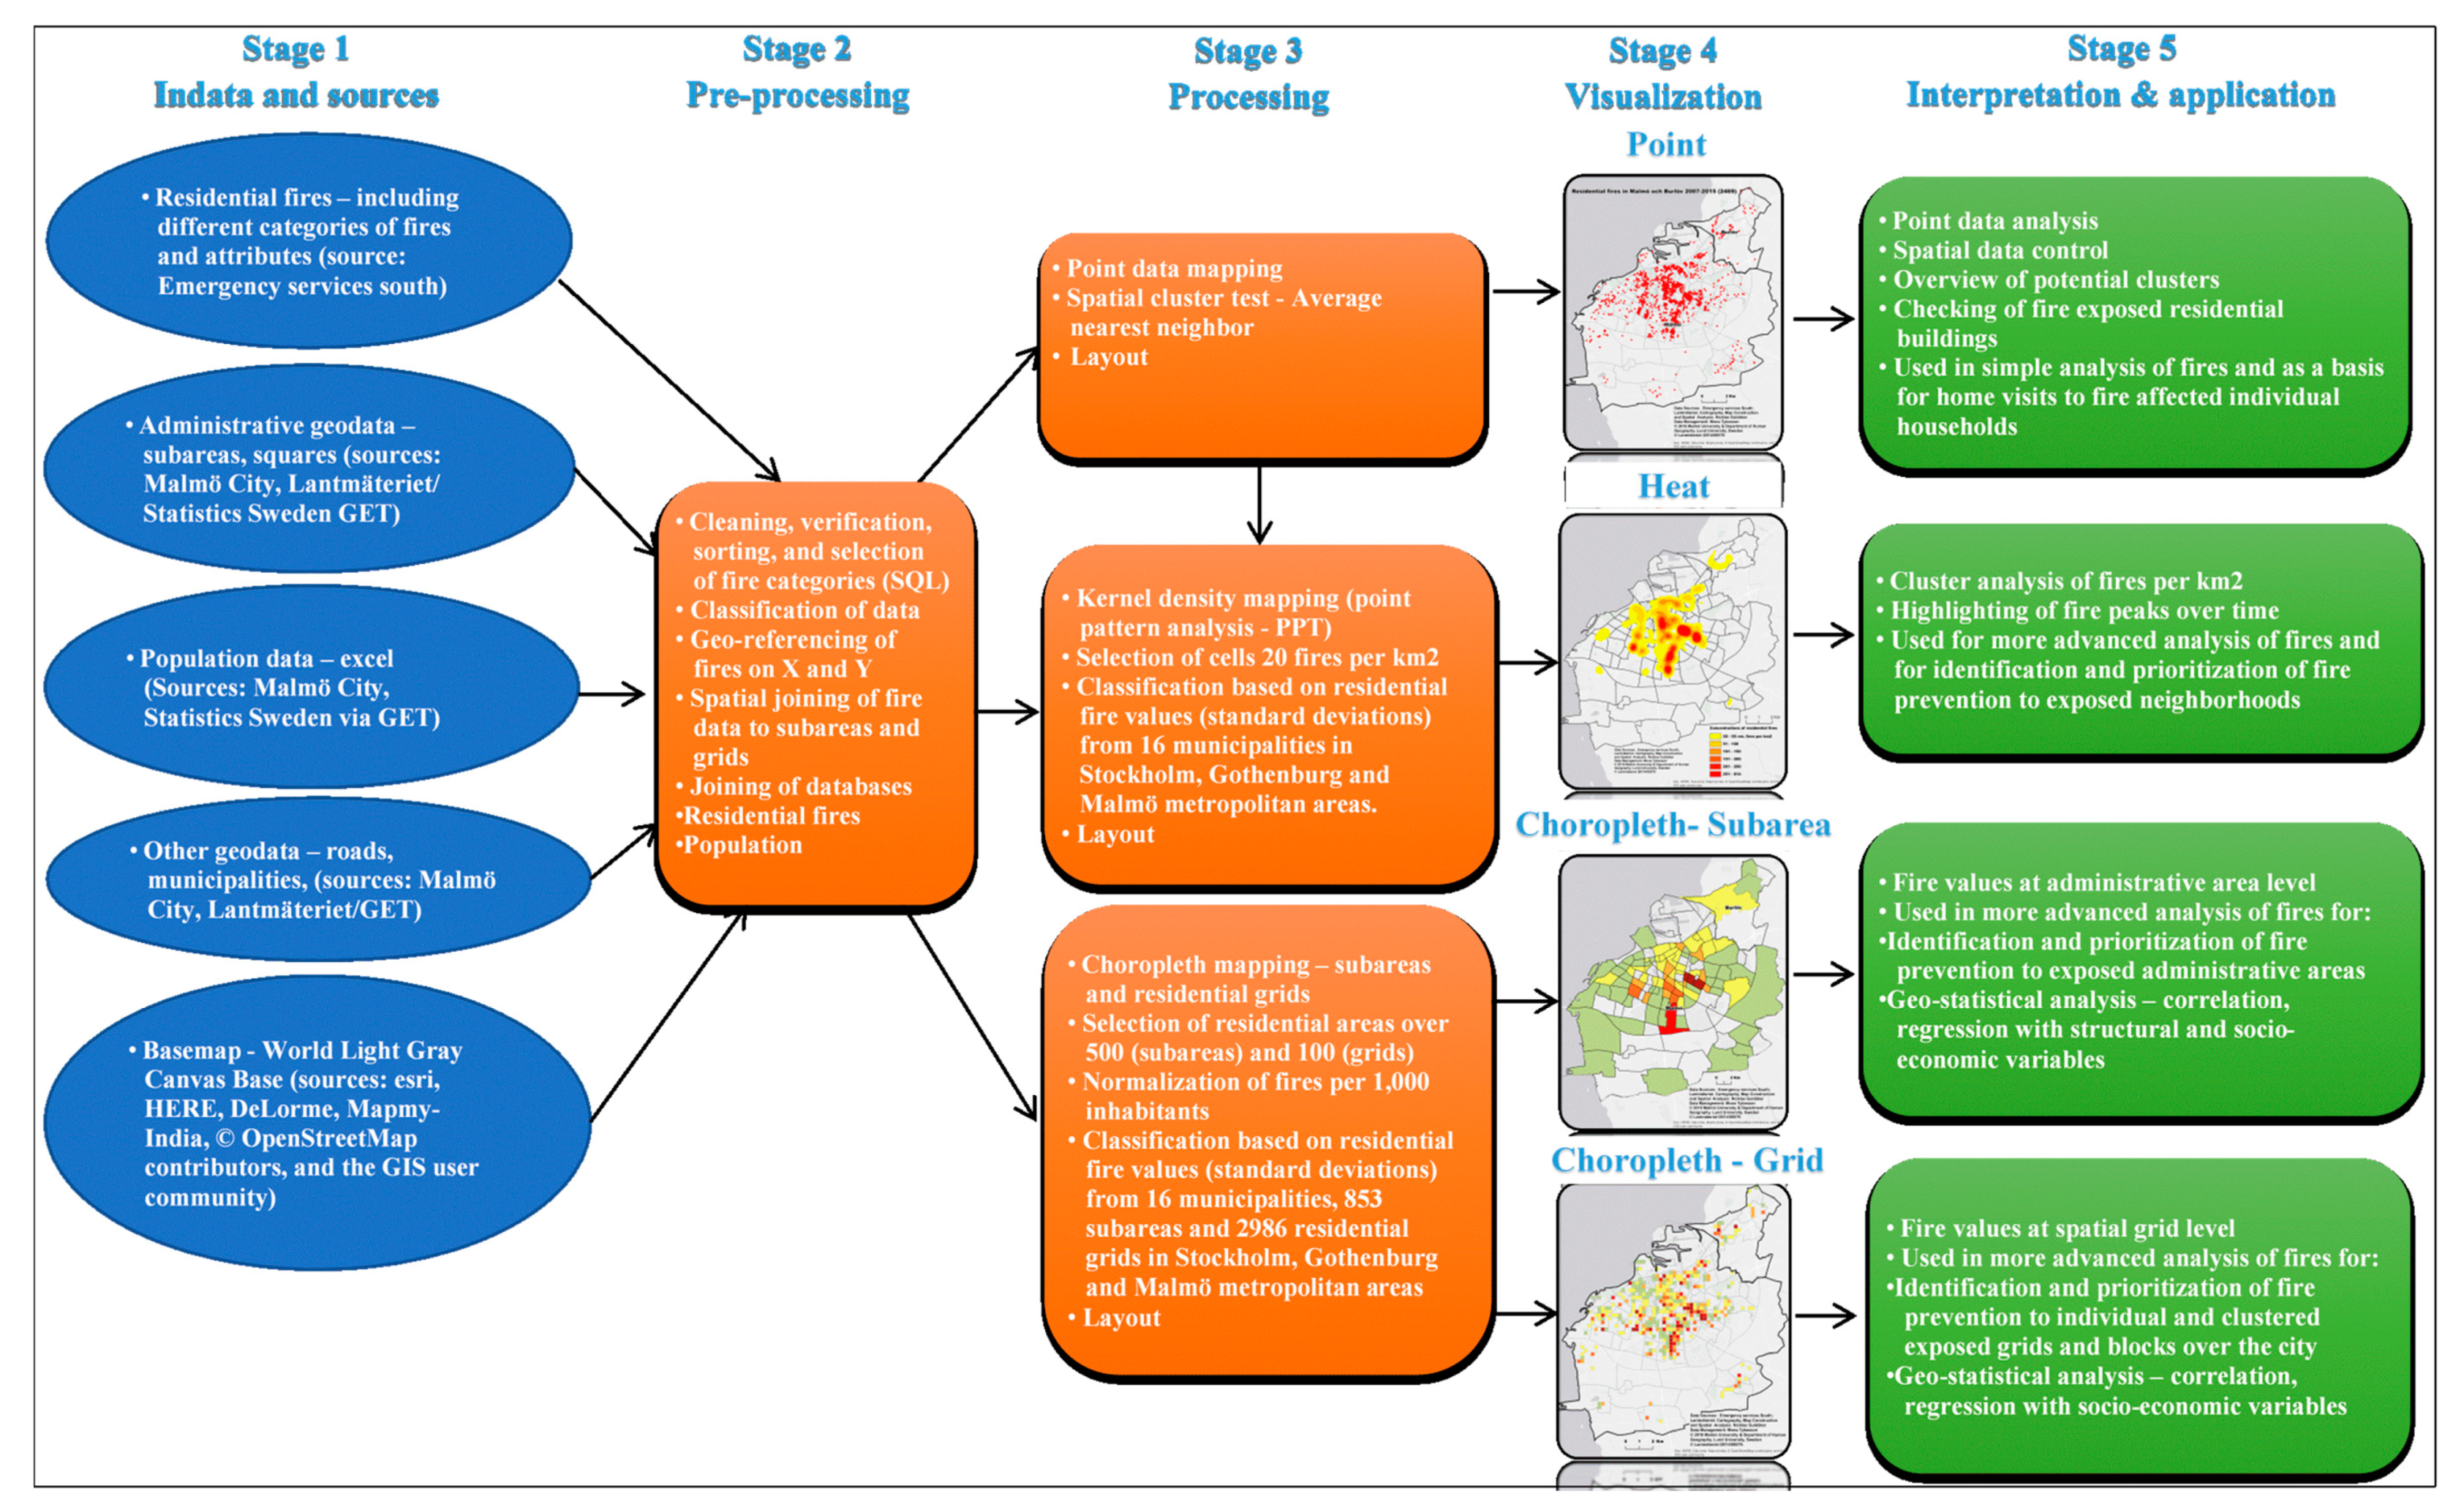
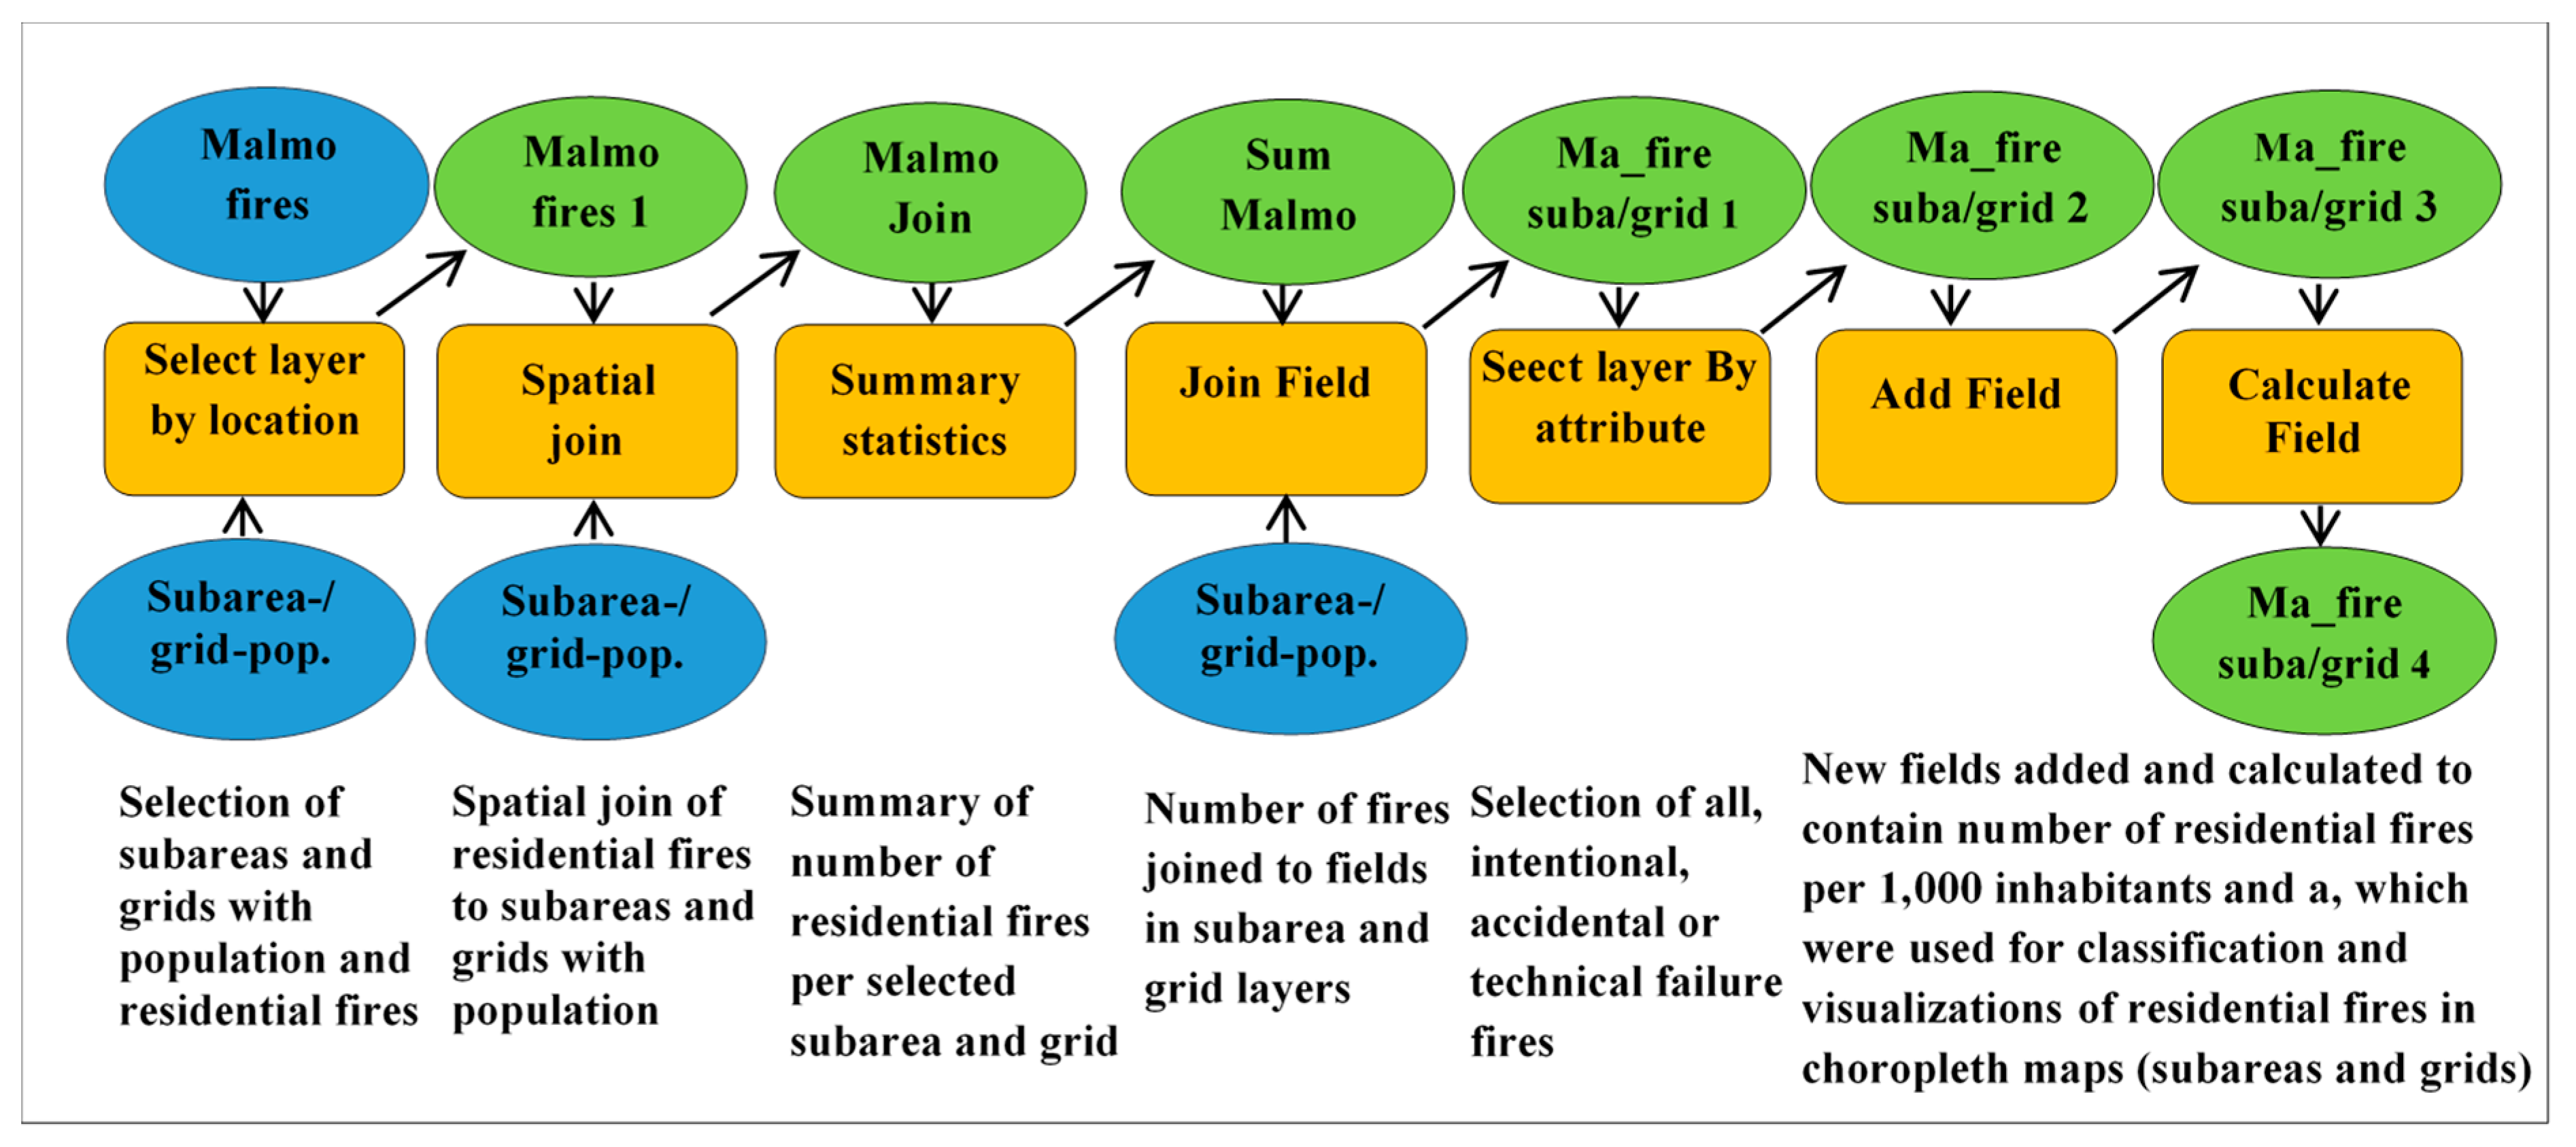
Applying different geovisualization techniques to fire prevention is divided in the following stages: In-data and Sources, Pre-processing, Processing and Visualization and Interpretation and Application (Figure 3).
2.2.1. Stage 1 In-Data and Sources
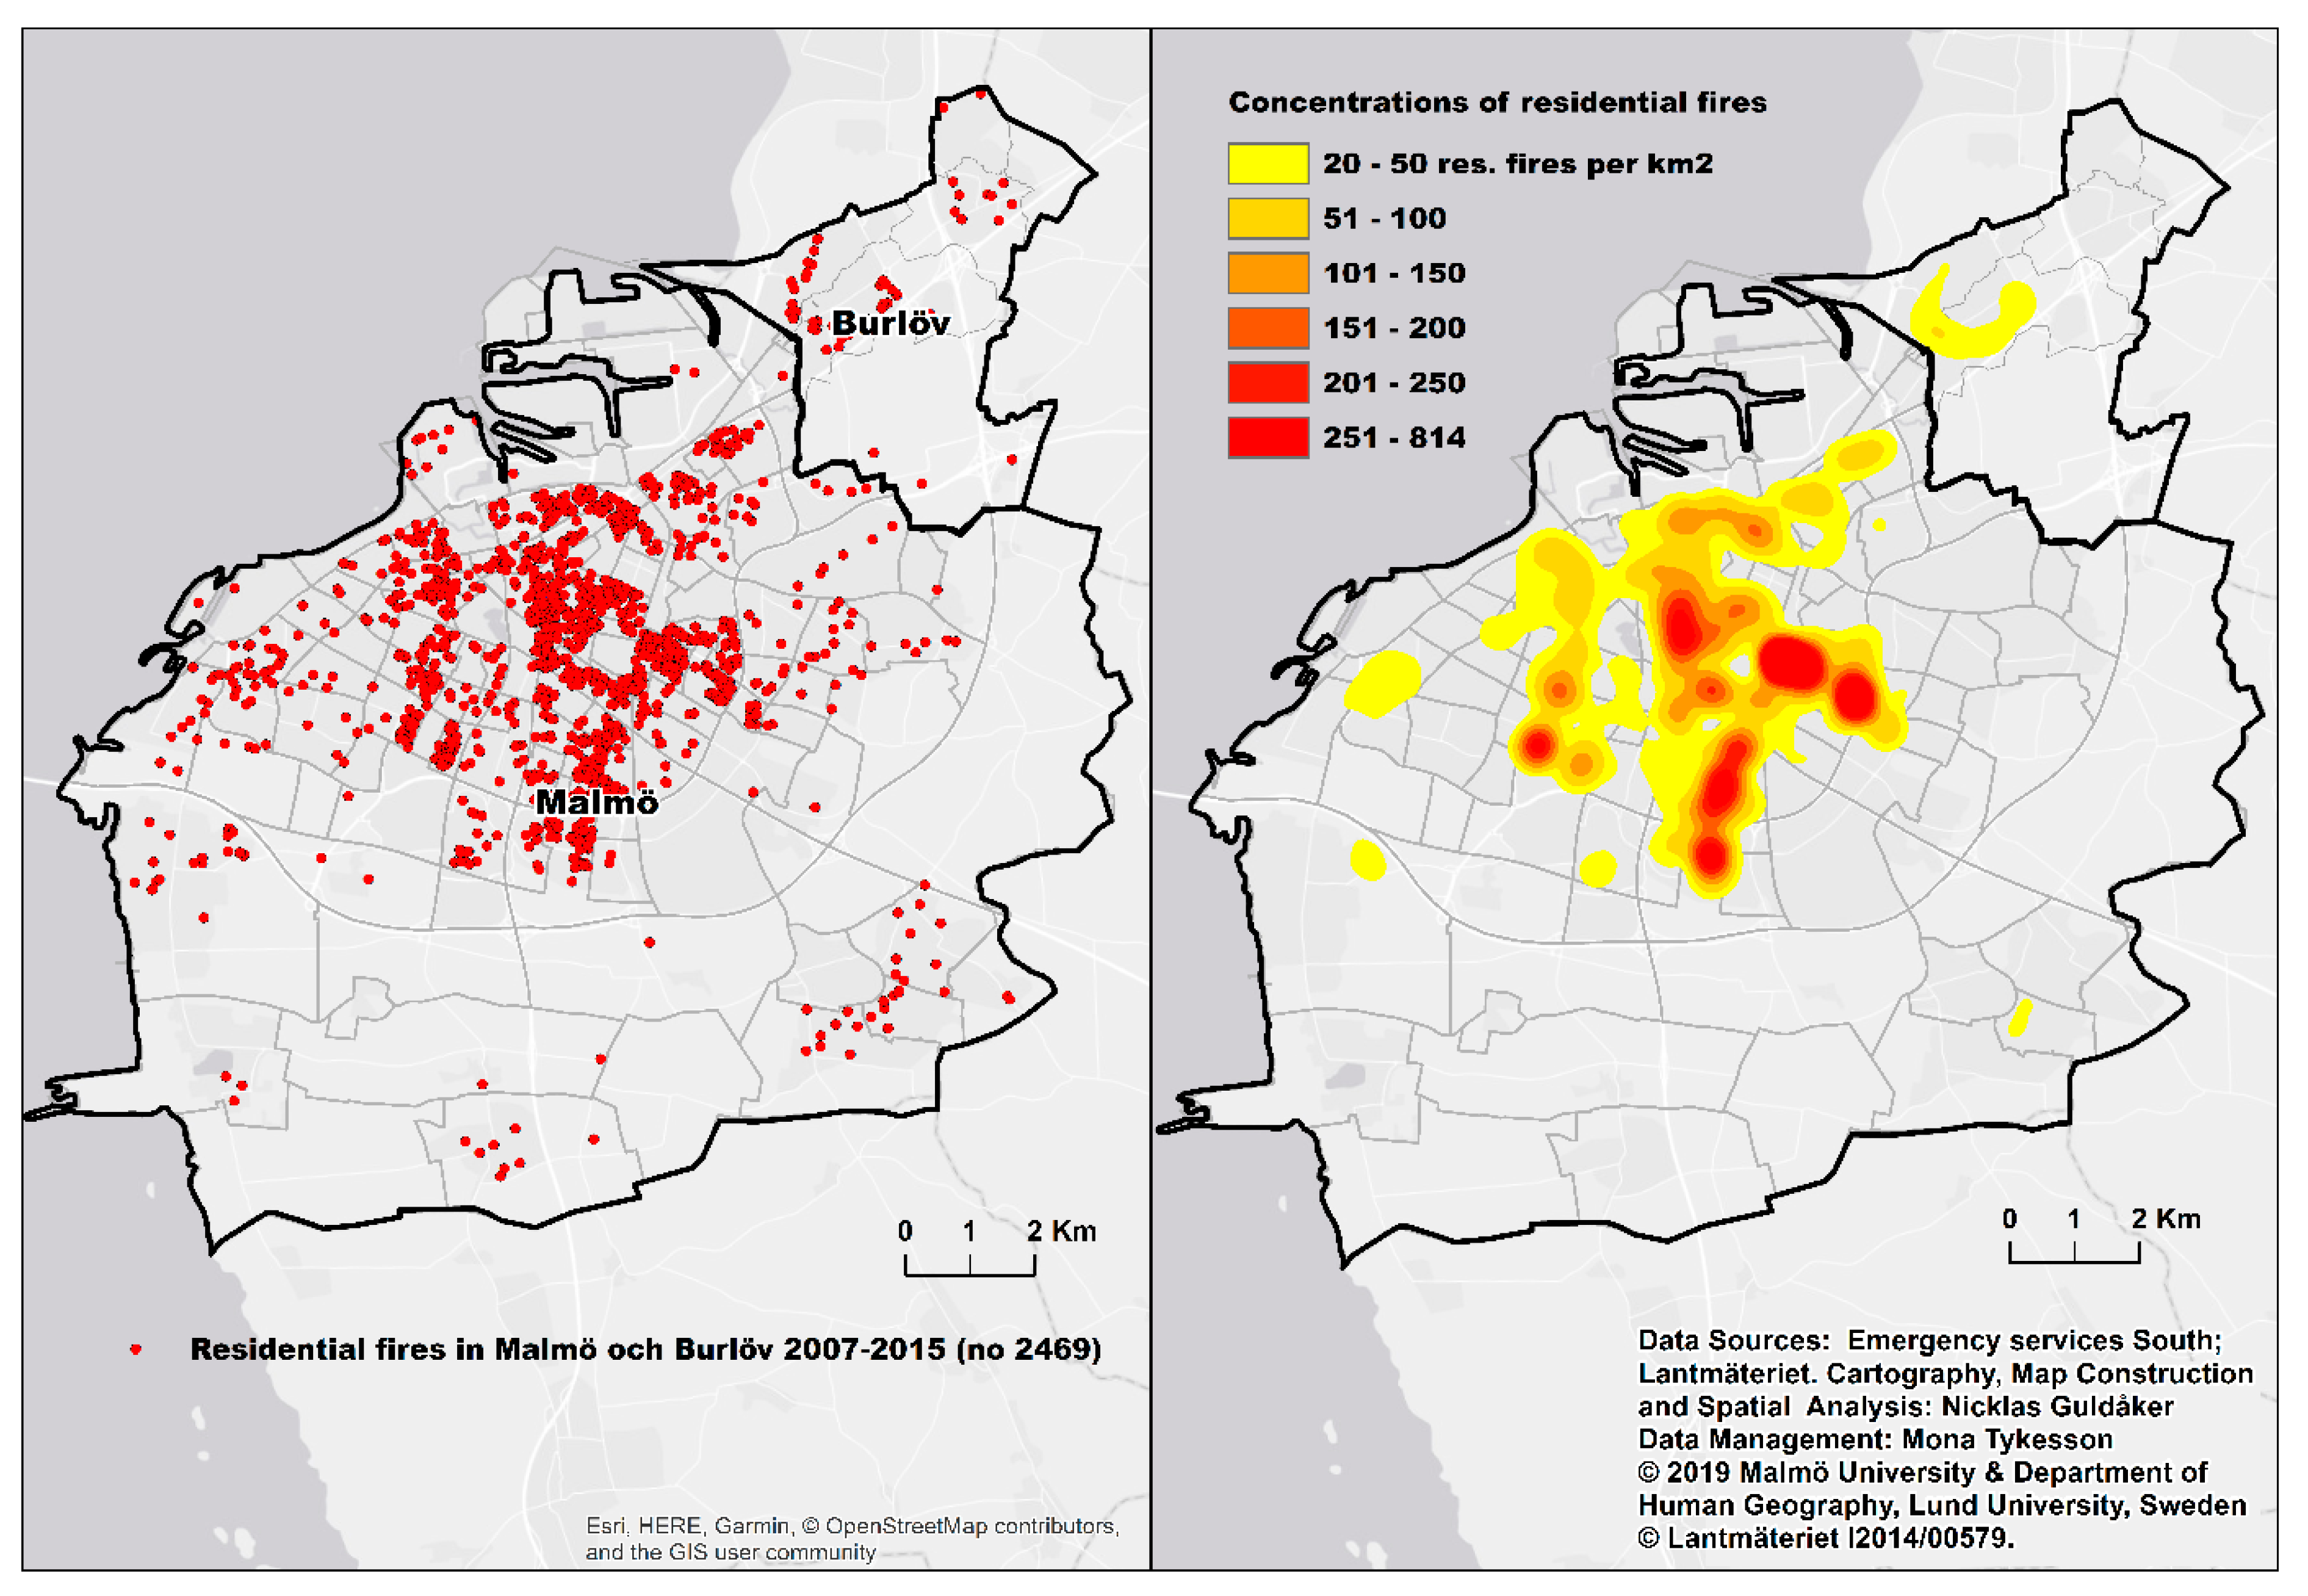
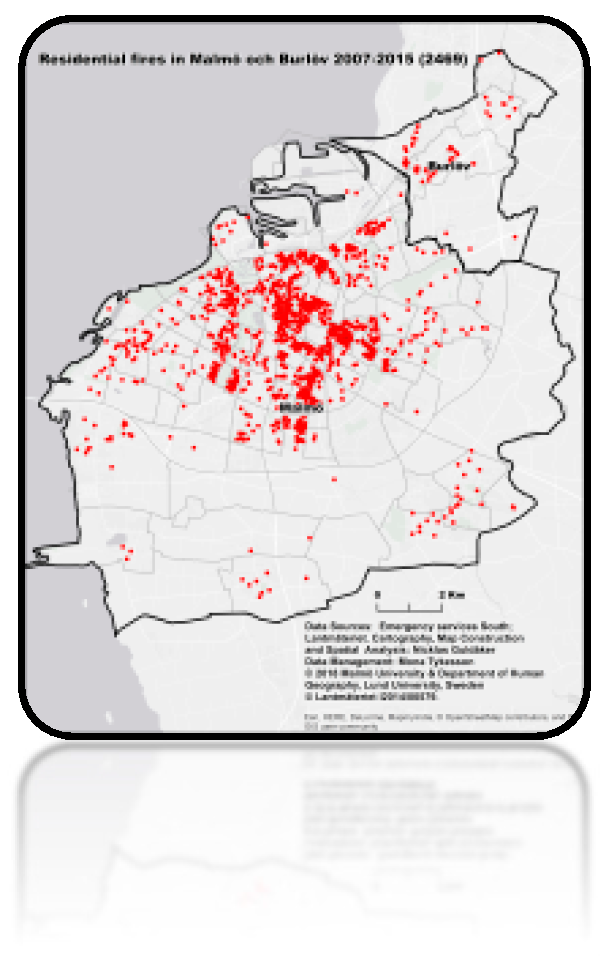
The fire records provided by the Emergency Services South over Malmö and Burlöv consist of 2469 residential fire incidents from 2007 to 2015 (Figure 4). The fire dataset includes locations of residential fire incidents (X- and Y-coordinates) as well as a variety of information about assessed causes of fire, starting places, temporal information and addresses. Population data and other geodata are collected from Malmö City and Statistics Sweden through the map service Geographic Extraction Tool (GET) available to most Swedish Universities and other higher education institutions [26]. The data is temporary stored in a geodatabase managed by the Department of Human Geography at Lund University [27]. The ESRI basemaps World Light Gray Canvas Base and Imagery are used as backgrounds (Stage 1 in Figure 3).
2.2.2. Stage 2 Pre-Processing
An important part of pre-processing the residential fire data was the data review including cleaning, verification, sorting and selection of fire data categories (Stage 2 in Figure 3). The selection criteria are based on previous research on residential fires [23]. The dataset over residential fires from the Emergency Services South was divided into one main and three different subcategories: 1) all residential fires; 2) intentional fires; 3) accidental fires; and 4) fires related to technical failures or work processes. Intentional fires are often associated with motives or expressions of norm breaking behaviors such as conflicts or different types of crime. Other motives can be thrill-seeking, boredom among young people or mental illness (pyromania) [9,28,29]. Intentional residential fires usually start in common areas that are difficult to monitor such as basements, storage rooms, stairwells in apartment buildings or just outside (outdoor fires) residential buildings [23]. Accidental fires can be related to people’s inability to prevent, detect and act when fires occur.
Common causes of accidental fires include stress, forgetfulness, inattention or mishaps often associated with other conditions, such as disabilities, alcohol or drug influence and medication side-effects [30]. Common activities behind accidental residential fires include cooking, smoking and the use of candles or open flames for heating. Fires can also occur because of technical failures during work processes such as construction or heating buildings, e.g., chimney fires [31]. Chimney fires also tend to increase during cold winters in Sweden [32]. In order to select data from the residential fire data set for each category, different SQL functions were constructed in ArcGIS (Table 1).
The pre-processing stage also includes geo-referencing of fire data to X and Y, spatial joining of fire data to subareas, vector grids in Malmö and Burlöv (Figure 5), as well as joining fire data to population data sets. In the subareas and grids, the numbers of residential fires are normalized per 1000 inhabitants. To facilitate the spatial joining of fire data to subareas and grids and normalization with population data, a model was created in ArcGIS (Figure 6). The model also presents the pre-visualization process, from selecting residential subareas/grids to calculating the number of residential fires per 1000 inhabitants and per year for the period 2007–2015.
2.2.3. Stages 3 and 4 Processing and Visualization
The processing of residential fire data for visualization and analysis of spatial fire data encompasses three different mapping methods (Stages 3 and 4 in Figure 3).
- The point data mapping of fire data in Malmö and Burlöv is preceded by a cluster test. A Nearest Neighbor test was conducted in order to determine whether residential fire clusters are statistically significant or whether they are likely explained by other reasons than random chance. For the purpose, the Average Nearest Neighbor tool in ArcGIS is utilized (see Section 3.1 below).
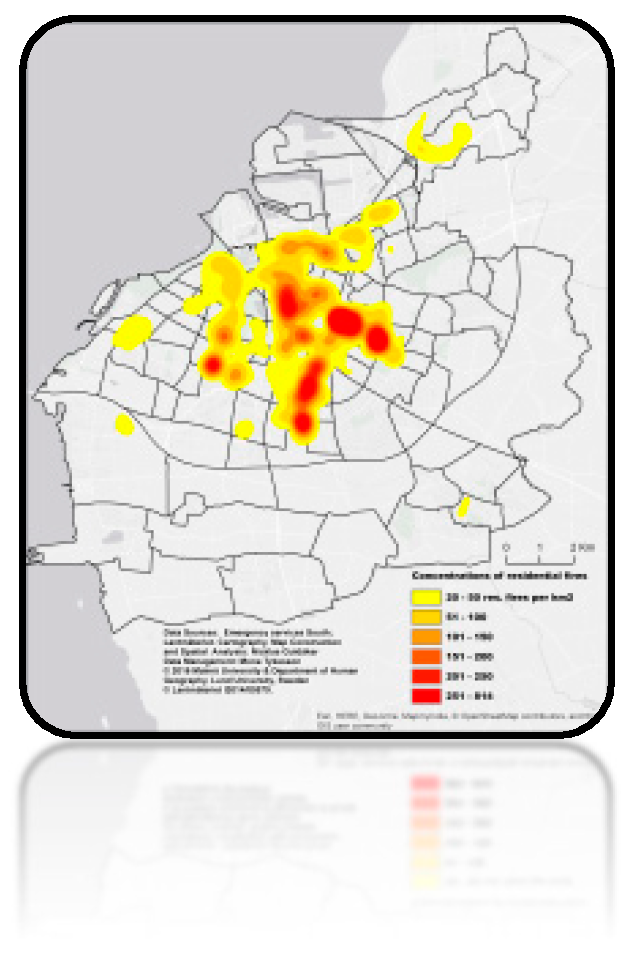
- The kernel density mapping is based on the kernel density estimation (KDE), which is one of various methods for point pattern analysis (PPT) [33]. KDE is widely used for the estimation of an increased probability of an event to occur in a pre-defined cluster [9,34,35]. In this paper, the density of different types of residential fires is calculated and visualized in raster layers with low to high values per square kilometer (km2). In other words, many adjacent raster cells with high values in one or many places in the map may indicate geographical concentrations of fires. The KDE method measures the distance between coordinates or centroids of the raster cells. An average of the distance from a coordinate to all nearest coordinates is then calculated. If the average appears to be less than the hypothetical value of random distribution of residential fires, the method indicates—as the Nearest Neighbor test proves—that there are clusters. In order to find these local patterns and to reduce the risk of spatial variation, the search radius (bandwidth) was set as default, the output cell size set consistently at 50 m, and the area unit set in square kilometers (km2). For the classification to be valid in a Swedish urban context, the ordering of the values into classes presented in the HEAT-maps is based on KDE-modeling of residential fire values from a larger data set covering 16 municipalities in Stockholm, Gothenburg and Malmö [2].
- The choropleth-mapping was performed in two ways: a) on subarea-level; and b) in statistical 250 × 250 m grids in more densely populated areas and 1000 × 1000 m grids in less densely populated areas. However, 1000 × 1000 m grids were not collected in Malmö and Burlöv owing to the high population density of these municipalities. In order to avoid distorted ratio values of residential fires per 1000 inhabitants, only subareas with more than 500 inhabitants and 250-meter grids with more than 100 residents were selected. The limit of 500 inhabitants for subareas is also a proven and appropriate level for statistical analyses conducted in a parallel study of Stockholm, Gothenburg and Malmö metropolitan areas [36]. The classification of residential fire values per 1000 inhabitants into classes used in the choropleths is based on values from 853 subareas and 2986 residential grids in Stockholm, Gothenburg and Malmö metropolitan areas [2]. The classification technique is standard deviations rounded to the nearest half-integer, with the exception of the lowest and highest values. All layouts are carried out in ArcMap version 10.5.1.
2.2.4. Stage 5 Interpretation and Application
The interpretations and proposals for using these different geovisualization techniques in fire prevention are partly based on results and feedback from workshops with staff from emergency services in the three largest metropolitan areas in Sweden, and partly on results from the use of techniques and methods in research [32,36]. In total, four workshops have been held with 32 employees from Emergency Services South (Malmö), Emergency Services Stockholm, Emergency Services Södertörn (Stockholm) and Emergency Services Gothenburg. Participants in the workshops were analysts, statisticians, fire engineers, fire inspectors, chief fire officers, commanders, fire safety officers and area managers. The overall purpose of the workshops was to present, discuss and get feedback on different GIS-based and geo-statistical analyzes of residential fires within each emergency services area. The process during the workshops was that the various map visualizations were presented to the personnel from the emergency services. All participants were then given the opportunity to comment on and problematize both maps and the spatial distribution of fires within their areas of operation (e.g., districts within Malmö, Stockholm and Gothenburg). All comments were compiled into a document that was further used as input to the evaluation of strengths and weaknesses with the various geovisualization techniques and their specific applicability in the emergency service’s fire prevention work. The results of the presented geovisualization methods in this paper are based on all workshops and largely applicable to all three metropolitan areas. In order to not repeat presentations from all workshops, this paper only presents data and visualizations of the municipalities of Malmö and Burlöv.
3. Results and Discussion
In this section, different spatial visualization techniques and their applicability in fire prevention work are compared and critically examined (see also Stage 5 in Figure 3).
3.1. Point Maps
Point map visualizations hold exact cartesian coordinates of residential fires in the Euclidean space. These visualizations are advantageous for fire prevention, but can be difficult to validate. Dynamic Point map visualizations are more useful than static ones in the sense that they permit emergency services to navigate to exact x- and y-positions. The point map can be used to locate residential fires and discuss anticipated spatial clusters in different parts of the mapped area. Coordinates linked to specific addresses facilitate local and regional analyses. However, a possible spatial cluster must be proved, such as in Figure 4 and Figure 7 over Malmö and Burlöv. A Nearest Neighbor (NN) test reveals that the observed mean distance is much lower than the estimated mean for all residential fires in Malmö and Burlöv. The probability (p) value is less than 0.01 (confidence level 99%), which means that clustered patterns for residential fires with a high probability can be explained by reasons other than random causes. Table 2 shows that all four subcategories of residential fires have spatial clustering. This is also confirmed by index values (average nearest neighbor ratios) significantly below 1.
The lowest index value applies for intentional fires, which indicates the strongest clustering among all categories. Other important uses of point map visualizations might be identifying mistakes in the data collection through using event reports, which can easily be corrected by double checking the positions just after a fire incident. This is particularly important because some of the reported fires have misplaced or no coordinates at all [37]. According to the emergency services, there are gaps in the knowledge and routines for working with dynamic maps and evaluating their spatial fire statistics. Consequently, it can be difficult for emergency service personnel to interpret the large amounts of points over large geographical areas. There are different ways to display and reveal spatio-temporal patterns of fires. Point maps, especially with individual colors for different categories, may work well for overall spatial analysis and hypothesis formulation about underlying causes and preparation for point pattern analysis (PPT).
Some caution should be taken with point maps when it comes to protecting personal data. In dynamic forms, e.g., on web GIS platforms with open access that can identify specific addresses, point maps are not compatible with the General Data Protection Regulation’s (GDPR’s) goal to maintain privacy and anonymity rights for citizens, e.g., those whom have had fire incidents at home.
3.2. Heat Maps
KDE modeling visualizes clusters of residential fires per area unit, in this case, square kilometer (km2). These heat-maps provide clear indications of where to find statistically significant clusters of fires in Malmö and Burlöv. In all categories of residential fires in Malmö and Burlöv, the observed average distance is below the estimated hypothetical mean distance (Table 2). Bright red colors and high values in the heat map indicate high spatial intensity of residential fires. Yellow colors correspond with lower concentrations. Concentrations below 20 residential fires per km2 have not been visualized and lacks color (Figure 4 and Figure 8). Statistically tested heat maps assist emergency services in selecting neighborhoods for further analysis and fire prevention. They may also indicate underlying spatial processes and phenomena that need to be examined more thoroughly, such as spatio-temporal analysis of residential fires or different living conditions in certain neighborhoods [7,9].
However, one weakness with heat maps is that they are not normalized. High concentrations of fires per km2 may possibly be an effect of many people living in dense areas, e.g., several block tower apartments within a smaller area, which is partly the case for Malmö and other metropolitan areas in Sweden. In order to reveal other underlying factors than population density, the heat-maps can be complemented with choropleth maps normalized with the population. Heat maps do not reveal where people live and can be used in communication about fire risks and fire prevention with other private or public actors.
3.3. Choropleth Maps
The choropleth maps display the residential fire and population ratio or the number of residential fires per 1000 inhabitants per year for the period 2007–2015 in Malmö and Burlöv. Choropleth visualizations are here represented using subarea and grid maps.
3.3.1. Subarea Maps
High or low values of residential fires in subareas of Malmö and Burlöv entail more or less fires relative to the population (Figure 5 and Figure 9). Notably, the average for Malmö and Burlöv is 0.76 residential fires per 1000 inhabitants, which is significantly higher than the average 0.49 for the metropolitan areas of Stockholm, Gothenburg and Malmö together. The highest value in Sweden, 6.1 residential fires per 1000 inhabitants during 2007–2015, is found in a subarea within Malmö called Rosengård, a district badly affected by intentional fire setting both outside and inside buildings [9]. As mentioned in Section 3, it should also be emphasized that the number of intentional fires in Malmö has decreased considerably during the period 2008–2015 [32]. The normalization of residential fires per 1000 inhabitants is an essential first stage in the analysis because determining factors other than population density may correlate to the spatial distribution of residential fires. The subarea level is advantageous for further geo-statistical analysis owing to a rich and partly open access to other data, such as socio-economic variables at the same geographic level. The subarea level has been used in several geo-statistical analyses of intentional and residential fires and underlying factors in Malmö, Stockholm and Gothenburg [9,36].
Another advantage of choropleth maps is that normalized subarea values can easily be compared with other normalized values in the same city or with other cities. In a comparison of residential fires between the three largest metropolitan areas in Sweden, eight out of eleven of the most affected areas are located in Malmö, while only two can be found in Stockholm, and one in Gothenburg [32]. One disadvantage is that the size of a subarea can be considered too big for more effective area-based fire prevention. Preventive residential fire interventions are more often targeted at smaller geographical areas such as neighborhoods, blocks or building with higher fire risks. Accordingly, emergency services need to identify work with large-scale fire risk areas, or in other words, smaller geographic units.
3.3.2. Grid Maps
Proposed grid maps show the number of residential fires per 1000 inhabitants in densely populated residential areas of Malmö and Burlöv (Figure 5 and Figure 10). In comparison to subarea maps, grid maps render an increased geographical accuracy. Many more grids hold values above the average residential fire to population ratio. This facilitates the emergency service’s preventive work, e.g., by prioritizing smaller and more homogeneous areas for home visits or other geographically targeted fire prevention measures. In the grid map, several high priority grids appear over Malmö and Burlöv (Figure 5). This diffused pattern does not appear in the choropleth map of subareas, which instead highlight expected fire exposed areas such as those in Rosengård (three darkest red subareas in Figure 5). However, caution should be taken when interpreting grid values. For example, population values just over 100 inhabitants, in combination with multiple fires, can give rise to disproportionately high fire risk values in certain grids.
Various principles for the interpretation of the data can therefore be applied and tested. For example, isolated grids with higher values often lie in more sparsely populated areas with detached houses (e.g., villas). Grids adjacent to each other often cover multi-family houses in apartment blocks with higher population density. Causes of residential fires may also differ between more and less populated areas. In villa areas in Stockholm, Gothenburg and Malmö, technical, electrical, or constructional failures such as chimney fires are overrepresented. In multi-family houses in more densely populated areas, accidental residential fires, such as cooking fires, appear to be more prevalent [32]. As stated above, intentional fires have been the dominant cause in some poorer areas in Malmö [9].
3.4. Discussion
Swedish emergency services still have relatively limited resources and time for proactive fire prevention. As a result of this, there is an extensive need for strategic working methods and knowledge to take advantage of spatial analyses. In addition, decision-making based on analyses of their own collected data has the potential to increase the validity of strategic decisions. The application fields are multidimensional. To broaden the scope, residential fire data can be analyzed in relation to contemporary socio-economic data provided from other parts of the society, e.g., the municipalities.
The spatial analyses and supporting maps can help find and predict risk areas for residential fires or be used directly to formulate hypotheses on fire patterns. Relatively simple mapping techniques, such as point mapping, can be utilized directly to evaluate incident reports and increase the quality of geocoded fire incidents. They can also serve as an input to risk analysis procedures that enhance the performance of the emergency services [7].
Different templates and examples of techniques need to be implemented in existing incident reporting systems in the emergency service organization. The discussions with the emergency services also indicate that there is a general need for a basic understanding of how spatial information in maps and charts can be perceived in different ways. The knowledge of interpreting map visualizations varies within and between each emergency service. If a visualization becomes too rich in details and complex, it can be too difficult for people to transform what they see into meaningful interpretations and hypotheses [38]. This was evident from the workshops with the different emergency services associations. This can also be linked to uncertainty when visualizing different map types [39,40]. Different methods for incorporating and mapping uncertainty may increase the possibility of more accurate interpretations and analyzes of the information in different map visualizations [41]. Some research also indicates the need to include methods for uncertainty assessments in visualizations of spatiotemporal datasets [42]. Although uncertainty is an extensive field in risk research, there are still few applications related to map visualizations of fires, e.g., visualization of wildfire hazard [43,44]. The presented process highlights how different map visualizations can support emergency services fire prevention work in various and complementary ways. A summary of the strengths and weaknesses of the visualization methods is presented in Table 3. The table also describes possible application fields for the spatial application of residential fires.
4. Conclusions
The aim of this study has been to critically examine how different geovisualization techniques—point data, kernel density and choropleth mapping—can complement each other be applied in fire preventive work. The combination of these visualization techniques facilitates various forms of fire prevention on different geographical scales, such as identification and targeting of different vulnerable groups, strategic selection of neighborhoods before home visits, fire safety supervisions for citizens, information campaigns, targeting of residential fire-prone areas to match different preventive strategies, and identifying certain types of fires in different areas. The study also shows how some of these techniques can be applied when analyzing residential fire incidents and their relation to underlying structural and socio-economic factors as well as spatio-temporal dimensions of fire incident data.
Although visual spatial analysis does not necessary demand high technical skills among emergency service employees, there is a risk of misinterpretation and incorrect strategic decisions. However, the combination of different visualizations of residential fires increases the scope for interpretation and the possibilities of targeting various forms of preventive measures to specific neighborhoods, or even residential buildings with higher risk of residential fires. There are still issues that need to be resolved, e.g., how uncertainty in map visualizations of residential fires can be highlighted and further analyzed, especially in relation to spatio-temporal variations of fires. The weaknesses presented in Table 3 can be used as a direct input to further discussions and mappings of uncertainty in spatial and temporal trends of residential fires. Other important issues include how the fire data how can be further explored, quality assured and protected, or how different convenient GIS-based methods and interpretation skills can be transformed and come to practical use in emergency services’ fire preventive work.
Funding
This work was funded by the Swedish Civil Contingencies Agency (grant number Dnr 2013-2657).
Acknowledgments
This study has been conducted within the Swedish research project Residential Fires in Metropolitan Areas: Spatial Differences and Fire Safety Work in the Socially Fragmented city, 2014–2018. Special thanks to my colleagues Mona Tykesson, Per-Olof Hallin and Jerry Nilsson for their contributions and invaluable comments during the project. Special thanks also to the Emergency Services South (Malmö), Emergency Services Stockholm, Emergency Services Södertörn (Stockholm) and Emergency Services Gothenburg for their supply of data and professional comments. Thanks to Dalena Tran for providing language help during the completion of this paper.
Conflicts of Interest
There is no conflict of interest. The funder had no role in the design of the study; in the collection, analyses, or interpretation of data; in the writing of the manuscript, or in the decision to publish the results.
References
- Kristianssen, A.-C.; Andersson, R.; Belin, M.-Å.; Nilsen, P. Swedish Vision Zero policies for safety—A comparative policy content analysis. Saf. Sci. 2006, 103, 260–269. [Google Scholar] [CrossRef]
- Guldåker, N.; Hallin, P.O.; Tykesson, M.; Nilsson, J. Fire Safety Work in the Social Fragmented City, Residential Fires in Metropolitan Areas Series; In Swedish with the Title: Brandsäkerhetsarbete i den Socialt Fragmenterade Staden. Rapport 4 i serien Bostadsbränder i storstadsområden—BIS; Malmö University: Malmö, Sweden; Lund University: Lund, Sweden, 2018; p. 4. ISBN 978-91-7895-166-6. [Google Scholar]
- Corcoran, J.; Higgs, G.; Brunsdon, C.; Ware, A.; Norman, P. The use of spatial analytical techniques to explore patterns of fire incidence: A South Wales case study. Comput. Environ. Urban Syst. 2007, 31, 623–647. [Google Scholar] [CrossRef]
- Corcoran, J.; Higgs, G.; Higginson, A. Fire incidence in metropolitan areas: A comparative study of Brisbane (Australia) and Cardiff (United Kingdom). Appl. Geogr. 2011, 31, 65–75. [Google Scholar] [CrossRef]
- Kc, K.; Corcoran, J. Modelling residential fire incident response times: A spatial analytic approach. Appl. Geogr. 2017, 84, 64–74. [Google Scholar] [CrossRef]
- Asgary, A.; Ghaffari, A.; Levy, J. Spatial and temporal analyses of structural fire incidents and their causes: A case of Toronto, Canada. Fire Saf. J. 2010, 45, 44–57. [Google Scholar] [CrossRef]
- Špatenková, O.; Virrantaus, K. Discovering spatio-temporal relationships in the distribution of building fires. Fire Saf. J. 2013, 62, 49–63. [Google Scholar] [CrossRef]
- Chainey, S. Using the vulnerable localities index to identify priority areas for targeting fire safety services. Fire Saf. J. 2013, 62, 30–36. [Google Scholar] [CrossRef]
- Guldåker, N.; Hallin, P.-O. Spatio-temporal patterns of intentional fires, social stress and socio-economic determinants: A case study of Malmö, Sweden. Fire Saf. J. 2014, 70, 71–80. [Google Scholar] [CrossRef] [Green Version]
- MacEachren, A.M.; Kraak, M.J. Research Challenges in Geovisualization. Cartogr. Geogr. Inf. Sci. 2001, 28, 3–12. [Google Scholar] [CrossRef]
- Krisp, J.M.; Virrantaus, K.; Jolma, A. Using explorative spatial analysis methods in a GIS to improve fire and rescue services. In Geo-information for Disaster Management; Oosterom, P., Zlatanova, S., Fendel, E.M., Eds.; Springer: Berlin, Germany, 2005; pp. 1282–1296. ISBN 978-3-540-27468-1. [Google Scholar]
- Wuschke, K.; Clare, J.; Garis, L. Temporal and geographic clustering of residential structure fires: A theoretical platform for targeted fire prevention. Fire Saf. J. 2013, 62, 3–12. [Google Scholar] [CrossRef]
- Higgins, E.; Taylor, M.; Jones, M.; Lisboa, P. Understanding community fire risk—A spatial model for targeting fire prevention activities. Fire Saf. J. 2013, 62, 20–29. [Google Scholar] [CrossRef]
- Ferreira, T.M.; Vicente, R.; Da Silva, J.A.R.M.; Varum, H.; Costa, A.; Maio, R. Urban fire risk: Evaluation and emergency planning. J. Cult. Heritage 2016, 20, 739–745. [Google Scholar] [CrossRef] [Green Version]
- Zhang, X.; Yao, J.; Sila-Nowicka, K.; Jin, Y. Urban Fire Dynamics and Its Association with Urban Growth: Evidence from Nanjing, China. ISPRS Int. J. Geo-Inf. 2020, 9, 218. [Google Scholar] [CrossRef] [Green Version]
- Martín-Gómez, C.; Vergara-Falces, J.; Elvira-Zalduegui, A. Geographic information system software application developed by a regional emergency agency. Case Stud. Fire Saf. 2015, 4, 19–27. [Google Scholar] [CrossRef] [Green Version]
- IKAROS Daedalos. Available online: www.daedalos.org (accessed on 27 April 2020).
- IDA MSB. Available online: https://ida.msb.se (accessed on 27 April 2020).
- Regulation (EU) 2016/679 of the European Parliament and of the Council. Available online: https://eur-lex.europa.eu/legal-content/ENG/TXT/PDF/?uri=CELEX:32016R0679&rid=1 (accessed on 27 April 2020).
- Ataei, M.; Degbelo, A.; Kray, C.; Santos, V. Complying with Privacy Legislation: From Legal Text to Implementation of Privacy-Aware Location-Based Services. ISPRS Int. J. Geo-Inf. 2018, 7, 442. [Google Scholar] [CrossRef] [Green Version]
- Keßler, C.; McKenzie, G. A geoprivacy manifesto. Trans. GIS 2017, 22, 3–19. [Google Scholar] [CrossRef] [Green Version]
- Civil Protection Act 2003:778. Available online: https://www.riksdagen.se/sv/dokument-lagar/dokument/svensk-forfattningssamling/lag-2003778-om-skydd-mot-olyckor_sfs-2003-778 (accessed on 27 April 2020).
- Hallin, P.-O.; Guldåker, N.; Tykesson, M.; Nilsson, J. Residential fires in metropolitan areas—Theoretical perspectives. In Residential Fires in Metropolitan Areas Series; In Swedish with the title: Bostadsbränder i Storstadsområden—Teoretiska Utgångspunkter. Rapport 2 i serien Bostadsbränder i storstadsområden—BIS; Malmö University: Malmö, Sweden; Lund University: Lund, Sweden, 2018; p. 2. ISBN 978-91-7895-165-9. [Google Scholar]
- Facts about Malmö. Available online: https://malmo.se/Fakta-och-statistik.html (accessed on 27 April 2020).
- Population Statistics on the Municipality of Burlöv. Available online: https://burlov.se/kommunpolitik/omburlov/%20befolkningochstatistik.4.4a8b2c6a159cac1506d4a161.html (accessed on 27 April 2020).
- GIS-Centre—Geodata Available for Lund University. Available online: https://www.gis.lu.se/geographical-data/geografical-data-for-university-students-and-staff (accessed on 27 April 2020).
- M-Database—A Research Database at Malmö University and Lund University. Available online: https://www.keg.lu.se/en/research/research-projects/current-research-projects/m-database-a-research-database-at-malmo (accessed on 27 April 2020).
- Jennings, C.R. Social and economic characteristics as determinants of residential fire risk in urban neighborhoods: A review of the literature. Fire Saf. J. 2013, 62, 13–19. [Google Scholar] [CrossRef]
- Putnam, C.T.; Kirkpatrick, J.T. Juvenile Firesetting: A Research Overview. Juvenile Justice Bulletin. 2005. Available online: https://www.ncjrs.gov/pdffiles1/ojjdp/207606.pdf (accessed on 27 April 2020).
- Kobes, M.; Helsloot, I.; De Vries, B.; Post, J.G. Building safety and human behaviour in fire: A literature review. Fire Saf. J. 2010, 45, 1–11. [Google Scholar] [CrossRef]
- FEMA. Residential Building fires (2013—2015). Top. Fire Rep. Ser. 2017, 18, 1–15. [Google Scholar]
- Guldåker, N.; Hallin, P.O.; Tykesson, M.; Nilsson, J. Fire safety work in the social fragmented city. In Residential Fires in Metropolitan Areas Series; In Swedish with the tile: Brandsäkerhetsarbete i den socialt fragmenterade staden. Rapport 5 i serien Bostadsbränder i storstadsområden—BIS; Malmö University: Malmö, Sweden; Lund University: Lund, Sweden, 2018; p. 4. ISBN 978-91-7895-168-0. [Google Scholar]
- Mitchell, A. The ESRI Guide to GIS Analysis. Volume 2: Spatial Measurements; Statistics; Esri Press: Redlands, CA, USA, 2009; ISBN 9781589481169. [Google Scholar]
- Anderson, T.K. Kernel density estimation and K-means clustering to profile road accident hotspots. Accid. Anal. Prev. 2009, 41, 359–364. [Google Scholar] [CrossRef]
- Xie, Z.; Yan, J. Kernel Density Estimation of traffic accidents in a network space. Comput. Environ. Urban Syst. 2008, 32, 396–406. [Google Scholar] [CrossRef] [Green Version]
- Nilsson, J.; Hallin, P.-O.; Tykesson, M.; Guldåker, N. Differences in fire occurrences within and between different Swedish metropolitan areas—A statistical analysis. In Residential Fires in Metropolitan Areas Series; In Swedish with the title: Skillnader i brandförekomst inom och mellan olika storstadsområden—En statistisk analys. Rapport 4 i serien Bostadsbränder i storstadsområden—BIS; Malmö University: Malmö, Sweden; Lund University: Lund, Sweden, 2018; p. 4. ISBN 978-91-7895-167-3. [Google Scholar]
- Tykesson, M.; Nilsson, J.; Guldåker, N.; Hallin, P.-O. A quality review of the reporting of residential fires in the metropolitan areas of Malmö, Gothenburg, Södertörn and Stockholm. In Residential Fires in Metropolitan Areas Series; In Swedish with the title: Kvalitetsgranskning av insatsrapportering av bostadsbränder: Storstadsområdena Malmö, Göteborg, Södertörn och Stockholm. Rapport 1 i serien Bostadsbränder i storstadsområden—BIS; Malmö University: Malmö, Sweden; Lund University: Lund, Sweden, 2016; p. 1. ISBN 978-91-7895-164-2. [Google Scholar]
- Demšar, U. Investigating visual exploration of geospatial data: An exploratory usability experiment for visual data mining. Comput. Environ. Urban Syst. 2007, 31, 551–571. [Google Scholar] [CrossRef]
- MacEachren, A.M. Visualizing Uncertain Information. Cartogr. Perspect. 1992, 13, 10–19. [Google Scholar] [CrossRef] [Green Version]
- MacEachren, A.M.; Robinson, A.; Hopper, S.; Gardner, S.; Murray, R.; Gahegan, M.; Hetzler, E. Visualizing Geospatial Information Uncertainty: What We Know and What We Need to Know. Cartogr. Geogr. Inf. Sci. 2005, 32, 139–160. [Google Scholar] [CrossRef] [Green Version]
- Lucchesi, L.R.; Wikle, C.K. Visualizing uncertainty in areal data with bivariate choropleth maps, map pixelation and glyph rotation. Stat 2017, 6, 292–302. [Google Scholar] [CrossRef]
- Alberti, K. Web-based Visualization of Uncertain Spatio-Temporal Data. Master’s Thesis, Utrecht University, Utrecht, The Netherlands, 2013. Available online: http://karssenberg.geo.uu.nl/_static/Alberti_K_Thesis_Webbased_Uncertainty_Visualization.pdf (accessed on 22 May 2020).
- Cheong, L.; Bleisch, S.; Kealy, A.; Tolhurst, K.; Wilkening, T.; Duckham, M. Evaluating the impact of visualization of wildfire hazard upon decision-making under uncertainty. Int. J. Geogr. Inf. Sci. 2016, 30, 1377–1404. [Google Scholar] [CrossRef] [Green Version]
- Amatulli, G.; Pérez-Cabello, F.; De La Riva, J. Mapping lightning/human-caused wildfires occurrence under ignition point location uncertainty. Ecol. Model. 2007, 200, 321–333. [Google Scholar] [CrossRef]
Figure 1.
Residential fires per 1000 inhabitants in Sweden and the three largest metropolitan areas 2007–2017.
Figure 1.
Residential fires per 1000 inhabitants in Sweden and the three largest metropolitan areas 2007–2017.

Figure 2.
Emergency Services South consists of five municipalities in south Sweden, in addition to the exemplified municipalities in this study Malmö and Burlöv (in red), also Eslöv, Lund and Kävlinge.
Figure 2.
Emergency Services South consists of five municipalities in south Sweden, in addition to the exemplified municipalities in this study Malmö and Burlöv (in red), also Eslöv, Lund and Kävlinge.

Figure 3.
The process for developing different GIS-based visualization techniques and their applications in fire prevention.
Figure 3.
The process for developing different GIS-based visualization techniques and their applications in fire prevention.

Figure 4.
Point map (left) and heat map (right) of the municipalities of Malmö and Burlöv, Sweden. The residential fire data period is 2007–2015.
Figure 4.
Point map (left) and heat map (right) of the municipalities of Malmö and Burlöv, Sweden. The residential fire data period is 2007–2015.

Figure 5.
Choropleth maps as subareas (left) and grids (right) of the municipalities of Malmö and Burlöv, Sweden. The residential fire data period was 2007–2015.
Figure 5.
Choropleth maps as subareas (left) and grids (right) of the municipalities of Malmö and Burlöv, Sweden. The residential fire data period was 2007–2015.

Figure 6.
Modeling of the spatial join of fire data to subareas and grids and normalization with population data. The model is developed with the model builder tool in ArcGIS desktop.
Figure 6.
Modeling of the spatial join of fire data to subareas and grids and normalization with population data. The model is developed with the model builder tool in ArcGIS desktop.

Figure 7.
Point map.

Figure 8.
Heat map.

Figure 9.
Choropleth map—Subarea.

Figure 10.
Choropleth map—grids.


Table 1.
Categorization of residential fires and their related causes (Data source: Emergency Services South).
Table 1.
Categorization of residential fires and their related causes (Data source: Emergency Services South).
| Category of Residential Fire | Selected (SQL) Assessed Fire Causes of Fire from the Fire Data Set |
|---|---|
| All residential fires | Fire causes = all |
| Intentional fires | Fire cause = Intentional fire setting |
| Accidental fires | Fire causes = cooking; forgotten stove left on; combustion of residual oils on the stove; stove started by mistake; cooking with oil; child, adult, or animal turned the knobs on the stove; wrong burner on the stove turned on; boiling dry pot; unattended cooking; fire in oil in a saucepan on the stove; bedside lamp; water boiler on the stove; forgotten fryer; plastic bowl on a stove burner; towel in the oven; things lying on the stove; microwave oven; toaster on burner; forgotten microwave; overheated food; leftovers in the oven; cardboard on the stove burner; cake in the oven; basket with cakes on the stove; forgotten pressure cooker; confused lady who started the stove; paper in the cook box; objects in the oven; plastic bag on burner; forgotten toaster; forgotten or knocked-over candles; smoking; something thrown into the trash that ignited; burning matchstick; unextinguished cigarettes or cigarette butts; children start the iron; floor lamp fallen on the couch; warm lamp; forgotten smoke stick in toilet bowl; bed smoking; barbecue; threw burning garbage without intent; vacuuming ash; overfilled/leakage of lamp oil; plastic flower on the sauna unit; incense; insect extermination with gasoline; burning of weeds; overloaded dryer; carelessness; confused lady who burns paper; sparklers; outdoor torch; textile/clothing on heat source; forgotten disposable grill; towel on top of spotlights; drunk person; ashtray; mistake; carelessness with fire; fire in fireplace. |
| Fires related to technical failures or work processes | Fire causes = technical error, explosion, leaking chimney, self-ignition, chimney fire, hot work processes, heat transfer, lightning strikes, re-ignition, electrical box, steam, sparks from electricity, electric fault, short circuit, heating system in the basement, heat generation in power cord, electrical coil. |
Table 2.
Given the z-score, there is a less than 1 % probability that clustered patterns of different types residential fires could be the effect of random chance. The area was fixed at 159 km2 and the distance method is Euclidean.
Table 2.
Given the z-score, there is a less than 1 % probability that clustered patterns of different types residential fires could be the effect of random chance. The area was fixed at 159 km2 and the distance method is Euclidean.
| Residential Fires | Observed Mean (Meters) | Estimated Mean (Meters) | Z-Score | Index—Average Nearest Neighbor Ratio | P-Value |
|---|---|---|---|---|---|
| All | 38.1 | 134.6 | −68.2 | 0.28 | 0.00 |
| Intentional | 48.7 | 229 | −41.5 | 0.21 | 0.00 |
| Accidental | 87.6 | 228.2 | −32.6 | 0.38 | 0.00 |
| Technical failures | 166.8 | 378.3 | −17.8 | 0.44 | 0.00 |
Table 3.
Strengths and weaknesses of the visualization methods, and possible fields for spatial application of residential fires.
Table 3.
Strengths and weaknesses of the visualization methods, and possible fields for spatial application of residential fires.
| Visualization Techniques/Methods | Strenghts | Weaknesses | Application Fields—Example of Residential Fires |
|---|---|---|---|
Point map |
|
|
|
Heat map |
|
|
|
Choropleth map |
|
|
|
Grid map |
|
|
|
© 2020 by the author. Licensee MDPI, Basel, Switzerland. This article is an open access article distributed under the terms and conditions of the Creative Commons Attribution (CC BY) license (http://creativecommons.org/licenses/by/4.0/).
Share and Cite
MDPI and ACS Style
Guldåker, N. Geovisualization and Geographical Analysis for Fire Prevention. ISPRS Int. J. Geo-Inf. 2020, 9, 355. https://doi.org/10.3390/ijgi9060355
AMA Style
Guldåker N. Geovisualization and Geographical Analysis for Fire Prevention. ISPRS International Journal of Geo-Information. 2020; 9(6):355. https://doi.org/10.3390/ijgi9060355
Chicago/Turabian StyleGuldåker, Nicklas. 2020. "Geovisualization and Geographical Analysis for Fire Prevention" ISPRS International Journal of Geo-Information 9, no. 6: 355. https://doi.org/10.3390/ijgi9060355
Note that from the first issue of 2016, this journal uses article numbers instead of page numbers. See further details here.