The Effect of Temperature on the Biosorption of Dyes from Aqueous Solutions


Department of Chemistry, Faculty of Environmental Management and Agriculture, University of Warmia and Mazury in Olsztyn, Plac Lodzki 4, 10-727 Olsztyn, Poland
*
Authors to whom correspondence should be addressed.
Processes 2020, 8(6), 636; https://doi.org/10.3390/pr8060636
Submission received: 3 April 2020
/
Revised: 12 May 2020
/
Accepted: 18 May 2020
/
Published: 26 May 2020
(This article belongs to the Special Issue Control and Optimization of Wastewater Treatment Technology)
Abstract
:This work is a review of scientific papers on the influence of temperature (T) on the biosorption of various dyes from aqueous solutions and wastewaters. The dyeing process of textiles is usually carried out at high temperatures, and therefore, the wastewater generated there when entering the treatment plant may still be hot. Hence, depending on the climatic conditions of a given region, the biosorption method used for their purification may occur at various temperatures. Most of the papers clearly stated the positive influence of T on biosorption, generally indicating the chemical nature of this process. At the same time, substantial number of authors confirmed the positive effect of T on the biosorption with an initial T-rise from approximately 20 °C to about 30–40 °C range; conversely, at higher temperatures, they indicated a decrease in the biosorption efficiency. Additionally, many authors clearly implied the negative impact of T on the biosorption parameters. They generally envisaged the physical nature of this process, but also indicated its limitation, as there was only a 15%–50% reduction in biosorption efficiency with an increase in T. In addition, an attempt was made to analyse the effect of temperature on the biosorption process, depending on the type of dye. It could then be cautiously suggested that a moderate increase in the T parameter favourably affected the biosorption of the red and reactive dyes.
1. Introduction
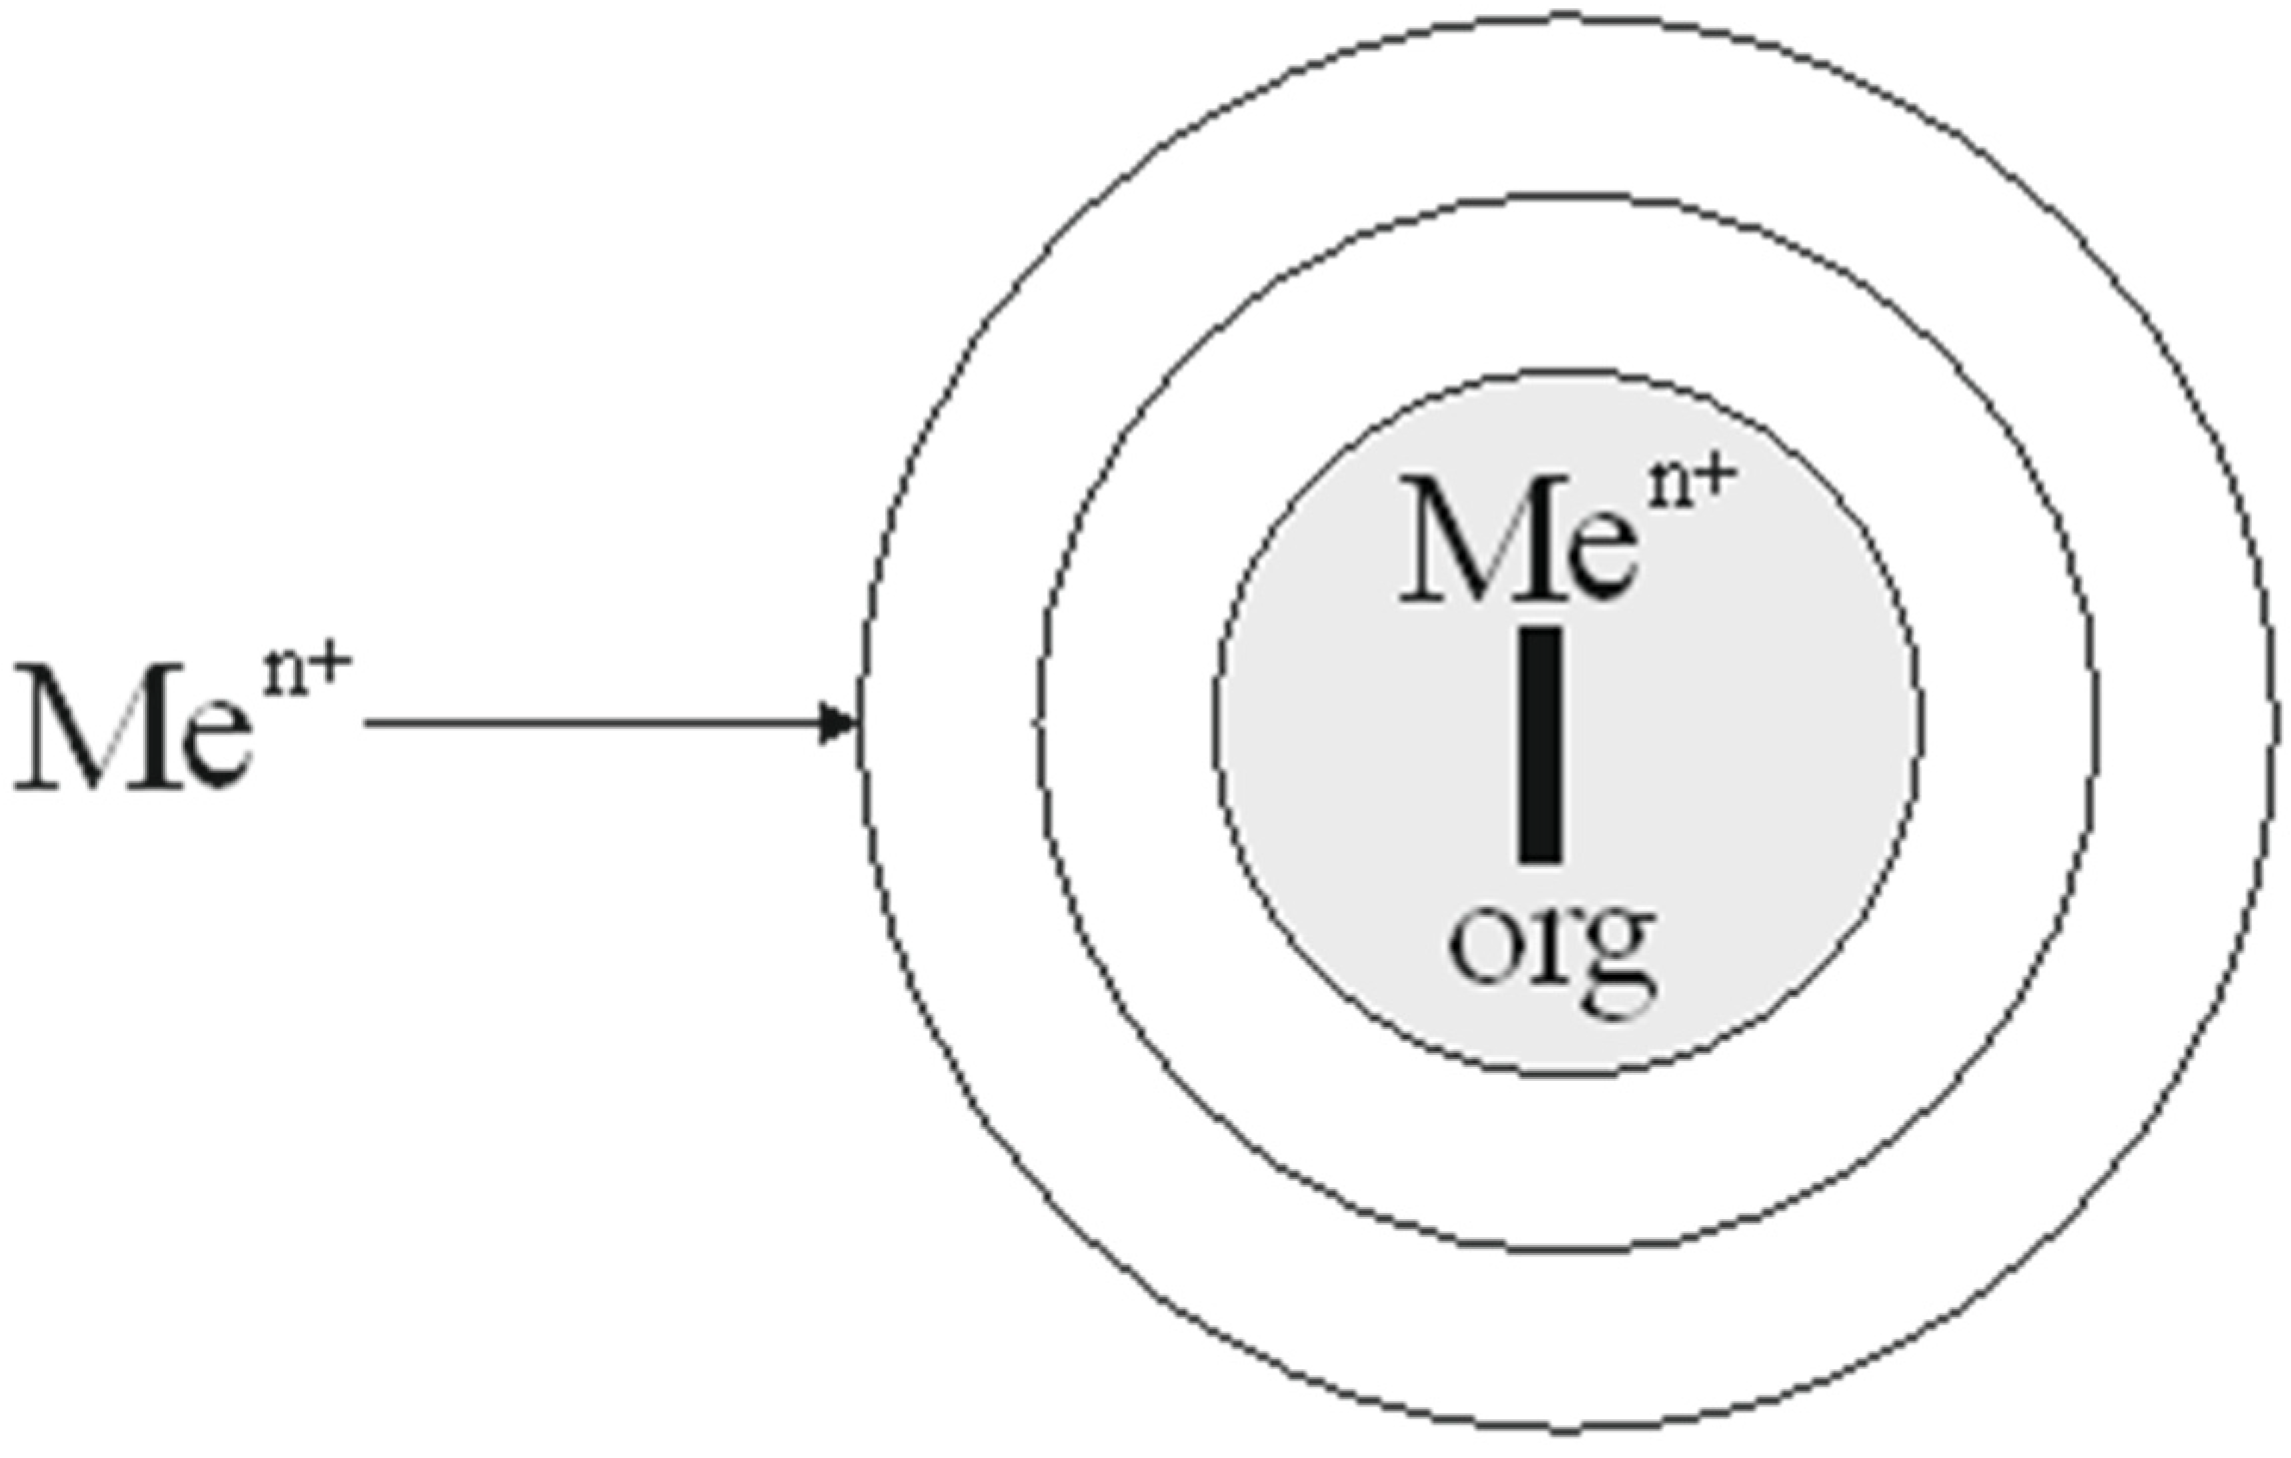
Figure 1 (consistent with the description of Chojnacka [1]), shows the use of the biosorption process to eliminate (and also possibly to recover) heavy metal ions from wastewater. At the same time, it illustrates its subsequent stages, i.e., migration and diffusion of an exemplary heavy metal ion to the surface of the biosorbent, then its absorption (a kind of “bioabsorption”) and binding at the centre of a specific unit, used in the biomass forming process. In this way, the “heavy metal” under consideration is blocked in the biomass used, which could later be regenerated. Biosorption in water purification can be defined as a total sorption process that includes both adsorption and absorption of contaminants on a living or dead biosorbent. For a living biosorbent, this phenomenon is accompanied by bioaccumulation and the metabolism of some pollutants in the living organism of the biosorbent [1].
It turns out that as much as 2% of the dyes produced are discharged directly into wastewater. These dyes appear in the outflow from the treatment plants because the effectiveness of their immobilization is often unsatisfactory [2]. In the treatment of dye-based wastewaters, adsorption methods are often employed. The efficiency of these methods is usually determined using parameters assessed from the well-known Langmuir and Freundlich isotherms.
Immobilization of dyes occurs for the biosorption defined both in the area of surface phenomena [3] and bioaccumulation [4], not excluding their metabolism in the “living” biosorbent. In practice, biosorption often uses a variety of materials—biosorbents, such as fungi, yeast, moulds, aerobic and anaerobic bacteria, algae, leaves, shells, nuts, almonds or rice, wood, sawdust, various plants, agricultural waste or seafood and many others.
Temperature Effect on Dyes Sorption/Biosorption—Basic Considerations
Any climate is a result of the average temperature of all seasons. Therefore, determining the effect of temperature on the biosorption of dyes is very important, particularly because the dyeing process is typically carried out at high temperatures, which leads to the formation of hot textile sewage.
It is known that the temperature (T) effect on sorption depends on the nature and the process’ mechanism. In general, if the sorption is chemical, then the influence of T is positive; however, if the sorption involves a physical process, then, the influence of T is mostly negative. Therefore, the conclusion about the influence of T on the biosorption used in the treatment plants seems to be questionable, and hence, there was a genesis to develop the presented-here review.
The influence of temperature on the rate of chemical reaction in the simplest way is determined by the empirical rule of van’t Hoff’s. According to this rule, an increase in T by 10 K causes a 2–4 fold increase in the reaction rate. Thus, an increase in T from 20 to 100 °C (ΔT = 80 K) could shorten the duration of the reaction, e.g., from 1 h to 1 min. In general, the reaction rate is experimentally measured at several temperatures, after which the linear dependence of the Arrhenius equation is analysed:
where k is the rate constant, T is temperature in [K], Ea is activation energy, and A and R are other constants.
This equation determines the activation energy Ea-value, characterizing the course of a given reaction. For chemical statics and technology, the influence of temperature on the reaction equilibrium constant is often essential. For this purpose, the heat of reaction Q should be determined at several temperatures and the equilibrium constant, K, would be assessed (the van’t Hoff isobar) from the relationship:
where K is the equilibrium constant, T is temperature in [K], ΔQ is the heat of reaction at P = const, and B and R are other constants.
It should be stated that biosorption is sorption on the so-called “biosorbent”; hence, two processes—physical, with a lower value of Qph (heat of physical adsorption), and the chemical, with a higher value of Qch (heat of chemisorption) could be expected.
2. Temperature Effect on Dyes Biosorption from Aqueous Solutions and/or Wastewater—Review and Discussion of Literature Data
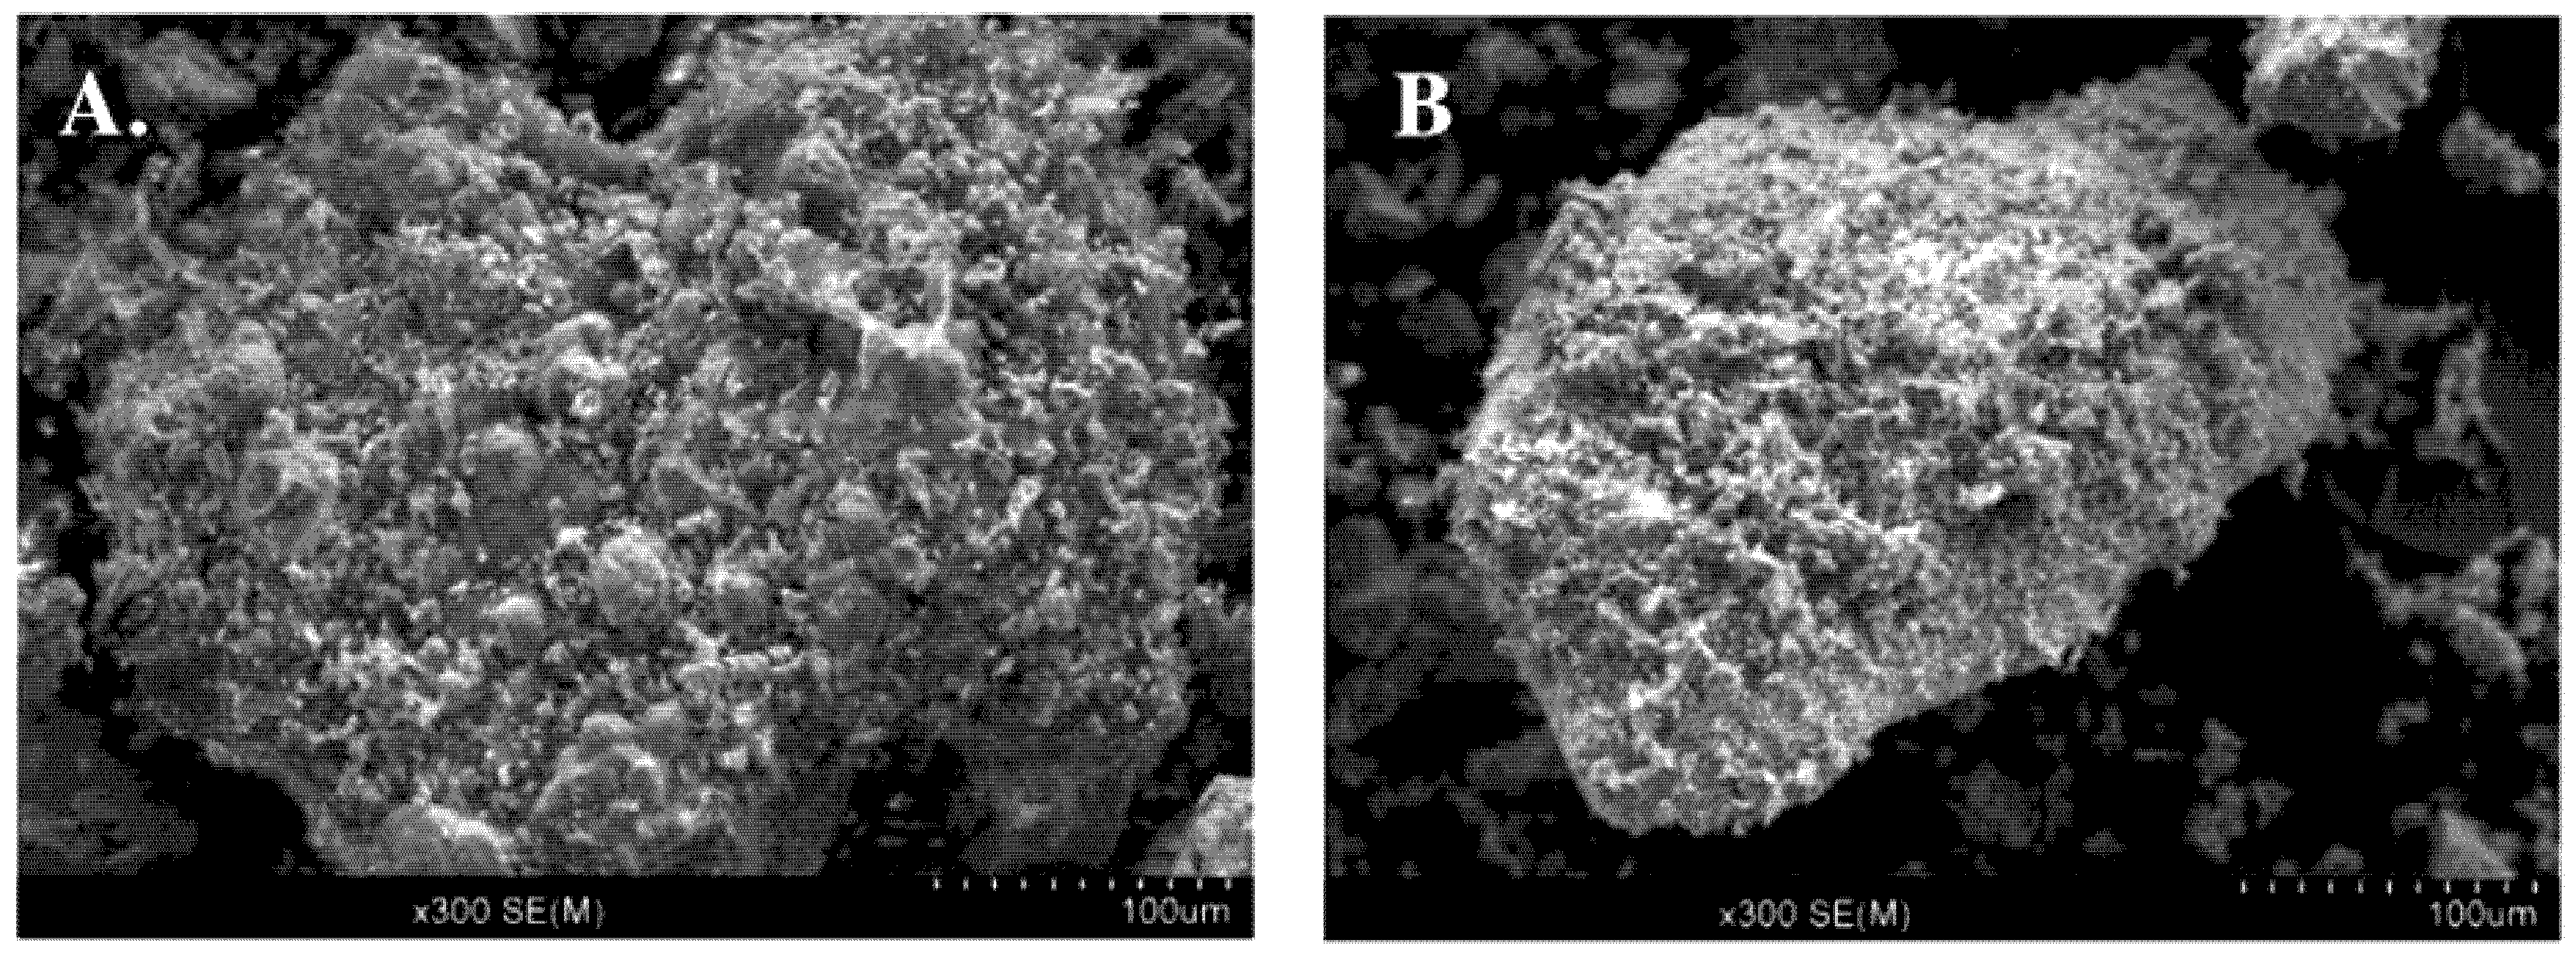
Many papers have been published, where among others, the issues of the broadly understood energy of dye biosorption processes from model wastewater (i.e., appropriate aqueous solutions), as well as from real wastewater (e.g., textile) are considered and discussed in detail. Virtually every such publication contains a scanning electron microscopy (SEM) micrograph (along with its detailed description) of the surface used in biosorbent testing. Thus, in the publication by Monteiro et al. [5], the surface structure of two efficient biosorbents is presented (Figure 2).
According to Monteiro et al. [5], the SEM picture revealed that the morphology of both biosorbents (A and B) is identical (Figure 2), presenting protuberances and microstructures in their surfaces. The main inorganic component in both materials is calcium carbonate (CaCO3), but their crystalline structures are different. The mineral identified in the clamshell was aragonite—an orthorhombic crystal system. On the other hand, for the crab exoskeleton, it was calcite—a rhombohedral crystal system of the calcium carbonate compound. Other elements, including aluminium, silicon, potassium and sodium, were also detected in both materials. Additionally, in the calcium carbonate (CC) powder, magnesium and phosphorous were also identified, thus indicating the existence of magnesium carbonate (MgCO3) and phosphates (PO43−) in its composition. Carbon, oxygen and sulphur were also detected in the EDS spectrum, since they are the main constituents of chitin and proteins—the main components of the organic matrix of both materials.
A general question may arise as to whether the biosorption processes are efficient enough in regions of the world that are characterized by both warm, as well as cold climates. In order to answer the above question, a thorough review and analysis of a database on the influence of temperature on the biosorption processes of dyes from aqueous solutions have been made.
Table 1 presents data and parameters describing the influence of temperature (T) on biosorption (Bio) of dyes from aqueous solutions on fungal biomass (its Latin name is given in column 1). In most cases, the biomass was dried and prepared in the laboratory by means of a dead biosorbent. In the next column, the type of dye was specified. The range of T used is further indicated; red colour for the positive effect of T (Pos) on biosorption and in blue for the negative (Neg). Column 4 contains selected quantitative data characterizing the effect of T on biosorption (in red or blue), and finally, reference papers are provided in column 5.
A number of different parameters were tested by the authors of the cited publications, including: the effect of pH, temperature (T), biosorbent dose, dye concentration and time of biosorbent contact with the dye-based solution on the effectiveness of the biosorption process. Kumar et al. [6] used the following concentrations of dye solutions: 50, 100, 150 and 200 mg/L. The most effective biosorption was obtained at the lowest dye concentration, which was 112–204 mg of dye per 1 g of biomass, at pH = 6. The results of their biosorption studies matched both adsorption isotherms, that is the Langmuir and Freundlich models. A fresh mass of algae in an aqueous solution was pre-irradiated (γ) or subjected to thermal treatment, according to Khalat et al. [7]. The thermal treatment of algae led to obtaining a more effective biosorbent with a biomass content of 8 g/L, compared to their irradiation. Biosorbent worked effectively three times, each time after 18 h of contact with the dye solution being at pH = 3. Iscen et al. [8] determined the optimal biomass concentration as 0.4 g/L at pH = 1. They determined the kinetic parameters of biosorption at the optimal biosorbent–adsorbate contact time of 75 min. Their research showed that the process under review was a pseudo second order (PSO) reaction (Ho [18]). Furthermore, Aksu et al. [9] passed a dye solution at a concentration of 812.6 mg/L through the column, at a pH of 2 and a speed of 0.8 m/min. They attempted to fit the experimental database to the Redlich–Peterson, Freundlich and Langmuir adsorption models, where the latter one proved to be the most advantageous. They also stated that the studied biosorption process was the PSO reaction. In addition, Kiran et al. [10] found that at pH = 1 and after 40 min of the continuing process, an equilibrium of biosorbent (0.4 g/L) and adsorbate was obtained. Again, they referred to the process as being the PSO reaction. They obtained positive results of testing all three adsorption models, namely: Langmuir, Freundlich and Dubinin–Radushkevich, which also allowed determination of free energy, enthalpy and entropy of the studied biosorption process. Then, Farah et al. [11] found a beneficial effect of pH increase on the studied biosorption process. The determined biosorption of 70 mg/g dry biosorbent mass was significantly higher than the adsorption of 18.5 mg of this adsorbate per 1 g of activated carbon. Among the tested models—Freundlich, Temkin and Langmuir—the latter was considered best suited for the recorded database. They stated that the process was chemical and endothermic. Furthermore, Arica and Bayramoglu [12] obtained the best biosorption results at pH = 3 and 800 mg of dye/L solution. This pre-treatment of biosorbent was found to be more advantageous than purely acidic, while natural biosorbent was indeed more effective than that prepared after imposition of an alkaline treatment. Here, the Freundlich and Temkin models were better suited for the experimental database than the Langmuir model. The authors considered the studied biosorption as the PSO reaction. Aksu and Tezer [13] found the optimal dye concentration of 800 mg/L at pH = 2, and these were their optimal parameters for the biosorption test. The experimental database fit better with the Freundlich model than with the Langmuir one. They defined the examined process as chemical and the PSO. The optimal concentration of dye at 500 mg/L and a pH of 3 were considered by Aksu et al. [14] as optimal parameters of the biosorption test. Among the tested models—Redlich–Peterson, Langmuir and Freundlich—the latter one was considered best suited to the produced database. The process they defined was also the PSO chemical reaction and it was found to be endothermic. Then, Xiong et al. [15] found an increase in biosorption along with a decrease in the system’s pH at a dye concentration of 400 mg/L. Both the Freundlich and Langmuir models fit the obtained database. The authors considered the studied process to be an endothermic, PSO spontaneous reaction. Iqbal and Saeed [16] noted an increase in biosorption with an increase in the concentration of an initial solution of the dye used. An optimal pH was 2 and the Langmuir model better described the database than the Freundlich one. Again, the studied biosorption turned out to be the PSO chemical process. Bayramoglu et al. [17] obtained the best biosorption results at a pH of 3 from the solution with a concentration of 600 mg dye/L and a continuous flow of 20 mL/h. Again, the above pre-treatment of the biosorbent was found to be more advantageous than that carried out under acidic conditions, while natural biosorbent was more effective than that after imposing an alkaline treatment. The Freundlich and Langmuir models were better suited for the experimental database than the Temkin model, while the kinetics of the process were best described by the Ritchie model.
Generally, in seven cases, the authors stated a positive T effect on the biosorption, twice the negative effect and three times positive and then negative effect along with a further increase in the T parameter. The positive T effect on the biosorption was most often interpreted as a result of the increase in sorbate energy and surface energy of the biosorbent. In three cases, positive T effect was attributed to an increase in the dye diffusion rate and two times to chemisorption. The negative T effect on the biosorption was not clearly interpreted, as was the growth and decrease in biosorption with the increase in T in Khalaf’s work [7], who mentioned the phenomenon of the so-called “acclimatization” of the biosorbent. Aksu and Tezer [13] ignored an initial positive T effect on the biosorption at 35 °C, which was then perceived as the negative effect (at higher T), being a result of the lowering surface energy of the biosorbent used. In turn, Iqbal and Saeed [16] obtained an increase and then, a reduction in the biosorption with the rising T parameter, interpreted as the effect of both physical adsorption and chemisorption. On the other hand, Iscen et al. [8] and Iqbal, and Saeed [16], when analysing the data from the “Removal” column, reported only a slight positive (+approx. 10%) and further positive T effect on the biosorption. Kumari et al. [6] unambiguously indicated negative T effect on the biosorption (reaching 40%–50%), while Farah et al. [11] and Xionga et al. [15] noted ca. 30%–40% positive T effect on the biosorption. The pseudo second order reaction was recorded and proved in 8 out of 12 claimed research articles.
Table 2, constructed similarly to Table 1, presents data and parameters describing the influence of temperature on the biosorption of dyes (from aqueous solutions) on bacteria and algae (their common names and the corresponding Latin names are given in column 1). Static biosorption studies in a wide range of dye concentrations (commencing from 50 mg/L) with the biosorbent concentration of 3 g/L were described by Gao et al. [19]. An optimal pH was 2 and the database was better suited for the Temkin model than for the Langmuir or Freundlich ones. The process was spontaneous and exothermic, being in line with the PSO equation. Such chemical groups as -NH2, -OH and -COOH were responsible for dye binding in the biosorbent. Furthermore, Mezenner and Aicha [20] used a dye solution with an initial concentration of 50 mg/L. They found a proportional increase in biosorption, with an increase in the amount of biosorbent. The experimental database matched Freundlich and Langmuir adsorption models. From a kinetic point of view, the process turned out to be the PSO reaction. Wang et al. [21] employed dye concentrations from 2 to 97 mg/L, with a biosorbent dose from 1 to 15 g/L. They examined the statics and kinetics of the process and found the most favourable matching of the database to the Langmuir and Freundlich models (as well as to the kinetic equation of the PSO reaction). The negative values of the Gibbs adsorption energy proved the exothermicity of the process studied. The authors of this work estimated the value of biosorption activation energy at 6.59 kJ/mol. Colak et al. [22] indicated the optimal pH of 1 for the biosorption test. They considered the process of the PSO spontaneous reaction. Of all tested adsorption models (Temkin, Freundlich and Langmuir), the latter best matched the obtained results. Sun et al. [23] at pH over 7 indicated that 60 min were needed to achieve equilibrium at dye concentrations of 50 and 60 mg/L; however, for 120 min, the dye concentration was about 70 to 80 mg/L. Here, biosorption was a chemical (monolayer) PSO process. Of the tested Redlich–Peterson, Freundlich and Langmuir models, the latter one best described the biosorption test. Determined ΔH > 0 and ΔG < 0 proved endothermicity and spontaneity of the biosorption test. Mona et al. [24] investigated dye biosorption at a concentration of 100–500 mg/L, at a pH range of 2 through 6. They obtained optimal results at a pH of 2 and the dye concentration of 100 mg/L. On the biosorbent surface, they identified the following functional groups as being responsible for the biosorption: -OH, -NH2, -COOH and -CH3. The process followed the kinetic equation of the PSO reaction.
Dotto et al. [25] used dye solutions with a concentration in the range of 100–1300 mg/L, with a biosorbent concentration of 250 mg/L. As the pH increased from 4 to 8, the biosorption capacity decreased. The database matched the multimolecular model of Sips. Based on the determined values of ΔH, ΔS and ΔG functions, the authors considered the studied process as spontaneous, without specifying the reaction order. Dotto et al. [26], for both biosorbed dyes, used the solution concentration within the range 40 to 550 mg/L. They also kept the system’s pH at 4. The database best suited the Sips model. Based on the determined values of ΔH, ΔS and ΔG, the authors considered the studied process to be multimolecular and spontaneous. However, as in the previous work, no reaction order was specified.
Aksu and Tezer [27] studied dye biosorption and obtained the most favourable results at their maximum concentrations, for instance at 800 mg/L and a pH of 2. The recorded database was tested by means of the Redlich–Peterson, Koble–Corrigan, Freundlich and Langmuir models, where the best fit was obtained for the Langmuir model (and in accordance with the PSO equation). Ozer et al. [28] found the optimal pH for the biosorption process to be around 2 to 3, where the biosorption results met the Langmuir isotherm equation. The database fitted the kinetic equation of the PSO reaction and the process turned out to be exothermic (and spontaneous), at the activation energy of Ea = −4.85 kJ/mol. Furthermore, Ozer et al. [29] used a biosorbent dose of 0.5 g/L at pH range of 2–3. Of the tested Freundlich, Langmuir and Redlich–Peterson models, the latter best described the biosorption test. Again, the database was matched to the kinetic equation for the PSO reaction. Obtained activation energy values were 31.5 and 19.87 kJ/mol. Based on the determined values of ΔH, ΔS and ΔG, the process was considered exothermic. Ozer et al. [30] found pH = 3 and algae concentration of 0.5 g/L as optimal conditions for the biosorption process described in their work. The amounts of dye removed increased linearly with the increase in its initial concentration and fulfilled the equation of the linearized Langmuir isotherm. The database was matched to the kinetic equation of the PSO reaction and the process turned out to be exothermic. There was no suggestion there about the spontaneity of the examined biosorption process. The authors stated that the algae used completely discoloured the wastewater containing 25 mg of dye in 1 L.
On the other hand, Daneshvar et al. [31] used solutions of all dyes with concentrations of 10–50 mg/L. There, rising pH from 2 to 10, caused a reduction in the biosorption. The experimental database best fitted the Freundlich isotherm equation and the PSO reaction kinetic equation. Based on the determined values of ΔH, ΔS and ΔG parameters, the authors considered the studied biosorption process to be spontaneous. They suggested that the functional groups of -OH and -NH2 are responsible for the biosorption bonds. Dye solutions with concentration range: 5–45 mg/L at biosorbent doses of 0.5–2.5 mg/L were used in their research by Khataee et al. [32]. Acid Orange was most effectively biosorbed at pH = 4, whereas the other two dyes at pH = 10. Again, the experimental database best fitted the Freundlich isotherm equation and the PSO reaction kinetic equation. Based on the determined values of ΔH, ΔS and ΔG, the authors considered the studied biosorption process to be spontaneous.
In contrast to the results presented in Table 1, for five cases in Table 2, the authors claimed an initial positive effect, with the further increase in T producing a negative T effect on the biosorption. It can therefore be concluded that along with the increase in T (e.g., from 20 to 30 °C), the biosorption grows and remains positive on the temperature augmentation. Moreover, five negative and three positive T effects on the biosorption (sometimes interpreted as an increase in the adsorbate energy and surface energy of the adsorbent) were noticed. Additionally, in a single case, it was impossible to figure out what the effect of T on the biosorption actually was. The three negative T effects on the biosorption were interpreted as the result of “physical” adsorption of the dye on the biosorbent used. Moreover, Sun et al. [23] noticed at T = 50 °C that the recorded adsorption of Malachite Green was twice as high on granular, aerobic activated sludge, as that recorded at T = 30 °C. In addition, Ozer et al. [29] found that an increase in T from 20 to 25 °C approximately twice increased the biosorption, where a further increase in temperature to 30, 40 and 50 °C finally caused reduction in the biosorption to reach values only 10% higher than those produced at 20 °C. The described negative T effects caused the biosorption to be reduced by only 15%–30%. The pseudo second order reaction was observed and proven in 12 out of 14 examined papers.
Table 3 summarizes the data and parameters describing the influence of T on the biosorption of dyes on other types of biosorbents. Chowdhury et al. [33] obtained a maximum biosorption after 150 min contact of 5 g/L biosorbent with a dye-based solution. This was with a minimum concentration of 50 mg/L, at a pH of 9. By means of the BET method, they determined the surface parameters of the biosorbent used. Of the Freundlich, Dubinin–Radushkevich and Langmuir models, the latter best matched the database. The authors determined the activation energy Ea = 45.79 kJ/mol of the examined biosorption process and defined that this process was spontaneous and exothermic, also meeting the PSO equation. Han et al. [34] found that a change in pH in the range of 4.5 to 10 did not affect the efficiency of the biosorption studied. In fact, it did rise with increasing amount of the biosorbent, but then kept reducing upon increasing amounts of salt in the system. The Langmuir model best described the studied process and the determined values of ΔG, ΔH and ΔS thermodynamic functions indicated the spontaneity and endothermicity of this biosorption process. Furthermore, Ho et al. [35] stated that the biosorption increased upon biosorbent dispersion growth. The database did fit the Langmuir model, whereas the calculated values of the ΔG, ΔH and ΔS functions indicated that the studied process was spontaneous and endothermic. The specific surface area of the biosorbent particles was 38–45 m2/g. This work lacks derivation of the kinetic parameters for the examined biosorption process. For another work by Ponnusami et al. [36], both kinetic and thermodynamic data are missing. The authors used dye solutions with concentrations from 50 to 250 mg/L and a biosorbent dose from 5 to 50 g/L. They found that increasing the pH from 2 to 7 significantly reduced the efficiency of the biosorption test. Aksakal and Ucun [37] used dye solutions with concentrations of 50–200 mg/L and a biosorbent dose of 5 to 40 g/L, at a pH of 1 to 6. In fact, a higher concentration (dose of biosorbent), contact time of 180 min and acidic pH of 1 were the most favourable conditions for the biosorption test. The database was fitted to the PSO kinetic equation and the Elovich equation describing chemisorption on a heterogeneous surface. To describe the equilibrium of biosorption, the authors used the Langmuir and Freundlich isotherm equations and the latter model best suited the database. They also calculated the activation energy of 8.904 kJ/mol and the values of the ΔG, ΔH and ΔS functions, prompting them to conclude that the biosorption test was endothermic. Akar et al. [38] used dye solutions with a concentration range of 100–300 mg/L. Optimal discolouration of the solution was observed after 20 min of stirring for a biosorbent dose of 1.6 g/L, at pH = 2.0. The database matched both Freundlich and Langmuir models. Thermodynamic functions were determined, and the reaction was found to occur spontaneously and exothermically in accordance with the PSO equation. According to Akkaya and Ozer [39], optimum biosorption occurred for dye solution at the concentration of 700 mg/L, biosorbent dose of 0.5 g/L and pH = 3. They tested the Freundlich, Temkin, Redlich–Peterson and Langmuir adsorption models, where the latter one was best fitted to the database. The results of the kinetics of the process matched the Weber–Morris model and the PSO reaction. The calculated ΔH and ΔS values indicated that the studied biosorption was a reversible and exothermic process. As expected, Barka et al. [40] implied that the biosorption increased with increasing dose and decreasing biosorbent particle size along with higher dye concentrations. The maximum biosorption was recorded at pH = 6.8 for one dye and at pH = 3 for another one. The experimental database was fitted to the Langmuir, Freundlich, Toth and Tempkin isotherms in order to give a maximum R2 of 0.99 for both the Toth and Langmuir models. The results matched the PSO reaction and the studied biosorption was exothermic. Akar et al. [41], after 40 min of continuing the process, obtained a maximum biosorption capacity at pH = 2 and the concentration of the biosorbent at 3 g/L. Based on the course and adaptation of the database to the Langmuir, Freundlich and Dubinin–Radushkevich isotherms, the authors suggested mono-molecularity and homogeneity of the adsorption layer studied. Negative ΔG and positive ΔH values implied that the biosorption test was a chemical, spontaneous and endothermic process satisfying the kinetic equation of the PSO reaction. According to Brito et al. [42], a specific surface area of 7 m2/g proved to be sufficient for electrostatic attraction and adsorption of particles of the added dyes. Their biosorption resulted both from the polarization of dye molecules at the applied pH of 6.57, as well as the process of their diffusion into the lignocellulosic surface of the biosorbent. The authors suggested a physical (ΔH < 0), spontaneous (ΔS < 0) and exothermic character of the biosorption process. Nevertheless, the database matched the Langmuir model and the PSO reaction equation. Akar et al. [43] achieved the balance of the biosorption process after 50 min. The database was analysed by means of the Langmuir, Freundlich, Dubinin and Radushkevich isotherm models and the results from this analysis showed that the biosorption process occurred on the homogenous surface of the biosorbent. Based on the calculated changes in the ΔG, ΔH and ΔS functions, the authors stated the exothermicity and spontaneity of the examined biosorption process. In turn, the calculated values of the reaction rate constants indicated the PSO kinetic model. Ofomaja and Ho [44] also fitted their experimental data at pH > 7 to the Langmuir, Freundlich and Redlich–Peterson models (lowest fit). The calculated values of the ΔG, ΔH and ΔS indicated spontaneity and endothermicity of the examined process. However, the paper did not present the kinetic parameters of the biosorption test. Desorption–regeneration of the biosorbent used could be carried out by means of HCl solution, which, according to the authors, indicated in this case that ion exchange was the process responsible for the biosorption. Kumar and Ahmad [45] considered intramolecular diffusion as the basic mechanism of the studied biosorption. The adaptation of the database to the Langmuir model (more favourable than Freundlich) indicated according to the authors, the formation of a monomolecular layer of the adsorbate on the biosorbent surface. A positive ΔH value indicated the endothermic and spontaneous nature of the studied process, which turned out to be the PSO reaction. The authors attempted to regenerate the treated ginger waste using acetic acid as the eluent. The biosorption process generally increased with increasing pH, where amine functional groups of the dye were mainly responsible for the chemi-biosorption mechanism. Doğan et al. [46] determined the contact time needed to establish the biosorbent–adsorbate equilibrium as 24 h at pH range 3–9, ionic strength up to 0.1 mol/L and biosorbent particle size up to 200 μm. The Langmuir model best suited the obtained database, where the process was monomolecular, endothermic and the dye showed high affinity for the biosorbent. Nevertheless, the authors did not specify the kinetic parameters of this biosorption process.
Oguntimein [47] described the biosorption of synthetic direct dyes used for bleaching and dyeing cotton fabrics. The optimal pH for this process was found to be in the range of 2.0–2.2. The calculated values of ΔH > 0, ΔG > 0 and ΔS < 0 and the fact that the experimental database was best suited to the Temkin model prompted the author to suggest the physical nature of this biosorption. Energy for activating was determined at Ea = 8.79 kJ/mol; it was also found that this biosorption followed the PSO equation. Additionally, Belala et al. [48] used dye solutions with a concentration of 70–700 mg/L. They adjusted the pH to an optimal value of 6.3. Based on the Langmuir equation (optimal for the database), they calculated a maximum biosorption of 39.5 mg/L. Thermodynamic data, i.e., ΔH, ΔG and ΔS, proved the spontaneity of this process, which followed the PSO equation. Slimani et al. [49] biosorbed the dye from solutions with concentration of 20–60 mg/L for optimal pH = 10. The calculated values of ΔH and ΔS indicated the spontaneity of this biosorption, which was carried out in accordance with the PSO equation. Guerrero-Coronilla used dye solutions with a concentration of 10–500 mg/L with an optimal pH of the solution set at 1.5. The database best matched the Langmuir isotherm equation. According to the authors, thermodynamic data, i.e., ΔH (>0) and ΔS (<0) indicated that the process was not spontaneous. The experimental database fitted the PSO equation. Activation energies of the studied biosorption were determined to rise with an increase in T from 19.8 to 34.8 kJ/mol.
In ten cases, the authors showed positive, and for seven other, negative T effects on the biosorption parameters. Only for a single case, they first noticed the growth of the biosorption with the increase in T, and then, the reduction in the biosorption parameters at higher T values. They interpreted such a phenomenon by the reversibility of the tested biosorption process. The chemical nature of the biosorption process resulted with positive T effect on the biosorption only in one case. Then, the negative T for the biosorption effects was explained by the physical character of the biosorption process. The record-breaking influence of T on the biosorption was observed by Kumar and Ahmad [45]. In their study, an increase in T from 30 to 40 °C caused over a 3-fold rise in the biosorption, while for temperature rising from 30 to 50 °C, it was more than 4-fold. The negative T effect on the biosorption generally reached a value of about dozen per cent. Additionally, very high fluctuations of the biosorption values for T ranging from 20 to 60 °C were found by Akkaya and Ozer [39]. According to the results of their research, an increase in T from 20 to 25 °C doubled the biosorption, while the T parameter rising from 20 to 30 °C resulted in the biosorption increasing by nearly 3-fold. Then, increasing T to 60 °C led to the biosorption value 30% lower than that obtained at T = 20°C. The pseudo second order reaction was observed and proven in 13 out of 18 examined papers.
3. Summary
Textile wastewater is a specific group of high temperature sewage systems, where high temperature might strongly affect the process of its purification. This context has inspired us to attempt to determine the effect of temperature on a new and fully economically (and ecologically) justified biosorption process. In fact, before commencing this literature review, one could not answer the question: “how does temperature affect dye biosorption?” However, the authors of this manuscript expected that their efforts could at least put new light into this issue and reveal general conditions within certain types of biosorbents that govern the process. Hence, in this work, quite diverse databases related to biosorption of various dyes on fungi, bacteria, algae and other natural materials have been analysed.
The dyes used in the tests and described can be grouped according to their colour, as well as based on their chemical properties. In both cases, the structure of this organic compound molecule containing chromophore, auxochrome and anti-auxochrome groups is decisive. Dye colour is determined by strong or weak chromophores, while auxochromes and anti-auxochromes strengthen or weaken the colour, thus shifting the maximum absorption of a given dye towards shorter or longer wavelengths. At the same time, auxochromes and anti-auxochromes largely determine dye properties and reactivity. It should be mentioned here that dye-based wastewater primarily contains reactive pigments, then acidic ones, and finally only a small number of basic pigments. In the described biosorption studies, acid, reactive and basic dyes were used 17, 12 and 6 times, correspondingly. Hence, there is a complete agreement between the nature of the dye and the most favourable pH of the system, where all acid dyes were best biosorbed in an acid medium, just like all basic dyes in basic environment. This is not a surprise, because e.g., acid dyes most effectively deposit their large anion on coloured textiles at pH = 1–3. It can be assumed that the pH of the system may slightly block the dissociation of the dye into the undissociated form, although it is well known that acid dyes remain dissociated in quite wide pH ranges, from about 2 to 12. On the other hand, pH significantly creates the surface charge of the biosorbent used, which provides effective exchange of: (a) a small anion from the biosorbent surface with a large acid dye anion, or (b) a small cation from the biosorbent surface with a large basic dye cation. All tested reactive dyes behaved similarly to acid pigments, which may indicate a similar mechanism of the biosorption process. In addition to ion exchange, a number of other processes and interactions (formation of ion pairs, hydrogen bonds, complexing, etc.,) determine the overall biosorption of the dye on the biosorbent, and the pH of the biosorbent-dye system generates many changes in the structure of other dye functional groups, as well as on the surface of the biosorbent.
Another important issue determining the biosorption process is the size and shape of the dye molecule and its potential fit into active centres and other pores on the biosorbent surface. In this regard, it is important to tailor the experimental database to the model adsorption isotherm, as expected, here most often to Langmuir (25 times) and Freundlich (12 times) models. The aforementioned fitting of the dye molecule to the active centres of the biosorbent surface, and thus, the mono-molecularity of the adsorption layer, is expressed by the great compatibility of the database (in many works R2 approaches 0.99) with the Langmuir model.
The summary of the temperature effect on biosorption for the main group of dyes (for all the tested biosorbents), does not give a clear indication, as the result positive-to-negative for the following dyes: acid = 10:9; reactive = 6:7 and basic = 2:3. From the statistical obligation, it should be mentioned that blue and violet dyes were used most frequently (21 times), whereas red and orange were employed 19 times. When leaving the sewage treatment plants, these dyes are seen as most unnatural in the outflow (e.g., in rivers or lakes), while yellow, green or black dyes do not contrast so much with colours in the natural environment. It is impossible to interpret the effect of T on the biosorption depending on the colour of the biosorbed dye. However, as a curiosity you could provide such a summary positive-to-negative for blue and purple = 12:8, and red and orange = 14:12. In this regard, it is interesting to note that a small increase in the T parameter by “first” 10 degrees C (from 20 to 30 °C), clearly has a positive effect on the biosorption of red, blue and, which is not surprising, reactive dyes.
For a vast majority of analysed works, the database from the biosorption process was successfully fitted (high R2 value) to the pseudo second order (PSO) equation, regardless of the positive or negative influence of T. Thus, the authors assumed that in the studied range of low dye concentrations, generally from approximately 10–500 mg/L, during the first ca. 10 min, the biosorption process is efficient and quick, and a further 60–180 min (or longer, even up to 24 h) lead to a dynamic equilibrium state, which then determines the duration of the process. In most of the works, the last stage of completing the database was the calculation of the thermodynamic data “set”: ΔH, ΔG and ΔS, from which the authors determined exo- or endothermicity and possible spontaneity of the biosorption process.
Summing up the statistically determined effect of temperature on the biosorption of dyes, it should be stated that the authors of 21 papers clearly indicated a positive effect, often interpreting it with the chemical nature of the studied process. At the same time, the authors of 10 other papers confirmed the positive effect of temperature on the biosorption with an initial increase in T from about 20 to about 30–40 °C, indicating that higher T values often caused a decrease in the capacity of biosorption. A radical, 3–4 times increase in the biosorption was found at an increase in T from 10 to 20 °C. The authors of the remaining 13 papers clearly demonstrated the negative impact of T on the examined biosorption processes, thus generally indicating the physical nature of this process.
4. Conclusions
In biosorption studies, acid and reactive dyes are most commonly used as sorbate, as these dyes are frequently found in dye sludges; reactive dyes are most often biosorbed on bacteria and algae. Biosorption is most often carried out at pH range 1–3, as it promotes the biosorption of acid and reactive dyes. The experimental database on dye biosorption best fits the Langmuir isotherm equation, which can statistically indicate the dominant chemical and monomolecular nature of this process. The analysed papers do not indicate a clear effect of temperature on the biosorption depending on the sorbate used—acid, reactive or basic dye. The examined works clearly showed: (a) the equation of the pseudo second order reaction as a kinetic model of dye biosorption, (b) the spontaneity of this process. The authors of 21 papers indicated the positive impact of temperature increase on the biosorption efficiency, whereas those of 13 other papers implied the negative effect, which leads to the conclusion that the increase in temperature raises the efficiency of this process. At the same time, the vast majority of authors showed that a slight increase in T by “first” 10°C (from 20–30 °C) positively affects the efficiency of the biosorption process.
Author Contributions
Writing—original draft preparation, L.S.; writing—review and editing, T.M.; writing—review and editing, B.P. All authors have read and agreed to the published version of the manuscript.
Funding
This research was funded by NCBR-Poland, Project No. WATERWORKS2017/1/WATER HARMONY/2/2019 (Closing the Water Cycle Gap with Harmonised Actions for Sustainable Management of Water Resources), amount of funding 12,000,000 PLN.
Acknowledgments
This paper stems from works related to the project No. WATERWORKS2017/1/WATER HARMONY/2/2019 (Closing the Water Cycle Gap with Harmonised Actions for Sustainable Management of Water Resources) financed by NCBR-Poland.
Conflicts of Interest
The authors declare no conflict of interest. The funders had no role in the design of the study; in the collection, analyses, or interpretation of data; in the writing of the manuscript, or in the decision to publish the results.
References
- Chojnacka, K. Biosorption and bioaccumulation—The prospects for practical applications. Environ. Int. 2010, 36, 299–307. [Google Scholar] [CrossRef] [PubMed]
- Ghaly, A.E.; Ananthashankar, R.; Alhattab, M.; Ramakrishnan, V.V. Production, Characterization and Treatment of Textile Effluents: A Critical Review. J. Chem. Eng. Process Technol. 2013, 5, 1–18. [Google Scholar] [CrossRef]
- Smoczyński, L.; Ratnaweera, H.; Kosobucka, M.; Smoczyński, M. Image analysis of sludge aggregates. Sep. Purif. Technol. 2014, 122, 412–420. [Google Scholar] [CrossRef] [Green Version]
- Sridharan, G.; Shankar, A.A. Toluidine blue: A review of its chemistry and clinical utility. J. Oral Maxillofac. Pathol. 2012, 16, 251–255. [Google Scholar] [CrossRef] [PubMed] [Green Version]
- Monteiro, R.J.R.; Lopes, C.B.; Rocha, L.S.; Coelho, J.P.; Duarte, A.C.; Pereira, E. Sustainable approach for recycling seafood wastes for the removal of priority hazardous substances (Hg and Cd) from water. J. Environ. Chem. Eng. 2016, 4, 1199–1208. [Google Scholar] [CrossRef]
- Kumari, K.; Abraham, T.E. Biosorption of anionic textile dyes by nonviable biomass of fungi and yeast. Bioresour. Technol. 2007, 98, 1704–1710. [Google Scholar] [CrossRef]
- Khalaf, M.A. Biosorption of reactive dye from textile wastewater by non-viable biomass of Aspergillus niger and Spirogyra sp. Bioresour. Technol. 2008, 99, 6631–6634. [Google Scholar] [CrossRef]
- Iscen, C.F.; Kiran, I.; Ilhan, S. Biosorption of Reactive Black 5 dye by Penicillium restrictum: The kinetic study. J. Hazard. Mater. 2007, 143, 335–340. [Google Scholar] [CrossRef]
- Aksu, Z.; Çağatay, Ş.Ş. Investigation of biosorption of Gemazol Turquise Blue-G reactive dye by dried Rhizopus arrhizus in batch and continuous systems. Sep. Purif. Technol. 2006, 48, 24–35. [Google Scholar] [CrossRef]
- Kiran, I.; Akar, T.; Ozcan, A.S.; Ozcan, A.; Tunali, S. Biosorption kinetics and isotherm studies of Acid Red 57 by dried Cephalosporium aphidicola cells from aqueous solutions. Biochem. Eng. J. 2006, 31, 197–203. [Google Scholar] [CrossRef]
- Farah, J.Y.; El-Gendy, N.S.; Farahat, L.A. Biosorption of Astrazone Blue basic dye from an aqueous solution using dried biomass of Baker’s yeast. J. Hazard. Mater. 2007, 148, 402–408. [Google Scholar] [CrossRef] [PubMed]
- Arıca, M.Y.; Bayramoğlu, G. Biosorption of Reactive Red-120 dye from aqueous solution by native and modified fungus biomass preparations of Lentinus sajor-caju. J. Hazard. Mater. 2007, 149, 499–507. [Google Scholar] [CrossRef] [PubMed]
- Aksu, Z.; Tezer, S. Equilibrium and kinetic modelling of biosorption of Remazol Black B by Rhizopus arrhizus in a batch system: Effect of temperature. Process Biochem. 2000, 36, 431–439. [Google Scholar] [CrossRef]
- Aksu, Z.; Tatlı, A.İ.; Tunç, Ö. A comparative adsorption/biosorption study of Acid Blue 161: Effect of temperature on equilibrium and kinetic parameters. Chem. Eng. J. 2008, 142, 23–39. [Google Scholar] [CrossRef]
- Xiong, X.-J.; Meng, X.-J.; Zheng, T.-L. Biosorption of C.I. Direct Blue 199 from aqueous solution by nonviable Aspergillus niger. J. Hazard. Mater. 2010, 175, 241–246. [Google Scholar] [CrossRef] [PubMed]
- Iqbal, M.; Saeed, A. Biosorption of reactive dye by loofa sponge-immobilized fungal biomass of Phanerochaete chrysosporium. Process Biochem. 2007, 42, 1160–1164. [Google Scholar] [CrossRef]
- Bayramoğlu, G.; Çelik, G.; Arica, M.Y. Biosorption of Reactive Blue 4 dye by native and treated fungus Phanerocheate chrysosporium: Batch and continuous flow system studies. J. Hazard. Mater. 2006, 137, 1689–1697. [Google Scholar] [CrossRef]
- Gao, J.; Zhang, Q.; Su, K.; Chen, R.; Peng, Y. Biosorption of Acid Yellow 17 from aqueous solution by non-living aerobic granular sludge. J. Hazard. Mater. 2010, 174, 215–225. [Google Scholar] [CrossRef]
- Ho, Y.-S. Review of second-order models for adsorption systems. J. Hazard. Mater. 2006, 136, 681–689. [Google Scholar] [CrossRef] [Green Version]
- Mezenner, N.Y.; Aicha, B. Equilibrium and kinetic modelling of methylene blue biosorption by pretreated dead streptomyces rimosus: Effect of temperature. Chem. Eng. J. 2006, 119, 121–125. [Google Scholar] [CrossRef]
- Wang, Y.; Mu, Y.; Zhao, Q.-B.; Yu, H.-Q. Isotherms, kinetics and thermodynamics of dye biosorption by anaerobic sludge. Sep. Purif. Technol. 2006, 50, 1–7. [Google Scholar] [CrossRef]
- Colak, F.; Atar, N.; Olgun, A. Biosorption of acidic dyes from aqueous solution by Paenibacillus macerans: Kinetic, thermodynamic and equilibrium studies. Chem. Eng. J. 2009, 150, 122–130. [Google Scholar] [CrossRef]
- Sun, X.-F.; Wang, S.-G.; Liu, X.-W.; Gong, W.-X.; Bao, N.; Gao, B.-Y.; Zhang, H.-Y. Biosorption of Malachite Green from aqueous solutions onto aerobic granules: Kinetic and equilibrium studies. Bioresour. Technol. 2008, 99, 3475–3483. [Google Scholar] [CrossRef] [PubMed]
- Mona, S.; Kaushik, A.; Kaushik, C.P. Biosorption of reactive dye by waste biomass of Nostoc linckia. Ecol. Eng. 2011, 37, 1589–1594. [Google Scholar] [CrossRef]
- Dotto, G.L.; Lima, E.C.; Pinto, L.A.A. Biosorption of food dyes onto Spirulina platensis nanoparticles: Equilibrium isotherm and thermodynamic analysis. Bioresour. Technol. 2012, 103, 123–130. [Google Scholar] [CrossRef] [PubMed] [Green Version]
- Dotto, G.L.; Vieira, M.L.G.; Esquerdo, V.M.; Pinto, L.A.A. Equilibrium and thermodynamics of azo dyes biosorption onto Spirulina platensis. Braz. J. Chem. Eng. 2013, 30, 13–21. [Google Scholar] [CrossRef]
- Aksu, Z.; Tezer, S. Biosorption of reactive dyes on the green alga Chlorella vulgaris. Process Biochem. 2005, 40, 1347–1361. [Google Scholar] [CrossRef]
- Özer, A.; Akkaya, G.; Turabik, M. Biosorption of Acid Red 274 (AR 274) on Enteromorpha prolifera in a batch system. J. Hazard. Mater. 2005, 126, 119–127. [Google Scholar] [CrossRef]
- Özer, A.; Akkaya, G.; Turabik, M. The biosorption of Acid Red 337 and Acid Blue 324 on Enteromorpha prolifera: The application of nonlinear regression analysis to dye biosorption. Chem. Eng. J. 2005, 112, 181–190. [Google Scholar] [CrossRef]
- Özer, A.; Akkaya, G.; Turabik, M. The removal of Acid Red 274 from wastewater: Combined biosorption and biocoagulation with Spirogyra rhizopus. Dye. Pigment. 2006, 71, 83–89. [Google Scholar] [CrossRef]
- Daneshvar, E.; Kousha, M.; Sohrabi, M.S.; Khataee, A.; Converti, A. Biosorption of three acid dyes by the brown macroalga Stoechospermum marginatum: Isotherm, kinetic and thermodynamic studies. Chem. Eng. J. 2012, 195–196, 297–306. [Google Scholar] [CrossRef]
- Khataee, A.R.; Vafaei, F.; Jannatkhah, M. Biosorption of three textile dyes from contaminated water by filamentous green algal Spirogyra sp.: Kinetic, isotherm and thermodynamic studies. Int. Biodeterior. Biodegrad. 2013, 83, 33–40. [Google Scholar] [CrossRef]
- Chowdhury, S.; Chakraborty, S.; Saha, P. Biosorption of Basic Green 4 from aqueous solution by Ananas comosus (pineapple) leaf powder. Colloids Surf. B Biointerfaces 2011, 84, 520–527. [Google Scholar] [CrossRef] [PubMed]
- Han, R.; Zou, W.; Yu, W.; Cheng, S.; Wang, Y.; Shi, J. Biosorption of methylene blue from aqueous solution by fallen phoenix tree’s leaves. J. Hazard. Mater. 2007, 141, 156–162. [Google Scholar] [CrossRef]
- Ho, Y.-S.; Chiang, T.-H.; Hsueh, Y.-M. Removal of basic dye from aqueous solution using tree fern as a biosorbent. Process Biochem. 2005, 40, 119–124. [Google Scholar] [CrossRef]
- Ponnusami, V.; Krithika, V.; Madhuram, R.; Srivastava, S.N. Biosorption of reactive dye using acid-treated rice husk: Factorial design analysis. J. Hazard. Mater. 2007, 142, 397–403. [Google Scholar] [CrossRef]
- Aksakal, O.; Ucun, H. Equilibrium, kinetic and thermodynamic studies of the biosorption of textile dye (Reactive Red 195) onto Pinus sylvestris L. J. Hazard. Mater. 2010, 181, 666–672. [Google Scholar] [CrossRef]
- Akar, S.T.; Özcan, A.S.; Akar, T.; Özcan, A.; Kaynak, Z. Biosorption of a reactive textile dye from aqueous solutions utilizing an agro-waste. Desalination 2009, 249, 757–761. [Google Scholar] [CrossRef]
- Akkaya, G.; Özer, A. Biosorption of Acid Red 274 (AR 274) on Dicranella varia: Determination of equilibrium and kinetic model parameters. Process Biochem. 2005, 40, 3559–3568. [Google Scholar] [CrossRef]
- Barka, N.; Abdennouri, M.; Makhfouk, M.E. Removal of Methylene Blue and Eriochrome Black T from aqueous solutions by biosorption on Scolymus hispanicus L.: Kinetics, equilibrium and thermodynamics. J. Taiwan Inst. Chem. Eng. 2011, 42, 320–326. [Google Scholar] [CrossRef]
- Akar, T.; Tosun, I.; Kaynak, Z.; Ozkara, E.; Yeni, O.; Sahin, E.N.; Akar, S.T. An attractive agro-industrial by-product in environmental cleanup: Dye biosorption potential of untreated olive pomace. J. Hazard. Mater. 2009, 166, 1217–1225. [Google Scholar] [CrossRef] [PubMed]
- De Oliveira Brito, S.M.; Andrade, H.M.C.; Soares, L.F.; de Azevedo, R.P. Brazil nut shells as a new biosorbent to remove methylene blue and indigo carmine from aqueous solutions. J. Hazard. Mater. 2010, 174, 84–92. [Google Scholar] [CrossRef] [PubMed]
- Akar, T.; Ozcan, A.S.; Tunali, S.; Ozcan, A. Biosorption of a textile dye (Acid Blue 40) by cone biomass of Thuja orientalis: Estimation of equilibrium, thermodynamic and kinetic parameters. Bioresour. Technol. 2008, 99, 3057–3065. [Google Scholar] [CrossRef] [PubMed]
- Ofomaja, A.E.; Ho, Y.-S. Effect of temperatures and pH on methyl violet biosorption by Mansonia wood sawdust. Bioresour. Technol. 2008, 99, 5411–5417. [Google Scholar] [CrossRef] [PubMed]
- Kumar, R.; Ahmad, R. Biosorption of hazardous crystal violet dye from aqueous solution onto treated ginger waste (TGW). Desalination 2011, 265, 112–118. [Google Scholar] [CrossRef]
- Doğan, M.; Abak, H.; Alkan, M. Biosorption of Methylene Blue from Aqueous Solutions by Hazelnut Shells: Equilibrium, Parameters and Isotherms. Water Air Soil Pollut. 2008, 192, 141–153. [Google Scholar] [CrossRef]
- Oguntimein, G.B. Biosorption of dye from textile wastewater effluent onto alkali treated dried sunflower seed hull and design of a batch adsorber. J. Environ. Chem. Eng. 2015, 3, 2647–2661. [Google Scholar] [CrossRef]
- Belala, Z.; Jeguirim, M.; Belhachemi, M.; Addoun, F.; Trouvé, G. Biosorption of basic dye from aqueous solutions by Date Stones and Palm-Trees Waste: Kinetic, equilibrium and thermodynamic studies. Desalination 2011, 271, 80–87. [Google Scholar] [CrossRef]
- Slimani, R.; El Ouahabi, I.; Abidi, F.; El Haddad, M.; Regti, A.; Laamari, M.R.; Antri, S.E.; Lazar, S. Calcined eggshells as a new biosorbent to remove basic dye from aqueous solutions: Thermodynamics, kinetics, isotherms and error analysis. J. Taiwan Inst. Chem. Eng. 2014, 45, 1578–1587. [Google Scholar] [CrossRef]
Figure 1.
An example of bioaccumulation [1].
Figure 1.
An example of bioaccumulation [1].

Figure 2.
Characterization of crab carapace (A) and clamshell (B) powders by SEM [5].
Figure 2.
Characterization of crab carapace (A) and clamshell (B) powders by SEM [5].


Table 1.
Data and parameters describing the influence of temperature (T) on biosorption (Bios) of dyes from aqueous solutions on fungal biomass (its Latin name is in column 1).
Table 1.
Data and parameters describing the influence of temperature (T) on biosorption (Bios) of dyes from aqueous solutions on fungal biomass (its Latin name is in column 1).
| Names of Biosorbent (Mushrooms) | Names of Biosorbate | T °C Effect of T: If + Bold If − Italic | Removal If in [mg/g] Then no Unit | Ref |
|---|---|---|---|---|
| Aspergillus niger, Aspergillus japonica, etc. | Reactive Black 8, Reactive Brown 9, Reactive Green 19, Reactive Blue 38, Reactive Blue 3 | 20–40 | 90–99%, 54–86%, mean = more than at 30o | [6] |
| Aspergillus niger | Synazol | 15, 30, 45 | 11,14; 44,36; 14,10 | [7] |
| Penicillium restrictum biomass | Reactive Black 5 | 20–50 | from 100 to 112 | [8] |
| Rhizopus arrhizus | Gemazol Turquise Blue G | 15–45 | from 78 to 92 | [9] |
| Cephalosporium aphidicola | Acid Red 57 | 20, 30, 40, 50 | 109, 104, 99, 82 | [10] |
| Saccharomyces cerev. | Astrazone Blue | 20, 30, 50 | max: 59, 63,83 | [11] |
| Lentinus sajur-caju | Reactive Red 120 | 5, 15, 25, 35 | max: 65 to 100 min: 20 to 22 | [12] |
| Rhizopus arrhizus | Remazol Black B | 25, 35, 45, 55 | 76%, 85%, 73%, 61% | [13] |
| Trametes versicolor | Acid Blue 161 | 25, 35, 45 | 178, 193, 207 | [14] |
| Aspergillus niger | Direct Blue 199 | 25–45 | approx. to 30% | [15] |
| Phanerochaete chrysosporium | Remazol Brilliant Blue R | 20, 30, 40, 50 | 45,62; 54,73; 45,62; 43,58 | [16] |
| Phanerochaete chrysosporium | Reactive Blue 4 | 4–37 | 81–157 | [17] |
Table 2.
Influence of temperature on the biosorption of dyes by bacteria and algae.
| Names of Biosorbent: (a) Bacteria (b) Algae | Names of Biosorbate (Remarks) | T °C Effect of T: If+ Bold If − Italic | Removal If in[mg/g] Then no Unit | Ref |
|---|---|---|---|---|
| a) | ||||
| non-living aerobic granular sludge | Acid Yellow 17 | 20, 35, 50 | 13–32, 15–38, 12–30 | [18] |
| streptomyces rimosus | Methylene Blue | 20–50 | from 86% to 54% | [19] |
| anaerobic sludge | Rhodamine B, Eosin Y | 20–60 | from 6 to 4 | [20] |
| Paenibacillus macerans | Acid Blue 225, Acid Blue 062 | 25–55 | from 109 to 86 | [21] |
| aerobic granules | Malachite Green | 30–50 | from 20 to 50 | [22] |
| Nostoc linckia | Reactive Red 198 | 25, 35, 45 | 50, 54, 35 | [23] |
| Spirulina platensis | red 40 acid blue 9 | 25–55 | 503–138 1951–163 | [24] |
| Spirulina platensis | tartrazine allura red | 25–55 | 363–238 469–181 | [25] |
| b) | ||||
| Chlorella vulgaris | Remazol Black B, Remazol Red RR, Remazol Golden Yellow | 25, 35, 45, 55 | 15–370, 16–416 14–284, 13–222 | [26] |
| Enteromorpha prolifera, | Acid Red 274 | 20, 25, 30, 35, 40, 50 | 238, 244, 231, 221, 203 | [27] |
| Enteromorpha prolifera | Acid Red 337 Acid Blue 324 | 20, 25, 30, 40, 50 | 33, 41; 66, 61; 53,67; 46,64; 36,45 | [28] |
| Spirogyra rhizopus | Acid Red 274 | 20, 25, 30, 35, 40, 50 | 240, 248, 249, 247 246, 242 | [29] |
| Stoechospermum marginatum | Acid Blue 25, Acid Orange 7, Acid Black 1 | 10–40 | 25–27 (at 30 mg/L) 20–22 (at 30 mg/L) 18–20 (at 30 mg/L) | [30] |
| Spirogyra sp. | Acid Orange 7, Basic Red 46, Basic Blue 3 | 15–45 | 50.2–54.3% 90.6–97% 80.5–91.4% | [31] |
Table 3.
Influence of temperature on the biosorption of dyes by other biosorbents.
| Names of Biosorbent | Names of Biosorbate | T °C Effect of T: If + Bold If − Italic | Removal If in [mg/g] Then no Unit | Ref |
|---|---|---|---|---|
| ananas comosus (pineapple) leaf powder | Basic Green 4 | 25–45 | 49–42 | [32] |
| fallen phoenix tree’s leaves | Methylene Blue | 22–50 | 81–90 | [33] |
| tree fern | Basic Red 13 | 10–40 | 0.7–0.9 [mmol/g] | [34] |
| acid-treated rice husk | Reactive red RGB | 20–40 | 60–85% | [35] |
| Pinus sylvestris L. | Reactive Red 195 | 20–50 | 3.73–4.16 | [36] |
| canned food plant | Reactive Red 198 | 20–50 | 82–78.6 | [37] |
| Dicranella varia | Acid Red 274 | 20, 25, 30, 35, 40, 50, 60 | 65, 130, 191, 130, 84, 54, 43 | [38] |
| Scolymus hispanicus L | Methylene Blue Eriochrome Black T | 20–60 | MB: 40%, EB: 30% | [39] |
| untreated olive pomace | textile dye, RR198 | 20–50 | 8.2–5.5 | [40] |
| Brazil nut shells | methylene blue, indygo carmine | 20–60 | MB: 72–67% IC: 9.8–8.5% | [41] |
| cone biomass of Thuja orientalis | Acid Blue 40 | 20–40 | 8.22–5.51 | [42] |
| mansonia wood sawdust | methyl violet | 26–56 | 17.6–23.3 | [43] |
| treated ginger | crystal violet | 30–50 | 65–277 | [44] |
| waste | ||||
| hazelnut Shells | Methylene Blue | 25–55 | 0.21–0.33 [mmol/g] | [45] |
| sunflower seed hull | wastewater from the textile industry | 19–60 | 42–68 [%] | [46] |
| palm-trees waste | Methylene Blue | 20–70 | 21–35 | [47] |
| calcined eggshells | basic yellow 28 | 15–45 | 9–4.5 | [48] |
| water hyacinth leaves | acid red 27 | 18–50 | 60–71 | [49] |
© 2020 by the authors. Licensee MDPI, Basel, Switzerland. This article is an open access article distributed under the terms and conditions of the Creative Commons Attribution (CC BY) license (http://creativecommons.org/licenses/by/4.0/).
Share and Cite
MDPI and ACS Style
Smoczyński, L.; Pierożyński, B.; Mikołajczyk, T. The Effect of Temperature on the Biosorption of Dyes from Aqueous Solutions. Processes 2020, 8, 636. https://doi.org/10.3390/pr8060636
AMA Style
Smoczyński L, Pierożyński B, Mikołajczyk T. The Effect of Temperature on the Biosorption of Dyes from Aqueous Solutions. Processes. 2020; 8(6):636. https://doi.org/10.3390/pr8060636
Chicago/Turabian StyleSmoczyński, Lech, Bogusław Pierożyński, and Tomasz Mikołajczyk. 2020. "The Effect of Temperature on the Biosorption of Dyes from Aqueous Solutions" Processes 8, no. 6: 636. https://doi.org/10.3390/pr8060636
Note that from the first issue of 2016, this journal uses article numbers instead of page numbers. See further details here.