Membrane Elastic Properties during Neural Precursor Cell Differentiation

 , , and
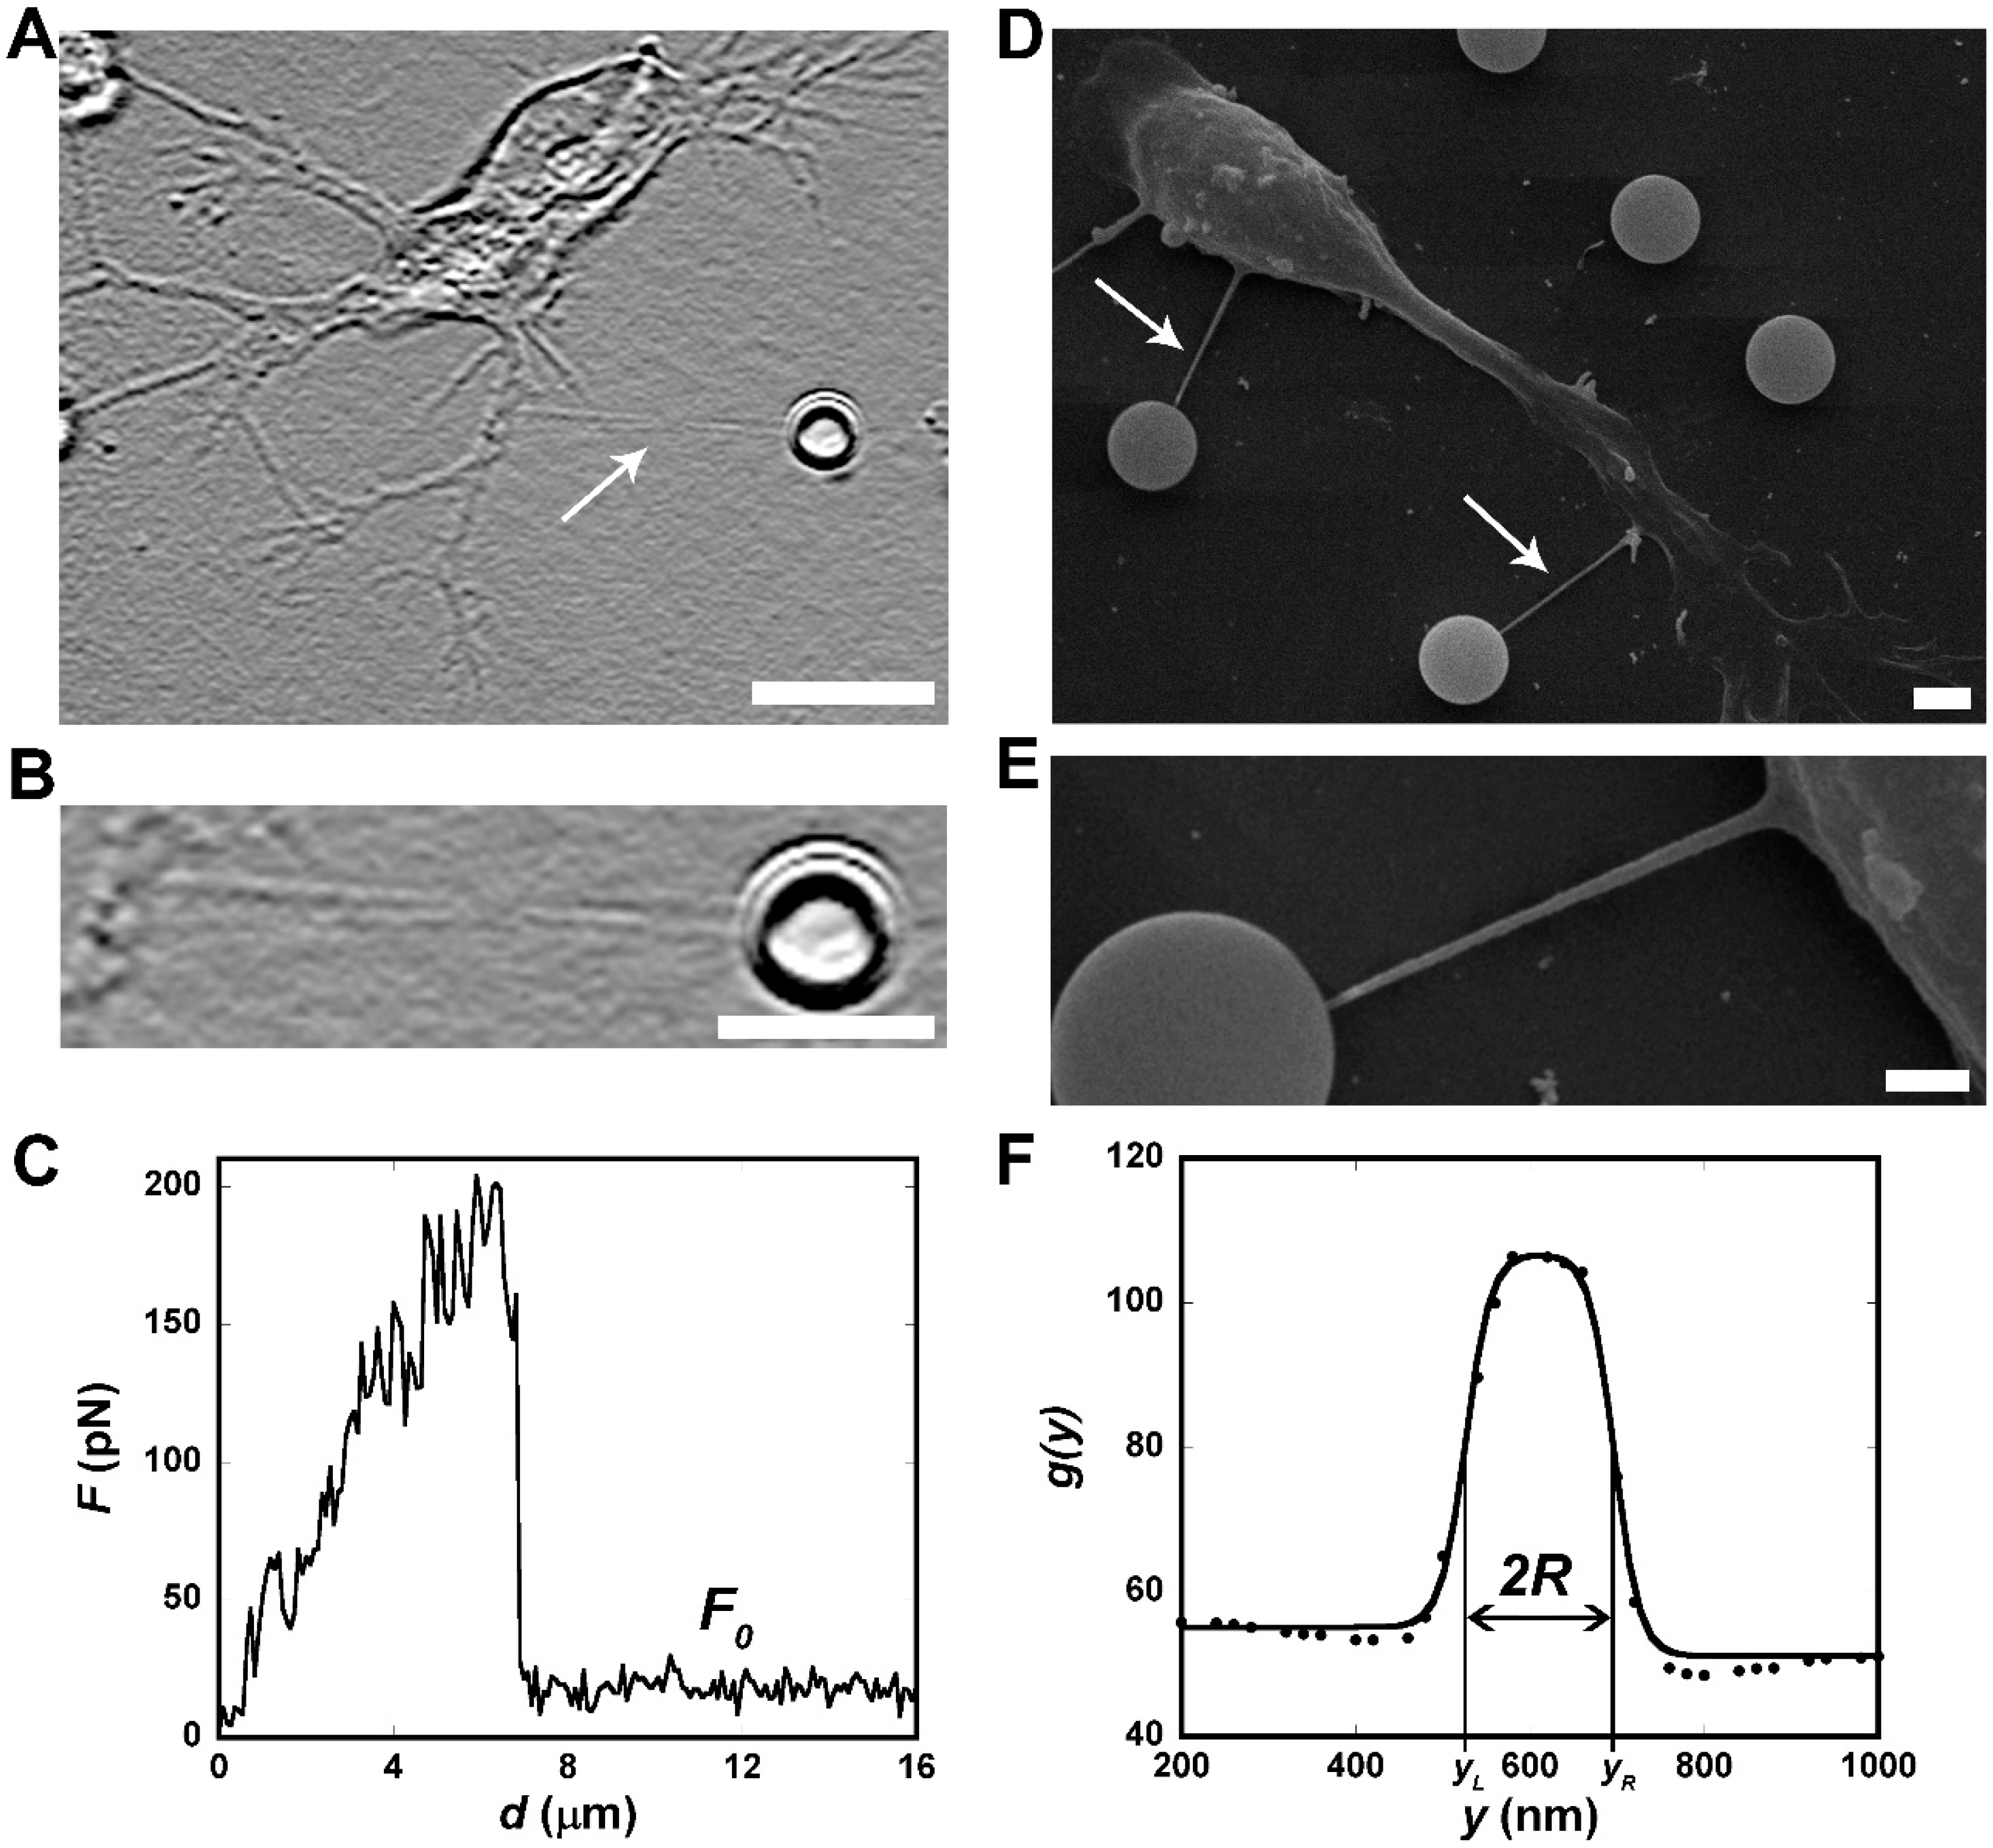
Abstract
:1. Introduction
2. Materials and Methods
2.1. Animals
2.2. Cell Cultures
2.3. Confocal Fluorescence Microscopy
2.4. Optical Tweezers Setup and Calibration
2.5. Tether Extraction Experiments with Optical Tweezers
2.6. Measurements of Tether Radii
2.7. Determination of Membrane Elastic Properties
2.8. Statistical Analysis
3. Results
3.1. OT as a Tool for Measuring CM Elastic Properties of NPCs and Differentiated Cells
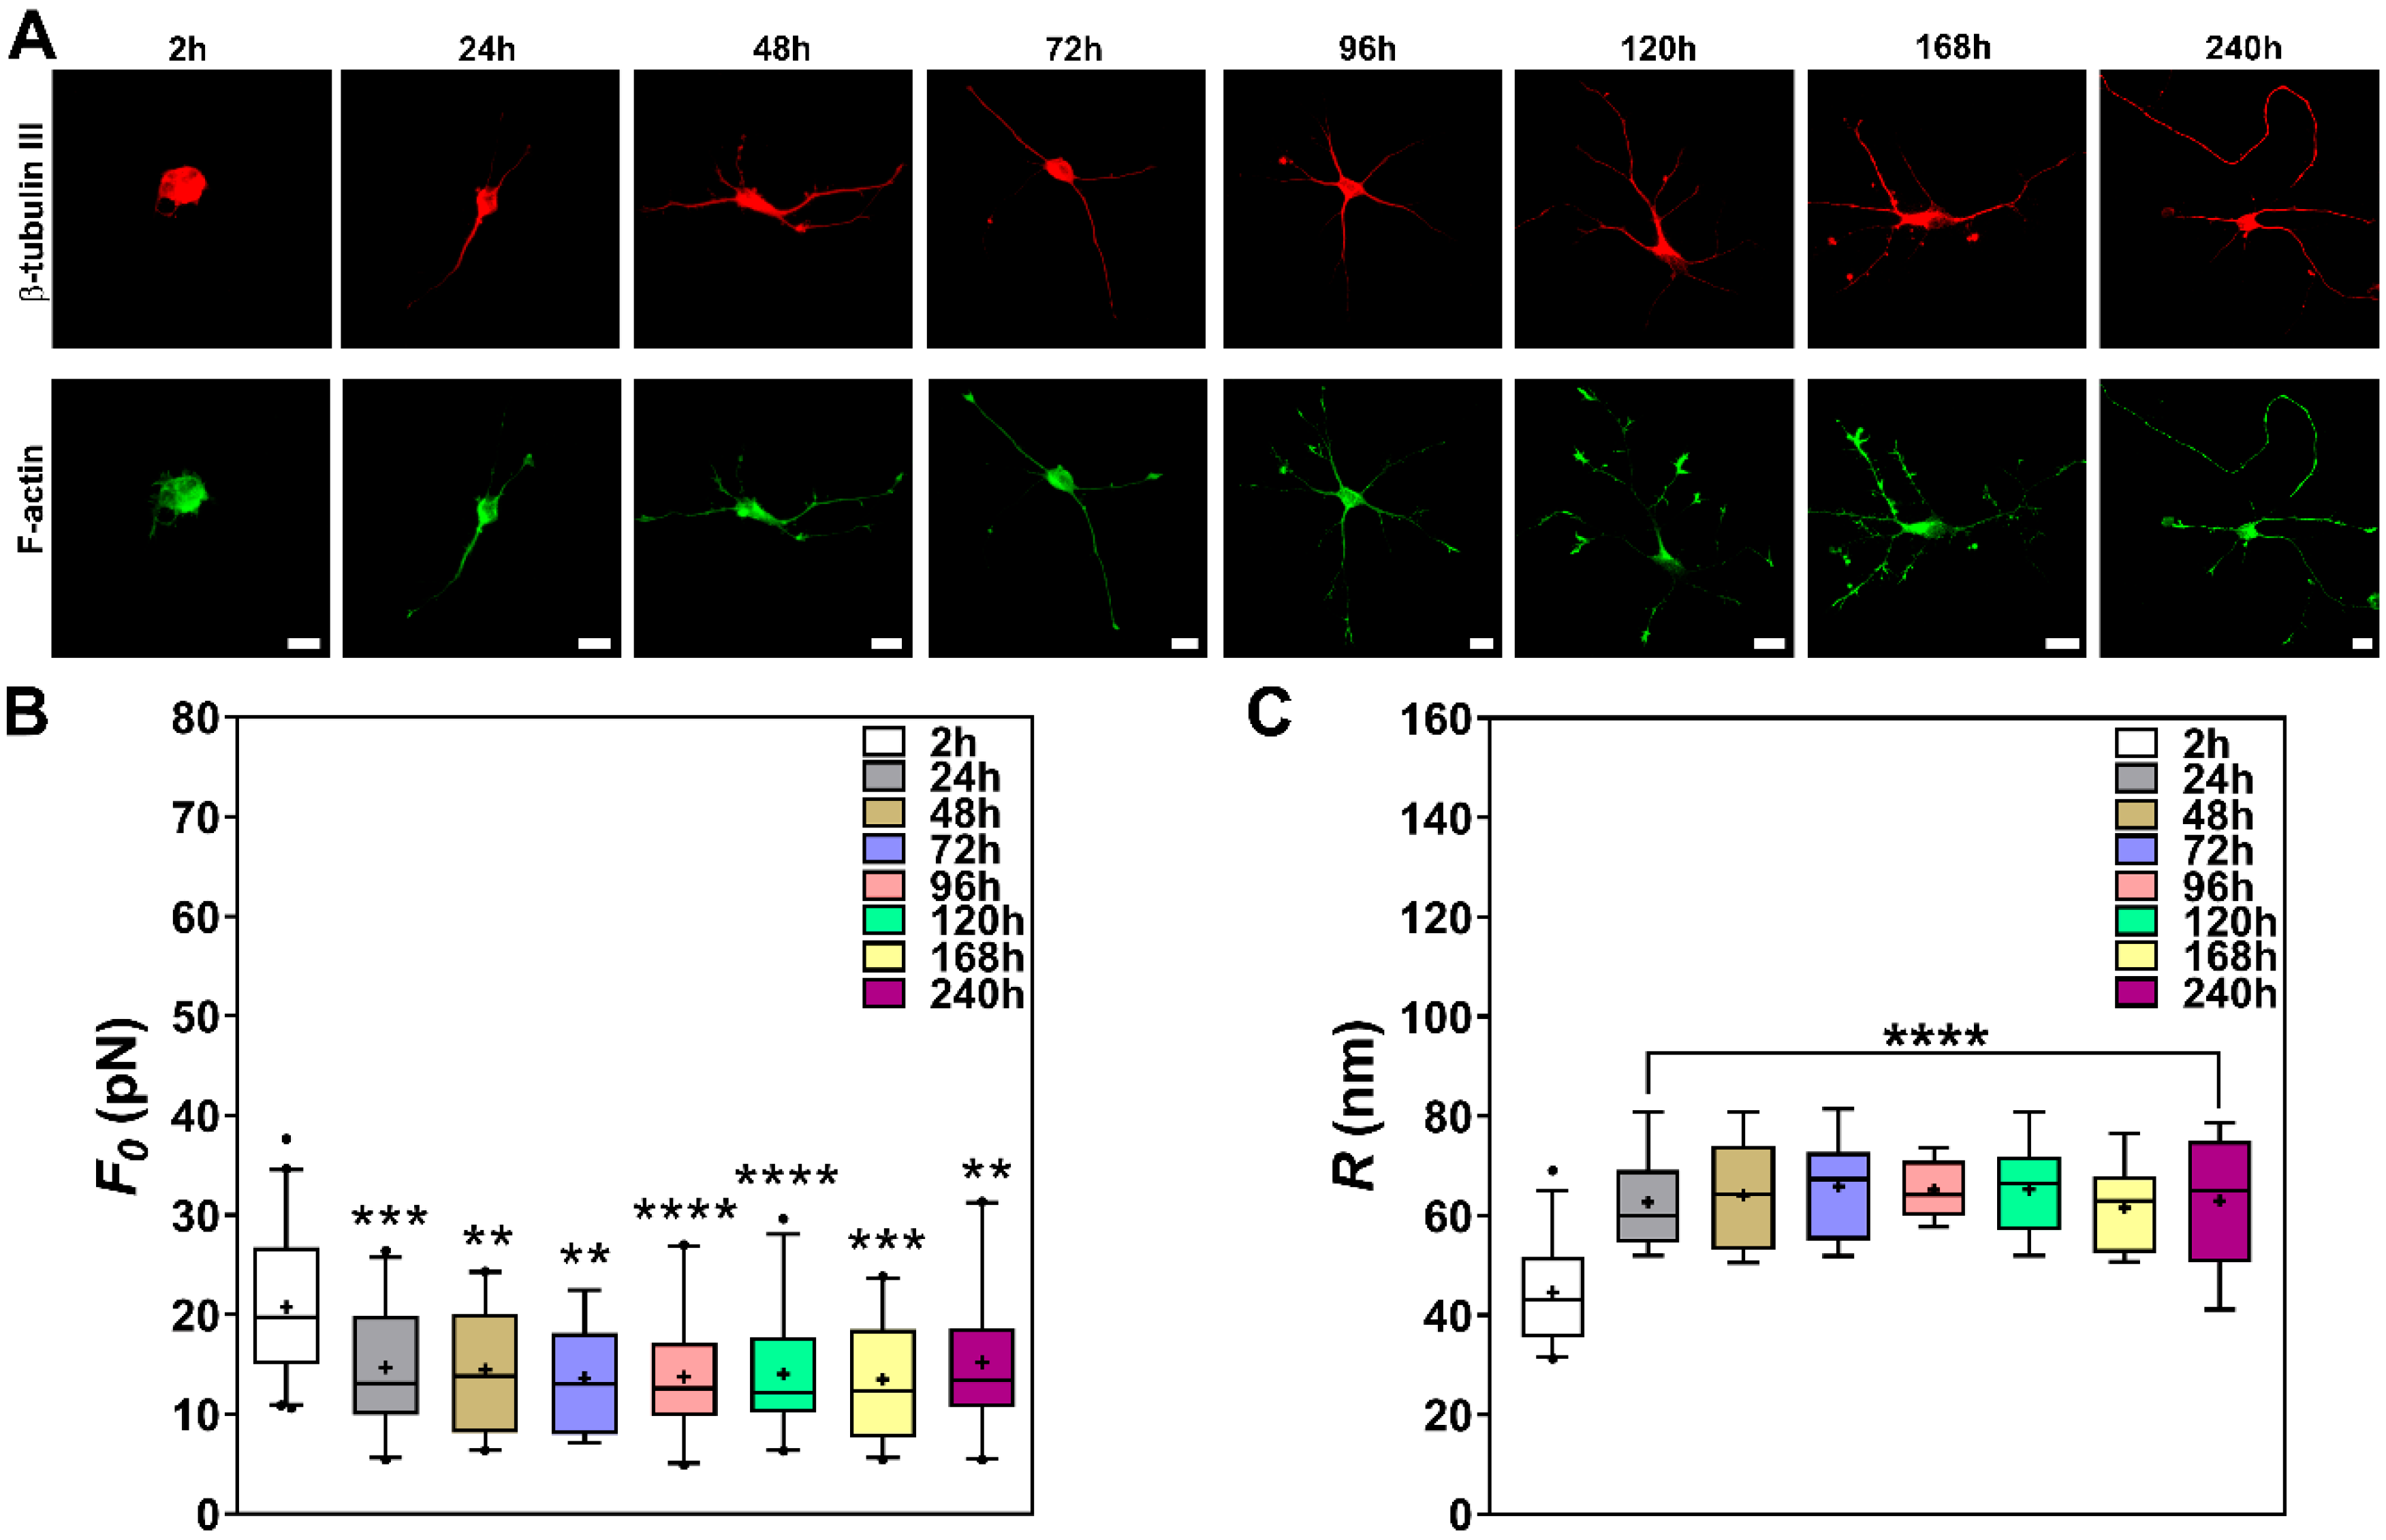
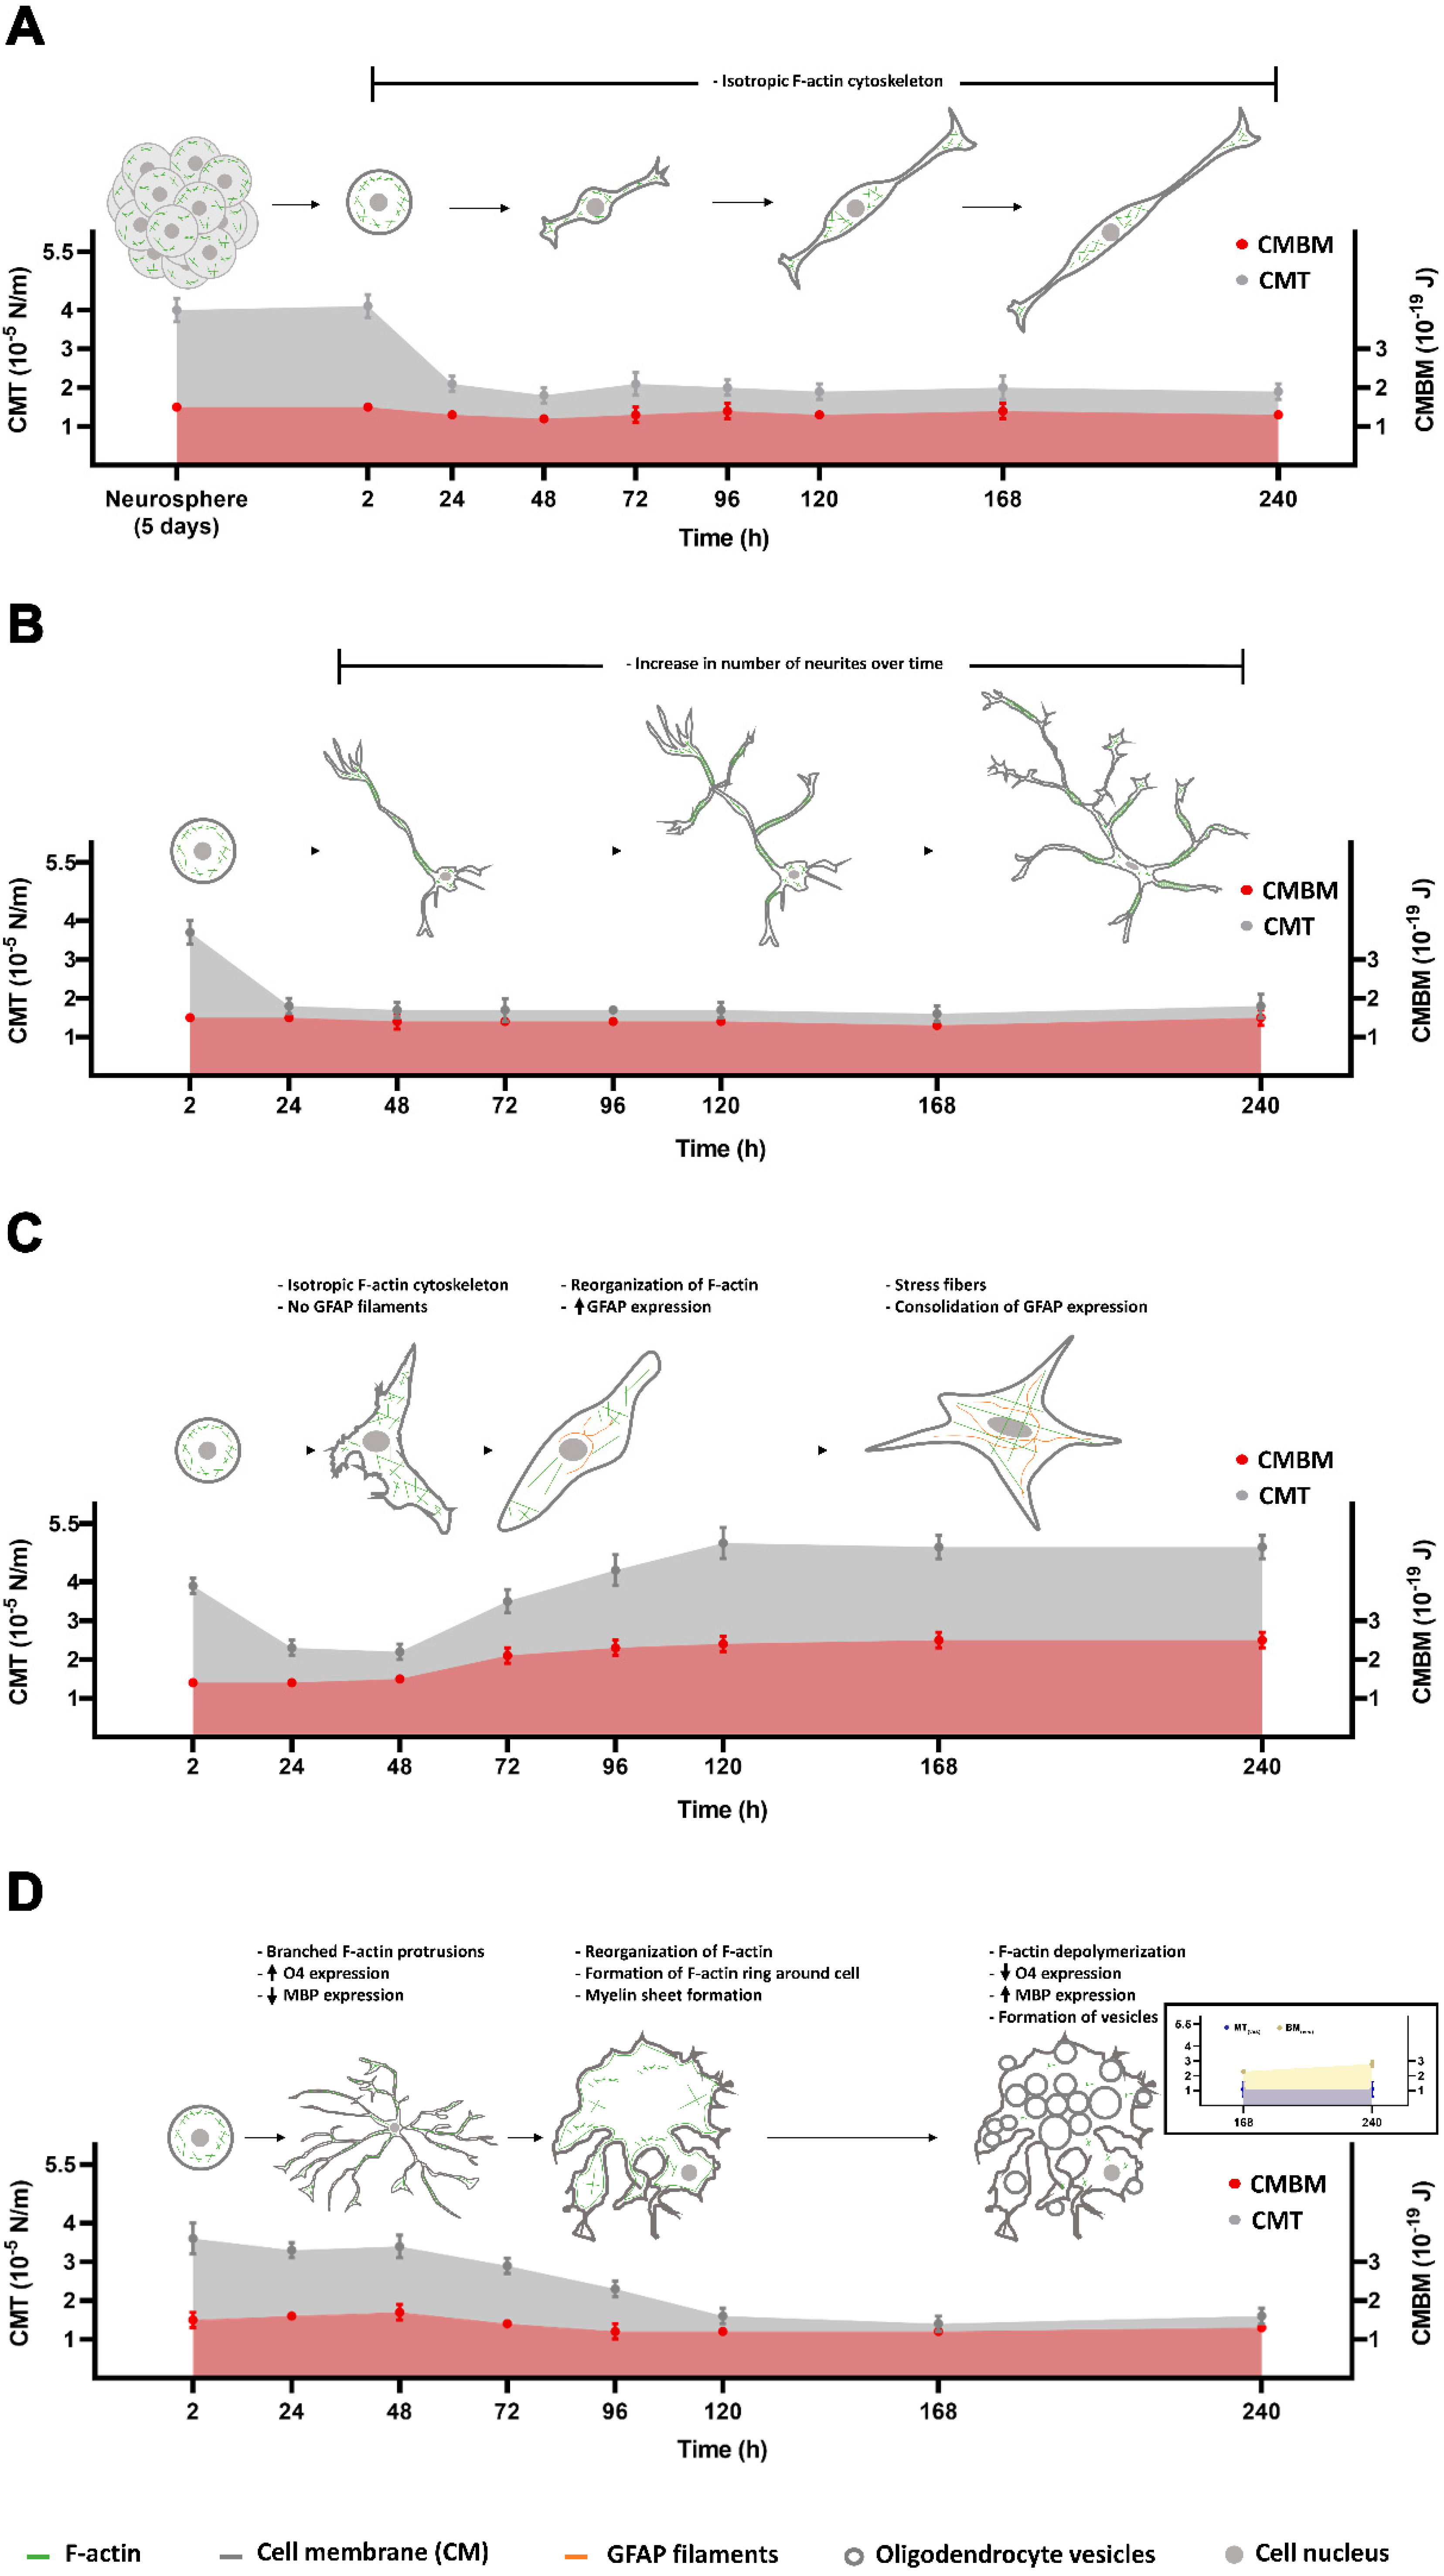
3.2. CM Elastic Properties Measured for NPCs Vary Only in the Initial Hours after Plating
3.3. CM Elastic Properties Measured for Cells Cultured in Neurobasal Medium Show a Similar Pattern in Comparison to NPCs
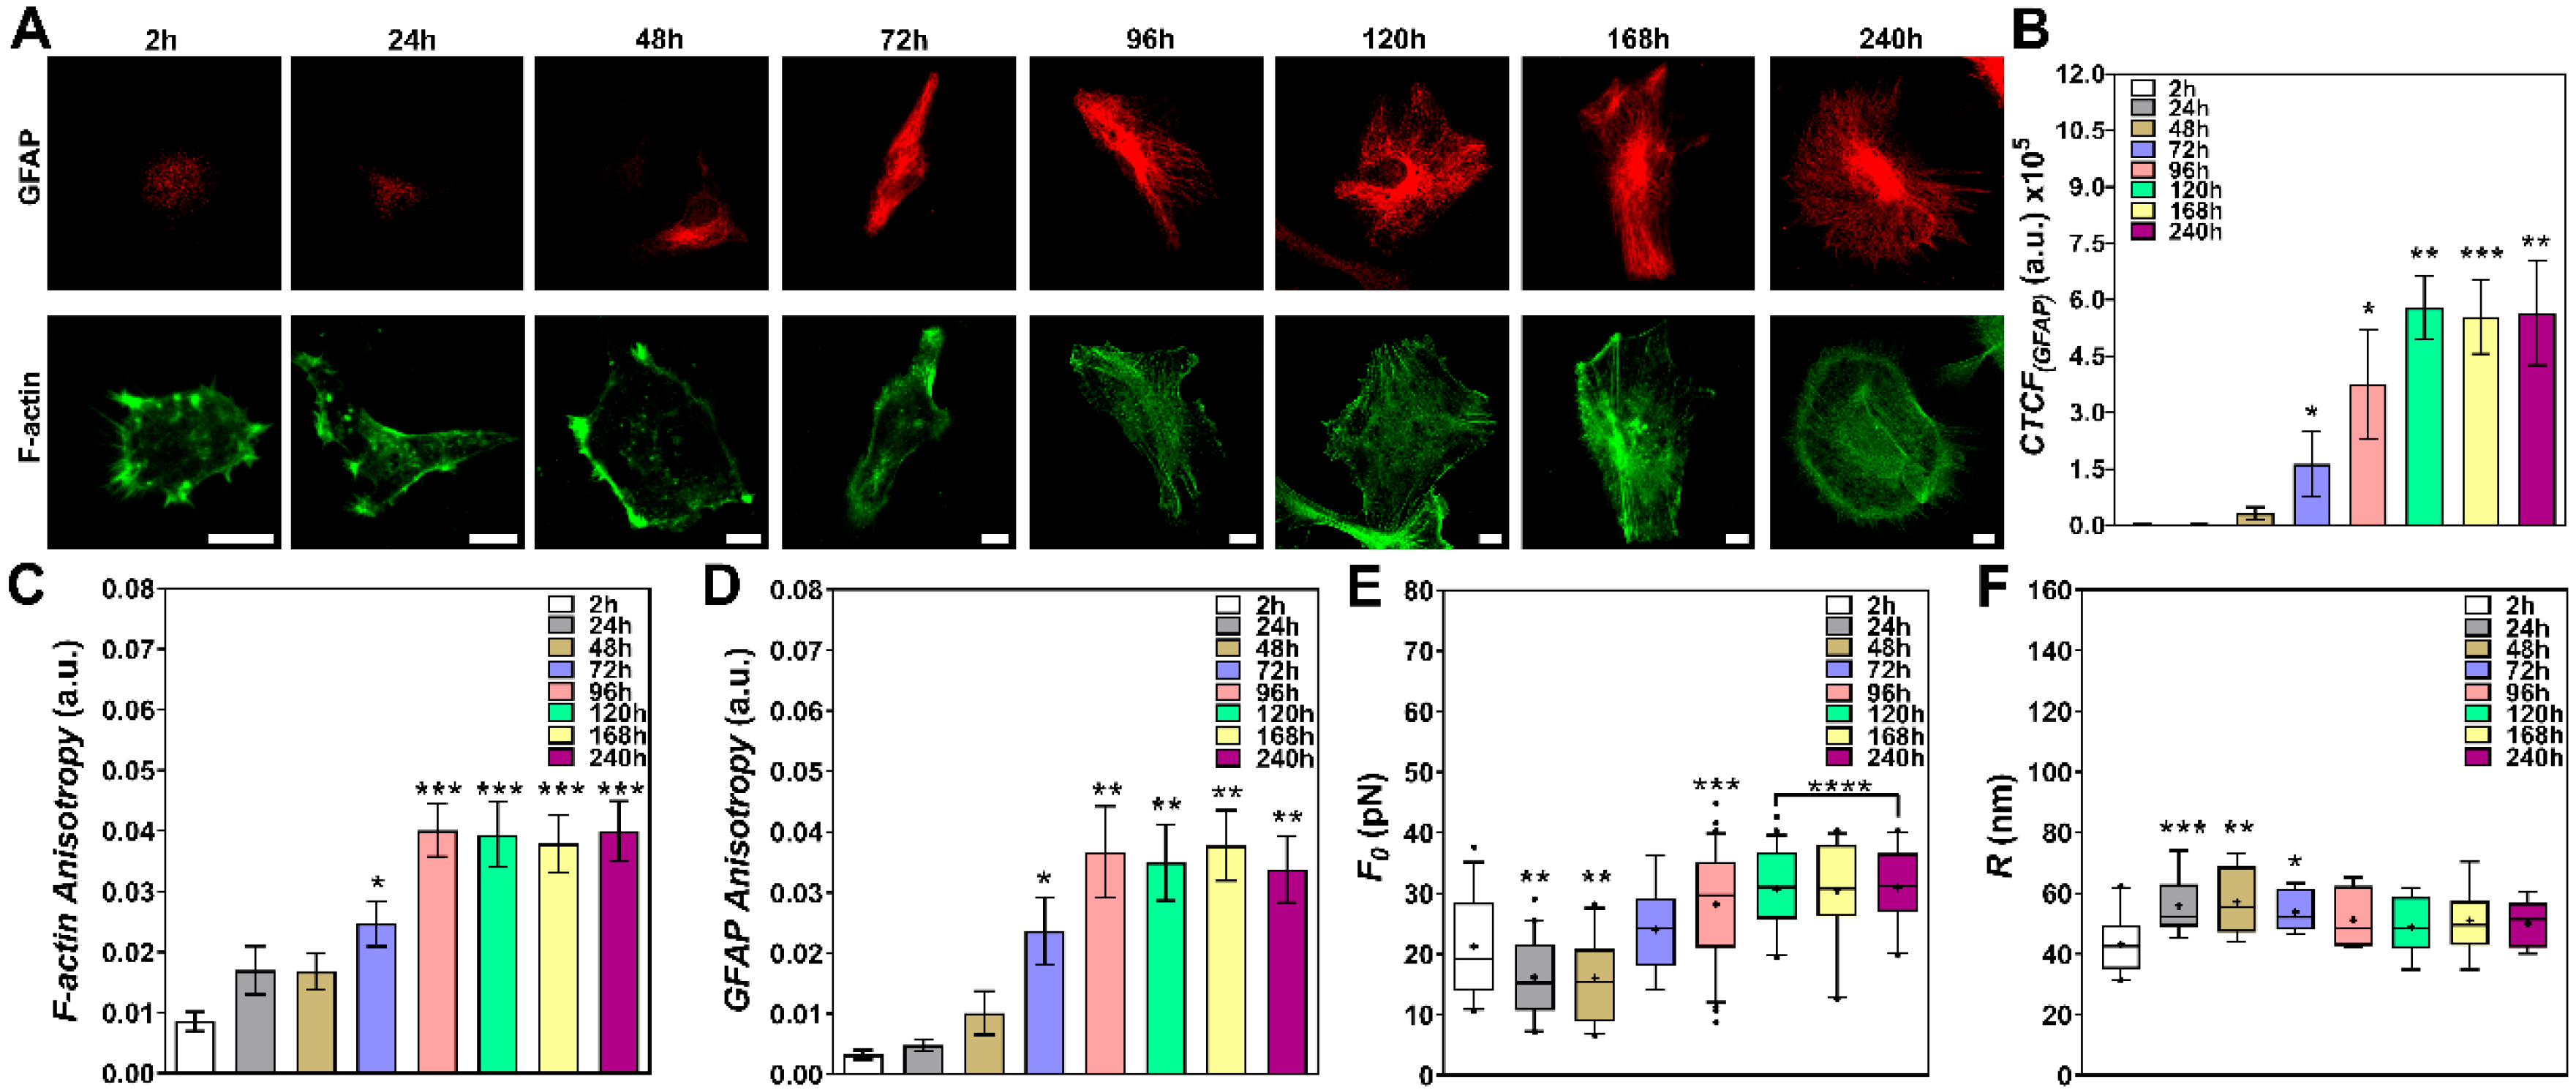
3.4. The Differentiation Process for Astrocytes Reveals Interesting Patterns that Correlate Cytoskeletal Architecture Remodeling with Changes in CM Elastic Properties
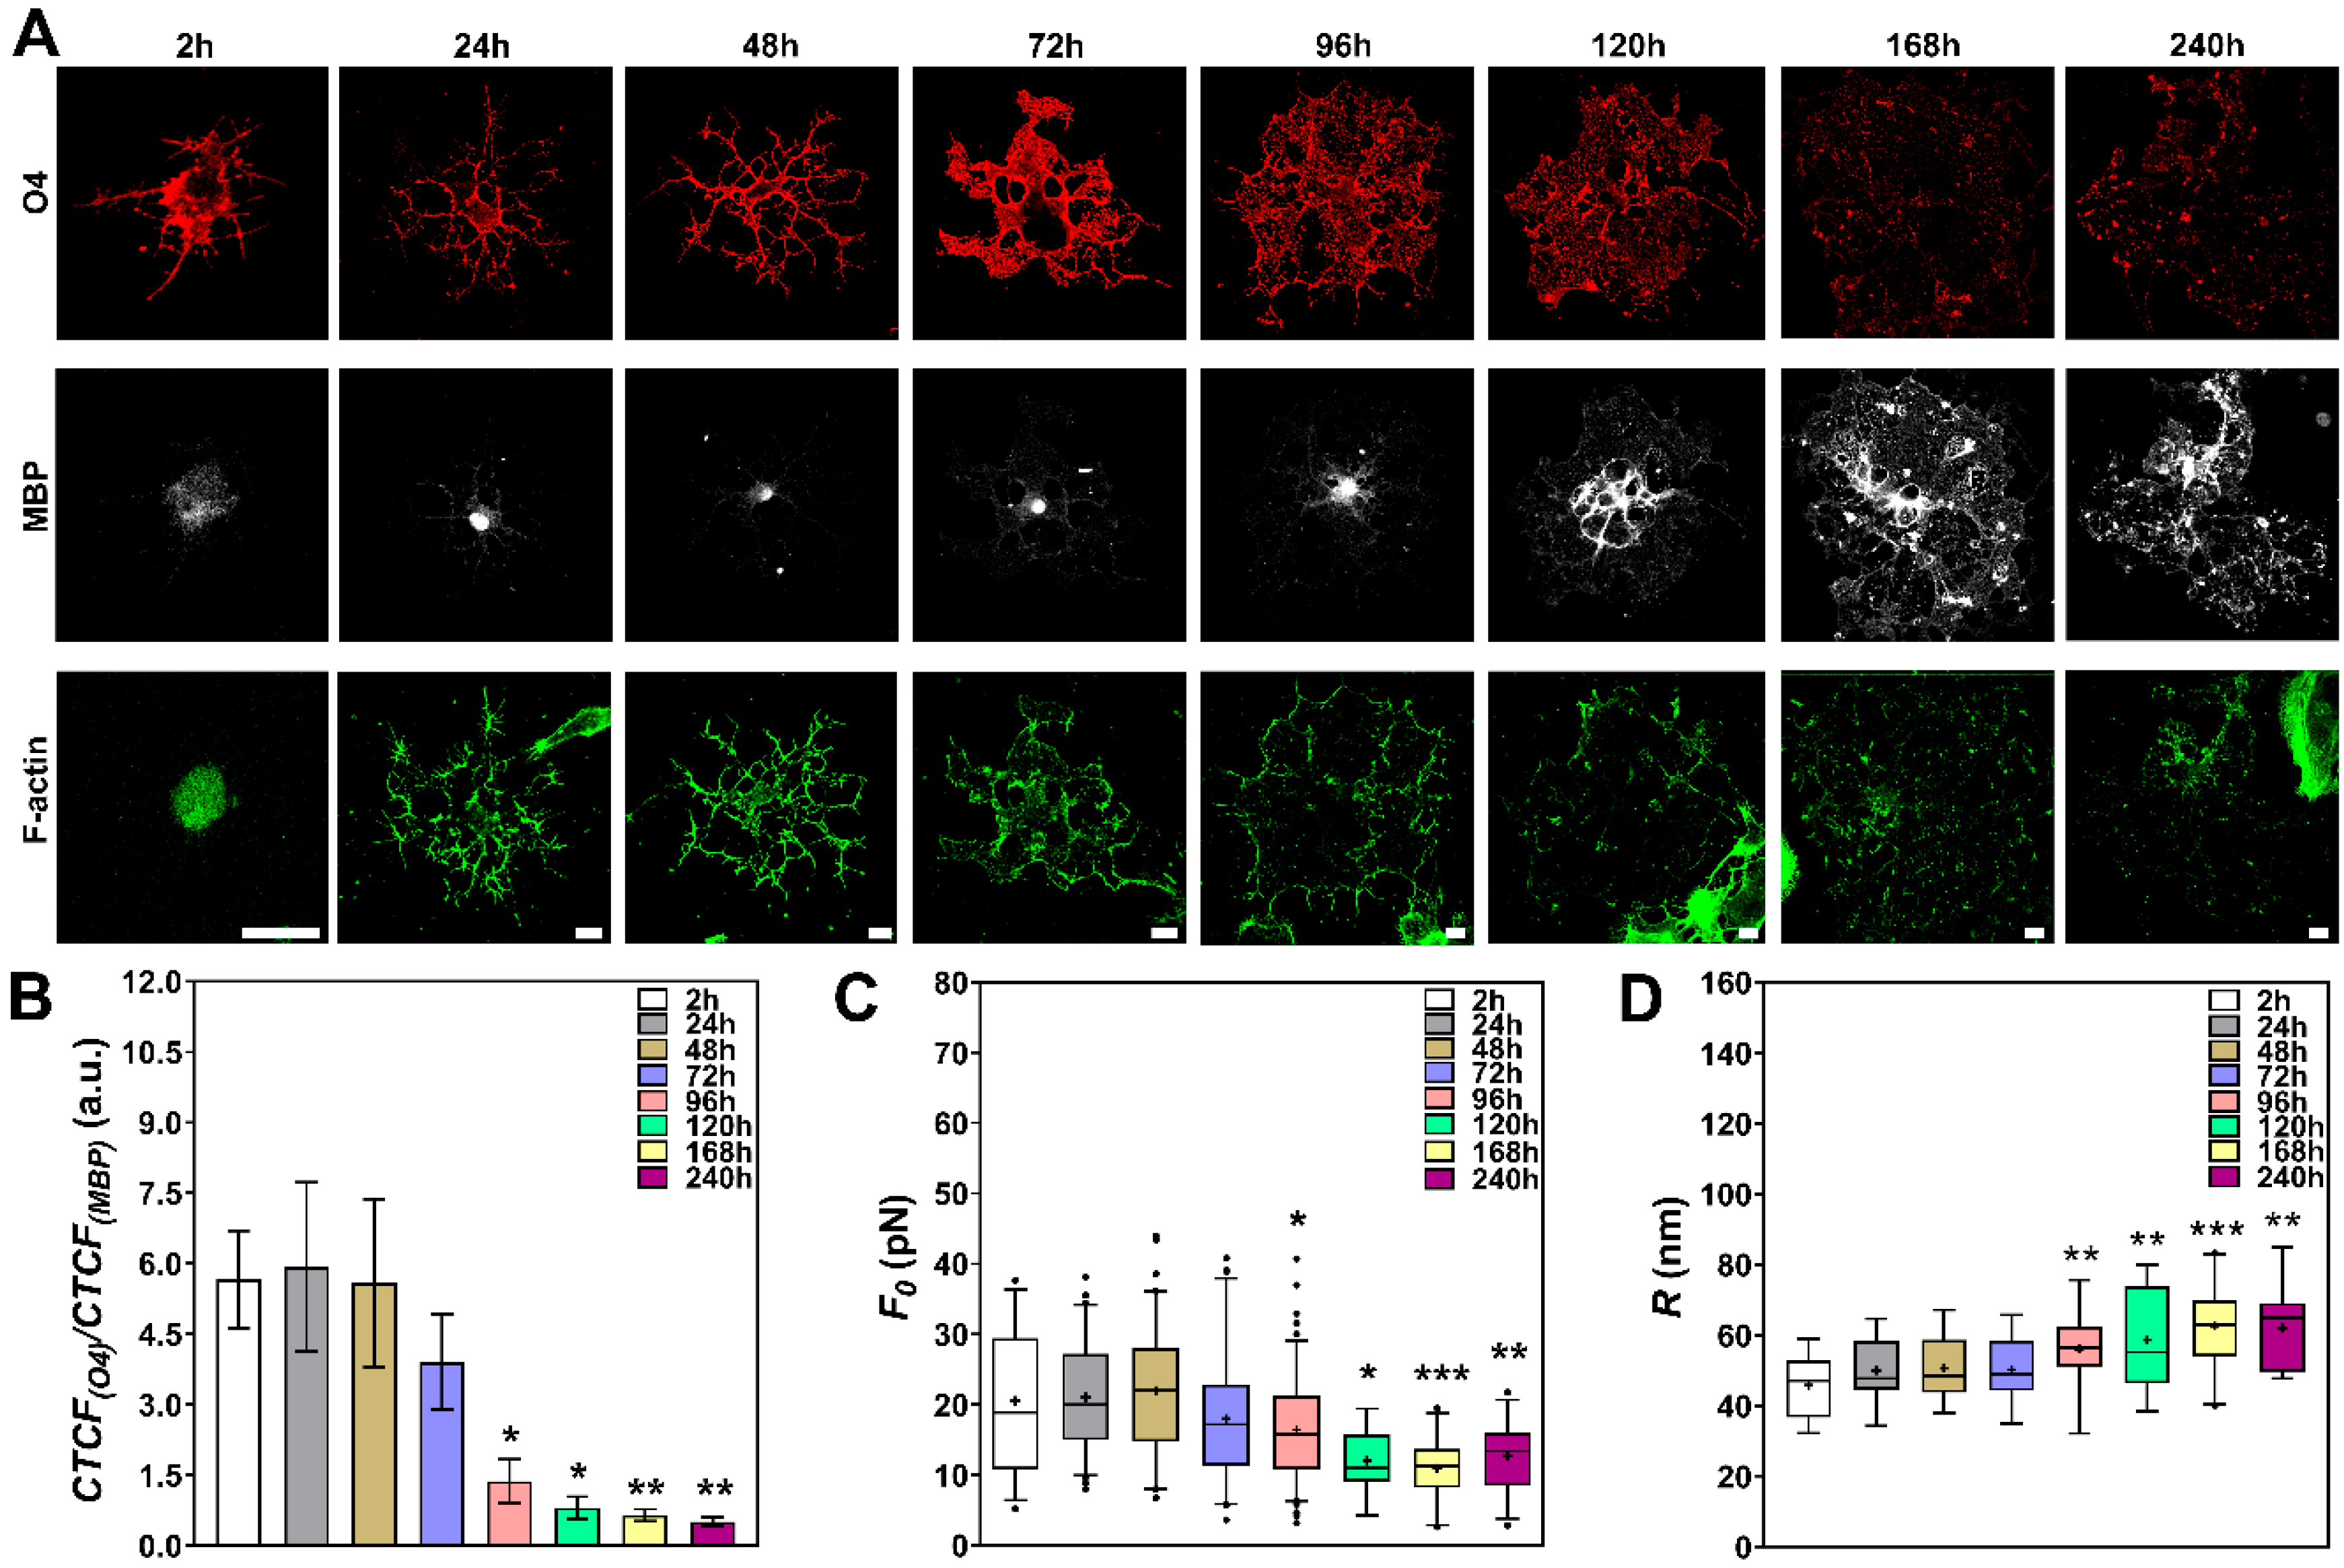
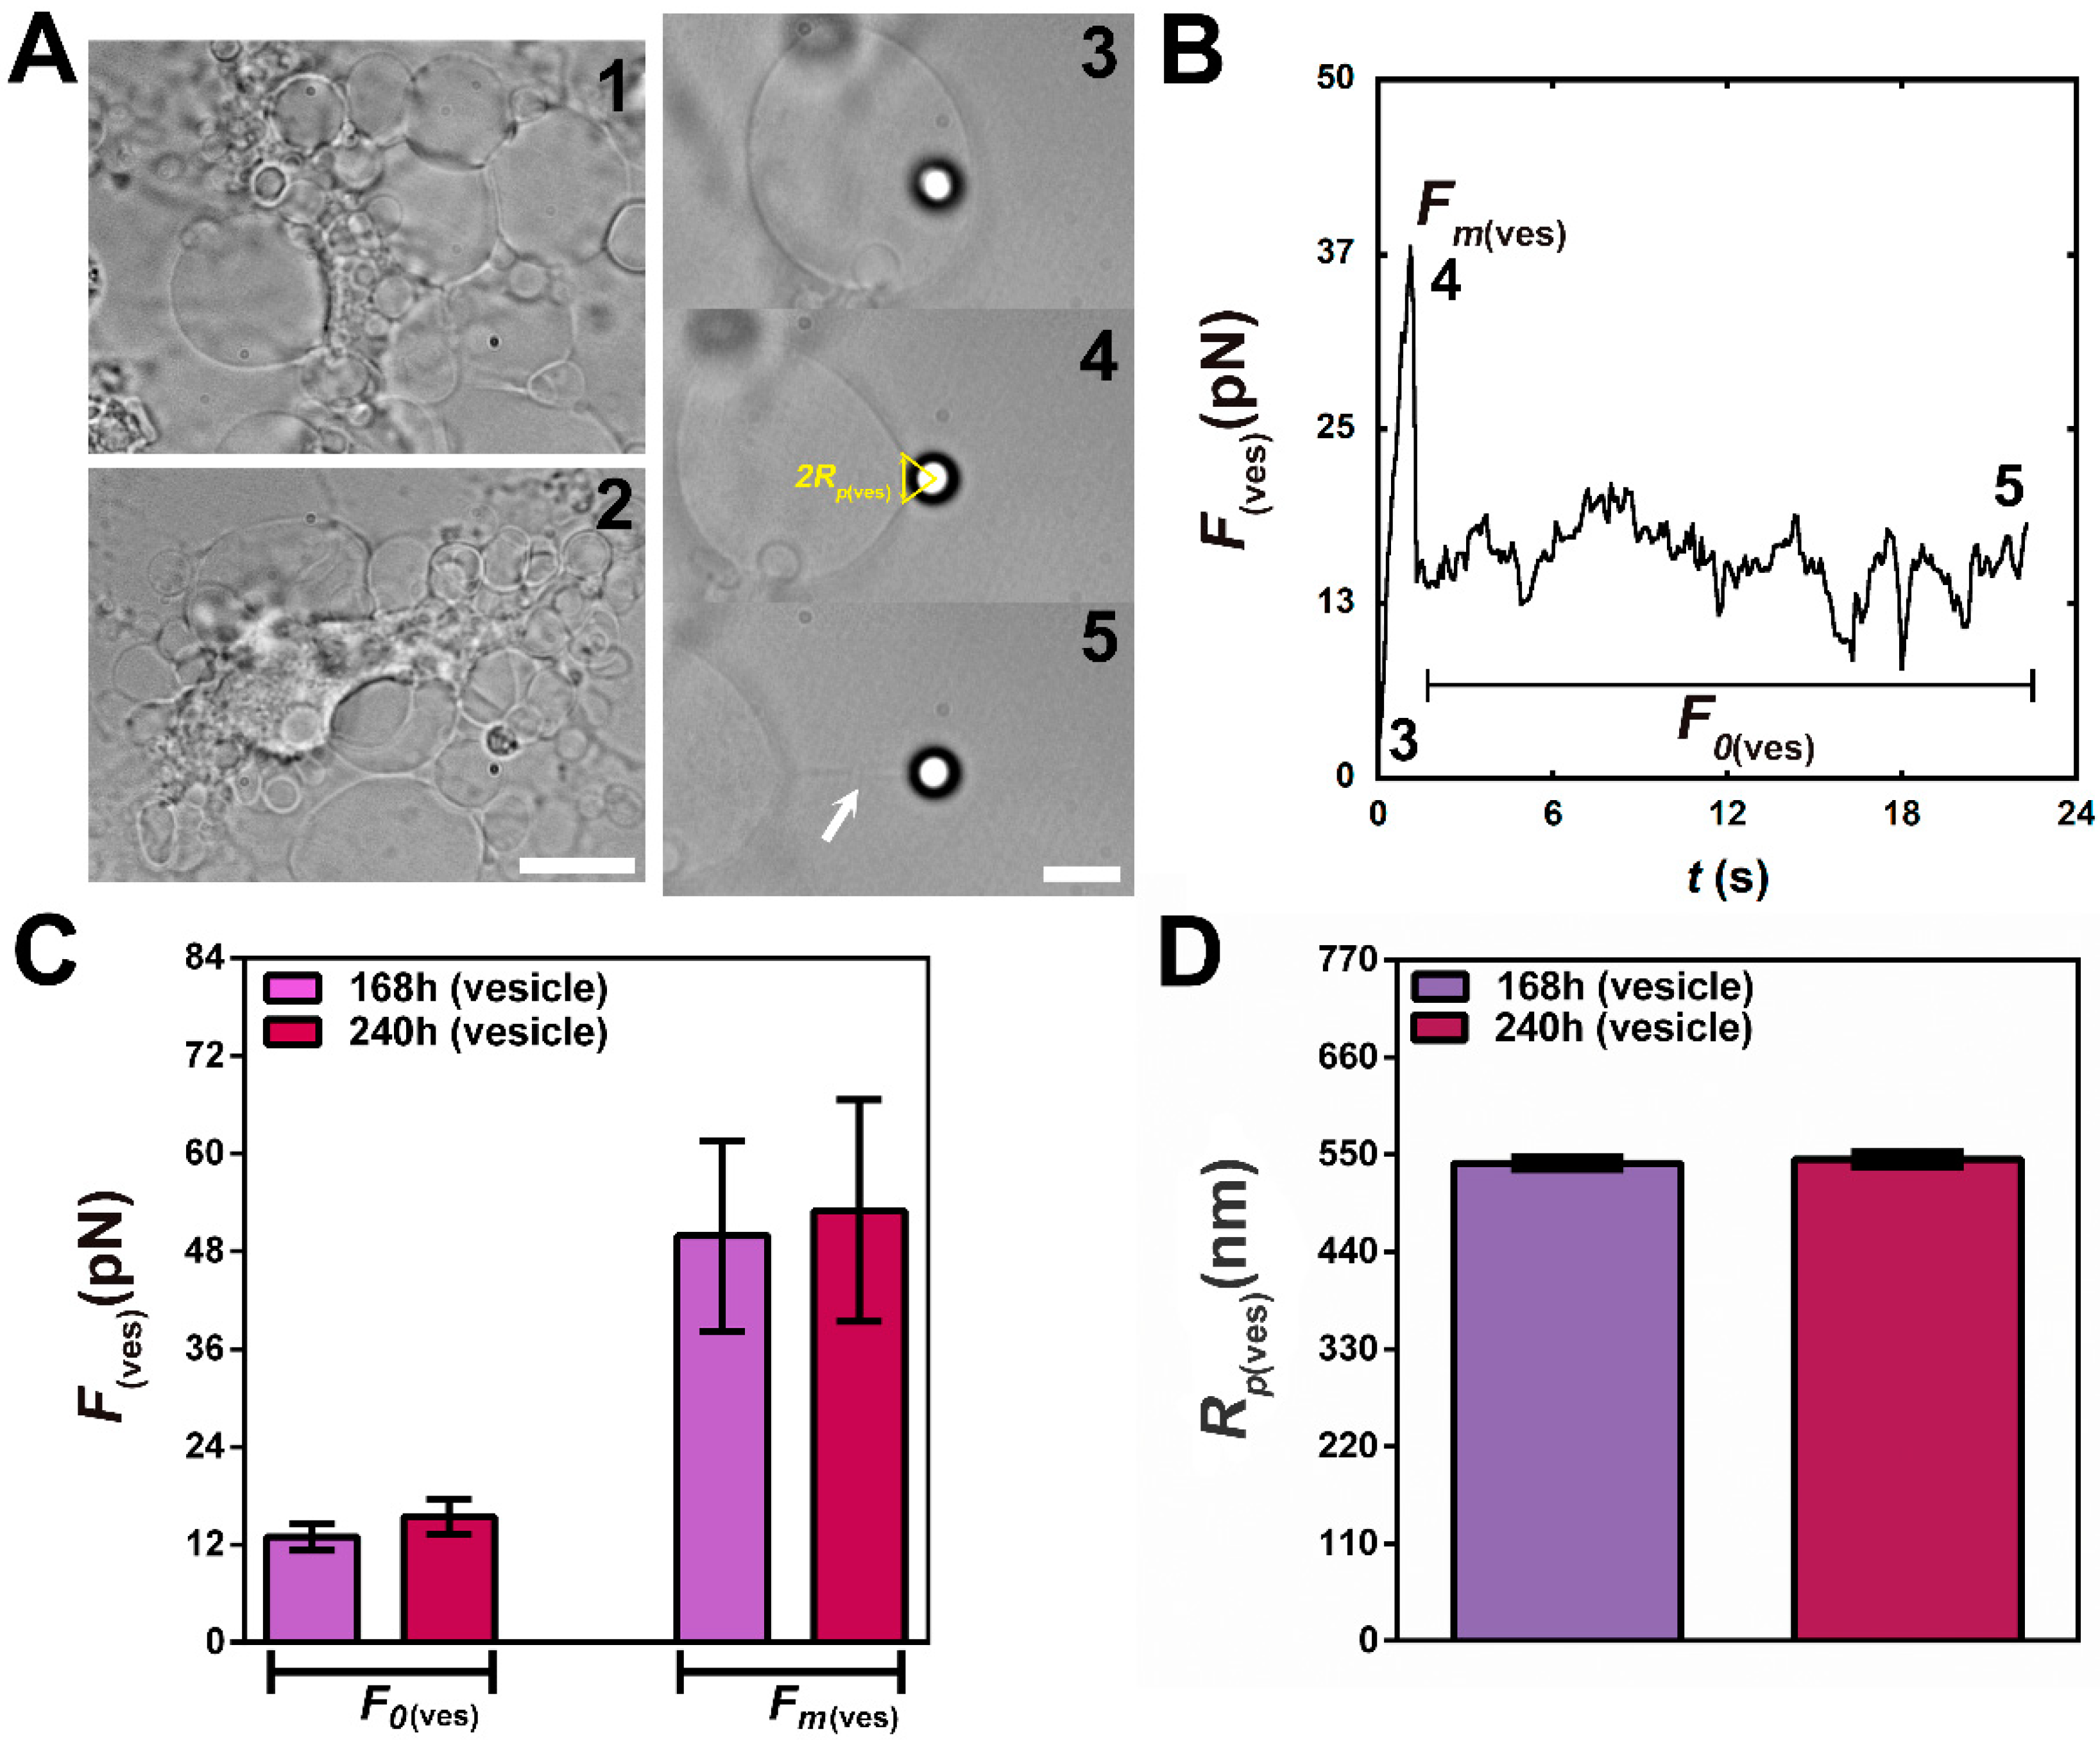
3.5. The Differentiation Process for Oligodendrocytes Reveals Interesting Patterns that Correlate Cytoskeletal Remodeling and Expression of Specific Markers with Changes in CM Elastic Properties
4. Discussion
Supplementary Materials
Author Contributions
Acknowledgments
Conflicts of Interest
References
- Chugh, P.; Paluch, E.K. The actin cortex at a glance. J. Cell Sci. 2018, 131, jcs186254. [Google Scholar] [CrossRef] [PubMed] [Green Version]
- Salbreux, G.; Charras, G.; Paluch, E. Actin cortex mechanics and cellular morphogenesis. Trends Cell Biol 2012, 22, 536–545. [Google Scholar] [CrossRef] [PubMed]
- Kusumi, A.; Fujiwara, T.K.; Chadda, R.; Xie, M.; Tsunoyama, T.A.; Kalay, Z.; Kasai, R.S.; Suzuki, K.G. Dynamic organizing principles of the plasma membrane that regulate signal transduction: Commemorating the fortieth anniversary of Singer and Nicolson’s fluid-mosaic model. Ann. Rev. Cell Dev. Biol. 2012, 28, 215–250. [Google Scholar] [CrossRef] [PubMed]
- Bassereau, P.; Jin, R.; Baumgart, T.; Deserno, M.; Dimova, R.; Frolov, V.A.; Bashkirov, P.V.; Grubmuller, H.; Jahn, R.; Risselada, H.J.; et al. The 2018 biomembrane curvature and remodeling roadmap. J. Phys. D Appl. Phys. 2018, 51. [Google Scholar] [CrossRef] [PubMed]
- Moeendarbary, E.; Harris, A.R. Cell mechanics: Principles, practices, and prospects. Wiley Interdiscip. Rev. Syst. Biol. Med. 2014, 6, 371–388. [Google Scholar] [CrossRef] [PubMed]
- Dai, J.; Sheetz, M.P. Mechanical properties of neuronal growth cone membranes studied by tether formation with laser optical tweezers. Biophys. J. 1995, 68, 988–996. [Google Scholar] [CrossRef] [Green Version]
- Pontes, B.; Viana, N.B.; Salgado, L.T.; Farina, M.; Moura Neto, V.; Nussenzveig, H.M. Cell cytoskeleton and tether extraction. Biophys. J. 2011, 101, 43–52. [Google Scholar] [CrossRef] [Green Version]
- Diz-Munoz, A.; Thurley, K.; Chintamen, S.; Altschuler, S.J.; Wu, L.F.; Fletcher, D.A.; Weiner, O.D. Membrane tension acts through PLD2 and mTORC2 to limit actin network assembly during neutrophil migration. PLoS Biol. 2016, 14, e1002474. [Google Scholar] [CrossRef] [Green Version]
- Pietuch, A.; Janshoff, A. Mechanics of spreading cells probed by atomic force microscopy. Open Biol. 2013, 3, 130084. [Google Scholar] [CrossRef] [Green Version]
- Ayala, Y.A.; Pontes, B.; Hissa, B.; Monteiro, A.C.; Farina, M.; Moura-Neto, V.; Viana, N.B.; Nussenzveig, H.M. Effects of cytoskeletal drugs on actin cortex elasticity. Exp. Cell Res. 2017, 351, 173–181. [Google Scholar] [CrossRef]
- Hissa, B.; Oakes, P.W.; Pontes, B.; Ramirez-San Juan, G.; Gardel, M.L. Cholesterol depletion impairs contractile machinery in neonatal rat cardiomyocytes. Sci. Rep. 2017, 7, 43764. [Google Scholar] [CrossRef] [PubMed] [Green Version]
- Hissa, B.; Pontes, B.; Roma, P.M.; Alves, A.P.; Rocha, C.D.; Valverde, T.M.; Aguiar, P.H.; Almeida, F.P.; Guimaraes, A.J.; Guatimosim, C.; et al. Membrane cholesterol removal changes mechanical properties of cells and induces secretion of a specific pool of lysosomes. PLoS ONE 2013, 8, e82988. [Google Scholar] [CrossRef] [PubMed] [Green Version]
- Pontes, B.; Ayala, Y.; Fonseca, A.C.; Romao, L.F.; Amaral, R.F.; Salgado, L.T.; Lima, F.R.; Farina, M.; Viana, N.B.; Moura-Neto, V.; et al. Membrane elastic properties and cell function. PLoS ONE 2013, 8, e67708. [Google Scholar] [CrossRef] [PubMed] [Green Version]
- Pontes, B.; Monzo, P.; Gauthier, N.C. Membrane tension: A challenging but universal physical parameter in cell biology. Semin. Cell Dev. Biol. 2017, 71, 30–41. [Google Scholar] [CrossRef] [PubMed]
- Pontes, B.; Monzo, P.; Gole, L.; Le Roux, A.L.; Kosmalska, A.J.; Tam, Z.Y.; Luo, W.; Kan, S.; Viasnoff, V.; Roca-Cusachs, P.; et al. Membrane tension controls adhesion positioning at the leading edge of cells. J. Cell Biol. 2017, 216, 2959–2977. [Google Scholar] [CrossRef] [Green Version]
- Gauthier, N.C.; Masters, T.A.; Sheetz, M.P. Mechanical feedback between membrane tension and dynamics. Trends Cell Biol 2012, 22, 527–535. [Google Scholar] [CrossRef]
- Gotz, M.; Huttner, W.B. The cell biology of neurogenesis. Nat. Rev. Mol. Cell Biol 2005, 6, 777–788. [Google Scholar] [CrossRef]
- Chklovskii, D.B. Synaptic connectivity and neuronal morphology: Two sides of the same coin. Neuron 2004, 43, 609–617. [Google Scholar] [CrossRef] [Green Version]
- Theodosis, D.T.; Poulain, D.A.; Oliet, S.H. Activity-dependent structural and functional plasticity of astrocyte-neuron interactions. Physiol. Rev. 2008, 88, 983–1008. [Google Scholar] [CrossRef] [Green Version]
- Baumann, N.; Pham-Dinh, D. Biology of oligodendrocyte and myelin in the mammalian central nervous system. Physiol. Rev. 2001, 81, 871–927. [Google Scholar] [CrossRef]
- Guillemot, F. Spatial and temporal specification of neural fates by transcription factor codes. Development 2007, 134, 3771–3780. [Google Scholar] [CrossRef] [PubMed] [Green Version]
- Gurok, U.; Steinhoff, C.; Lipkowitz, B.; Ropers, H.H.; Scharff, C.; Nuber, U.A. Gene expression changes in the course of neural progenitor cell differentiation. J. Neurosci. 2004, 24, 5982–6002. [Google Scholar] [CrossRef] [PubMed] [Green Version]
- Azari, H.; Sharififar, S.; Rahman, M.; Ansari, S.; Reynolds, B.A. Establishing embryonic mouse neural stem cell culture using the neurosphere assay. J. Vis. Exp. 2011, 47, e2457. [Google Scholar] [CrossRef] [PubMed] [Green Version]
- Boudaoud, A.; Burian, A.; Borowska-Wykret, D.; Uyttewaal, M.; Wrzalik, R.; Kwiatkowska, D.; Hamant, O. FibrilTool, an ImageJ plug-in to quantify fibrillar structures in raw microscopy images. Nat. Protoc. 2014, 9, 457–463. [Google Scholar] [CrossRef]
- Ayala, Y.A.; Pontes, B.; Ether, D.S.; Pires, L.B.; Araujo, G.R.; Frases, S.; Romao, L.F.; Farina, M.; Moura-Neto, V.; Viana, N.B.; et al. Rheological properties of cells measured by optical tweezers. BMC Biophys. 2016, 9, 5. [Google Scholar] [CrossRef] [Green Version]
- Ether, D.S.; Pires, L.B.; Umrath, S.; Martinez, D.; Ayala, Y.; Pontes, B.; de S. Araújo, G.R.; Frases, S.; Ingold, G.L.; Rosa, F.S.S.; et al. Probing the Casimir force with optical tweezers. EPL (Eur. Phys. Lett.) 2015, 112, 44001. [Google Scholar] [CrossRef] [Green Version]
- Koster, G.; Cacciuto, A.; Derenyi, I.; Frenkel, D.; Dogterom, M. Force barriers for membrane tube formation. Phys. Rev. Lett. 2005, 94, 068101. [Google Scholar] [CrossRef] [Green Version]
- Derenyi, I.; Julicher, F.; Prost, J. Formation and interaction of membrane tubes. Phys. Rev. Lett. 2002, 88, 238101. [Google Scholar] [CrossRef] [Green Version]
- Powers, T.R.; Huber, G.; Goldstein, R.E. Fluid-membrane tethers: Minimal surfaces and elastic boundary layers. Phys. Rev. EStat. NonlinearSoft Matter Phys. 2002, 65, 041901. [Google Scholar] [CrossRef] [Green Version]
- Hartfuss, E.; Galli, R.; Heins, N.; Gotz, M. Characterization of CNS precursor subtypes and radial glia. Dev. Biol. 2001, 229, 15–30. [Google Scholar] [CrossRef] [Green Version]
- Jacque, C.M.; Vinner, C.; Kujas, M.; Raoul, M.; Racadot, J.; Baumann, N.A. Determination of glial fibrillary acidic protein (GFAP) in human brain tumors. J. Neurol. Sci. 1978, 35, 147–155. [Google Scholar] [CrossRef]
- Kuhn, S.; Gritti, L.; Crooks, D.; Dombrowski, Y. Oligodendrocytes in development, myelin generation and beyond. Cells 2019, 8, 1424. [Google Scholar] [CrossRef] [PubMed] [Green Version]
- Azevedo, M.M.; Domingues, H.S.; Cordelieres, F.P.; Sampaio, P.; Seixas, A.I.; Relvas, J.B. Jmy regulates oligodendrocyte differentiation via modulation of actin cytoskeleton dynamics. Glia 2018, 66, 1826–1844. [Google Scholar] [CrossRef] [PubMed]
- Nawaz, S.; Sanchez, P.; Schmitt, S.; Snaidero, N.; Mitkovski, M.; Velte, C.; Bruckner, B.R.; Alexopoulos, I.; Czopka, T.; Jung, S.Y.; et al. Actin filament turnover drives leading edge growth during myelin sheath formation in the central nervous system. Dev. Cell 2015, 34, 139–151. [Google Scholar] [CrossRef] [PubMed] [Green Version]
- Zuchero, J.B.; Fu, M.M.; Sloan, S.A.; Ibrahim, A.; Olson, A.; Zaremba, A.; Dugas, J.C.; Wienbar, S.; Caprariello, A.V.; Kantor, C.; et al. CNS myelin wrapping is driven by actin disassembly. Dev. Cell 2015, 34, 152–167. [Google Scholar] [CrossRef] [Green Version]
- Kuhlmann-Krieg, S.; Sommer, I.; Schachner, M. Ultrastructural features of cultured oligodendrocytes expressing stage-specific cell-surface antigens. Brain Res. 1988, 467, 269–280. [Google Scholar] [CrossRef]
- Diz-Munoz, A.; Fletcher, D.A.; Weiner, O.D. Use the force: Membrane tension as an organizer of cell shape and motility. Trends Cell Biol. 2013, 23, 47–53. [Google Scholar] [CrossRef] [Green Version]
- Sens, P.; Plastino, J. Membrane tension and cytoskeleton organization in cell motility. J. Phys. Condens. Matter 2015, 27, 273103. [Google Scholar] [CrossRef]
- Shi, Z.; Graber, Z.T.; Baumgart, T.; Stone, H.A.; Cohen, A.E. Cell membranes resist flow. Cell 2018, 175, 1769–1779.e1713. [Google Scholar] [CrossRef] [Green Version]
- Hochmuth, F.M.; Shao, J.Y.; Dai, J.; Sheetz, M.P. Deformation and flow of membrane into tethers extracted from neuronal growth cones. Biophys. J. 1996, 70, 358–369. [Google Scholar] [CrossRef] [Green Version]
- Betz, T.; Sykes, C. Time resolved membrane fluctuation spectroscopy. Soft Matter 2012, 8, 5317–5326. [Google Scholar] [CrossRef]
- Colom, A.; Derivery, E.; Soleimanpour, S.; Tomba, C.; Molin, M.D.; Sakai, N.; Gonzalez-Gaitan, M.; Matile, S.; Roux, A. A fluorescent membrane tension probe. Nat. Chem 2018, 10, 1118–1125. [Google Scholar] [CrossRef] [PubMed]
- Titushkin, I.; Cho, M. Distinct membrane mechanical properties of human mesenchymal stem cells determined using laser optical tweezers. Biophys. J. 2006, 90, 2582–2591. [Google Scholar] [CrossRef] [PubMed] [Green Version]
- Titushkin, I.; Cho, M. Modulation of cellular mechanics during osteogenic differentiation of human mesenchymal stem cells. Biophys. J. 2007, 93, 3693–3702. [Google Scholar] [CrossRef] [PubMed] [Green Version]
- Bergert, M.; Lembo, S.; Milovanović, D.; Börmel, M.; Neveu, P.; Diz-Muñoz, A. Cell surface mechanics gate stem cell differentiation. bioRxiv 2019, 798918. [Google Scholar] [CrossRef] [Green Version]
- De Belly, H.; Jones, P.H.; Paluch, E.K.; Chalut, K.J. Membrane tension mediated mechanotransduction drives fate choice in embryonic stem cells. bioRxiv 2019, 798959. [Google Scholar] [CrossRef] [Green Version]
- Mahajan, G.; Lee, M.Y.; Kothapalli, C. Biophysical and biomechanical properties of neural progenitor cells as indicators of developmental neurotoxicity. Arch. Toxicol 2019, 93, 2979–2992. [Google Scholar] [CrossRef]
- Xia, S.; Lim, Y.B.; Zhang, Z.; Wang, Y.; Zhang, S.; Lim, C.T.; Yim, E.K.F.; Kanchanawong, P. Nanoscale architecture of the cortical actin cytoskeleton in embryonic stem cells. Cell Rep. 2019, 28, 1251–1267.e1257. [Google Scholar] [CrossRef] [Green Version]
- Pajerowski, J.D.; Dahl, K.N.; Zhong, F.L.; Sammak, P.J.; Discher, D.E. Physical plasticity of the nucleus in stem cell differentiation. Proc. Natl. Acad. Sci. USA 2007, 104, 15619–15624. [Google Scholar] [CrossRef]
- Berg, D.A.; Su, Y.; Jimenez-Cyrus, D.; Patel, A.; Huang, N.; Morizet, D.; Lee, S.; Shah, R.; Ringeling, F.R.; Jain, R.; et al. A Common embryonic origin of stem cells drives developmental and adult neurogenesis. Cell 2019, 177, 654–668.e615. [Google Scholar] [CrossRef] [Green Version]
- Gauthier, N.C.; Rossier, O.M.; Mathur, A.; Hone, J.C.; Sheetz, M.P. Plasma membrane area increases with spread area by exocytosis of a GPI-anchored protein compartment. Mol. Biol Cell 2009, 20, 3261–3272. [Google Scholar] [CrossRef] [PubMed] [Green Version]
- Elmore, S. Apoptosis: A review of programmed cell death. Toxicol. Pathol. 2007, 35, 495–516. [Google Scholar] [CrossRef] [PubMed]
- Caruso, S.; Poon, I.K.H. Apoptotic cell-derived extracellular vesicles: More than just debris. Front. Immunol. 2018, 9, 1486. [Google Scholar] [CrossRef] [PubMed] [Green Version]


© 2020 by the authors. Licensee MDPI, Basel, Switzerland. This article is an open access article distributed under the terms and conditions of the Creative Commons Attribution (CC BY) license (http://creativecommons.org/licenses/by/4.0/).
Share and Cite
Soares, J.; Araujo, G.R.d.S.; Santana, C.; Matias, D.; Moura-Neto, V.; Farina, M.; Frases, S.; Viana, N.B.; Romão, L.; Nussenzveig, H.M.; et al. Membrane Elastic Properties during Neural Precursor Cell Differentiation. Cells 2020, 9, 1323. https://doi.org/10.3390/cells9061323
Soares J, Araujo GRdS, Santana C, Matias D, Moura-Neto V, Farina M, Frases S, Viana NB, Romão L, Nussenzveig HM, et al. Membrane Elastic Properties during Neural Precursor Cell Differentiation. Cells. 2020; 9(6):1323. https://doi.org/10.3390/cells9061323
Chicago/Turabian StyleSoares, Juliana, Glauber R. de S. Araujo, Cintia Santana, Diana Matias, Vivaldo Moura-Neto, Marcos Farina, Susana Frases, Nathan B. Viana, Luciana Romão, H. Moysés Nussenzveig, and et al. 2020. "Membrane Elastic Properties during Neural Precursor Cell Differentiation" Cells 9, no. 6: 1323. https://doi.org/10.3390/cells9061323