Cell Theranostics on Mesoporous Silicon Substrates

 , , , , , and
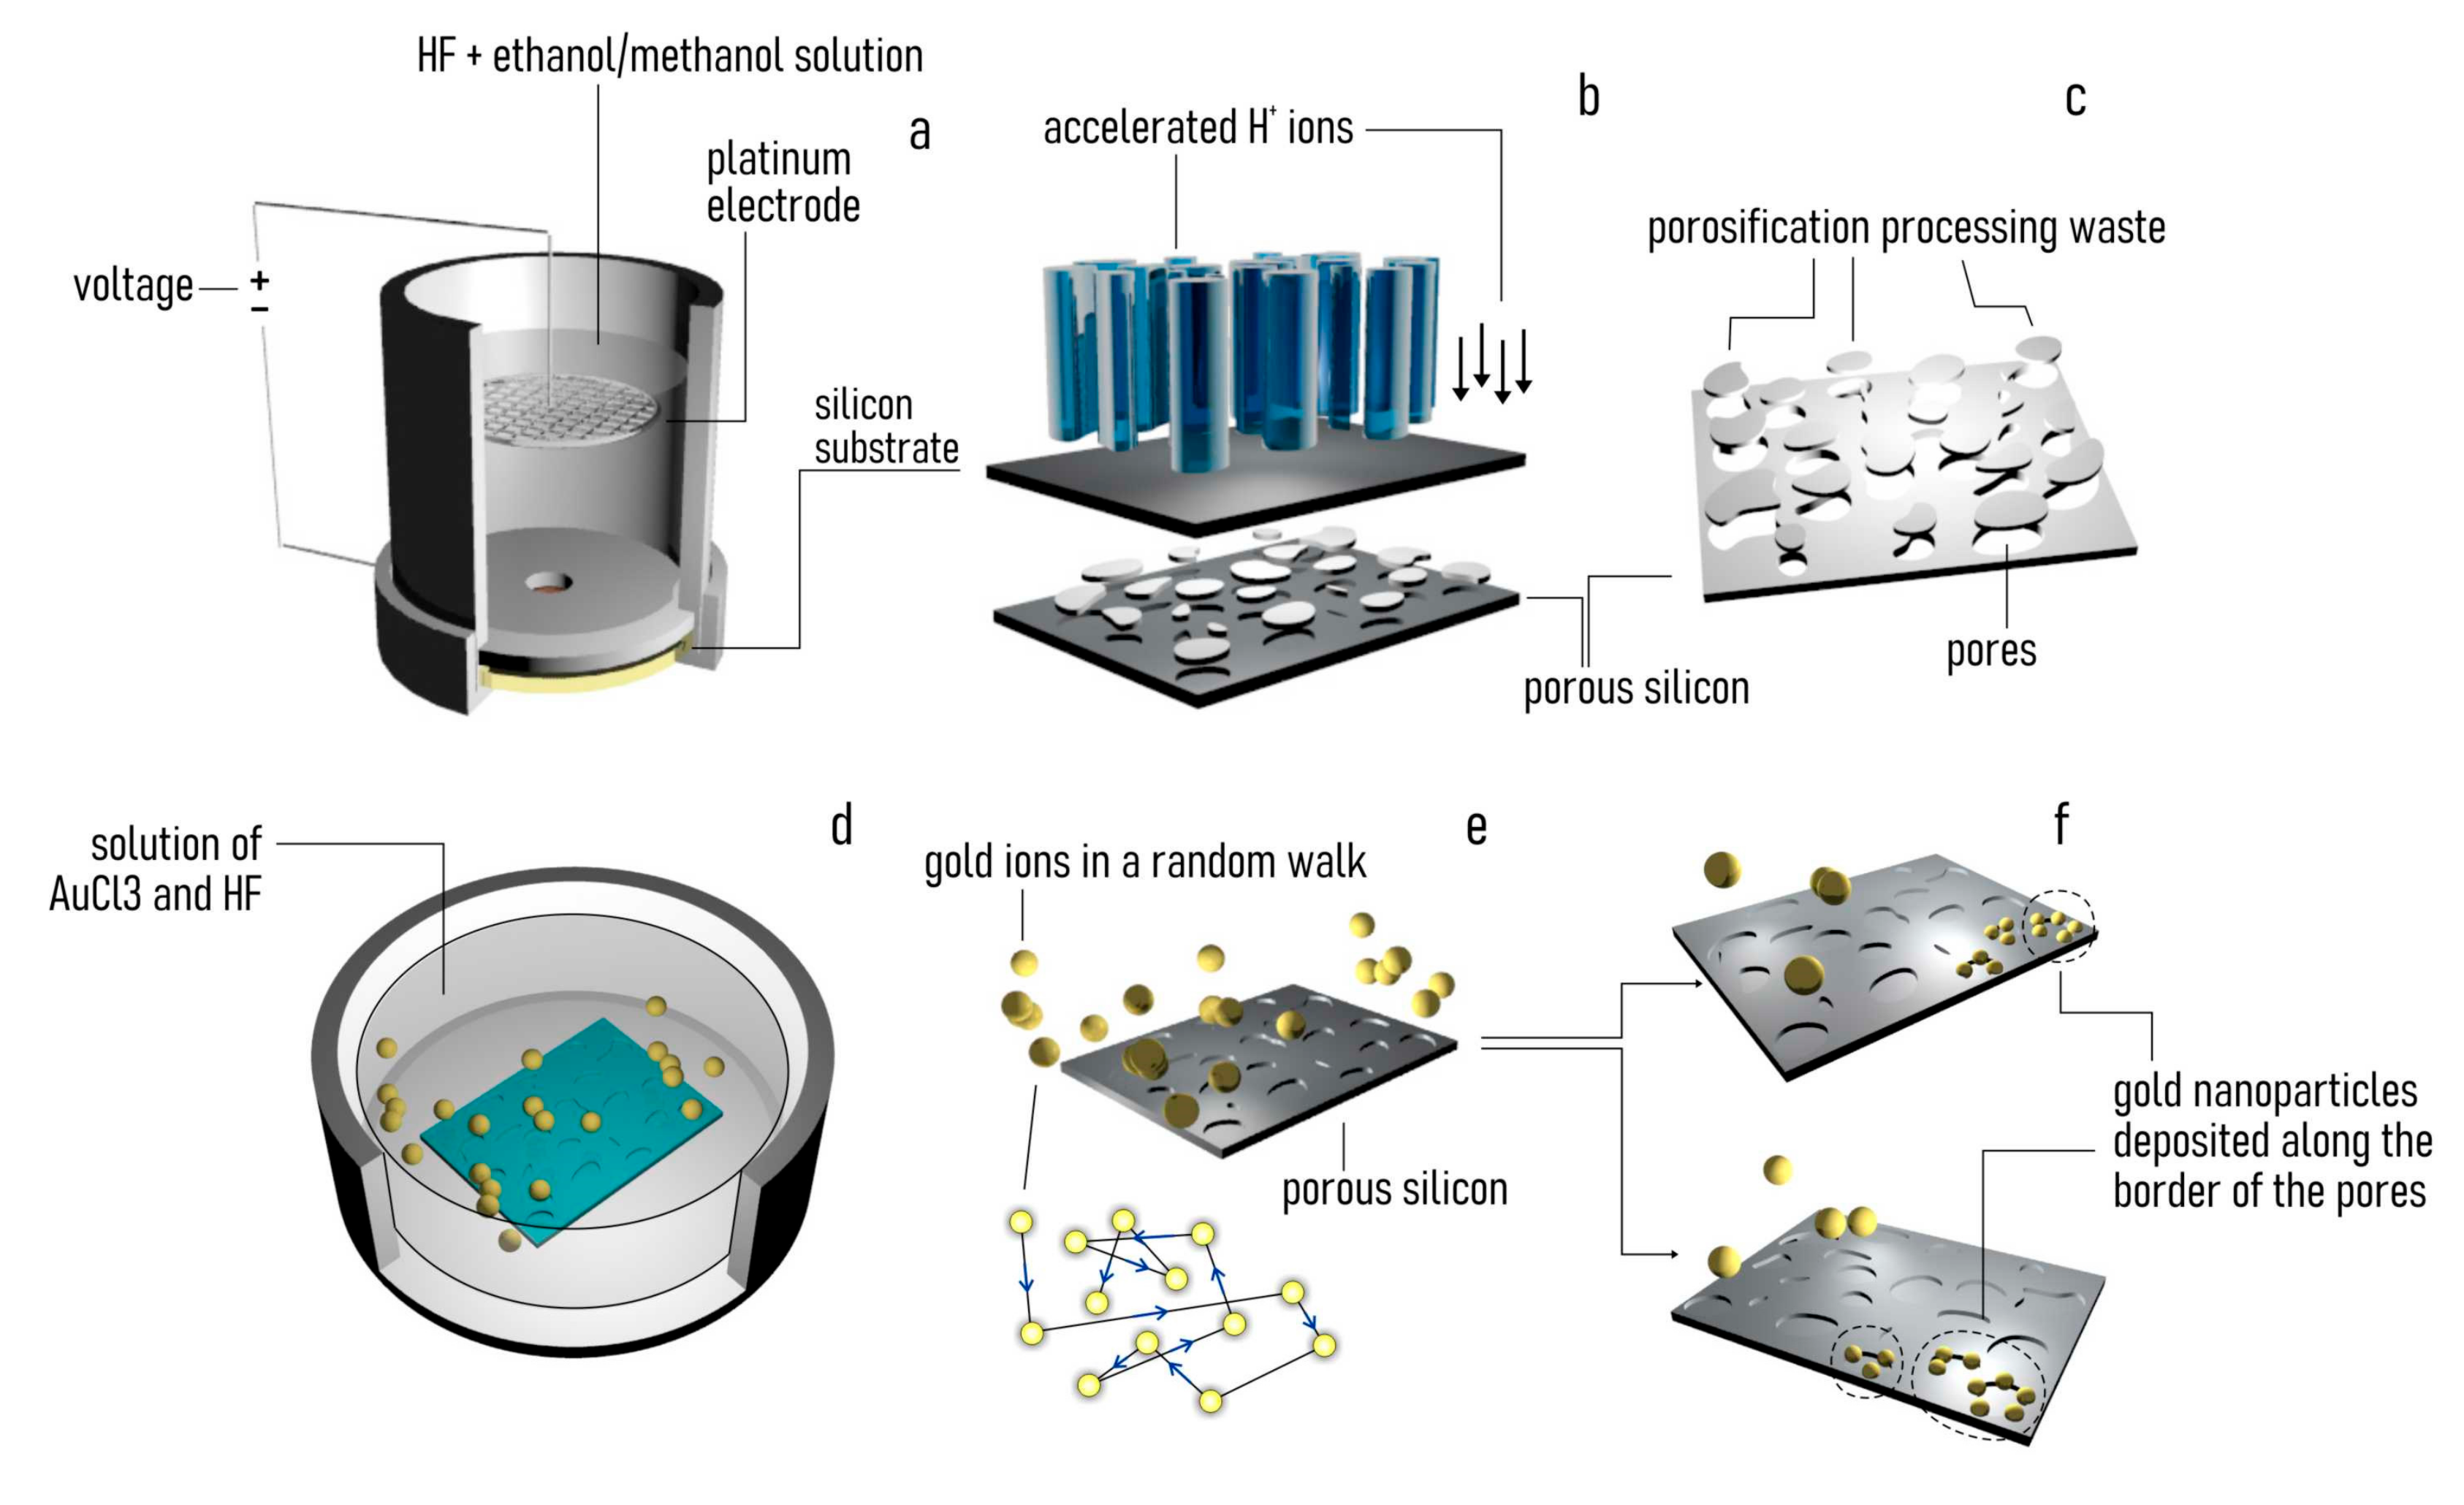
Abstract
:1. Introduction
2. Methods
2.1. Fabrication of Mesoporous Silicon Surfaces
2.2. Electroless Deposition of Gold Nanoparticles Clusters
2.3. SEM Sample Characterization
2.4. AFM Sample Characterization
2.5. Contact Angle Characterization of Samples
2.6. MCF-7 Cell Culture and Staining
2.7. Imaging Cells on the Substrates
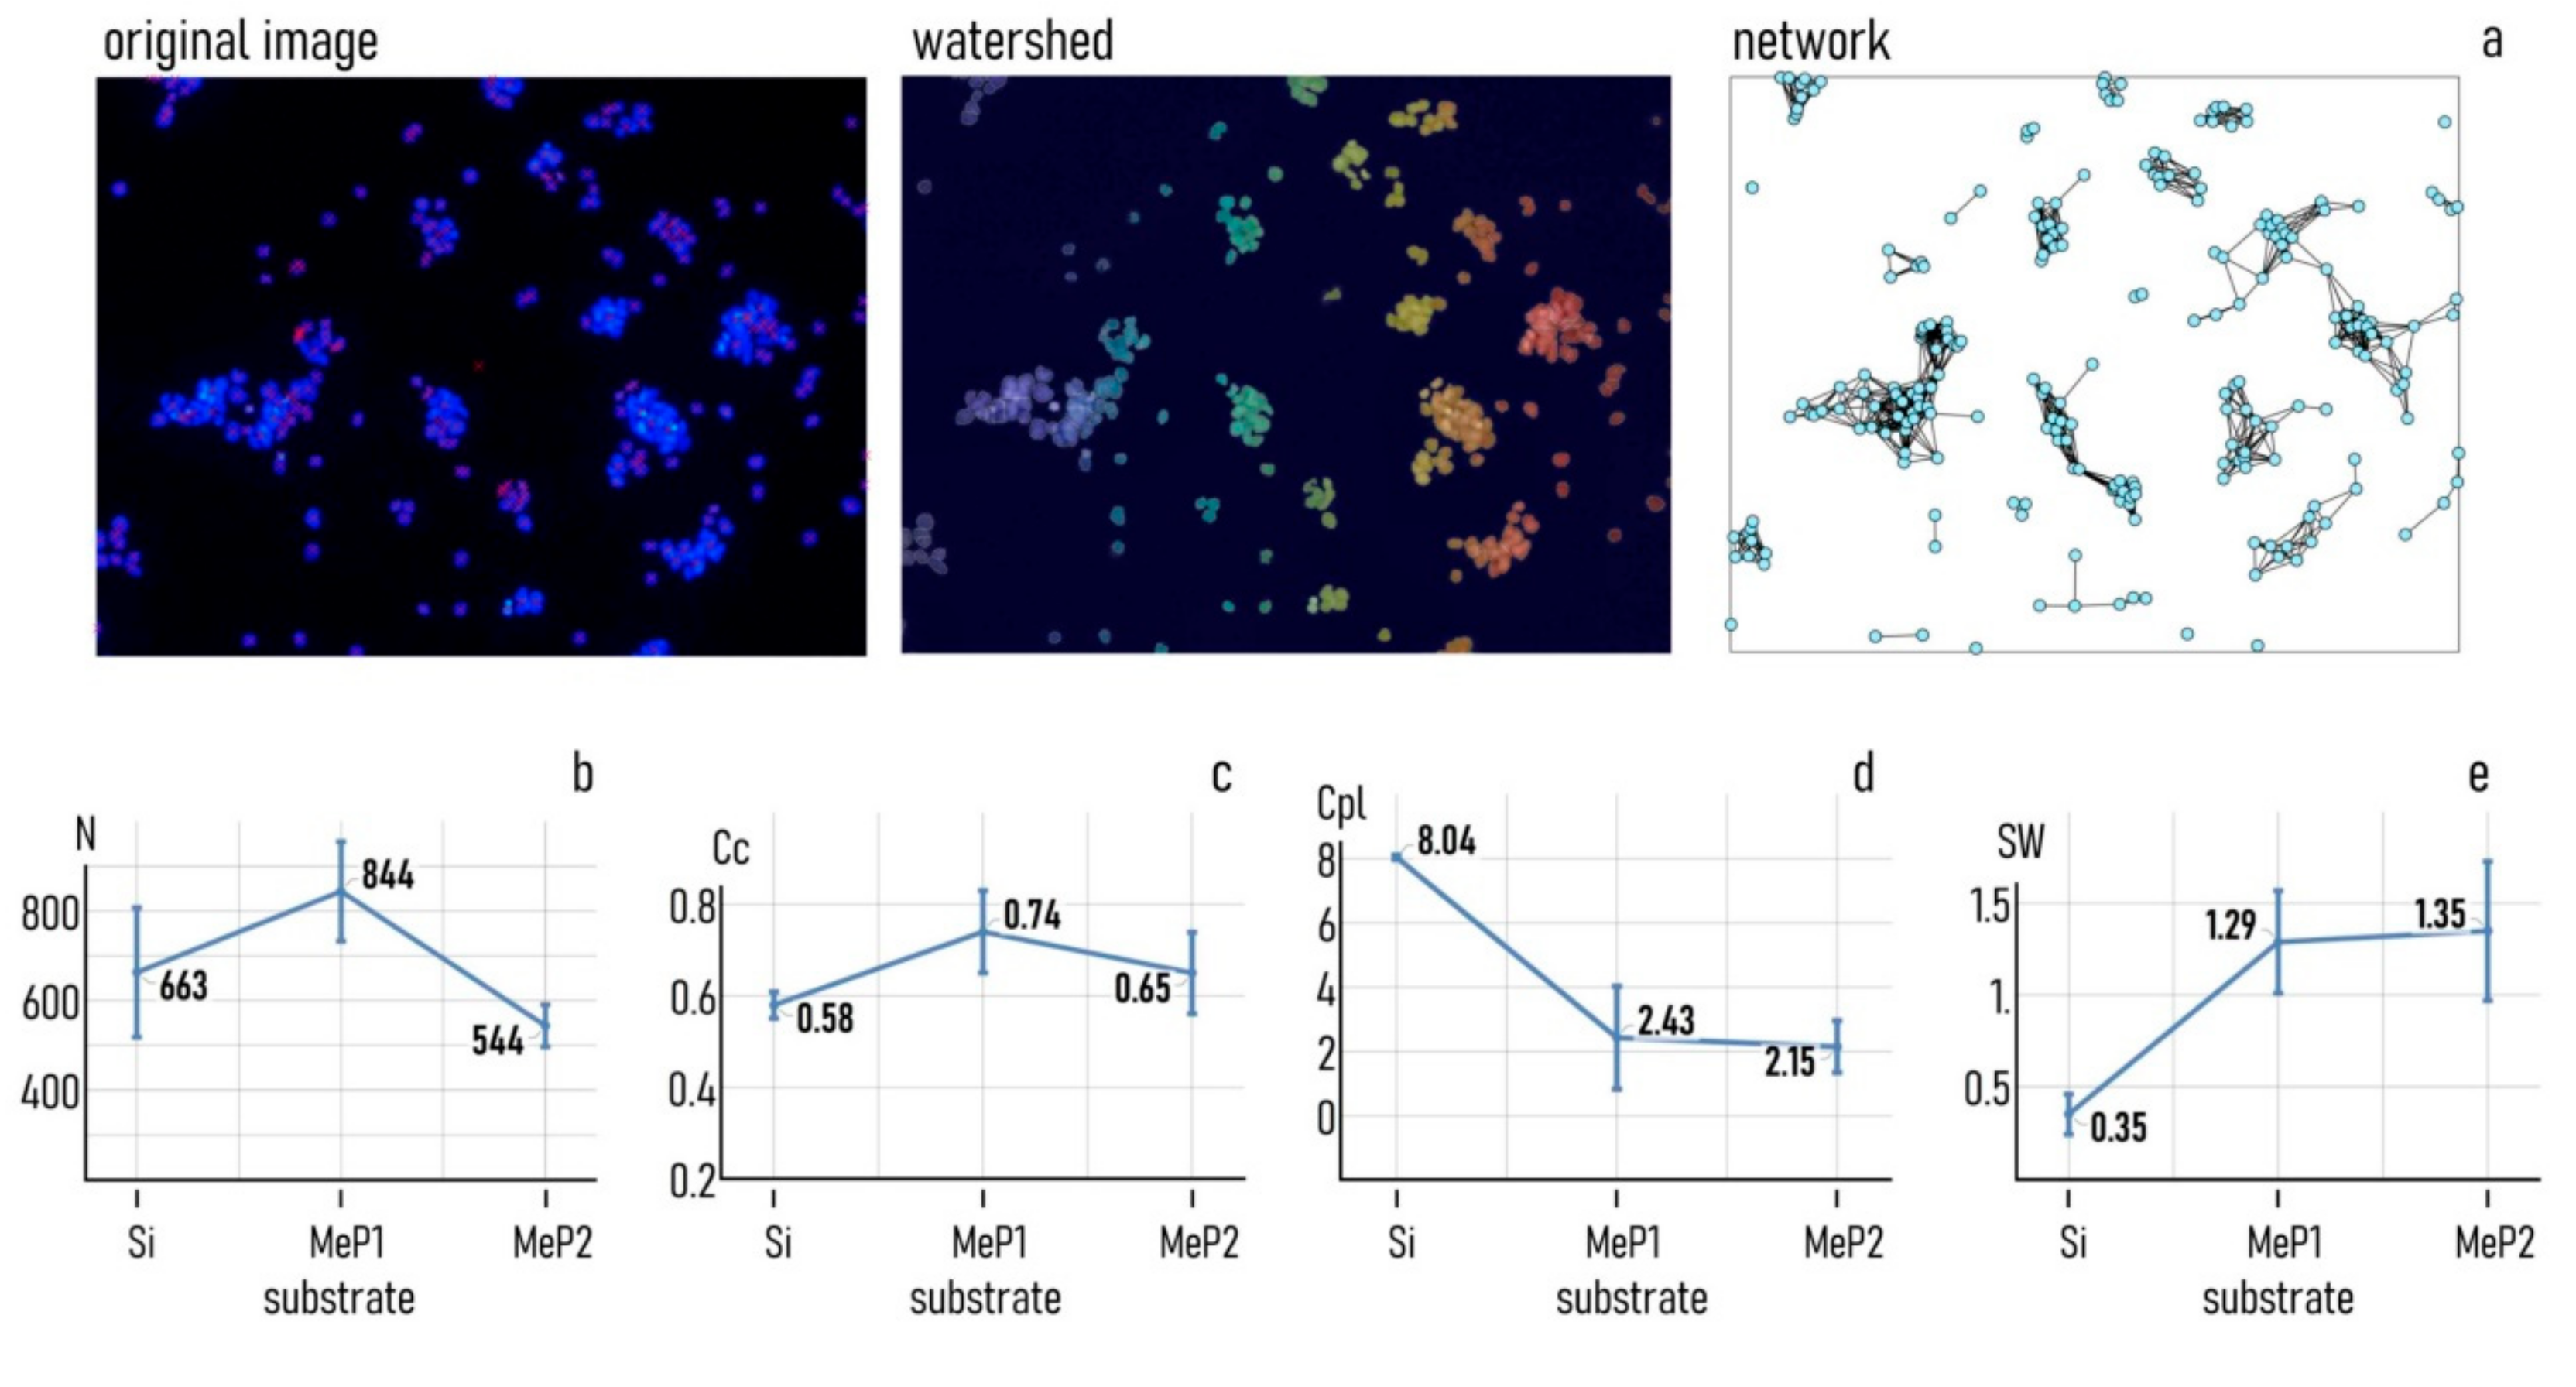
2.8. Image Analysis and Topological Characteristics of Cell Networks
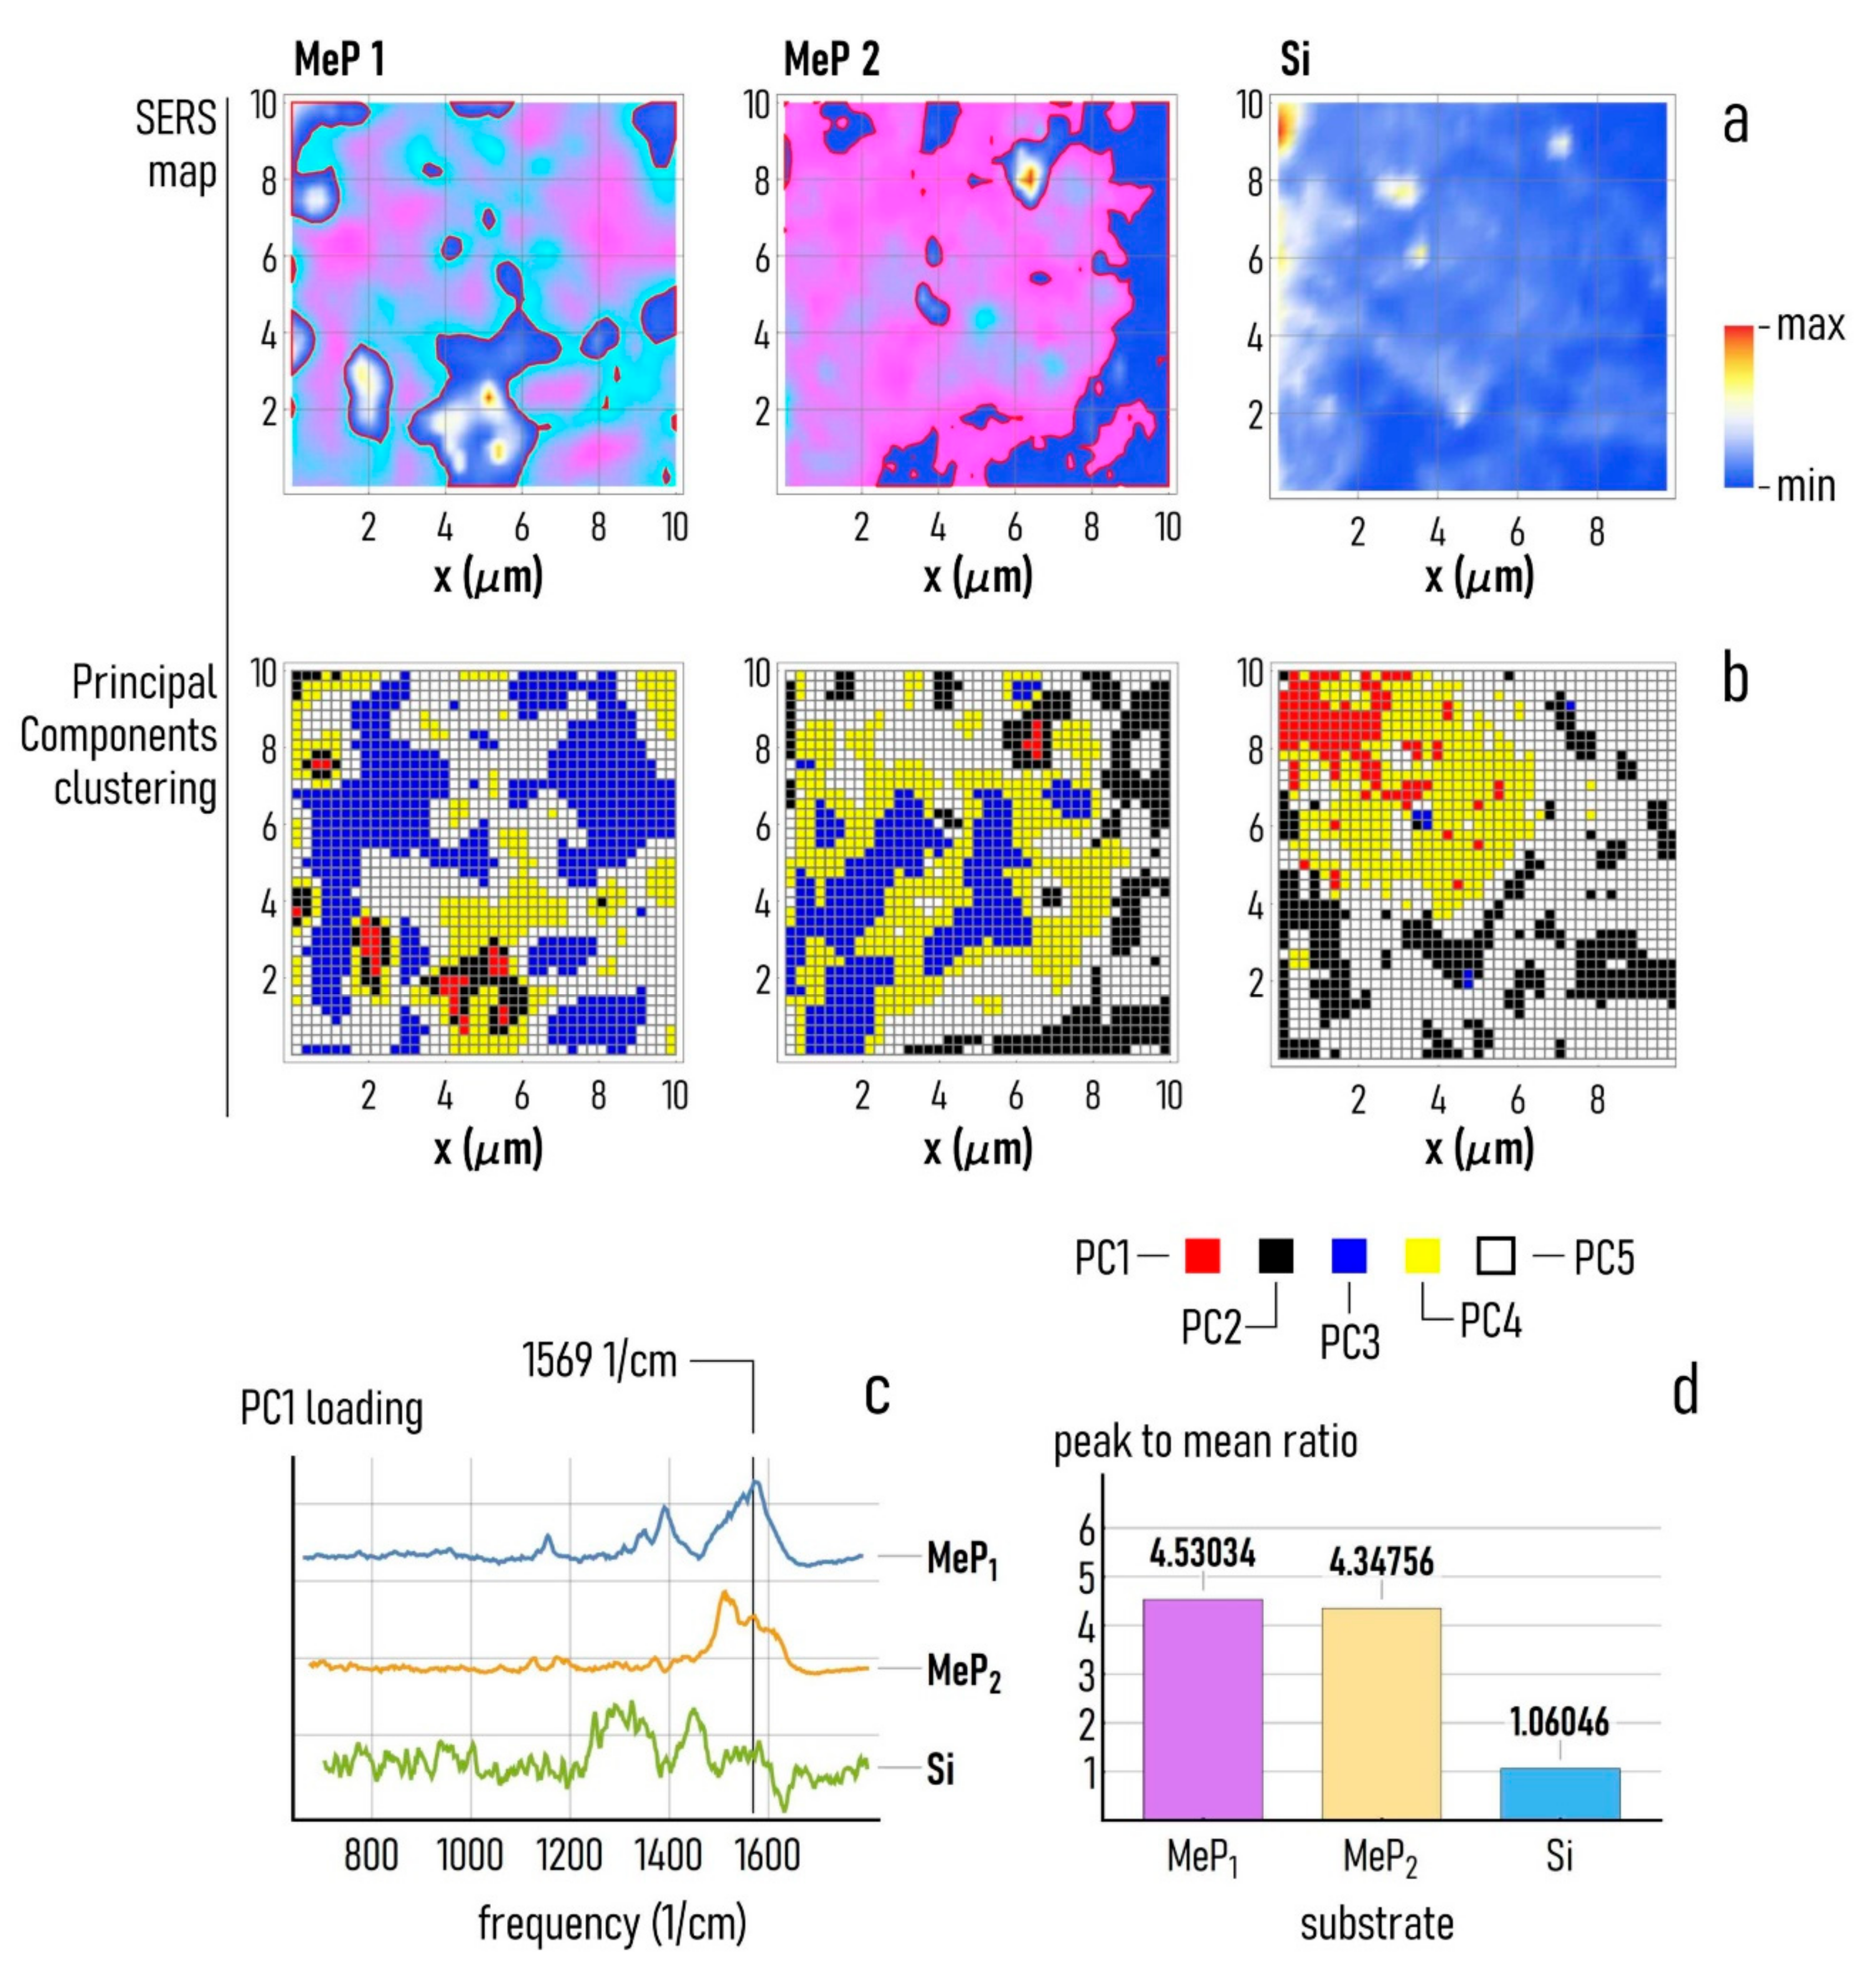
2.9. Raman Analysis of Samples
2.10. Principal Components Analysis of Raman Spectra
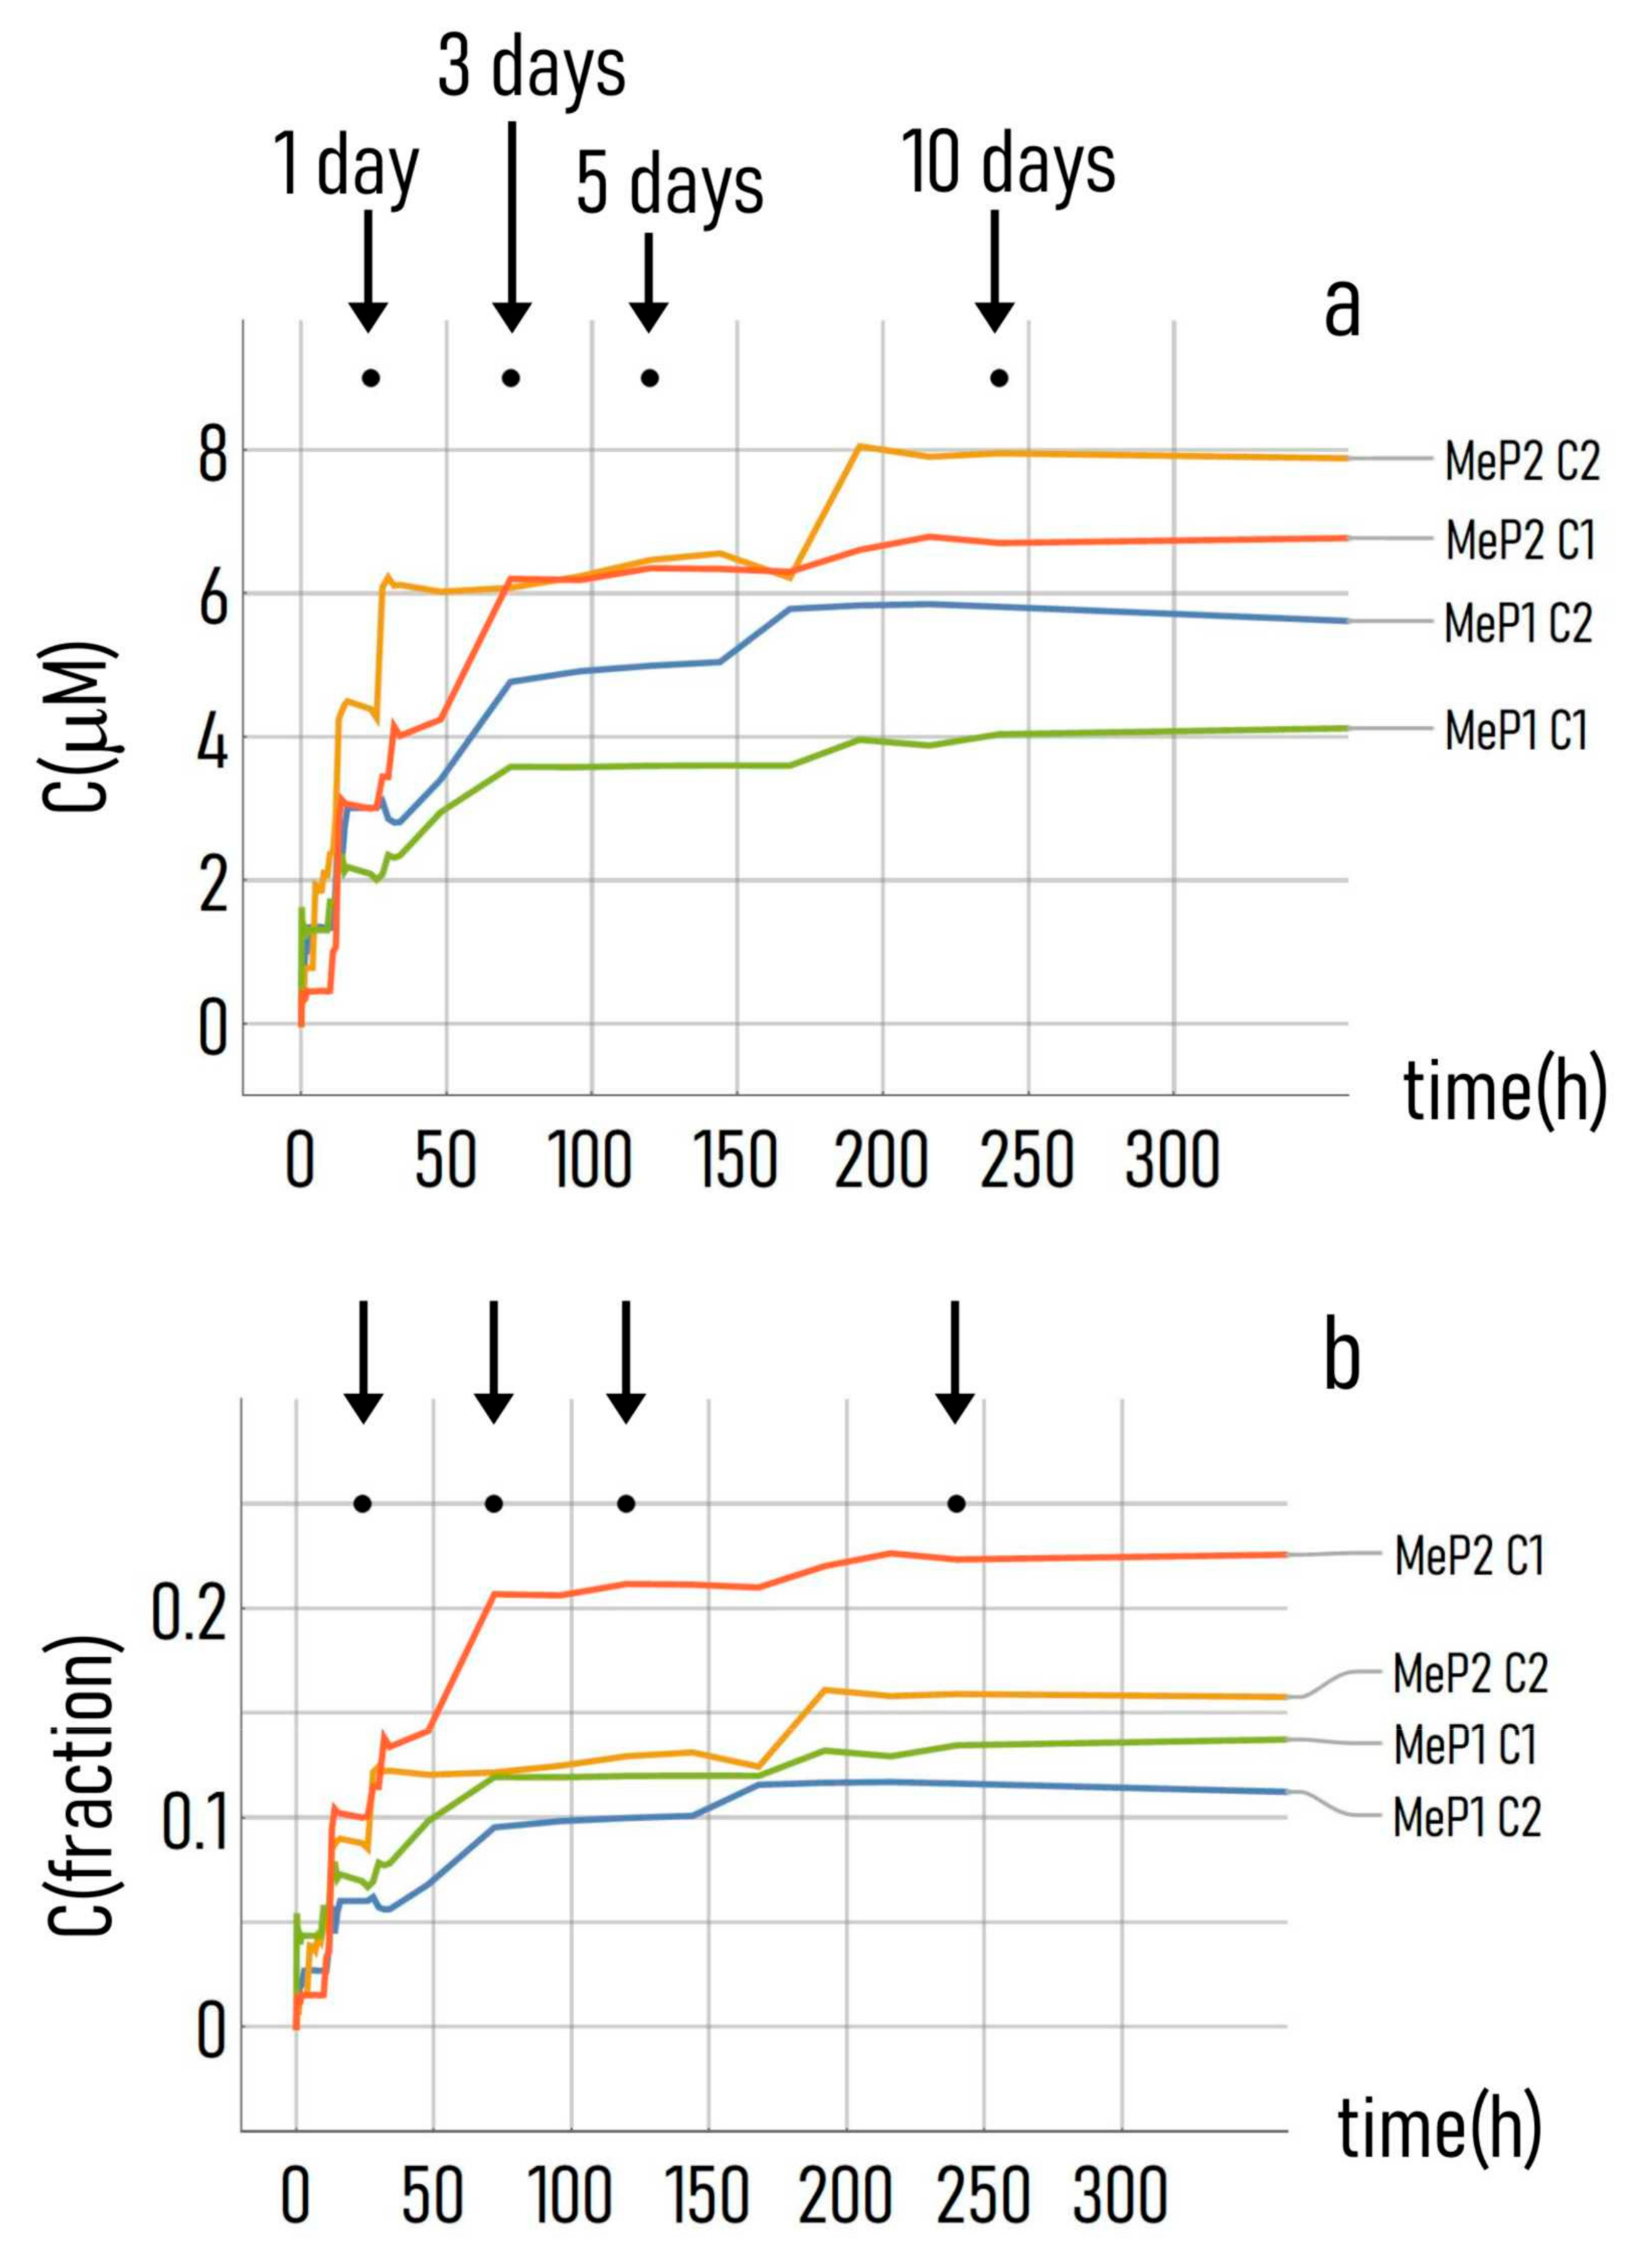
2.11. UV Characterization of Drug Release
2.12. Statistical Analysis
3. Results
3.1. Producing Gold-Functionalized Mesoporous Surfaces
3.2. Controlling Cell Organization on Au-Mesoporous Silicon Surfaces
3.3. SERS Analysis of Cell Adhesion on Au-Mesoporous Silicon Surfaces
3.4. Kinetics of Drug Release from the Mesoporous Silicon Matrices
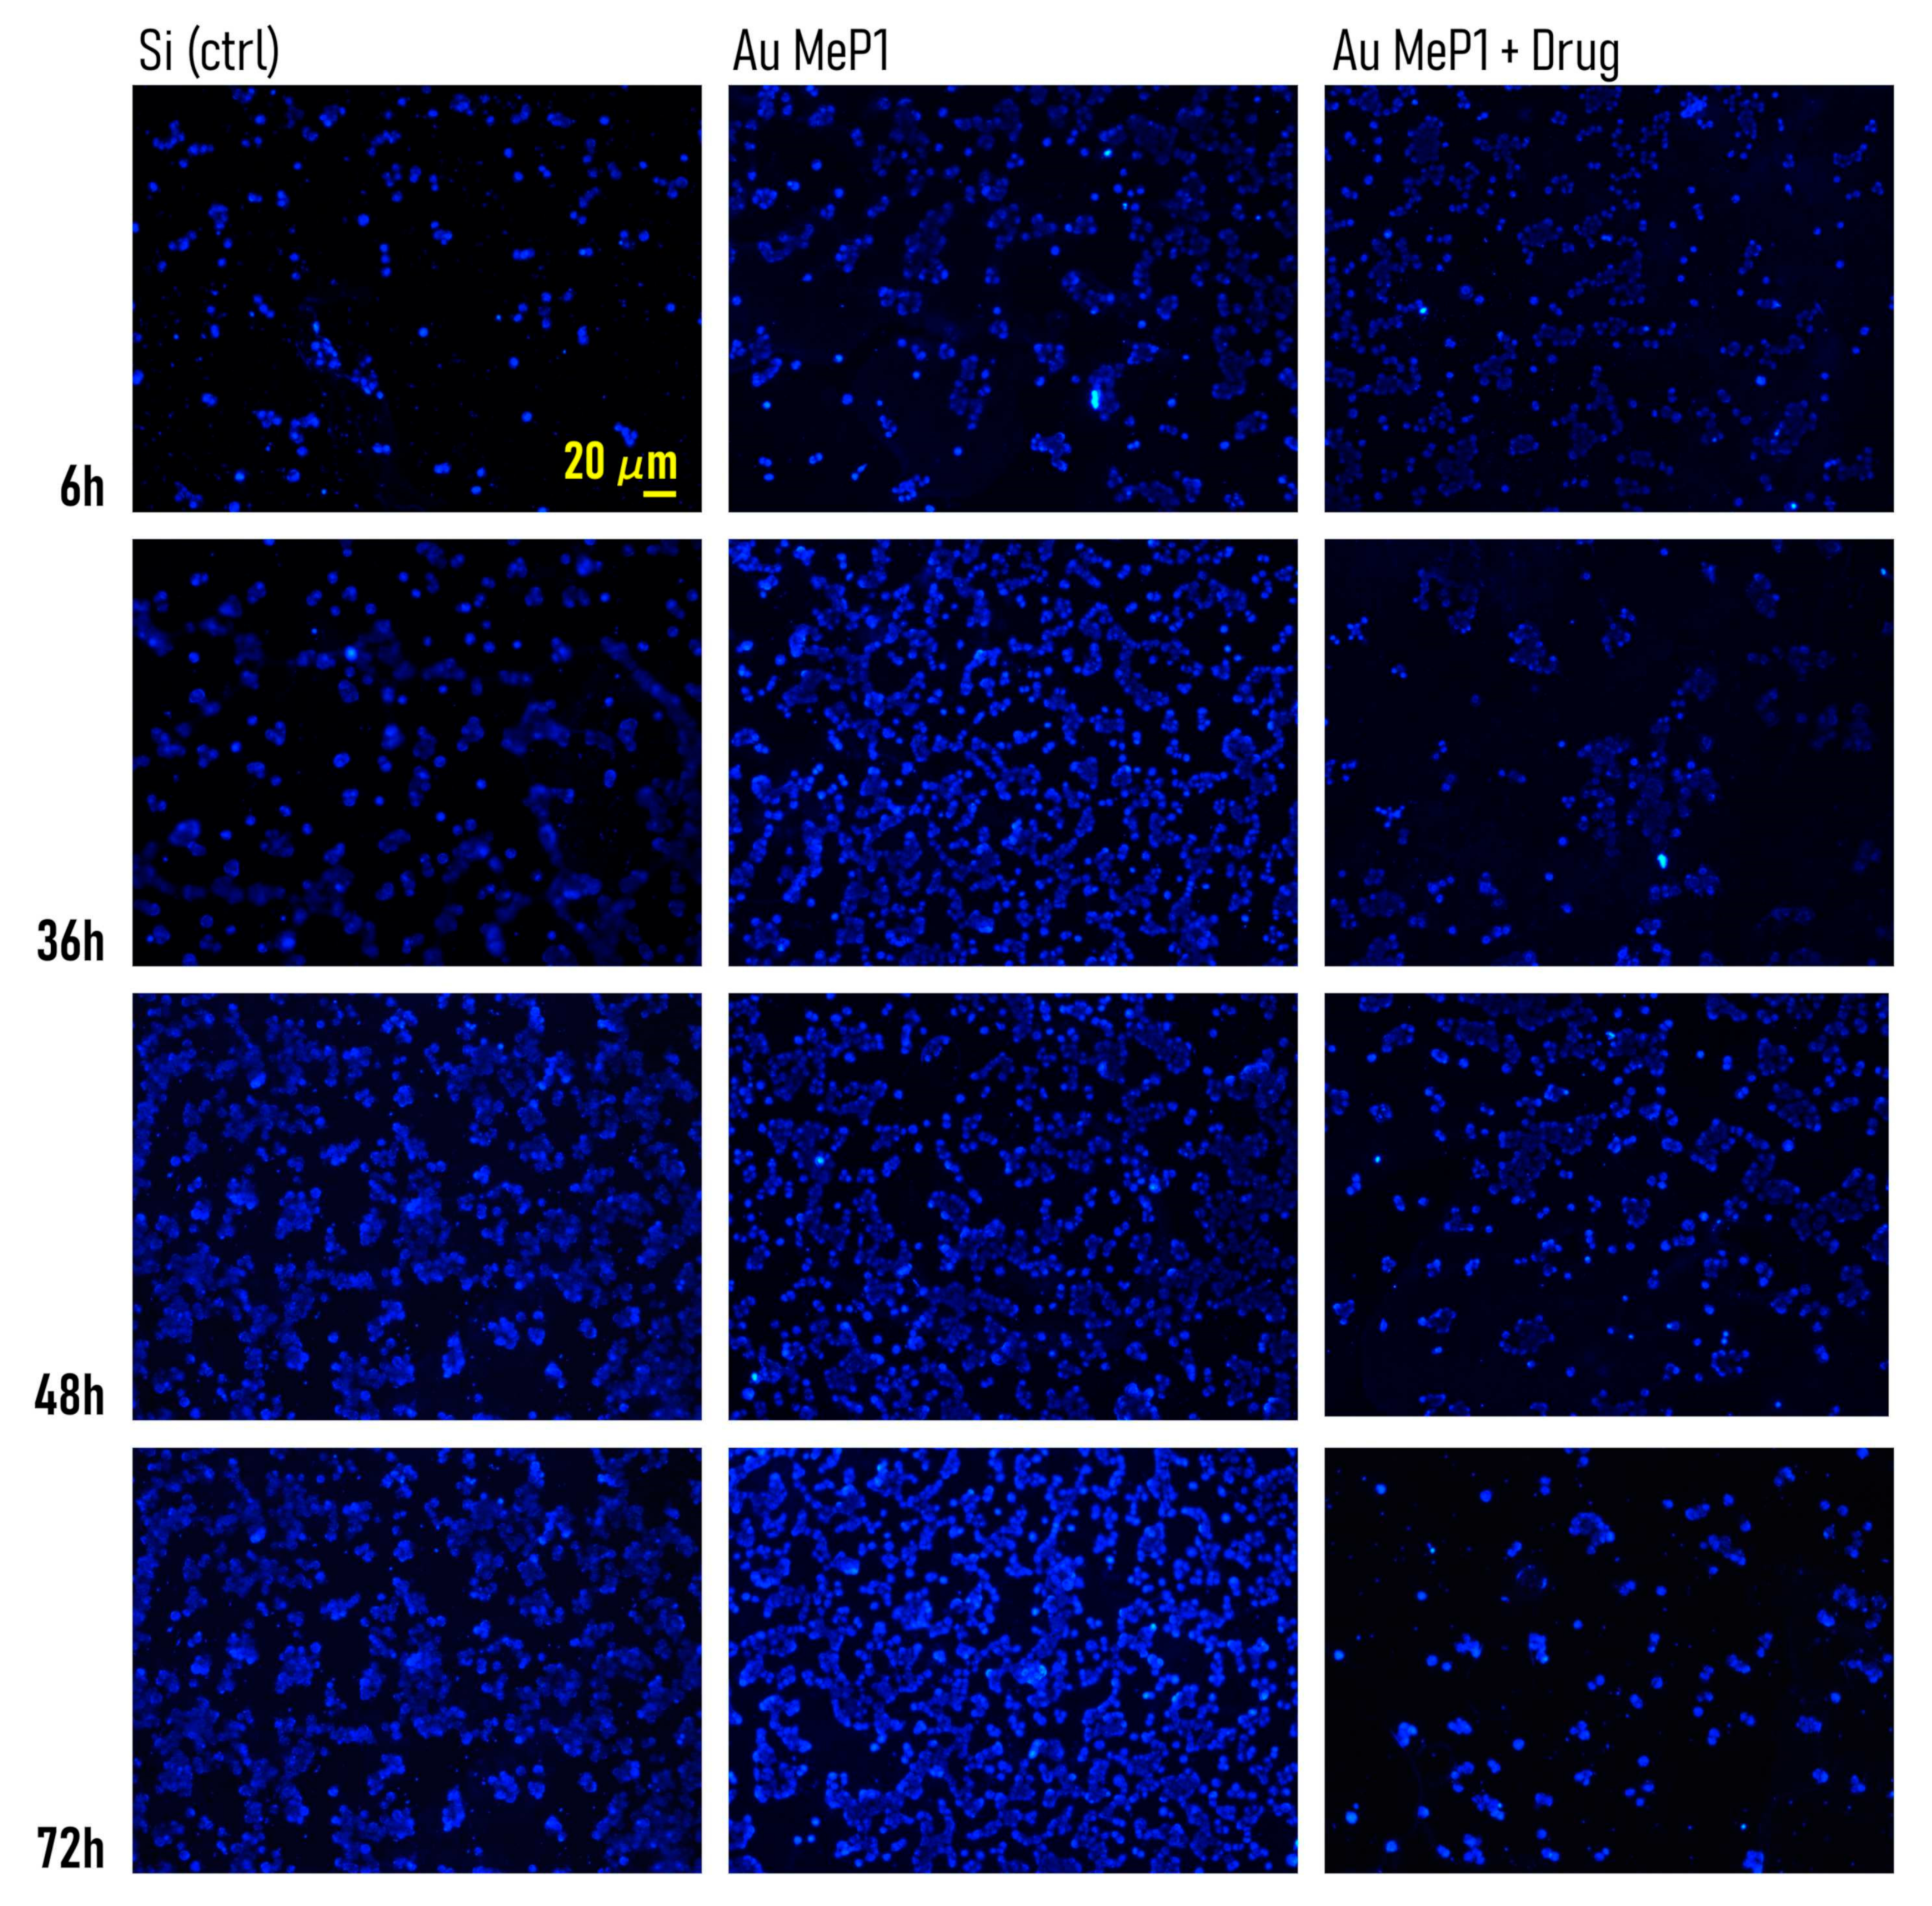
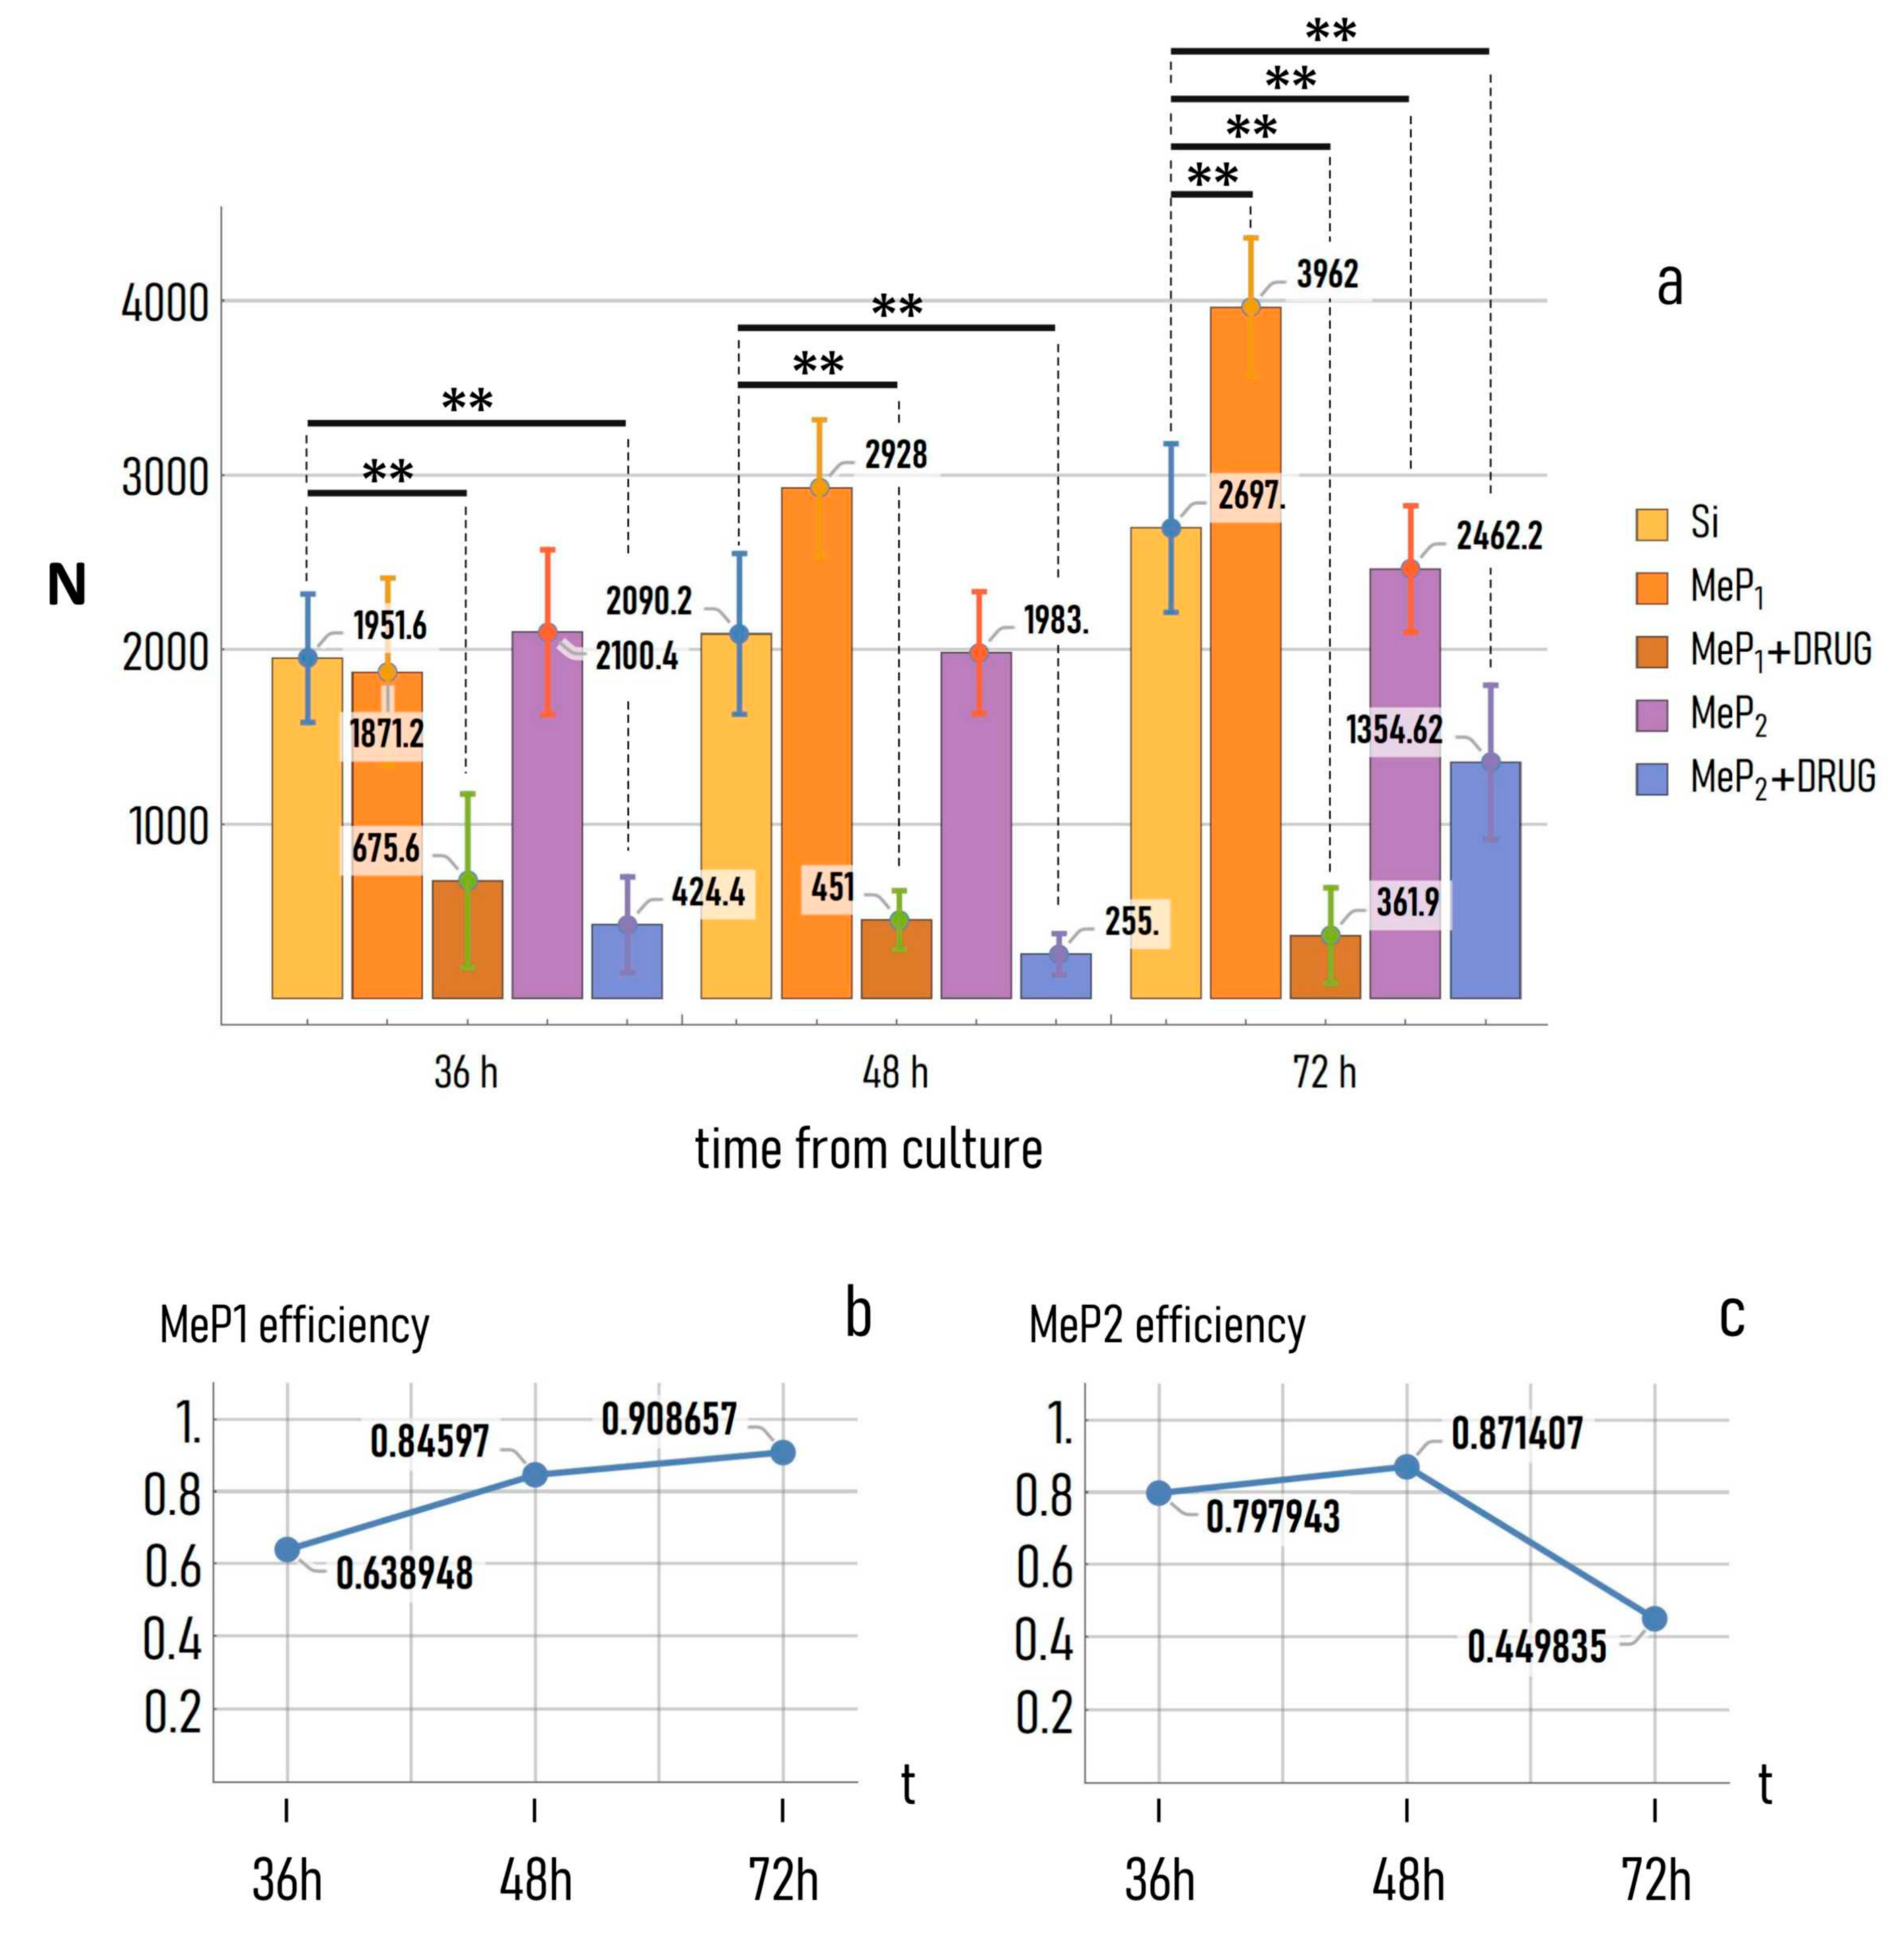
3.5. Timely Delivery of Drugs Impairs Tumor Cells Adhesion
4. Discussion
- (1)
- Transition from a 2D to 3D geometry. Results of the work and the way the device operates are restricted to 2D geometries. Cells themselves are plated on a surface and cell clusters are described using bi-dimensional variables. Future research that will be conducted over time shall have to clarify whether, and to which extent, cell behavior changes moving from 2D to 3D scaffolds.
- (2)
- Understanding whether the delivery is active. As demonstrated in the work, the delivery of the drugs from the porous matrix does not last indefinitely. Additionally, there could be cases in which, because of unpredictable leakages or occlusions of the pores, the process of release terminates before the expected time. Thus, the substrate should incorporate a sensor sensitive to the released drug, indicating the rate at which release proceeds, warning of possible malfunctions of the device before cells react to the alterations of delivery.
- (3)
- Switching between on-off delivery states of the device. In this configuration, the release of drugs is always active, being driven by the gradients of concentration in the system—and described by the Fick’s laws. In a more sophisticated evolution of the device, one should be able to switch between on-off states: i.e., an active (on) state, in which drug molecules are allowed to flow in the system, and an inactive (off) state, in which release is temporarily paused. This can be possibly accomplished by varying, in a controlled fashion, the levels of pH and temperature of the system, having previously conjugated the drug with a pH-sensitive cleavable linker as described, as for an example, for injectable nanoparticle generators in [56].
- (4)
- Increasing the efficiency of drug loading, either in terms of pore-capacity and total amount of drug loaded in the pores, and in terms of loading time. The time necessary to load the drug into the device (more than 60 h for the present configuration) is unacceptably long for real life/industrial applications of the device.
- (5)
- Integration. While the device offers complementary ways to measure cell performance, using the bio-chip alternatively in a confocal-microscope or in a Raman setup can take time, and slow down the pace of a test campaign, a trial, or a biology/medicine application of the device. The method can take advantage from the integration of the chip in an automatic multi-well plate reader, where different imaging techniques (confocal imaging and Raman spectroscopy) are combined in the same platform.
- (6)
- Optimization. The device can be especially useful in cancer theranostics. While the results obtained in this work are based on an initial cell density of about 105 cells per substrate, this value can be optimized: the total number of cells for which the device has some measurable effects may be significantly lower than the 105 limit. Miniaturization has as principal consequence the possibility to use the devices in all those cases in which, because of the early stage of a disease, conventional biopsies are ineffective. For the same reason, the device can be used to perform liquid biopsy. Liquid biopsy is based on the detection and isolation of cancer cells directly from the peripheral blood of the patient [57]. The limit of the method is that, often, cancer cells are too few to be detected. Liquid biopsy could realistically benefit from multi-drug array panels based on mesoporous silicon substrates, designed to evaluate the sensitivity of circulating tumor cells to a test drug.
- (7)
- Generality. Further to the end of liquid biopsy: results of the paper suggest that this theranostics device is also effective towards more aggressive cancer cells, such as triple negative breast cancer cells. The integrin expression that we chose to analyze in this work is believed to be a hallmark of more aggressive forms of breast cancer [58]. In particular, the expression of β1 integrins on the cell surface is a predictive marker of triple negative breast cancer. Since the substrates that we produced induce, for certain configurations, an increased production of integrins on the MCF-7 surface, it is legitimate to hypothesize that this theranostics procedure is effective also in the case of triple negative breast cancer cells. Regarding the impact on normal cells, it has been demonstrated in several studies—some of which have been cited throughout the article—that both the porosity and roughness of nanoscale surfaces affect the adhesion, proliferation, and clustering of cells, depending on their degree of differentiation and replication speed. Thus, the method that we developed is general in scope and can be realistically adapted to several different cell types for different applications.
5. Conclusions
Supplementary Materials
Author Contributions
Funding
Acknowledgments
Conflicts of Interest
References
- Gentile, F. Nanotopographical Control of Cell Assembly into Supracellular Structures. In Nanomaterials for Advanced Biological Applications; Rahmandoust, M., Ayatollahi, M., Eds.; Springer: Cham, Switzerland, 2019; Volume 104. [Google Scholar]
- Hutmacher, D.W.; Woodfield, T.B.F.; Dalton, P.D. Scaffold Design and Fabrication. In Tissue Engineering; Van Blitterswijk, C.A., De Boer, J., Eds.; Academic Press: Boston, MA, USA, 2014; pp. 311–346. [Google Scholar]
- Limongi, T.; Schipani, R.; Di Vito, A.; Giugni, A.; Francardi, M.; Torre, B.; Allione, M.; Miele, E.; Malara, N.; Alrasheed, S.; et al. Photolithography and micromolding techniques for the realization of 3D polycaprolactone scaffolds for tissue engineering applications. Microelectron. Eng. 2015, 141, 135–139. [Google Scholar] [CrossRef]
- Lu, T.; Li, Y.; Chen, T. Techniques for fabrication and construction of three-dimensional scaffolds for tissue engineering. Int. J. Nanomed. 2013, 8, 337–350. [Google Scholar] [CrossRef] [Green Version]
- Perozziello, G.; Simone, G.; Candeloro, P.; Gentile, F.; Malara, N.; Larocca, R.; Coluccio, M.L.; Pullano, S.; Tirinato, L.; Geschke, O.; et al. A Fluidic Motherboard for Multiplexed Simultaneous and Modular Detection in Microfluidic Systems for Biological Application. Micro Nanosyst. 2010, 2, 227–238. [Google Scholar] [CrossRef] [Green Version]
- Decuzzi, P.; Ferrari, M. Modulating cellular adhesion through nanotopography. Biomaterials 2010, 31, 173–179. [Google Scholar] [CrossRef] [PubMed]
- Geiger, B.; Bershadsky, A.; Pankov, R.; Yamada, K.M. Transmembrane Extracellular Matrix–Cytoskeleton Crosstalk. Nat. Rev. Mol. Cell Biol. 2001, 2, 793–805. [Google Scholar] [CrossRef] [PubMed]
- Geiger, B.; Spatz, J.P.; Bershadsky, A.D. Environmental sensing through focal adhesions. Nat. Rev. Mol. Cell Biol. 2009, 10, 21–33. [Google Scholar] [CrossRef] [PubMed]
- Kanchanawong, P.; Shtengel, G.; Pasapera, A.M.; Ramko, E.B.; Davidson, M.W.; Hess, H.F.; Waterman, C.M. Nanoscale architecture of integrin-based cell adhesions. Nature 2010, 468, 580–586. [Google Scholar] [CrossRef] [Green Version]
- Perozziello, G.; La Rocca, R.; Cojoc, G.; Liberale, C.; Malara, N.; Simone, G.; Candeloro, P.; Anichini, A.; Tirinato, L.; Gentile, F.; et al. Microfluidic Devices Modulate Tumor Cell Line Susceptibility to NK Cell Recognition. Small 2012, 8, 2886–2894. [Google Scholar] [CrossRef]
- Stevens, M.; George, J. Exploring and engineering the cell surface interface. Science 2005, 310, 1135–1138. [Google Scholar] [CrossRef]
- De Vitis, S.; Coluccio, M.L.; Strumbo, G.; Malara, N.; Fanizzi, F.P.; De Pascali, S.A.; Perozziello, G.; Candeloro, P.; Di Fabrizio, E.M.; Gentile, F. Combined effect of surface nano-topography and delivery of therapeutics on the adhesion of tumor cells on porous silicon substrates. Microelectron. Eng. 2016, 158, 6–10. [Google Scholar] [CrossRef] [Green Version]
- Lane, S.W.; Williams, D.A.; Watt, F.M. Modulating the stem cell niche for tissue regeneration. Nat. Biotechnol. 2014, 32, 795–803. [Google Scholar] [CrossRef] [PubMed] [Green Version]
- Dalby, M.J.; Gadegaard, N.; Oreffo, R.O.C. Harnessing nanotopography and integrin-matrix interactions to influence stem cell fate. Nat. Mater. 2014, 13, 558–569. [Google Scholar] [CrossRef]
- Delcassian, D.; Depoil, D.; Rudnicka, D.; Liu, M.; Davis, D.M.; Dustin, M.L.; Dunlop, I.E. Nanoscale Ligand Spacing Influences Receptor Triggering in T Cells and NK Cells. Nano Lett. 2013, 13, 5608–5614. [Google Scholar] [CrossRef] [Green Version]
- Robinson, J.T.; Jorgolli, M.; Shalek, A.K.; Yoon, M.-H.; Gertner, R.S.; Park, H. Vertical nanowire electrode arrays as a scalable platform for intracellular interfacing to neuronal circuits. Nat. Nanotechnol. 2012, 7, 180–184. [Google Scholar] [CrossRef] [PubMed] [Green Version]
- Gentile, F.; Tirinato, L.; Battista, E.; Causa, F.; Liberale, C.; Di Fabrizio, E.; Decuzzi, P. Cells preferentially grow on rough substrates. Biomaterials 2010, 31, 7205–7212. [Google Scholar] [CrossRef] [PubMed]
- Sorkin, R.; Greenbaum, A.; David-Pur, M.; SaritAnava; Ayali, A.; Ben-Jacob, E.; Hanein, Y. Process entanglement as a neuronal anchorage mechanism to rough surfaces. Nanotechnology 2009, 20, 015101. [Google Scholar] [CrossRef] [PubMed]
- Xie, C.; Hanson, L.; Xie, W.; Lin, Z.; Cui, B.; Cui, Y. Noninvasive Neuron Pinning with Nanopillar Arrays. Nano Lett. 2010, 10, 4020–4024. [Google Scholar] [CrossRef] [Green Version]
- Ankam, S.; Suryana, M.; Chan, L.Y.; Moe, A.A.K.; Teo, B.K.K.; Law, J.B.K.; Sheetz, M.P.; Low, H.Y.; Yim, E.K.F. Substrate topography and size determine the fate of human embryonic stem cells to neuronal or glial lineage. Acta Biomater. 2013, 9, 4535–4545. [Google Scholar] [CrossRef]
- Baranes, K.; Chejanovsky, N.; Alon, N.; Sharoni, A.; Shefi, O. Topographic Cues of Nano-Scale Height Direct Neuronal Growth Pattern. Biotechnol. Bioeng. 2012, 109, 1791–1797. [Google Scholar] [CrossRef]
- Ferrari, A.; Cecchini, M.; Dhawan, A.; Micera, S.; Tonazzini, I.; Stabile, R.; Pisignano, D.; Beltram, F. Nanotopographic Control of Neuronal Polarity. Nano Lett. 2011, 11, 505–511. [Google Scholar] [CrossRef]
- Ligon, S.C.; Liska, R.; Stampfl, J.; Gurr, M.; Mülhaupt, R. Polymers for 3D Printing and Customized Additive Manufacturing. Chem. Rev. 2017, 117, 10212–10290. [Google Scholar] [CrossRef] [PubMed] [Green Version]
- Guvendiren, M.; Molde, J.; Soares, R.M.D.; Kohn, J. Designing Biomaterials for 3D Printing. ACS Biomater. Sci. Eng. 2016, 2, 1679–1693. [Google Scholar] [CrossRef]
- Accardo, A.; Courson, R.; Riesco, R.; Raimbault, V.; Malaquin, L. Direct Laser Fabrication of Meso-Scale 2D and 3D Architectures with Micrometric Feature Resolution. Addit. Manuf. 2018, 22, 440–446. [Google Scholar] [CrossRef]
- Nguyen, A.K.; Narayan, R.J. Two-Photon Polymerization for Biological Applications. Mater. Today 2017, 20, 314–322. [Google Scholar] [CrossRef]
- Fan, D.; Staufer, U.; Accardo, A. Engineered 3D Polymer and Hydrogel Microenvironments for Cell Culture Applications. Bioengineering 2019, 6, 113. [Google Scholar] [CrossRef] [Green Version]
- Accardo, A.; Blatché, M.C.; Courson, R.; Loubinoux, I.; Thibault, C.; Malaquin, L.; Vieu, C. Multiphoton Direct Laser Writing and 3D Imaging of Polymeric Freestanding Architectures for Cell Colonization. Small 2017, 13, 1700621–1700611. [Google Scholar] [CrossRef] [PubMed] [Green Version]
- Gentile, F.; Rocca, R.L.; Marinaro, G.; Nicastri, A.; Toma, A.; Paonessa, F.; Cojoc, G.; Liberale, C.; Benfenati, F.; Di Fabrizio, E.; et al. Differential Cell Adhesion on Mesoporous Silicon Substrates. ACS Appl. Mater. Interfaces 2012, 4, 2903–2911. [Google Scholar] [CrossRef]
- Marinaro, G.; La Rocca, R.; Toma, A.; Barberio, M.; Cancedda, L.; Di Fabrizio, E.; Decuzzi, P.; Gentile, F. Networks of Neuroblastoma Cells on Porous Silicon Substrates Reveal a Small World Topology. Integr. Biol. 2015, 7, 184–197. [Google Scholar] [CrossRef]
- Foll, H.; Christophersen, M.; Carstensen, J.; Hasse, G. Formation and application of porous silicon. Mater. Sci. Eng. 2002, 39, 93–141. [Google Scholar] [CrossRef]
- Gentile, F.; Battista, E.; Accardo, A.; Coluccio, M.; Asande, M.; Perozziello, G.; Das, G.; Liberale, C.; De Angelis, F.; Candeloro, P.; et al. Fractal Structure Can Explain the Increased Hydrophobicity of NanoPorous Silicon Films. Microelectron. Eng. 2011, 88, 2537–2540. [Google Scholar] [CrossRef]
- Coluccio, M.L.; Gentile, F.; Francardi, M.; Perozziello, G.; Malara, N.; Candeloro, P.; Di Fabrizio, E. Electroless Deposition and Nanolithography Can Control the Formation of Materials at the Nano-Scale for Plasmonic Applications. Sensors 2014, 14, 6056–6083. [Google Scholar] [CrossRef] [PubMed] [Green Version]
- Battista, E.; Coluccio, M.-L.; Alabastri, A.; Barberio, M.; Causa, F.; Netti, P.-A.; Di Fabrizio, E.; Gentile, F. Metal enhanced fluorescence on super-hydrophobic clusters of gold nanoparticles. Microelectron. Eng. 2017, 175, 7–11. [Google Scholar] [CrossRef] [Green Version]
- Li, W.; Liu, C.; Zhao, C.; Zhai, L.; Lv, S. Downregulation of β3 integrin by miR-30a-5p modulates cell adhesion and invasion by interrupting Erk/Ets 1 network in triple-negative breast cancer. Int. J. Oncol. 2016, 48, 1155–1164. [Google Scholar] [CrossRef] [PubMed] [Green Version]
- Waxman, B. Routing of multipoint connections. IEEE J. Sel. Areas Commun. 1988, 6, 1617–1622. [Google Scholar] [CrossRef]
- Barabási, A.-L. Network Science; Cambridge University Press: Glasgow, UK, 2016; p. 475. [Google Scholar]
- Barabási, A.-L.; Albert, R. Emergence of scaling in random networks. Science 1999, 286, 509–512. [Google Scholar] [CrossRef] [Green Version]
- Barabási, A.-L.; Oltvai, Z.N. Network biology: Understanding the cell’s functional organization. Nat. Rev. Genet. 2004, 5, 101–113. [Google Scholar] [CrossRef]
- Watts, D.J. Small Worlds: The Dynamics of Networks between Order and Randomness; Princeton University Press: Woodstock, UK, 2003. [Google Scholar]
- Watts, D.J.; Strogatz, S.H. Collective dynamics of ‘small-world’ networks. Nature 1998, 393, 440–442. [Google Scholar] [CrossRef]
- Humphries, M.D.; Gurney, K. Network ‘Small-World-Ness’: A Quantitative Method for Determining Canonical Network Equivalence. PLoS ONE 2008, 3, e0002051. [Google Scholar] [CrossRef]
- Perozziello, G.; Catalano, R.; Francardi, M.; Rondanina, E.; Pardeo, F.; De Angelis, F.; Malara, N.; Candeloro, P.; Morrone, G.; Di Fabrizio, E. A microfluidic device integrating plasmonic nanodevices for Raman spectroscopy analysis on trapped single living cells. Microelectron. Eng. 2013, 111, 314–319. [Google Scholar] [CrossRef]
- Candeloro, P.; Grande, E.; Raimondo, R.; Di Mascolo, D.; Gentile, F.; Coluccio, M.L.; Perozziello, G.; Malara, N.; Francardi, M.; Di Fabrizio, E. Raman database of Amino Acids solutions: A critical study of Extended Multiplicative Signal Correction. Analyst 2013, 138, 7331–7340. [Google Scholar] [CrossRef]
- Muscella, A.; Vetrugno, C.; Migoni, D.; Biagioni, F.; Fanizzi, F.; Fornai, F.; De Pascali, S.; Marsigliante, S. Antitumor activity of [Pt(O,O′-acac)(γ-acac)(DMS)] in mouse xenograft model of breast cancer. Cell Death Dis. 2014, 5, e1014. [Google Scholar] [CrossRef] [PubMed] [Green Version]
- Gentile, F.; Medda, R.; Cheng, L.; Battista, E.; Scopelliti, P.; Milani, P.; Cavalcanti-Adam, E.; Decuzzi, P. Selective modulation of cell response on engineered fractal silicon substrates. Sci. Rep. 2013, 3, 1461. [Google Scholar] [CrossRef] [PubMed] [Green Version]
- Strogatz, S.H. Exploring complex networks. Nature 2001, 410, 268–276. [Google Scholar] [CrossRef] [PubMed] [Green Version]
- Onesto, V.; Cancedda, L.; Coluccio, M.; Nanni, M.; Pesce, M.; Malara, N.; Cesarelli, M.; Fabrizio, E.D.; Amato, F.; Gentile, F. Nano-topography Enhances Communication in Neural Cells Networks. Sci. Rep. 2017, 7, 1–13. [Google Scholar] [CrossRef] [PubMed] [Green Version]
- Onesto, V.; Villani, M.; Narducci, R.; Malara, N.; Imbrogno, A.; Allione, M.; Costa, N.; Coppedè, N.; Zappettini, A.; Cannistraci, C.; et al. Cortical-like mini-columns of neuronal cells on zinc oxide nanowire surfaces. Sci. Rep. 2019, 9, 4021–4017. [Google Scholar] [CrossRef] [Green Version]
- Di Mascolo, D.; Coclite, A.; Gentile, F.; Francardi, M. Quantitative micro-Raman analysis of micro-particles in drug delivery. Nanoscale Adv. 2019, 1, 1541–1552. [Google Scholar] [CrossRef] [Green Version]
- Jin, H.; Varner, J. Integrins: Roles in cancer development and as treatment targets. Br. J. Cancer 2004, 90, 561–565. [Google Scholar] [CrossRef]
- Koistinen, P.; Heino, J. Integrins in Cancer Cell Invasion. In Madame Curie Bioscience Database [Internet]; Landes Bioscience: Austin, TX, USA, 2013. Available online: https://www.ncbi.nlm.nih.gov/books/NBK6070/ (accessed on 15 April 2020).
- Chowdhury, M.H.; Gant, V.A.; Trache, A.; Baldwin, A.M.; Meininger, G.A.; Coté, G.L. Use of surface-enhanced Raman spectroscopy for the detection of human integrins. J. Biomed. Opt. 2006, 11, 024004. [Google Scholar] [CrossRef]
- Gentile, F.; Coluccio, M.L.; Zaccaria, R.P.; Francardi, M.; Cojoc, G.; Perozziello, G.; Raimondo, R.; Candeloroa, P.; Fabrizio, E.D. Selective on site separation and detection of molecules in diluted solutions with superhydrophobic clusters of plasmonic nanoparticles. Nanoscale 2014, 6, 8208–8225. [Google Scholar] [CrossRef]
- Liston, D.R.; Davis, M. Clinically Relevant Concentrations of Anticancer Drugs: A Guide for Nonclinical Studies. Clin. Cancer Res. 2017, 23, 3489–3498. [Google Scholar] [CrossRef] [Green Version]
- Xu, R.; Zhang, G.; Mai, J.; Deng, X.; Segura-Ibarra, V.; Wu, S.; Shen, J.; Liu, H.; Hu, Z.; Chen, L.; et al. An Injectable Nanoparticle Generator Enhances Delivery of Cancer Therapeutics. Nat. Biotechnol. 2016, 34, 414–418. [Google Scholar] [CrossRef] [PubMed] [Green Version]
- Malara, N.; Givigliano, F.; Trunzo, V.; Macrina, L.; Raso, C.; Amodio, N.; Aprigliano, S.; Minniti, A.; Russo, V.; Roveda, L.; et al. In vitro expansion of tumour cells derived from blood and tumour tissue is useful to redefine personalized treatment in non-small cell lung cancer patients. J. Biol. Regul. Homeost. Agents 2014, 28, 717–731. [Google Scholar] [PubMed]
- Yin, H.-L.; Wu, C.-C.; Lin, C.-H.; Chai, C.-Y.; Hou, M.-F.; Chang, S.-J.; Tsai, H.-P.; Hung, W.-C.; Pan, M.-R.; Luo, C.-W. β1 Integrin as a Prognostic and Predictive Marker in Triple-Negative Breast Cancer. Int. J. Mol. Sci. 2016, 17, 1432. [Google Scholar] [CrossRef] [PubMed]


© 2020 by the authors. Licensee MDPI, Basel, Switzerland. This article is an open access article distributed under the terms and conditions of the Creative Commons Attribution (CC BY) license (http://creativecommons.org/licenses/by/4.0/).
Share and Cite
Coluccio, M.L.; Onesto, V.; Marinaro, G.; Dell’Apa, M.; De Vitis, S.; Imbrogno, A.; Tirinato, L.; Perozziello, G.; Di Fabrizio, E.; Candeloro, P.; et al. Cell Theranostics on Mesoporous Silicon Substrates. Pharmaceutics 2020, 12, 481. https://doi.org/10.3390/pharmaceutics12050481
Coluccio ML, Onesto V, Marinaro G, Dell’Apa M, De Vitis S, Imbrogno A, Tirinato L, Perozziello G, Di Fabrizio E, Candeloro P, et al. Cell Theranostics on Mesoporous Silicon Substrates. Pharmaceutics. 2020; 12(5):481. https://doi.org/10.3390/pharmaceutics12050481
Chicago/Turabian StyleColuccio, Maria Laura, Valentina Onesto, Giovanni Marinaro, Mauro Dell’Apa, Stefania De Vitis, Alessandra Imbrogno, Luca Tirinato, Gerardo Perozziello, Enzo Di Fabrizio, Patrizio Candeloro, and et al. 2020. "Cell Theranostics on Mesoporous Silicon Substrates" Pharmaceutics 12, no. 5: 481. https://doi.org/10.3390/pharmaceutics12050481