Manoeuvrability of a Large Cruise Ship after Damage for Safe Return to Port


1
Graduate School of Maritime Sciences, Kobe University, Kobe 658-0022, Japan
2
Graduate School of Engineering, Osaka Prefecture University, Sakai 599-8531, Japan
3
Kobe Ocean-Bottom Exploration Center, Kobe University, Kobe 658-0022, Japan
4
National Research Institute of Fisheries Engineering, Japan Fisheries Research and Education Agency, Kamisu 314-0408, Japan
*
Author to whom correspondence should be addressed.
J. Mar. Sci. Eng. 2020, 8(5), 378; https://doi.org/10.3390/jmse8050378
Submission received: 30 April 2020
/
Revised: 20 May 2020
/
Accepted: 20 May 2020
/
Published: 25 May 2020
(This article belongs to the Special Issue Safety Assessment of Ships and Offshore Structures under Severe Condition)
Abstract
:Free-running model tests were conducted using a scaled model of a large cruise ship with a damaged compartment, to investigate the effects of damage opening and floodwater on the manoeuvring performance in calm water and regular and irregular head waves. Drifting tests in regular beam waves were also performed. The experimental results indicated that the course-keeping ability in waves and turning ability became worse in the damaged condition. However, the target ship retained its manoeuvrability for safe return to the port, on its own, even in a damaged state. As it is time- and cost-consuming to conduct a free-running model experiment, a captive model test was also carried out to develop a system-based simulation model for evaluating the manoeuvrability of large cruise ships after damage.
1. Introduction
For large cruise ships carrying thousands of passengers, ensuring safety in the event of damage accidents is an essential issue. As a ship gains stability against lateral inclination owing to the action of buoyancy, it becomes unstable once the buoyancy is significantly lost due to damage or flooding. The Safety of Life at Sea (SOLAS) convention was first adopted in 1914 and has been updated by the International Maritime Organization (IMO) to guarantee the survivability of ships when damages occur. Recently, Safe Return to Port (SRtP) was established, which refers to the SOLAS regulation adopted by the IMO resolution MSC.216(82) [1]. This regulation is aimed at securing further survivability in flooding events, and requires a passenger ship to proceed to port on its own even in a damaged or flooded condition. However, standard methods for evaluating the manoeuvrability of ships after damage have not been developed yet.
To date, several experimental studies have been reported, which investigated the behaviour of damaged ships during flooding and discussed the survivability against flooding; for example, Palazzi and De Kat (2004) [2], Ruponen (2006) [3], Ruponen et al. (2010) [4], Ikeda et al. (2011) [5], Manderbacka et al. (2015) [6], Lee et al. (2015) [7], Hashimoto et al. (2017) [8], Cho et al. (2019) [9], and Gao et al. (2019) [10]. Experimental studies on a damaged ship freely drifting in waves have also been reported; for instance, Begovic et al. (2013) [11], Acanfora and De Luca (2016) [12], Haro et al. (2017) [13], and Ćatipović et al. (2019) [14]. These previous studies assumed that the ship totally lost her propulsion function due to flooding, so their results are not available to discuss the manoeuvrability for SRtP. Recently, Kim et al. (2018) [15] conducted a free-running model test on manoeuvring performance in damaged and flooded conditions, but the subject ship was a naval ship and the test was conducted only in calm water with a relatively small heel angle.
In this study, free-running model tests were conducted using a self-propelled model of a large cruise ship with a damaged compartment around the midship as the most reliable approach to obtain solid knowledge on this issue. To discuss the manoeuvrability and safety in an actual sea, the free-running model tests were conducted not only in regular waves but also long- and short-crested irregular waves, as well as in regular beam waves. All experiments were also performed for the intact condition under the same condition as the damaged condition, to highlight the effect of damage/floodwater. For developing a system-based model for manoeuvring simulation of a damaged ship, a captive model test, the so-called circular motion test (CMT), was conducted to determine hydrodynamic manoeuvring coefficients for various conditions. Then, the result of the numerical simulation was compared with that of the free-running model tests to verify its capability, as a tool to judge the compliance with international manoeuvrability standards for cruise ships after damage.
2. Experimental Condition
2.1. Ship Model
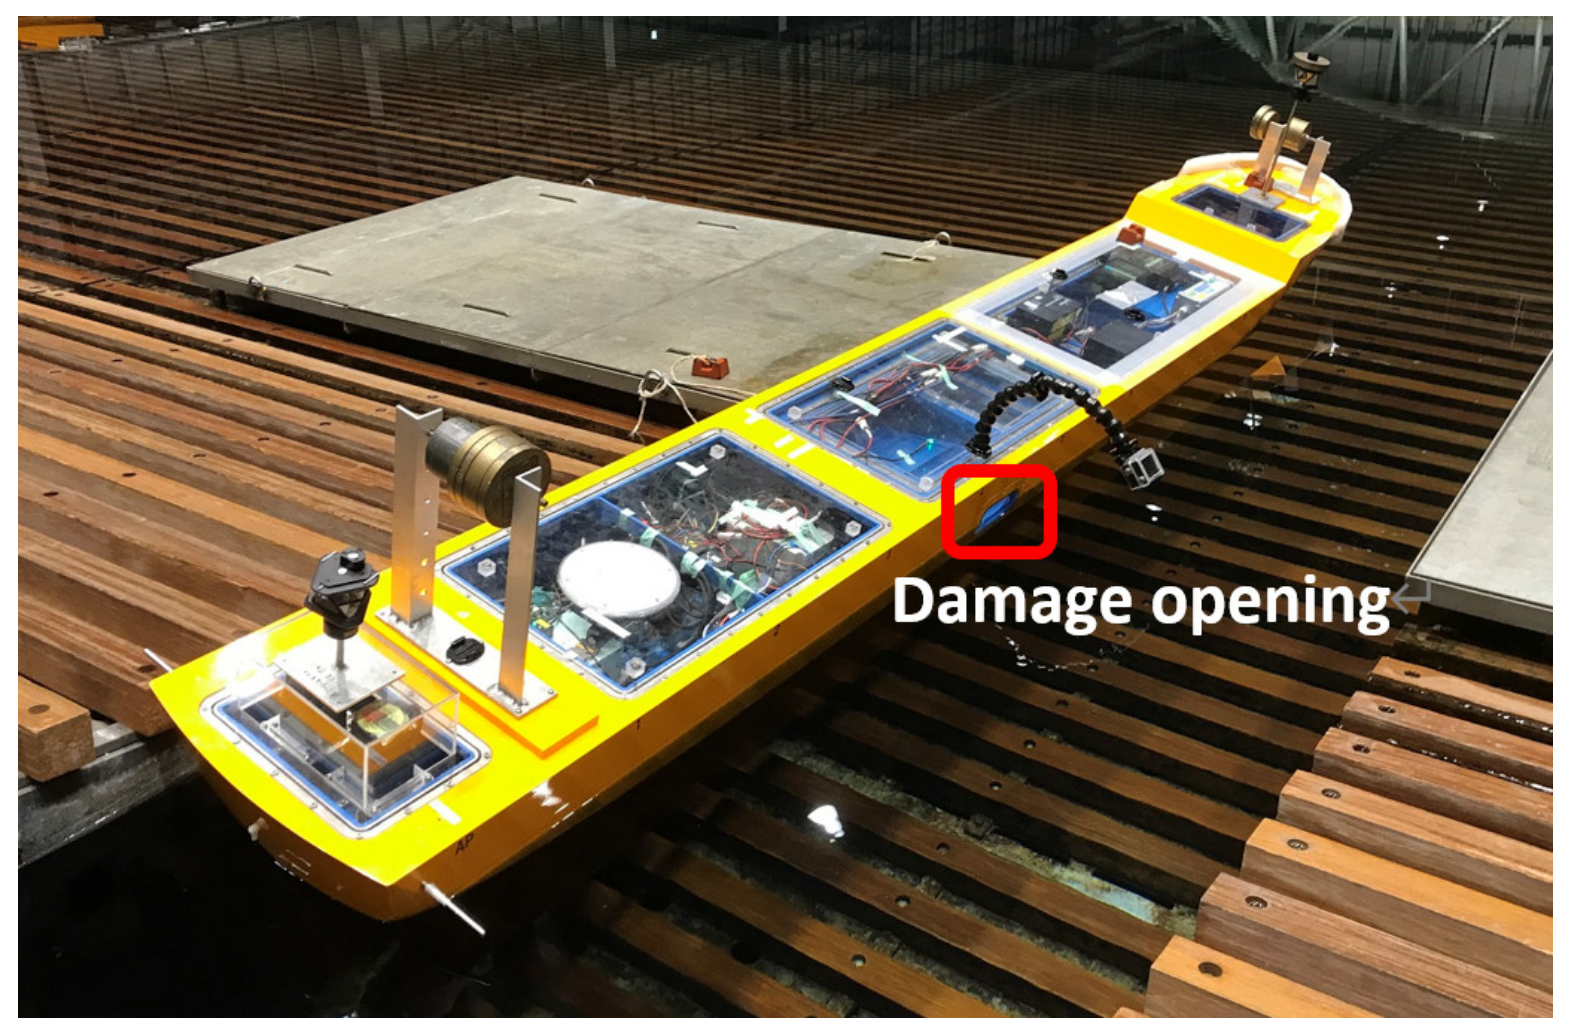
Figure 1 shows a scaled model of a large cruise ship used for the experiment. The principal particulars of the ship are shown in Table 1. The ship model was built at a scale 1:82. It was equipped with two sets of propellers, shafts, and rudders, for conducting a free-running experiment. Bilge keels and a skeg were also equipped, but fin stabilizers were not.
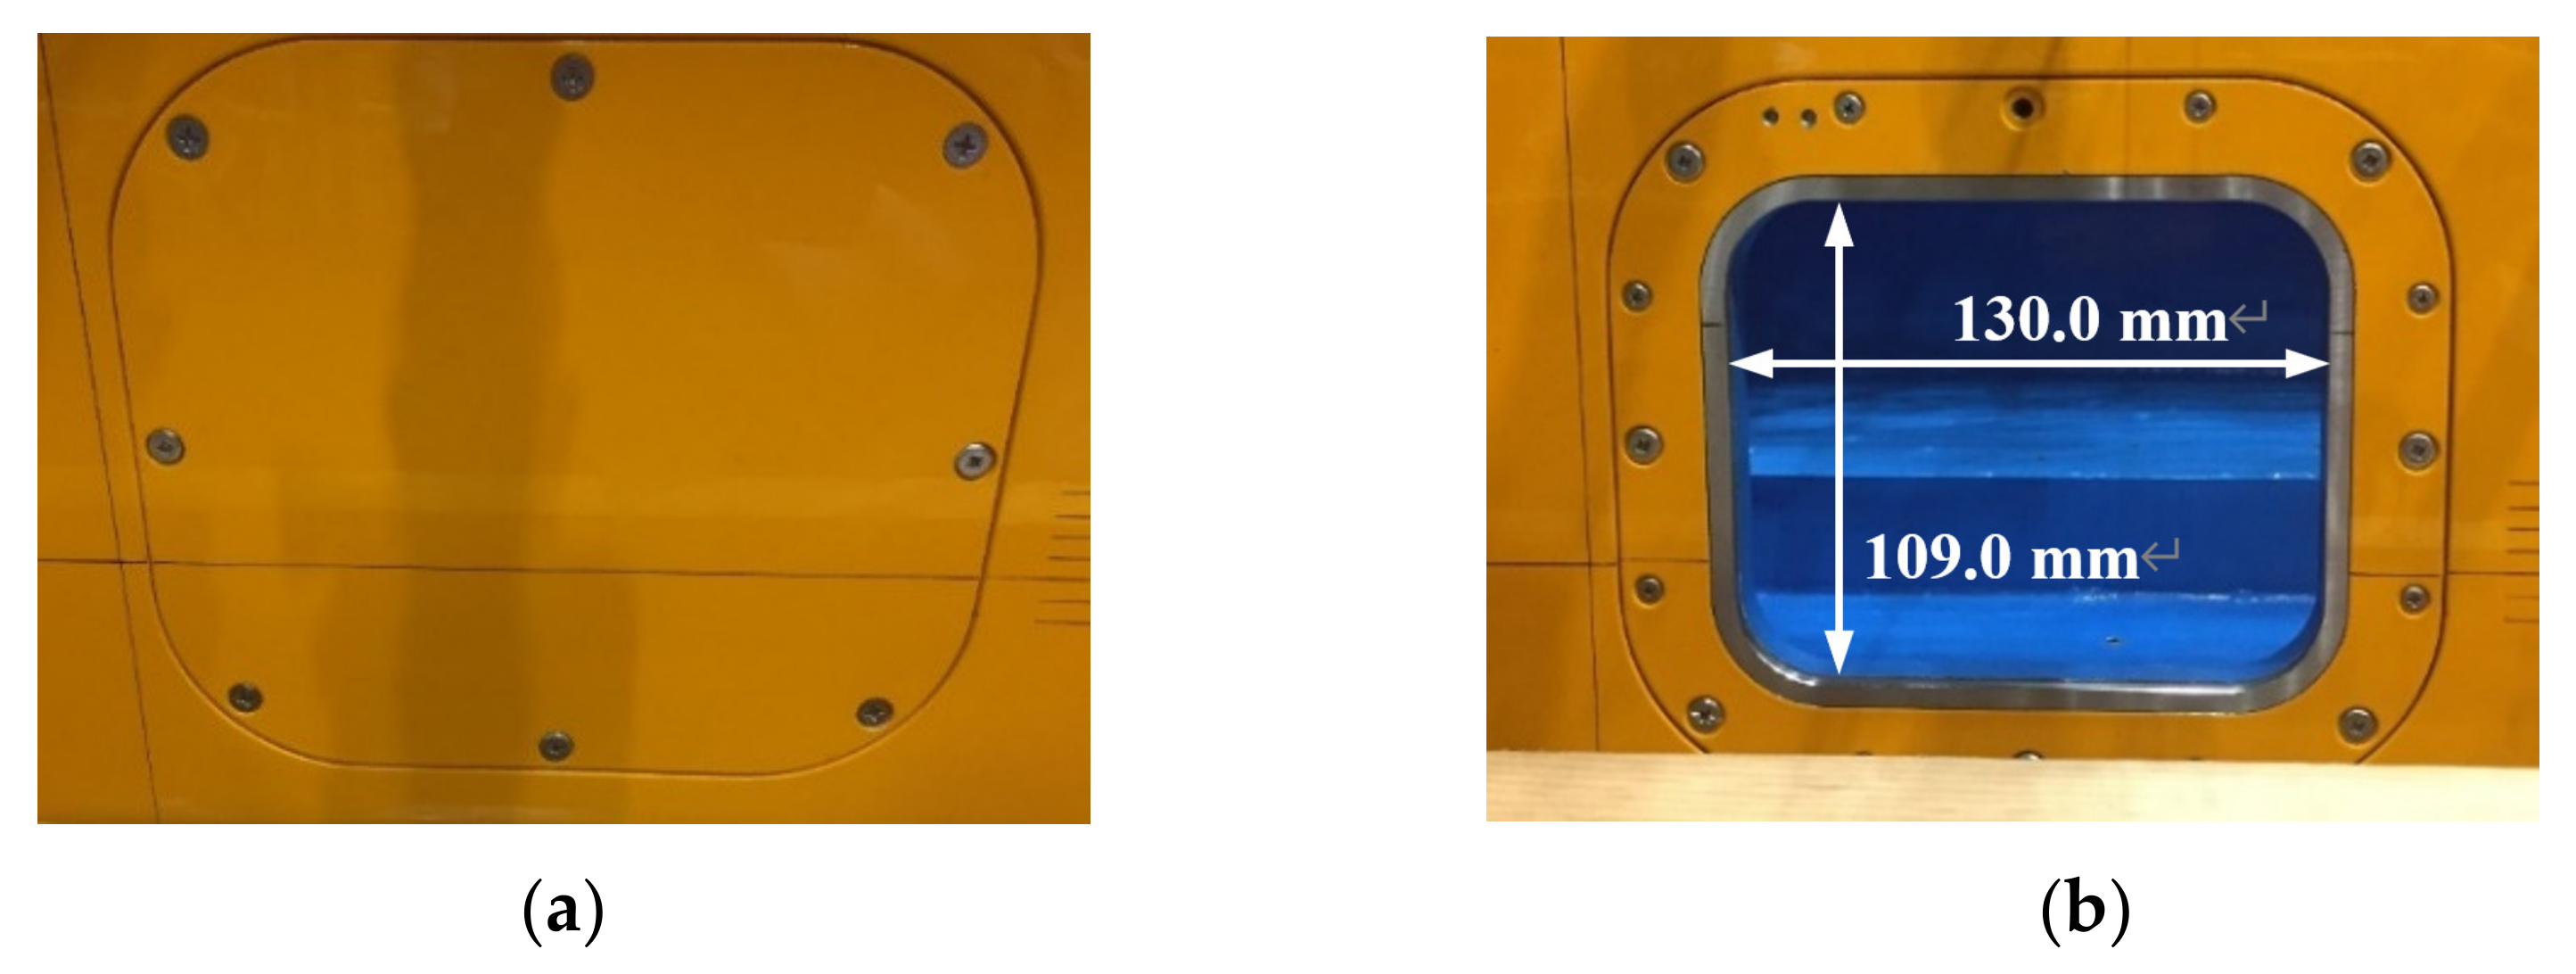
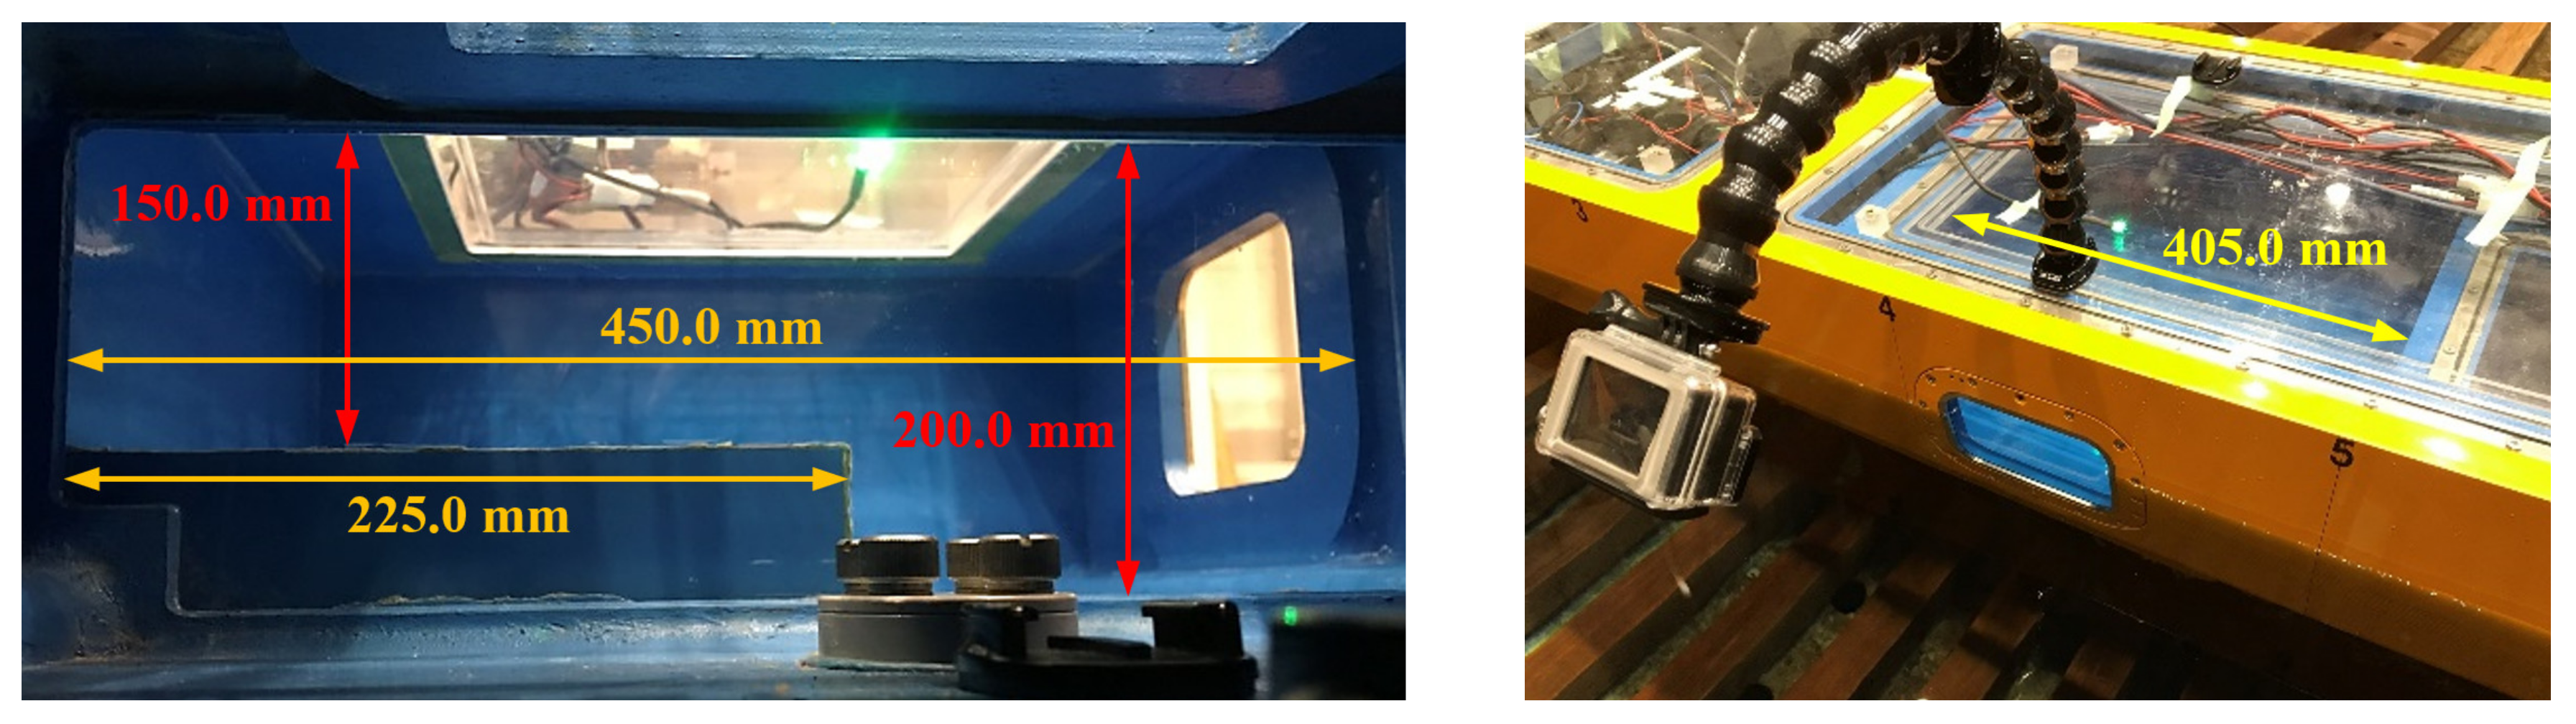
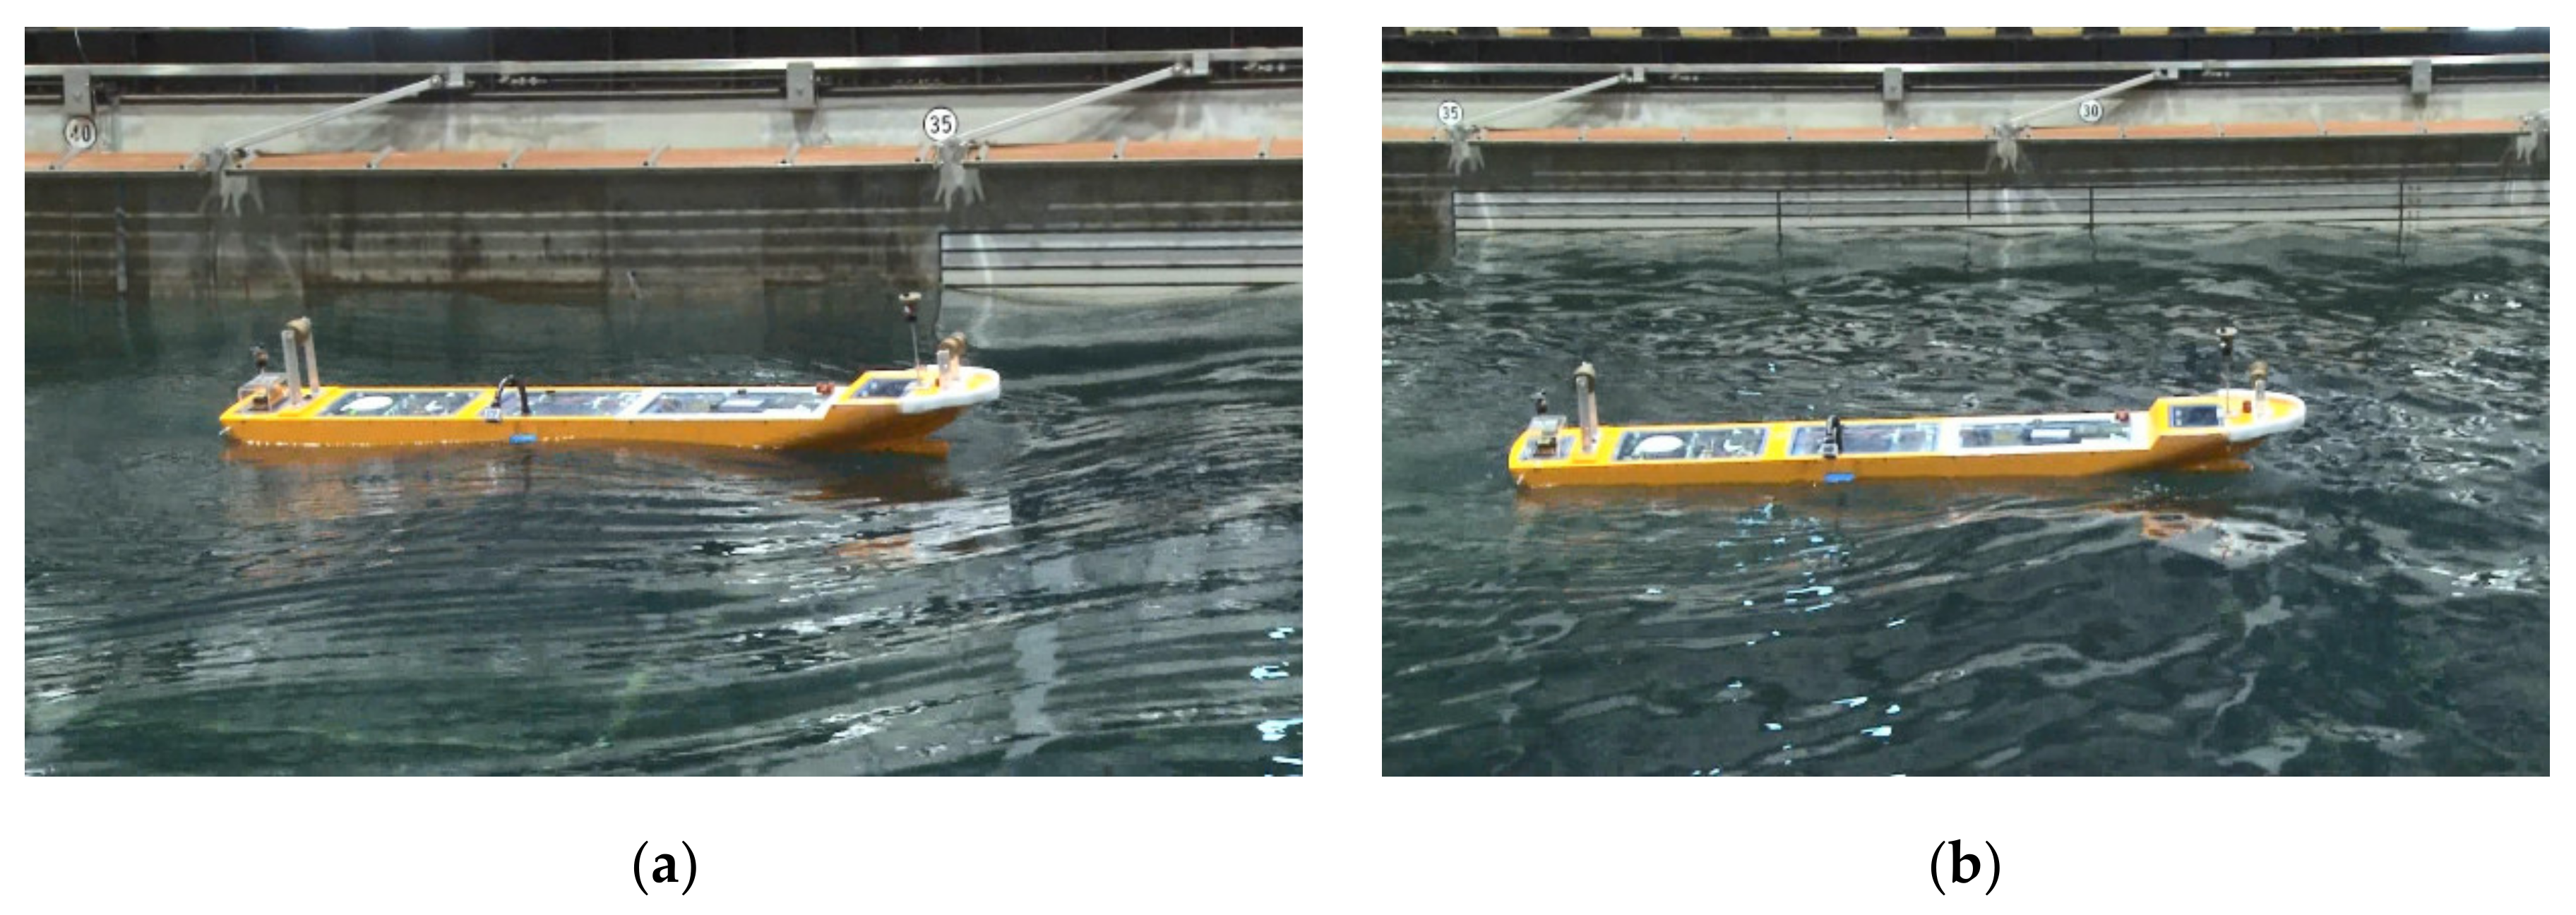
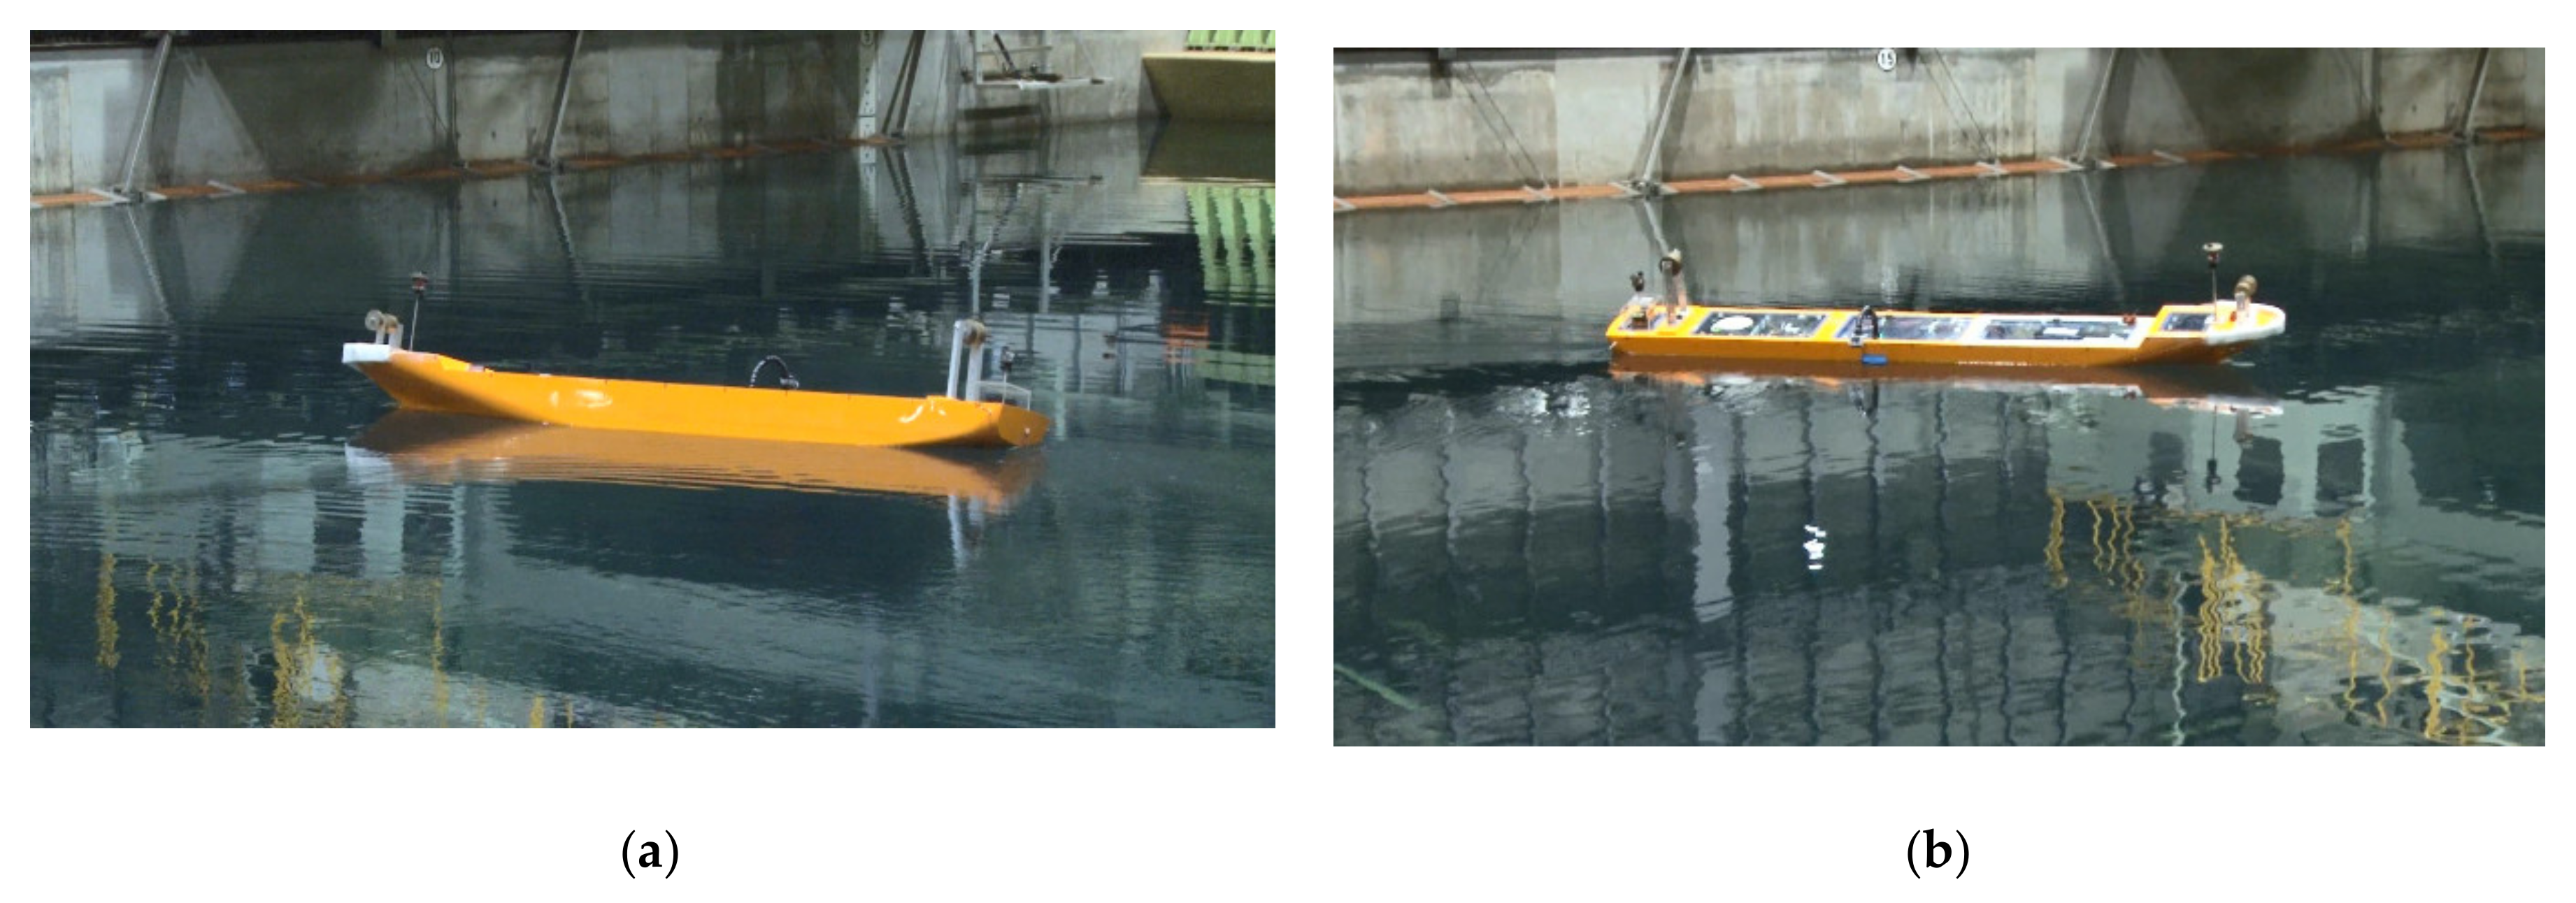
An aluminium frame was embedded on the starboard side around the midship. By attaching a lid to this aluminium frame, experiments in the intact state can be conducted (Figure 2a). By attaching a lid with a rectangular hole to the aluminium frame, experiments in a damaged state can also be conducted (Figure 2b). The damaged compartment is a combination of two continuous compartments, but without the vertical bulkhead, and its top is closed with the horizontal bulkhead. Figure 3 shows the floodable space inside the ship and the length and location of the damaged compartment. In the experiment, multiple decks are not realized because perfect water tightness cannot be expected, due to the presence of ventilation pipes, once serious flooding occurs. As the horizontal length of a damage opening is not uniquely determined by the current stochastic criteria of damage stability, IMO resolution MSC.194 (80) [16], it was determined based on the past deterministic criteria of damage stability. For the vertical height, the bottom of the opening was set to the allowable lowest limit from the viewpoint of the structural strength of the ship model.
2.2. Experimental System
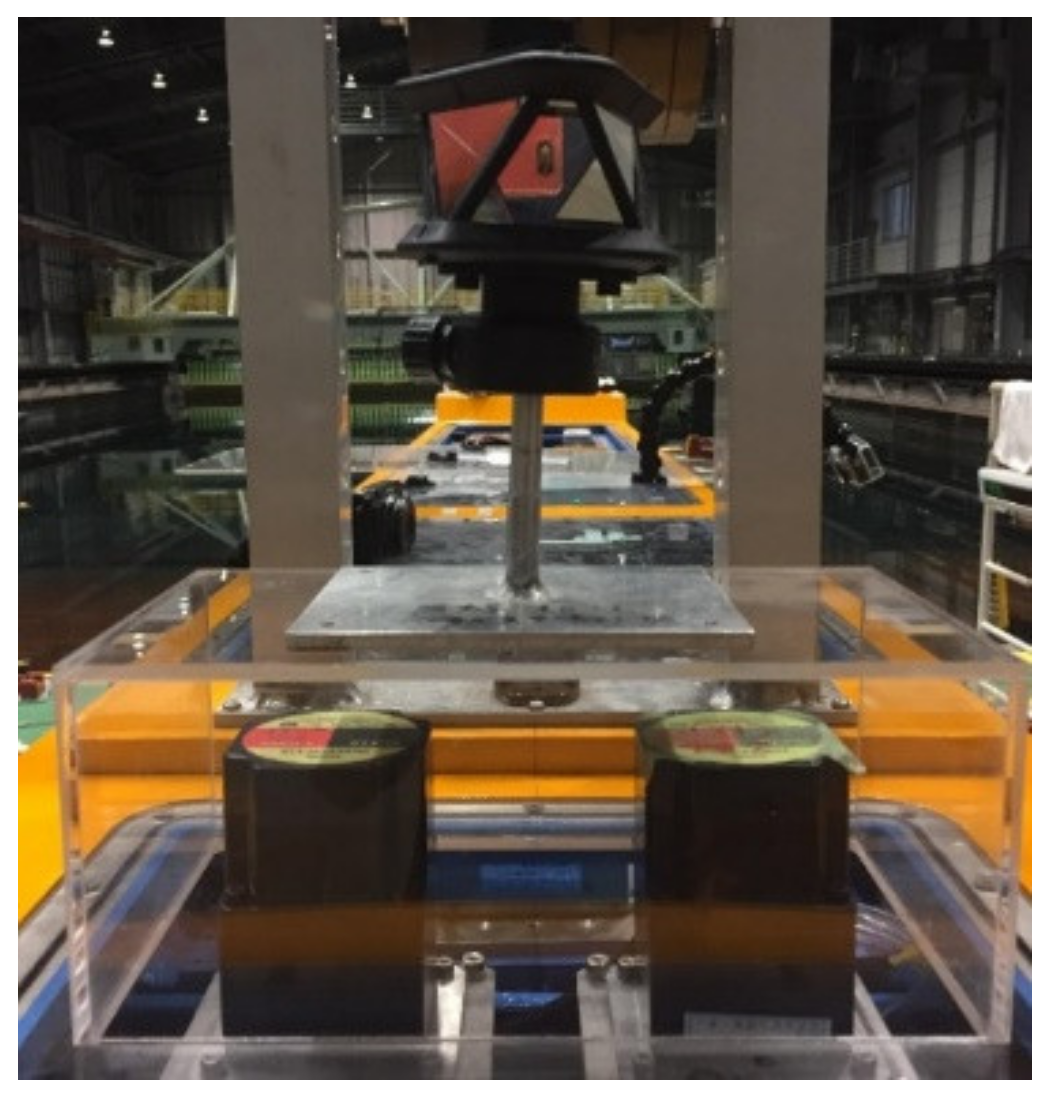
Free-running model tests were conducted at the Marine Dynamics Basin of National Research Institute of Fisheries Engineering (NRIFE). The dimensions of the basin were 60 m length, 25 m width, and 3.2 m water depth. Inside the ship model, there were electric motors for driving two propellers and two rudders, an optical fibre gyroscope for measuring rotational motions of the ship, a microcomputer for managing the experimental and measurement systems, and batteries for supplying power to these devices. It is important to measure ship translational motions accurately for the free-running model tests; therefore, the ship position was measured using the ‘total station system’. Two stations were set up on land, which were equipped with a light-wave rangefinder and theodolite. Figure 4 shows the total station reflection prism placed on the bow and stern of the ship as tracking targets. With these, distance measurement by the laser light could be performed. The maximum error of the motion tracing system is ±1.6 mm. By combining the positioning data obtained using the ‘total station system’ and rotational motion data obtained by the onboard gyroscope, a ship motion with six degrees of freedom (DoFs) could be uniquely determined (Umeda et al., 2014) [17]. In the experiment, the ship motion was recorded with a video camera from outside the basin. The high-repeatability of the free-running test, using the same measurement system, was reported by Matsuda et al. (2016) [18].
Regular waves, unidirectional irregular waves, and multidirectional irregular waves can be generated using 80-segmented plunger-type wave makers. For generating irregular waves, the ISSC wave spectrum, ISSC (1964) [19], was used. It is a two parameter spectrum, with parameters of significant wave height and mean frequency. The number of components of the elementary wave was 200 at unequally divided wave frequencies, to avoid the self-repeating effect, e.g., Hashimoto and Umeda (2019) [20]. The cosine fourth power was used for the directional distribution of short-crested irregular waves.
2.3. Experimental Condition
The propulsion requirement for SRtP described in SOLAS II-2/21.4.1 requests the propulsion ability to advance in head waves at six or more knots on Beaufort scale 8. In the experiment, the minimum propeller rotational number satisfying this requirement was determined by repeating the speed trial test. As wind blowers were not used in the experiment, a decrease in speed due to the presence of wind was not considered. Therefore, long-crested irregular waves, in which the added resistance in the waves increases compared to short-crested irregular waves, were used to determine the minimum propeller revolution number that satisfied the propulsion requirement for SRtP.
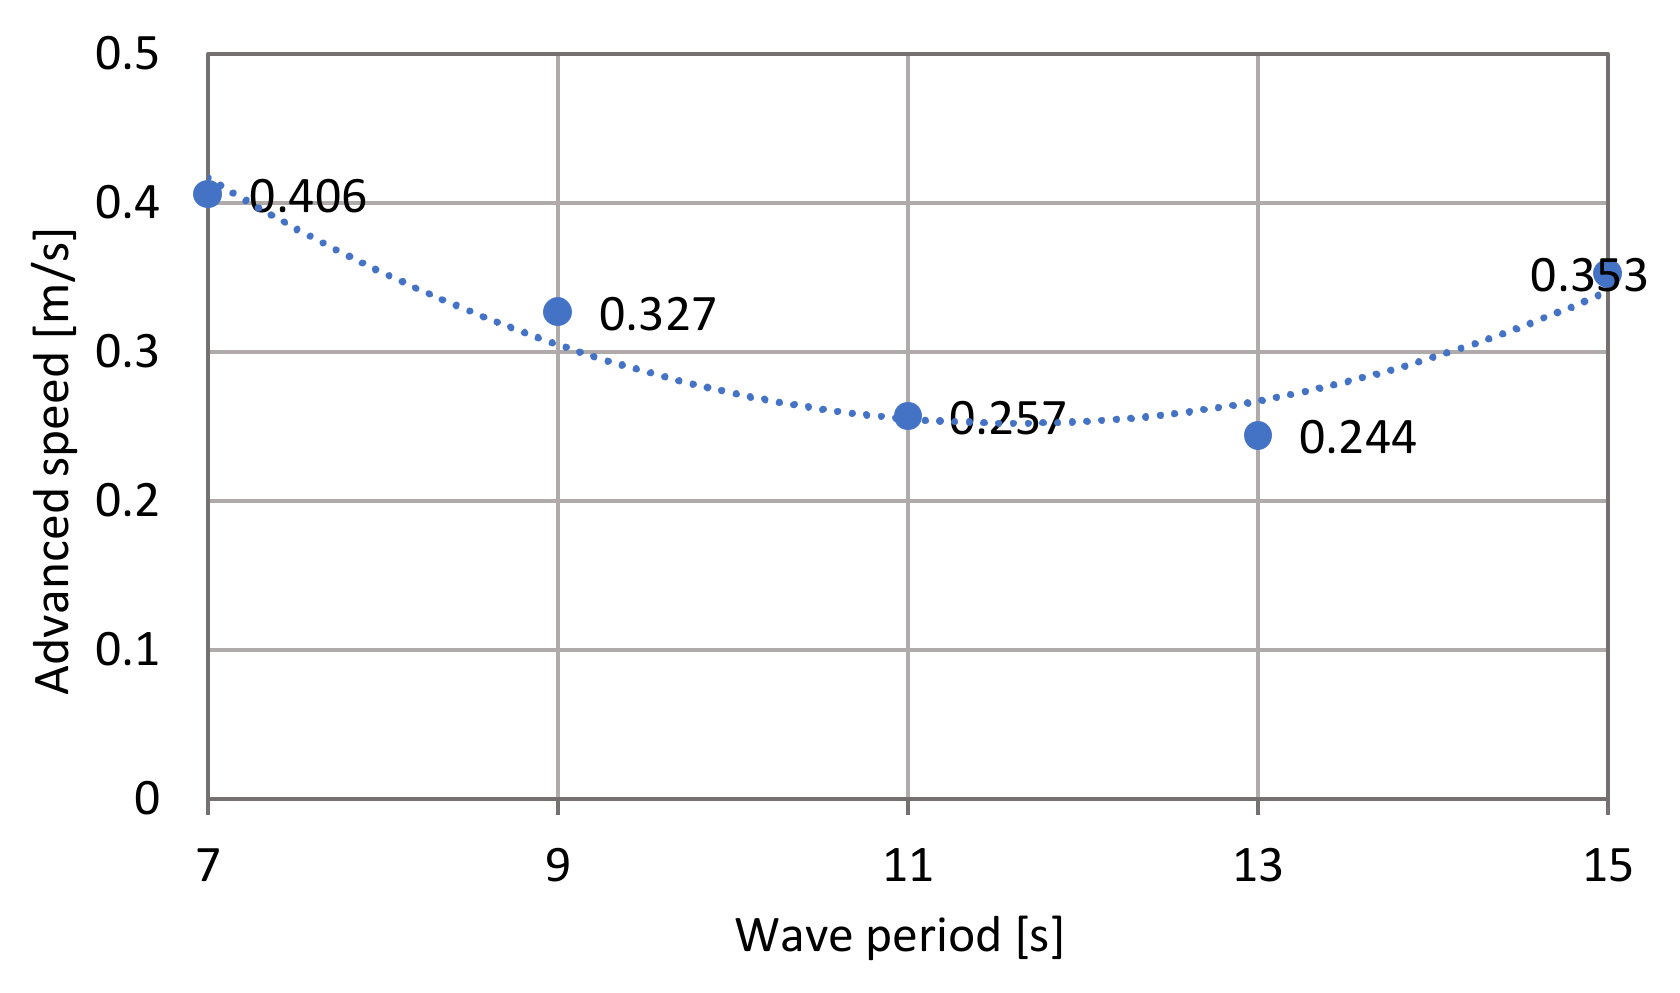
Regarding the wave height in long-crested irregular waves, a significant wave height of 5.5 m was used, which is equivalent to Beaufort scale 8. As the possible range of the mean wave period is quite wide, the wave period providing the largest speed drop in regular head waves was investigated first. Figure 5 shows the effect of wave period on the ship’s forward speed in regular head waves. Drawing a second-order approximation curve, 11.6 s was found to be the wave period showing the largest speed drop on the real ship scale. The obtained period was used as the peak period of the long-crested irregular waves, which can be transformed into the mean period of 8.95 s using their relationship, e.g., ITTC (2002) [21]. Then, the minimum propeller revolution number was determined, which satisfied six knots on a real scale. As a result, the propeller revolution marginally satisfying the propulsion requirement for SRtP was determined as 706 rpm in the model scale. Therefore, all experiments in long- and short-crested irregular waves, in the following sections, were conducted with a significant wave height of 0.067 m and a mean wave period of 0.988 s in the model scale, which correspond to 5.5 m and 8.95 s in the real scale, respectively.
3. Experimental Results
3.1. Course-Keeping Test in Waves
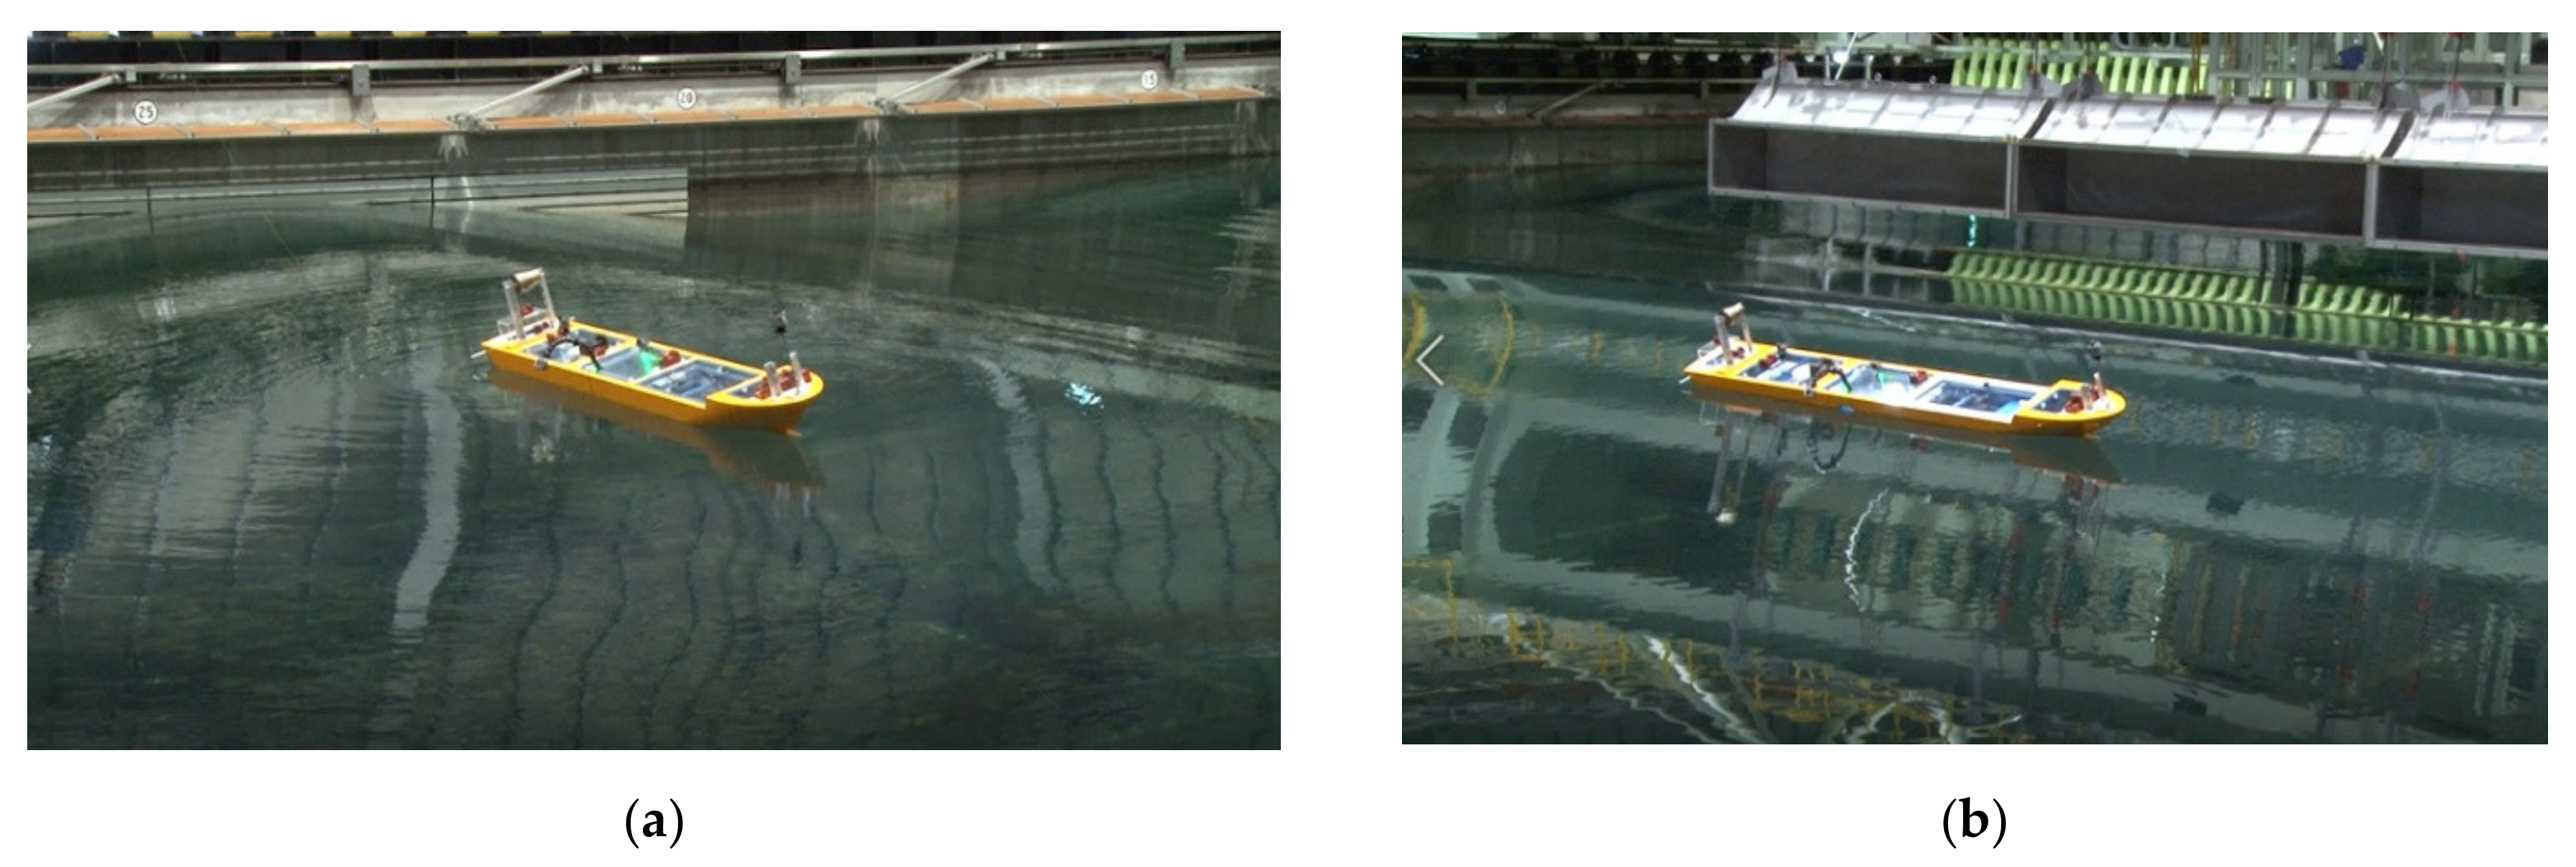
Using the propeller speed determined in the previous section, free-running model tests were conducted in regular head waves, long-crested irregular head waves, and short-crested irregular head waves. The tests were conducted in both intact and damaged states, and the measured results of a 6-DoFs ship motion were compared to confirm the effects of floodwater on the manoeuvring performance in the damaged/flooded condition. Table 2 shows parameters related to the dynamic motion of the ship in the intact state. In the damage state, 13.6 degrees of steady heel angle resulted from the asymmetricity of the damaged compartment, as shown in Figure 3. Note that the metacentric height indicates the value for the intact and upright condition. A snapshot of the free-running model test is shown in Figure 6.
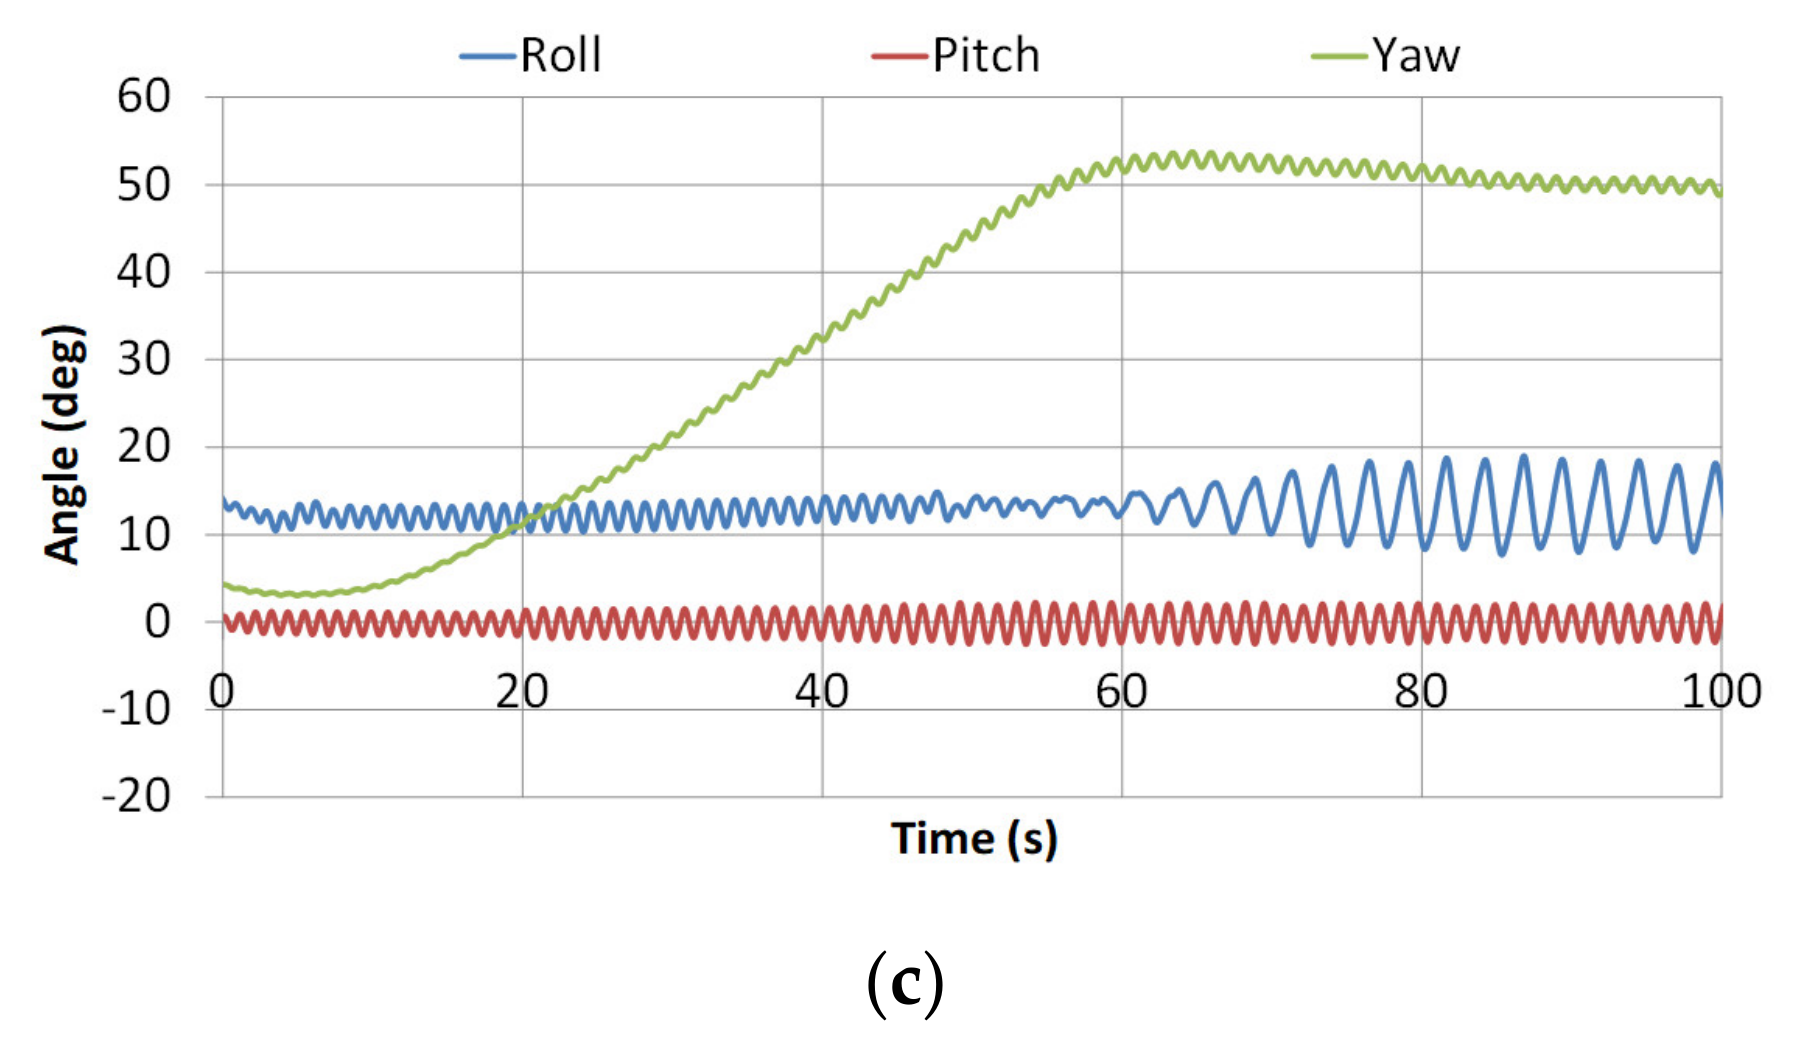
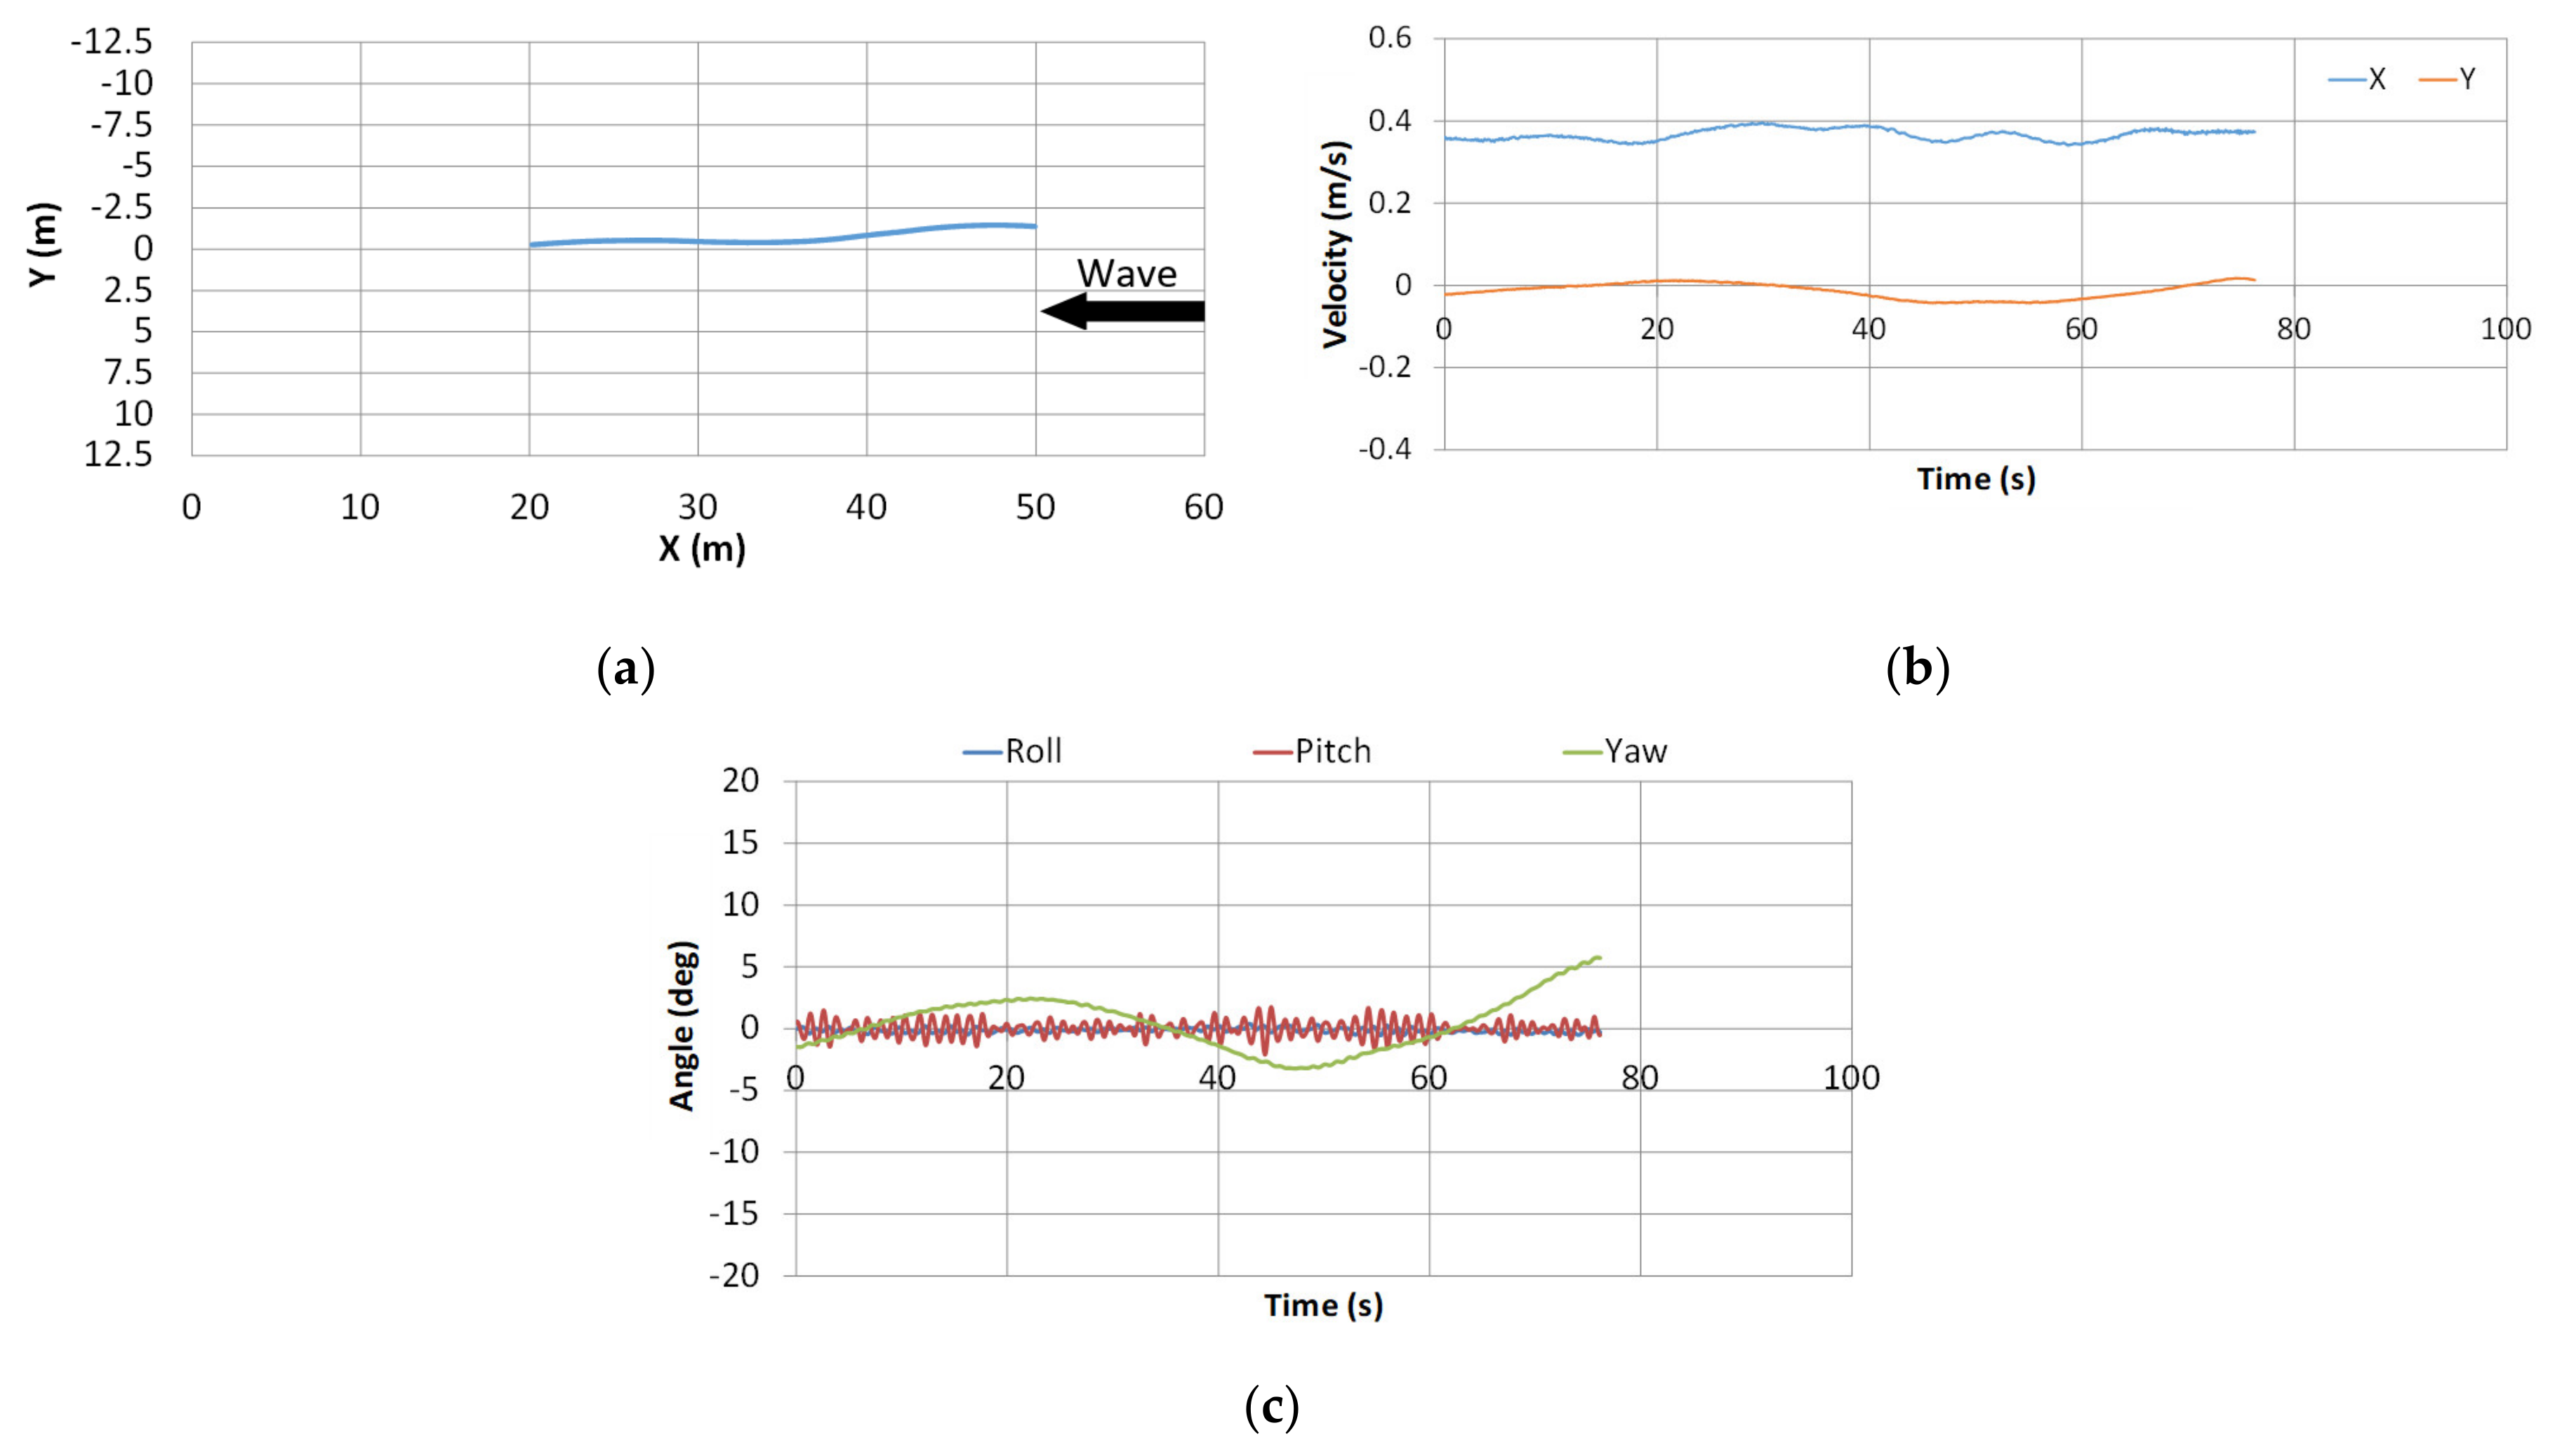
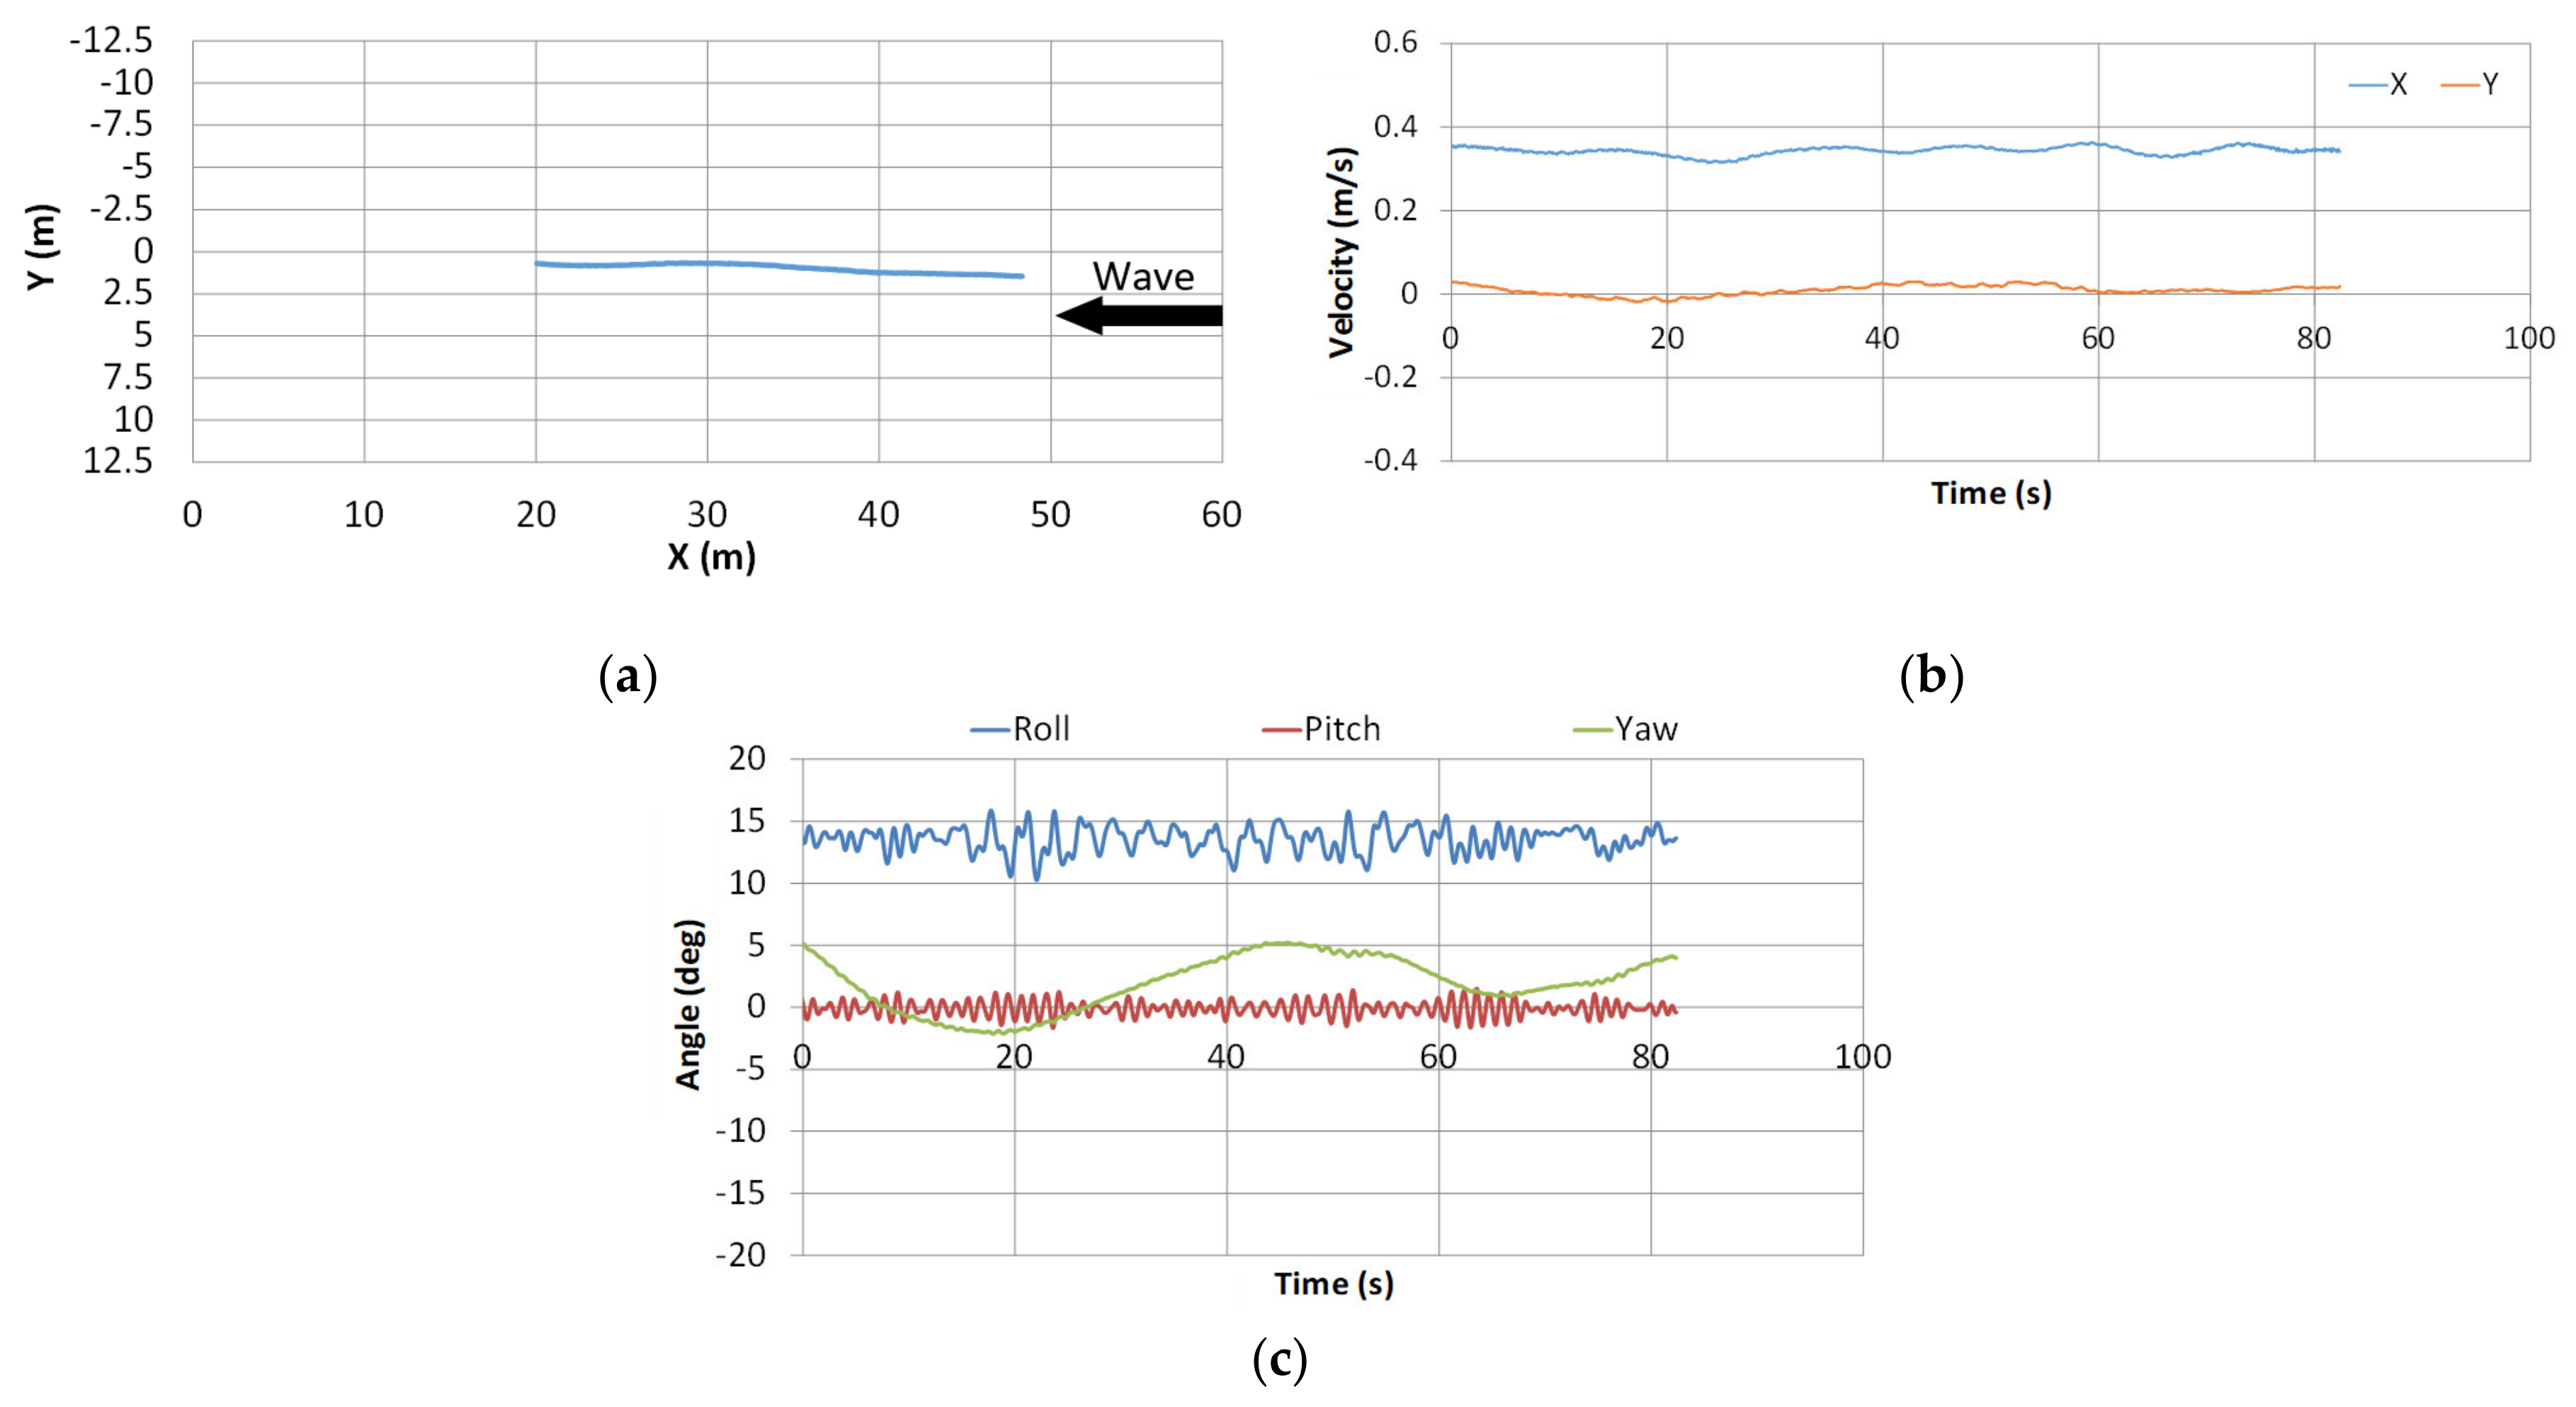
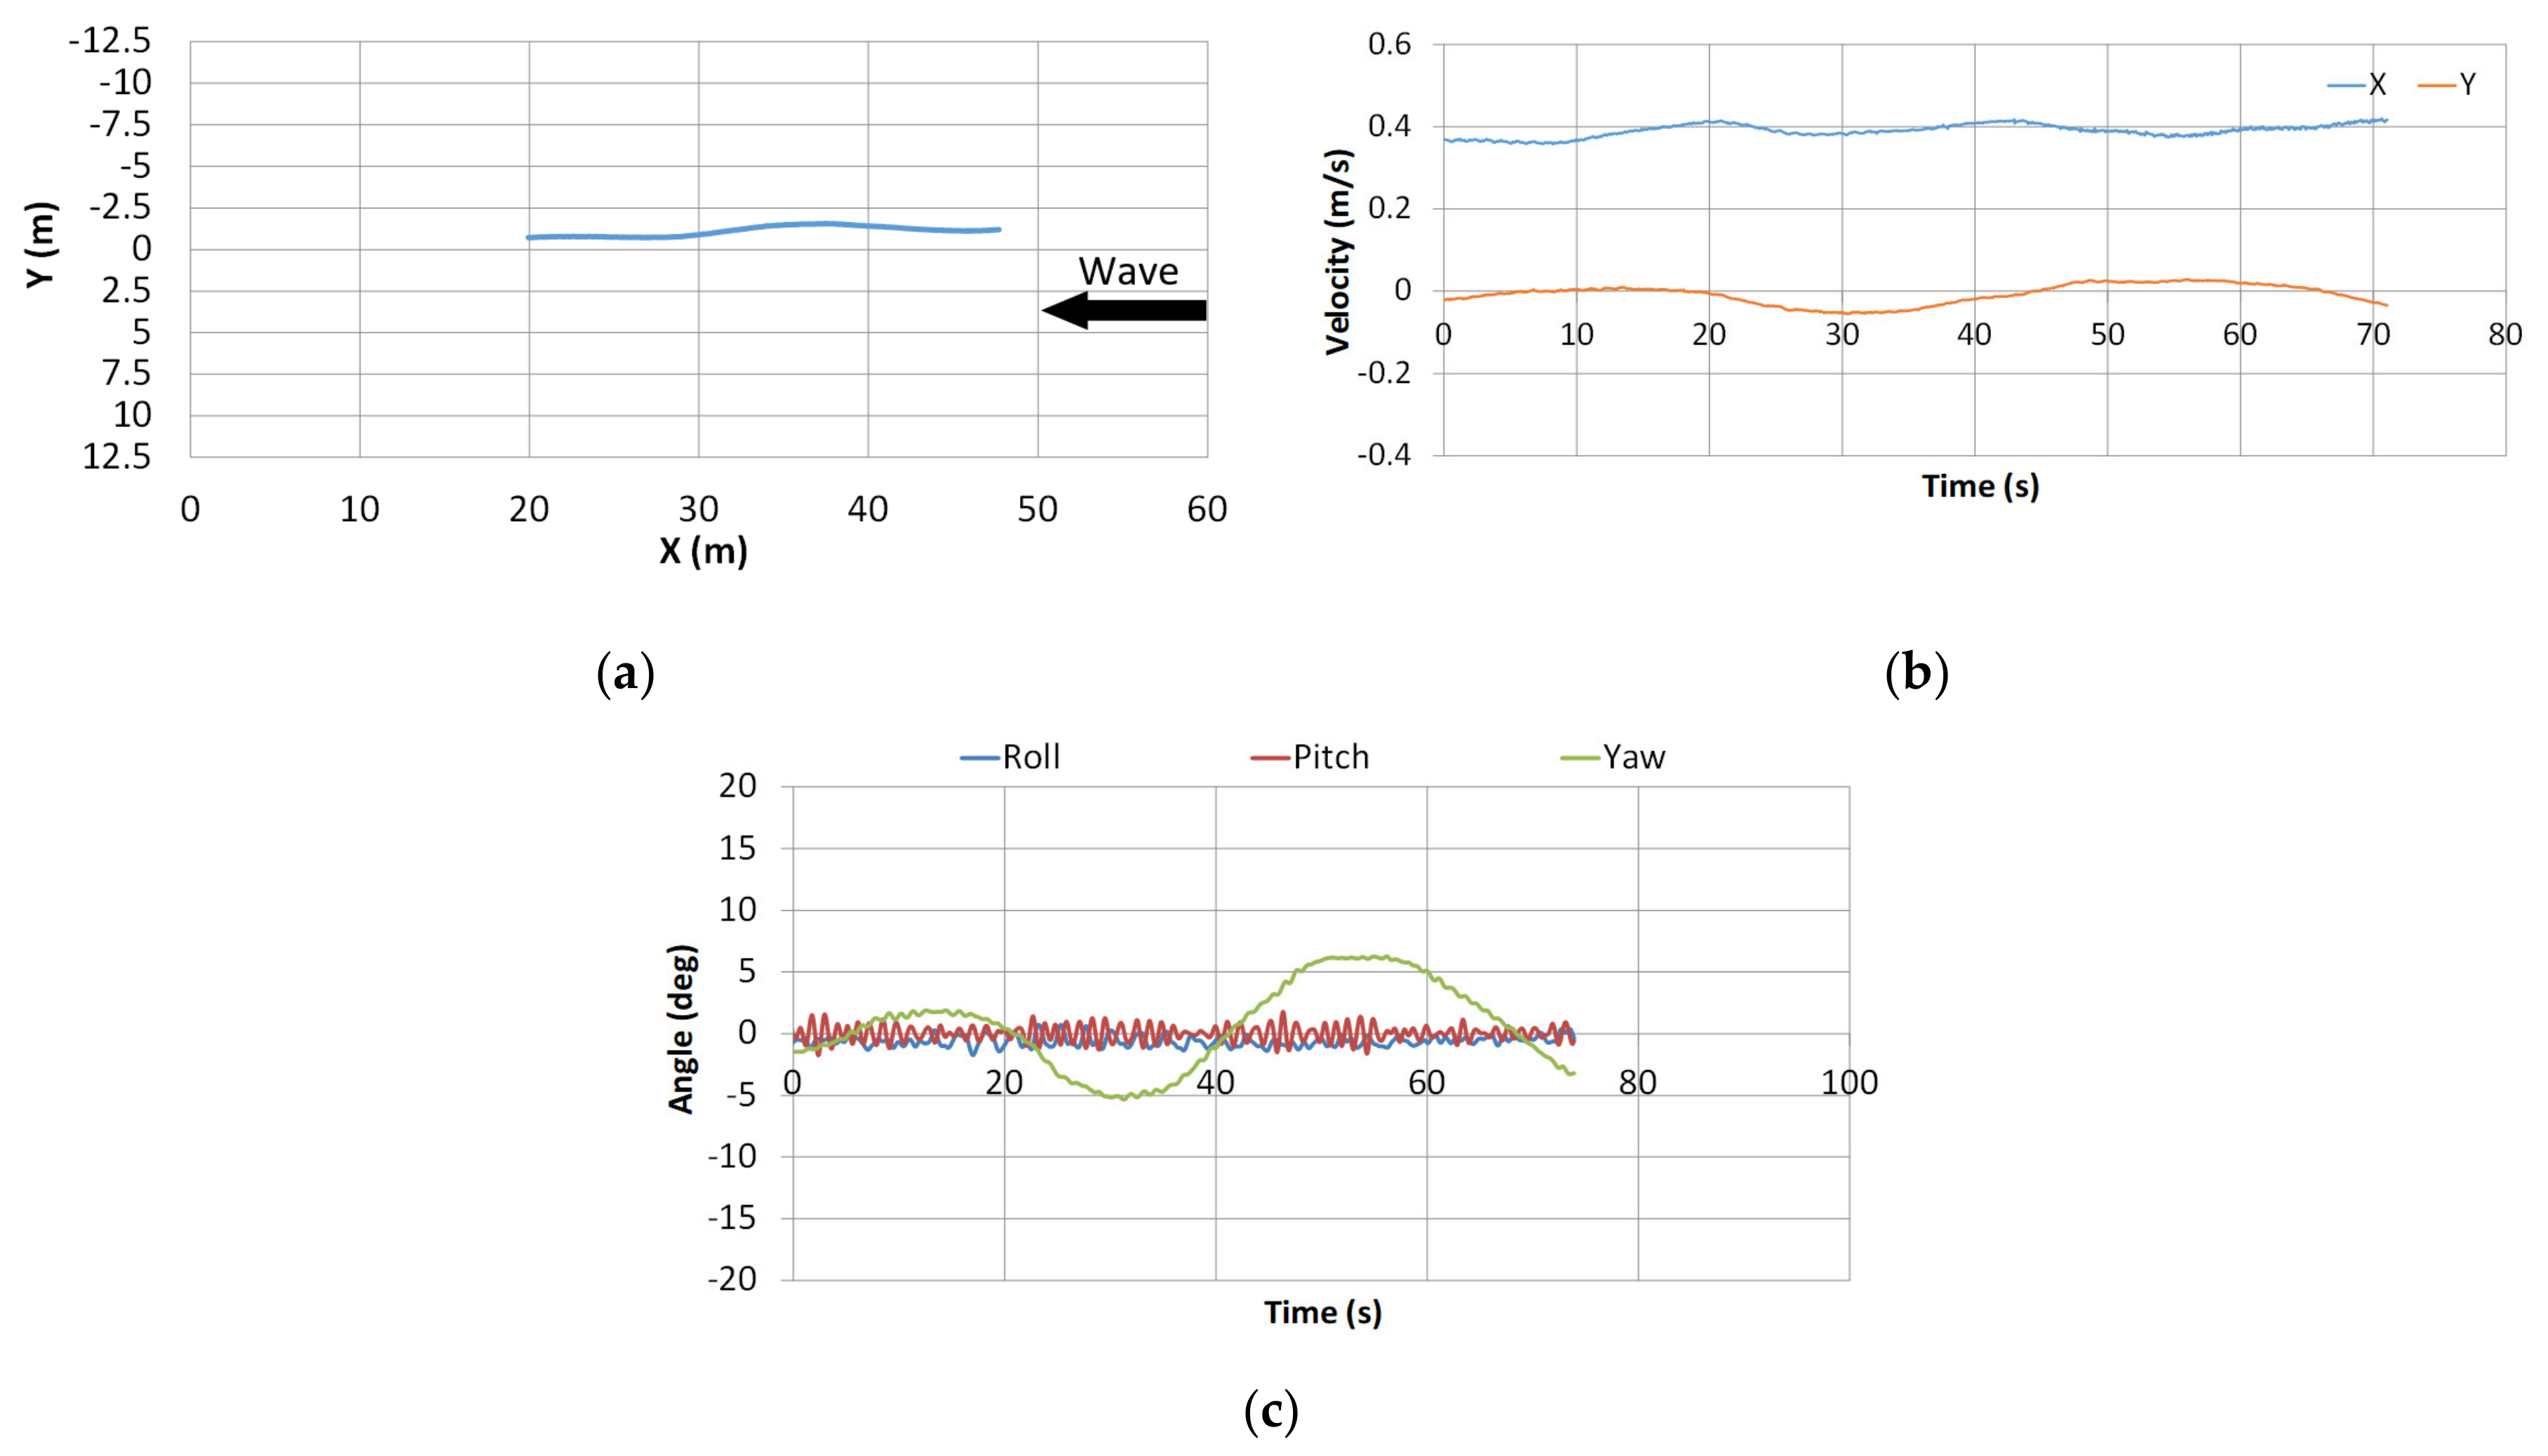
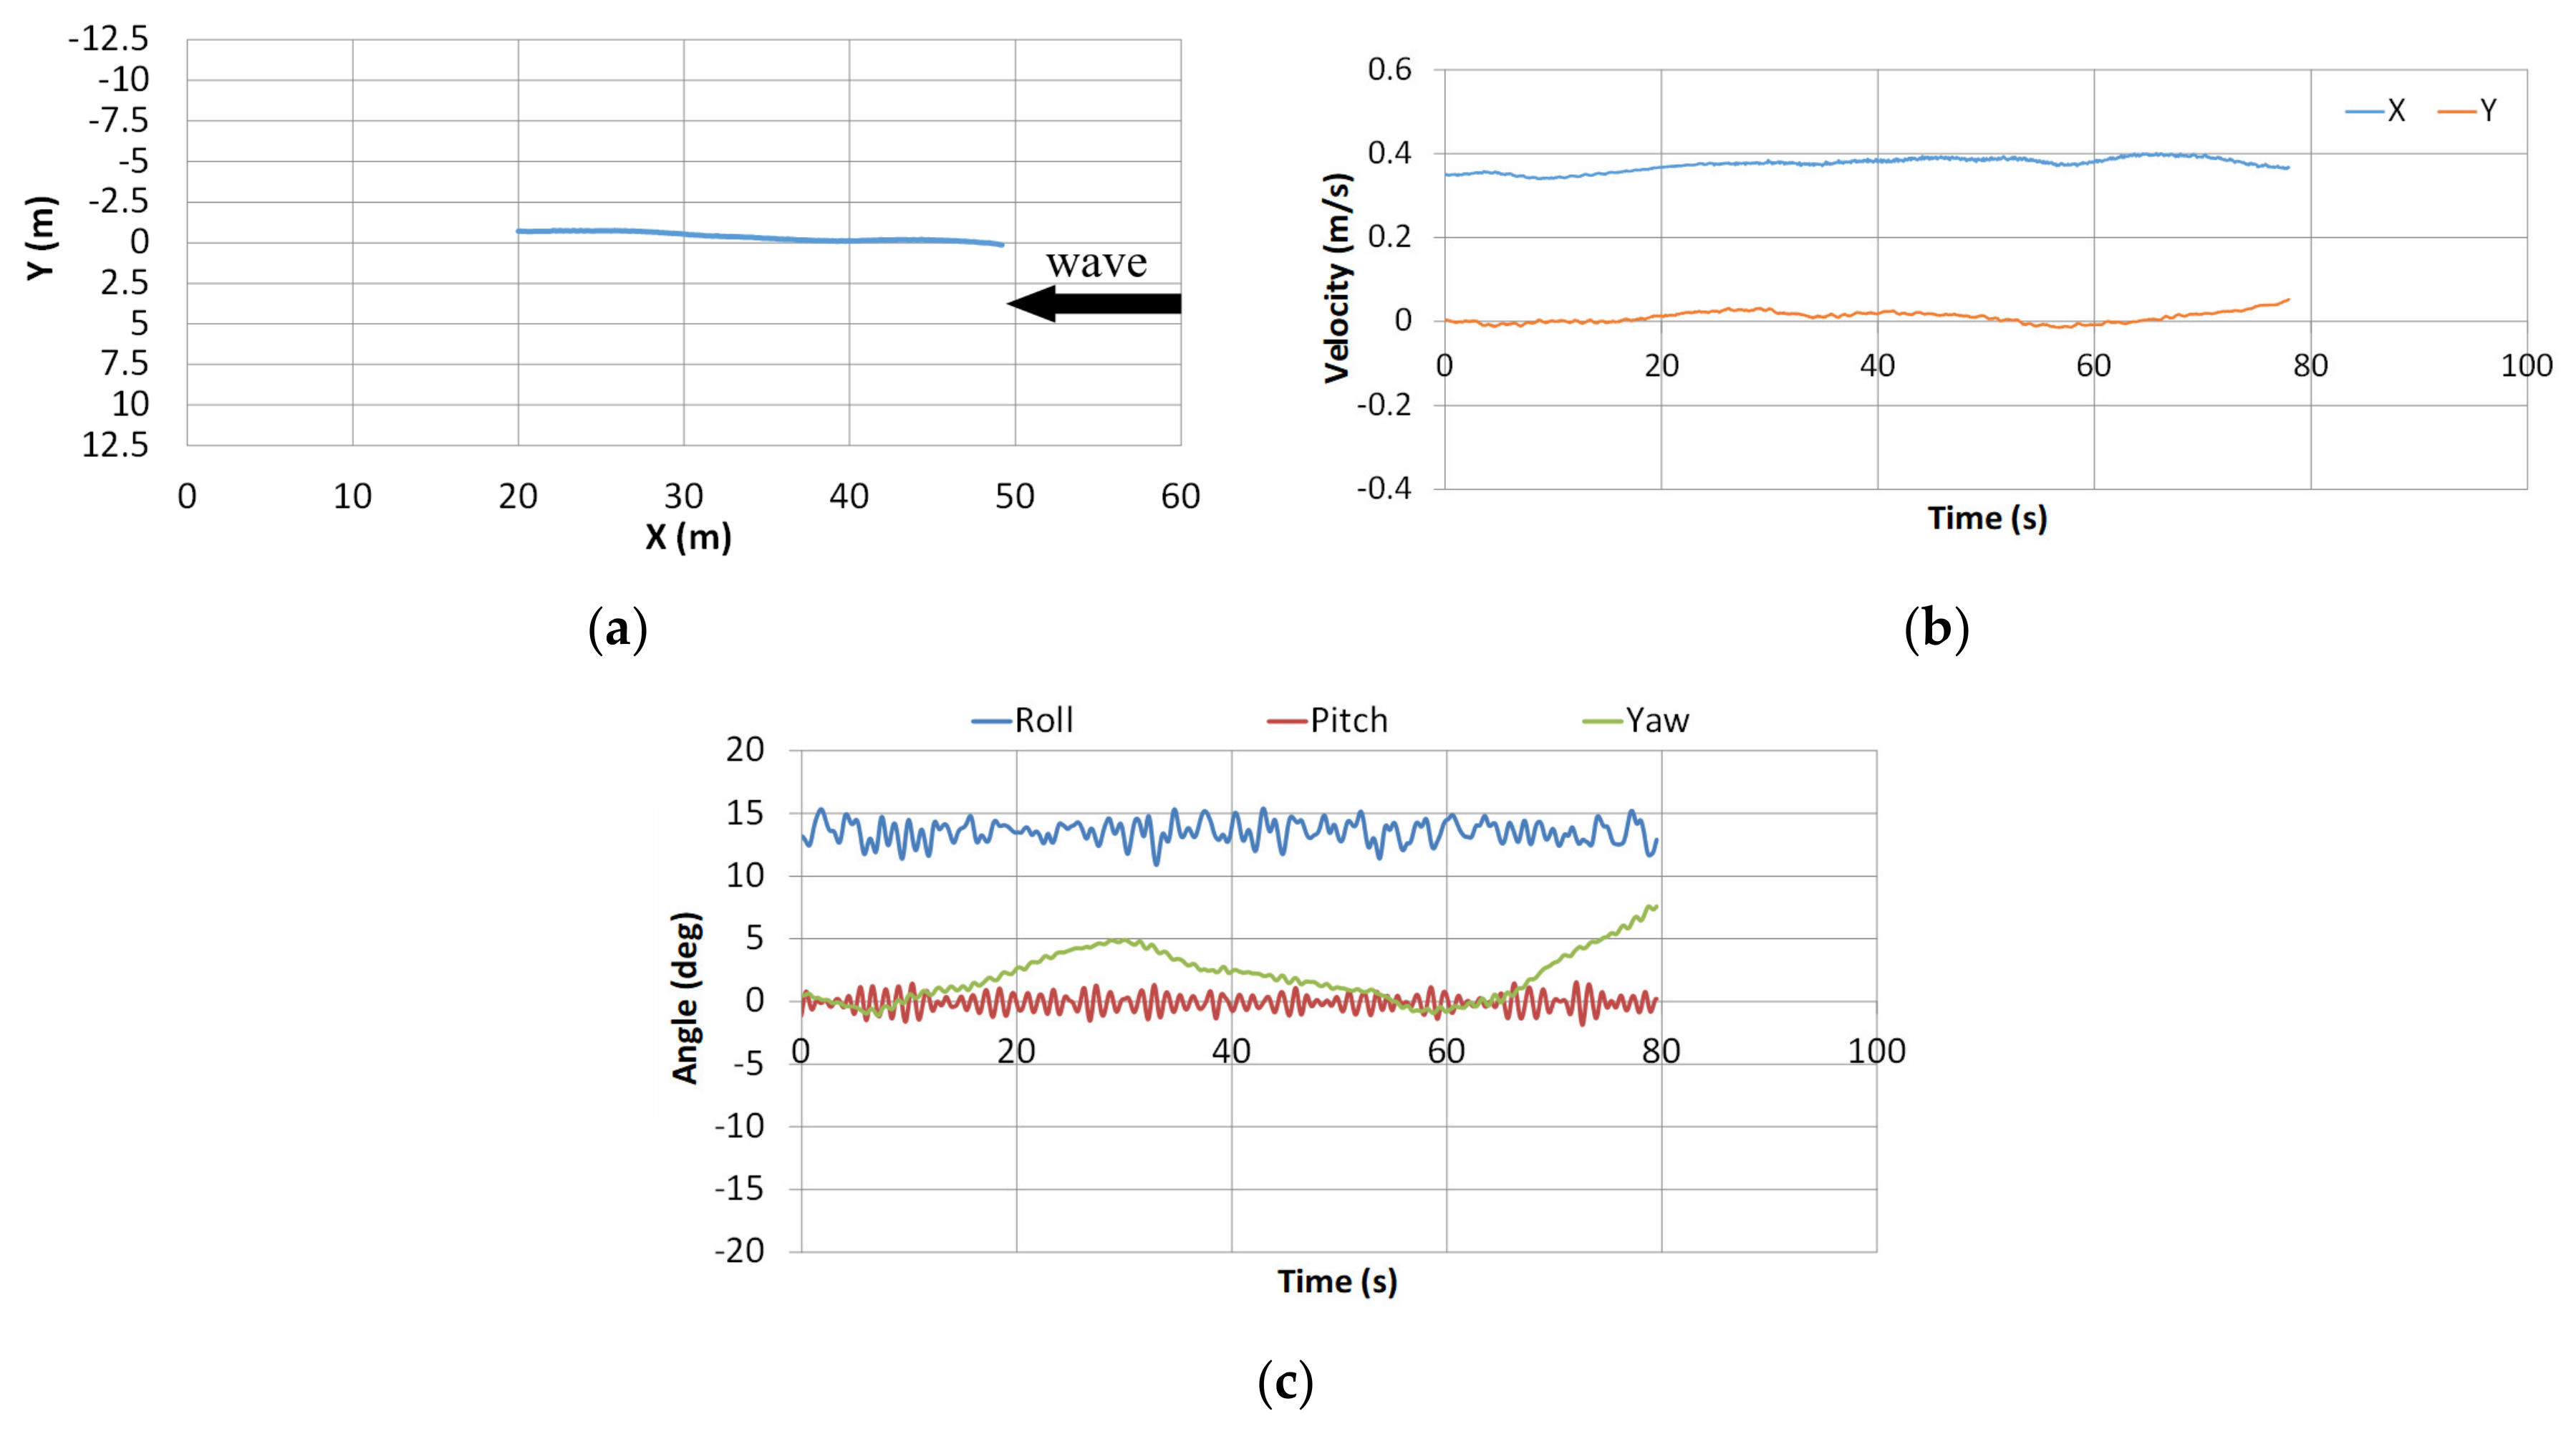
Figure 7, Figure 8, Figure 9, Figure 10, Figure 11 and Figure 12 show the time series of ship trajectory, longitudinal and transversal velocities, and rotational angles of the ship in regular waves, long-crested irregular waves, and short-crested irregular waves. In the figures, the arrow represents the (major) direction of wave propagation. The experiment was conducted for three types of waves in two states, intact and damage conditions; thus, a total of six free-running tests were conducted. In all conditions, the ship met incident waves after the propeller revolution number settled down to the desired value. A simple proportional control with a gain of 1.0 was used for the auto pilot to keep a course.
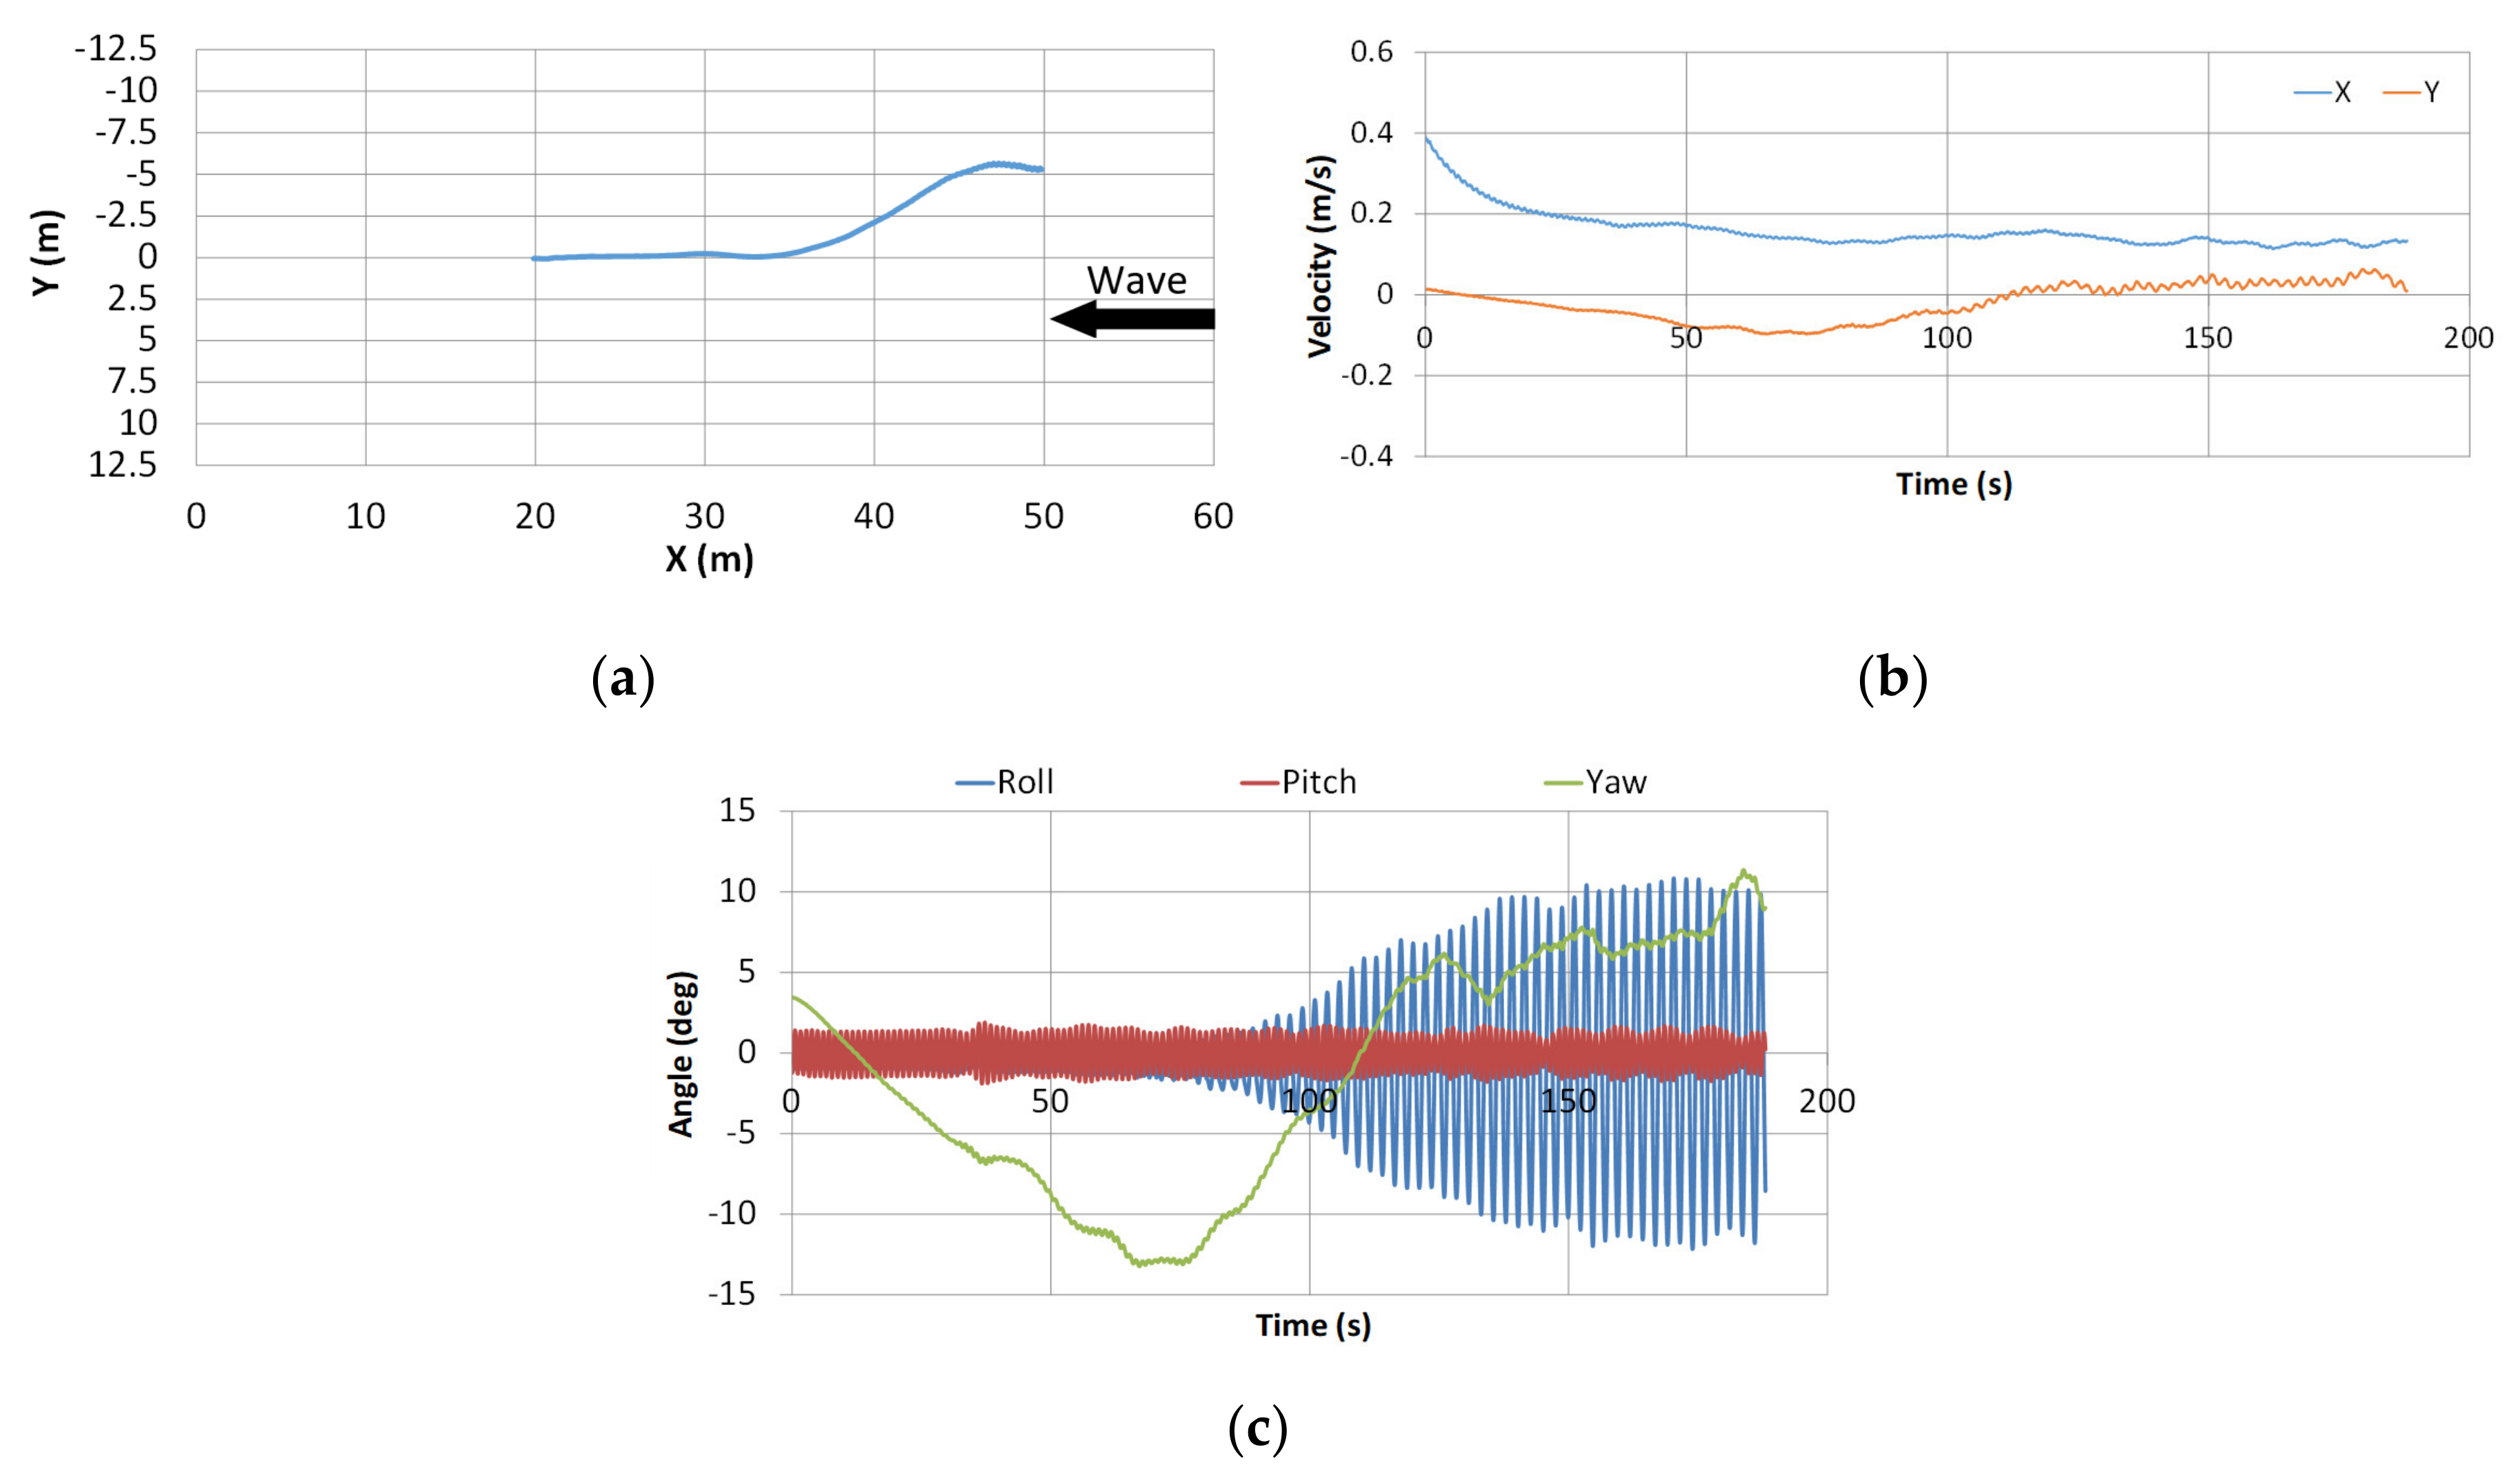
Figure 7 and Figure 8 show the results in regular head waves for the intact and damaged states. In the intact condition, it was possible to proceed against the incoming waves to maintain the desired course. On the other hand, in the damaged condition, it was difficult to proceed against the waves and to maintain the desired course, and thus, the ship drifted laterally. One reason for the different behaviours is that a turning moment was induced because of the asymmetric underwater hull caused by the steady heel in the damaged condition. The result of ship rotational motions indicated that a roll motion was gradually excited, and finally, reached the amplitude of 10° in the intact condition and 5° in the damaged condition. Here, the encounter period was about a half of the natural roll period, so it is a so-called ‘parametric roll’ phenomenon, c.f. Paulling (2011) [22]. The reason why the amplitude in the damaged condition was smaller than that in the intact condition is that the natural roll period could be shorter and the roll damping could be larger when floodwater exists inside the ship.
From the experimental results of long-crested irregular head waves shown in Figure 9 and Figure 10, as well as those of short-crested irregular head waves shown in Figure 11 and Figure 12, it was found that the course-keeping ability could be secured against incident waves even in the damaged condition, while this was impossible in the case of regular waves. This is because the added wave-induced resistance was suppressed by the irregularity of the encountering waves. Although there was no significant difference in the ship motion between the intact and damaged conditions, the forward speed tended to be smaller in the presence of floodwater. This might be because the ship weight increased due to the floodwater, and the ship resistance slightly increased due to the steady heel angle exceeding 10°. Regarding the ship velocity in the opposite direction to the incoming waves, it was impossible to go ahead in regular waves, but 6.0 knots in long-crested irregular waves and 6.6 knots in short-crested irregular waves could be achieved. These results indicate that the subject ship exhibited the required propulsion performance and course-keeping ability in waves for SRtP, even in a serious damage situation.
3.2. Drifting Test in Beam Waves
It can be easily imagined that a ship can lose her propulsion function in serious damage and flooding events. Therefore, a model experiment in a freely drifting condition in waves was conducted. In a drifting condition without any propulsion, a synchronous roll in beam waves, where the wave period equals the ship’s natural roll period, is considered the most dangerous situation, except for the afore-mentioned parametric roll. Therefore, a free drifting experiment in regular beam waves was performed at several wave periods. Here the wave encounter angle was ±90°, considering the left–right asymmetric damage. The wave conditions in the experiment are shown in Table 3. In the case of the wave steepness of 1/40, the wave period corresponding to the natural roll period was included, but not in the case of 1/20 wave steepness, because of the limitation of the wave maker. However, this wave period corresponds to a wavelength of more than 900 m in the actual ship scale, and hence, the occurrence probability of such a wave is almost zero. For comparison, the model experiment was conducted for both the intact and damaged conditions, under the same wave conditions (Figure 13).
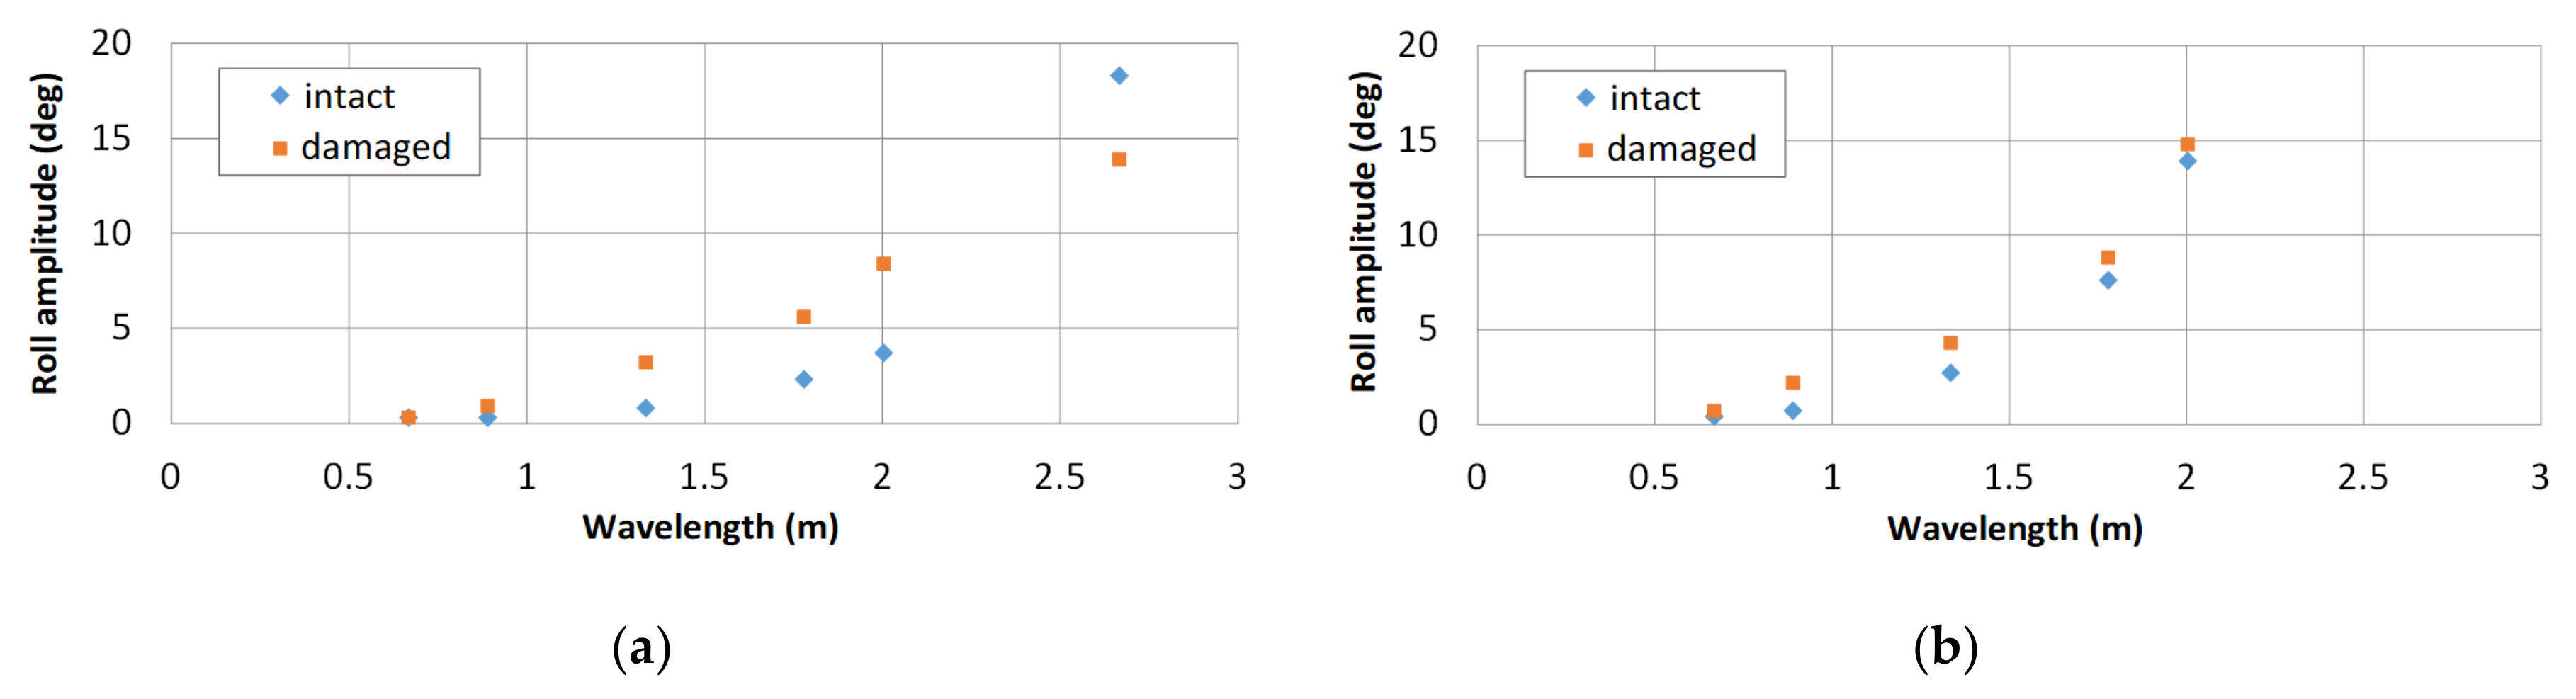
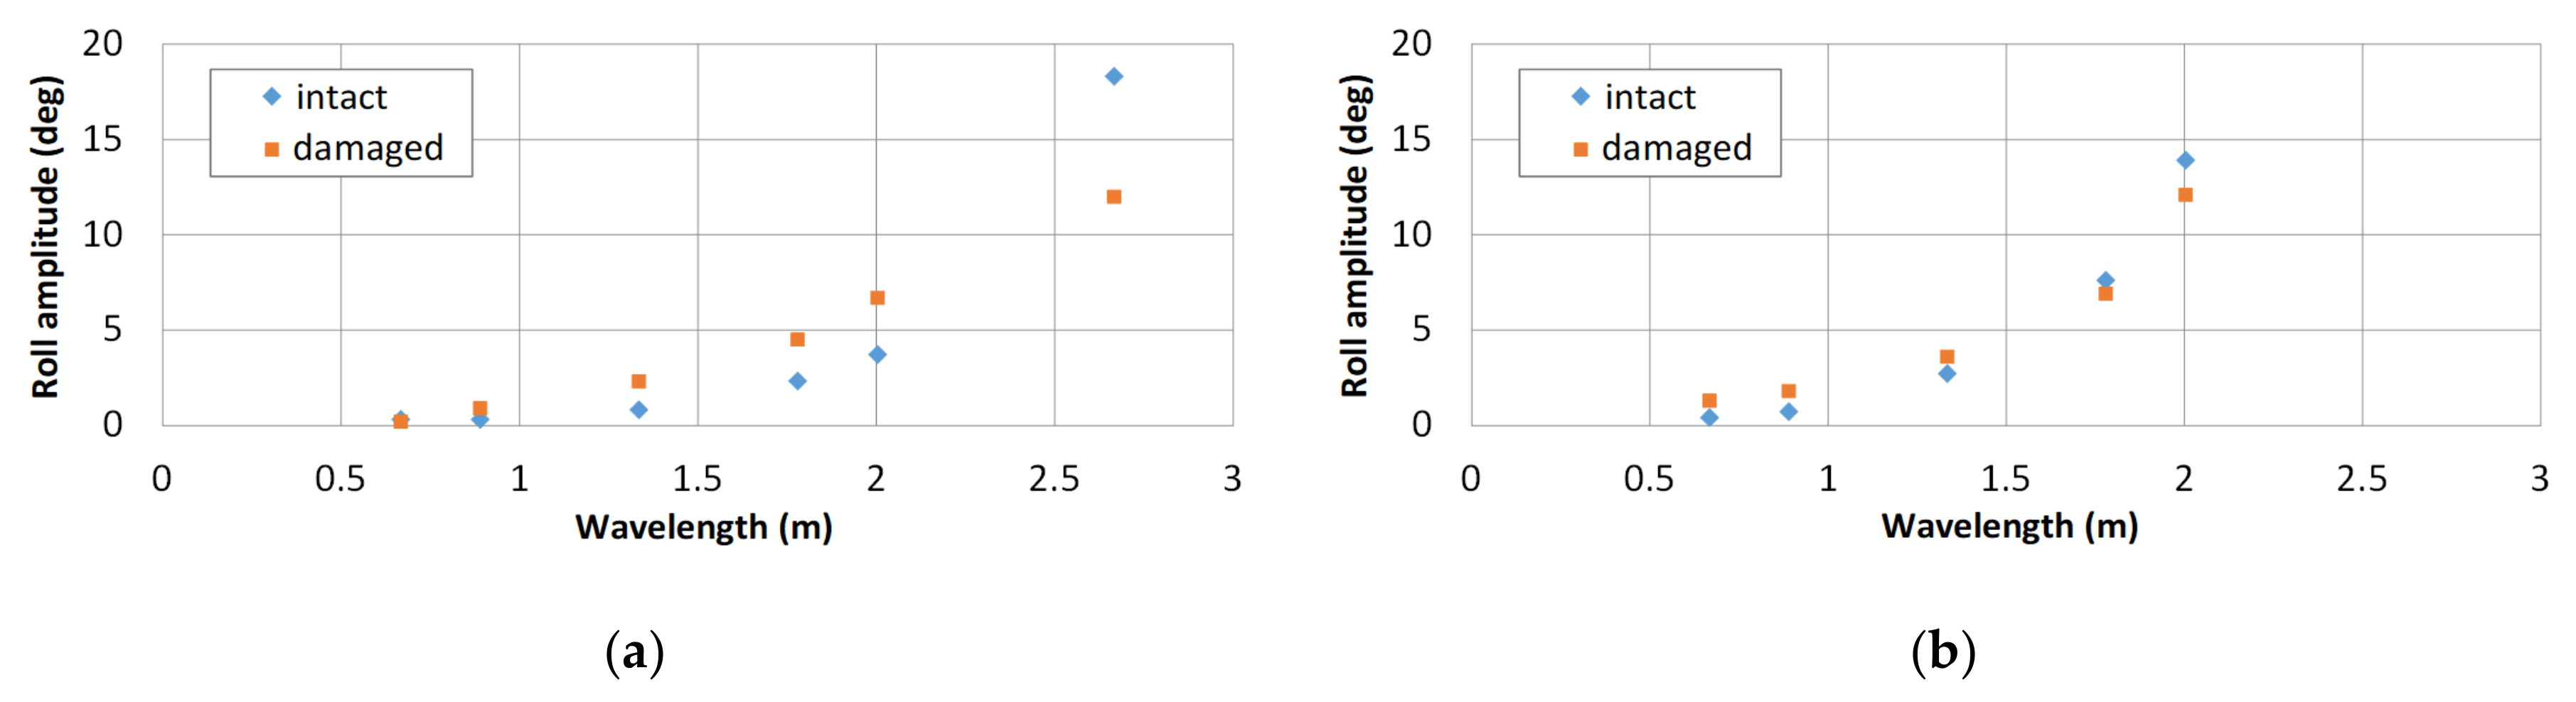
Regarding the effect of damage/flooding on the roll motion in beam waves, Figure 14 shows the result when the damage opening was to the waveward, and Figure 15 shows the result when it was to the leeward. The roll amplitude was larger in the damaged condition than in the intact condition, except for that at the tuning period, in both directions. Note that this tendency decreased as the wave steepness increased. It is a common understanding that the centre of ship gravity is lowered by water flooding into compartments below the centre of gravity, and a ship becomes more stable after damage, but the experimental results did not seem to limit this. At the tuning period, the roll amplitude in the damaged condition was smaller than that in the intact condition, regardless of the wave direction. This might be because the natural roll period changed due to the water accumulated in the compartment, and floodwater played the role of an anti-rolling tank. Focusing on the difference caused by the wave steepness, the non-linearity with respect to wave steepness appeared strongly in the intact condition, while it increased almost linearly with wave steepness in the damaged condition. This result clearly demonstrates that the damage opening and floodwater significantly influence the roll motion in drifting in beam waves.
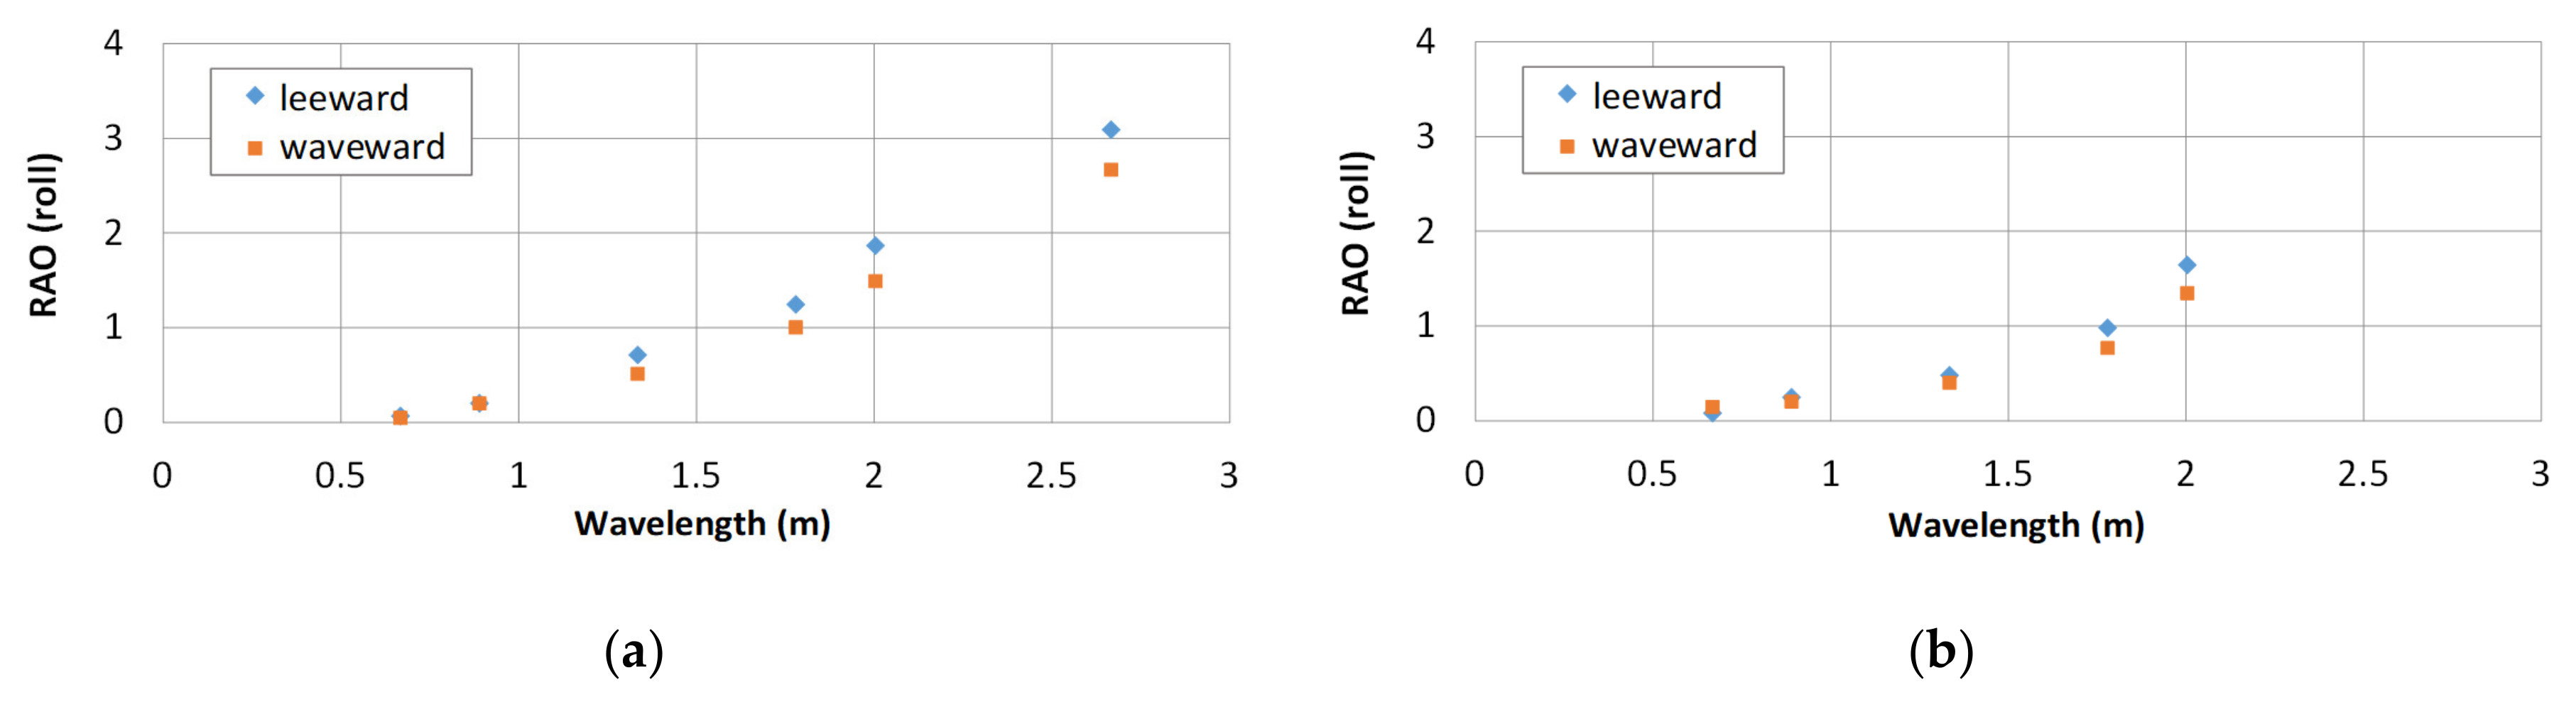
Figure 16 shows a comparison of roll response when the waves hit the ship from the starboard side, on which the damage opening exists, and the port side. Here, the vertical axis represents the response amplitude operator (RAO) obtained by dividing the roll amplitude by the maximum wave slope. A clear tendency could be observed in which the roll response increased when the damage opening was located on the leeward as compared to that on the waveward.
3.3. Manoeuvring Test in Calm Water
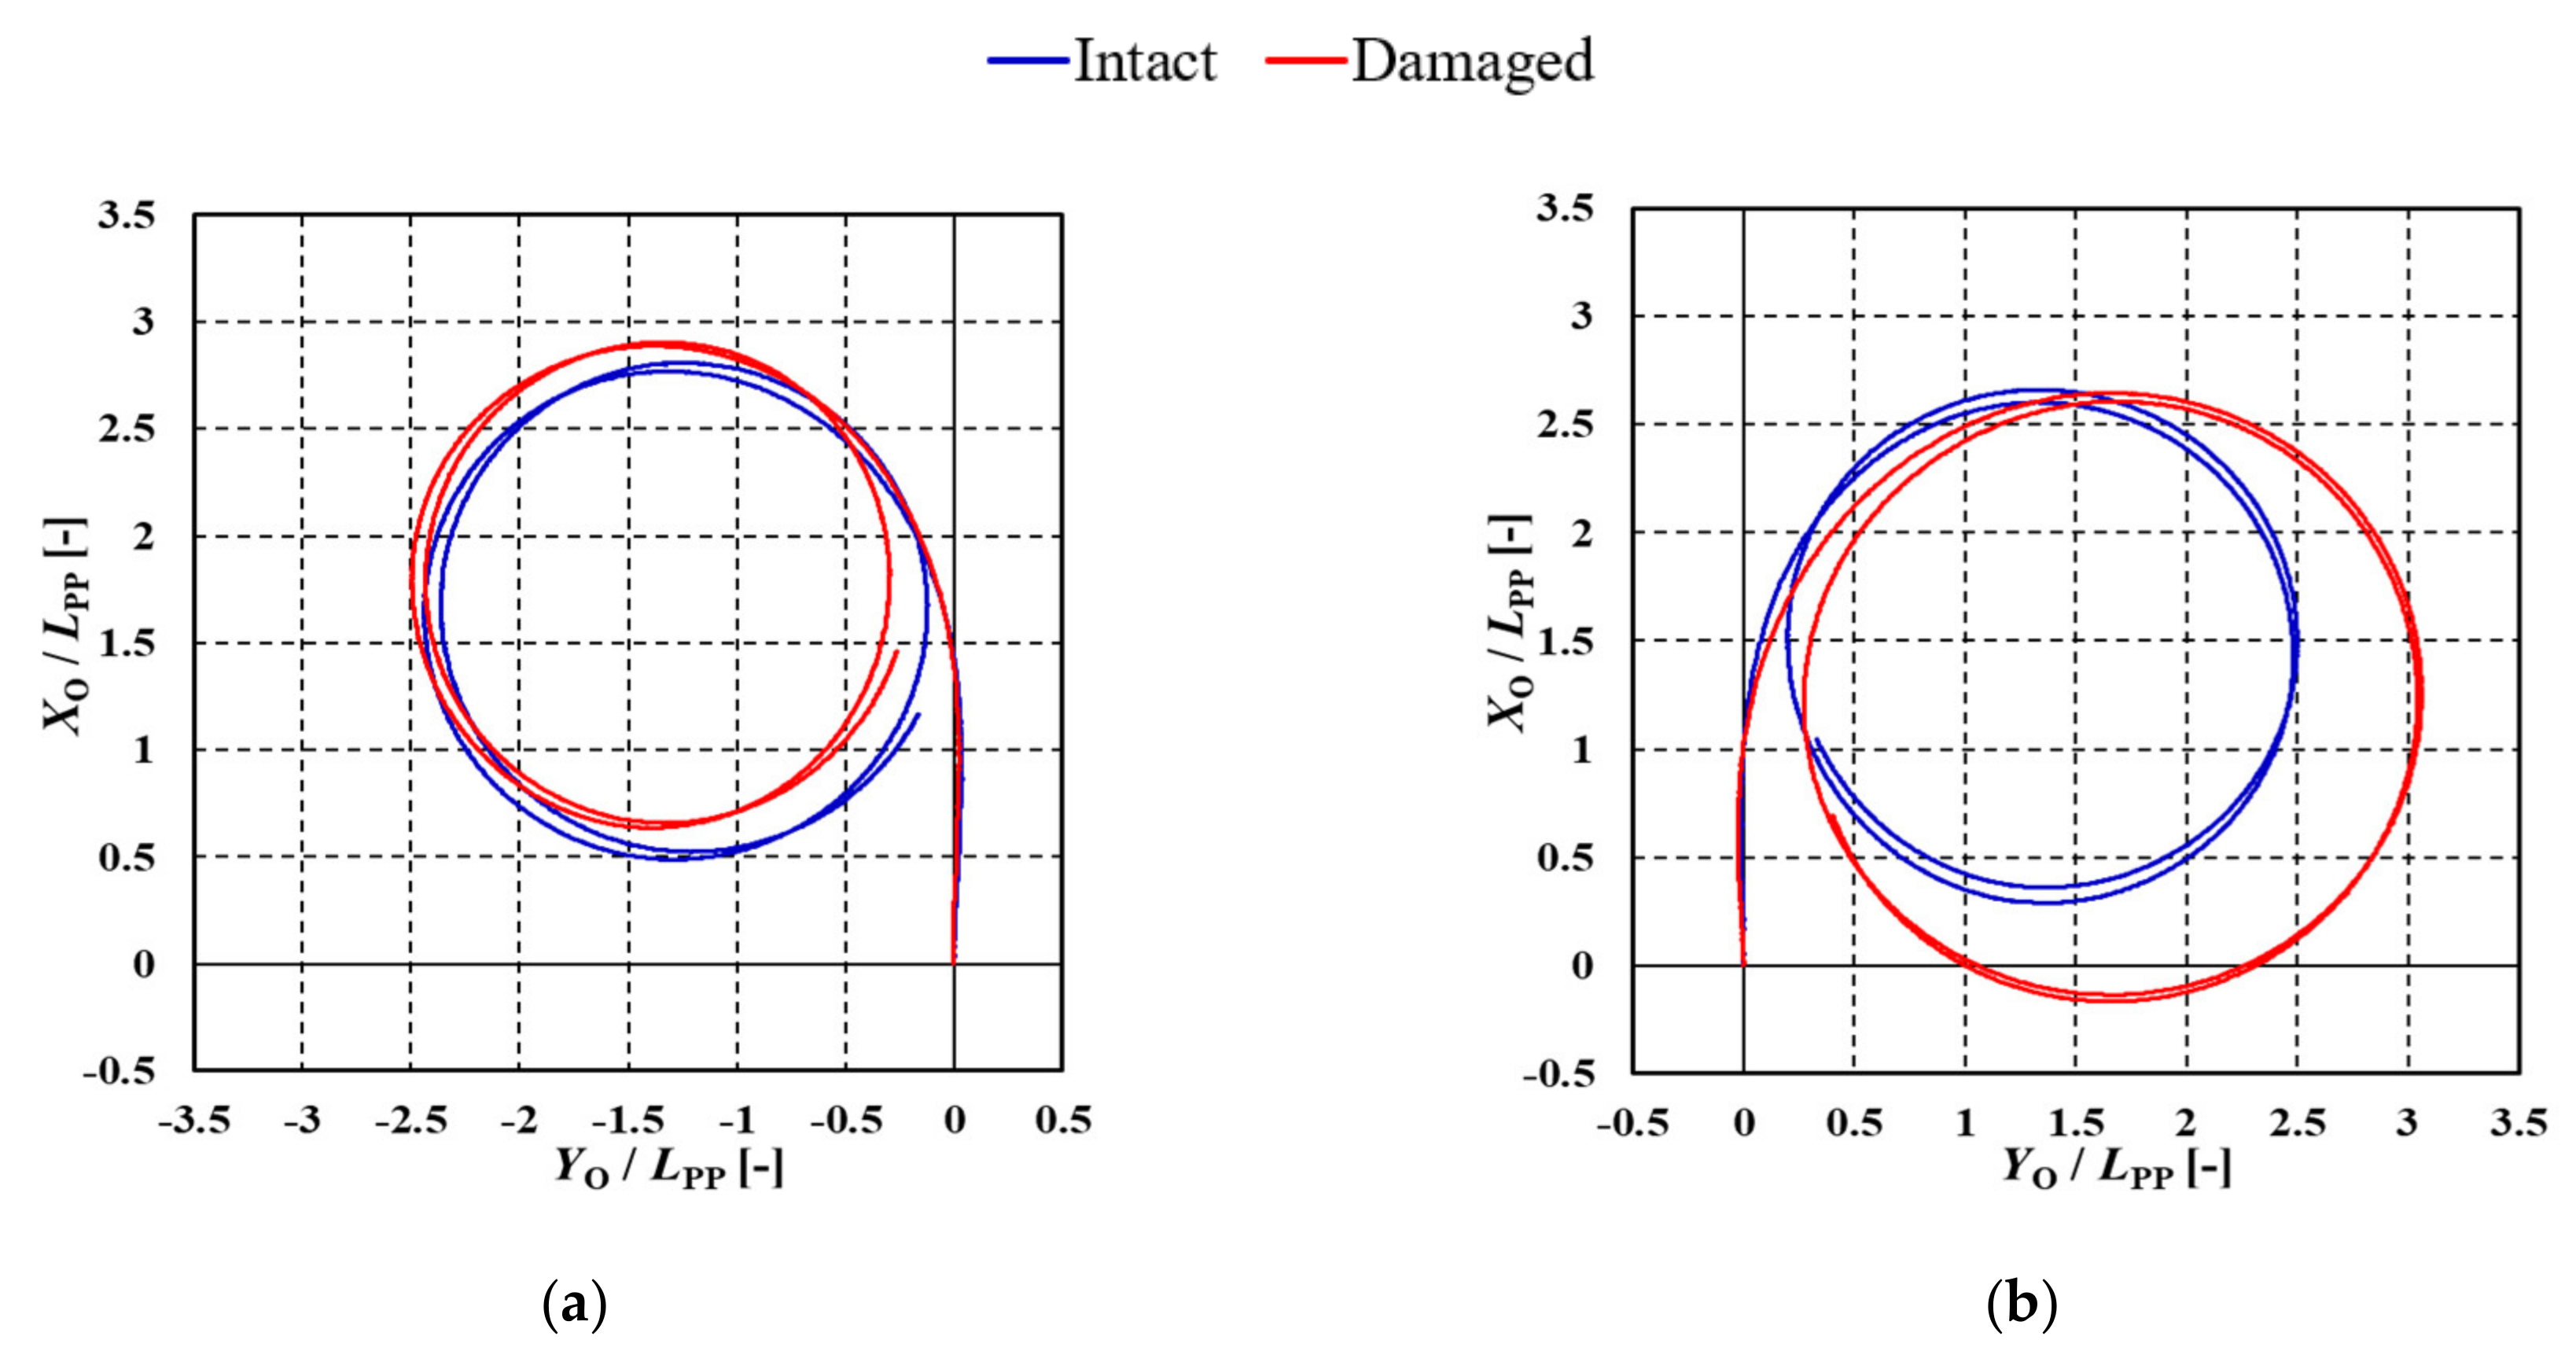
It was confirmed that the course-keeping ability in head waves could worsen in the presence of damage opening and floodwater. To discuss the general trend of manoeuvrability in a damaged state, a free-running model test of steady turning was conducted with a maximum rudder angle of ±35° for both the intact and damaged conditions. A snapshot of the turning test for both conditions is shown in Figure 17. The measured trajectory of the ±35° turning test is shown in Figure 18. Table 4 presents the results of analysis of the turning ability.
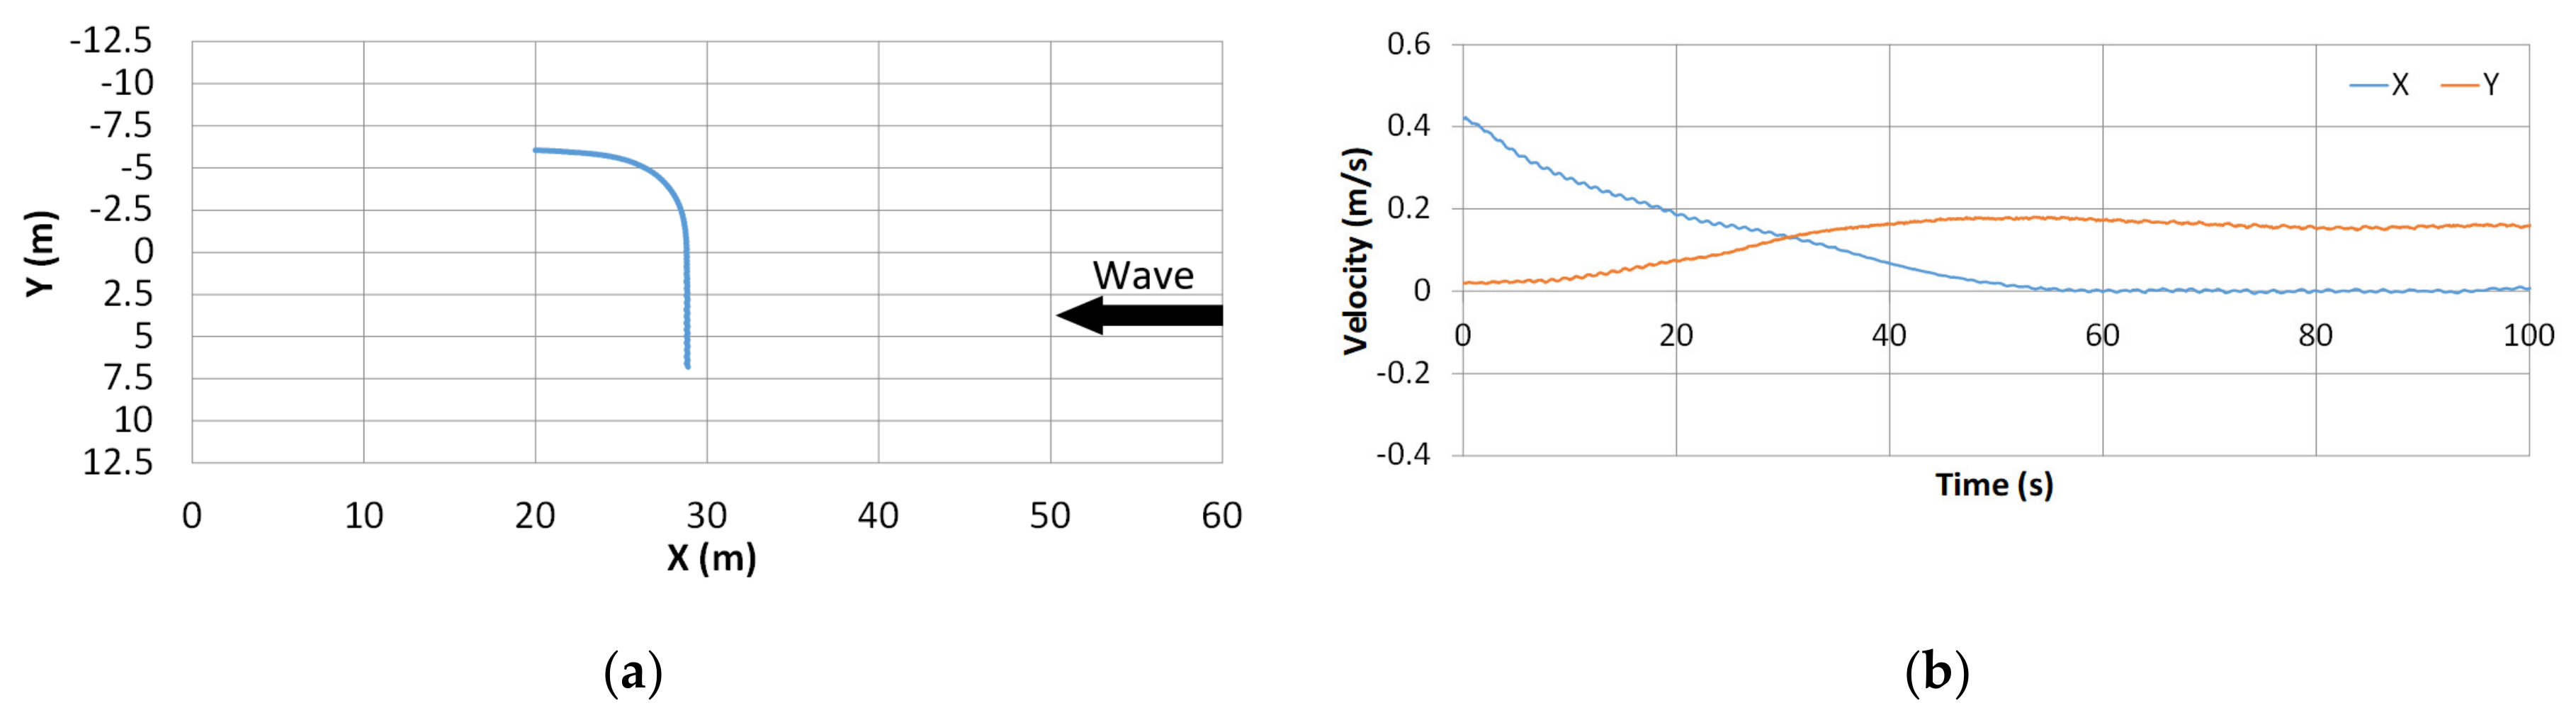
The trajectories of the port turn and the starboard turn appeared almost symmetrical in the intact condition, and largely different in the damaged condition. As the ship inclined outward due to the action of centrifugal force during turning, it leaned to the left side in the turn to the starboard and to the right side in the turn to the port. However, the ship remained heeled to the starboard side even while turning to the starboard in the damaged condition, so the height of the action point of the lateral force differed between the intact and damaged conditions. As a result, there was a significant left–right difference in the turning trajectory. In addition, there was a large difference in speed reduction between the port and starboard turning. These results clearly indicate that the steady heel due to the damage/floodwater has a significant effect on the ship-turning manoeuvrability, and that the turning circle enlarges when turning to the damaged side, compared to the intact condition.
Next, 10/10° and 20/20° zig-zag tests were performed with and without damage opening. A comparison of the first overshoot angle, the second overshoot angle, and the manoeuvrability indices of K and T is shown in Table 5. Comparing the two conditions, the ship response to steering became quicker, while the turning force became worse, and both the first and second overshoot angles generally decreased. In the turning test, there was a large difference between the turning diameter and speed reduction between the turning directions. On the other hand, no particular problem occurred in the zig-zag test because steering was performed alternately in both directions and the left–right difference was offset.
To objectively discuss the ship manoeuvre observed in the experiment, it was checked whether the subject ship satisfied the international standards of ship manoeuvrability (IMO MSC. 137(76) [23]) in the damaged condition. In this standard, the criteria for turning ability, yaw-checking, and course-keeping abilities are described. For the turning ability, the advance should not exceed 4.5 ship lengths and the tactical diameter should not exceed 5 ship lengths in the turning circle manoeuvre to both the starboard and port at 35° angle or the maximum rudder angle. For the yaw-checking and course-keeping abilities, the limit of the first and second overshoot angles in the 10/10° zig-zag test and the first overshoot angle in the 20/20° zig-zag test are described. From the experimental results shown in Table 4 and Table 5, the advance is 2.84 ship lengths and the tactical diameter is 2.99 even in the worst case. The worst first overshoot angle is 5.08° and the second overshoot angle is 12.37° for the 10/10° zig-zag test, and 9.27° and 14.08°, respectively, for the 20/20° zig-zag test. As the experimental result satisfies the international manoeuvring standard with a margin, it can be judged that the subject ship has sufficient manoeuvrability for SRtP even after damage casualties.
4. Manoeuvring Simulation
In the previous section, the manoeuvrability in the damaged condition was evaluated by conducting a free-running model experiment, but there were limitations in terms of available facilities and cost for conducting such a model experiment. A manoeuvring simulation is commonly used for evaluating manoeuvrability in the ship design stage, but only few computational fluid dynamics (CFD) studies on manoeuvring simulation after damage are available, e.g., Haro et al. (2016) [13]. Therefore, a semi-captive model experiment was conducted at the Marine Dynamics Basin at NRIFE to construct a system-based simulation model for the prediction of ship manoeuvrability in the damaged state.
4.1. Mathematical Model
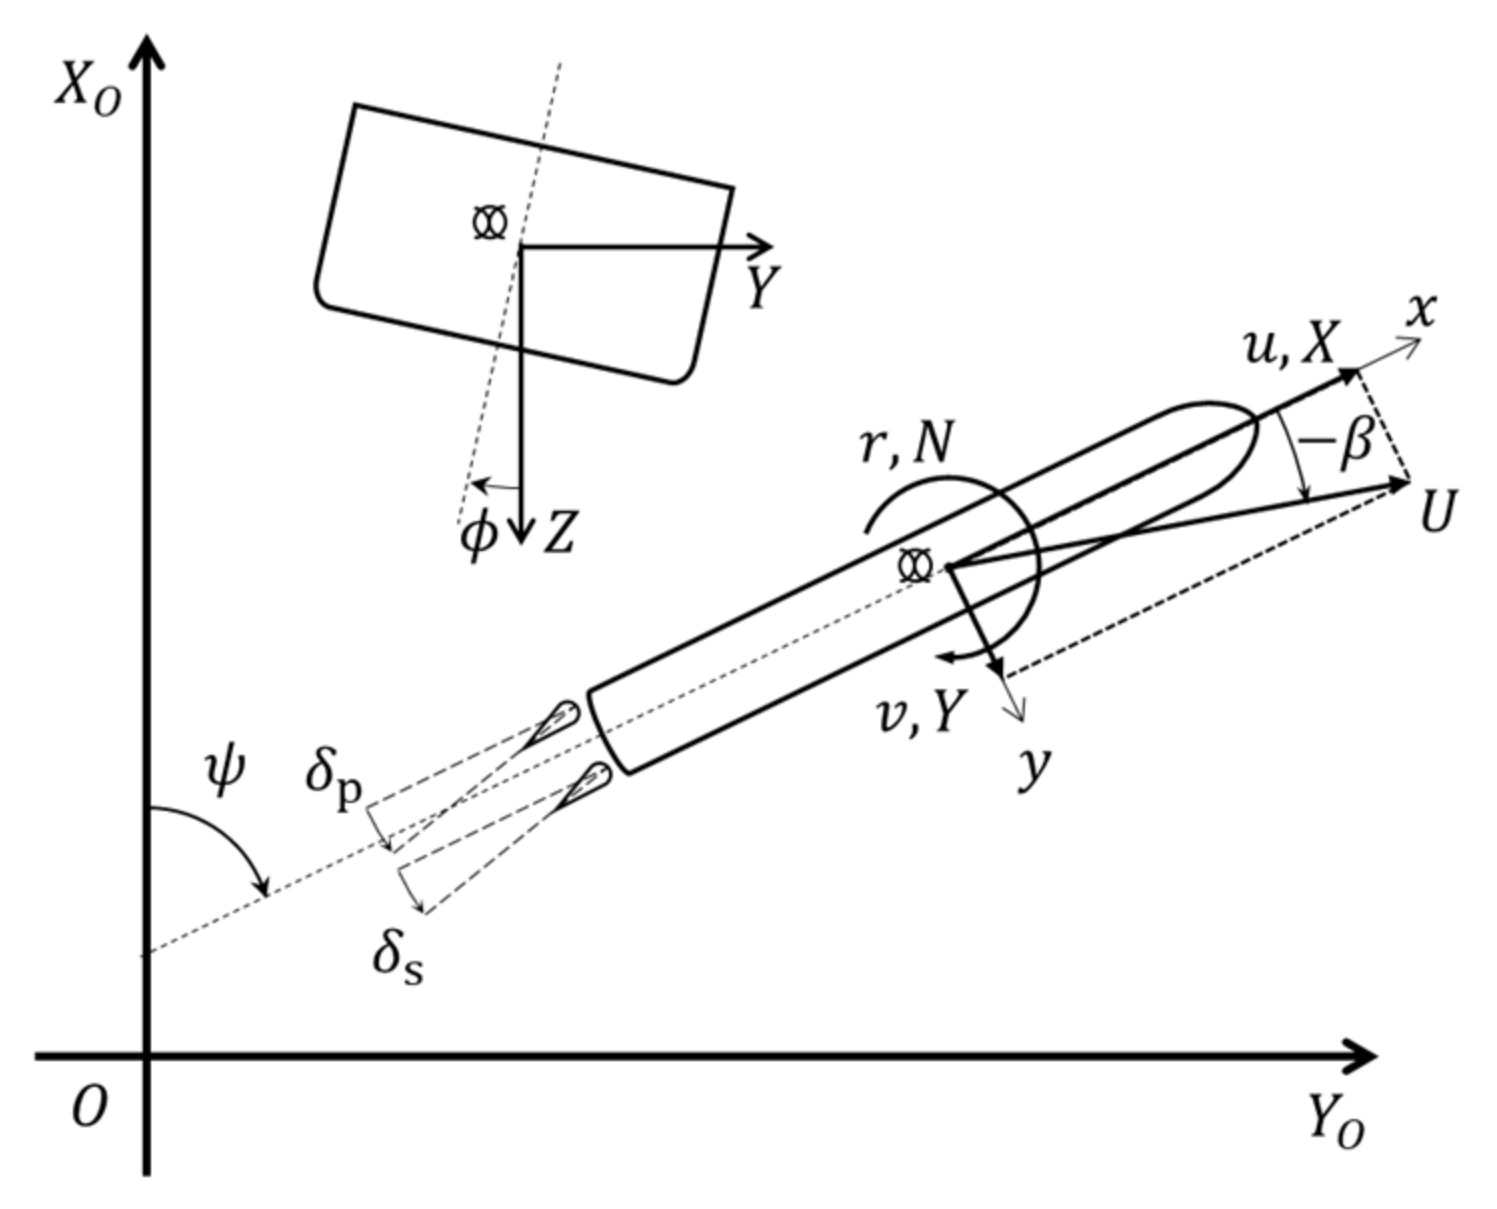
In general, a ship can be assumed as a rigid body and ship vertical motions are neglected under the quasi-static assumption. In addition, the change in heel angle is negligible when a time has elapsed after the damage. Therefore, 3-DoFs surge, sway, and yaw motions are considered for a manoeuvring simulation, but effects of the steady heel due to floodwater on manoeuvring forces are considered. The basic equations of motion are shown in Equations (1) and (2) based on the so-called MMG model, c.f. Yasukawa et al. (2015) [24]. Here, the origin is set at the centre of ship gravity. On the other hand, the hydrodynamic force acting on a hull is expressed with the origin at the midship position, as shown in Figure 19.
where
and subscripts are: H: Hull force, P: Propeller thrust, R: Rudder force.
In a model test, it is difficult to accurately remove the influence of added mass on the ship manoeuvring motion, so we consider it comprehensively. The hydrodynamic force acting on the hull is expressed as Equations (3)–(5). The hydrodynamic hull manoeuvring coefficients in the equations are obtained by conducting a circular motion test (CMT). Here, a constant term is added in the sway and yaw motions to take the influence of the steady heel into account, as proposed by Yasukawa et al. (2019) [25]. For the manoeuvring simulation, rudder forces and propeller thrusts are needed, which were determined with reference to Yoshimura’s work (2016) [26,27]
4.2. Circular Motion Test
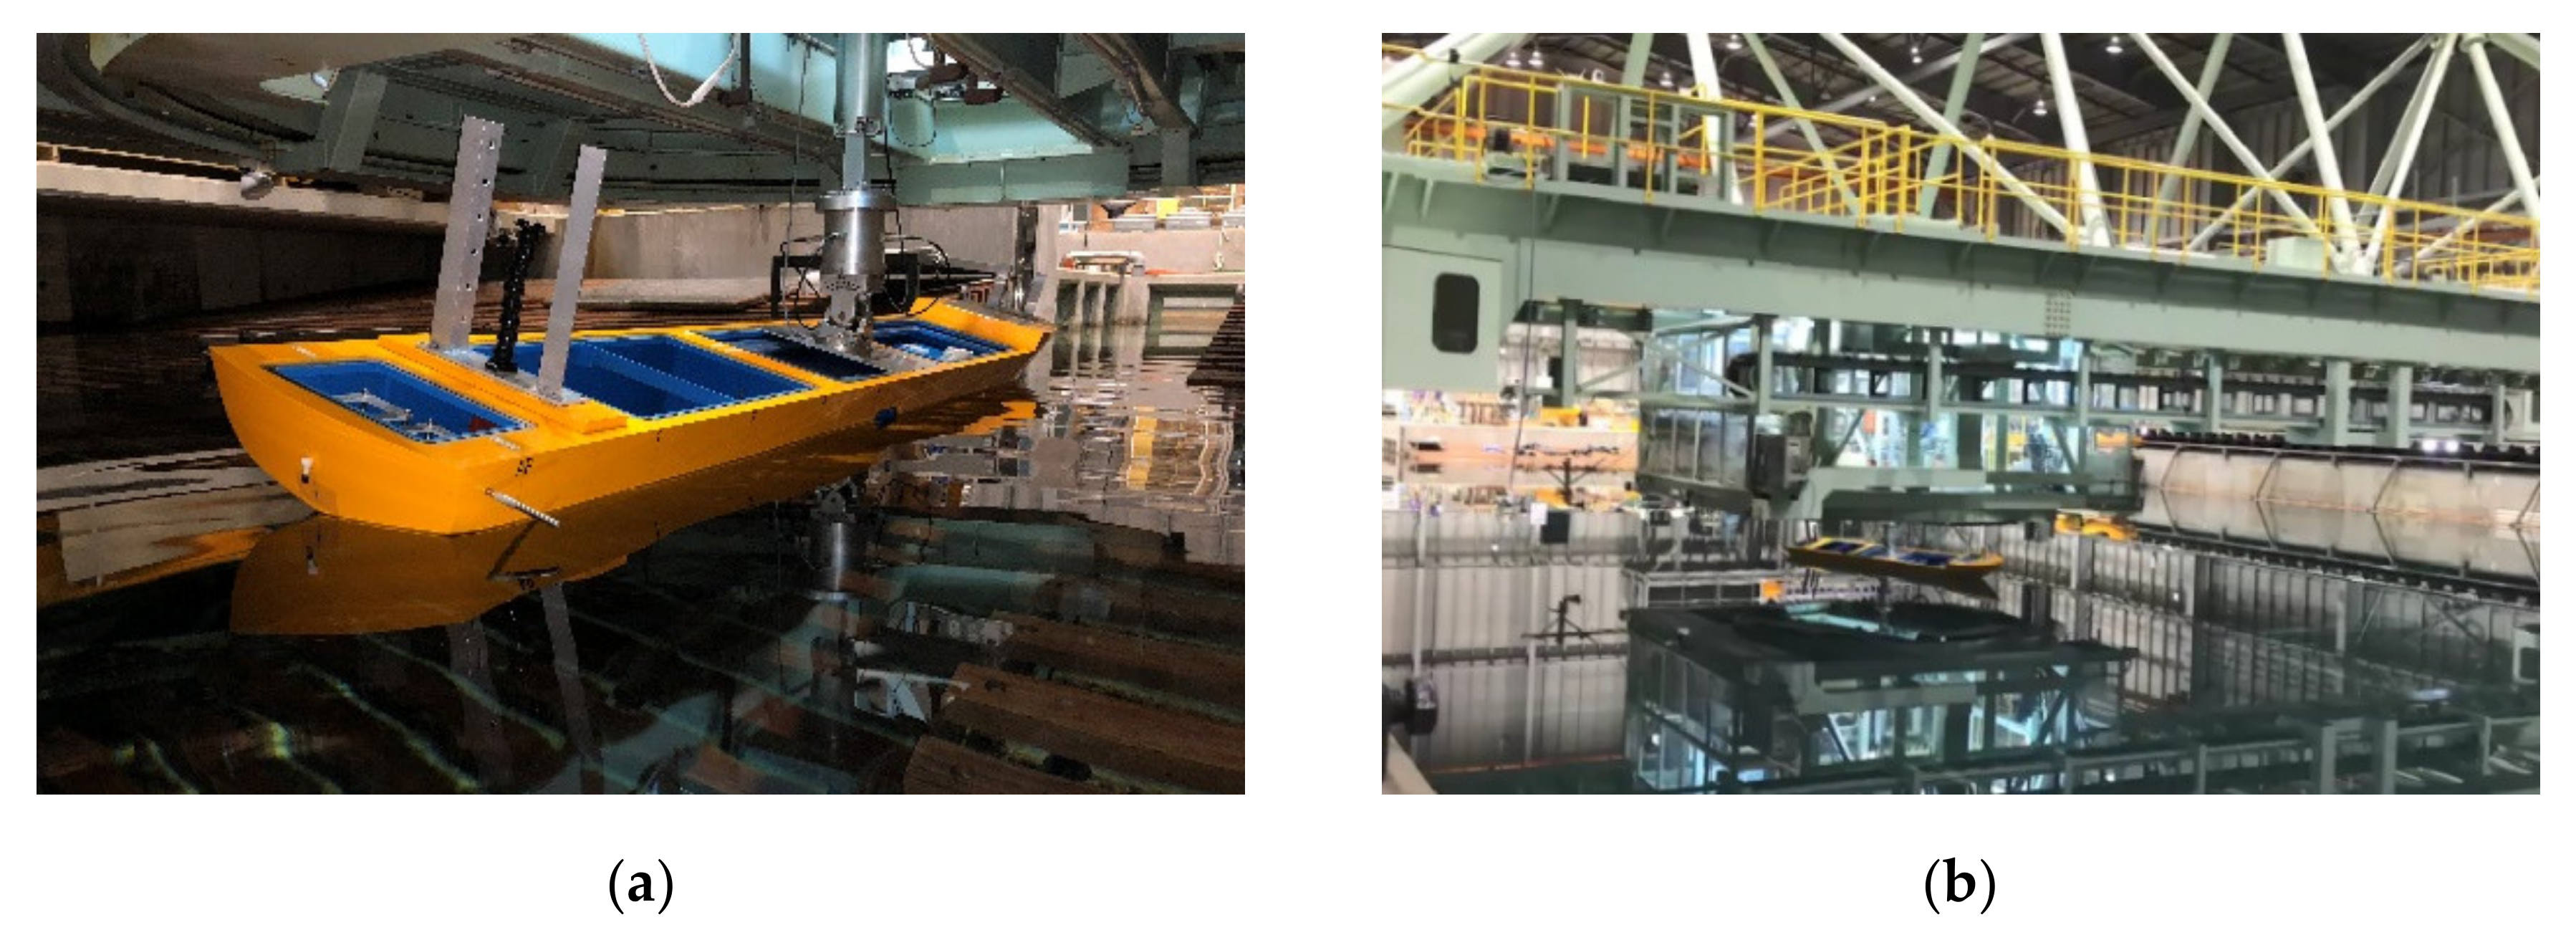
Based on the results of the free-running model test, a CMT was conducted in both intact and damaged conditions without the rudders and the propellers. In the damaged condition, the water can ingress and egress through the damage opening, and then, constant heel angles of 0° and 15° are given to distinguish the effects of damage opening and steady heel. Under the intact condition, heel angles of 0° and 15° are also given, which intend to reproduce the upright and heeled conditions but without damage opening. A snapshot of the experiment is shown in Figure 20. In the captive test, surge and sway forces, as well as a yaw moment, were measured using a dynamometer, and heave and pitch motions were in the free state.
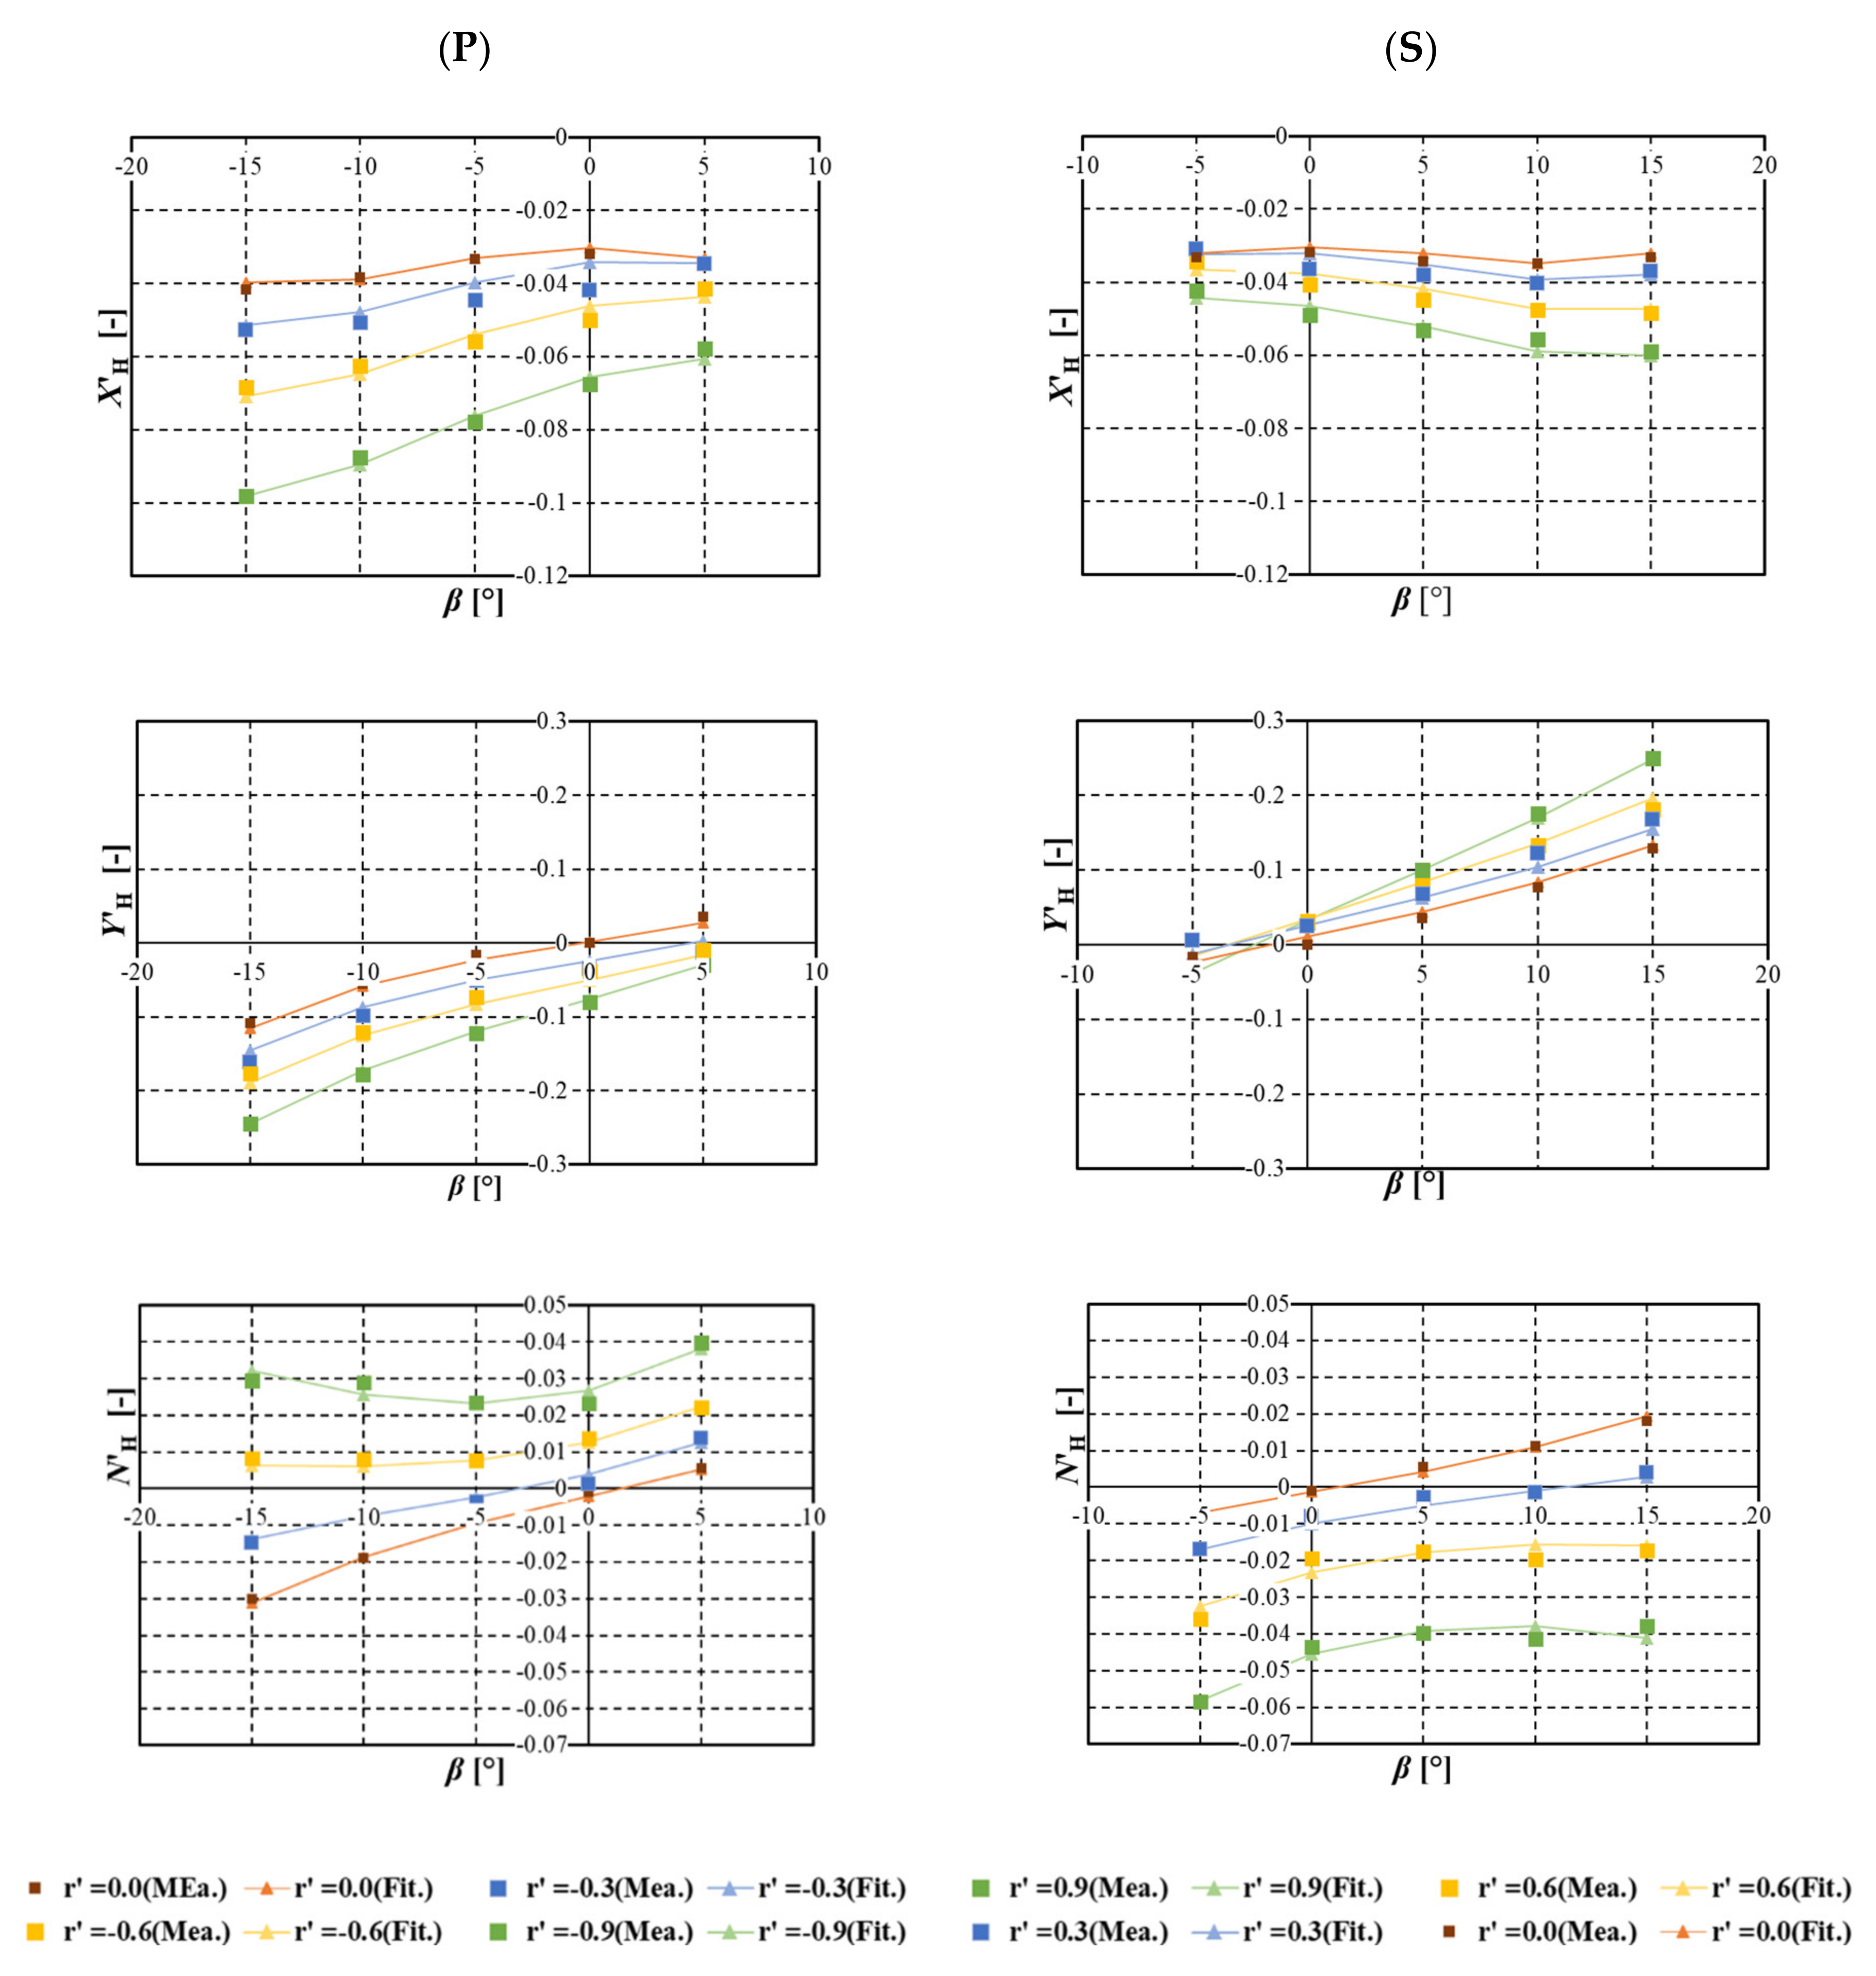
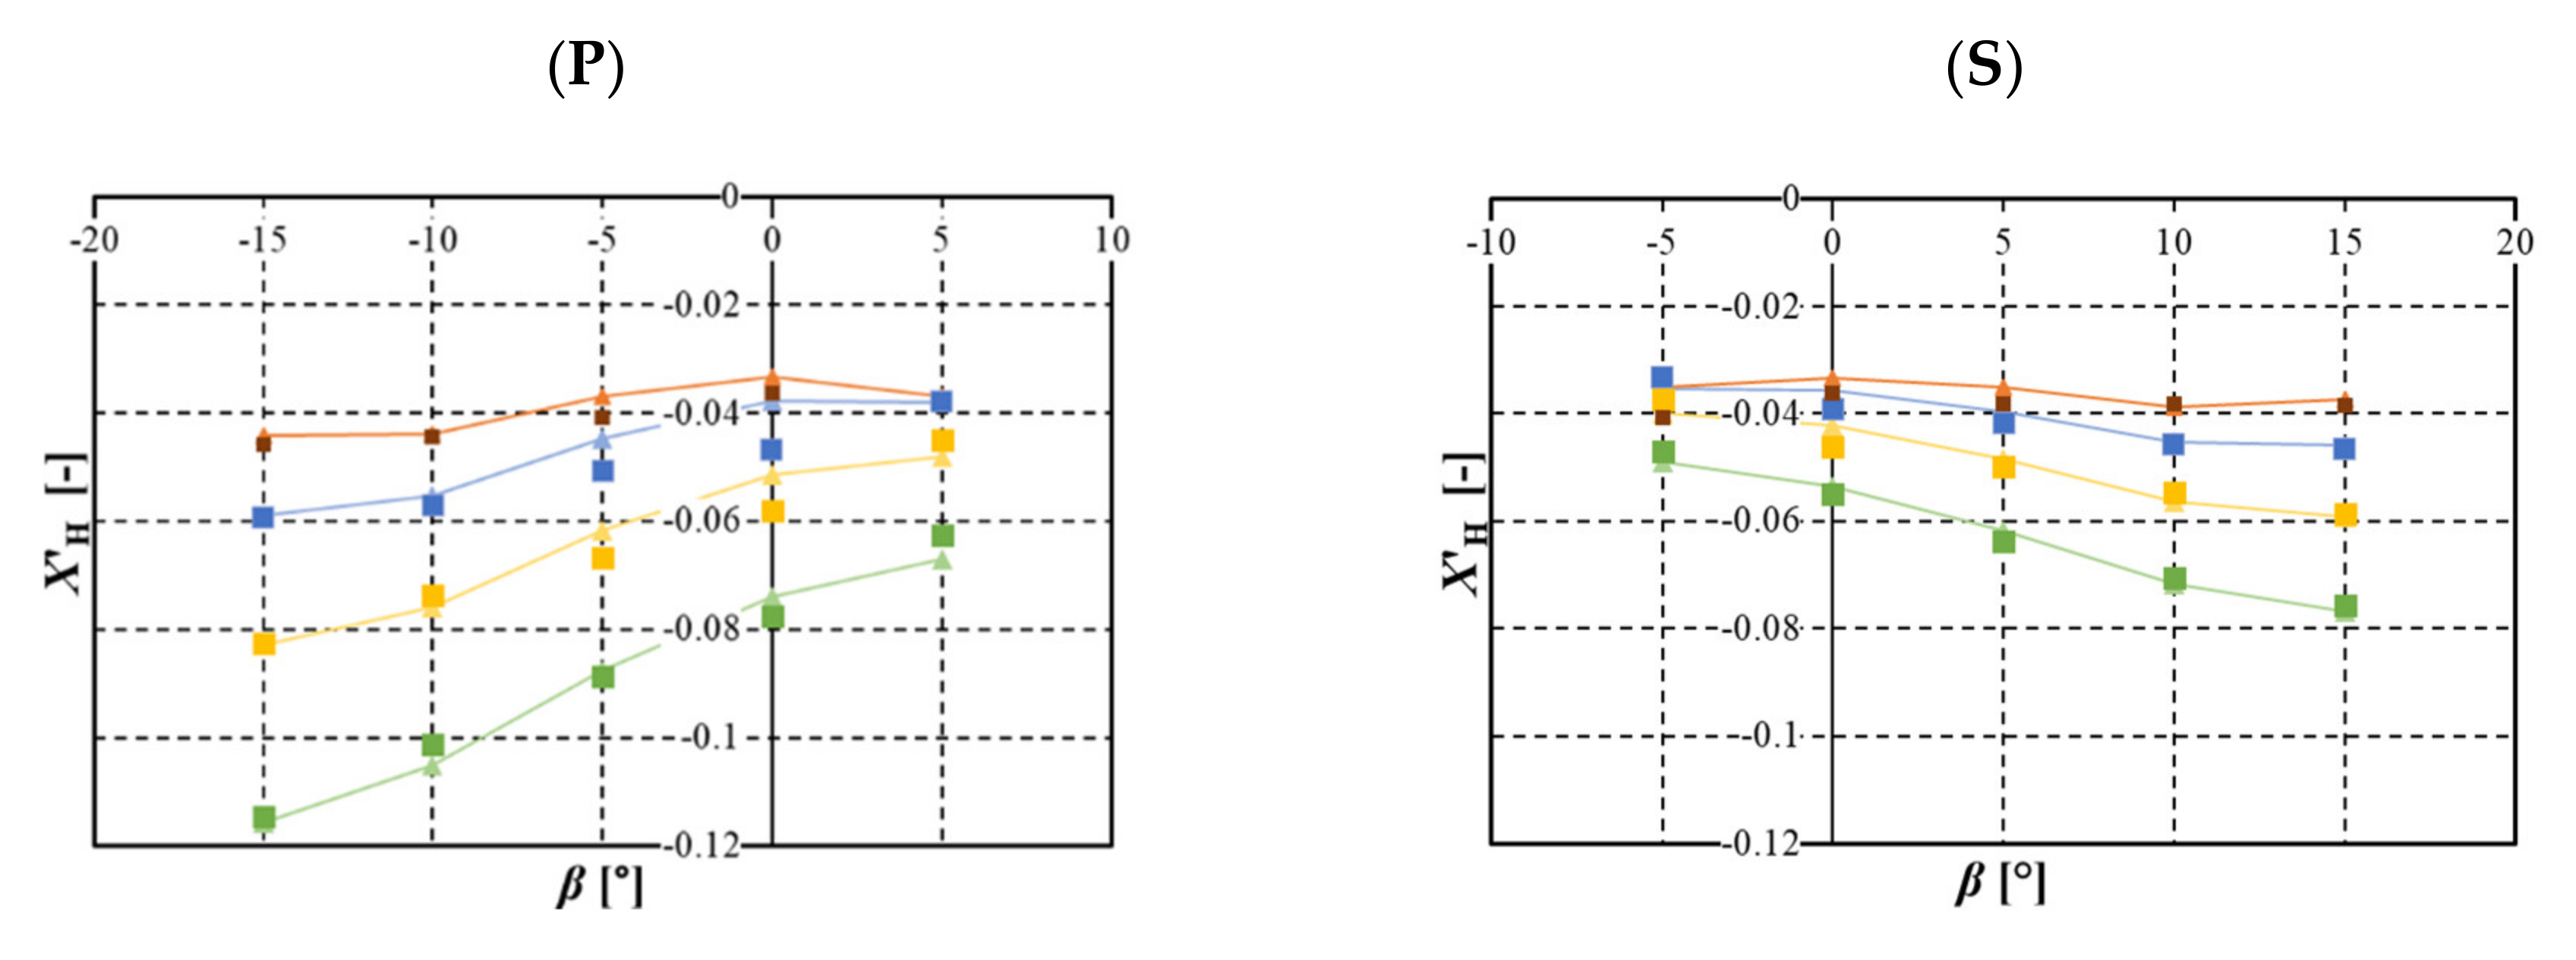
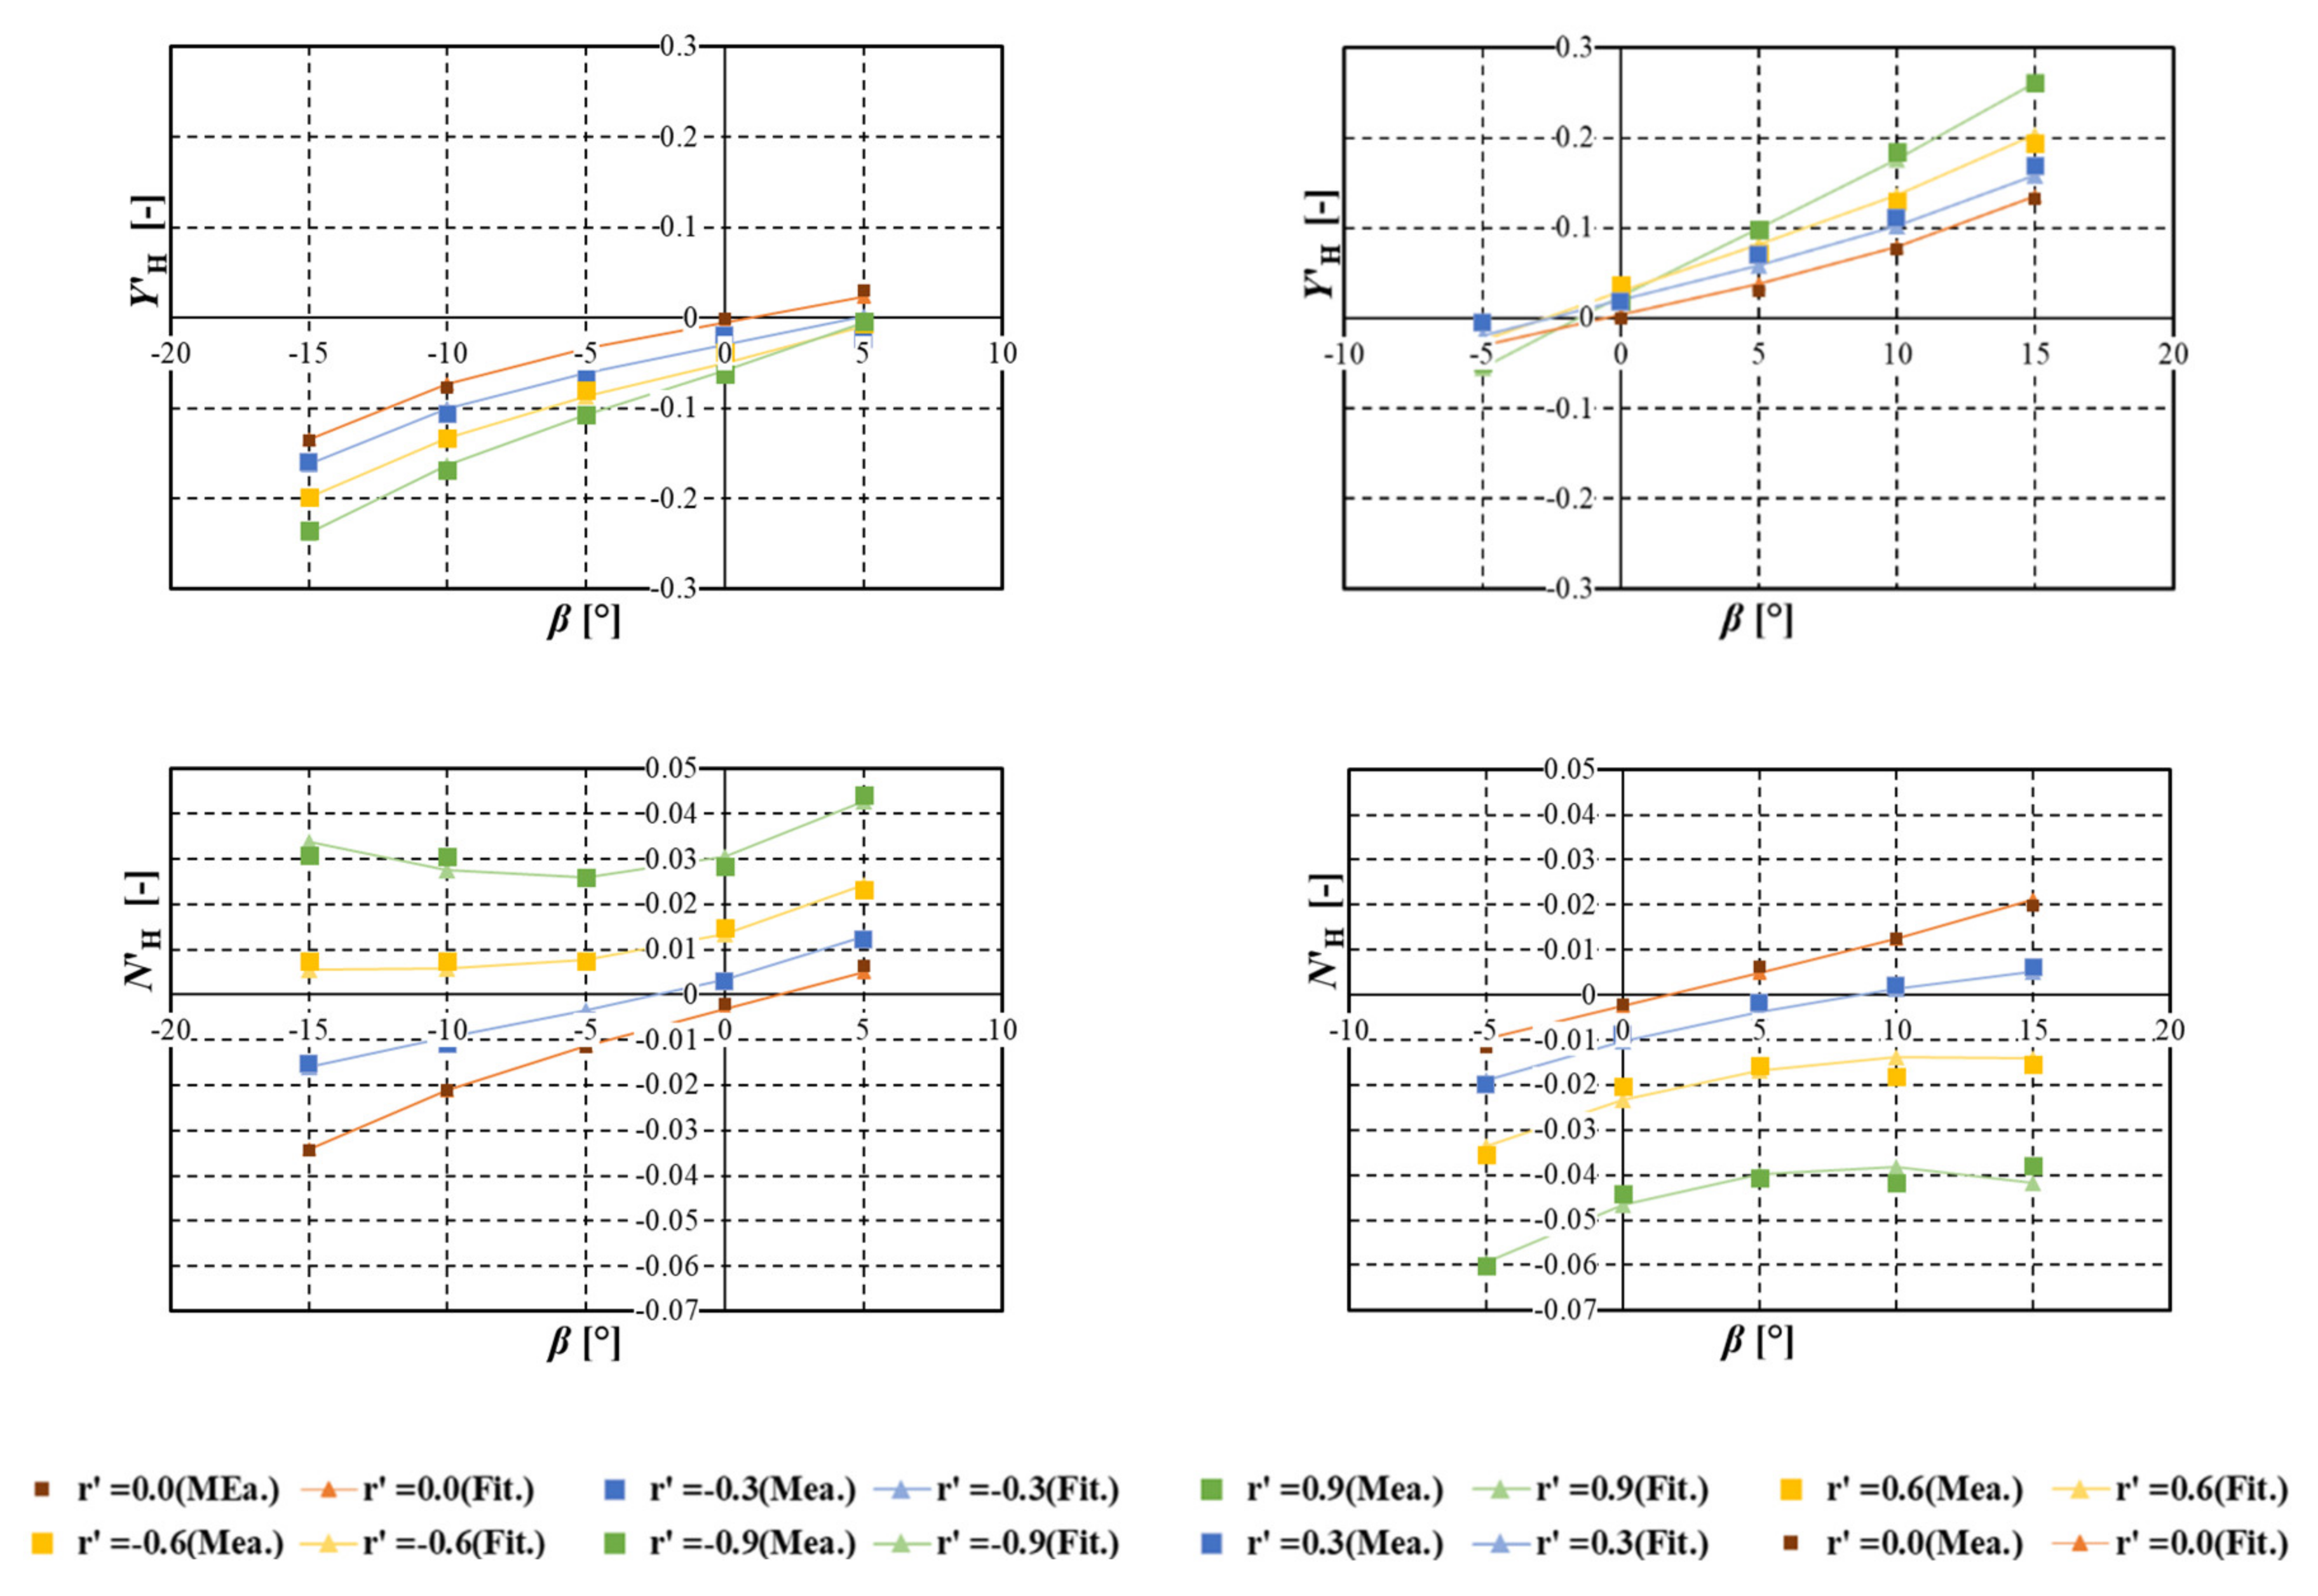
The CMT was performed for both directions of the turn because of the existence of steady heel. The drift angle, β, of −5 to 15° and non-dimensional yaw rate r’ = Ur/Lpp of −0.3 to 0.9 were selected for turning to the port and those of 5 to −15° and 0.3 to −0.9 were selected for turning to the starboard. The measured hull manoeuvring forces in the intact and damaged states are shown in Figure 21 and Figure 22, respectively. For both states, a significant difference appears in the manoeuvring forces between the turning directions, because of the existence of heel. Focusing on the difference between the intact and damage states, a prominent difference can be found in the surge force in both directions of turn and the sway force in port turning. A slight difference is found in the sway force and the yaw moment in starboard turning, particularly in the combination of large drift angle and large yaw rate.
For a more detailed discussion on the differences among the conditions, all manoeuvring coefficients are shown in Table 6, Table 7 and Table 8. Here the results for the intact and damaged conditions without steady heel are also presented. As the higher-order coefficients are difficult to compare, the linear manoeuvring coefficients, Yβ, Yr, Nβ and Nr, are focused on. Irrespective of the turning direction, the intact condition with steady heel shows better agreement with the damaged condition with steady heel for Yβ and Nr, while the damaged condition without steady heel shows better agreement for Yr and Nβ. This might imply that the existence of heel is dominant for Yβ and Nr and that of the damage opening is dominant for Yr and Nβ. Further detailed investigation and discussion are necessary in the future.
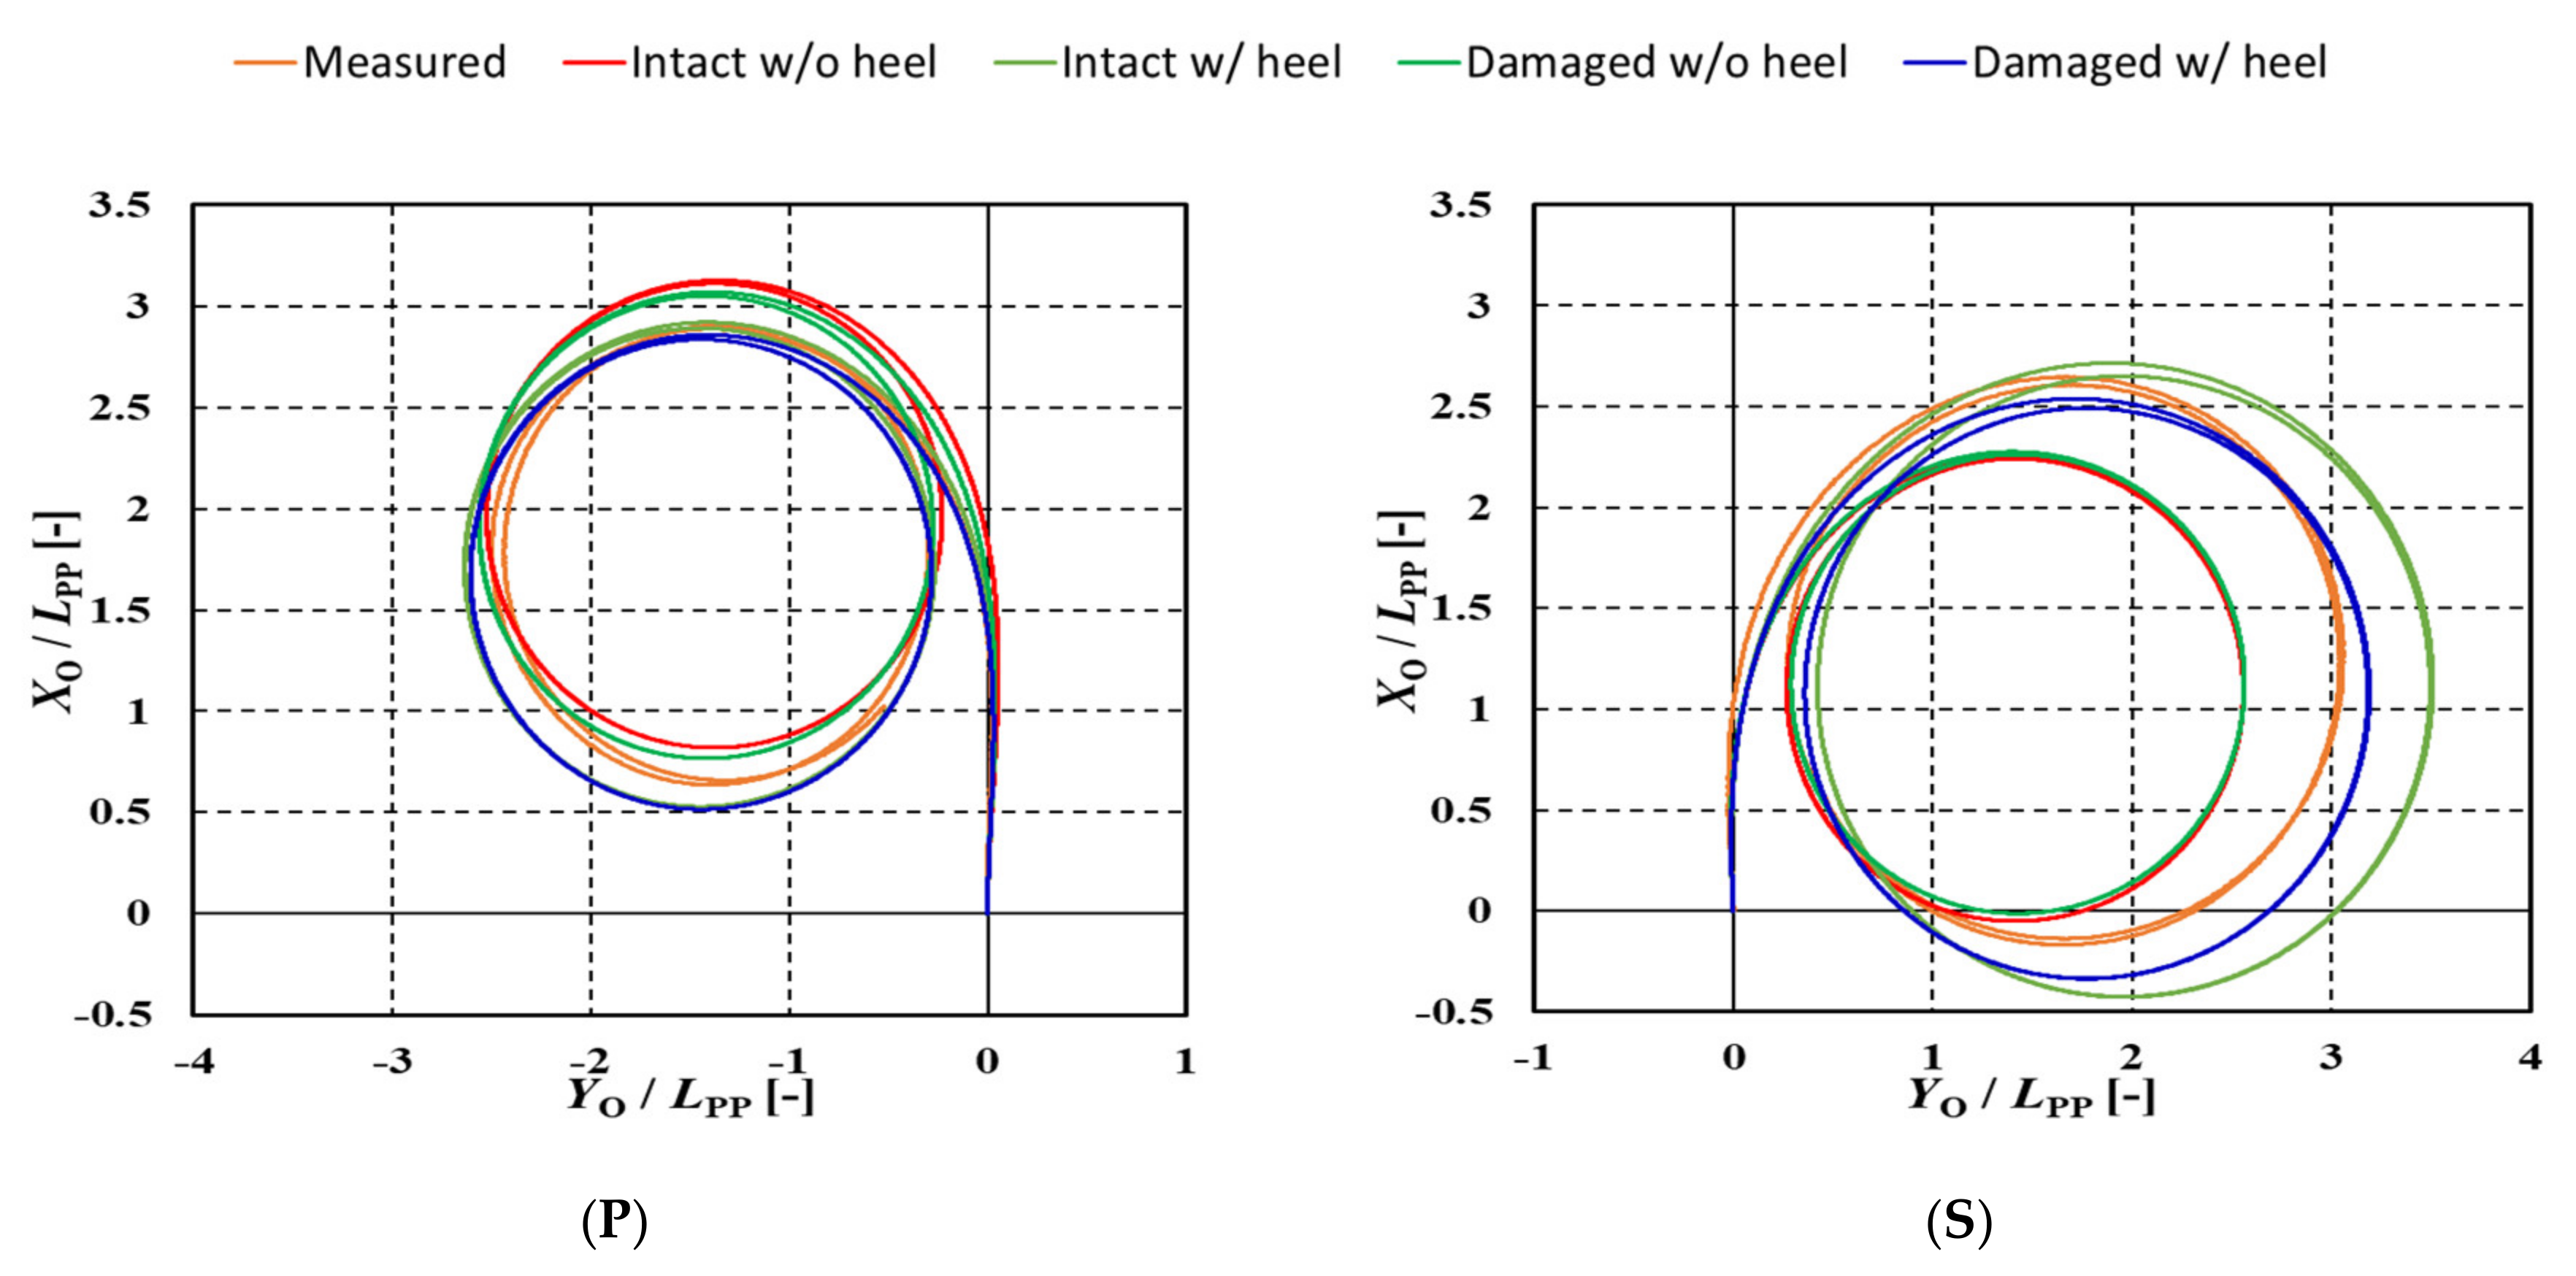
4.3. Numerical Results and Discussion
Using the manoeuvring coefficients listed in Table 6, Table 7 and Table 8, a turning simulation was performed for four different models. A comparison of the ship trajectory among the four models, as well as the free-running model test, is shown in Figure 23. A comparison of the results indicates that the intact condition without heel and the damaged condition without heel provide quite similar results for both turning directions, and fail to reproduce the difference in the left–right turning diameter. The intact condition with heel and the damaged condition with heel can provide better agreement in turning diameter for both turning directions. This fact clearly shows that the existence of the damage opening itself has little influence on the steady turning and the damage-induced steady heel is a major element that leads to the difference in the turning ability depending on the turning direction. Although the damaged condition with heel provides the best agreement with the free-running model test, the intact condition with heel is acceptable for the safety argument, because it overestimates the turning diameter, leading to a conservative assessment. Therefore, once the steady heel angle after damage and flooding is estimated, a manoeuvring simulation for the intact hull considering the effect of steady heel can be used for the safety assessment of the damaged ship, at least for turning manoeuvrability.
A numerical simulation of the 10/10° and 20/20° zig-zag tests was performed using the same models, and numerical results for intact and damaged conditions are presented in Table 9. A comparison of the numerical results with the experimental results in Table 5 shows that the agreement is not satisfactory even for the intact condition. As the zig-zag manoeuvre is unsteady while the turning manoeuvre is steady, it is difficult to reproduce the zig-zag manoeuvre using the hydrodynamic force determined by the CMT in which the steady motion is assumed. Further study, including an unsteady planar motion mechanism (PMM) test as a next step, is desired.
5. Conclusions
In this study, free-running model tests were conducted for a scaled model of a large cruise ship with a damaged compartment in the midship. The experiment was conducted in calm water, regular head and beam waves, long-crested irregular waves, and short-crested irregular waves to investigate the manoeuvrability after damage for SRtP, i.e., course-keeping ability, turning ability, and yaw-checking. In the experiment, the free-running model test was repeated for both the intact and damaged conditions under the same experimental conditions to highlight the effect of existence of damage/floodwater on manoeuvrability. As a result, it was demonstrated that the course-keeping ability in harsh conditions, as well as the turning ability when turning to the damaged side, worsened. However, it was also confirmed that the subject cruise ship maintained the required manoeuvrability for SRtP even in damaged and flooded conditions, which was supported by the fact that she satisfied the international standards for ship manoeuvrability with a margin.
For developing a system-based manoeuvring simulation model, CMTs were conducted using the same ship model to determine the hydrodynamic manoeuvring forces for various conditions. The MMG model considering the effect of steady heel on the hull manoeuvring forces can reproduce the left–right difference in steady turning and evaluate the turning diameter qualitatively. For practical uses, it is recommended to use a manoeuvring simulation model for the intact hull, considering the effect of steady heel on the manoeuvring forces, which underestimates the turning ability, as a safety assessment tool. On the other hand, it is difficult to reproduce the unsteady zig-zag manoeuvre using steady hydrodynamic forces.
It is desired to conduct a similar free-running model test for different ships to derive quantitative conclusions on this issue. It is also desired to provide experimental data using a ship which can be fully public to facilitate developing system-based manoeuvring models or validating CFD simulation.
Author Contributions
Conceptualization, H.H.; methodology, T.Y., H.H., and A.M., validation, T.Y., H.H., and A.M.; investigation, T.Y. and H.H.; data curation, T.Y., H.H., and A.M.; writing—original draft preparation, T.Y. and H.H.; writing—review and editing, T.Y. and H.H.; visualization, T.Y. and H.H.; supervision, H.H.; funding acquisition, H.H. and A.M. All authors have read and agreed to the published version of the manuscript.
Funding
This research was partially supported by JSPS KAKENHI, Grant Number 19H00803.
Acknowledgments
The authors would like to express sincere gratitude to Shingen Takeda from Mitsubishi Shipbuilding Co., Ltd. for providing ship data and technical advises. The authors thank Kouki Kawamura from National Maritime Research Institute for his help in the experiment. We would like to thank Editage (www.editage.com) for English language editing.
Conflicts of Interest
The authors declare no conflict of interest. The funders had no role in the design of the study; in the collection, analyses, or interpretation of data; in the writing of the manuscript, or in the decision to publish the results.
Abbreviations
| IMO | International Maritime Organization |
| SOLAS | Safety of Life at Sea |
| SRtP | Safe Return to Port |
| CMT | Circular Motion Test |
| ISSC | International Ship & Offshore Structures Congress |
| ITTC | International Towing Tank Conference |
Nomenclature
| Ship mass | |
| Added mass in x- and y-directions | |
| Surge and sway velocities | |
| Yaw rate | |
| Moment of inertia around z-axis | |
| Added moment of inertia around z-axis | |
| Ship resistance in x-axis | |
| Surge force, sway force, and yaw moment around the midship excluding added mass component | |
| Surge force, sway force, and yaw moment around the centre of ship gravity excluding added mass component | |
| Surge force, sway force, yaw moment around the midship acting on hull, excluding added mass component | |
| Surge force, sway force, yaw moment around the midship by propeller | |
| Surge force, sway force, yaw moment around the midship by rudder | |
| Hydrodynamic manoeuvring derivatives | |
| Constant hydrodynamic manoeuvring derivatives | |
| Longitudinal coordinate of the centre of ship gravity | |
| Drift angle | |
| Starboard rudder angle | |
| Port rudder angle | |
| Heading angle |
References
- IMO. MSC.216(82), Amendments to the International Convention for the Safety of Life at Sea, 1974; International Maritime Organization (IMO): London, UK, 2006. [Google Scholar]
- Palazzi, L.; de Kat, J. Model experiments and simulations of a damaged ship with air flow taken into account. Mar. Technol. 2004, 41, 38–44. [Google Scholar]
- Ruponen, P. Model Tests for the Progressive Flooding of a Box-Shaped barge; Report No. M-292; Helsinki University of Technology: Helsinki, Finland, 2006. [Google Scholar]
- Ruponen, P.; Kurvinen, P.; Saisto, I.; Harras, J. Experimental and numerical study on progressive flooding in full-scale. Int. J. Marit. Eng. 2010, 152, A197–A208. [Google Scholar]
- Ikeda, Y.; Ishida, S.; Katayama, T.; Takeuchi, Y.; Kat, J.O. Experimental and Numerical Studies on Roll Motion of a Damaged Large Passenger Ship in Intermediate Stages of Flooding. Fluid Mech. Appl. 2011, 97, 633–641. [Google Scholar] [CrossRef]
- Manderbacka, T.; Ruponen, P.; Kulovesi, J.; Matusiak, J. Model experiments of the transient response to flooding of the box shaped barge. J. Fluids Struct. 2015, 57, 127–143. [Google Scholar] [CrossRef] [Green Version]
- Lee, S.; You, J.-M.; Lee, H.-H.; Lim, T.; Park, S.T.; Seo, J.; Rhee, S.H.; Rhee, K.-P. Experimental Study on the Six Degree-of-Freedom Motions of a Damaged Ship Floating in Regular Waves. IEEE J. Ocean. Eng. 2015, 41, 1. [Google Scholar] [CrossRef]
- Hashimoto, H.; Kawamura, K.; Sueyoshi, M. A numerical simulation method for transient behavior of damaged ships associated with flooding. Ocean Eng. 2017, 143, 282–294. [Google Scholar] [CrossRef]
- Cho, S.-K.; Sung, H.; Hong, S.; Nam, B.; Hwang, S.; Kim, Y. Study on the Motions and Flooding Process of a Damaged Ship in Waves. Fluid Mech. Appl. 2019, 119, 223–245. [Google Scholar] [CrossRef]
- Gao, Z.; Gao, Q.; Vassalos, D. Numerical Study of Damaged Ship Motion in Waves. Fluid Mech. Appl. 2019, 119, 247–256. [Google Scholar] [CrossRef]
- Begovic, E.; Mortola, G.; Incecik, A.; Day, A. Experimental assessment of intact and damaged ship motions in head, beam and quartering seas. Ocean Eng. 2013, 72, 209–226. [Google Scholar] [CrossRef]
- Acanfora, M.; De Luca, F. An experimental investigation into the influence of the damage openings on ship response. Appl. Ocean Res. 2016, 58, 62–70. [Google Scholar] [CrossRef]
- Haro, M.P.E.; Seo, J.; Sadat-Hosseini, H.; Seok, W.-C.; Rhee, S.; Stern, F. Numerical simulations for the safe return to port of a damaged passenger ship in head or following seas. Ocean Eng. 2017, 143, 305–318. [Google Scholar] [CrossRef]
- Ćatipović, I.; Ćorak, M.; Parunov, J.; Alujević, N. Seakeeping experiments on damaged ship. Ships Offshore Struct. 2018, 14, 100–111. [Google Scholar] [CrossRef]
- Kim, D.; Park, S.; Park, J.; Yeo, H.; Seo, J.; Rhee, S.H. Dynamic stability analysis including roll motion in the maneuvering motion for a damaged surface naval vessel. In Proceedings of the 13th International Conference on the Stability of Ships and Ocean Vehicles, Kobe, Japan, 16–21 September 2018; pp. 379–386. [Google Scholar]
- IMO. MSC.194(80), Amendments to the International Convention for the Safety of Life at Sea, 1974; International Maritime Organization (IMO): London, UK, 2005. [Google Scholar]
- Umeda, N.; Furukawa, T.; Matsuda, A.; Usada, S. Rudder normal force during broaching of a ship in stern quartering waves. In Proceedings of the 30th Symposium on Naval Hydrodynamics, Hobart, TAS, Australia, 2–7 November 2014. [Google Scholar]
- Matsuda, A.; Hashimoto, H.; Terada, D.; Taniguchi, Y. Validation of free running model experiment in heavy seas. In Proceedings of the 3rd International Conference on Violent Flows, Osaka, Japan, 9–11 March 2016. [Google Scholar]
- ISSC. Report of the Committee 1. Environmental Conditions. In Proceedings of the 2nd International Ship Structures Congress, Delft, The Netherlands, 20–24 July 1964. [Google Scholar]
- Hashimoto, H.; Umeda, N. Prediction of Parametric Rolling in Irregular Head Waves. Fluid Mech. Appl. 2019, 119, 275–290. [Google Scholar] [CrossRef]
- ITTC. The Specialist Committee on Waves-Final Report and Recommendations to the 23rd ITTC. In Proceedings of the 23rd International Towing Tank Conference, Venice, Italy, 8–14 September 2002. [Google Scholar]
- Paulling, J.R. Parametric rolling of ships—Then and now. Fluid Mech. Appl. 2011, 96, 347–360. [Google Scholar]
- IMO. MSC.137(76), Standards for Ship Manoeuvrability; International Maritime Organization (IMO): London, UK, 2002. [Google Scholar]
- Yasukawa, H.; Yoshimura, Y. Introduction of MMG standard method for ship maneuvering predictions. J. Mar. Sci. Technol. 2014, 20, 37–52. [Google Scholar] [CrossRef] [Green Version]
- Yasukawa, H.; Sakuno, R.; Yoshimura, Y. Practical maneuvering simulation method of ships considering the roll-coupling effect. J. Mar. Sci. Technol. 2019, 24, 1280–1296. [Google Scholar] [CrossRef]
- Yoshimura, Y.; Masumoto, Y. Hydrodynamic Force Database with Medium High Speed Merchant Ships Including Fishing Vessels and Investigation into a Manoeuvring Prediction Method. J. Jpn. Soc. Nav. Arch. Ocean Eng. 2011, 14, 63–73. [Google Scholar] [CrossRef] [Green Version]
- Yoshimura, Y.; Kondo, M.; Nakano, T.; Yamashita, R. Equivalent Simple Mathematical Model for the Manoeuvrability of Twin-propeller Ships under the same propeller-rps. J. Jpn. Soc. Nav. Arch. Ocean Eng. 2016, 24, 157–166. [Google Scholar] [CrossRef] [Green Version]
Figure 1.
Scaled model of a large cruise ship with a damage opening.

Figure 2.
Damage opening: (a) intact state with a lid; (b) damage state without a lid.

Figure 3.
Floodable compartment with damage opening.

Figure 4.
Reflection prism for the positioning.

Figure 5.
Change in advance speed in regular head waves.

Figure 6.
Snapshot of the free-running test: (a) in regular head waves and (b) in short-crested irregular head waves.
Figure 6.
Snapshot of the free-running test: (a) in regular head waves and (b) in short-crested irregular head waves.

Figure 7.
Experimental result in intact condition in regular waves: (a) ship trajectory; (b) ship velocity in X and Y directions; (c) time history of roll, pitch, and yaw.
Figure 7.
Experimental result in intact condition in regular waves: (a) ship trajectory; (b) ship velocity in X and Y directions; (c) time history of roll, pitch, and yaw.

Figure 8.
Experimental result in damaged condition in regular waves: (a) ship trajectory; (b) ship velocity in X and Y directions; (c) time history of roll, pitch, and yaw.
Figure 8.
Experimental result in damaged condition in regular waves: (a) ship trajectory; (b) ship velocity in X and Y directions; (c) time history of roll, pitch, and yaw.


Figure 9.
Experimental result in intact condition in long-crested irregular waves: (a) ship trajectory; (b) ship velocity in X and Y directions; (c) time history of roll, pitch, and yaw.
Figure 9.
Experimental result in intact condition in long-crested irregular waves: (a) ship trajectory; (b) ship velocity in X and Y directions; (c) time history of roll, pitch, and yaw.

Figure 10.
Experimental result in damaged condition in long-crested irregular waves: (a) ship trajectory; (b) ship velocity in X and Y directions; (c) time history of roll, pitch, and yaw.
Figure 10.
Experimental result in damaged condition in long-crested irregular waves: (a) ship trajectory; (b) ship velocity in X and Y directions; (c) time history of roll, pitch, and yaw.

Figure 11.
Experimental result in intact condition in short-crested irregular waves: (a) ship trajectory; (b) ship velocity in X and Y directions; (c) time history of roll, pitch, and yaw.
Figure 11.
Experimental result in intact condition in short-crested irregular waves: (a) ship trajectory; (b) ship velocity in X and Y directions; (c) time history of roll, pitch, and yaw.

Figure 12.
Experimental result in damaged condition in short-crested irregular waves: (a) ship trajectory; (b) ship velocity in X and Y directions; (c) time history of roll, pitch, and yaw.
Figure 12.
Experimental result in damaged condition in short-crested irregular waves: (a) ship trajectory; (b) ship velocity in X and Y directions; (c) time history of roll, pitch, and yaw.

Figure 13.
Snapshot of the freely drifting test in regular beam waves: (a) intact condition; (b) damaged condition.
Figure 13.
Snapshot of the freely drifting test in regular beam waves: (a) intact condition; (b) damaged condition.

Figure 14.
Result of the stability test in regular beam waves, where damage opening is to leeward: (a) wave steepness of 0.025; (b) wave steepness of 0.05.
Figure 14.
Result of the stability test in regular beam waves, where damage opening is to leeward: (a) wave steepness of 0.025; (b) wave steepness of 0.05.

Figure 15.
Result of the stability test in regular beam waves, where damage opening is to waveward: (a) wave steepness of 0.025; (b) wave steepness of 0.05.
Figure 15.
Result of the stability test in regular beam waves, where damage opening is to waveward: (a) wave steepness of 0.025; (b) wave steepness of 0.05.

Figure 16.
Effect of wave direction on roll response amplitude operator (RAO): (a) wave steepness of 0.025; (b) wave steepness of 0.05.
Figure 16.
Effect of wave direction on roll response amplitude operator (RAO): (a) wave steepness of 0.025; (b) wave steepness of 0.05.

Figure 17.
Snapshot of the turning test: (a) turn to port with δ = −35° in intact condition; (b) turn to starboard with δ = 35° in damaged condition.
Figure 17.
Snapshot of the turning test: (a) turn to port with δ = −35° in intact condition; (b) turn to starboard with δ = 35° in damaged condition.

Figure 18.
Measured trajectory in intact and damaged conditions: (a) turn to port with δ = −35°; (b) turn to starboard with δ = 35°.
Figure 18.
Measured trajectory in intact and damaged conditions: (a) turn to port with δ = −35°; (b) turn to starboard with δ = 35°.

Figure 19.
Coordinate systems in manoeuvring simulation.

Figure 20.
Snapshot of the captive test: (a) experimental setup; (b) circular motion test (CMT).

Figure 21.
Measured manoeuvring force in intact condition with steady heel: (P) turn to port; (S) turn to right.
Figure 21.
Measured manoeuvring force in intact condition with steady heel: (P) turn to port; (S) turn to right.

Figure 22.
Measured manoeuvring force in damaged condition with steady heel: (P) turn to port; (S) turn to starboard.
Figure 22.
Measured manoeuvring force in damaged condition with steady heel: (P) turn to port; (S) turn to starboard.


Figure 23.
Comparison of trajectory between the free-running test and the simulations: (P) turn to port with δ = −35°; (S) turn to starboard with δ = 35°.
Figure 23.
Comparison of trajectory between the free-running test and the simulations: (P) turn to port with δ = −35°; (S) turn to starboard with δ = 35°.


Table 1.
Principal particulars of the subject ship.
| Item | Actual Ship | Scaled Model |
|---|---|---|
| Length between perpendiculars: Lpp [m] | 246.0 | 3.0 |
| Breadth: B [m] | 37.5 | 0.457 |
| Depth: D [m] | 25.7 | 0.314 |
| Draught: d [m] | 8.05 | 0.098 |
| Area of rudder: AR [m2] | 34.8 | 0.00517 |
Table 2.
Experimental conditions of the ship in intact state.
| Item | Actual Ship | Scaled Model |
|---|---|---|
| Non-dimensional radius of gyration in pitch: κyy/Lpp [m] | 0.34 | 0.34 |
| Metacentric height: GM [m] | 2.50 | 0.0305 |
| Natural roll period: Tφ [s] | 24.2 | 2.67 |
Table 3.
Wave condition for the drifting test.
| Item | Actual Ship | Scaled Model |
|---|---|---|
| Wave period: T [s] | 6.0, 8.1, 12.1, 16.1, 18.1, 24.2 | 0.67, 0.89, 1.34, 1.78, 2.00, 2.67 |
| Wave steepness: H/λ | 0.025, 0.05 | 0.025, 0.05 |
Table 4.
Experimental result of turning tests: (a) intact condition and (b) damaged condition.
| (a) Intact | Advance | Tactical Diameter | Turning Radius | Turning Time [s] | Speed Reduction(U/U0) | Drift Angle [°] | Yaw Rate [°/s] | Heel Angle [°] |
| −35 degree | 2.65 × Lpp | 2.33 × Lpp | 1.16 × Lpp | 77.80 | 0.551 | −23.88 | −4.58 | 1.45 |
| +35 degree | 2.50 × Lpp | 2.38 × Lpp | 1.13 × Lpp | 77.65 | 0.515 | 23.87 | 4.53 | −1.37 |
| (b) Damaged | Advance | Tactical Diameter | Turning Radius | Turning time [s] | Speed Reduction(U/U0) | Drift Angle [°] | Yaw Rate [°/s] | Heel Angle [°] |
| −35 degree | 2.84 × Lpp | 2.45 × Lpp | 1.11 × Lpp | 1.13 × Lpp | 0.497 | −16.38 | −4.18 | 17.53 |
| +35 degree | 2.56 × Lpp | 2.99 × Lpp | 1.39 × Lpp | 83.4 | 0.619 | 18.89 | 4.33 | 13.80 |
Table 5.
Experimental result of zig-zag tests: (a) intact condition, (b) damaged condition.
| (a) Intact | 1st OSA (deg) | 2nd OSA (deg) | K [1/s] | T [s] |
| −10/10° | 7.94 | 15.64 | 0.66 | 30.97 |
| +10/10° | 7.81 | 13.94 | 0.58 | 26.39 |
| −20/20° | 9.92 | 12.71 | 0.25 | 10.37 |
| +20/20° | 10.18 | 12.21 | 0.20 | 9.10 |
| (b) Damaged | 1st OSA (deg) | 2nd OSA (deg) | K [1/s] | T [s] |
| −10/10° | 5.08 | 11.98 | 0.30 | 14.56 |
| +10/10° | 7.75 | 12.37 | 0.35 | 17.80 |
| −20/20° | 9.27 | 8.92 | 0.19 | 8.97 |
| +20/20° | 7.82 | 14.08 | 0.22 | 10.21 |
Table 6.
Manoeuvring coefficients in surge: (P) turn to port, (S) turn to starboard.
| (P) | Intact w/o heel | Intact w/heel | Damaged w/o heel | Damaged w/heel |
| −0.0301 | −0.0303 | −0.0303 | −0.0333 | |
| −0.2258 | −0.3948 | −0.3730 | −0.5067 | |
| −0.0367 | −0.0978 | −0.0870 | −0.1313 | |
| −0.0129 | −0.0436 | −0.0377 | −0.0501 | |
| 1.1771 | 3.7276 | 3.8529 | 5.0689 | |
| (S) | Intact w/o heel | Intact w/heel | Damaged w/o heel | Damaged w/heel |
| −0.0301 | −0.0303 | −0.0303 | −0.0333 | |
| −0.2258 | −0.2466 | −0.2761 | −0.2735 | |
| −0.0367 | −0.0506 | −0.0862 | −0.0823 | |
| −0.0129 | −0.0200 | −0.0354 | −0.0249 | |
| 1.1771 | 3.2212 | 2.2133 | 3.1503 |
Table 7.
Manoeuvring coefficients in sway: (P) turn to port, (S) turn to starboard.
| (P) | Intact w/o heel | Intact w/heel | Damaged w/o heel | Damaged w/heel |
| 0.000 | 0.0023 | −0.0061 | −0.0052 | |
| 0.2691 | 0.2630 | 0.2979 | 0.0892 | |
| 0.0769 | 0.0866 | 0.0269 | −0.0198 | |
| 0.8984 | 2.7091 | 0.8080 | 0.4248 | |
| −0.4087 | −0.1367 | −0.2426 | −0.5771 | |
| 0.3347 | 0.2825 | 0.3456 | 0.0064 | |
| −0.0604 | 0.0002 | −0.0130 | −0.0216 | |
| (S) | Intact w/o heel | Intact w/heel | Damaged w/o heel | Damaged w/heel |
| 0.000 | 0.0108 | −0.0017 | 0.0037 | |
| 0.2691 | 0.3758 | 0.2889 | 0.3772 | |
| 0.0769 | 0.0520 | 0.0577 | 0.0597 | |
| 0.8984 | 1.2986 | 1.0327 | 1.8519 | |
| −0.4087 | −0.1925 | −0.1729 | −0.3914 | |
| 0.3347 | 0.5014 | 0.3444 | 0.6105 | |
| −0.0604 | −0.0349 | −0.0584 | −0.0451 |
Table 8.
Manoeuvring coefficients in yaw: (P) turn to port, (S) turn to starboard.
| (P) | Intact w/o heel | Intact w/heel | Damaged w/o heel | Damaged w/heel |
| 0.000 | −0.0020 | −0.0023 | −0.0032 | |
| 0.0730 | 0.0815 | 0.0921 | 0.0892 | |
| −0.0169 | −0.0179 | −0.0274 | −0.0198 | |
| 0.2076 | 0.4357 | 0.1104 | 0.4248 | |
| −0.4102 | −0.5642 | −0.3063 | −0.5771 | |
| 0.0453 | 0.0011 | 0.0217 | 0.0064 | |
| −0.0264 | −0.0174 | −0.0177 | −0.0216 | |
| (S) | Intact w/o heel | Intact w/heel | Damaged w/o heel | Damaged w/heel |
| 0.000 | −0.0013 | −0.0006 | −0.0024 | |
| 0.0730 | 0.0624 | 0.0859 | 0.0825 | |
| −0.0169 | −0.0261 | −0.0167 | −0.0236 | |
| 0.2076 | 0.2483 | 0.2099 | 0.1037 | |
| −0.4102 | −0.4566 | −0.3487 | −0.4268 | |
| 0.0453 | 0.0553 | 0.0361 | 0.0368 | |
| −0.0264 | −0.0285 | −0.0311 | −0.0316 |
Table 9.
Numerical result of zig-zag tests: (a) intact with constant heel (b) damaged with constant heel.
Table 9.
Numerical result of zig-zag tests: (a) intact with constant heel (b) damaged with constant heel.
| (a) Intact w/heel | 1st OSA(°) | 2nd OSA(°) | K[1/s] | T [s] |
| −10/10° | 4.90 | 3.04 | 0.15 | 7.23 |
| +10/10° | 2.87 | 11.54 | 0.24 | 12.61 |
| −20/20° | 7.34 | 6.63 | 0.14 | 7.51 |
| +20/20° | 5.41 | 13.23 | 0.17 | 9.52 |
| (b) Damaged w/heel | 1st OSA(°) | 2nd OSA(°) | K[1/s] | T [s] |
| −10/10° | 5.22 | 4.03 | 0.17 | 8.95 |
| +10/10° | 2.96 | 11.67 | 0.25 | 12.63 |
| −20/20° | 8.24 | 10.11 | 0.18 | 9.07 |
| +20/20° | 5.72 | 13.46 | 0.18 | 9.84 |
© 2020 by the authors. Licensee MDPI, Basel, Switzerland. This article is an open access article distributed under the terms and conditions of the Creative Commons Attribution (CC BY) license (http://creativecommons.org/licenses/by/4.0/).
Share and Cite
MDPI and ACS Style
Yuura, T.; Hashimoto, H.; Matsuda, A. Manoeuvrability of a Large Cruise Ship after Damage for Safe Return to Port. J. Mar. Sci. Eng. 2020, 8, 378. https://doi.org/10.3390/jmse8050378
AMA Style
Yuura T, Hashimoto H, Matsuda A. Manoeuvrability of a Large Cruise Ship after Damage for Safe Return to Port. Journal of Marine Science and Engineering. 2020; 8(5):378. https://doi.org/10.3390/jmse8050378
Chicago/Turabian StyleYuura, Tetsuhiro, Hirotada Hashimoto, and Akihiko Matsuda. 2020. "Manoeuvrability of a Large Cruise Ship after Damage for Safe Return to Port" Journal of Marine Science and Engineering 8, no. 5: 378. https://doi.org/10.3390/jmse8050378
Note that from the first issue of 2016, this journal uses article numbers instead of page numbers. See further details here.