Article

Dual Photonic–Phononic Crystal Slot Nanobeam with Gradient Cavity for Liquid Sensing

1
Department of Mechanical and Mechatronic Engineering, National Taiwan Ocean University, Keelung 20224, Taiwan
2
Department of Mechanical Engineering, National Yunlin University of Science and Technology, Yunlin 64002, Taiwan
3
Institute of Optoelectronic Sciences, National Taiwan Ocean University, Keelung 20224, Taiwan
4
Center of Excellence for Ocean Engineering, National Taiwan Ocean University, Keelung 20224, Taiwan
*
Authors to whom correspondence should be addressed.
Crystals 2020, 10(5), 421; https://doi.org/10.3390/cryst10050421
Submission received: 14 April 2020 / Revised: 22 May 2020 / Accepted: 22 May 2020 / Published: 25 May 2020
(This article belongs to the Special Issue Sonic and Photonic Crystals)

Abstract

:
A dual photonic–phononic crystal slot nanobeam with a gradient cavity for liquid sensing is proposed and analyzed using the finite-element method. Based on the photonic and phononic crystals with mode bandgaps, both optical and acoustic waves can be confined within the slot and holes to enhance interactions between sound/light and analyte solution. The incorporation of a gradient cavity can further concentrate energy in the cavity and reduce energy loss by avoiding abrupt changes in lattices. The newly designed sensor is aimed at determining both the refractive index and sound velocity of the analyte solution by utilizing optical and acoustic waves. The effect of the cavity gradient on the optical sensing performance of the nanobeam is thoroughly examined. By optimizing the design of the gradient cavity, the photonic–phononic sensor has significant sensing performances on the test of glucose solutions. The currently proposed device provides both optical and acoustic detections. The analyte can be cross-examined, which consequently will reduce the sample sensing uncertainty and increase the sensing precision.

1. Introduction

Photonic crystals (PTCs) are periodically arranged structures composed of materials with different refractive indices (RIs). These periodic structures have photonic band gaps (PTBGs) that can block light propagation for a wave with a specific range of frequencies, which, thereby, affects optical wave behaviors in the artificial crystal [1]. PTCs can be designed for measuring RI. Due to their high sensing performances for high sensitivity, real-time and label-free features, PTCs have been developed into sensing applications [2,3,4,5,6], including biomedical sensing and environmental detection. In the same manner as PTCs, phononic crystals (PNCs) consist of periodic materials with different mass densities and elastic coefficients. Besides, PNC structures have phononic band gaps (PNBGs) as well. Recently, PNC sensors have received increasing attention [7,8]. More recently, photonic–phononic crystal sensors with dual PTBGs and PNBGs have also been investigated [9,10,11]. Researchers have created the defect, i.e., cavity, in a periodic crystal so that light/sound is confined in the cavity to produce a localized defect state for performing both photonic and phononic sensing.
Single nanobeams and dual nanobeams have been studied intensively in recent years because of their high-quality factor and small mode volume. Dual nanobeam consists of two beams with a slot between the beams. Each beam is patterned with a one-dimensional line of holes. Wang et al. [12] verified experimentally that the dual nanobeam exhibits high sensibility and quality factors in refractive index sensing for glucose solutions. At the same time, a gradual lattice variation in the defect has been introduced to enhance the energy confinement in cavities [13,14]. Researchers have shown that the gradient design can reduce the mode mismatch at the interface between the cavity space region and the PTC mirrors, which can lead to lower energy loss and higher quality factor for the cavity.
In this study, a dual crystal nanobeam incorporated with a gradient cavity is proposed as the photonic–phononic sensor. The optical and acoustic waves were utilized to detect the physical parameters RI and sound velocity of glucose solutions. The gradient cavity was characterized by gradual variations in the diameter and spacing of holes. By introducing the gradient cavity, the optical and acoustic waves can further be confined in the slot and holes, and avoid energy leakage from the edges of the nanobeam sensor. It can be expected to have a stronger interaction between light/sound and analyte solution, and thus, yield a higher sensing performance. In addition, the current simulation showed that the gradient cavity is indispensable for exciting localized acoustic resonances.
The usage of dual photonic–phononic sensing can increase the selectivity of the sample analysis. A “single sensing” based on either optical sensing or acoustic sensing alone may have trouble in assessing unequivocally the analyte that could be misplaced or contaminated. The simultaneous detection of the optical and acoustic properties from a single device can cross-examine the analyte, which consequently reduces the sensing uncertainty and increases the sensing precision.
This paper is organized as follows. The design of the crystal sensor and theories are presented in Section 2, which includes the geometry of the nanobeam sensor, material properties of the device and glucose solutions, and fundamental theories for the optical and acoustic modal analyses. In Section 3, the numerical results of both the optical and acoustic analyses and the sensing performance for photonic–phononic sensors are given. Pertinent discussions on the results are also included in this section. Section 3.1 focuses on the optical sensing of RI of the glucose solutions. The effect of the cavity gradient on the sensor performance is examined in detail. Meanwhile, the acoustic sensing for the sound velocity of the solutions is shown in Section 3.2. Finally, Section 4 concludes this study.

2. Structure Design and Theory
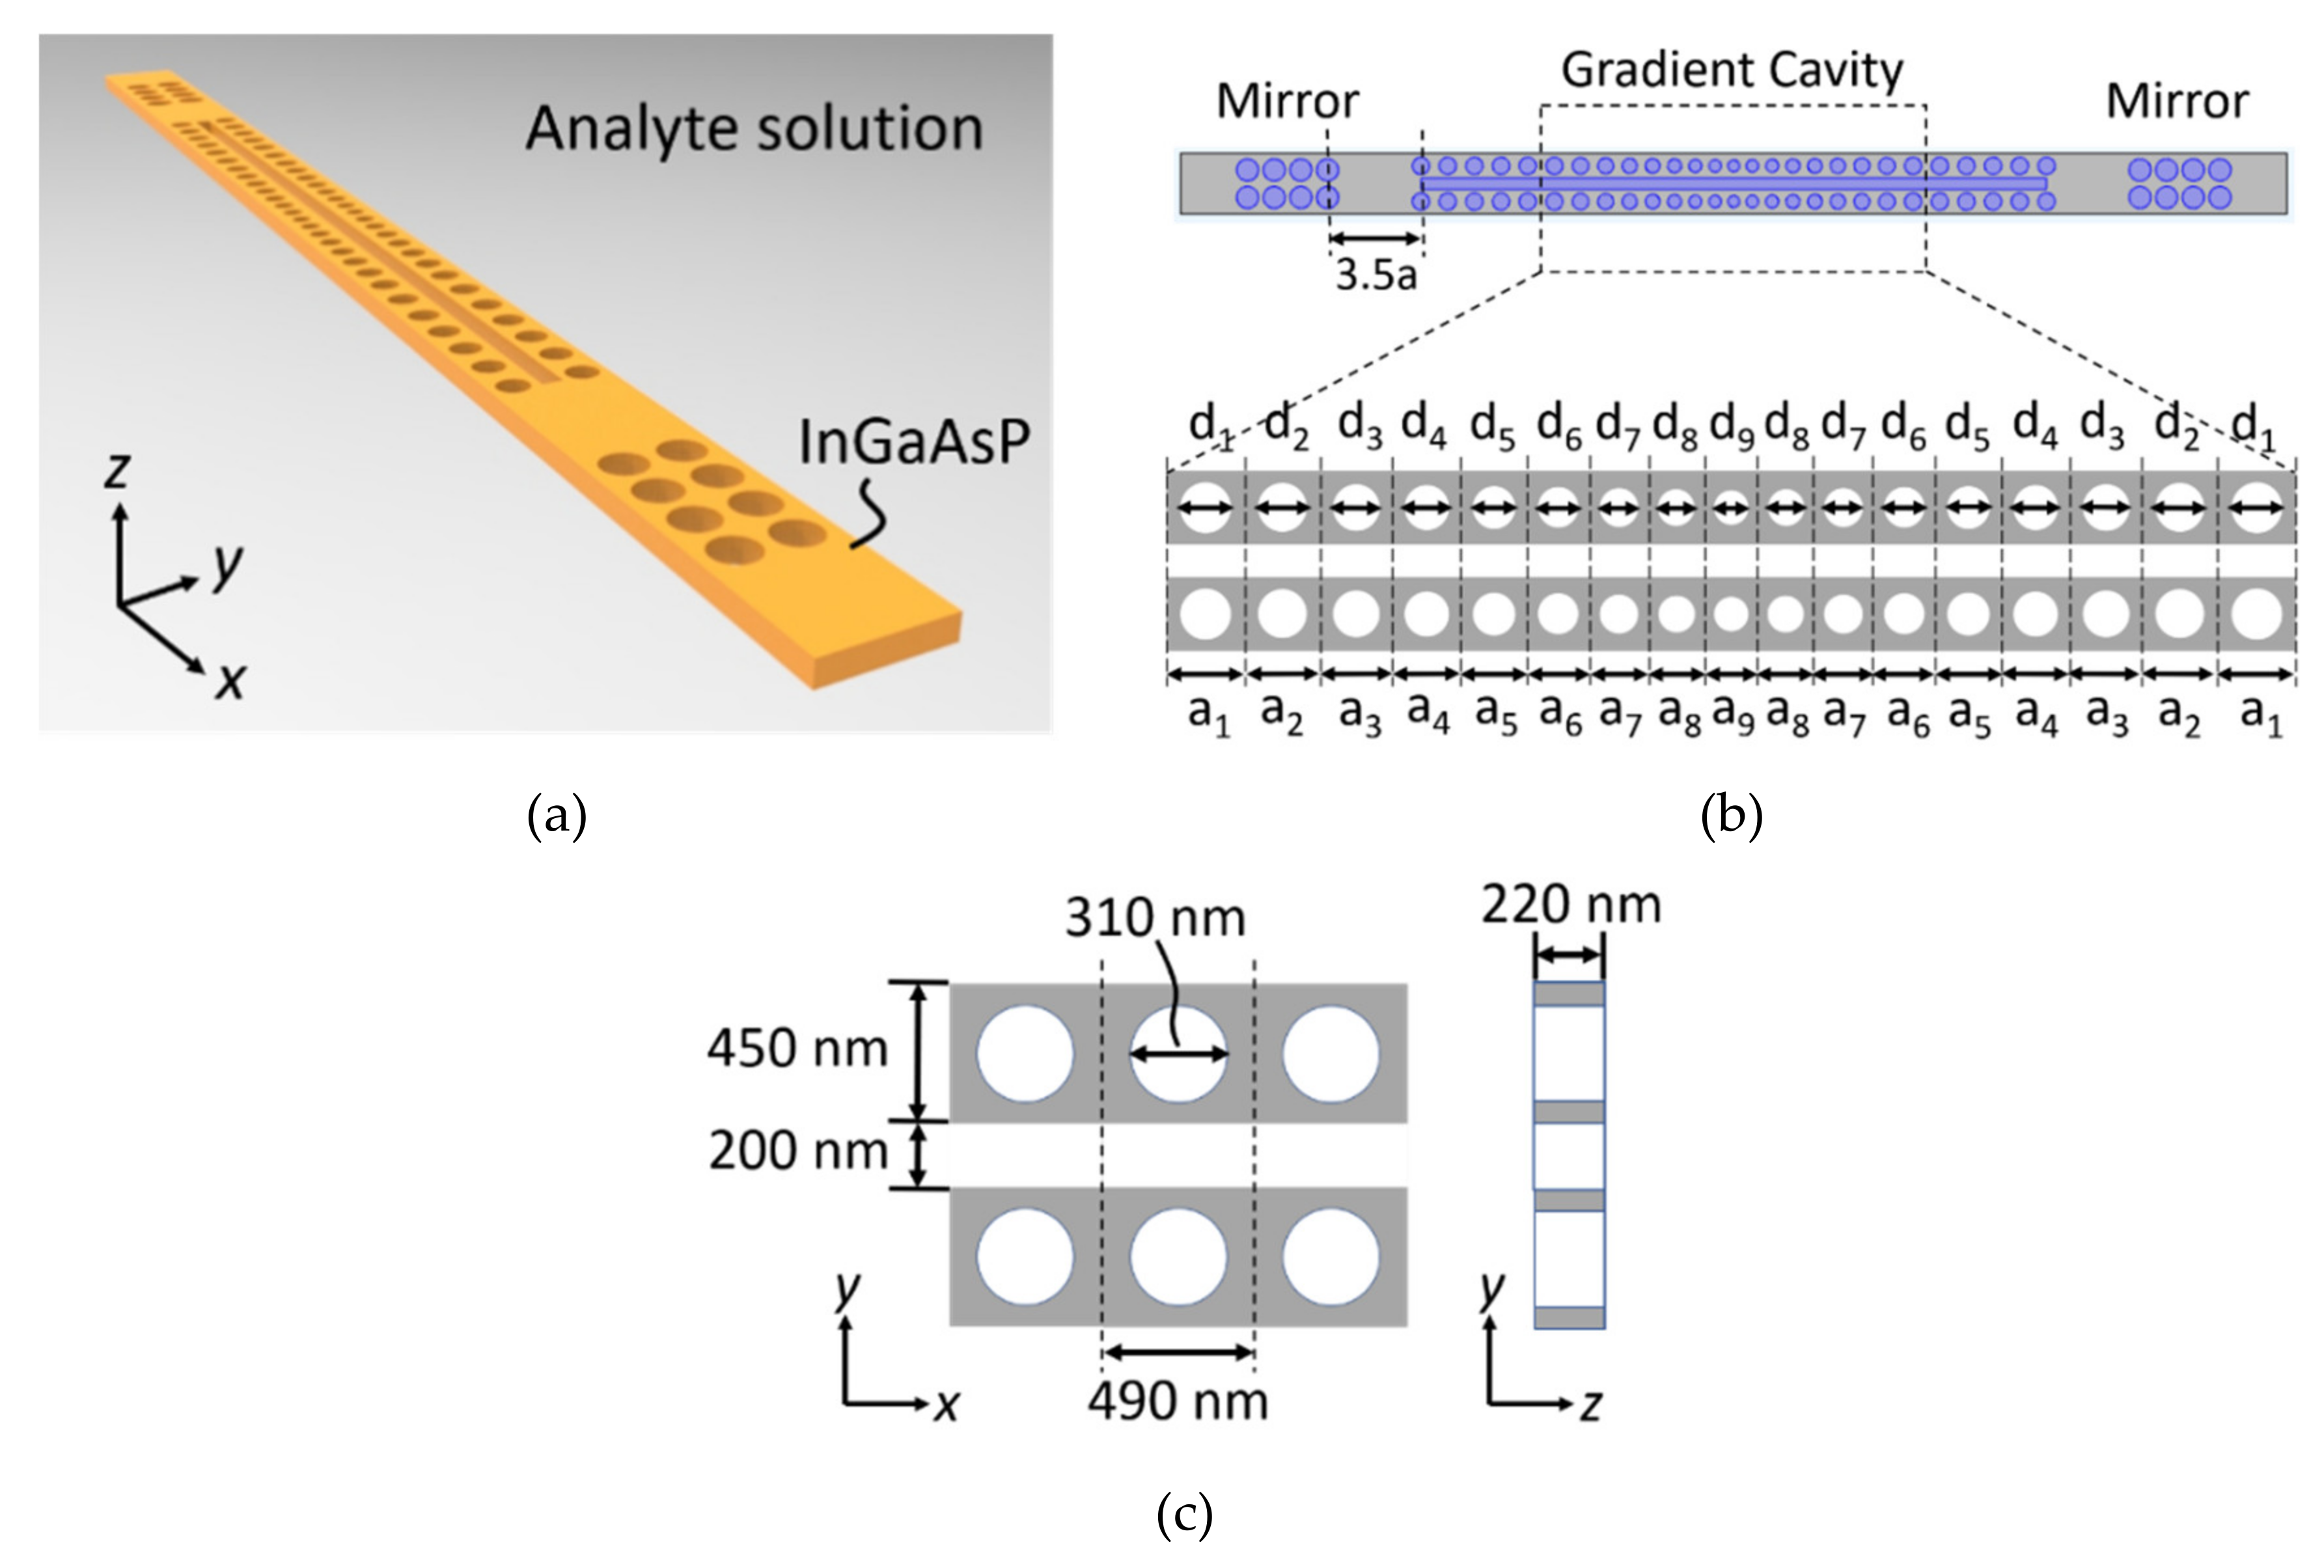
The current photonic analysis was based on the electromagnetic waves theory. Meanwhile, the phononic analysis was based on the wave propagation theory of elastic solids and fluids. The finite element software COMSOL Multiphysics [15] was employed to analyze the acoustic and optical characteristics of the photonic–phononic sensor, which was immersed in the glucose solution. In the current numerical analysis, to simulate the infinite solution domain, the perfect matching layers (PML) were placed on the exteriors of a rectangular parallelepiped that contains the nanobeam.

2.1. Device Design

The structures of coupled nanobeams with slot waveguide can increase the sensitivity of optical sensing due to the enhanced overlap between the localized optical field and the analyte in the slot region [16]. The PTC slot nanobeam slow-light waveguides for RI sensing was investigated by Wang et al. [12]. On the basis of their study, a gradient cavity version of the device for both the optical and acoustic sensing applications is proposed. The schematic three-dimensional view and top view of the device are shown in Figure 1a and Figure 1b, respectively. The enlarged area of the gradient cavity is also depicted in Figure 1b. The lattice constants ai and hole diameters di, as indicated in the figure, vary according to the following formulations:
a i = a × 0.98 ( i 1 ) × N , d i = d × 1 ( i 1 ) × N , ( i = 1 ~ 9 ) a = 490 nm , d = 310 nm , N = 0.01 , 0.02 , 0.03 , 0.04
where a and d are periodic lattice constant and regular hole diameter, respectively. Variable N, referred to as the hole tuning parameter, controls the cavity gradient. A larger value of N represents a larger variation in hole diameter and spacing. In this study, the effect of N, on the sensing performance of the device was examined. The design of this gradient cavity structure was classified as a heterogeneous-type resonant cavity [17], which is aimed at making the optical energy more tightly confined in the slot and holes. It is noted from Figure 1b that the length of the slot was also dependent on N. To prevent energy loss from two ends, mirrors with a lattice constant of 490 nm and hole diameter of 400 nm were added [12], as indicated in Figure 1b. The top and cross-section views of the unit cell of the corresponding perfect crystal structure are presented in Figure 1c, which shows that the width of a single nanobeam was 450 nm, the width of the slot was 200 nm, and the beam thickness was 220 nm.
The structure was assumed to be made of indium gallium arsenide phosphide (InGaAsP). From the point of optical view, InGaAsP behaves as an isotropic medium. The RI was taken as n = 3.2395 [18]. The elastic constants of InGaAsP, a cubic material, were C11 = 1.0081 × 10¹¹ N/m2, C12 = 5.4468 × 10¹⁰ N/m2, and C44 = 4.6392 × 10¹⁰ N/m2 [19]. Meanwhile, the mass density of InGaAsP was ρ = 4936.9 kg/m3 [19]. The analyte to be sensed was glucose solution with percent concentrations (by mass) of 0%, 20%, 40% and 60% (w/w), separately. The corresponding RIs of the solutions with various concentrations were n = 1.3330, 1.3639, 1.3999 and 1.4419, respectively [20]. The corresponding mass densities were ρ = 998, 1084, 1180 and 1273 kg/m3, respectively [21]. The sound speeds in the solutions were taken as 1490, 1558, 1671 and 1781 m/s, respectively [21].

2.2. Theories

The time-harmonic governing equations for the optical and acoustic modes are provided in Section 2.2.1 and Section 2.2.2, respectively. All equations presented hereafter are in phasor notations. The formulations for calculating the sensitivity, quality factor, and figure of merit for the photonic–phononic device are listed in Section 2.2.3.

2.2.1. Optical Modes

The magnetic field H of time-harmonic optical waves is governed by the Helmholtz equation [22]:
× 1 ε r × H = ω 2 c 2 H
and subjected to the transverse condition:
· H = 0
where εr, ω, and c are the relative permittivity, angular frequency, and the light speed in a vacuum, respectively. Once the magnetic field was solved, the electric field could be obtained as
E = i ω ε × H
where ε is the permittivity.

2.2.2. Acoustic Modes

The sensor was immersed in the glucose solution. Therefore, the acoustic analysis involved the solid–fluid interaction. The relevant equations include not only the governing equations for both the solid and fluid but also the interface coupling conditions between two media. The pertinent equations in the phasor forms are presented.
The propagation of time-harmonic waves in an elastic body was governed by the Cauchy equation of motion. Without considering body force, the governing equation is [23]:
· T + ρ s ω 2 u s = 0
where T, ρs, and us are the stress, mass density, and displacement of the solid, respectively. For an anisotropic elastic material, the constitutive equation connecting stress T and strain S is
T = C : S
where C is the stiffness tensor. The strain S caused by the displacement field us can be expressed as:
S = 1 2 u s + ( u s ) T
The time-harmonic wave propagation in the fluid domain was governed by the Helmholtz equation for sound pressure [24]:
· 1 ρ f p + ω 2 ρ f c f 2 p = 0
where p, ρf, and cf are the pressure, mass density, and sound speed of the fluid, respectively.
On the interface, the force balance and displacement continuity are required [24]. The force balance condition, or traction condition, is:
T · n = p n
where n is the unit outward normal vector to the boundary of the solid domain. Meanwhile, when the body force is neglected, the displacement continuity condition can be expressed as:
ρ f ω 2 u s · n = p n

2.2.3. Sensitivity and Figure of Merit

The sensing parameters, namely sensitivity, quality factor, and figure of merit, were introduced to evaluate the optical and acoustic sensing performances of the nanobeam device. The sensitivities of photonic and phononic sensors are defined separately as [2]
S photonic = Δ λ r Δ n nm / RIU ; S photonic = Δ f r Δ c kHz / ms 1
In the above expression, Δλr and Δn are the resonant wavelength shift and RI difference of two solutions when performing optical sensing. Parameters Δfr and Δc are the resonant frequency shift and sound-velocity difference of two solutions when performing acoustic sensing. Unit RIU stands for the Refractive Index Unit.
Figure of merit, also widely used in photonic and phononic sensors to characterize the sensing capability, is defined as [2]
FOM photonic = S photonic × Q o λ r RIU 1 ; FOM photonic = S photonic × Q a f r m / s 1
where λr and fr are the resonant wavelength shift and frequency shift for optical sensing and acoustic sensing, respectively. Parameters Qo and Qa are the quality factors for photonic and phononic sensors, which are defined as [2]:
Q o = λ r FWHM , λ ; Q a = f r FWHM , f
where FWHMλ and FWHMf are the full width at half maximum of the resonant wavelength and frequency, respectively.

3. Results and Discussions

This section presents and discusses the calculated results of the optical and acoustic behaviors and the sensing performance of the photonic–phononic device. The results based on the optical and acoustic analyses are given in Section 3.1 and Section 3.2, respectively.

3.1. Optical Behaviors

The results of the optical behavior analysis are presented in this subsection. First, the band diagram and eigenmodes of the perfect crystal structure immersed in the distilled water were studied. Second, the defect modes of the finite-length nanobeam with N = 0.04 were found. Third, the resonant spectra and wavelength shifts for glucose solutions with various concentrations are presented. The sensing performance for each excited mode was evaluated by examining the evaluation parameters. Finally, the effect of the cavity gradient on the sensing performance was investigated.

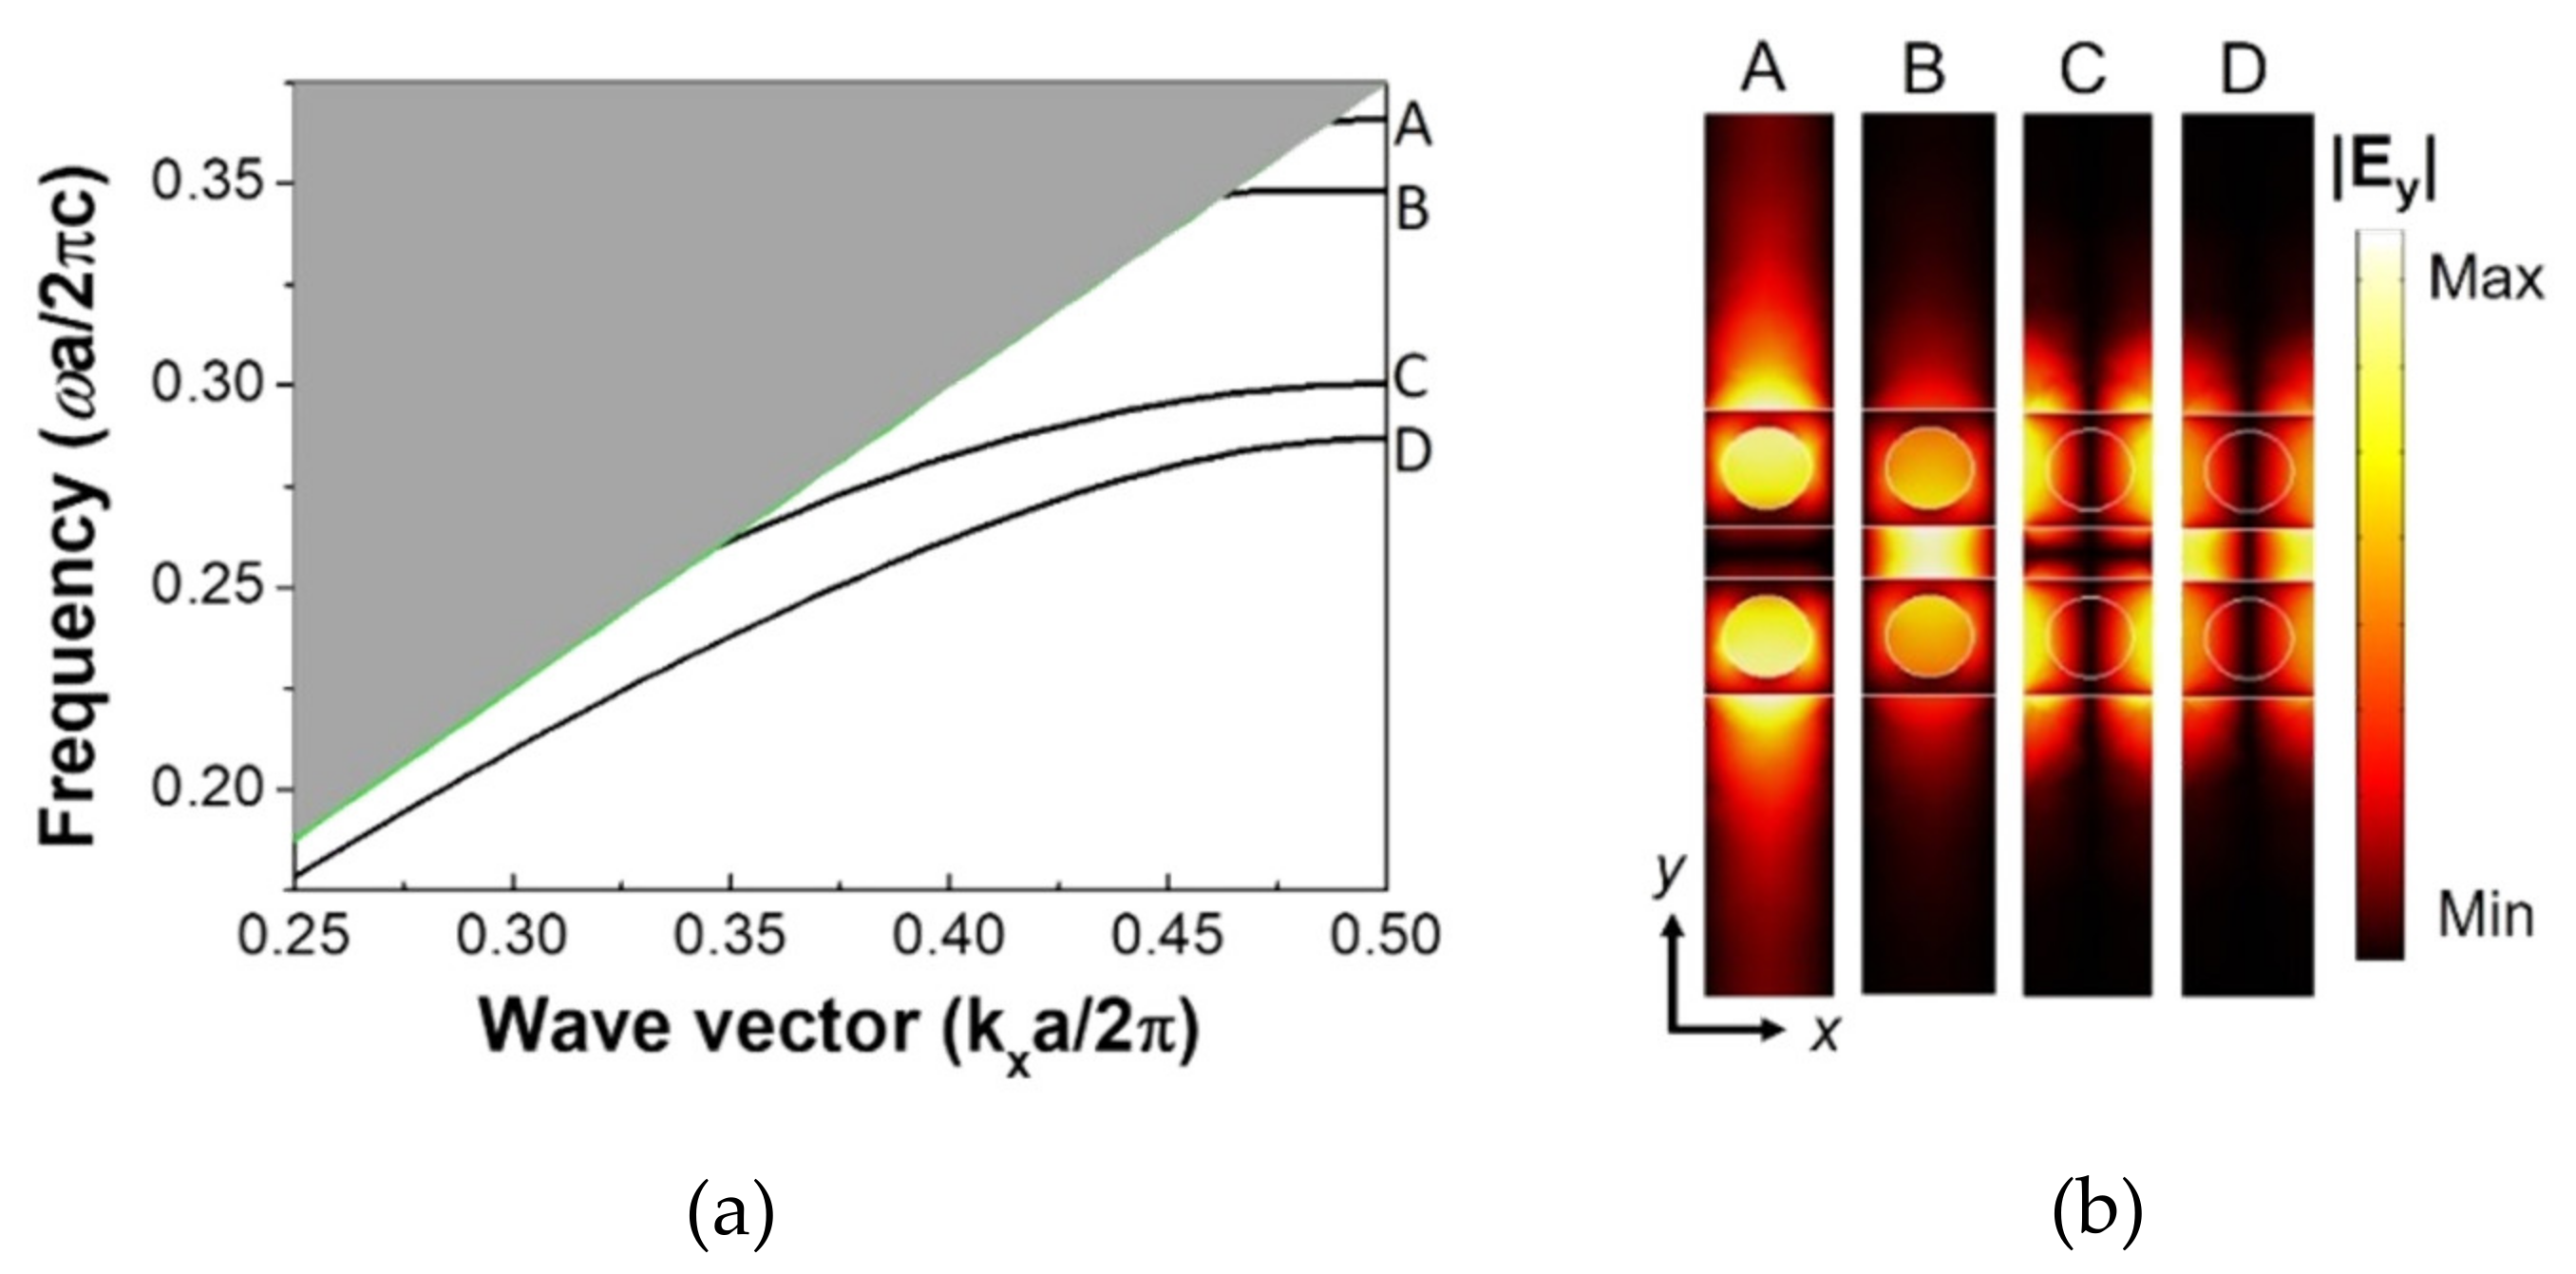
3.1.1. Perfect Modes of Photonic Crystal

The time-harmonic optical wave equation (2) was solved numerically based on the unit-cell model of the perfect crystal slot nanobeam. The perfect crystal waveguide under consideration was assumed to be immersed in pure water. The calculated dispersion curves below the light cone are shown in Figure 2a. The four band curves corresponded to four photonic eigenmodes that can propagate in the perfect crystal structure. At the Brillouin zone boundary, their corresponding wavelengths were 1338.6, 1407.9, 1630.9, and 1707.1 nm, respectively. It is noted that there was a PTBG between Modes B and C.
The electric-field intensity patterns associated with these four band-edge Modes A–D are shown in Figure 2b. For all those modes, the electric field was primarily polarized on the xy plane and dictated by Ey; meanwhile, the magnetic field was predominately in the transverse (z) direction. The highest-frequency Mode A was the closest mode to the light line; its mode profile revealed that the electric field extended into the surrounding water. Meanwhile, the lowest-frequency Mode D was far away from the light line; its mode pattern suggested that this mode had more optical energy concentrated in the slot and InGaAsP.
To understand the modal characteristics of the grooved nanobeam, the sensing performance of the perfect lattice modes of the PTC was further analyzed. The surrounding pure water was replaced by a glucose solution with a concentration of 60%. The wavelength shift ratios and sensitivity values of these four band-edge modes are reported in Table 1. It is noted that the high-frequency Modes A and B had higher wavelength shift ratios and sensitivity values than the low-frequency Modes C and D. These results were consistent with the electric field distributions shown in Figure 2b, which indicates that there is a stronger interaction between light and fluid for the high-frequency modes. For the low-frequency modes, Mode D had higher values of wavelength shift and sensitivity than Mode C. It is because the optical energy of Mode C was primarily located in InGaAsP, while Mode D had more optical energy confined within the slot infiltrated with solution. From the above results, it is further confirmed that an increase in the active region between optical resonance and analyte will generally improve sensitivity.

3.1.2. Defect Modes of Photonic Crystal (with N = 0.04)

For the finite-length crystal slot nanobeam (with N = 0.04) immersed in the pure water, nine localized defect modes were found and are indicated by dashed lines in Figure 3a. The bands of the perfect crystal structure are also repeatedly shown in Figure 3a. The six higher-frequency defect modes 1–6 were inside the band gap, and their wavelengths were 1445.0, 1472.2, 1526.6, 1572.0, 1576.2, and 1620.0 nm, respectively. The distributions of their electric field are shown in Figure 3b. Meanwhile, three lower-frequency modes 7–9 were below the frequency band gap with wavelengths 1640.9, 1699.5, and 1746.7 nm, respectively. The electric field profiles are shown in Figure 3c, which indicate that the optical energy was also largely confined. In general, the high-frequency modes had more optical energy concentrated in the central part of the nanobeam. Meanwhile, the optical energy of low-frequency modes spread to both ends but did not leak to the surrounding water due to the existence of mirrors and gradient cavity. The energy of Modes 1, 3, 5, and 6 was primarily concentrated in the hole cavities only. However, the energy of Modes 2, 4, 7, 8, and 9 was concentrated in both holes and the slot.
To analyze the sensing performance for these cavity modes of the photonic device, external excitations are applied to the cavity structure (with N = 0.04) immersed in a sensing fluid to obtain the resonance spectrum. By changing the surrounding fluids with different RIs, the offsets of the resonance wavelengths in the spectrum are observed and used for the RI sensing. The resonance spectrum of the nanobeam sensor with infiltration of distilled water is shown in Figure 4a. Five peaks were observed for wavelengths ranging from 1400 nm to 1770 nm. These five excited modes corresponded to defect crystal Modes 2, 4, 7, 8, and 9 with resonance wavelengths 1472.1, 1572.0, 1640.9, 1701.8, and 1746.5 nm, respectively. The electric field patterns of the excited modes are illustrated in Figure 4b. It is seen that both the resonance wavelengths and excited mode profiles were consistent with frequencies and eigenmodes based on the eigen-analysis. It is also noted from resonance spectra that Modes 4 and 7 had higher peaks, which implies that these two modes had more optical energy stored in the structure than the other modes. However, those modes associated with higher peaks did not necessarily have a better sensing performance. The quality of the sensing performance depended on the interaction between the optical mode profile and the object to be tested, and on the energy storage capacity in the cavity.
To analyze the sensing performance of these resonance modes, the surrounding distilled water was replaced by glucose solutions with concentrations of 20%, 40%, and 60%, separately. The resulting resonance spectra are shown in Figure 4c. It is observed that a larger redshift occurred for a solution with a higher concentration. The redshift phenomenon can be justified by the following perturbation formula for frequency shift [25]:
ω ω 0 ω = V d V Δ μ H · H * + Δ ε E · E * V d V μ H · H * + ε E · E *
where ω0 and ω are the resonance frequencies of the structure immersed in pure water and in glucose solution, respectively. Parameter Δμ is the difference in permeability between solution and water, which can be neglected since both permeability values are taken to be unity. Meanwhile, Δε is the difference in dielectric constants between glucose solution and water. A glucose solution with higher concentration will have a larger RI and consequently will have a higher value in dielectric constant. Therefore, it can be concluded from Equation (14) that replacing water with glucose solution will cause a redshift in resonance wavelength. The resonance wavelengths of the above-mentioned five excitation modes are plotted against solution concentrations in Figure 4d. It is seen from the figure that the relation between resonant wavelength and solution concentration was nearly linear up to a concentration of 60% for every mode, which posts a great advantage in the detection of an analyte with various concentrations.
The resonance wavelengths and the full width at half maximum (FWHM) for various excited defect modes for a solution with 60% concentration are listed in Table 2. The resonance wavelength shifts corresponding to distilled water and 60% solution are also included in Table 2. The performance evaluation parameters Q, S, and FOM were calculated; the results based on the 60% solution are tabulated in the table. It is noted that, in general, higher-frequency modes had higher Q values than the lower-frequency modes. This observation can be confirmed by examining the mode profiles illustrated in Figure 4b, which shows the optical energy distributions of high-frequency modes were more concentrated and confined in the center of the nanobeam. One exception was low-frequency Mode 8, whose energy distribution spread all over the holes and slot, but it had the highest Q value. This may be due to the mirrors on both ends, which can effectively reflect light back to the structure. It is further noted from Table 2 that the lower-frequency modes consistently had a larger sensitivity S than the higher-frequency modes. This is because those low-frequency modes had more extensive interaction between light resonance and sensing fluids. As a final observation of Table 2, it is no surprise that Mode 8 had a much higher FOM than the other modes since FOM incorporated both S and Q, and Mode 8 had nearly the largest values in both parameters.

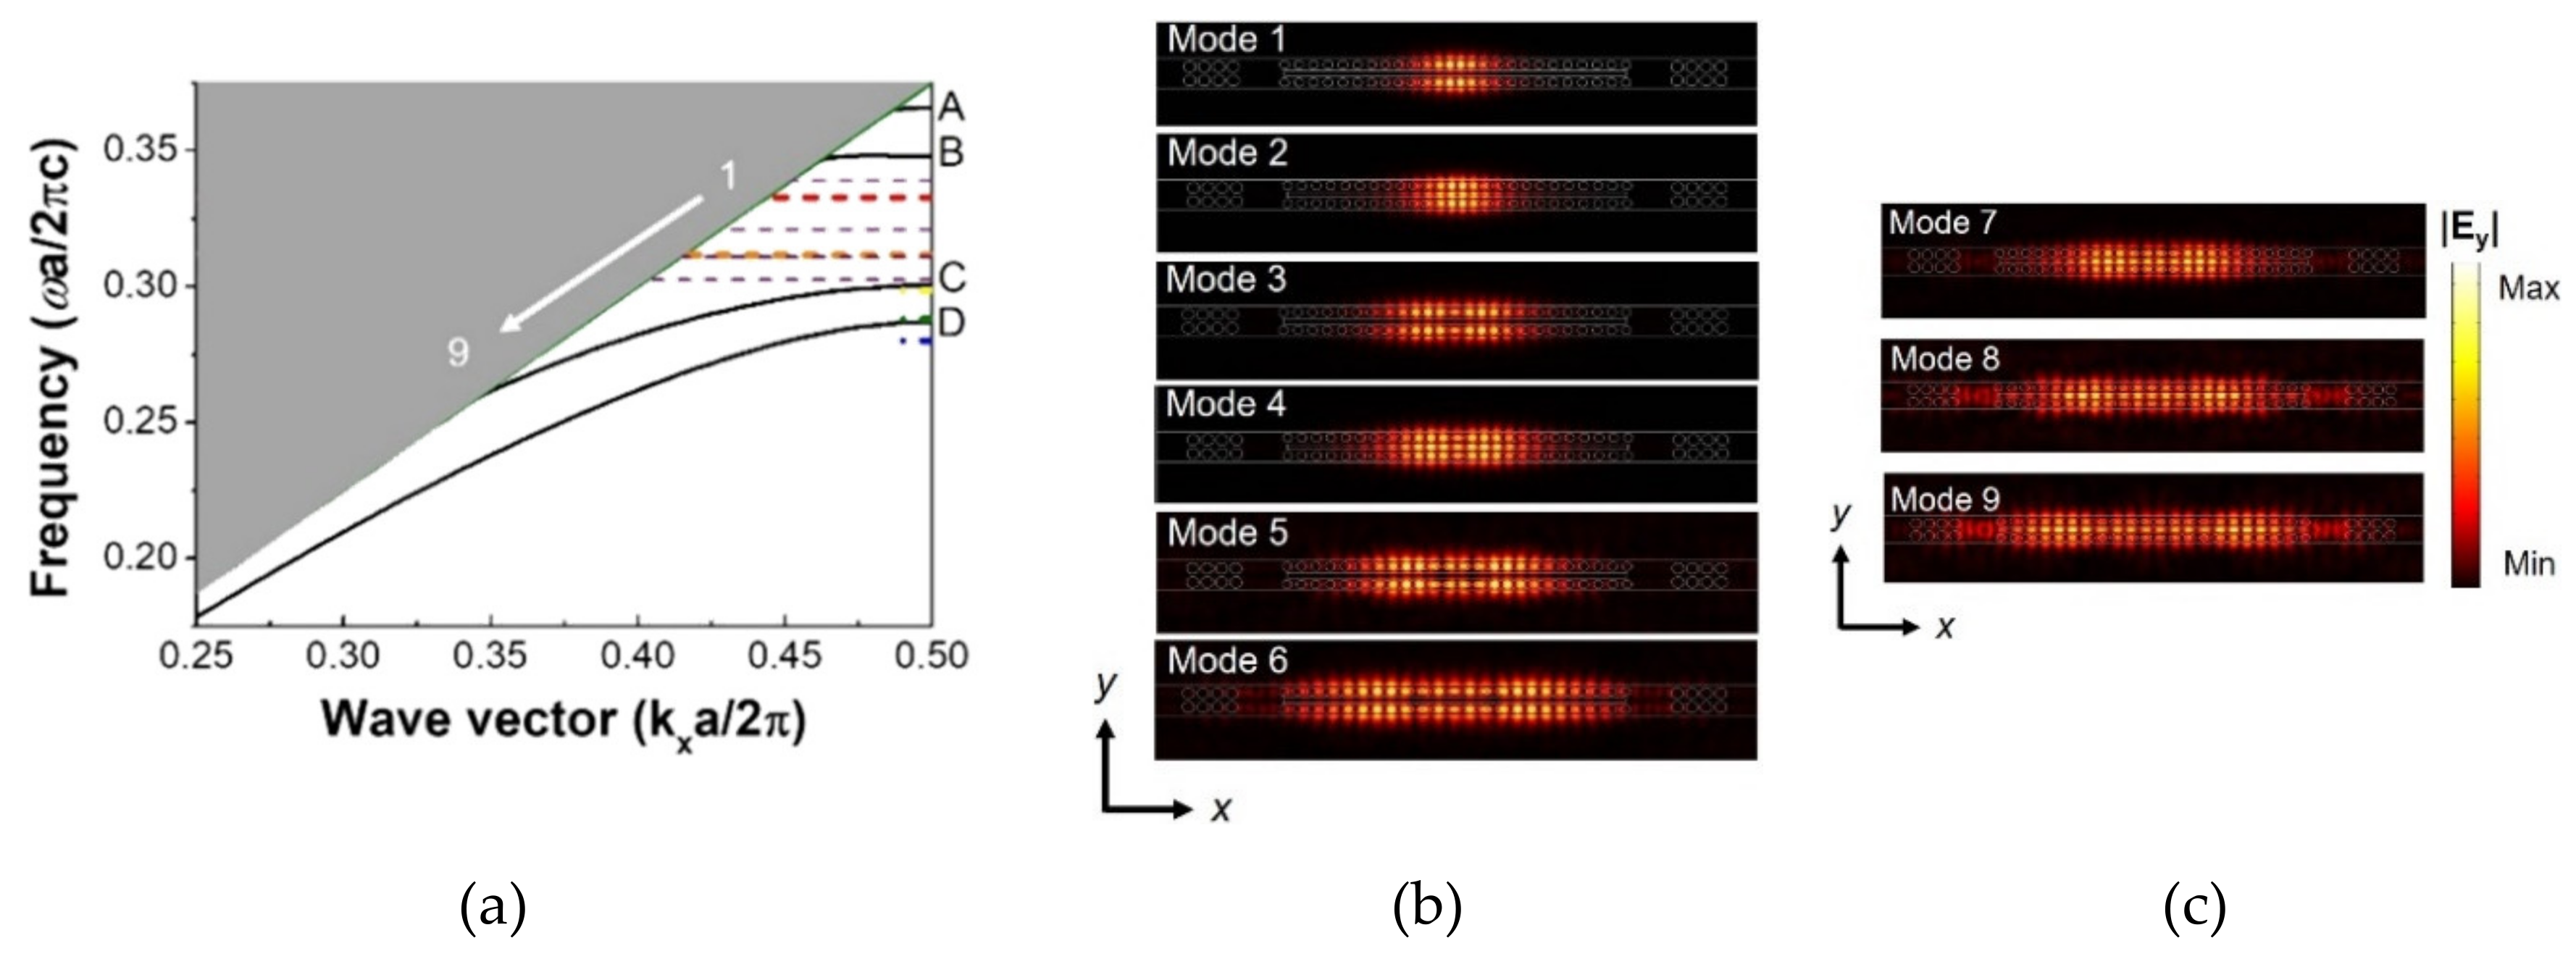
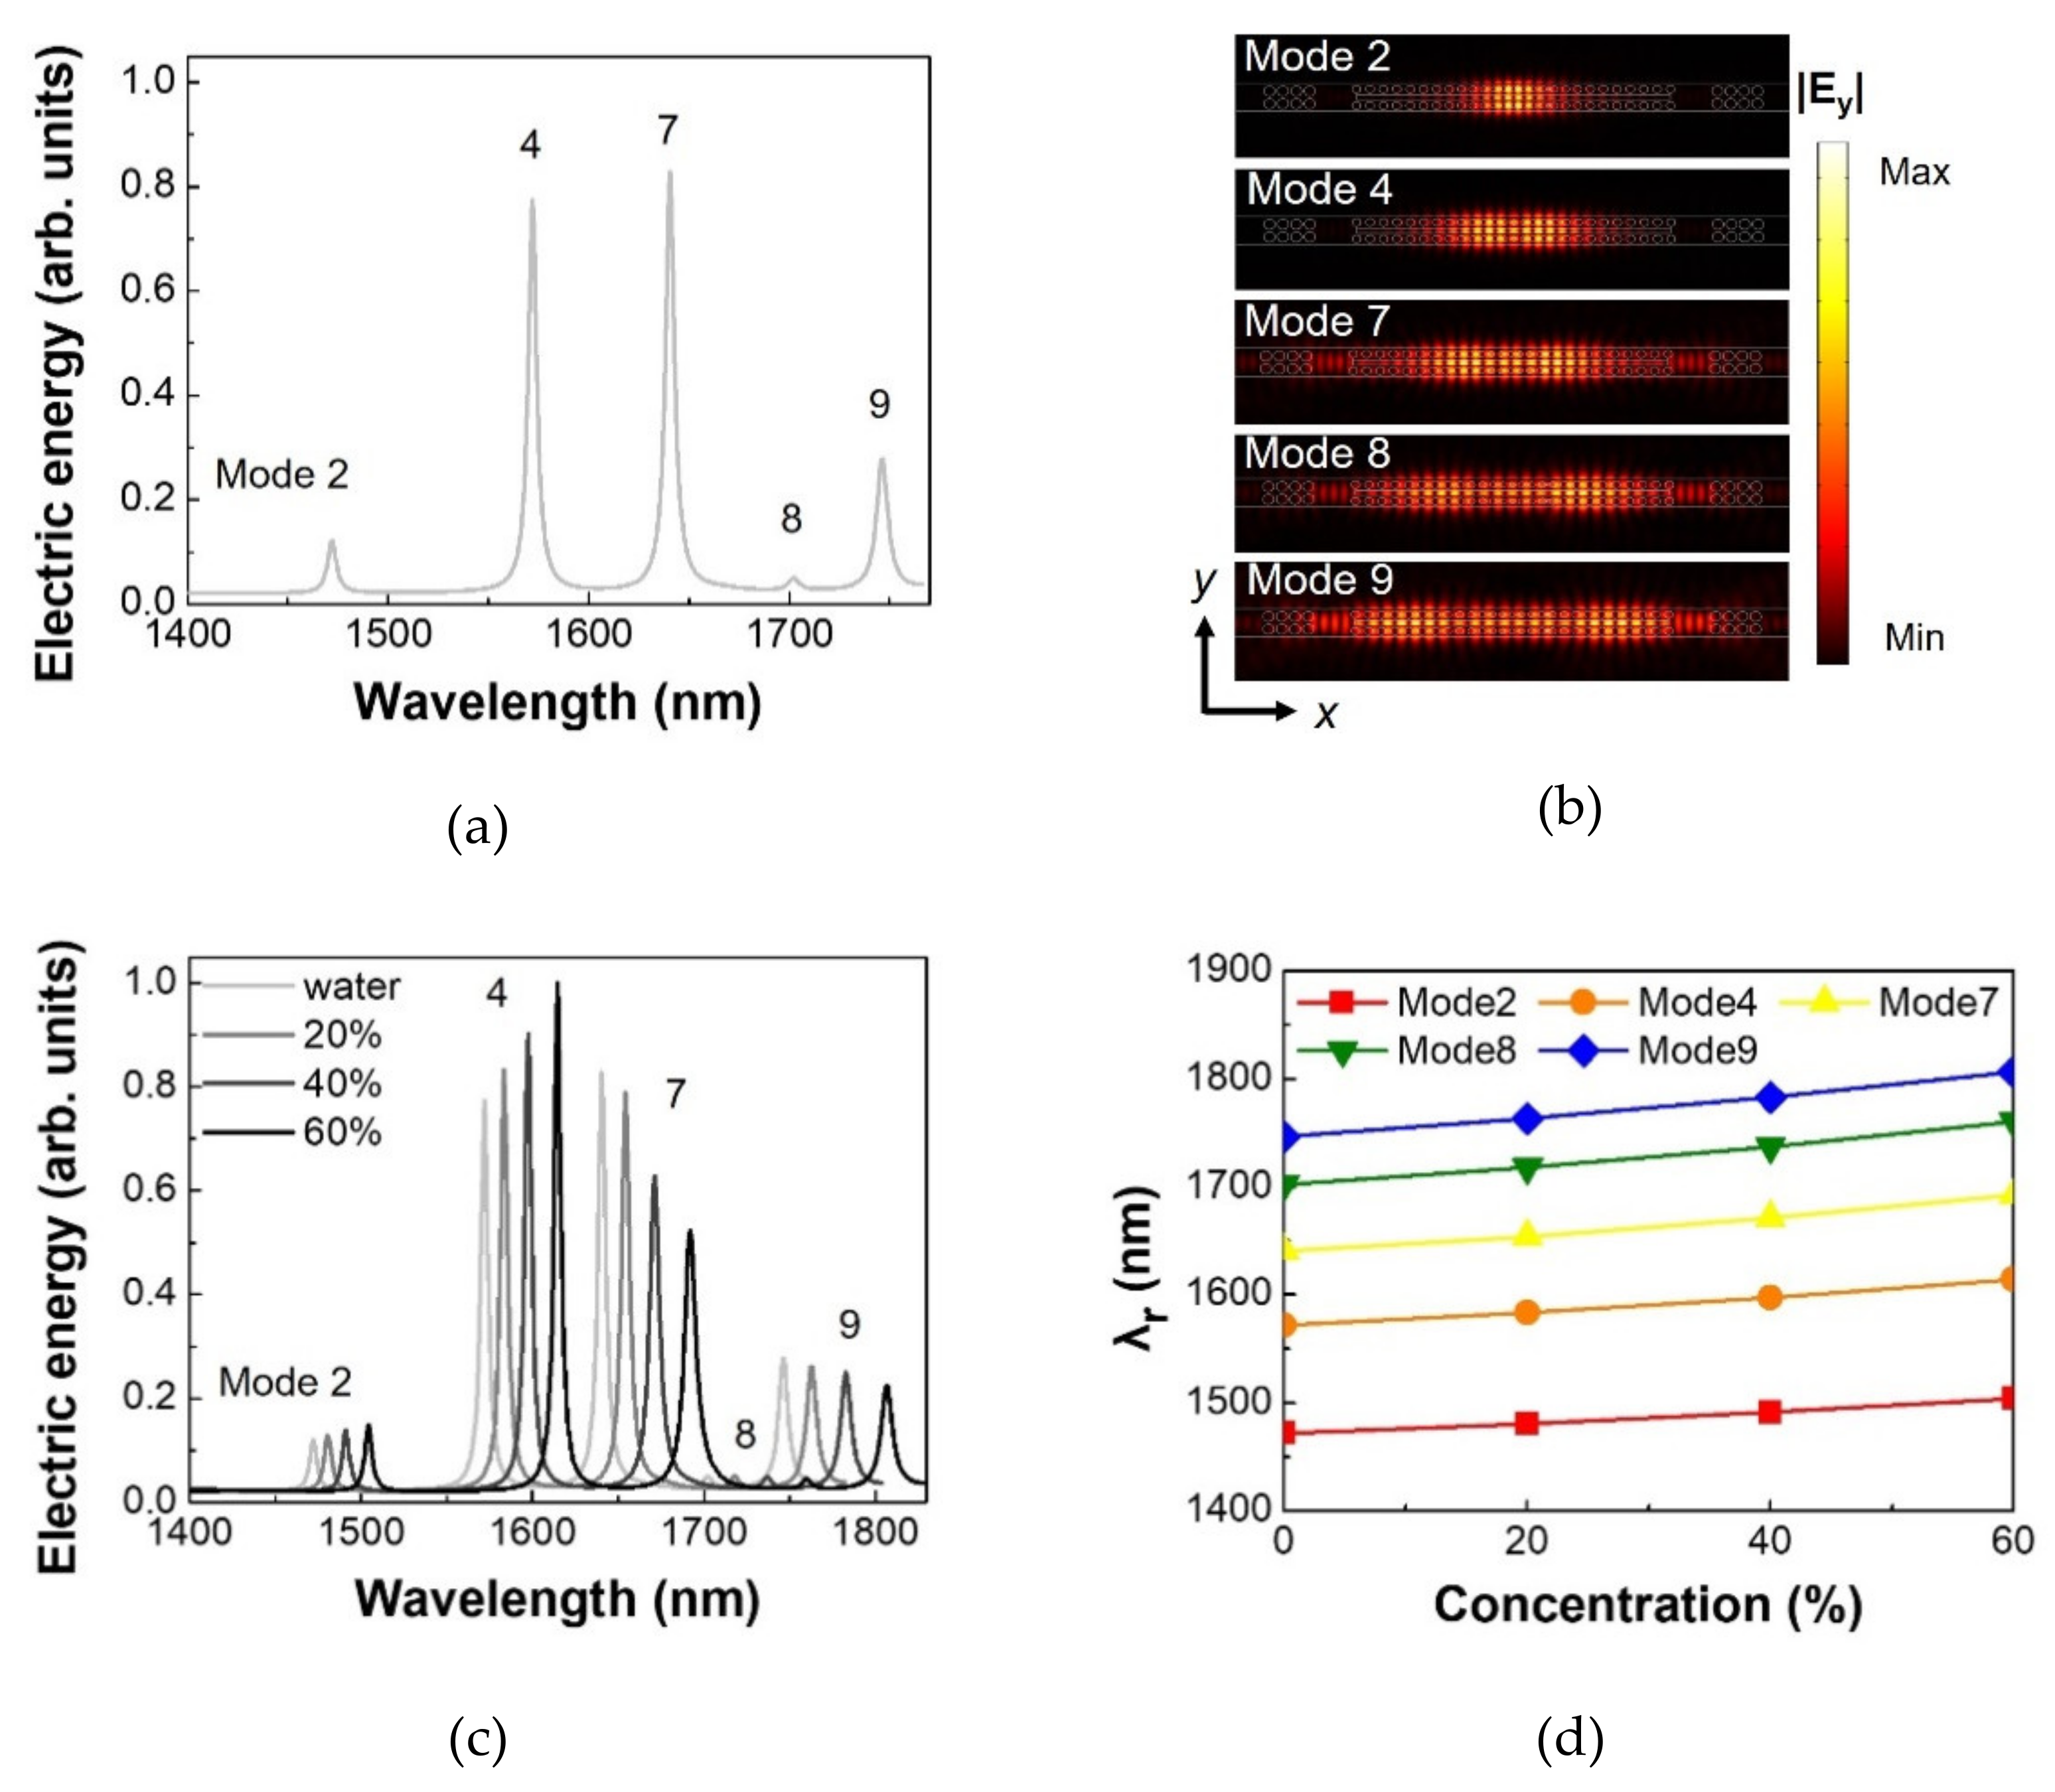
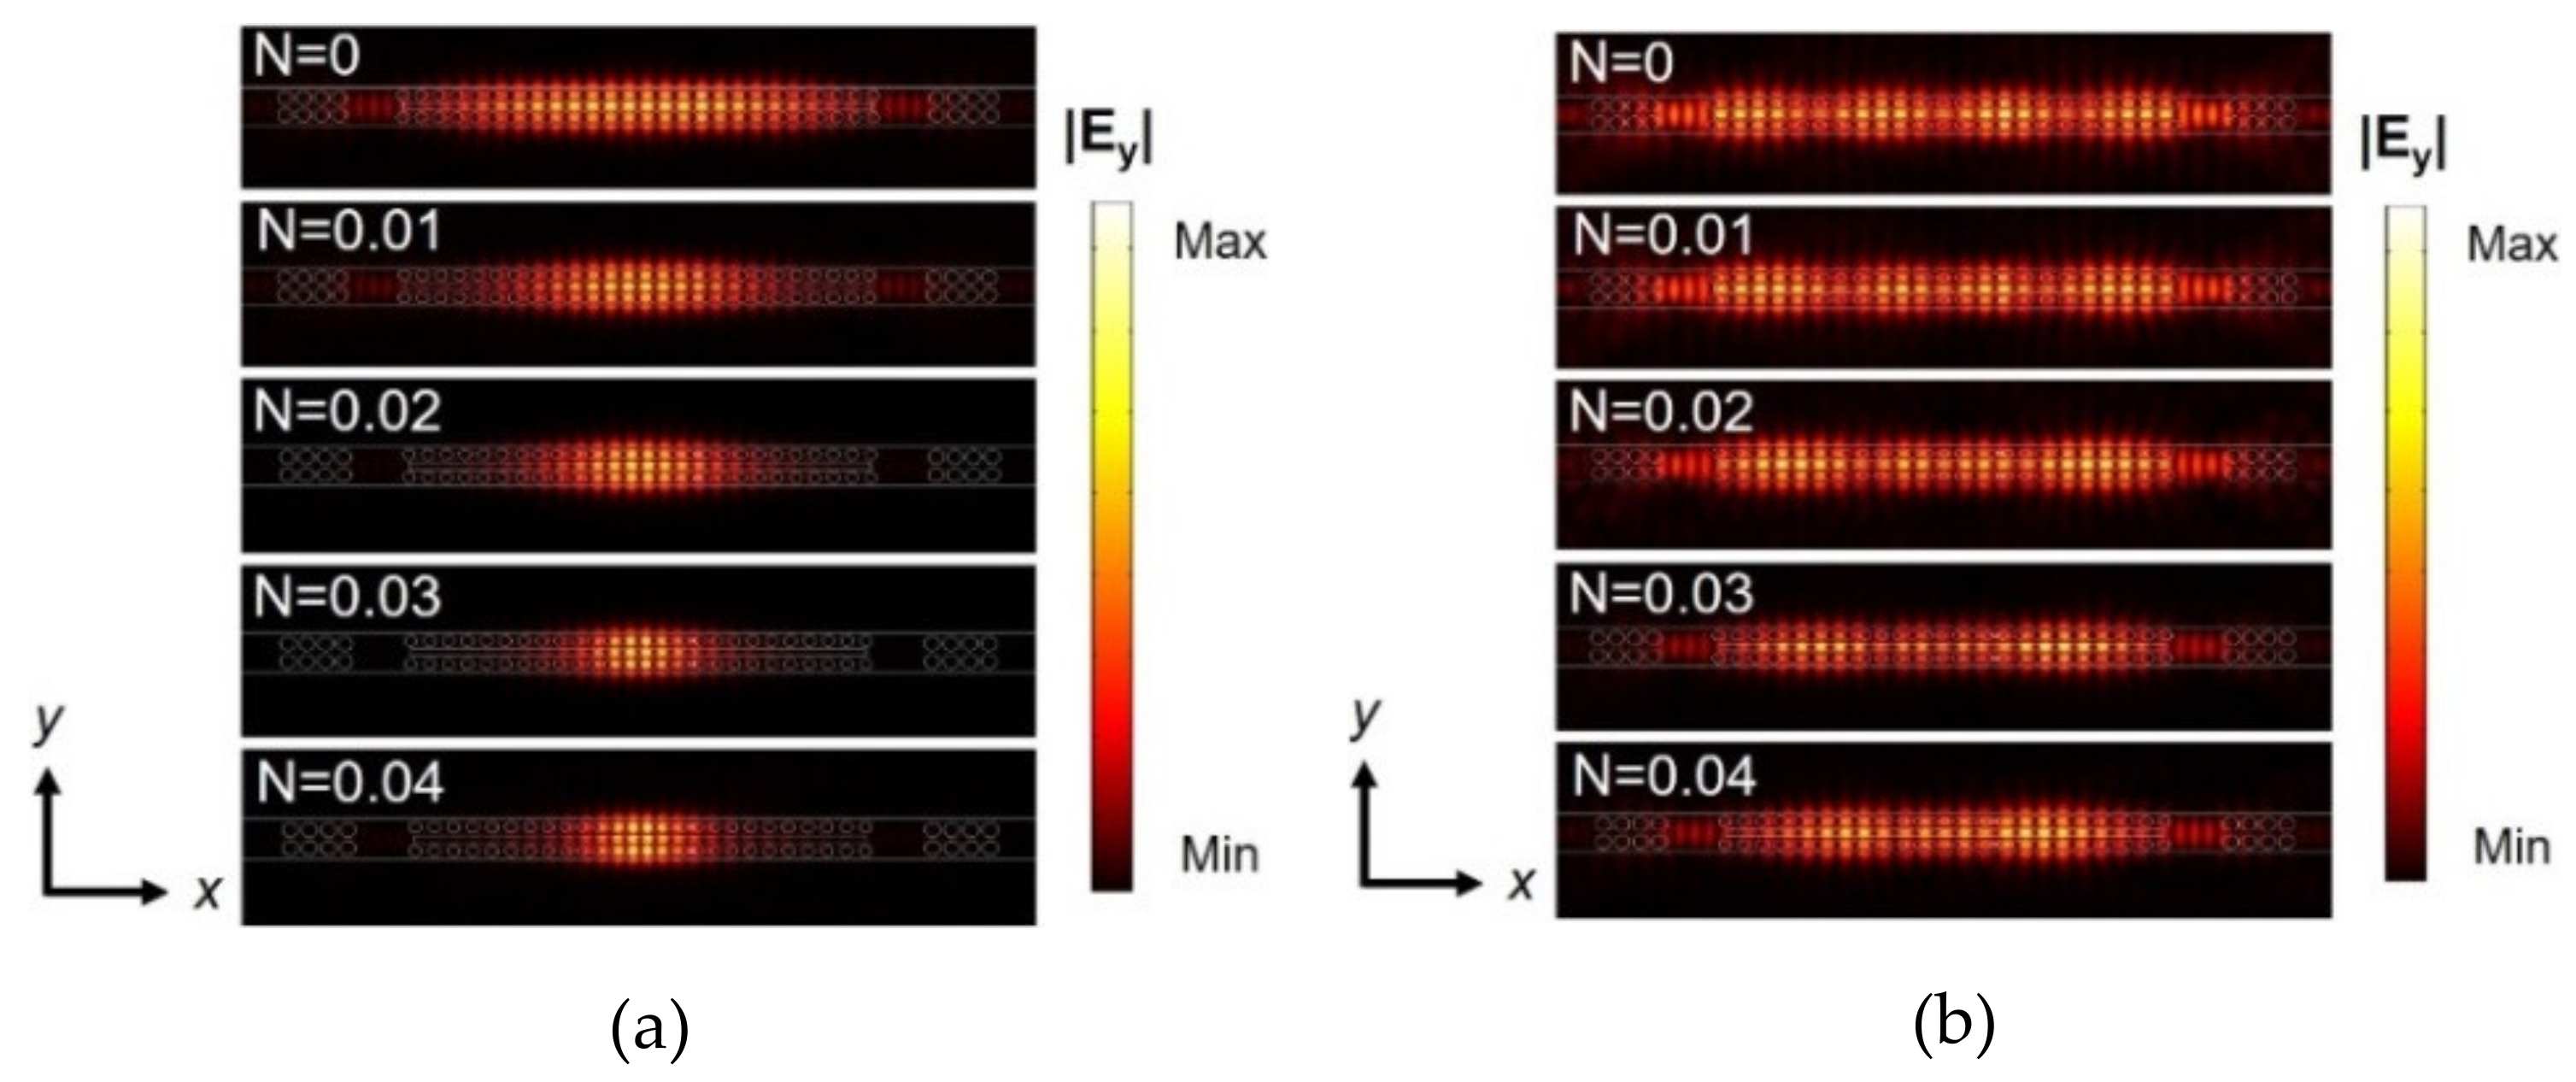
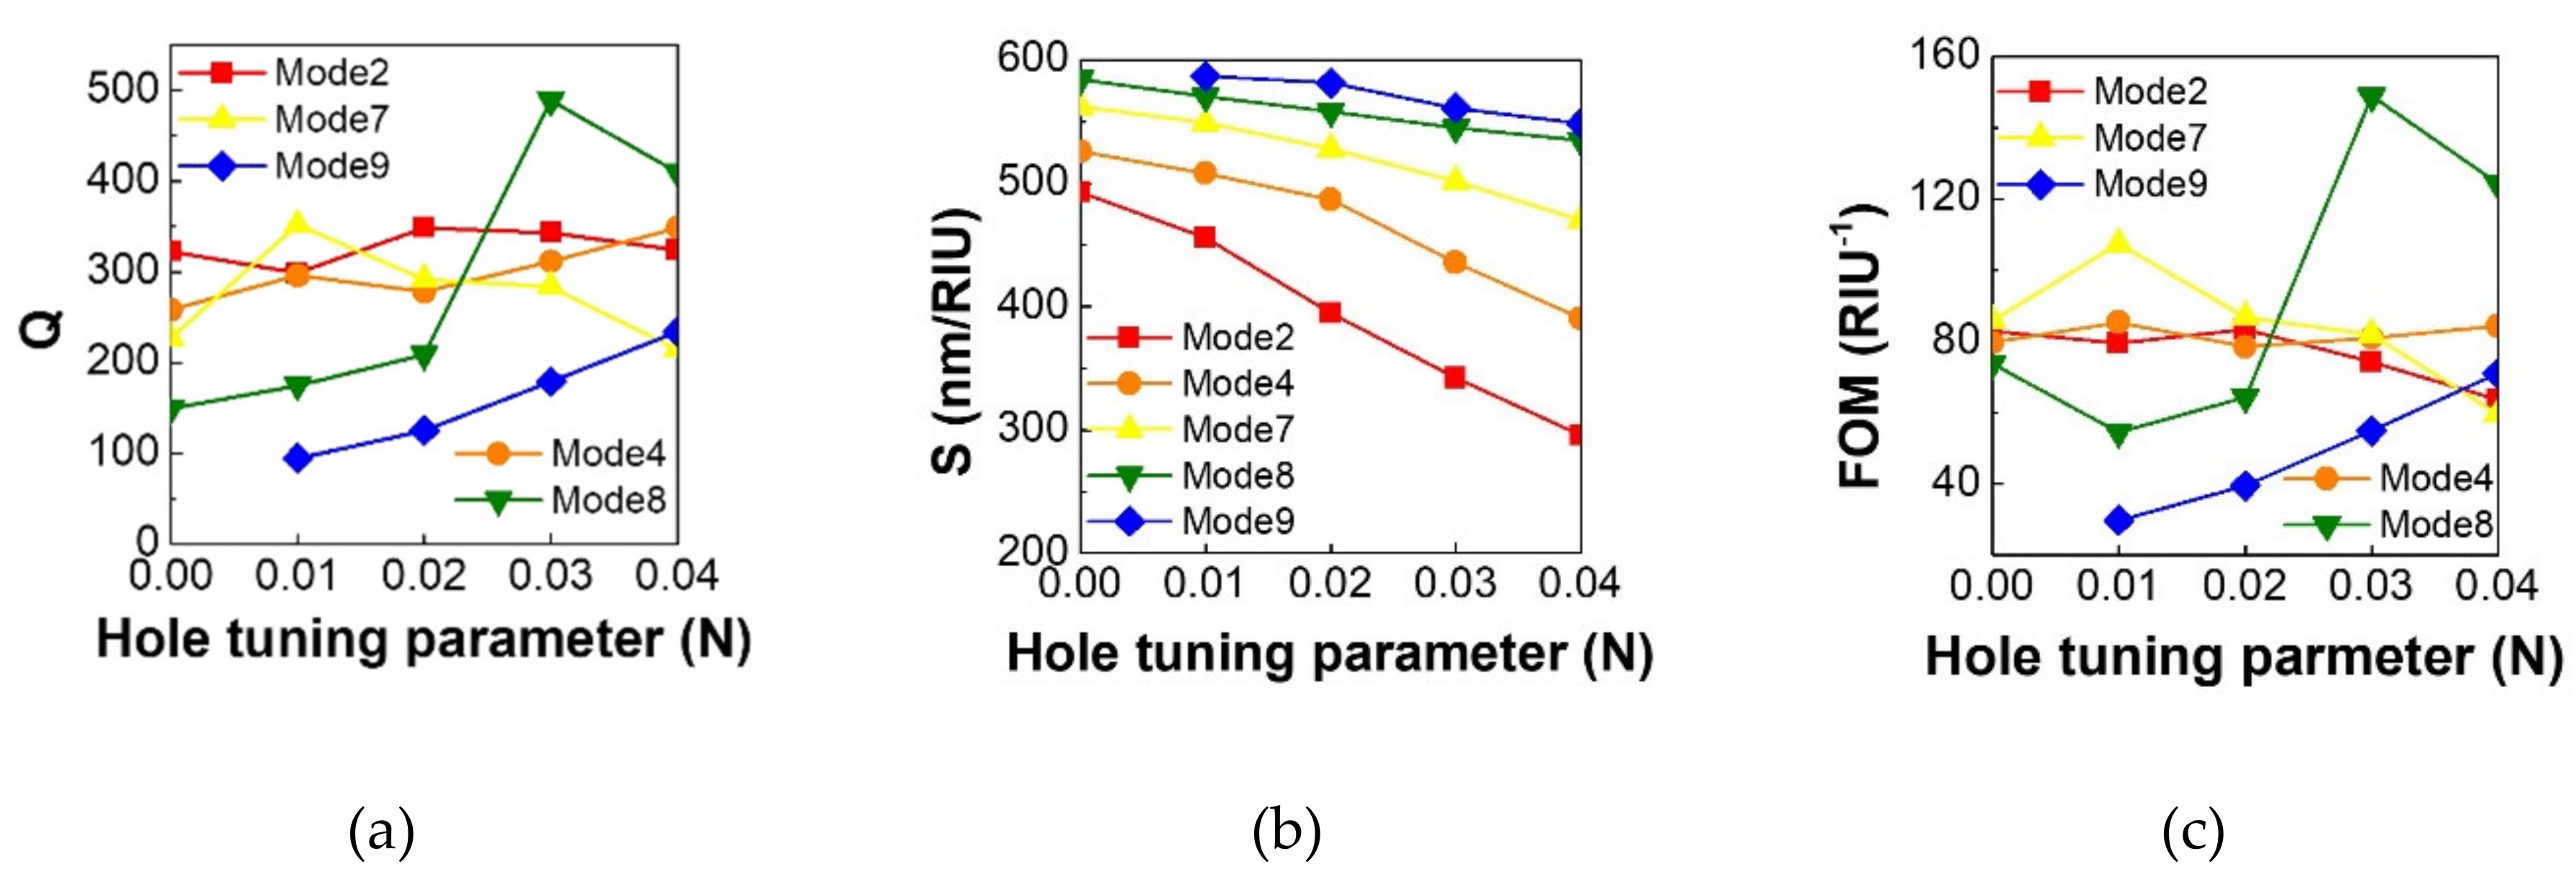
3.1.3. Gradient Cavity Optimization

The design of the gradient cavity with varying hole diameters and heterogeneous lattices is aimed at creating a cavity that can produce more localized modes. In this subsubsection, the effect of gradient cavity, controlled by the hole tuning parameter N on the sensing performance of the nanobeam, is studied in detail. The glucose solution with a 60% concentration was considered. The values of N were 0, 0.01, 0.02, 0.03, and 0.04, respectively. According to Equation (1), the diameters and spacing of holes decreased when the value of N increased.
The electric-field intensity patterns corresponding to the highest-frequency Mode 2 and the low-frequency Mode 8 for various values of N are illustrated in Figure 5a,b. It is noted that from both figures that modes with larger N had a more localized optical energy distribution. For Mode 2, a large cavity gradient (i.e., large N) yielded an extremely localized distribution; meanwhile, this mode had a more extended pattern when the cavity gradient was smaller. For low-frequency Mode 8, it is observed that optical energy leaks from both ends of the nanobeam when gradient defect was absent (N = 0). On the other hand, the leaky mode could be tuned into a more localized mode by creating a larger gradient cavity. It is worth mentioning that the lowest-frequency resonant Mode 9 could not be excited when the nanobeam lacked a cavity gradient.
The evaluation parameters Q, S, and FOM are plotted against the hole tuning parameter N in Figure 6a–c, separately for the 60% glucose solution. It is noted from Figure 6a that while quality factors of the high-frequency modes were not much affected by the cavity gradient, the quality factor Q of low-frequency Modes 8 and 9 improved as the cavity gradient increases. This is because a dispersive pattern can be transformed into a more concentrated mode by increasing N, as illustrated in Figure 5b. Figure 6b reveals that sensitivity S decreased as cavity gradient parameter N increased for all the modes considered, especially for high-frequency Modes 2 and 4. As indicated in Figure 5a, Mode 2 became more concentrated, and the volume of mode was greatly reduced as N increased. The reduction in the active region between optical resonance and analyte caused a decrease in S. Figure 6c shows the effect of hole tuning parameter N on the FOM, which incorporated both S and Q. It shows that the design of gradient cavity was more beneficial to the low-frequency modes. The FOM of Mode 9 improved steadily as N increased. Mode 8 had an overall highest FOM when N = 0.03.

3.2. Acoustic Behaviors

The nanobeams, coupled with gradient cavity design, can work not only as optical sensors but also as acoustic sensors, which is demonstrated in this subsection. The results of the phononic analysis are presented hereafter. First, the band diagram and eigenmodes of the perfect crystal structure immersed in distilled water are analyzed. Among various eigenmodes, those modes associated with volume dilation of cavities are singled out because they possess a larger solid–fluid interaction. Then, the defect modes of the finite-length nanobeam with N = 0.04 were investigated. Finally, the acoustic resonant spectra for glucose solutions with various concentrations are presented. The acoustic sensing performance for each excited mode was evaluated by examining the evaluation parameters.

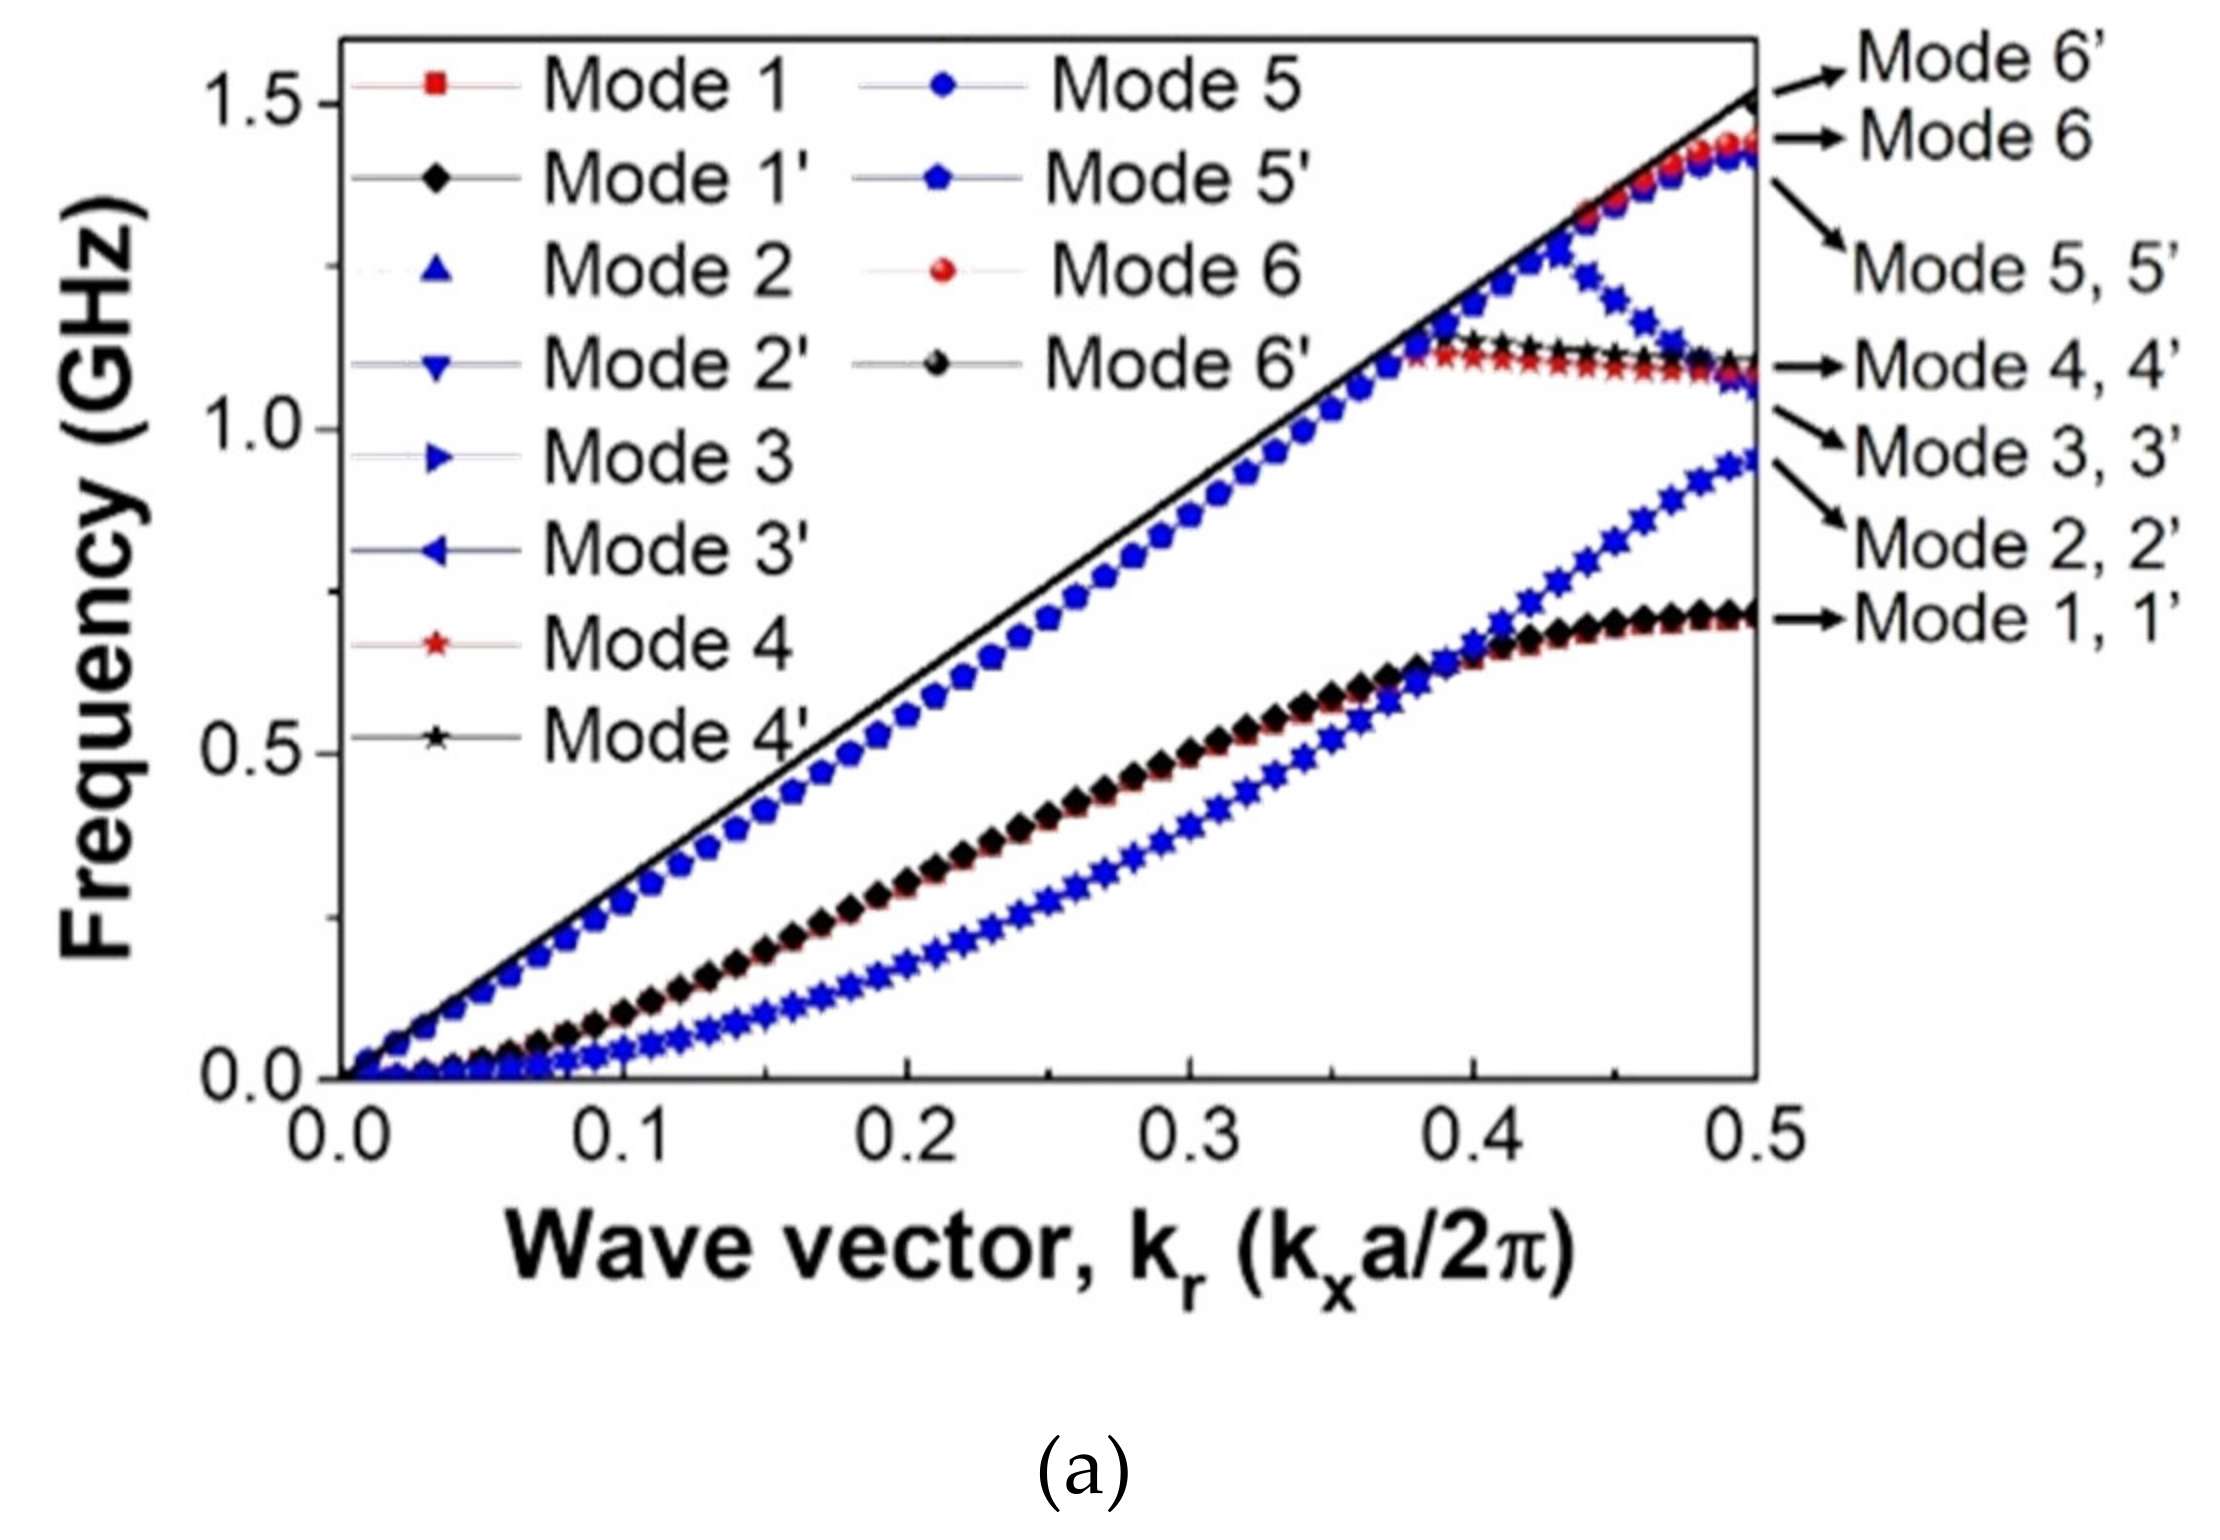
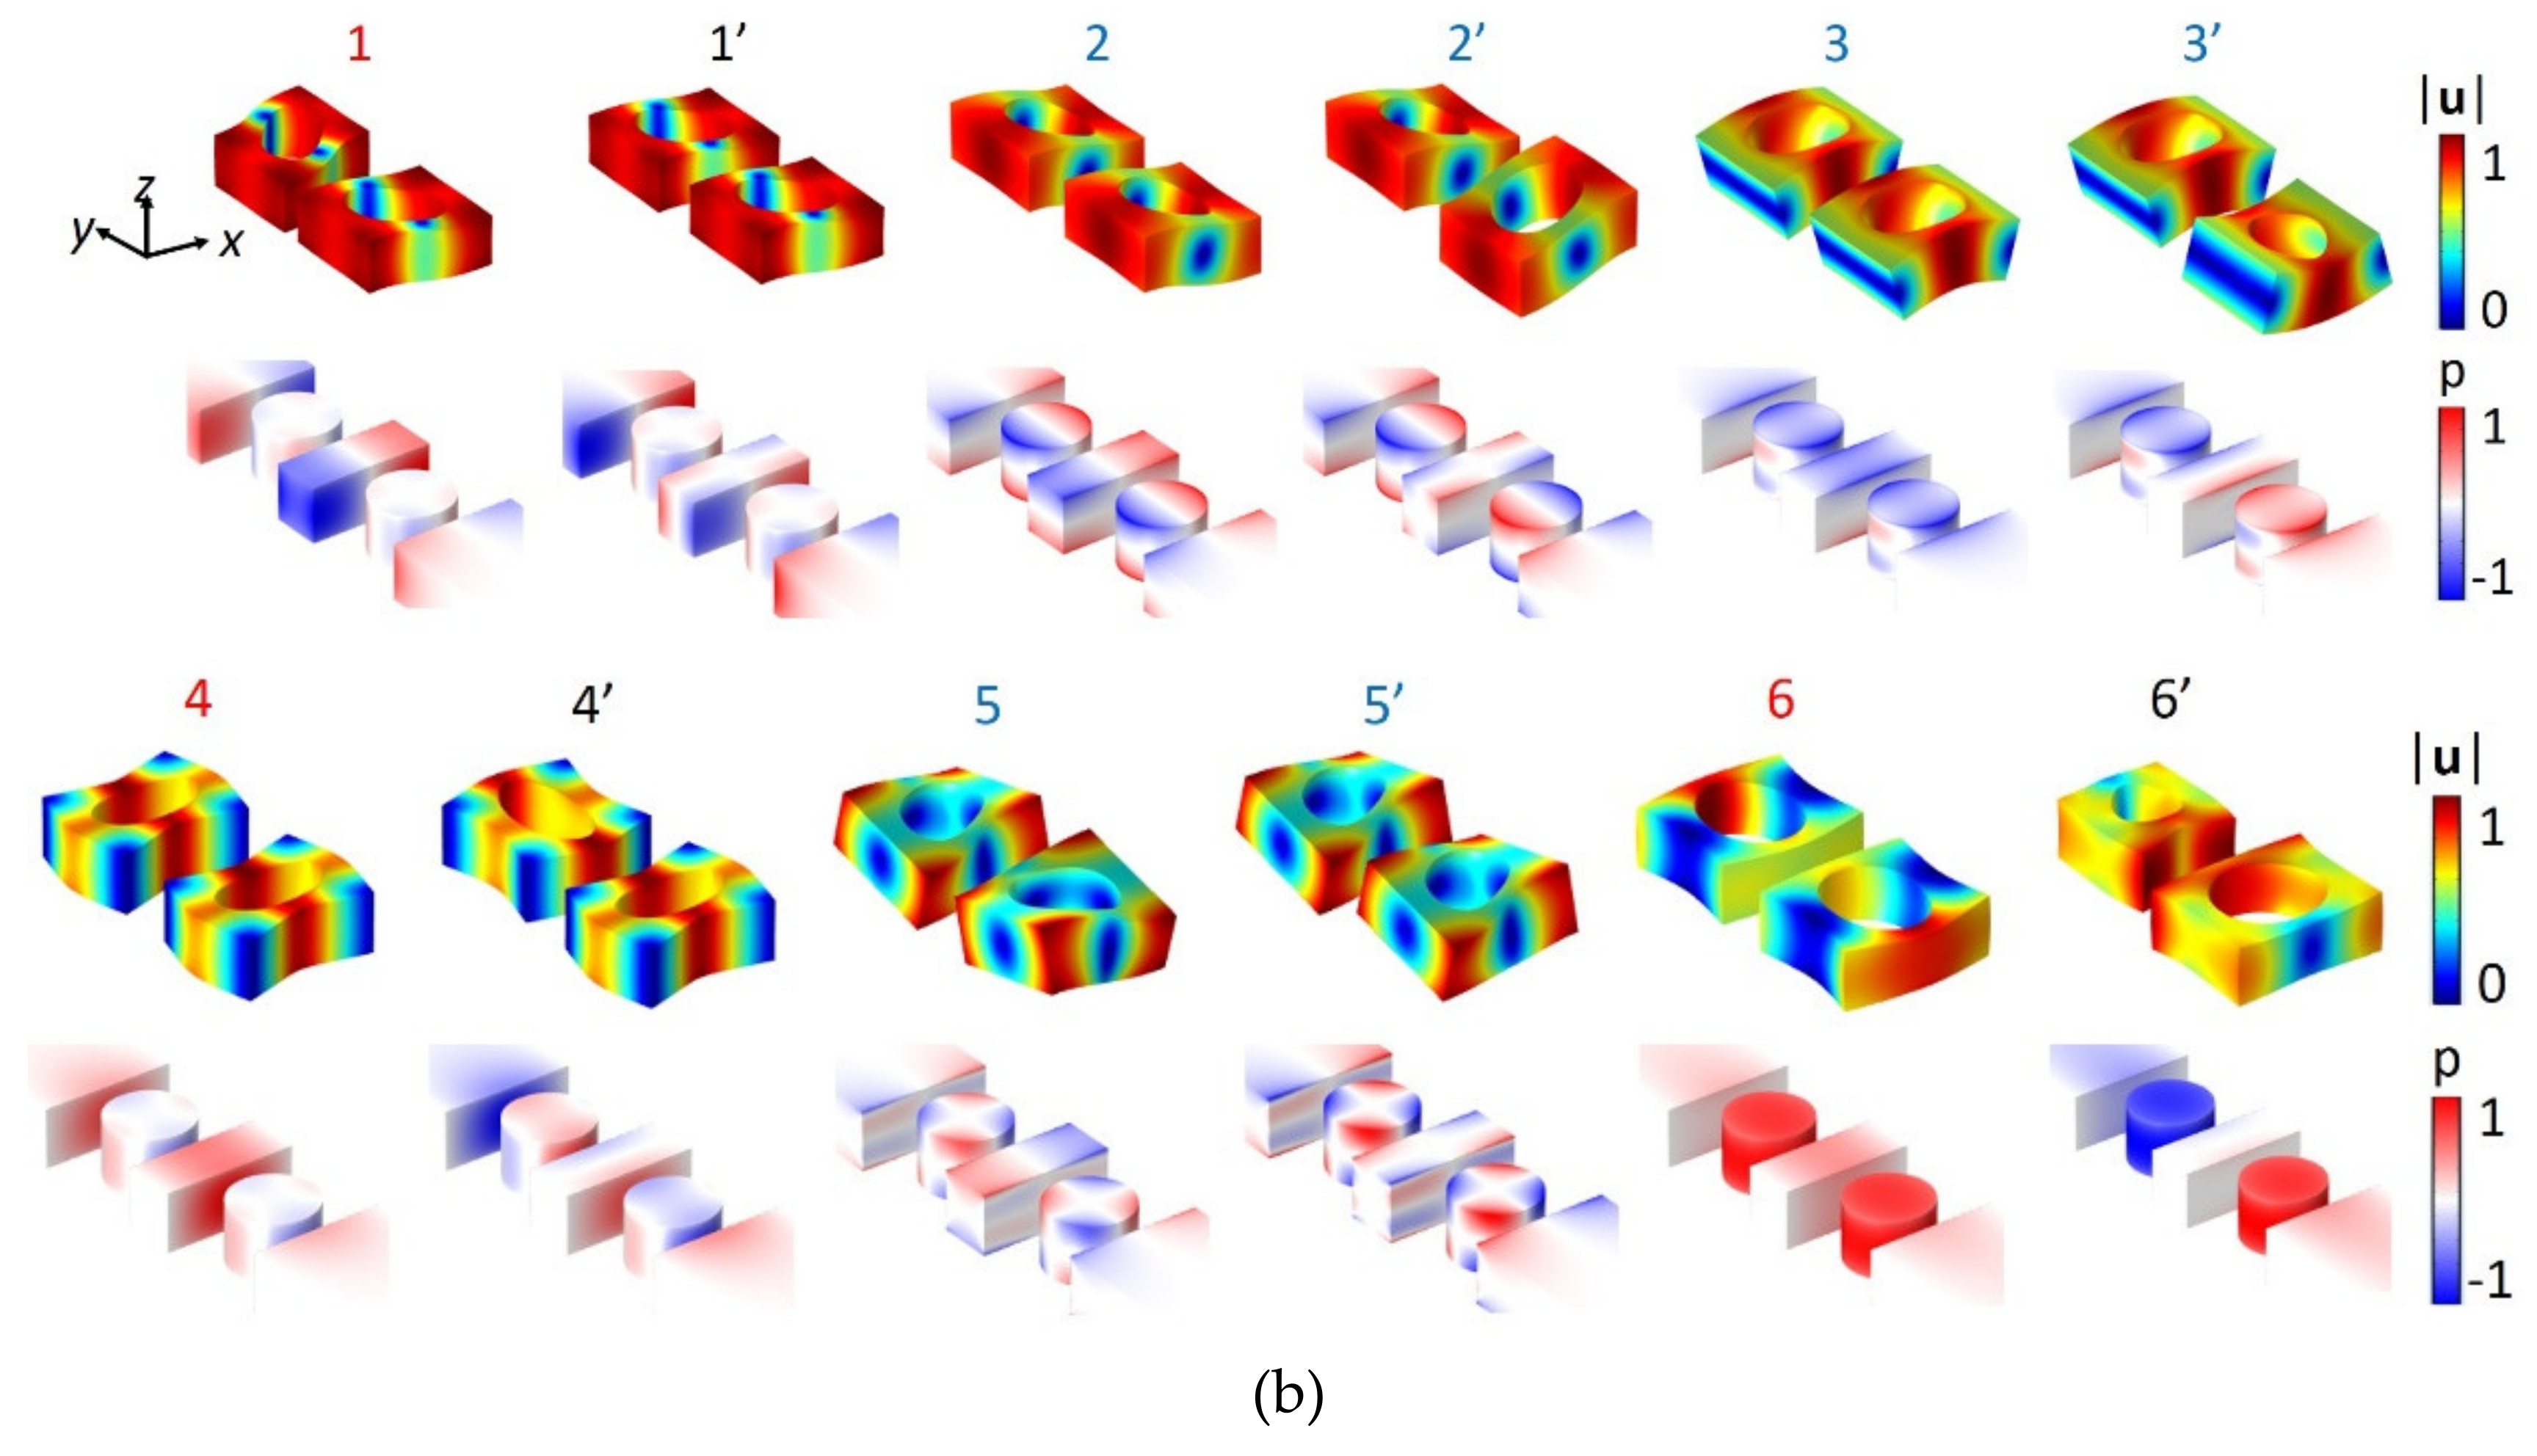
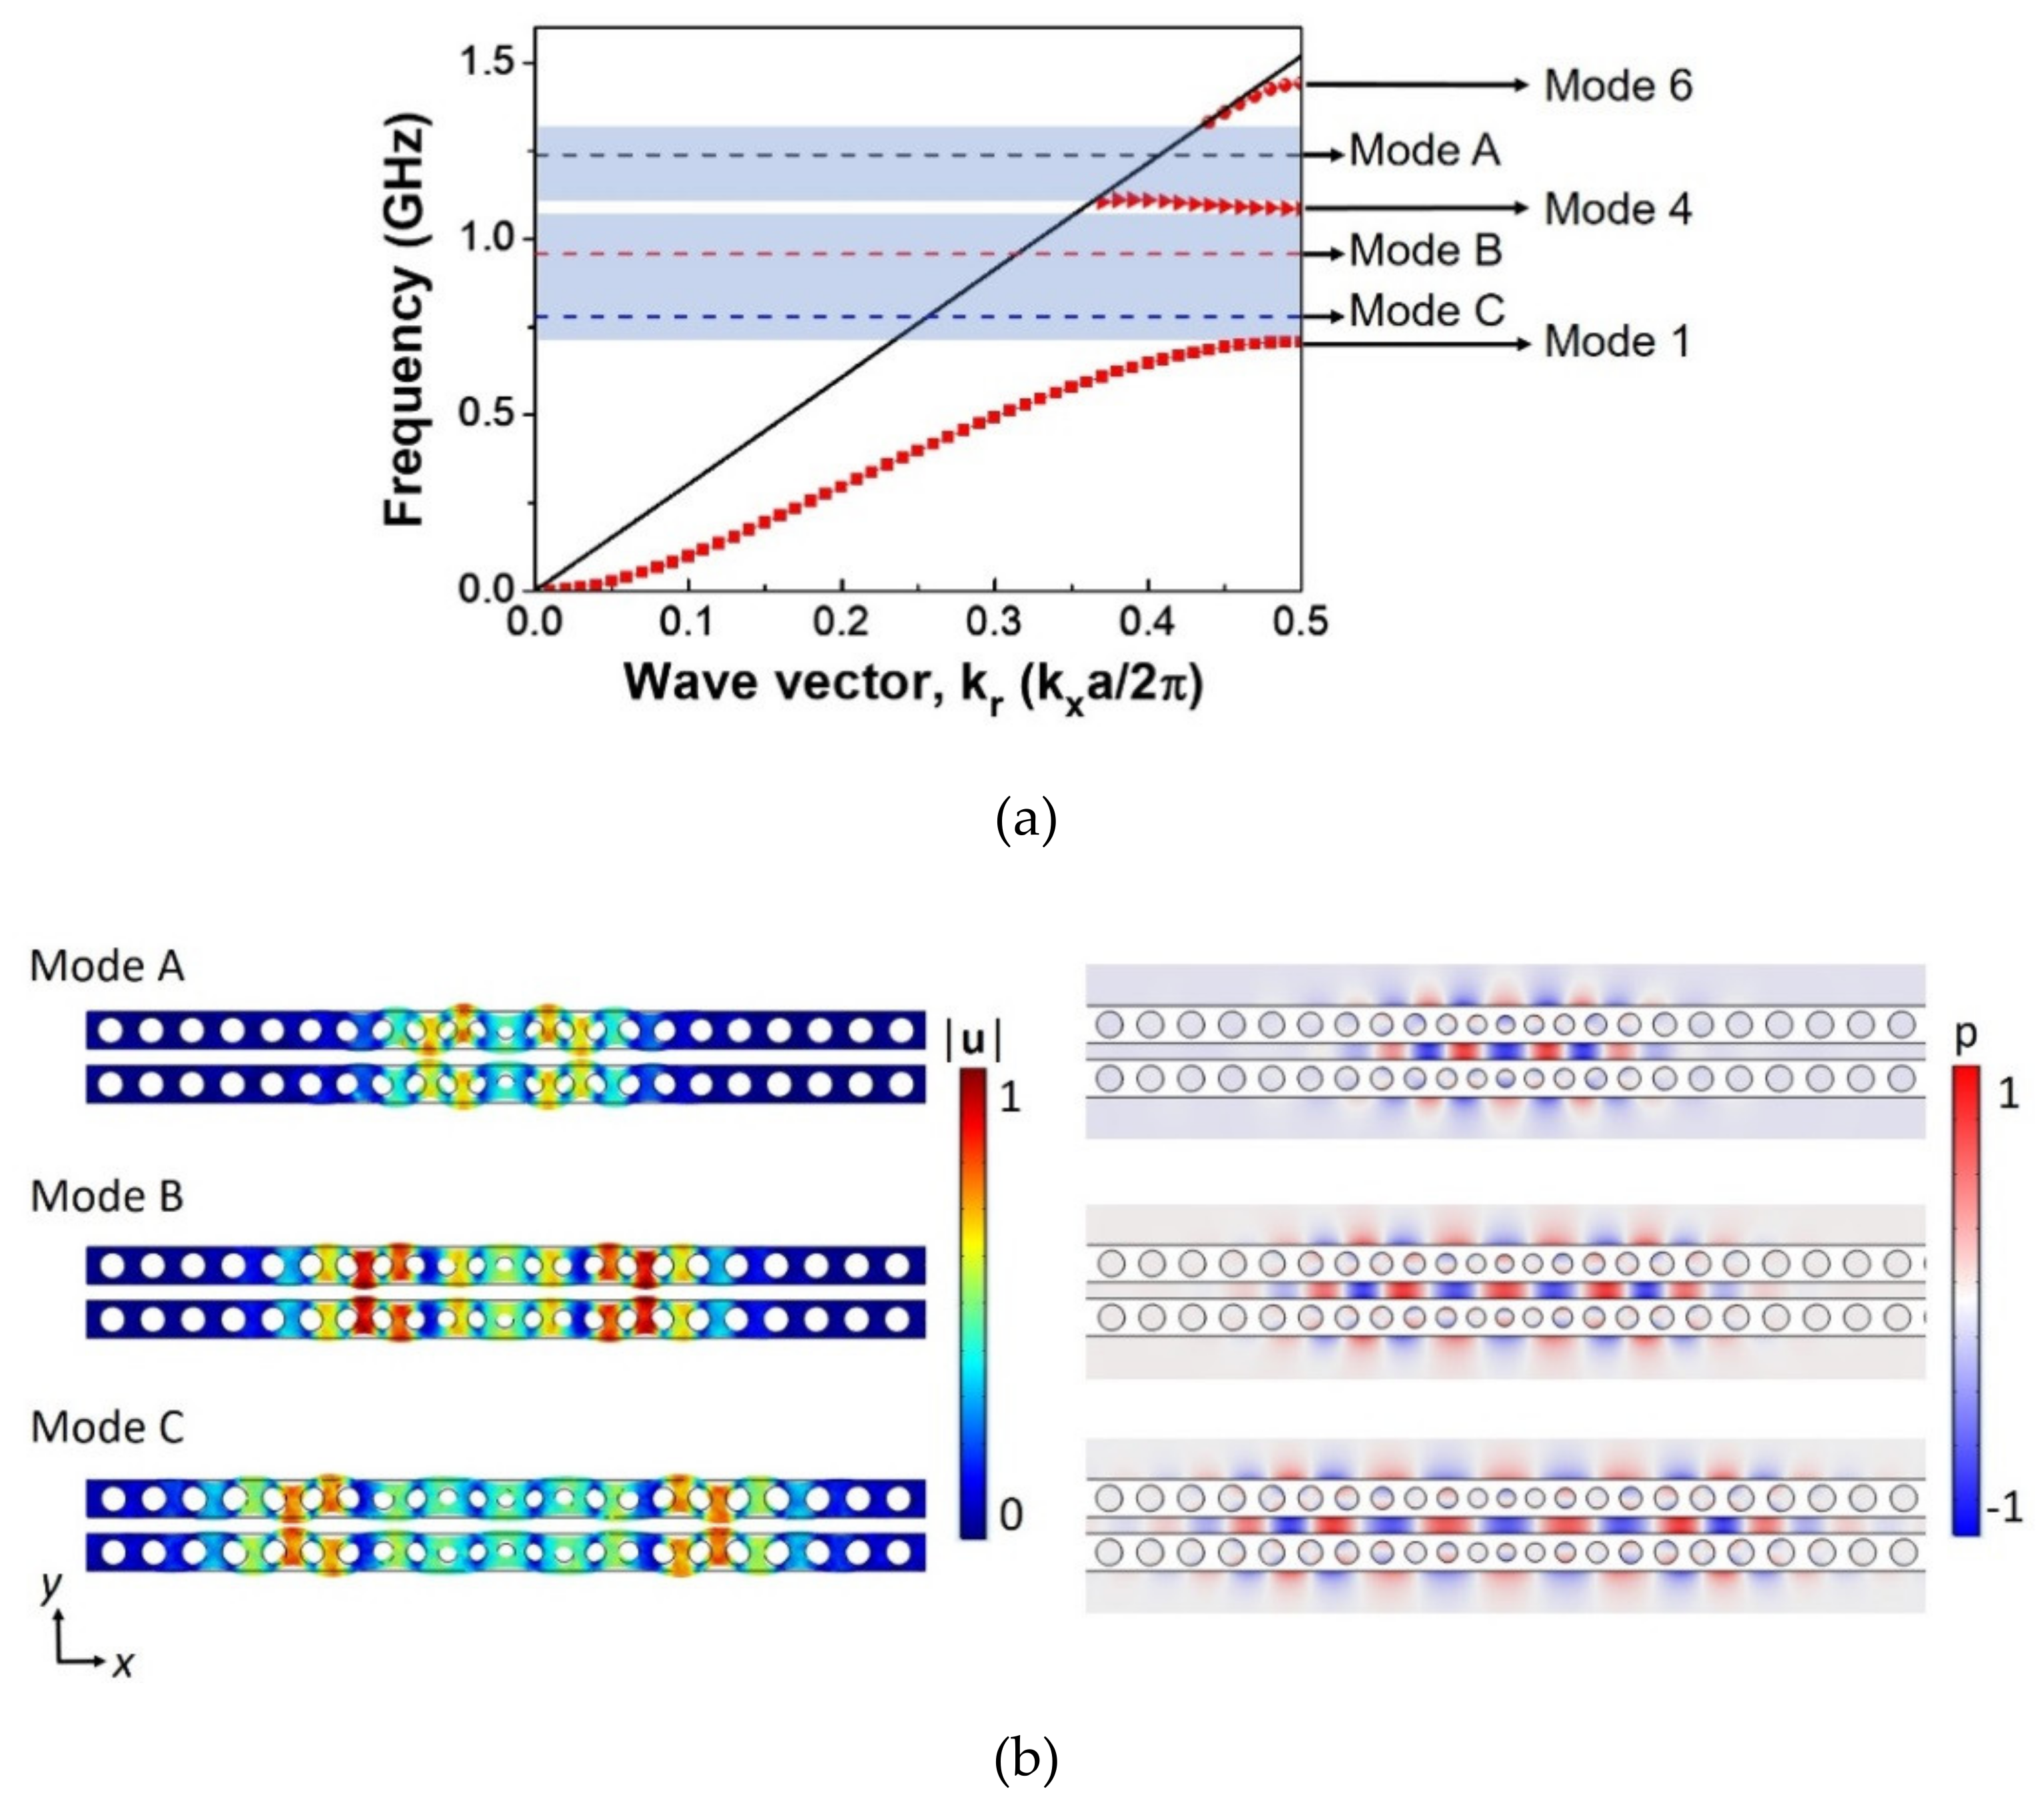
3.2.1. Perfect Modes of Phononic Crystal

From the sound analysis of the perfect crystal dual nanobeam immersed in water, twelve acoustic dispersion curves were found, as shown in Figure 7a. The corresponding displacement and sound pressure fields for these modes are depicted in Figure 7b. The deformation patterns of the unit cell associated with these modes are also illustrated in Figure 7b. It is noted that the solid black line in Figure 7a denotes the sound line in the water. In light of the results of the optical part, it can be shown that when the mode distributions penetrated the water domain, their interaction with the water solution could be stronger. However, when sound waves propagated in a structure surrounded by water, acoustic energy may radiate freely into the water. Here, the crystal dual nanobeam was used to confine the sound pressure field in the slot and holes to sense changes in the liquid domain. Confining sound fields requires the frequency to be below the sound cone of water. Since the perfect crystal structure is composed of two identical beams separated by a gap, there exist similar vibration patterns in these two beams. The vibrations of the beams are either in-phase or out-of-phase, as illustrated by the deformation patterns shown in Figure 7b. Therefore, there were six pairs of modes among the twelve modes. In Figure 7a, the modes, in pairs, in the dispersion curves are labeled with the same band number; the in-phase modes are distinguished from the out-of-phase modes with a superscript prime (‘). The in-phase and out-of-phase motions of the dual nanobeams in the water will yield distinct displacement and pressure fields, but with very close eigen-frequencies.
Figure 7b shows the displacement and sound pressure fields in the crystal dual nanobeams and water, respectively. The modes can be classified into three types based on their displacement fields. The modes of the first type had a dominated displacement polarization in the z-direction, and this type of the mode can be divided into the bending and twisting forms. It is noted from the three-dimensional deformation figures that Modes 2, 2’, 3, 3’, 5, and 5’ belong to this type. Because of their polarization direction, they were less likely to be influenced by the deformation of the gap and holes, so the solid–fluid coupling and the resulting sound pressure field were relatively weaker. The polarizations of the second and third types were both on the x-y plane. The second type is called the dilatation mode, which is characterized by the volume dilatation (expansion or contraction) in both the gap and holes. Modes 1, 4, and 6 were seen to be the dilatation modes. The dilatation was primarily caused by the out-of-phase motions in the y-direction of the dual nanobeams. The opposite movement of the dual nanobeams creates a symmetric deformation pattern with the center line of the gap as the line of reflection symmetry, which consequently will result in a dilatation in the gap. The dilatation modes were more likely to produce a stronger coupling between the beam vibration and the sound pressure. As an example, Mode 1 showed a concentrated sound pressure field in the gap region, which was induced by the expansion and contraction of the gap due to the opposite movements of the two beams. In addition, for this mode, the opposite motion deformed the circular holes into oval cavities, which generated a quadrupole sound pressure pattern in both holes. On the other hand, the third-type mode lacked a significant volume change in the gap, which is primarily attributed to the same y-directional movement of the dual nanobeams. This type of motion causes a shear/bend pattern of the gap; the volume change in the gap due to this type of deformation appears to be trivial. The remaining modes 1’, 4’, and 6’ fell into this category. Due to the fact that the dilatation modes are more likely to cause the volume changes in the gap and holes, they are expected to enhance the solid–fluid coupling, and thus, yields a better sensing performance. Therefore, the attention of acoustic sensing is focused on the dilatation modes associated with the dispersion curves 1, 4, and 6.

3.2.2. Defect Modes of Phononic Crystal (with N = 0.04)

The identical slot dual nanobeam with a gradient cavity used for optical sensing was employed for acoustic sensing. The previous photonic analysis has shown that an extended mode can be tuned into a more concentrated mode by increasing the cavity gradient. The current phononic analysis shows that the incorporation of a gradient cavity is even more critical for producing localized defect modes. In this study, no defect modes could be excited in case that nanobeams lack a gradient cavity. Hereafter, only crystal nanobeams with a large cavity gradient (N = 0.04) are considered.
The band diagram of perfect crystal dual nanobeams with dispersion curves associated with dilatation modes 1, 4, and 6 are drawn in Figure 8a. There were two acoustic frequency gaps for the dilatation modes, whose frequencies ranged from 0.709 to 1.087 GHz and from 1.105 to 1.331 GHz, respectively. For the sensor with gradient defect N = 0.04, one defect mode in the upper-frequency gap and two defect modes in the lower frequency gap were found. The displacement and sound pressure fields of these three defect modes in the gradient cavity area are shown in Figure 8b. It is seen that the displacements of the dual nanobeams were reflection-symmetric with respect to the centerline of the slot, which results in the width variation of the slot. The dilatation pressed the liquid in the slot and holes and subsequently induced a high sound pressure field in the cavity. Accordingly, these confined cavity modes can be used to sense the change in the acoustic properties of the glucose solutions. Moreover, it is noted from modal patterns shown in Figure 8b that Mode C was more dispersive than Modes A and B, which suggests that Mode C had a larger wavelength, that is, a lower resonance frequency than Modes A and B.

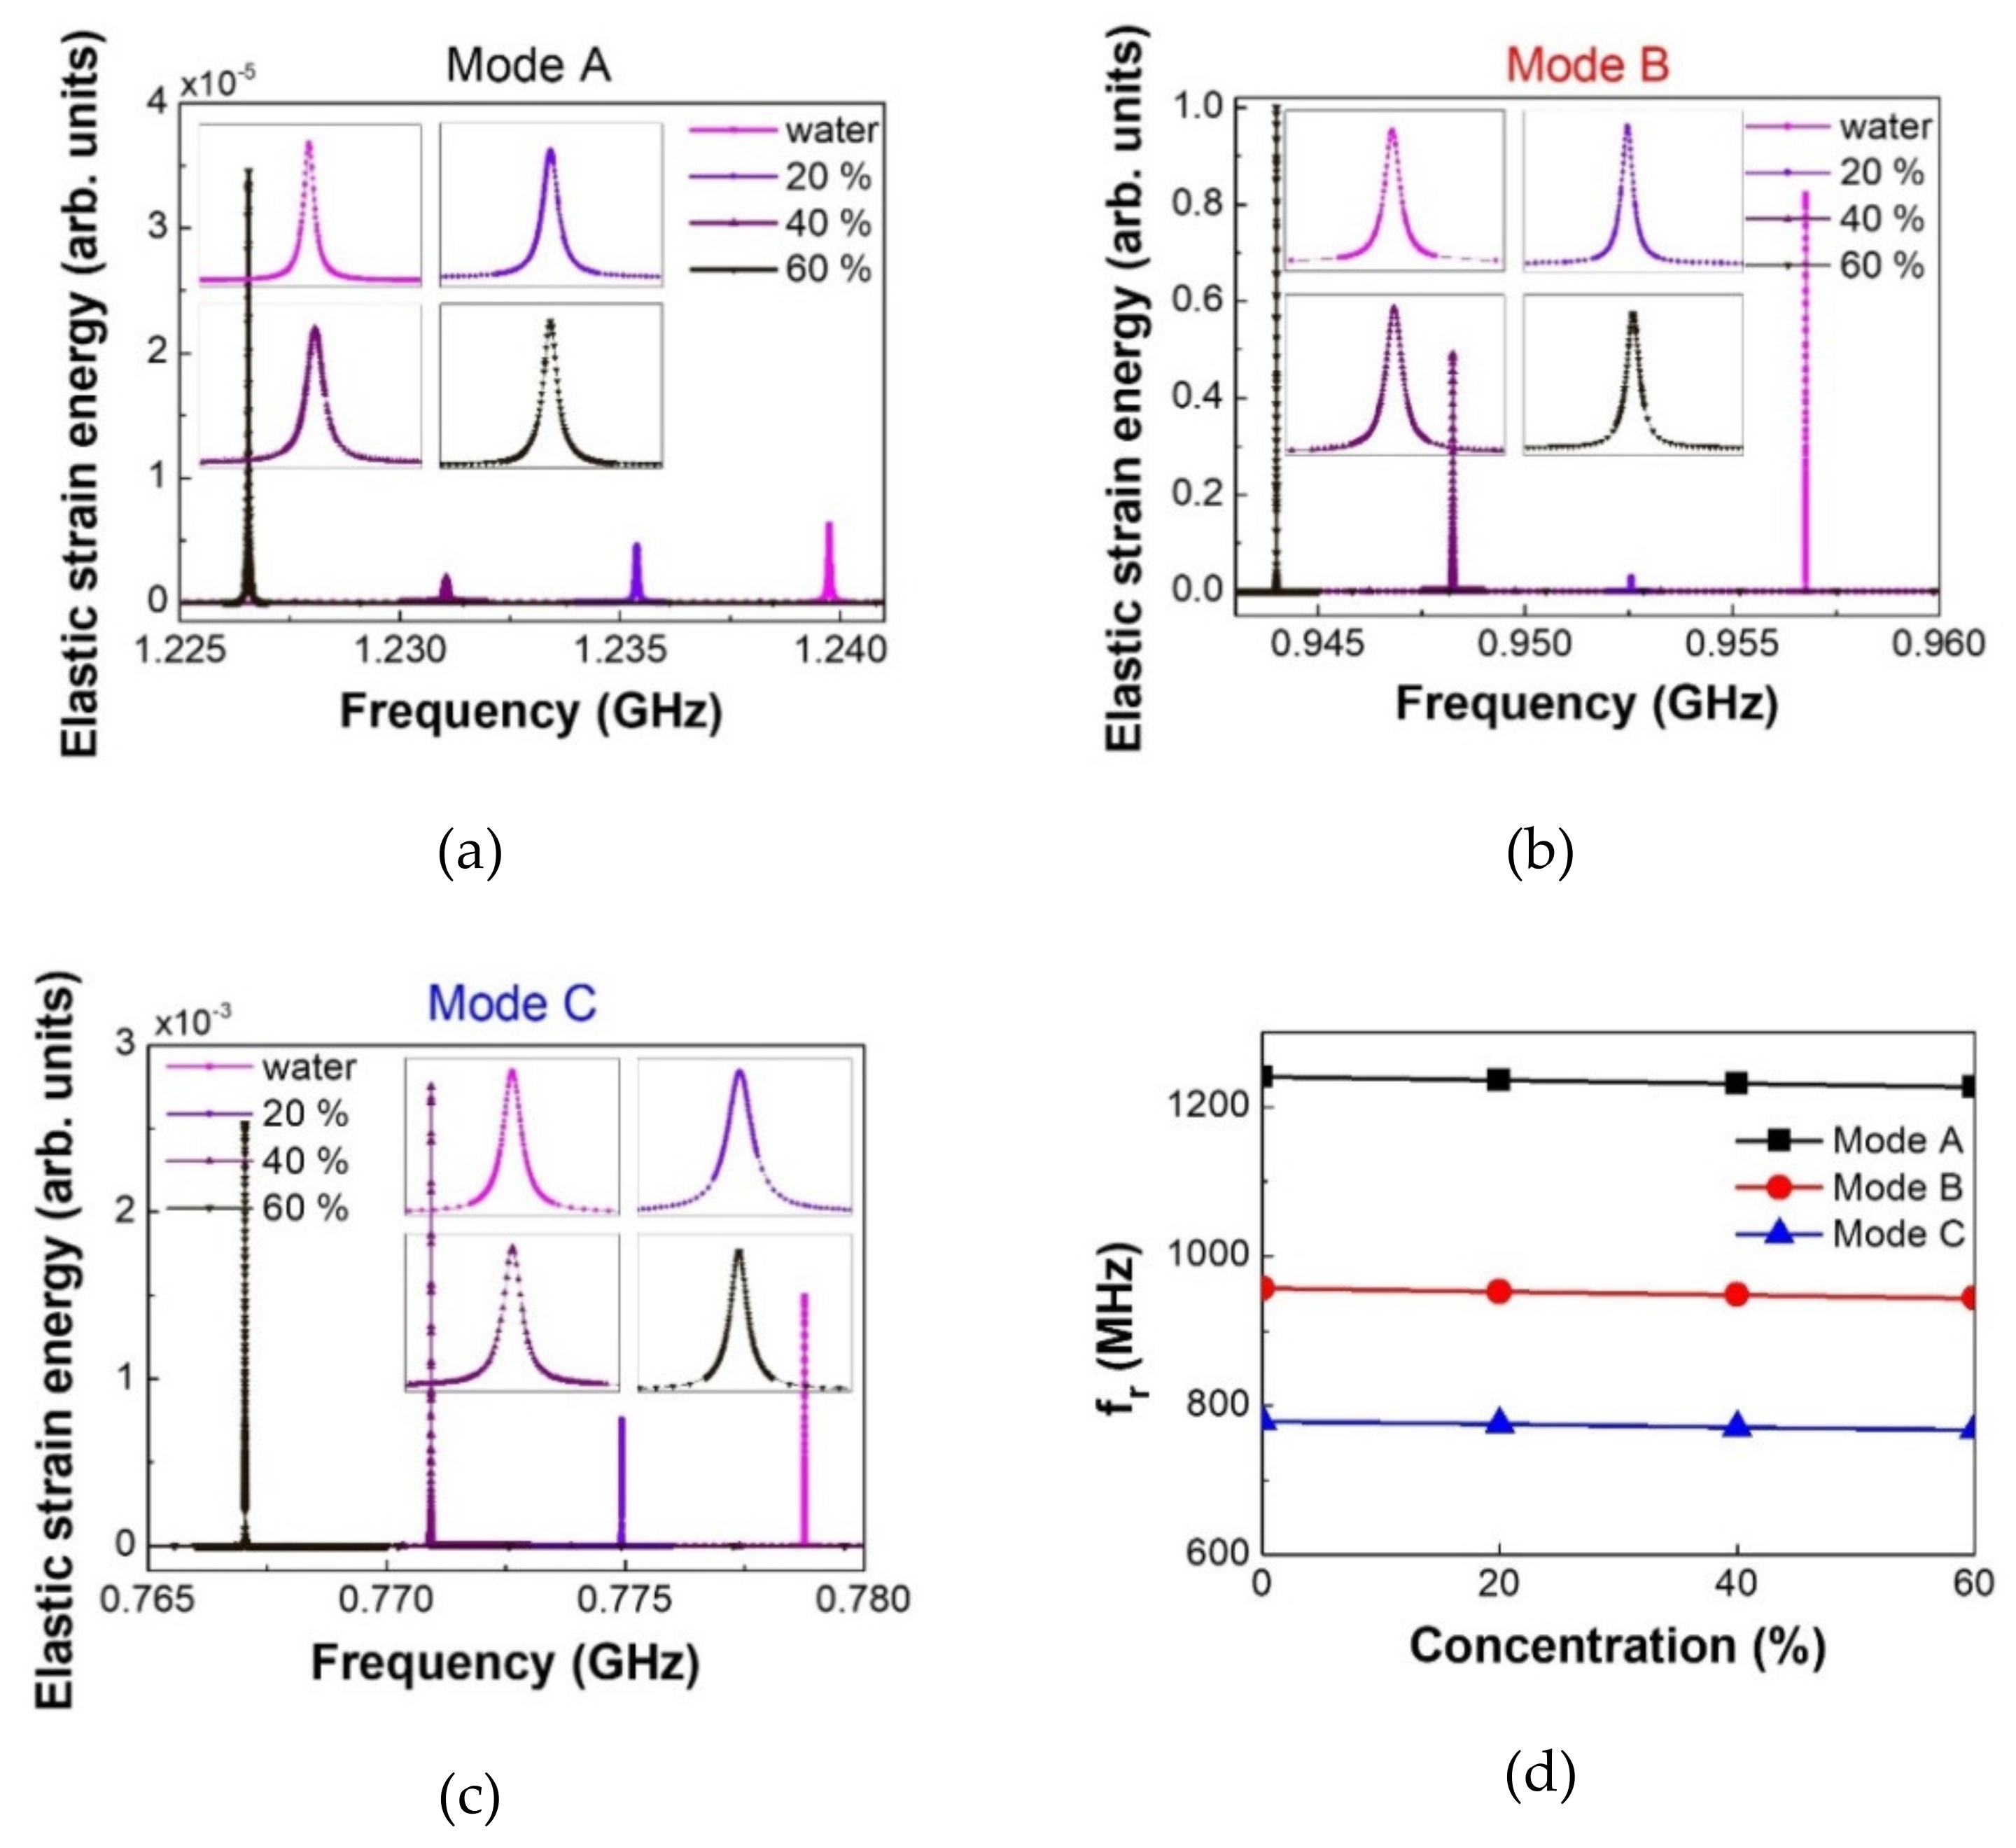
3.2.3. Sensing Performance for Phononic Device

To analyze the acoustic sensing performance of the nanobeam with a gradient cavity (with N = 0.04) using the resonant cavity, an external excitation method was applied to obtain the acoustic cavity mode spectra for the 20%, 40%, and 60% glucose solutions. The calculated results of the resonance spectra of the three acoustic cavity modes are shown in Figure 9a–c. It is found for all these three modes that a system involving a higher-concentration solution had a lower system resonant frequency. As the glucose concentration increased, so did the density of the surrounding fluid. In this situation, the overall system was less likely to be pushed around to produce oscillations, so the resonance frequency of the system reduced. It is observed from Figure 9a–c that all the resonance spectra had very narrow peaks and small FWHMs, especially in Modes B and C, which yielded very large values of quality factor. This apparently unrealistic result is largely thanks to the idealized numerical simulation adopted in the current study, without considering material losses, viscous damping, etc. The resonance frequencies of these three modes are plotted against various solution concentrations in Figure 9d. It is noted that their relationship was nearly linear for concentrations up to 60%, and the acoustic resonance frequency offset reached about 13 MHz.
Table 3 lists the acoustic sensing evaluation parameters when the liquid was changed from water to a 60% glucose solution. It is noted that the sensitivity of Mode A was slightly higher than Modes B and C. Meanwhile, Mode B had the highest value of quality factor, more than tenfold that of the other two modes. Consequently, Mode B possessed a much better value of figure of merit than Modes A and C. Figure 8b shows that Mode A had the best concentrated field. Nonetheless, it can be seen from the strain energy intensity spectrum in Figure 9b that Mode B had the highest energy intensity. This is because the displacement of Mode B can induce a stronger solid–fluid coupling, which results in higher quality factor and figure of merit. As a final remark, it is worthwhile to repeatedly mention that the values of quality factor and figure of merit listed in Table 3 were the consequence of the “highly” idealized analysis. This study neglects many factors that could lead to energy losses. The readers should treat the current numerical results with caution when the proposed design is to be realized into a sensor.

4. Conclusions

A dual photonic-phononic crystal slot nanobeam incorporated with a gradient cavity was proposed for liquid sensing in this study. The device was able to confine both optical and acoustic waves with mode bandgaps to enhance the interactions between light/sound and analyte solution. The introduction of the gradient cavity can further confine energy and reduce energy loss by avoiding the abrupt changes in lattices. The calculated results for photonic devices showed that the high-frequency defect modes had more optical energy concentrated in the central part of the nanobeam. Meanwhile, the optical energy of low-frequency defect modes spread to both ends but did not leak to the surrounding liquid due to the existence of mirrors and gradient cavity. The effect of the cavity gradient on the optical sensing performance for each defect mode was thoroughly examined. It is concluded that the gradient cavity design is more beneficial to low-frequency optical modes. The low-frequency defect modes tend to have a more dispersive pattern. A dispersive mode can be tuned into a localized mode by increasing the degree of cavity gradient, and the energy leakage can thus be reduced. Therefore, low-frequency optical modes can have more extensive interaction between light and analyte solution.
The integration of the gradient cavity also makes it feasible for the nanobeam to be used for acoustic sensing. The acoustic defect modes can be excited when the gradient cavity is present. The phononic analysis revealed that the acoustic dilatation modes, associated with the volume changes in the slot and holes, are more likely to produce a stronger coupling between the nanobeam vibration and sound pressure, and thus, yields a high acoustic sensing performance. The current photonic–phononic crystal sensors with gradient cavity have a noteworthy sensing performance, which is attributed to the strong interaction between light/sound and analyte solution. The dual optical/acoustic sensing mechanism provides opportunities for various applications of photonic–phononic crystals in sensing and detection.

Author Contributions

N.-N.H., Y.-C.C., J.-C.H., and T.-R.L. initiated the work. Y.-C.C., H.-T.C., Y.-F.L., C.-T.K., Y.-W.C., and C.-Y.C. performed the numerical simulation and modeling supervised by N.-N.H., J.-C.H., and T.-R.L. The manuscript was written by N.-N.H., Y.-C.C., J.-C.H., and T.-R.L. The funding was acquired by T.-R.L. and J.-C.H. All authors have discussed the results and commented on the manuscript. All authors have read and agreed to the published version of the manuscript.

Funding

This work was supported by Minister of Science and Technology (MOST) in Taiwan under Contracts MOST 105-2221-E-019-049-MY3, MOST 108-2221-E-019-055-MY3, MOST 108-2221-E-019-057-MY3, and MOST 106-2628-E-224-001-MY3.

Conflicts of Interest

The authors declare no conflict of interest.

References

  1. Yablonovitch, E. Photonic crystals: Semiconductors of light. Sci. Am. 2001, 285, 47–55. [Google Scholar] [CrossRef] [PubMed]
  2. Cheng, P.-J.; Huang, Z.-T.; Li, J.-H.; Chou, B.-T.; Chou, Y.-H.; Lo, W.-C.; Chen, K.-P.; Lu, T.-C.; Lin, T.-R. High-performance plasmonic nanolasers with a nanotrench defect cavity for sensing applications. ACS Photonics 2018, 5, 2638–2644. [Google Scholar] [CrossRef]
  3. Song, Y.; Bai, J.; Zhang, R.; Wu, E.; Wang, J.; Li, S.; Ning, B.; Wang, M.; Gao, Z.; Peng, Y. LSPR-enhanced photonic crystal allows ultrasensitive and label-free detection of hazardous chemicals. Sens. Actuators B 2020, 310, 127671. [Google Scholar] [CrossRef]
  4. Li, T.; Gao, D.; Zhang, D.; Cassan, E. High-Q and high-sensitivity one-dimensional photonic crystal slot nanobeam cavity sensors. IEEE Photonics Technol. Lett. 2016, 28, 689–692. [Google Scholar] [CrossRef]
  5. Watanabe, T.; Saijo, Y.; Hasegawa, Y.; Watanabe, K.; Nishijima, Y.; Baba, T. Ion-sensitive photonic-crystal nanolaser sensors. Opt. Express 2017, 25, 24469–24479. [Google Scholar] [CrossRef] [PubMed]
  6. Rodriguez, G.A.; Markov, P.; Cartwright, A.P.; Choudhury, M.H.; Afzal, F.O.; Cao, T.; Halimi, S.I.; Retterer, S.T.; Kravchenko, I.I.; Weiss, S.M. Photonic crystal nanobeam biosensors based on porous silicon. Opt. Express 2019, 27, 9536–9549. [Google Scholar] [CrossRef] [PubMed]
  7. Lucklum, R.; Ke, M.; Zubtsov, M. Two-dimensional phononic crystal sensor based on a cavity mode. Sens. Actuators B 2012, 171–172, 271–277. [Google Scholar] [CrossRef]
  8. Oseev, A.; Mukhin, N.; Lucklum, R.; Zubtsov, M.; Schmidt, M.-P.; Steinmann, U.; Fomin, A.; Kozyrev, A.; Hirsch, S. Study of liquid resonances in solid-liquid composite periodic structures (phononic crystals)—Theoretical investigations and practical application for in-line analysis of conventional petroleum products. Sens. Actuators B 2018, 257, 469–477. [Google Scholar] [CrossRef]
  9. Amoudache, S.; Pennec, Y.; Rouhani, B.D.; Khater, A.; Lucklum, R.; Tigrine, R. Simultaneous sensing of light and sound velocities of fluids in a two-dimensional phoXonic crystal with defects. J. Appl. Phys. 2014, 115, 134503. [Google Scholar] [CrossRef]
  10. Amoudache, S.; Moiseyenko, R.; Pennec, Y.; Rouhani, B.D.; Khater, A.; Lucklum, R.; Tigrine, R. Optical and acoustic sensing using Fano-like resonances in dual phononic and photonic crystal plate. J. Appl. Phys. 2016, 119, 114502. [Google Scholar] [CrossRef] [Green Version]
  11. Ma, T.-X.; Wang, Y.-S.; Zhang, C.; Su, X.-X. Theoretical research on a two-dimensional phoxonic crystal liquid sensor by utilizing surface optical and acoustic waves. Sens. Actuator A Phys. 2016, 242, 123–131. [Google Scholar] [CrossRef]
  12. Wang, B.; Dündar, M.A.; Nötzel, R.; Karouta, F.; He, S.; van der Heijden, R.W. Photonic crystal slot nanobeam slow light waveguides for refractive index sensing. Appl. Phys. Lett. 2010, 97, 151105. [Google Scholar] [CrossRef] [Green Version]
  13. Zain, A.R.M.; Johnson, N.P.; Sorel, M.; De la Rue, R.M. Ultra high quality factor one dimensional photonic crystal/photonic wire micro-cavities in silicon-on-insulator (SOI). Opt. Express 2008, 16, 12084–12089. [Google Scholar] [CrossRef] [PubMed]
  14. Lin, T.-R.; Lin, C.-H.; Hsu, J.-C. Strong optomechanical interaction in hybrid plasmonic-photonic crystal nanocavities with surface acoustic waves. Sci. Rep. 2015, 5, 13782. [Google Scholar] [CrossRef] [PubMed] [Green Version]
  15. COMSOL Multiphysics®® Modeling Software. Available online: https://www.comsol.com/ (accessed on 13 April 2020).
  16. Almeida, V.R.; Xu, Q.; Barios, C.A.; Lipson, M. Guiding and confining light in void nanostructure. Opt. Lett. 2004, 29, 1209–1211. [Google Scholar] [CrossRef] [PubMed]
  17. Zhang, Y.; Zhao, Y.; Zhou, T.; Wu, Q. Applications and developments of on-chip biochemical sensors based on optofluidic photonic crystal cavities. Lab Chip 2018, 18, 57–74. [Google Scholar] [CrossRef] [PubMed]
  18. Adachi, S. Optical dispersion relation for GaP, GaAs, GaSb, InP, InAs, InSb, AlxGa1−xAs and In1−xGaxAsyP1−y. J. Appl. Phys. 1989, 66, 6030–6040. [Google Scholar] [CrossRef]
  19. Adachi, S. Physical Properties of III-V Semiconductor Compounds; Wiley: New York, NY, USA, 1992; pp. 11–23. [Google Scholar]
  20. Rosenbruch, K.J.; Emmerich, A. The refractometric determination of aqueous sugar solutions. Sugar Technol. Rev. 1988, 14, 137–205. [Google Scholar]
  21. Saggin, R.; Coupland, J.N. Concentration measurement by acoustic reflectance. J. Food Sci. 2001, 66, 681–685. [Google Scholar] [CrossRef]
  22. Joannopoulos, J.D.; Johnson, S.G.; Winn, J.N.; Meade, R.D. Photonic Crystal, 2nd ed.; Princeton University Press: New Jersey, NJ, USA, 2008; pp. 9–10. [Google Scholar]
  23. Royer, D.; Dieulesaint, E. Elastic Waves in Solids I: Free and Guided Propagation, 1st ed.; Springer: New York, NY, USA, 2000; p. 128. [Google Scholar]
  24. Monkola, S. Numerical Simulation of Fluid-Structure Interaction between Acoustic and Elastic Waves. Ph.D. Dissertation, University of Jyvaskyla, Jyvaskyla, Finland, 2011. [Google Scholar]
  25. Lin, T.-R.; Chang, S.-W.; Chuang, S.L.; Zhang, Z.; Schuck, P.J. Coating effect on optical resonance of plasmonic nanobowtie antenna. Appl. Phys. Lett. 2010, 97, 063106. [Google Scholar] [CrossRef]
Figure 1. Geometry of the crystal slot nanobeam with a gradient cavity: (a) Schematic three-dimensional view of the device; (b) Top view of the device and the enlarged area of gradient cavity; (c) The top and cross-section views of the unit cell (marked by two dashed lines) of the corresponding perfect structure.
Crystals 10 00421 g001
Figure 2. (a) Band diagram of the perfect crystal structure immersed in distilled water; (b) The electric-field intensity (|Ey|) profiles of the four band-edge modes.
Crystals 10 00421 g002
Figure 3. (a) Frequencies of the defect Modes 1–9 for the nanobeam (with N = 0.04) immersed in the pure water are indicated on the band diagram of the perfect crystal; (b) Electric strength profiles of Modes 1–6 that were inside the band gap; (c) Electric strength profiles of Modes 7–9 that were below the band gap.3.1.3. Sensing Performance for Photonic Device (with N = 0.04)
Crystals 10 00421 g003
Figure 4. Resonance spectra, resonance wavelengths, and excited defect crystal modes of the nanobeam sensor device with N = 0.04: (a) Resonance spectrum of the nanobeam immersed in distilled water; (b) Electric field distributions of the excited defect crystal modes of the nanobeam immersed in distilled water; (c) Resonance spectra and wavelength shifts of the nanobeam immersed in the glucose solutions with various concentrations for various modes; (d) The resonance wavelengths of various modes are plotted against concentrations of glucose solutions.
Crystals 10 00421 g004
Figure 5. The electric-field intensity (|Ey|) patterns of the 60% glucose solution for various degrees of cavity gradients (N = 0, 0.01, 0.02, 0.03, 0.04): (a) Profiles of high-frequency Mode 2, (b) Profiles of low-frequency Mode 8.
Crystals 10 00421 g005
Figure 6. The evaluation parameters Q, S, and FOM are plotted against the hole tuning parameter N in (a), (b), and (c), separately for the 60% glucose solution.
Crystals 10 00421 g006
Figure 7. (a) Acoustic dispersion curves of the perfect crystal dual beams immersed in water; (b) The displacement and sound pressure fields in the unit cell, respectively.
Crystals 10 00421 g007aCrystals 10 00421 g007b
Figure 8. (a) Acoustic dispersion curves associated with dilatation modes (1, 4, and 6) of perfect crystal nanobeams immersed in pure water are drawn. Frequencies of the defect modes (A, B, and C) with N = 0.04 are indicated in the band diagram; (b) The displacement and sound pressure fields of these three defect modes are shown in the gradient cavity area of the dual nanobeam device.
Crystals 10 00421 g008
Figure 9. The acoustic resonance frequency spectra corresponding to various concentrations of glucose solutions for Modes A, B, and C are plotted in (ac), separately; (d) The resonance frequencies of various modes are plotted against the concentrations of glucose solutions.
Crystals 10 00421 g009
Table 1. The wavelength shifts and sensitivity values of perfect crystal modes for the 60% glucose solution.
Mode Δ λ 60 % / λ r S 60 % ( nm / RIU )
A5.94%730
B5.58%721
C3.20%479
D3.59%563
Table 2. The resonance wavelengths, full width at half maximum (FWHM) and evaluation parameters for various excited defect modes corresponding to the 60% glucose solution and N = 0.04.
Mode λ 0 % ( nm ) λ 60 % ( nm ) FWHM(nm) Δ λ 60 % ( nm ) Q 60 % S 60 % ( nm / RIU ) F O M 60 % ( 1 / RIU )
21472.11504.34.6432.232429664
41572.01614.64.6342.634939184
71640.91692.17.8751.221547060
81701.81760.14.3058.3409535124
91746.51806.37.7159.823454971
Table 3. Acoustic evaluation parameters for various excited defect modes corresponding to the 60% glucose solution.
Mode Frequency f r , 60 % ( GHz ) S 60 % ( kHz / ms 1 ) Q 60 % F O M 60 % ( m / s ) 1
A1.24045.3 2.31 × 1 0 4 1.98
B0.956744.0 8.08 × 1 0 6 411
C0.778740.3 3.32 × 1 0 5 22.6

