
Abstract
A research concept that was first presented on a poster at a Comprehensive Nuclear-Test-Ban Treaty (CTBT) conference in 2009 has resulted in a fully-fledged operational software product named NET-VISA (Network Processing Vertically Integrated Seismic Analysis), which performs the Network Processing step of the automatic processing at the International Data Centre (IDC). It has become one of the tools of the waveform analysts to review and improve the IDC standard automatic third Standard Events List (SEL3) bulletin and produce the Reviewed Events Bulletin (REB), the only global seismo-acoustic bulletin. The basic scientific concepts imbedded into NET-VISA are briefly summarized in this paper but the emphasis is on the process of adopting, developing, adapting, testing, and operationalizing the initial prototype. Extensive off-line testing has shown that one of the expected benefits of NET-VISA was the significant reduction in missed events rate compared to the current Network Processing software, Global Association (GA). NET-VISA also finds some events previously missed by manual review. Starting in July 2017, and as of January 2020, NET-VISA generates an automatic bulletin, called VSEL3, in parallel to SEL3, which is also used by analysts since January 2018. Tracing the origin of the REB events has confirmed the significant reduction in missed events when complementary VSEL3 events are reviewed in addition to the SEL3 events. If sufficient confidence is established, NET-VISA has the potential to replace GA in producing the standard automatic SEL3 bulletin.
1 Introduction
The Comprehensive Nuclear-Test-Ban Treaty (CTBT) is a multilateral international treaty where the states that sign the treaty, and are referred to as State Signatories in the rest of this paper, agree to prohibit any nuclear explosions in the atmosphere, underground and in-water. We will refer to the CTBT as “the Treaty” in later sections of this paper. A particularity is that Article IV of the Treaty (CTBT 1996) calls for an International Monitoring System (IMS) for the purpose of verification. The protocol to the Treaty includes in its Annex I the list of stations from four different technologies that constitute the sensor instrumentation part of the IMS. The Preparatory Commission to the Comprehensive Nuclear-Test-Ban Treaty (CTBTO) was established in Vienna, Austria, in 1997 to achieve among other objectives the international verification of the Treaty, including the establishment and completion of the IMS. As of August 2019, 91.6% of the stations of the IMS network are installed.
The data from the IMS sensors is acquired, processed, reviewed, and archived by the International Data Centre (IDC) which in turn provides standard products to the State Signatories. The Reviewed Event Bulletin (REB) of seismo-acoustic events is one of the key standard products provided to them. It is a global seismo-acoustic bulletin reviewed by a team of analysts, on the basis of an automatic bulletin. The REB contains a subset of the events that have been reviewed and saved by the analysts. The subset consists of the events that pass an event definition criterion ensuring that it has a sufficient number of defining components (detections time, slowness and azimuth at all stations detecting the event) to be of significance to the monitoring of the Treaty. This implies a location-dependent magnitude level of detectability (Ringdal and Kværna 1992). Monitoring at lower magnitude level, with a smaller number of detecting stations is currently not envisioned because the total number of events to be reviewed grows exponentially with a decrease in magnitude. All events analysed and saved by the analysts, including those too small to pass the event definition criterion threshold constitute the Late Event Bulletin (LEB) bulletin.
This paper examines the improvements brought to the automatic bulletin products by the new Network Processing Vertically Integrated Seismic Analysis (NET-VISA) algorithm and software. The specialized acronyms for the various lists of detections and events are defined in Table 1, which can be used as reference by the reader. Three automatic bulletins are produced by the IDC and their content made available to State Signatories. They are referred to as Standard Event List (SEL) and a number specifying the chronological order of their availability. The automatic bulletin reviewed by analysts is called the SEL3 bulletin. It is produced in three stages successively in time. The first stage is the production of the first SEL (SEL1) bulletin 1 h after real time. The SEL1 bulletin uses parametric arrival data from the primary seismic and hydro-acoustic networks. The arrivals are obtained by detection processing on the continuous waveforms received at the IDC using a standard Short Term Average over Long Term Average (STA/LTA) algorithm. Numerous features are extracted for detected arrivals, including refined slowness vector measurements based on standard frequency-wavenumber analysis. Based on the events produced in the SEL1 bulletin, data segments from auxiliary seismic stations are requested and detection processing adds to the primary seismic and hydro-acoustic sets of arrivals. Infrasound detection processing is done in parallel to the primary seismic and hydro-acoustic, using the Progressive Multi-Channel Cross-Correlation (PMCC) algorithm (Cansi 1995). PMCC detects seismic or acoustic signals impinging on an array with a high degree of coherency between the array elements, in this case microbarometers. The second SEL (SEL2) bulletin is produced using parametric data from all four waveform technology networks (Seismic, Infrasound, and Hydroacoustic, or SHI) and is available 4 h after real time. This processing structure is presented in graphical form on Fig. 1, which shows the various types of data flowing in and the different stages of processing for automatic and reviewed products of the IDC. The network processing stages are handled by a software called Global Association (GA) that was developed in the 1990s (Le Bras et al. 1994; Hanson et al. 2001) and has been running continuously with only minor modifications at the IDC since 2001, as the IMS network was expanding and nearing completion of its installation.

This diagram shows the processing flow of the waveform data as it is currently handled at the IDC. The data types are colour coded by technology: green for Primary seismic, white for Hydroacoustic, brown for Auxiliary seismic, and red for Infrasound. The main steps of the processing are shown by the vertical blue bars. They consist of the Station Processing step, the Network Processing, and the Interactive Review. The light red bubbles show the products of the three stages of Network Processing, the Standard Event Lists (SELs). The SEL1 is produced 1 h after real time, the SEL2 4 h after real time, and the SEL3 6 h after real time. The SEL3 is reviewed by the analysts in order to produce the Reviewed Event Bulletin (REB)
First pass analysis by human analysts consists of the following steps:
-
Review of the SEL3 bulletin. This includes, if needed:
-
Correcting or refining pick times;
-
Adding arrivals missed either at the stage of station processing or network processing;
-
Rejecting spurious events formed as an artefact of the network processing algorithm;
-
Disentangling cases where either:
-
The set of arrivals from a large event is split by the network processing part of the automatic system into subset forming several automatic events;
-
An automatically formed event includes arrivals which belong to multiple real events.
-
-
Adding events missed by the automatic processing. This is performed through the use of the scanner interactive tool which takes advantage of specific characteristics of IMS stations in detecting smaller magnitude events in areas that they are sensitive to (Coyne et al. 2009).
-
Opportunistic manual scanning is also performed during the course of the review when analysts encounter an un-associated arrival with a high signal-to-noise ratio, which in their judgment clearly belongs to a real event. It is referred to as opportunistic because it happens only in the course of the review of the SEL3 and no systematic manual scanning for additional missed events is currently performed after review of the SEL3 and automatic scanning.
-
The purpose of this paper is to briefly explain the method behind the NET-VISA software and to retrace the process that led to its use at the IDC. This process and history spans roughly 10 years from the outreach to the academic community in the domain of Machine Learning to the development, testing and operational evaluation of NET-VISA. The software is currently a component of the IDC system releasing standard products for State Signatories and will soon be released to authorized users of the State Signatories under an open source license.
2 Outreach to the Academic Community Through the CTBTO Science and Technology Conference Series
Beginning in 2006, the CTBTO has engaged in outreach activities with two initial symposia in June 2006 and June 2009, and then the series of Science and Technology conferences starting in 2011 and occurring every 2 years since then. At the time of writing of this paper, the 2019 edition is the latest in the series and the next one is scheduled for June 2021. Information about these conferences can be accessed on the CTBTO public web site (SnT 2019).
In March 2009, in preparation for the 2009 symposium, a workshop took place to understand the potential of Machine Learning methods to improve on the data processing at the IDC. One of the outcomes of the workshop was the initiation of a proof-of-concept project to tackle the Network Processing part of IDC data processing and this was envisioned in two stages. In a first stage, NET-VISA would be a one-to-one replacement to GA, using parametric detection data as input to produce the seismic bulletin (Russell et al. 2010). In a second stage, the waveforms themselves would be directly used as input to the Signal-based Vertically Integrated Seismic Monitoring (SIG-VISA) to produce the bulletin. The core of the algorithm was planned to be using a Bayesian approach in both cases. While at the time of writing of this paper the NET-VISA approach has been fully developed and is used operationally to complement the SEL3 bulletin produced by GA, SIG-VISA (Moore 2016; Moore et al. 2017) is at the stage of research and proof-of-concept, but seems promising. Another outcome of the workshop was the initiation of the virtual Data Exploitation Centre (vDEC) platform (Vaidya et al. 2009) which allows academic and other scientific or technical organizations to access CTBTO data for specific studies and algorithm development.
3 NET-VISA Method for Seismic Data
NET-VISA (Arora et al. 2013) uses a probabilistic model and the Bayesian method to find the best set of events explaining the parametric detection observations and thus produce a seismic bulletin from these observations. Bayesian methods have previously been used with considerable success in geophysics, for instance to improve on the seismic location problem (Myers et al. 2007, 2009).
The forward model at the heart of the method is essentially the same physical model that is used by GA as far as the propagation model is concerned, using the same seismic travel times and probability of observing phases at a given distance and for a given magnitude. The physical model for the propagation of seismic and acoustic waves consists of considering that a seismo-acoustic event source is a single point in time and space. The expected time of arrival at the stations for each seismic phase from that event is governed by the standard one-dimensional IASPEI 91 (Kennett and Engdahl 1991) model with the possibility of refining the regional travel times using correction surfaces specific to stations. Slowness is derived from the travel time curves and azimuth from the geodesic azimuth of the geodesic line between event and station. Slowness and azimuth may be corrected at individual stations based on statistics at the stations showing deviations from expectations based on the one-dimensional model for slowness and on the geodesic for azimuth (Bondár et al. 1999). The detection amplitude and period model for P arrivals uses the standard Veith–Clawson correction curve as a function of distance (Veith and Clawson 1972). The physical model in NET-VISA is more elaborate than the GA model in that it includes:
-
The seismicity background;
-
An elaborate probability of detection model;
-
An explicit probability that a detection is an arrival of a wave front originating from an actual event (noted Λ), or a false detection (noted ξ), which will not be associated to an event, as well as the probability that it is a coda phase (noted κ);
-
The phase-dependent expected arrival amplitude given the event magnitude.
The method used by GA is a comprehensive exploration of all possible combinations of detections at a given location on the Earth, after discretization of its surface into grid cells. The combinations form many hypothesized events including redundancies and overlaps. These redundancies and overlaps are resolved through optimization on seismological basis, but involve a large number of parameters, which are difficult and time consuming to tune. NET-VISA on the other hand tunes itself by learning the parameters of a probabilistic model from the LEB reviewed bulletin.
In this section, we provide an overview of the NET-VISA algorithm and probabilistic model. For a comprehensive explanation of the method and for further details please refer to Arora et al. (2013). NET-VISA differs from GA in its algorithmic approach to building events. Where GA explores all possible points on a global grid, NET-VISA starts from the detections and builds seed events based on all detections interpreted as P phases. This algorithmic step is called the ‘Birth Move’ and is the first of several steps in finding an optimal set of events explaining the observed detections, which include the ‘Improve-Arrival’, ‘Improve-Event’, and ‘Death Move’. ‘Improve-Arrival’ associates or re-associates arrivals to events. ‘Improve-Event’ finds a better location, depth, magnitude, and time within a limited distance (2° in latitude and longitude, 100 km in depth, 2 units of magnitude, and 5 s in time) from the original values of these parameters. The choice of the location, time and magnitude parameters is random within these intervals and the scores (see Sect. 3.3 for the definition of an event’s score) of 100 newly added random events are computed and the best one selected. NET-VISA iterates between ‘Improve-Arrival’ and ‘Improve-Event’ to optimize events. Finally, the ‘Death Move’ discards events with event scores less than one.
3.1 The Probabilistic Model
For a given seismic station and seismic phase, a distribution of the residual travel time, residual slowness and residual azimuth is derived from the statistics provided by the large number of events in the analyst-reviewed LEB bulletin. Examples of residual distribution statistics for time, slowness, and azimuth are shown on Fig. 2 along with the functional probability function derived from the statistics. In the case of time, slowness, and azimuth, the probability density function (PDF) takes the functional form of a Laplace distribution f(x) defined by its location b and scale μ:
where x is either time, slowness, or azimuth.

Examples of Laplace probability distribution functions for time, slowness, and azimuth residuals at a given station. In this case, the IASPEI91 travel time model is used to derive time and slowness for a given event location and origin time. Azimuth only depends on the station to event geometry
Given a hypothetical event at a given location and magnitude, the model includes the probability that the event occurs at that location, based on a global seismicity map derived from the International Seismological Centre (ISC) seismicity data (International Seismological Centre 2019). Since the essence of seismic monitoring at the CTBTO is to be able to detect explosions that may occur at unexpected locations, the probability that an event occurs at any location, including ones with no previous seismicity, is finite and added to the probability derived from the previous seismicity pattern. A discussion on this topic is included in the discussion section of this paper.
The probability of a set of events e, and that these events are associated with the Λ arrivals, and κ coda arrivals and that the rest of the arrivals, ξ, are false is given by the complex expression:
where A represents the whole set of arrivals, each of them being categorized as Λ, ξ, or κ, as expressed by the “1” function. The symbol “⊕” represents the exclusive ‘or’ operator, and each arrival is classified as one of the three types: Λ, ξ, or κ. Pθ is the seismicity prior function. PΦ is the probability of an event, which is itself a complex combination of the probability that associated detections, their time, amplitude, slowness, and azimuth are one of the seismic phases generated by that event. Pω is the probability of false arrivals and Pγ is the probability that the κ set is the set of coda arrivals given the set of arrivals associated with the events, Λ and the set of false arrivals ξ (U is the mathematical union symbol). The PDFs from which the probabilities are calculated are also called priors.
3.2 Learning the Priors for the Probabilistic Model
The characteristic of machine learning methods in general is that they extract knowledge from the data set previously assembled (e.g. Russell and Norvig 2009). In the case of Bayesian methods, the priors may be established from physical models or learned from the statistics on previous data. The latter is true for most of the seismic priors which are calculated during the learning phase of NET-VISA, and includes the time, slowness, amplitude, and azimuth residual priors which are computed every week over a 60 day interval of the LEB bulletin in the current configuration. The seismicity prior is static and computed using the dense data set of the International Seismological Centre (International Seismological Centre 2019) over a period of 10 years and is dependent on depth. Table 2 lists the priors used for each technology and gives a flavour of the complexity of the probabilistic model used by NET-VISA and of the different types of functional or empirical PDFs defined as priors. For many of the priors associated with the main arrival attributes of time, azimuth, and slowness, they are computed in a similar way for the three technologies, but specific attributes are also used for hydro-acoustic and infrasound and these are listed in Table 3. For both tables the empty cells indicate that the variable listed is not relevant for the technology.
3.3 Inferring the Optimal Set of Events and Associated Arrivals
The input to NET-VISA is a collection of detections and their features within a given time period. From this collection of unrelated detections, the system will identify events and the structural graph relating the events and detections related to the events (Fig. 3). It will also classify the detections (Fig. 4) as either:

A hypothetical world. Events are denoted as e, arrivals associated with events are denoted Λ, false arrivals are denoted ξ, and coda arrivals are denoted κ. Arrows indicate dependence. The job of NET-VISA is to figure out the structure of this graph by finding the events and the arrows that connect events to detections

This figure presents the relationship between events and the three kinds of arrivals classified by NET-VISA. Events are represented by the beige bubbles labelled ‘e’. The panel to the left shows the relationship between the event and an arrival associated with it, labelled Λ, within a green bubble. The middle panel shows that events and arrivals labelled ξ and colored blue are independent of each other. The panel to the right shows that there is no relationship (in the probabilistic model) between an event and a coda arrival labelled κ. The relationship is between the coda arrival and a previous arrival shown in green, classifying it as an associated arrival
-
Associated, meaning they are interpreted as phase arrivals from an event;
-
Coda arrivals, which are also associated to an event, but not identifiable as a seismic or acoustic phase;
-
False detections meaning they are not associated to any event.
In the course of searching for the optimal set of events, many event hypotheses are formulated, some of them false. In order to eliminate these false events, scores are defined for an event and for arrivals associated with an event. The score of an event is defined as the ratio of the probabilities of two hypotheses: one in which the event exists and the other where the event does not exist and all arrivals associated with it have the default classification of false or coda. The score of an arrival associated with an event is, similarly to the event score, the ratio of the probabilities of two hypotheses. The first hypothesis is that the arrival is the identified seismic phase associated with the event. The second hypothesis is that the arrival is a false or coda arrival. The final values of these scores (event and associated arrivals) are available in database tables for each event formed by NET-VISA.
3.4 Extension of the Method for Hydro-acoustic and Infrasound Data
As shown in Fig. 1, the IDC processes all three types of data from waveform technologies together within network processing. The capabilities of NET-VISA were augmented with the ability to jointly process seismic, hydro-acoustic, and infrasound detection data (Prior et al. 2013; Arora 2014; Prior and Arora 2014; Mialle et al. 2019). In the case of these two acoustic technologies, the priors used as of October 2019 are static. Because of the scarcity of archive data available for learning, the priors for hydro-acoustics are computed over a longer time period than in the seismic case. Whatever data is available for a given station was used at the time of the initial computation, and the priors are not re-computed as often as the seismic priors.
In addition to the time, azimuth, slowness as in the seismic case, hydro-acoustic parametrization of arrival attributes and priors include:
-
The energy (in dB re. Joules/m2/Hz) in the 6–12 Hz band, similar to the amplitude attribute in seismic;
-
A modified probability of detection that includes the probability that the path between the event and the station is blocked;
-
The fraction of time that the signal spends above the detection threshold versus the total duration of the signal measured in the 6–12 Hz frequency band. This is modelled as a beta distribution.
Infrasound static priors are computed using a whole year’s worth of data (built with event location and detection rate prior) and they include the following elements:
-
Clutter model to avoid building events from long-lasting local sources;
-
NET-VISA’s infrasound arrival attributes and priors include: time, back-azimuth, slowness, consistency pixel family size, and centre frequency.
The priors specific to hydro-acoustic and infrasound are listed in Table 3.
4 Overall Operationalization Process for NET-VISA
This section reviews the various steps that led to the operationalization of NET-VISA. Figure 5 shows two timelines. At the top, the specific dates are shown for the chronologically successive stages of feature enhancements explained in the previous paragraph. The overall time that NET-VISA took to become an operational reality is about 7 years including initial development, research to enhance the initial prototype for hydroacoustic, then infrasound, further development for an analyst interface, and improvements to processing of regional events.

Time line showing at the top the evolution of the features implemented in the software and at the bottom the different stages of operational testing
This section focuses on the operational testing shown on the bottom timeline.
4.1 Testing Off-line
4.1.1 Initial Testing by Analysts
Initial examination of the results of an early version of the seismic NET-VISA capable of processing seismic data only took place early (Le Bras et al. 2011). Arora et al. (2012), reports on review by analysts of a NET-VISA produced bulletin in parallel to the SEL3 bulletin over a period of 27 h. It was already clear at that early stage what the advantages of using NET-VISA would be that the automatic bulletin would miss fewer events and the events found would be more complete, with a larger number of stations associated.
4.1.2 Off-line Tests on 1 Year of Data
Further operational testing was performed off-line on the much larger time interval of one complete year. The complete suite of building the SEL1:
-
using primary and hydro-acoustic data, requesting auxiliary seismic data from the SEL1 and SEL2 events,
-
running station processing on the auxiliary segments requested, and
-
building the SEL3 event to be compared to the bulletin produced by GA
was simulated off-line for the data year 2013 (Le Bras et al. 2017; Bondár et al. 2018). It is quite convincing from comparing the event maps produced by the SEL3, LEB, and NET-VISA bulletins that there appears to be a much better agreement between the NET-VISA results and the LEB (Fig. 6). This is confirmed quantitatively by Fig. 7, where we calculated the overlap and inconsistency values on a monthly basis using the REB bulletin as a comparison benchmark.

Maps for LEB and automatic bulletins. a Map showing the automatic SEL3 bulletin generated by GA for the 2013 year. It contains 54,327 events shown as red dots with no distinction of depth or magnitude. b Analyst-reviewed LEB bulletin for the 2013 year. It contains 42,782 events. c Automatic bulletin generated by NET-VISA version 2.2.48 for the 2013 year. It contains 62,487 events

This figure shows the results of comparing the two automatic bulletins to the REB. The curves shown are the overlap percentage, meaning the percentage of REB events recovered by the automatic bulletin, and the inconsistency percentage, the percentage of events from the automatic bulletin not found in the REB. The statistics are computed on a monthly basis for the year 2013. The automatic events compared correspond to the events shown in Fig. 6a, c. The overlap for NET-VISA is higher than for GA and the inconsistency is lower, indicating a better match overall for NET-VISA, implicating a lower cost for analyst review
A further confirmation of the ability of NET-VISA to recover real events much better than GA is provided by a test using Ground-Truth events as published by the ISC (International Seismological Centre 2019). These events are not only confirmed events which are located with an accuracy of better than 5 km, but they are independent of the LEB and REB. Hence, they provide an un-biased comparison between the LEB, SEL3, and NET-VISA results. Figure 8 shows that the NET-VISA bulletin is the best out these three bulletins in being able to recover the ground-truth events published by the ISC for 2013.

This figure shows the comparison of NET-VISA, GA, and the LEB in terms of recovering ground-truth (GT) events, which are independent of the REB, and are known to exist and be accurately located within 5 km. The comparison is for the year 2013 and the bulletins compared are the LEB, the SEL3, and the bulletin generated by an offline test using NET-VISA version 2.2.48. The figure shows the number of GT events in each intersection set. For instance 93 events are formed by all bulletins, whereas NET-VISA alone forms 93 of them, LEB contains 8 uniquely and 20 are common to both NET-VISA and the LEB
4.1.3 Analysts Testing of the ‘NET-VISA Button’
It is always with great care that operational systems are replaced and many testing steps are necessary to confirm the robustness, validity and operational worthiness of a new software. In the case of the IDC, it impacts the daily work of several of the teams involved with processing and analysing the data and the quality of the products. Network processing is one of the key steps of the IDC automatic processing chain and replacing it cannot be done lightly. Since one of the main advantages of the NET-VISA software is its ability to outperform GA in completeness of the bulletin, an initial step was taken to complement rather than replace GA and a mechanism was devised to:
-
Compute the dynamic priors with the NET-VISA LEARN module, on a weekly basis over a time length of 60 days of the most recent LEB results. This choice of 60 days resulted from testing several alternatives. It was found to be optimal when measuring a cost function depending on the overlap and inconsistency values where the cost of an inconsistent event (false alarm) is one tenth of the cost of a missed event.
-
Run the inference module of NET-VISA on the same arrivals that are available for the formation of the SEL3 bulletin, producing a complete bulletin called the VSEL3;
-
Present the IDC analysts with the events contained in VSEL3, which had not yet been seen by the analysts after review of the SEL3. This is performed after the analysts are finished reviewing the SEL3 automatic bulletin and the additional events are selected from the VSEL3 bulletin and presented to them for review through the use of the ‘NET-VISA button’.
Figure 9 is a diagram showing the timing of the ‘LEARN’ module and the VSEL3 production with respect to the standard automatic bulletins. The standard automatic bulletin consists of three pipelines SEL1, SEL2, and SEL3. The results of the processing for these pipelines are available respectively 1 h, 4 h, and 6 h after real time. In addition, the input to the SEL2 and the SEL3 include detections at auxiliary stations obtained on waveform segments requested on the basis of SEL1 and SEL2 events. The ‘LEARN’ module is currently triggered once a week and updates the priors to be used by the inference module of NET-VISA. The VSEL3 bulletin uses the same detection input and is available at the same time as the SEL3 bulletin.

The VISA LEARN module which computes the non-static part of the NET-VISA statistical model is run every week using LEB bulletin statistics over 60 days. The VSEL3 bulletin is produced on the same schedule as the SEL3 bulletin and its input includes the same set of arrivals as the SEL3 bulletin
Once the configuration explained in the previous section was setup in a quasi-operational testbed environment, it became possible to confirm that additional events qualifying as REB events would be obtained by analysts tapping the additional resources of the VSEL3 bulletin. Two tests were performed on a limited number of days by a team of two analysts:
-
The first test presented NET-VISA events that are additional to the LEB as it stands. This is not an entirely fair test of the full value of NET-VISA because the LEB contains scanned events (see Sect. 1) that NET-VISA could potentially find. It was interesting from the point of view of the ergonomics of the new interactive module to assess whether NET-VISA found new events beyond the LEB. Three data days were re-analysed using the additional events formed by NET-VISA and 42 additional LEB events could be found, including 6 events meeting the event definition criteria for the REB. The legitimate events found were about 36% of the total number of the 116 automatic events presented to the analysts. This test clearly identified events which had not been found either by GA or by scanning and were missing from the LEB and REB bulletins.
-
The second test simulated a pre-scan situation by removing the LEB events obtained from scanning and see what events are recovered by NET-VISA. This step was meant to simulate a situation which may be an adequate analysis protocol where first SEL3 is analysed, then the NET-VISA interactive button is used to include additional events, then Scanner (see Introduction) is used to include yet more additional seed events. In this case, 5 days of data were prepared and 75 LEB events were found, including 33 events meeting the event definition criteria for the REB. The legitimate events found were about 42.4% of the total number of the 177 automatic events presented to the analysts. The number of additional events is higher than for the first test because some of the events recovered by NET-VISA had previously been found through scanning. Figure 10 shows a map with the location of the events recovered during this second test.
Fig. 10 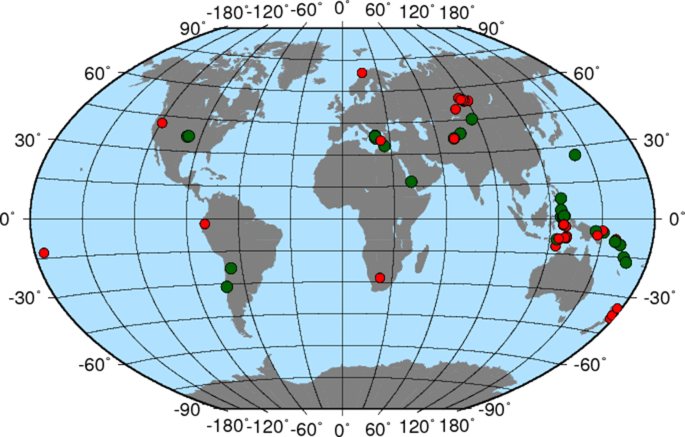
Map showing the addition events obtained for the five data days of step 2 Testbed analyst testing. The green symbols indicate the events passing the REB criterion

Based on these tests, the next step was to implement the VSEL3 and the ‘NET-VISA button’ in operations.
4.1.4 Operational Context
The VSEL3 first started production in July 2017 in a configuration that included only the primary seismic stations. Two analysts were then using the ‘NET-VISA button’ on an experimental basis and to detect any issues with the software in a fully operational context. After passing this step successfully, all analysts then used this procedure after the data day for 1 January 2018, and the Scanner and complementary VSEL3 events are now presented to the analysts in a single step, after they review the SEL3 bulletin (Le Bras et al. 2018). A further change was introduced in June 2018 when all SHI data are now used as input to NET-VISA and a bulletin equivalent to the SEL3 bulletin is produced including all SHI events. The detections that are used as input to NET-VISA for the VSEL3 bulletin are exactly the same as the ones used by the SEL3 bulletin. They include detections from the primary seismic network, the hydroacoustic network, and the infrasound network of stations. In addition, detections from the auxiliary seismic network made on waveform segment requests based on the SEL1 and SEL2 events are also included as input to the VSEL3.
4.2 Analysing the Operational Results
4.2.1 Provenance of REB Events
Each event in the automatic and reviewed bulletins possesses two unique identifiers, called orid (for origin identifier) and evid (for event identifier). In order to be able to understand the provenance of the REB events, the evid numbers of the SEL3 and VSEL3 events are conserved by the analysts and the original evid number of a SEL3 or VSEL3 event will be saved in the LEB, even though the orid will be different because the event is relocated. The arid number identifying the detections of seed events from the interactive tool Scanner (see Sect. 1) are also saved and it is possible to identify the provenance of REB events originating as a scanner seed. Figure 11 shows two possible methods of identifying events which can be considered the same in two different bulletins. One of them is to compare them through the evid number and consider they are the same when the evid numbers match. The other method is to compare the composition of the events and declare that two events are the same when they share arrivals. For instance, two defining associated arrivals in the REB are associated to the SEL3, VSEL3 or Scanner event, and the two event locations are within twenty degrees distance and the two event origin times are within 120 s. Figure 12 shows the provenance analysis of the REB events possessing an mb magnitude, during the period 1 January–11 August 2019 and Fig. 13 shows the events possessing no mb magnitude but with an ML magnitude. The method used to perform this provenance analysis is the evid linkage. The events from SEL3, VSEL3 and Scanner have a direct link through their evid number, while the events labelled as Analyst events do not have this link and the Analyst category contains all events whose evid cannot be traced to one of the other three categories. These events are therefore manually scanned by the analysts. With the procedure currently in place, they may also have been present in the VSEL3, but the analyst may have noticed un-associated arrivals in the course of reviewing the SEL3 and formed them by manual scanning before proceeding to the next stage of requesting additional events to review through the ‘NET-VISA button’. This is an indication of the added benefit that could be derived from the analysts reviewing directly the events formed by NET-VISA rather than GA. An additional benefit, which was noticed early on (Arora et al. 2012) is that the events formed by VSEL3 tend to be more complete and associate more stations to an event. It can be seen from the histograms that a non-negligible part of the REB events originates with the VSEL3.

Illustration of two different types of linkage to decide if an REB event and an automatic event are equivalent. The evid-based linkage, on the left panel, provides information on the automatic bulletins contributing to the REB bulletin. This is the linkage used to present Figs. 11 and 12. The arid-based linkage, on the right panel, can be used to compare bulletins even when they have not contributed to the REB, for instance compare the complete SEL3 and VSEL3, not just the part of VSEL3 contributing to the REB as in Fig. 13

Histogram of the provenance of the REB events with an mb magnitude. The provenance is established through the evid identifier. Each event can either have been formed by the SEL3 bulletin (blue), VSEL3 bulletin (orange), from Scanner (grey), or from the analyst (yellow). The histogram is presented by mb magnitude intervals

Histogram of the provenance of the REB events with an ML magnitude and no mb magnitude. The provenance is established through the evid identifier. Each event can either have been formed by the SEL3 bulletin (blue), VSEL3 bulletin (orange), from Scanner (grey), or from the analyst (yellow). The histogram is presented by ML magnitude intervals
4.2.2 Comparison Metrics for SEL3 and VSEL3
From off-line testing, the expectations for the improvements brought to the overall process of automatic processing and analysis are that we should observe better overlap and lower inconsistency with the REB from VSEL3 compared to SEL3. In order to ascertain this, we have conducted the same analysis that was conducted for the off-line results and Fig. 14 shows that the expectations are met or exceeded with regard to overlap and inconsistency. For the time period shown, the average overlap for VSEL3 is 86.36% and the inconsistency 52.54% while the SEL3 overlap is 69.75% and the inconsistency 55.90%. This evaluation was done using an arid-based matching of events as explained in Sect. 4.2.1 and Fig. 11.

Monthly statistics of the overlap and inconsistency values for SEL3 and VSEL3 between 1 July 2018 and 31 July 2019. As was the case for the off-line testing and is now confirmed in operations, the overlap for NET-VISA is higher than for GA and the inconsistency is lower, indicating a better match overall for NET-VISA, and implicating a lower cost for analyst review
5 Discussion and Future Work
Even though the mission of the CTBTO is to detect unannounced nuclear explosions, these have thankfully been very rare since the 1992 moratorium on testing between the United States and the Russian Federation. Since 1992, the only signatory States to have conducted nuclear tests are France and China. None of the signatory States have conducted a nuclear test after the opening of the Treaty for signature in 1996 and the only nations known to have conducted nuclear tests since the existence of the CTBTO organization are India and Pakistan in 1998 and the Democratic Popular Republic of Korea in 2006, 2009, 2013, twice in 2016 and 2017.
Analysts spend most of their time analysing earthquakes and improving on the process and time spent forming natural events is valuable to the IDC. It is however important that the software which could eventually replace GA which was successful in detecting all nuclear tests at the IDC starting with the 2006 announced test from the Democratic Popular Republic of Korea (DPRK) test does at least as well with detecting events in non-seismic areas. As explained briefly in Sect. 3, the score of an event based on the probability calculations from the generative model is essential to the detection of an event and its identification as a real event with a high probability.
During the evaluation of the software, the question was raised whether NET-VISA would be capable of detecting events in areas with no previous seismicity, given that a seismicity prior enters the composition of the score of an event. We want to show here that the value of the detection score is much more important than the value of the location score in determining the overall validity of an event. Figure 15 shows the distribution of event scores as a function of the number of defining phases along with the absolute value of the location score (the location score is always negative since it is the logarithm of a probability). The set of events used to illustrate this are the results of the SEL3-equivalent calculation for 1 year of data in 2013. Is it worthwhile noting that the third nuclear test of the DPRK (DPRK3) is included in this set of results. DPRK3 has an event score of 821.5 and a location score of − 12.7. This barely affects the overall score based on the detection evidence. The highest score for location with the 2013 SEL3-equivalent data set is − 4.4 and the lowest is − 23.8. The DPRK1 test which had an IDC mb magnitude of 4.1 after analysis was detected by the SEL3 bulletin with 13 defining phases.

Statistics of the event score and location score as a function of ndef number of defining phases. The error bars show the standard deviation of the scores for events with the same ndef. Note that the absolute value of the score is shown for the location score. The location score is always negative
Figure 16 shows a map of the events in the LEB and REB bulletins analysed from VSEL3 automatic events between 1 July 2018 and 30 September 2019, during a period when the NET-VISA version has been stable. Some of these events may have been recovered by scanning in the absence of tapping the VSEL3 bulletin, but a large percentage of these would not have been in the LEB and REB bulletin. The density of these additional events does not seem to present in general any significant bias to any particular region, but it would be of interest to study regional variations more precisely. It was pointed out by Bondár et al. (2019) that the VSEL3 seems to create many more events in the Eastern Mediterranean area than SEL3. Figure 16 also shows a high density of events in that area, which means that at least some of the events are confirmed by analysts and seems to provide a clear advantage over the SEL3. Without an evaluation of this specific area and understanding of which stations contribute to the bulletin, it is difficult to be definite about the reason for this, but several hypothesis come to mind. One possibility is the wrong attribution by SEL3 of some of the events to the deep seismic zone of the Aegean subduction arc. Another possibility is the increased role of the auxiliary stations in VSEL3 compared to SEL3 which help in initiating event formation that eventually will lead to finding more valid events in the LEB, even if these will not in the end reach the REB for lack of sufficient primary station associations. This latter hypothesis seems to be the most likely after examining the composition of the VSEL3 events and comparing it to the SEL3 events. The number of events in SEL3 for that time period is 1478 as compared to 3188 for the VSEL3 in a rectangle bounded by latitudes 32–41 and longitudes 19–41. This is a ratio of 2.16 of VSEL3 events over SEL3 events, which is much larger than the global ratio of 1.16 for the same time period. In addition, the number of associations at IDI (AS36 in the Treaty), an auxiliary station on the island of Crete for that time period is 5050 for the VSEL3, which makes it the station with the most associations for events in that area, whereas it is only 331 for SEL3. A precise evaluation of the algorithmic differences that lead to this much higher events density in VSEL3 would be an interesting study as well as a systematic investigation into similar regional differences.

Maps of the LEB (6750) and REB (4267) events with provenance from the VSEL3 bulletin from 1 July 2018 to 30 September 2019. The events are color coded according to their number of defining phases. The size of the symbols indicates the magnitude (IDC mb or ML if mb not available)
The IDC is still not taking full advantage of the improvements in automatic association brought by NET-VISA. The next improvements include putting in place the replacement to the SEL1 and SEL2 pipelines in order to request the auxiliary data based on the events formed by NET-VISA and not by GA as is the case at the time of writing of this paper. Improvements to the hydro-acoustic and infrasound processing are also being envisioned, in particular to include the in-water explosions large enough to be seen at seismic stations. Another area of improvement will be to better understand the physical basis for the learned priors (see Table 2) and assess whether it is essential to learn the prior parameters weekly as is the current practice, or if, for instance, season-dependent priors would yield comparable results.
6 Conclusions
This paper presented the results of testing and evaluating the NET-VISA software at the IDC. The method uses the same detection input as GA, the legacy system in place at the IDC, and produces the same type of output in the form of database tables describing a seismo-acoustic bulletin. The next major improvement in automatic bulletin publishing will probably involve using a more holistic approach to the automatic bulletin production where detections and waveforms are re-examined after event detection, in contrast with the current sequential approach. However, the research and development associated with this system has shown the benefit of reaching out to the Machine Learning academic community to apply Bayesian methods to derive an adapted probability model and take advantage of experience accumulated in the analyst-reviewed bulletin to populate the priors defined in the probability model.
NET-VISA is a major upgrade to network processing and extends previous usage of artificial intelligence (Bache et al. 1993; Sereno and Patnaik 1993) in the domain of nuclear monitoring. The probabilistic framework allows for a quantification of the quality of an event with respect to the model and this can be used for instance to evaluate automatic events formed by other methods, such as GA. The benefits expected from this upgrade will be a decrease of ten percent in the missed event rate, better completeness of the events in terms of the number of stations associated to an automatic event. This in turn will help the analysts in their productivity and will allow them to spend more time on tasks necessitating their knowledge and attention.
References
Arora, N. S. (2014). Threshold monitoring maps for under-water explosions. In Poster S41B-4470. AGU Fall conference, San Francisco, CA, December 15–19, 2014. https://doi.org/10.13140/2.1.1263.1842.
Arora, N. S., Given, J., Tomuta, E., Russell, S., & Spiliopoulos, S. (2012). Analyst evaluation of NET-VISA (network processing vertically integrated seismic analysis) at the CTBTO. In Proceedings of Monitoring Research Review (MRR 2012), Albuquerque, New Mexico, 2012.
Arora, N. S., Russell, S., & Sudderth, E. (2013). NET-VISA: Network processing vertically integrated seismic analysis. Bulletin of the Seismological Society of America, 103, 709–729.
Bache, T. C., Bratt, S. R., Swanger, H. J., Beall, G. W., & Dashiell, F. K. (1993). Knowledge-based interpretation of seismic data in the intelligent monitoring system. Bulletin of the Seismological Society of America, 83(5), 1507–1526.
Bondár, I., Arora, N., Le Bras, R. (2019). NET-VISA: Evaluation of event location performance compared to SEL3, and NEIC PDE, T3.5-O10, CTBT SnT 2019 conference, Vienna, June 24–28, 2019.
Bondár, I., Le Bras, R., Arora, N., Kushida, N., Tomuta, E. (2018). Evaluation of NET-VISA association and location performance using ground truth events and RSTT model based SSSCs. EGU General Assembly, Vienna, Austria, April 4–13, 2018. Poster EGU2018-13432.
Bondár, I., North, R. G., & Beall, G. (1999). Teleseismic slowness-azimuth station corrections for the international monitoring system seismic network. Bulletin of the Seismological Society of America, 89, 989–1003.
Cansi, Y. (1995). An automatic seismic event processing for detection and location: The PMCC method. Geophysical Research Letters, 22(9), 1021–1024. https://doi.org/10.1029/95gl0046.
Coyne, J., Jia, Y., & Brogan, R. (2009). Relative contribution of the IMS stations to the reviewed event bulletin. In CTBTO international scientific studies, Hofburg, Vienna, Austria, 10–12 June 2009.
CTBT. (1996). Retrieved November 11, 2019 from https://www.ctbto.org/fileadmin/user_upload/legal/CTBT_English_withCover.pdf.
Hanson, J., Le Bras, R., Dysart, P., Brumbaugh, D., Gault, A., & Guern, J. (2001). Operational processing of hydroacoustics at the prototype international data center. Pure and Applied Geophysics, 158, 425. https://doi.org/10.1007/PL00001190.
International Seismological Centre. (2019). On-line bulletin. London: International Seismological Centre. https://doi.org/10.31905/D808B830.
Kennett, B., & Engdahl, E. R. (1991). Travel times for global earthquake location and phase identification. Geophysical Journal International, 105, 429–465.
Le Bras, R. J., Arora, N., Kushida, N., Mialle, P., Tomuta, E. (2018). Operational experience with next-generation automatic association software NET-VISA. Seismology of the Americas Meeting, Latin American and Caribbean Seismological Commission and Seismological Society of America, 14–17 May 2018, Miami, Florida, USA.
Le Bras, R., Kushida, N., Mialle, P., Tomuta E., & Arora, N. (2017). The NET-VISA automatic association tool. Next generation software testing and performance under realistic conditions. In EGU General Assembly, Vienna, Austria, April 23–28, 2017. Poster EGU2017-15683.
Le Bras, R., Russell, S., Arora, N., & Miljanovic, V., Machine Learning at the CTBTO. (2011). Testing and evaluation of the false events identification (FEI) and vertically integrated seismic association (VISA) projects, In Proceedings of the 2011 monitoring research review: ground-based nuclear explosion monitoring technologies, LA-UR-11-04823, Vol. 1, pp. 313–321.
Le Bras, R., Swanger, H., Sereno, T., Beall, G., & Jenkins, R. (1994). Global association: Final report. Science Applications International Corporation. Tech. Rep. SAIC-94/1155, ADA304805, San Diego, CA.
Mialle, P., Brown, D., & Arora, N. (2019). Advances in operational processing at the international data centre. In A. Le Pichon, E. Blanc, & A. Hauchecorne (Eds.), Infrasound monitoring for atmospheric studies. Cham: Springer. https://doi.org/10.1007/978-1-4020-9508-5.
Moore, D. (2016). Signal-based Bayesian seismic monitoring. PhD thesis, UC Berkeley.
Moore, D., Myers, S., Mayeda, K., & Russel, S. (2017). Initial evaluations of signal-based Bayesian seismic monitoring (SIG-VISA). T5.3-03, CTBT SnT 2017 conference, Vienna, June 26–30, 2017.
Myers, S. C., Johannesson, G., & Hanley, W. (2007). A Bayesian hierarchical method for multiple-event seismic location. Geophysical Journal International, 171, 1049–1063.
Myers, S. C., Johannesson, G., & Hanley, W. (2009). Incorporation of probabilistic seismic phase labels into a Bayesian multiple-event seismic locator. Geophysical Journal International, 177, 193–204.
Prior, M. K., & Arora, N. (2014). Testing and enhancing the NET-VISA software of the commission: Fusion of seismic and hydro-acoustic propagation. Review of monitoring research. Cham: Springer.
Prior, M. K., Tomuta, E., & Poplavskiy, A. S. (2013). Quantitative assessment of the detection performance of global association algorithms. In CTBT SnT 2013 conference, Vienna, June 17–21, 2013.
Ringdal, F., & Kværna, T. (1992). Continuous seismic threshold monitoring. Geophysical Journal International, 111(3), 505–514. https://doi.org/10.1111/j.1365-246X.1992.tb02108.x.
Russell, S., & Norvig, P. (2009). Artificial intelligence: A modern approach (3rd ed.). Upper Saddle River: Prentice Hall. (ISBN-13: 978-0136042594).
Russell, S., Vaidya, S., & Le Bras, R. (2010). Machine learning for comprehensive nuclear-test-ban treaty monitoring. CTBTO Spectrum, 14, 32–35.
Sereno, T., & Patnaik, G. (1993). Initial wave-type identification with neural networks and its contribution to automated processing in IMS version 3.0, (1993). Tech. Rep., SAIC-93/1219.
SnT. (2019). Retrieved February 5, 2020 from https://www.ctbto.org/the-organization/science-and-technology-the-conference-series/.
Vaidya, S., Engdahl, R., Le Bras, R., Koch, K., & Dahlman, O. (2009). Strategic initiative in support of CTBT data processing: vDEC (virtual Data Exploitation Centre) (abstract DM-01/A). In CTBTO international scientific studies, Hofburg, Vienna, Austria, 10–12 June 2009.
Veith, K. F., & Clawson, G. E. (1972). Magnitude from short-period P-wave data. Bulletin of the Seismological Society of America, 62(2), 435–452.
Acknowledgements
We are grateful to our CTBTO colleagues and former colleagues Jeff Given, Gerhard Graham, Patrick Grenard, Mark Prior, Alexander Poplavskiy, and Spilios Spiliopoulos for encouragements and participation in the testing of earlier versions of NET-VISA. Heidi Kuzma participated in the early stages of development and documentation of NET-VISA. The participants to the Wave Expert Group sessions taking place during the Working Group B meetings, one of the Policy Making Organs of the CTBTO, have provided criticisms, comments and suggestions between 2011 and 2019 that resulted in improvements to the NET-VISA algorithms and software. An early version of this paper was reviewed by Peter Glaeber and Steven Gibbons, resulting in a much improved manuscript.
Author information
Authors and Affiliations
Corresponding author
Additional information
Publisher's Note
Springer Nature remains neutral with regard to jurisdictional claims in published maps and institutional affiliations.
Disclaimer
The views expressed by the authors in this work do not necessarily reflect those of the CTBTO.
Rights and permissions
Open Access This article is licensed under a Creative Commons Attribution 4.0 International License, which permits use, sharing, adaptation, distribution and reproduction in any medium or format, as long as you give appropriate credit to the original author(s) and the source, provide a link to the Creative Commons licence, and indicate if changes were made. The images or other third party material in this article are included in the article's Creative Commons licence, unless indicated otherwise in a credit line to the material. If material is not included in the article's Creative Commons licence and your intended use is not permitted by statutory regulation or exceeds the permitted use, you will need to obtain permission directly from the copyright holder. To view a copy of this licence, visit http://creativecommons.org/licenses/by/4.0/.
About this article

Cite this article
Le Bras, R., Arora, N., Kushida, N. et al. NET-VISA from Cradle to Adulthood. A Machine-Learning Tool for Seismo-Acoustic Automatic Association. Pure Appl. Geophys. 178, 2437–2458 (2021). https://doi.org/10.1007/s00024-020-02508-x
Received:
Revised:
Accepted:
Published:
Issue Date:
DOI: https://doi.org/10.1007/s00024-020-02508-x