
Abstract
The article demonstrates an effective solution for ultrasonic quality monitoring of transmission and drive components of motor vehicles, joined using an innovative method called magnetically impelled arc butt welding (MIAB). The major challenge was the application of ultrasonic technology for quick and reliable testing of thin-walled components with complex geometry. To solve this problem the idea of using ultrasonic subsurface waves was investigated. By using finite elements method (FEM) the angle of the ultrasonic beam incident on the tested element and the frequency of the ultrasonic transducer were verified. Then, scanning acoustic microscopy (SAM) and X-ray computed tomography (CT), both nondestructive tests on thin-walled welded tubular components were performed. The research have shown that it is possible to detect defects with diameter of 0.3 mm with the angle of incidence of wave 31.5°. The results of the numerical analysis were compared with the experimental approach and confirmed the usefulness of proposed method. Finally, the potential of using immersion ultrasonic technique for quick and reliable validation of thin-walled tubular components was proven, as the test duration for a one elements was around 3 s.
1 Introduction
The constant shifts toward downsizing, weight reduction and reduced energy consumption has been observed in the automotive industry in the recent decades. These factors, along with the need for cost reduction, have resulted in changes to the materials used in car production, especially in indicating the need for thinner construction elements. However, due to e.g. low stiffness of such parts, this have caused different difficulties in further processing, including joining. One of the methods that have found an application in the joining process of such thin-walled components is magnetically impelled arc butt (MIAB) welding [1,2,3,4,5,6]. An example of the element that has been manufactured using this method is drive shaft. However, a constant examination of such elements is needed in order to maintain their high quality. Among the numerous destructive and non-destructive testing methods that are applicable for detecting e.g. flaws in joints, Scanning acoustic microscopy (SAM) appears to be a highly beneficial one. As presented previously [7,8,9], this method allows to analyze materials with high resolution and sensitivity, through the use of surface and subsurface waves. Moreover, SAM is a relatively cost-effective and quick method. Although SAM testing has been broadly discussed in the literature [10, 11], no published study has directly addressed this method as a tool to evaluate thin-walled welded car components.
The aim of this research was to verify whether SAM can be used to perform fast and reliable quality testing of MIAB welded thin-walled tubular elements. The theoretical introduction has comprised a detailed description of MIAB welding, followed by both a presentation of the fundamental features of mechanical waves and SAM method. In order to select the optimal parameters of ultrasonic beam propagation and to understand the physical–acoustic phenomena, finite elements method (FEM) modelling was performed. Then, the phenomena of wave transformation on the boundary of the medium have been analyzed by experimental approach. The results of the numerical analysis were confirmed by UT and CT, respectively.
Presented method is very promising in many area of applications e.g. tubular joints and pipelines quality control. Application of subsurface waves gives opportunity to perform the nondestructive tests of the welds made by other methods than MIAB. It can be GMAW, TIG, friction welded joints and others. The strong physical background of this waves propagation allows detection of many types of defects. In MIAB joints the typical types of imperfections are: metallic and nonmetallic inclusions, hot and cold cracks, lack of fusion, geometrical imperfection caused by e.g. improper preparation of welded edges or deformation of parts to be joined. This and many others defects can be potentially detected using subsurface waves. The potential of using such testing method is presented here based on MIAB welded thin-walled tubular components.
2 Materials and Methods
2.1 Joining Method: MIAB
The case analyzed in this study is MIAB welded driveshaft, which is mostly used in rear wheel drive and other types of cars to transfer power from the engine to the rear axle. This kind of mechanism consists of two shafts connected with a CV joint (constant-velocity—the type of homokinetic joints, allows a drive shaft to transmit power through a variable angle, at constant rotational speed) [12]. The shaft is made of three elements: an outer race, a tube and a stub shaft (Fig. 1). These elements were joined all together by using MIAB welding.

The drivetrain of a car-drive shafts [13]
MIAB technique allows to create butt joints between two elements with closed cross-sections. In order to reach the high temperature needed to create a joint, a welding arc is ignited in the gap between the elements being welded [1,2,3]. Once the arc is initiated, it starts to spin along the edges of the elements. The spin of the arc is caused by the magnetic field generated by permanent magnets or electromagnetic coils located closely to the welding region [1,2,3].
The MIAB process can be summarized in four steps:
-
positioning and fixing of the welded components. Butt faces are stuck together and the current is turned on (Fig. 2a),
Fig. 2 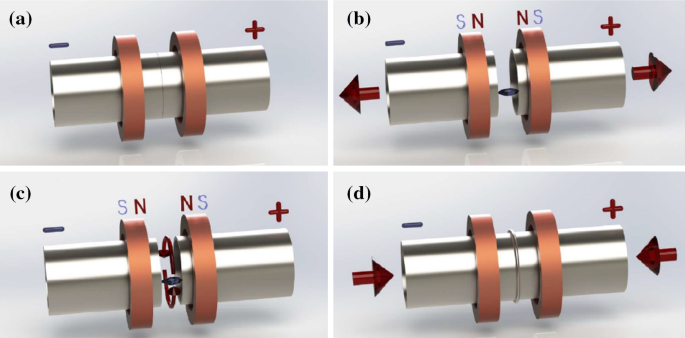
The stages of magnetically impelled arc butt welding [3], a positioning of the elements, b arc ignition, c arc spinning, and d weld forming
-
components are pulled apart and an arc is ignited between the faces (Fig. 2b),
-
the magnetic field between the components cause an arc to spin along the circuit that consists of the elements (Fig. 2c),
-
the melted edges are stuck together due to the upset forces (Fig. 2d).

The most significant part of MIAB welding is the spin of the arc. This phenomenon is caused by the Lorentz force acting on the welding arc [2,3,4]. The Lorentz force is formulated according to the following equation:
where \(\overrightarrow{{F}_{l}}\) is Lorentz force, \(\overrightarrow{I}\) is arc current, \(dL\) is arc length, \(B\) is magnetic flux density.
The directions of the induction force, the Lorentz force and the velocity of the charged particles are presented in Fig. 3.

Relation between the magnetic flux, the Lorentz force and the arc current vectors
The velocity of the spinning welding arc can reach values of up to 200 m/s and the heat is thereby evenly distributed over the front surfaces of the welded components [1,2,3,4].
In general, MIAB is used mainly to connect two round elements such as pipes, shafts or axles, especially thin-walled ones. It can be used to join a wide range of metal alloys, from basic carbon steel through high alloy steel and also some non-ferrous metals such as aluminum alloys [4,5,6, 14, 15]. Due to its vast number of advantages, this method is becoming more popular in the automotive, gas, oil, power and defense industries [4,5,6, 14, 15].
In this work, the MIAB process was used to connect complete TSA (tubular shaft assembly) parts, consisting of a tube (C22 steel) with a wall thickness of 1.5 mm and two ends: a joint (UC1 steel)—stub shaft ended with spline. Welding parameters for all joints were the same and consistent with the applied production technology.
2.2 Ultrasonic Testing
The wave propagation phenomena seems to be crucial for understanding the mechanisms that underpin ultrasonic testing. A wave is the transfer of energy in a medium or space, which can be described by the equations of periodic oscillation [16]. A mechanical wave is described as particles oscillation. It can only propagate in a medium which can be characterized with elasticity and density. Therefore it has to be gas, solid or liquid [16,17,18,19].
In the field of ultrasonic there are two types of bulk acoustic waves that can propagate in an elastic solid body: (1) longitudinal waves, and (2) transverse (shear) waves.
The longitudinal wave, also called a compression one, is a type of planar wave, the particles of which oscillate in the direction of the wave propagation. Therefore, along the direction of propagation, the particles of the medium alternately compress and expand [16,17,18,19,20]. A longitudinal wave may propagate in a solid, liquid and gas medium. Due to the uncomplicated generation and detection of longitudinal wave, this kind of oscillation is widely used in ultrasonic testing. On the other hand, the particles of the transverse wave oscillate in the direction which is perpendicular to direction of propagation, therefore transverse waves can propagate only in solids [16,17,18,19,20].
In UT testing of welds it is difficult to use normal (perpendicular to the tested surface) beam. The surface of weld flash is rough and curved, which causes the distraction and dissipation of ultrasonic beam. A beam with angular incidence is commonly used in order to avoid such difficulties. The acoustic wave is introduced to the material by using angle probes. This kind of wave propagation is much more complex, mainly because of the appearance of other wave modes, but also due to refraction and attenuation effects.
To avoid the inconveniences caused by longitudinal waves the subsurface lateral waves were chosen for quality assessment of MIAB joints.
Razygraev [17], Deputat [18], and Chaki et al. [20] have described an acoustic field in a solid material when the boundary surface is hit by the ultrasonic wave with the critical angle [14]. Due to the refraction phenomenon, subsurface waves and non-uniform longitudinal waves propagate along the boundary surface in the lower (solid) and in the upper (liquid) medium. Propagation of the subsurface wave is not disturbed by surface flaws or roughness but may be reflected by flaws localized under the material’s surface.
Chaki et al. [20], presented a FEM simulation as well as an experimental study of a critically refracted longitudinal wave in a liquid–solid interface boundary. The excitation source corresponds to the critical angle for the water–steel boundary. The refracted beam causes the appearance of the previously described wave modes such as head wave, transverse wave and subsurface longitudinal wave [20].
In this work the ultrasonic testing system was built basing on SAM. SAM is a technique which is used for investigating, measuring and imaging the external and internal structure of materials using a high frequency ultrasonic beam. There are many ways of processing data, which can be one- or two-dimensional acoustic profiles, which are called the A-scan or B-scan. Further, by processing the collected data using the relevant methods, it is possible to determine some of the properties of the material, like Young modulus, shear modulus or Poisson ratio [10, 11]. This method is relatively fast and safe, and as a consequence it has been applied for non-destructive testing of materials [21], as well as in medical and biological research [22, 23]. The construction of a SAM is presented on Fig. 4.

Scanning acoustic microscope [24]
The internal structure of the MIAB joint has to be tested using a subsurface wave because of e.g. irregular surface of the flash weld. In the case when normal beam is used, most of the signal is reflected in random directions, which makes impossible to verify the internal structure of weld. Evaluations with a normal beam would be only possible when the flash weld would be ground on two sides of the joint. This is impossible in this case because there is no access to the flash inside the tube. The subsurface wave was indicated on the surface of the tube near to the flash weld and then it travelled under the surface through the joint. In case of the defect occurrence the acoustic wave is reflected back. Otherwise it travels forward. This method is shown in the scheme in Fig. 5.

Scheme of the subsurface testing methodology
The acoustic microscope used in this study has been equipped with a high frequency focused beam transducer which diameter was 7 mm, focus length in water 15 mm and frequency 10 MHz, which is able to generate a subsurface wave. The conventional version of the microscope (Fig. 4) is usually limited to samples with flat surfaces. Due to the more complex geometry of the shaft it is not possible to carry out the scan along the entire circuit, using conventional kinematic system consisted with 2 degrees of freedom movable arm crewed with focused beam transducer and one axis positioner. In order to enable data collection from the entire circuit, the kinematic system was modified and this is shown in Fig. 6.

The kinematic system of the testing setup
2.3 Numerical Simulations of the Propagation of Ultrasonic Waves
All simulations were conducted for the same joint geometry (Fig. 7). Analysed MIAB welds were formed at the end faces of pipe and stub shaft. Both elements had the same diameter (50 mm) and thickness (1.5 mm) at the interface area.

The 3D FEM model of welded components: a the components of the model, b model of the mesh with area of the very dens mesh surrounding the defect, and c discretization of the defect
The ultrasonic beam was oriented at the angle of 31.5° to the surface of the tube, because in this case the wave incident angle should correspond to the third critical angle. By this way, the required subsurface wave can be generated due to the phase transformations at the border of two media.
The transducer frequency was selected on the basis of previous empirical experiments determining the depth of the subsurface wave penetration into the tested material. The wave created in the tested material (tube) must involve its whole thickness to ensure maximum detection of welding nonconformities and for this reason the value of 10 MHz was assumed.
The welded area in the FEM model was represented as an interface (with no thickness) between two welded components. This simplification do not influence on the results because ultrasonic wave is reflected by the borders of the media with different acoustical impedance. The thickness of the border (air gap) does not matter at this case because the reflection rate is determined by the physical properties (Young modulus, Poisson ratio and the density) of the material and the gas or fluid filling the defect. The advantage of such modelling is shortening of the calculation time and possibility of quick modification of the model.
Ensuring appropriate conditions for the simulation required the selection of an appropriate size of the finite element mesh and the time step. When selecting these parameters, the frequency of the transducer and the wave celerity in the given medium were also considered. The model discretization was conducted taking into account the factors mentioned above. This means that for unambiguous interpretation of the results, the size of the mesh element should be significantly smaller than 50% of the wavelength, suggested 10 elements per wavelength [20]. Therefore, the assumed size of the element was in the range of 0.05 mm up to 0.2 mm (Fig. 7b, c). Similarly, to ensure unambiguity of the results, the maximum time step should not exceed 20 ns, and this results from the general theory of signal sampling [20].
Figure 7 presents the 3D FEM model of main tested elements. The model consists of a long tube, a short stub shaft and a contact surface of the welded elements. The model was discretized and then boundary conditions (restrains at the ends of the welded elements) as well as input in the form of a force impulse with the length of 1/4 of the ultrasonic wave period applied in the area shown in Fig. 8 were defined.

Configuration of the FEM model of the MIAB joint
3 Results
At first, FEM simulations of the quality control process for MIAB welded joints have been conducted. These simulations enabled the verification of parameters necessary for conducting the experimental tests in a correct way by using in-house made SAM set-up and in particular the angle of the ultrasonic beam incident on the tested element and the frequency of the ultrasonic transducer. Afterwards, the tests were performed by SAM and selected results were compared to the ones obtained by the X-ray computed tomography.
3.1 Results of the Numerical Simulation
The test result presented below demonstrate a possibility for using a subsurface wave for the detection of discontinuities in welds made by the MIAB method.
Figure 8 shows an example of UT wave propagation in the analyzed configuration of the measuring system, the location of the wave excitation and an example of an artificial nonconformity. This is an example for the welded joint at a selected stage of the wave propagation in the tested media. The time of the ultrasonic wave front flight is measured since the moment of the wave excitation until it returns to the measuring point (see Fig. 8).
Figure 9 shows two cases of the ultrasonic wave propagation. Figure 9a presents a situation in which a correct weld was formed, while the uniform weld was not obtained in a second case (Fig. 9b). This means that there is an interface between the welded elements forming a reflector for the ultrasonic wave. The entire energy of the wave is reflected from the contact surface of the materials (Fig. 9b). It was obtained by turning off the contact condition in the FEM model between both welded components.

The FEM model of the wave propagation in the MIAB weld in case of: a forming correct weld, and b weld was not formed
By measuring the time of the wave flight in the tested sample, it can be determined if the welded joint was formed or not (Fig. 9). The results of an analysis show that when the weld was formed, the wave passes through the weld area. There is no physical border between both welded components. The time of the wave propagation in this case equals 10.6 μs. In case of the defect occurrence the wave is reflected and in such case the time of the wave propagation equals 4.9 μs. It happens because of the high difference of the acoustical impedance of the welded material and the gas (usually air) placed in the defect or material interface. The shorter time of wave flight indicating the lack of weld or defect occurrence (Fig. 10).

The propagation time for the case when: (a) weld was formed; t = 10.6 μs, and (b) weld was not formed; t = 4.9 μs
Figure 11 presents the example of a simulated imperfection in the MIAB welded joint. By using FEM circular shaped defects were mainly analyzed. The diameter of the defects was in the range of 0.2 mm to 1.2 mm. The depth of every defect was equal to the wall thickness.

An example model of the MIAB weld with a defect
During ultrasonic testing, the most important factor, for detectability of the defects, is substantial difference of acoustical impedance of two media. According to the basis of the geometrical acoustics such a boundary of two materials is a reflector for ultrasonic wave. By precise micromachining and introducing the artificial defects it is possible to simulate almost all typical types of weld imperfections, like pores, cracks or metallic or nonmetallic inclusions. In this case, the geometry of the defect is not important, however the shape of the border between two materials (base material and defect—e.g. air) must be taken into account. If the border is perpendicular to the direction of the wave propagation, then it is a good reflector. Otherwise, the wave is dissipated and cannot be detected. Cylindrical shape of the artificial defects is the best shape for simulation of the welds imperfections. Always, at least small part of the cylinder surface can be a good reflector and thanks to that it is possible to compare influence of the artificial effect size for the detected signal strength. This simulation should be considered as qualitative and not quantitative, to prove existence of signal to defect size relation. Because of the very small sizes of the nonconformities and for the purpose of batter presentation of the detection phenomena, the rectangular shaped defect was presented on the Fig. 11. The dimensions of this defect was: width 1.2 mm, height 0.2 mm and the depth 1.5 mm. This case shows clearly visible wave front. The signals reflected from the circular defects are well visible on the Fig. 12 as a 2D chart. The influence of the defect size on the level of the signal reflected by the nonconformity was presented on the Figs. 12 and 13.

The A-scan results of simulation for various size of the defect in the MIAB weld

The analysis of ultrasonic wave amplitude for various sizes of nonconformities in a MIAB welds
Figure 12 shows a set of results of numerical simulations for a model of the weld with imperfections of different sizes (from 0.2 to 1.2 mm). It is clearly visible here that an amplitude of the wave reflected by the nonconformity increases with the size of the defect.
Figure 13 shows a relationship between the size of the nonconformities and the amplitude of the reflected wave. This relationship is approximately linear, as confirmed by the high value of the correlation coefficient, R2, of 0.99.
The results obtained here show that for the assumed simulation parameters (incident angle of 31.5°, the transducer frequency of 10 MHz), a nonconformity in the MIAB welded joint can be unambiguously detected. The tests conducted for other beam incident angles and the transducer frequencies did not give satisfying results, so they are not presented here.
The conducted numerical simulations allowed an initial verification of adapted ultrasonic test parameters. Thus, it was possible to limit the number of conducted experiments and to better understand the phenomena accompanying the propagation of subsurface ultrasonic waves during testing of MIAB welded joints.
3.2 Results of the Ultrasonic and Computed Tomography Tests
Two examples of shafts have been shown below.
3.2.1 Shaft I
Three artificial defects (holes) were prepared across the weld using laser techniques. These holes were used for the verification of the detectability of the defects using the ultrasonic method. Figure 14 shows the B-scan with the detected imperfections (labelled by arrows). These marks are listed in Table 1 along with a brief description.

Artificial defects and the B-scan indication for Shaft I
In the first case (Fig. 14) two points were clearly visible on the B-scan, representing the twin hole defects with 0.5 mm in size. The similar effect was observed in case no. 3, the indication of the hole with the diameter of 1.2 mm was well detected. In case no. 2 (defect size 0.3 mm) it was also possible to find the indication of this defect but sometimes there were also other indications close to the defect. They probably arose from the irregular geometry of the weld, insufficient fusion or external disturbances. This will be investigated during further research work.
3.2.2 Shaft II
The second shaft also had artificial defects that were designed to verify the test method. The shaft was examined using the acoustic microscopy and CT to enable the comparison of these two methods. This also has allowed for the verification and interpretations of the detected imperfections. Figure 15 shows the B-scan with the marked holes and potential imperfections, they are also listed in Table 2 along with a brief description.

Artificial defects and their B-scan indication for Shaft II
In this case all the artificial defects were revealed, however sometimes other indications could appear on the B-scan. This is usually caused by the incorrect geometry of the weld, incorrect fusion, gas pores or some external disturbances (according to Fig. 16, which shows some selected cross sections of MIAB weld).

The CT tomograms: a face part of the joint, b middle part of the joint, and c root part of the joint in the comparison with the B-scan ultrasonic image. Moreover the tomogram shows the cross sections of the shaft A–A, C–C, D–D and detail B
3.3 Comparison of SAM and CT Results
Figure 16 shows comparisons of tests performed using SAM and CT. These results clearly demonstrate that outcomes for both methods are consistent. The comparison performed verified the correct operation of the proposed method for the detection of nonconformities in drive shafts.
In the tomogram (Fig. 16), it was possible to observe the local excess weld metal and overlaps, especially in the middle and bottom part of the weld. The relevant details for the study have been shown in the cross sections (Fig. 16). The cross sections A–A and detail B have shown the gas pores in the top part of the flash weld as well as the overlap that can be observed in these areas on the tomogram. The cross section C–C represents the location of the most inclined angle of the weld. This can dissipate the wave flowing through the weld and cause a decrease in a signal level. The excess weld metal with a large pore inside the flash weld was visible in the D–D section. No other correlations between the tomogram and the B-scan were found.
4 Summary and Conclusion
The aim of this study was to verify whether an acoustic microscope may be used to perform quick and reliable validation (the test duration for a one elements takes around 3 s) of MIAB welded joints. As a part of the conducted work, extensive numerical calculations and experimental tests were performed, which unambiguously demonstrated the effectiveness of the described methods. On the basis of the conducted simulations and the analyses of the experimental test results, the following conclusions can be drawn:
-
A possibility to use subsurface ultrasonic waves for tests of thin-walled elements was demonstrated and their use in tube-shaped elements enables the detection of nonconformities in welds made by MIAB method.
-
By setting the ultrasonic transducer at a critical angle (31.5° for steel), it is possible to transform the longitudinal wave into the subsurface wave, thus it is possible to test MIAB welds without the need for deburring.
-
The use of the numerical methods can be a tool supporting the selection of appropriate parameters for ultrasonic tests. By conducting numerical calculations, the required parameters (frequency, size) of the ultrasonic transducer and an incident angle of the ultrasonic beam were selected, to ensure the highest detectability of nonconformities in a MIAB weld, as well as the best ratio of noise to the analyzed signal.
-
The performed simulations ensure better understating of the test process and the method of the wave propagation in welded joints, thus enabling precise interpretation of results obtained during tests of real elements.
-
The conducted numerical analyses (considering wave transformation, time of flight, influence of the flaw size on amplitude level) were confirmed by ultrasound tests in laboratory conditions.
-
The research has confirmed the possibility of using subsurface waves in ultrasonic immersion techniques. The wave penetrated the material and it was possible to receive the reflected wave back. Using these techniques, all of the prepared verification artificial defects were detected.
-
The results obtained using computed tomography gave a very precise and accessible view of the internal structure of the joint. Nowadays computed tomography is expensive, time consuming and uses hazardous ionizing radiation. The B-scan image is less precise and is not easy to interpret but if this method could be developed it should provide the necessary data in a very short time at a low cost.
To sum up, although the precision of the measurements using the acoustic microscope was lower than some of the alternative methods, it has numerous advantages. SAM is fast, less expensive than the CT method for instance, and does not pose a threat to operators’ health.
References
Piwowarczyk, T., Małachowska, A., Sokołowski, P.: Tendencje rozwojowe zgrzewania łukiem wirującym w aspekcie zastosowań w przemyśle motoryzacyjnym. Prz. Spaw. Weld. Technol. Rev. 85(6) (2013)
Kim, J.W., Choi, D.H.: A study on the numerical analysis of magnetic flux density by a solenoid for magnetically impelled arc butt welding. Proc. Inst. Mech. Eng. B 217(10), 1401–1407 (2003)
Piwowarczyk, T., et al.: Effect of pipe butting face preparation on the quality of magnetically impelled arc welded joints. Biul. Inst. Spaw. (2016). https://doi.org/10.17729/ebis.2016.5/15
Phillips, H.D.: Magnetically Impelled Arc Butt (MIAB) welding of chromium-plated steel tubular components utilizing arc voltage monitoring techniques. Dissertation, The Ohio State University (2008)
Kachinskiy, V.S., Krivenko, V.G., Ignatenko, VYu: Magnetically impelled arc butt welding of hollow and solid parts. Weld. World 46(7–8), 49–56 (2002)
Sivasankari, R., et al.: Characterization of magnetically impelled arc butt welded T11 tubes for high pressure applications. Def. Technol. 11(3), 244–254 (2015)
Korzeniowski, M., Piwowarczyk, T.: Możliwości zastosowania skaningowej mikroskopii akustycznej do analizy jakości połączeń spajanych. Weld. Technol. Rev. 89(10), 39–46 (2017)
Pawlak, S.: Scanning Acoustic Microscopy, Theory and Applications to Material Characterization, E-learning. Instytut Metalurgii i Inżynierii Materiałowej PAN (2013)
Yu, Z., Boseck, S.: Scanning acoustic microscopy and its applications to material characterization. Rev. Mod. Phys. 67(4), 863 (1995)
Kustroń, P., Korzeniowski, M., Lewandowski, M., Witek, B., Rozbicki, J.: A high frequency ultrasonic imaging of welded joints. In: 2016 IEEE International Ultrasonics Symposium (IUS 2016), 18–21 September, Tours, France, pp. 1–4. IEEE (2016)
Korzeniowski, M., Białobrzeska, B.K.: Analysis of using acoustic microscopy to evaluate defects in spot welding joints. Arch. Metall. Mater. 61(2B), 1009–1019 (2016)
GKN Driveline—the first complete AWD system developed in China. https://www.gkn.com/en/our-divisions/gkn-driveline/case-studies/2016/gkn-is-chinas-most-advanced-local-driveline-developer-and-supplier/. Accessed 28 March 2018
Piwowarczyk, T., Salamon, M., Korzeniowski, M,, Sokołowski, P., Bicz, A.: Zautomatyzowane stanowisko do badań ultradźwiękowych połączeń zgrzewanych łukiem wirującym. Prz. Spaw., R. 89(8) (2017)
Iordachescu, D., et al.: Technological windows for MIAB welding of tubes featuring original longitudinal magnetization system with peripheral solenoids. J. Mater. Process. Technol. 210(6), 951–960 (2010)
Arungalai, S.V., et al.: Magnetic flux distribution modelling of magnetically-impelled arc butt-welding of steel tubes using finite-element analysis. Proc. Inst. Mech. Eng. C 222(9), 1783–1790 (2008)
Krautkrämer, J., Krautkrämer, H.: Ultrasonic Testing of Materials. Springer, Berlin (2013)
Razygraev, N.P.: Ultrasonic nondestructive testing by head waves, physical prerequisites and practical use. Russ. J. Nondestruct. Test. 40(9), 593–601 (2004)
Deputat, J.: Fale podpowierzchniowe (2006). https://www.badania-nieniszczace.info/Badania-Nieniszczace-Nr-02-08-2006/pdf/07_02_06_deputat.pdf. Accessed 31 July 2018
Hasan, H.M., Honarvar, F.: An investigation of the relationship between subsurface and head waves by finite element modeling. Nondestruct. Test. Eval. 31(4), 319–330 (2016)
Chaki, S., Ke, W., Demouveau, H.: Numerical and experimental analysis of the critically refracted longitudinal beam. Ultrasonics 53(1), 65–69 (2013)
Stefanidou, M., et al.: Application of acoustic microscopy technique for the assessment of the efficacy of water repellent treatment in fired bricks. In: 15th Euroseminar on Microscopy Applied to Building Materials (EMABM), pp. 16–19 (2015).
Miura, K., Yamamoto, S.: A scanning acoustic microscope discriminates cancer cells in fluid. Sci. Rep. 5, 15243 (2015)
Liang, H.D., Blomley, M.J.K.: The role of ultrasound in molecular imaging. Br. J. Radiol. 76, S140–S150 (2014)
Okos Solutions, LLC (2020). https://www.okos.com/ndt-systems. Accessed 31 July 2018.
Acknowledgements
This paper is part of the Project “The criteria and methodology for determining the quality of rotating arc welded joints”, co-financed by the National Centre for Research and Development (NCBR, Poland) under the 3rd Program of Applied Research.
Author information
Authors and Affiliations
Corresponding author
Additional information
Publisher's Note
Springer Nature remains neutral with regard to jurisdictional claims in published maps and institutional affiliations.
Rights and permissions
Open Access This article is licensed under a Creative Commons Attribution 4.0 International License, which permits use, sharing, adaptation, distribution and reproduction in any medium or format, as long as you give appropriate credit to the original author(s) and the source, provide a link to the Creative Commons licence, and indicate if changes were made. The images or other third party material in this article are included in the article's Creative Commons licence, unless indicated otherwise in a credit line to the material. If material is not included in the article's Creative Commons licence and your intended use is not permitted by statutory regulation or exceeds the permitted use, you will need to obtain permission directly from the copyright holder. To view a copy of this licence, visit http://creativecommons.org/licenses/by/4.0/.
About this article

Cite this article
Kustroń, P., Piwowarczyk, T., Korzeniowski, M. et al. The Detectability of Welding Defects in MIAB Welded Thin-Walled Tubular Components by Immersion Ultrasonic Technique. J Nondestruct Eval 39, 42 (2020). https://doi.org/10.1007/s10921-020-00684-3
Received:
Accepted:
Published:
DOI: https://doi.org/10.1007/s10921-020-00684-3