


Abstract
We examine a strong, coherent, highly impulsive acoustic transient radiated into the solar interior by the flare SOL20110730T02:04-M9.3. The acoustic spectrum of this transient extends out to 10 mHz. The fine diffraction limit of this high-frequency component of the flare acoustic transient allows us to discriminate different source components in operation during the flare. Acoustic-source power density maps of the 10 mHz component show sources that are compact to within the now 760 km diffraction limit of local helioseismic diagnostics for this frequency. One of the acoustic sources found is bifurcated across a sharp penumbral magnetic boundary, the component in the stronger magnetic field temporally lagging its partner. The facility to discriminate this level of acoustic-source detail could open the door to a long sought after understanding of the mechanics of transient emission from solar flares, still a mystery two decades after its discovery. It also suggests that helioseismic observations of higher cadence and spatial resolution could reveal coherent acoustic emission at even higher frequencies, with proportionately further potential benefits to solar seismology and its growing domain of applications.
Export citation and abstract BibTeX RIS
1. Introduction
Helioseismology of acoustically active flares has told us a lot about flares, flare acoustics, solar acoustics in general, and how we can study a broad range of solar phenomena that have acoustic manifestations (Kosovichev & Zharkova 1998, 1999; Zharkova & Kosovichev 1998; Donea et al. 1999a; Donea & Lindsey 2005; Besliu-Ionescu et al. 2007; Martínez-Oliveros et al. 2007, 2008a, 2008b; Martínez-Oliveros & Donea 2009; Wang & Liu 2010; Zharkov et al. 2011). It has also imposed upon us some remarkably thorny puzzles. After some two decades since its discovery, the basic mechanics of transient seismic emission from flares remains a great mystery. Why is it, for example, that the great preponderance of regions encompassed by photospheric and chromospheric Doppler and magnetic and intensity transients in the outer solar atmosphere during flares are acoustically quiet? The significant sources of acoustic transients are confined to within relatively compact regions, usually sunspot penumbrae or umbral boundaries. Do Lorentz-force transients in the low photosphere have a role in driving transient acoustic emission in flares? What about heating of the outer atmosphere overlying the source regions?
In addition to the insight it offers us into the mechanics of flares, flare acoustic emission has opened a fertile domain in local helioseismology at large (Braun et al. 1998; Lindsey & Braun 1998, 2004; Donea et al. 1999a, 1999b; Lindsey & Donea 2008) for gauging the veracity and quality of our local seismic diagnostics. The sources of flare acoustic transients are the most conspicuously both local and impulsive (i.e., local in time) of any seismic mechanism so far known to operate in the solar environment (e.g., Donea et al. 1999a; Donea & Lindsey 2005; Moradi et al. 2007).
In this study, we apply computational helioseismic holography (Braun et al. 1998; Lindsey & Braun 1998, 2004; Gizon et al. 2018) to surface Doppler ripples observed to travel outward from the source region from an acoustically active flare. Technical details of the algorithm we use are described at some length by Lindsey & Braun (2000). The specific form of the diagnostic for this study is subjacent-vantage acoustic-power holography of surface or near-surface acoustic sources (see Section 4 of Lindsey & Braun 2000). The algorithm is applied to the surface signatures of waves understood to have been injected into the Sun's interior through its surface, and refracted thence back to its surface into an annular pupil surrounding the source region. The algorithm coherently extrapolates the acoustic field in the pupil back through the underlying solar interior and thence back up to the source region to deliver a map of the source-power density of the extrapolation thereat (Lindsey & Braun 2000, 2005a, 2005b; Lindsey et al. 2011, 2013). In this study, we quantify a local source by its acoustic power, i.e., its square amplitude integrated over the source region—or, equivalently, over the pupil. Hence, we call the square amplitude itself the source density of the disturbance that subsequently appears in the pupil.5
Zharkov et al. (2011) found transient seismic emission from the X2.2-class flare of 2011 February 15 with a strong compact source extending to 10 mHz. This was a very unusual seismically active flare in many respects (Kosovichev 2011; Alvarado-Gómez et al. 2012), and for some years remained the only instance known to us of a conspicuous compact acoustic source pushing the Nyquist limit of Solar Dynamics Observatory (SDO)/Helioseismic and Magnetic Imager (HMI) helioseismic observations. More recently, Buitrago-Casas et al. (2015) have made a survey of transient acoustic emission from weaker, mostly M-class flares, noting that even in X-class flares the compact source regions of transient acoustic emission can be fully encompassed by transient visible and EUV source regions in M- and C-class flares.6 Buitrago-Casas et al. (2015) reason that the lower probability of significant acoustic emission from M- and C-class flares could be offset by their far more frequent occurrence, giving us a considerably greater database of powerful acoustic transients. This endeavor has been quite fruitful, approximately doubling our database, and giving us some acoustic transients that are exceptional. One of these, SOL2011-07-30T02:04-M9.3, hosted by NOAA AR 11261, is the subject of this study. This flare is also the subject of a study by Sharykin & Kosovichev (2015), who independently discovered its unusually strong acoustic emission.
SOL2011-07-30T02:04-M9.3 is the second flare we know of that has released transient acoustic emission with highly compact sources whose spectra extend to ∼10 mHz. This is our first indication that transient acoustic sources extending to HMI's Nyquist limit may not be overly exceptional. Indeed, it will presently be seen that this single flare released acoustic transient emission from three distinct acoustic sources in the 10 mHz spectrum, all close to the diffraction limit of 10 mHz seismic holography in compactness.
These ultra-impulsive sources are crucial for one overriding reason: they offer unsurpassed spatial resolution of themselves, in accordance with standard wave optics, hence into the mechanism that is releasing this acoustic energy.
2. The Observations
The flare SOL2011-07-30T02:04M9.3 was hosted by NOAA AR 11621, located approximately at N14W35. We used Doppler-helioseismic observations of AR 11621 for a 4 hr period encompassing the flare by the HMI on board the SDO (Schou et al. 2012). SDO/HMI provides Doppler maps of the Sun's surface in the Fe i line at 6173.34 Å, with a pixel spacing of ∼0 5 and a cadence of 45 s. We applied computational seismic holography to HMI observations of the surface Doppler ripples that emanated from the acoustic-source region up to 1 hr after the impulsive phase of the flare. Figure 1 shows the resulting source-density maps in three passbands.7
Panel (a) shows white-light emission emanating from the flaring region. The subsequent panels, (b), (c), and (d), show the source density of acoustic emission in 2 mHz bands centered at 6, 8, and 10 mHz, respectively. In this instance, no significant excess acoustic emission was seen beneath about 5 mHz. However, conspicuous signatures appear in the 6, 8 and 10 mHz bands shown in panels (b), (c) and (d), respectively.
5 and a cadence of 45 s. We applied computational seismic holography to HMI observations of the surface Doppler ripples that emanated from the acoustic-source region up to 1 hr after the impulsive phase of the flare. Figure 1 shows the resulting source-density maps in three passbands.7
Panel (a) shows white-light emission emanating from the flaring region. The subsequent panels, (b), (c), and (d), show the source density of acoustic emission in 2 mHz bands centered at 6, 8, and 10 mHz, respectively. In this instance, no significant excess acoustic emission was seen beneath about 5 mHz. However, conspicuous signatures appear in the 6, 8 and 10 mHz bands shown in panels (b), (c) and (d), respectively.
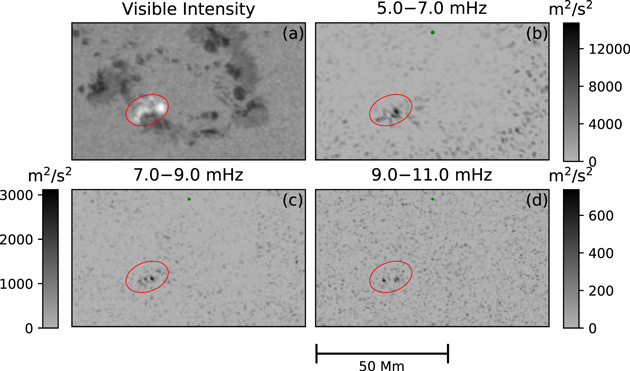
Figure 1. Source density maps of the acoustic transient released by the flare SOL2011-07-30T02:04-M9.3 at 02:04 UTC on 2011 July 30. Panel (a) shows the HMI continuum intensity at the onset of the flare with the transient component enhanced by a factor of 5.0 in the elliptical region. Panels (b), (c), and (d) are source density maps of the acoustic transient released into the solar interior in 2 mHz bands centered at 6, 8, and 10 mHz, respectively. Units of source density are m2 s−2. Green filled circles near the tops of panels (b), (c), and (d) indicate diffraction limits of our diagnostic in its responses to artificial point sources at the base of the photosphere radiating at frequencies of 6, 8, and 10 mHz, respectively, from that horizontal location.
Download figure:
Standard image High-resolution imageAs the frequency increases from 6 mHz (Figure 1(b)) to 10 mHz (Figure 1(d)), the source distributions are seen to become sharper, as the spatial resolution improves. With Figure 2 we focus in on the 10 mHz source density (upper right), comparing it with the visible-continuum intensity (upper left) and the line-of-sight (los) magnetic field (lower left), both preflare. At first glance, the 10 mHz source density map shows two conspicuous components, the greater one, source A, approximately 8 Mm west of the weaker one, source B. Source B lies on the eastern (left) boundary of an umbra of northern magnetic polarity. Source A lies in the penumbra on the other side of said umbra, between it and its δ counterpart of southern magnetic polarity approximately 8 Mm to its west (right). Source A is now clearly seen to be a composite of two kernels, ASE and ANW, whose centers are separated by ∼2 Mm in the approximately  direction. These straddle a sharp magnetic boundary within the penumbra separating an inner S–E region of up to 1200 Gauss los, from a surrounding N–W region of ∼750 Gauss los.

Figure 2. 10 mHz source density distribution rendered in Figure 1(d) (panel (b)) is compared with cospatial preflare continuum (panel (a)) with the mean local quiet Sun ("QS") scaled to unity, the los magnetic field (panel (c)), and the local 10 mHz acoustic power (panel (d)). Transient source B (panel (b)) sits on the northeastern boundary of the north-polar umbra; kernels ASE and ANW of source A straddle a sharp magnetic boundary in the penumbra separating the northern and southern magnetic umbrae, across which the los magnetic field increases from ∼900 Gauss (kernel ASE) to ∼1150 Gauss los (ANW). Los magnetic induction (panel (c)) is rendered in kGauss. The mean local acoustic power is highly saturated in panel (d), its greatest value being 130,000 m2 s−2. Green filled circle near top of panel (b) indicates the diffraction limit of our diagnostic in its response to an artificial 10 mHz point source at the base of the photosphere at that horizontal location.
Download figure:
Standard image High-resolution imageBecause flares generally complicate conditions in the outer atmospheres of active regions, we cannot regard either the los Doppler or magnetic signatures to be reliable in quantitative detail in the impulsive phase (Martínez Oliveros et al. 2014). However, we understand that transient Doppler and magnetic signatures are a reliable indicator of a significant local transient departure from the preflare Doppler or magnetic disposition of the locality, even in the impulsive phase. Figure 3 shows preflare and subsequent transient los Doppler maps of the acoustic-source region in the early impulsive phase. Panel (a) shows the raw-preflare signature, with the succeeding panels showing, at 45 s intervals, the transient component, i.e., the difference between the respective raw and the raw-preflare Doppler maps. Panel (c) shows a transient Doppler anomaly of positive sign (redshift) infringing into the domain of kernel ANW (see Figure 2(b) for kernel identifications), followed directly (panel (d)) by transient anomalies of both positive and negative sign appearing in the domains of kernels ASE and ANW. Figure 3(c) shows a strong Doppler anomaly of negative sign appearing in the center of source B. The red arrows in Figures 3(b)–(d) mark the location of the strongest Doppler transient. Sharykin & Kosovichev (2015) propose to associate such a Doppler feature with what they recognize as the general seismic source of the flare. However, this location is immaculately devoid of any significant indication in panels (b)–(d) of a source of acoustic emission in any part of the acoustic spectrum.
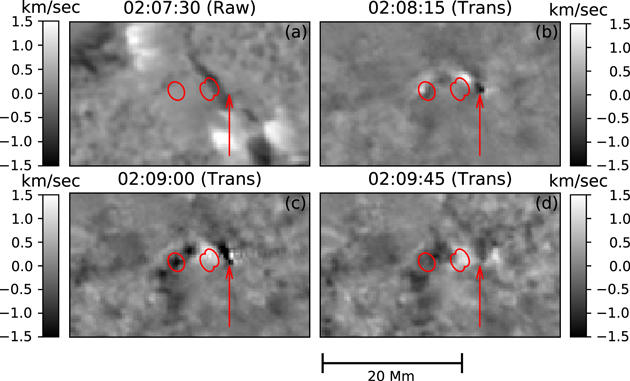
Figure 3. Temporal progression of the los Doppler transient during the impulsive phase of the flare. Panel (a) shows the raw-preflare Doppler signature. Panels (b), (c), and (d) show the transient component of the succeeding Doppler signatures at 45 s intervals. Closed curves mark the locations of the acoustic sources mapped in Figure 2(b). Positive values attached to color bars indicate redshift, i.e., velocities with los components away from the observer, in units of km s−1.
Download figure:
Standard image High-resolution imageReturning to Figure 2, panel (d) maps the local acoustic power of photospheric Doppler disturbances in the (10 ± 1) mHz band, same as that of the source density mapped in panel (b). The domain of source B is seen to coincide fairly closely with a local Doppler disturbance, suggesting, notwithstanding an imperfect alignment, that this is related to the acoustic transient released from that general locality. However, the domain of source A is devoid of any conspicuous local-acoustic-power anomaly approaching the morphology seen in panel (d).
The ability to resolve the individual kernels of source A on either side of the sharp magnetic boundary they straddle reveals remarkable differences between the parts of the emission emanating from regions of weaker and stronger los magnetic field. Figure 4, for example, reveals a significant difference between the temporal progression of the two kernels that comprise the western source. This is somewhat subtle: while confinement of the spectrum to just the (10 ± 1) mHz band allows us to clearly discriminate high-frequency signatures that would otherwise be overwhelmed by more powerful emission in the adjoining lower-frequency spectrum, the restriction of the spectrum to a 2 mHz bandpass limits the temporal resolution to 1/(2 mHz) = 500 s (8.3 minutes). This, somewhat ironically, obscures some of the transient nature of the acoustic radiation released. Figure 4 nevertheless shows that the temporal profile of kernel ANW leads that of kernel ASE by ∼200 s.

Figure 4. Temporal progression of the source density of the acoustic transient released by the flare SOL20110730T02:04-M9.3 in the 9.0–11.0 mHz spectrum, showing that emission from the northwestern kernel,  , of the composite western acoustic source significantly precedes (see panel (a)) that from the south-eastern kernel, ASE (see panel (c)). Acoustic emission from the single-kernel far-eastern source, B, appears to peak about halfway between the peaks of the individual kernels of the composite western source.
Download figure:
Standard image High-resolution image
Emission from source B peaks approximately halfway between the temporal peaks of kernels ASE and ANW. The relative timing of the acoustic-source density signatures is more of an indication of when the acoustic emission from the respective sources arrived into the outlying pupil (see the footnote in Section 2) of the seismic diagnostic than when it necessarily emanated from its source. Emanation of the transient from a greater depth, such as from a magnetically depressed photosphere (e.g., a Wilson depression), for example, might shorten the travel time from source to pupil, expediting its temporal profile in Figure 4.
3. Discussion
This study identifies the existence of strong coherent acoustic radiation extending out to ∼10 mHz radiated into the solar interior by the solar flare SOL20110730T02:04-M9.3. The observed acoustic sources are similar in nature to those reported by Zharkov et al. (2011, 2013). This avails us with spatial resolution that can discriminate the different morphologies of source distributions of transient seismic emission from flares from those of surface Doppler, magnetic, and intensity transients. In the special instance of SOL20110730T02:04-M9.3, we find a compact acoustic source straddling a magnetic boundary whose acoustic excitation on one side is sharply different from that on the other: Waves from the source in the los magnetically weaker region significantly precede those of the stronger one.
One has to suspect that the sharp magnetic boundary upon which transient source A sits has some dynamical relationship with its bifurcation into two kernels, ASE and ANW. It may likewise have a dynamical connection to emission from kernel ASE leading that from kernel ASE by ∼200 s. It needs to be kept in mind that, with AR 11261's location 35° from the center of the solar disk, the region of greater los magnetic field need not be the region of greater magnetic field strength, nor the region of greater magnetic depression if there is one. The region in which kernel ANE sits appears to be the strong neutral line we expect to separate the opposing umbrae on either side of it. The detailed configuration of this region is an important issue we leave open in this study.
The 10 mHz component of the acoustic transient released by SOL20110730T02:04-M9.3 reinforces some very mysterious qualities of other acoustic transients (e.g., Alvarado-Gómez et al. 2012). Of all of the regions that show strong transient perturbations in velocity, magnetic field, and apparent heating, only from highly select relatively compact regions is significant transient acoustic energy released into the solar interior. Moreover, from some of the select regions from which strong acoustic energy is released, the signatures of transient perturbations in the outer atmosphere are remarkably weak, as they are for kernel ANW and possibly ASE in SOL20110730T02:04-M9.3. While the local acoustic power in the domain of ANW is marginally sufficient to drive the acoustic flux released from it if the entirety of it is transmitted into the solar interior—in just the source region and nowhere else—its morphology remains radically incongruent to that of kernels ASE and ANW of source A. This will be discouraging to hypotheses that propose to model transient acoustic sources as acoustic disturbances generated in the Sun's outer atmosphere that are simply transmitted downward through the source photosphere by the rules of linear acoustics. This is based on an understanding that the spectrum of the disturbances that arrived at length in the outlying pupil were simply inherited from that which was injected into the solar interior through the photosphere at the source location.
The existence of transient acoustic sources with spectra extending to 10 mHz opens multiple prospects in flare seismology for further development of the 6–10 mHz acoustic spectrum for applications in flare seismology, whereby we propose to enjoy a spatial resolution, that is now ∼760 km, which in area is nearly three times finer than what we have had at the familiar 6 mHz. The existence and detectability of strong, compact, coherent acoustic sources out to 10 mHz opens the prospect that 10 mHz is not the limit of clearly detectable seismic emission, which, if detected, would open further benefits to flare seismology. 10 mHz presently presses the Nyquist limit (11.1 mHz) of HMI helioseismic observations, with their 45 s cadence. Extension of acoustic diagnostics beyond this is realistically practical only with an instrument with a higher cadence than HMI. To take proper advantage of this will require a proportionately finer spatial resolution. For example, by halving the cadence, to 22.5 s, we could enjoy a diffraction limit of ∼380 km. To secure this diffraction limit would entail a pixel spacing of ∼190 km, approximately doubling HMI's spatial resolution. This would quadruple the number of pixels needed to cover the entire solar disk. Of course, a great deal of flare seismology on M- and C-class flares can be accomplished with much less than full coverage of the solar disk.
The essential purpose of this Letter, then, is to crack open this ripe, new domain for exploitation we expect to be highly fruitful. Its further pursuit could possibly uncover the basic mechanics that drive a phenomenon that has been highly elusive for two decades, and may tell us something crucial not just about flare acoustic transients but about flare mechanics itself.
We greatly appreciate the insights of Drs. Matthias Rempel and Anna Malanuschenko, and the technical assistance of Dr. Joseph Werne. This study was supported by NASA grants NNX16AG89G and 80NSSC20K0712.
Footnotes
- 5
In the terminology of Lindsey & Braun (2000), what we call the source density here is called the coherent acoustic egression power.
- 6
- 7
The annular pupil surrounding each pixel in the source density map extends from an inner radius of 7 Mm about said pixel to an outer radius of 84 Mm (see Figure 3 of Lindsey & Braun 2000).