

Abstract
An accurate knowledge of in vivo proton dose distribution is key to fully utilizing the potential advantages of proton therapy. Two representative indirect methods for in vivo range verification, namely, prompt gamma (PG) imaging and positron emission tomography (PET), are available. This study proposes a PG-PET system that combines the advantages of these two methods and presents detector geometry and background reduction techniques optimized for the PG-PET system. The characteristics of the secondary radiations emitted by a water phantom by interaction with a 150 MeV proton beam were analysed using Geant4.10.00, and the 2-D PG distributions were obtained and assessed for different detector geometries. In addition, the energy window (EW), depth-of-interaction (DOI), and time-of-flight (TOF) techniques are proposed as the background reduction techniques. To evaluate the performance of the PG-PET system, the 3-D dose distribution in the water phantom caused by two proton beams of energies 80 MeV and 100 MeV was verified using 16 optimal detectors. The thickness of the parallel-hole tungsten collimator of pitch 8 mm and width 7 mm was determined as 200 mm, and that of the GAGG scintillator was determined as 30 mm, by an optimization study. Further, 3–7 MeV and 2–7 MeV were obtained as the optimal EWs when the DOI and both the DOI and TOF techniques were applied for data processing, respectively; the detector performances were improved by about 38% and 167%, respectively, compared with that when applying only the 3–5 MeV EW. In this study, we confirmed that the PG distribution can be obtained by simply combining the 2-D parallel hole collimator and the PET detector module. In the future, we will develop an accurate 3-D dose evaluation technique using deep learning algorithms based on the image sets of dose, PG, and PET distributions for various proton energies.
Export citation and abstract BibTeX RIS
1. Introduction
Present radiation therapy techniques utilize photon beams to deliver high doses to tumour targets using various radiation field sizes and beam directions to improve the target dose conformity (Otto 2008, Choi et al 2019). However, they deliver the dose to an extensive region of normal tissue; thus, a key concern caused by such techniques is a second malignancy or other undesirable late normal tissue effects after radiation treatment, especially in paediatric patients (Miralbell et al 2002, Levin et al 2005). Radiotherapy utilizing protons has the potential benefit with respect to normal tissue sparing because of its superior dose distribution characteristics—the lower dose in the entrance channel, and the steep increase and fall-off towards the end of their range in the so-called Bragg peak—compared with that utilizing photons (Wilson 1946). However, those characteristics can cause unfavourable consequences; the uncertainties over determining the proton range may cause adverse effects on the actual dose distribution because of the steep dose gradient at the distal edge of the Bragg peak (Schlegel et al 2006, Knopf and Lomax 2013). Therefore, a treatment plan using a single-field is rarely performed even though a conformal dose distribution can be realized theoretically. Although the intensity-modulated proton therapy or a technique that patches the single-field lateral and distal fall-offs can be employed to eliminate such risks; which are still highly sensitive to range errors (Albertini et al 2010), and can deliver high dose to normal tissues. Therefore, an accurate knowledge of in vivo proton dose distribution is very important to improve the treatment quality.
For in vivo range verification, many research teams worldwide have studied the various methods such as the Compton camera, prompt gamma ray (PG) timing, PG imaging, and positron emission tomography (PET). The Compton camera, PG timing, and PG imaging techniques measure gamma rays of 2–15 MeV emitted by excited target nuclei. These techniques are highly desired because the PG has strong relationship with the actual dose. However, when the proton beam is on, the detector is severely disturbed by background neutrons and stray gammas, thus necessitating a sophisticated detector.
The Compton camera (Everett et al 1977) consisting of multiple position-sensitive detectors as an absorber and several scatterers calculates an emission position of secondary radiations by tracking the incident angle of radiation from the coincidence events of both absorber and scatterers. This method requires high-performance detectors regarding spatial, time and energy resolution and a clinical application of which is still challenging because of its technical complexity, low coincident efficiency, and high radiation background.
The PG timing technique (Golnik et al 2014) discriminates against the proton energy by measuring the time structure of PG using a monolithic detector with excellent timing resolution and no collimation and analysing the bunch time spread. This technique has advantages for constructing the detection system with low cost and compact size; however, it is not applicable at all clinical accelerators because the time spectra of the PG are quite sensitive to not only the time resolution of the detector but also the time width of the accelerated proton bunches.
The PG imaging technique measures the PG emission distribution in a right angle to the beam track using a multi-array detector; we focused on this technique in this study. Since the first proposition of the PG imaging technique by (Min et al 2006) for proton range verification, various PG measurement systems have been studied by the researchers to develop a clinically suitable detector system (Krimmer et al 2018). (Richter et al 2016) first reported the clinical application of a knife-edge camera to verify the proton range regarding head and neck tumours. Then, a second prototype of the knife-edge camera was tested for the pencil beam scanning treatment mode in Philadelphia (Xie et al 2017). However, this system is sensitive to the slit position and has limitations in obtaining a clear fall-off region of the PG distribution. A comparison of the performances of the knife-edge and multi-slit collimators indicated that the multi-slit collimator more clearly measures the fall-off region of the PG distribution than the knife-edge collimator when several background reduction techniques such as energy window (EW) and time-of-flight (TOF) are applied to the PG detection system (Smeets et al 2016, Lin et al 2017, Lopes et al 2018).
The PET measures the coincident gamma rays (CG) of 511 keV resulting from the annihilation of emitted positrons by electrons. Positron emitters (PE) such as 15O or 11C are generated in the medium after the medium interacts with the proton beam, and have decay periods of 122 s and 20.4 min, respectively. To verify the dose distribution, the PET method requires the ability to quickly start the measurement for a short time, to be less sensitive to blurring and biological distortion caused by washout, wash-in, and transportation of PE. Several studies have been conducted on PET systems installed near the tables in treatment rooms with either dual-head detection system (Enghardt et al 2004, Nishio et al 2010, Marafini et al 2015, Lopes et al 2016, Ferrero et al 2018) or more sophisticated geometry (Tashima et al 2012, 2016). A comparison of the performances of the PG and PET imaging methods based on Monte Carlo (MC) simulations by Moteabbed et al 2011) indicated that the efficiency of an in-room PET system is greatly higher than that of the prototype of the PG detection system; however, the fall-off region of PET method was less similar to the proton dose fall-off region.
In this study, we propose a PG-PET system that combines the advantages of these two methods. During proton beam irradiation, the PG-PET system measures the PG distribution using multiple detector modules comprising a 2-D parallel-hole collimator and a pixelated scintillator-based detector positioned at various angles; after the beam irradiation is turned off, the PG-PET system immediately starts measuring the PE distribution without the collimators by individually moving the collimators and the detectors. The 3-D distributions of the PG and PE can then be obtained; further, we intend to verify the in vivo 3-D dose distribution as accurately as possible by comparing the reconstructed PG and PE distributions with those calculated by MC simulations (Moteabbed et al 2011).
2. Materials and methods
2.1. Optimizing the detector geometry
2.1.1. Monte Carlo simulation condition.
To measure the CG from the production of positron emission isotopes, a detector module does not need a collimator, but needs only scintillators, photosensors, and a data-acquisition (DAQ) system suitable for a 511 keV gamma measurement, and 2 detector modules facing each other around the sources. However, measuring the PG is difficult, because the emission of the PG from excited target nuclei is in a random direction, and its energy is very high, usually in the order of over 4 MeV; therefore, an optimally designed collimator and a scintillator are necessary. The collimator directs the entering PG to a specific position of scintillator along with background noise reduction.
The MC simulation was employed in the detector optimization study to save time and cost. The Geometry and Tracking 4 (Geant4) version 10.00.p02 was used in this study because it is advantageous in developing an object-oriented simulation program that suits the user's purpose, and in easily using various physics models. Figure 1 shows the schematic of the Geant4 simulation to evaluate the detector performance based on various detector geometries. A 150 MeV proton beam was irradiated at the centre of a 200 × 200 × 300 mm3 water phantom. Proton beam energies of 60–220 MeV are generally used in clinics to conformally deliver doses to the tumour positioned at various depths. The 150 MeV proton beam (15.78 g cm−2) was chosen as representative energy for the optimization study. If the optimization of the collimator is biased to a large amount of background radiation caused by using a high energy proton beam, the detector sensitivity would decreased, thereby the PG measurement time would increase. For the opposite case, however, the capability of discrimination of the PG distribution for the high energy proton beam would decrease because of the high background noise level. After the proton beam and the water phantom interact, various radiations were emitted from the water phantom in perpendicular to the beam direction and all tracks of them were analysed in the detector module. The detector module was positioned at a depth of 150 mm in the phantom and 50 mm away from the phantom surface to realize the Bragg peak at the centre of the detector (range of a 150 MeV proton beam in water is 157.8 mm). For an efficient simulation, the phase space files on the surface of the collimator were recorded and reused dozens of times. A phase space file stores the information of the radiation type, position, beam direction, time, and kinetic energy in a specified area.
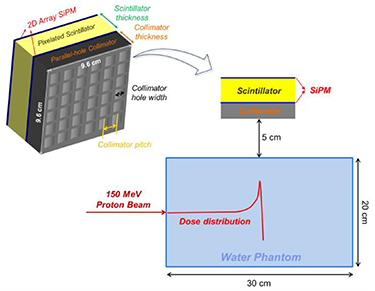
Figure 1. Schematic of the Geant4 simulation for detector optimization.
Download figure:
Standard image High-resolution imageThe detector module consists of a parallel-hole collimator, a pixelated scintillator, and photosensors. Tungsten, which has a density of 19.25 g cm−3, was chosen as the collimator material, instead of lead (11.34 g cm−3) because a thin septum between two holes is beneficial for the image quality, given the same shielding capability. The field-of-view (FOV) of the detector was 96 × 96 mm2 and the detection performance of the PG distribution was evaluated by changing the geometrical parameters of the collimator and the scintillator; these paramaters are, namely, pitch size between two square-shaped holes, hole width, and thickness of the collimator, and the pitch size between two pixels, thickness, and material of the scintillator. After determining the geometry of the detector module for the PG measurement, the geometry of the pixelated scintillator was slightly modified based on the CG measurement. Barium sulphate (BaSO4) reflector was chosen as the reflector in the scintillator array because its transferring performance of optical photons generated in the scintillator to the photosensor is better than that of Teflon tape or the Enhanced Specular Reflector (Kamada et al 2007). Silicon photomultiplier (SiPM) was selected as the photosensor because of its low cost and very high gain (∼106) which is comparable to that of vacuum phototube and higher than that of avalanche photo-diode (Dolgoshein et al 2006). Owing to the dark rate, power dissipation, and optical crosstalk, the size of the SiPM must be as small as 1–3 mm (Dolgoshein et al 2006). Each commercially available SiPM pixel in various sizes was coupled to each scintillator pixel.
For the MC simulation for the optimization study, the following physics list was set in the Geant4:
G4HadronElasticPhysicsHP,
G4EmStandardPhysics_option3,
G4HadronPhysicsQGSP_BIC_HP,
G4EmExtraPhysics,
G4StoppingPhysics,
G4DecayPhysics,
G4IonPhysics.
The range cut value of gamma and electrons was set as 100 μm.
2.1.2. Performance evaluation factors for detector optimization.
For the optimization study, we determined a figure of merit (FOM) to evaluate the performance of the detector module. The first evaluation factor is the background fraction relative to the peak position of the PG distribution. Figure 2 shows the 2-D PG distribution acquired by the detector module and the central profile of the PG distribution. The central profile is similar to the Bragg peak of the proton dose distribution; the capability of discrimination of the peak position in the PG distribution is an important factor in finding the proton range. If the collimation ability of the detector module is low, the background count in deeper regions of the peak increases more than that at the proton range region. We determined the mean count value of the 24 mm rear region (yellow region in figure 2(b)) in the 96 mm FOV of the central profile of the PG distribution as the background count (so-called noise), and the count value of the peak subtracted by the background count as the signal (equation (1)). Then, as shown in equation (1), the capability of discrimination of the peak position was determined as the ratio of signal and noise (SNR).

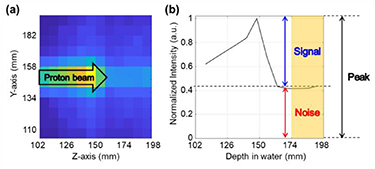
Figure 2. (a) 2-D PG distribution acquired by the detector module and (b) central profile of PG distribution illustrating the elements used in determining the figure of merit.
Download figure:
Standard image High-resolution imageThe second evaluation factor is the sensitivity of the detector module. A great advantage of the PG measurement method for proton range verification is its real-time treatment monitoring capability. The detector sensitivity is a very important factor in realizing real-time monitoring because it is strongly related to the measurement time. The absolute peak count of the PG distribution is closely related to the detector sensitivity, and the FOM was thus determined by considering the SNR and peak count (equation (2)).

2.2. Optimizing the detection data processing techniques
When high energy protons interact with a medium, not only PG and PE but also many background radiations (noise factors) such as neutron, alpha, beta, and scattered gamma rays, which prevent an accurate range verification, are generated in the medium. Compared with the CG measurement, which is performed immediately after the proton beam is turned off, the PG measurement is fairly sensitive to the above-mentioned background radiations because it is performed while the beam is on. Figure 3 shows two different energy spectra that illustrate the impact of the background radiation in the PG measurement. The kinetic energy spectrum of PG (green line in figure 3) and the energy spectrum of the secondary radiations deposited in the 30 mm thick scintillator (red line in figure 3) after interaction between the 150 MeV proton and a medium were analysed in Geant4. The major energies of PG can be easily identified in its kinetic energy spectrum as 4.4 MeV and 5.2 MeV; however, these energies are indistinctive if the background radiations are involved in energy deposition in the scintillator. Therefore, in this study, we present three detection data processing techniques to clearly distinguish the PG distribution: EW, depth of interaction (DOI), and TOF. Moreover, we determined the optimal parameters for data processing with those techniques based on the optimally determined the detector geometry.
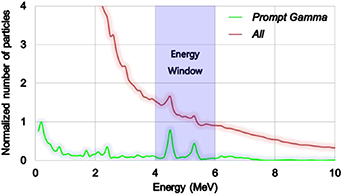
Figure 3. Kinetic energy spectrum of the PG rays entering the scintillator (green line), and deposited energy spectrum in the scintillator by all the secondary radiations generated after 150 MeV protons interact with a medium (red line).
Download figure:
Standard image High-resolution image2.2.1. Energy window.
A summing process of the counts detected for a specific energy range is generally used for plotting a 2-D distribution from the detection data of scintillator pixels. For the deposited energy spectrum shown in figure 3, the PG distribution cannot be distinguished if the summing process is performed for the counts of the entire energy range because of the background radiations. Therefore, performing the summing process of the counts in only a specific energy region of interest (EW) is necessary. Further, we evaluated the FOM of the 2-D PG distribution according to several EWs to determine an optimal EW for an effective discrimination of the PG distribution.
2.2.2. Depth of interaction.
The target energies of PG (4.4 MeV and 5.2 MeV) are greatly higher than that of CG (0.511 MeV); in addition, the probability of fully delivering their energy to each scintillator pixel is relatively low because of its high scattering probability. Consequently, although the PG passing through a collimator hole enters the scintillator pixel corresponding to the hole, it may easily escape from the pixel and deliver a large portion of its energy to another pixel. For example, as illustrated in figure 4, even though 4.4 MeV PG entered the fourth scintillator pixel, there can be a situation that it escapes the fourth pixel and delivers 88% of its energy (3.9 MeV) to the second and third scintillator pixels. In this case, as a conventional method, if we apply 3–7 MeV EW to a DAQ system, the detected counts regarding the deposited energy out of 3–7 MeV range will be ignored in the PG distribution. In other words, among the three events of one 4.4 MeV PG, the detected count regarding the 3.2 MeV deposited energy in the second scintillator pixel can be involved in the PG distribution, which results in a positioning error of the incoming PG. Therefore, we propose DOI technique that can determine the entering position of the PG as the position of the scintillator pixel responding at shallowest depth in the array for the multiple scattered events using a dual-ended readout system in this study. If the DAQ system can accurately detect deposited energy and time of multiple events in a very short time, we can guess the total energy of the primary PG, and the depth of the energy deposition in each scintillator from the ratio of timing or amplitude of the detected signals. After obtaining a 2-D DOI map for every single event, we classify the total energy of the scattered events to the deposited energy in the pixel corresponding to the shallowest DOI and calculate an energy spectrum in each pixel for every event. In this algorithm, errors in determining the entering positions of the PG because of the backscattering probability were ignored. Nevertheless, with this procedure, the PG distribution can be more effectively discriminated against compared to the data processing with only EW technique.
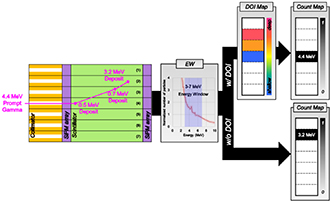
Figure 4. Schematic of the DOI technique to improve the capability of PG discrimination.
Download figure:
Standard image High-resolution image2.2.3. Time of flight.
Figure 5 shows the time spectra of the secondary radiations generated by the interaction of the 150 MeV protons with the water phantom; these spectra were obtained on the surface of the detector module. The proton beams were irradiated 1000 mm away from the surface of the water phantom, and the secondary radiations, including PG, took about 6 ns to reach the detector module. Among these secondary radiations, the PG fluence rapidly increases in the early 1.0 ns period of time, following which it drastically decreases and the neutron flux increases, which greatly influences the detection data. The secondary radiations, excluding PG, are emitted from the water phantom for several microseconds when the clock is reset to zero for each proton irradiation. The TOF technique utilizes the detection data of a certain period of time to reduce the background radiation.
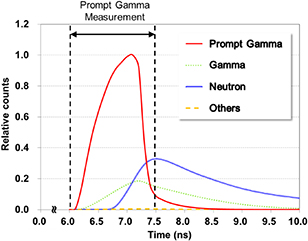
Figure 5. Time spectra of secondary radiations generated by the interaction of the 150 MeV proton beam with the water phantom: PGs (red line), delayed and scattered gammas (green dotted line), neutrons (blue line), and other radiations (yellow dashed line).
Download figure:
Standard image High-resolution image2.3. Performance evaluation of the PG-PET system
After optimizing the detector module, the 3-D proton dose in the water phantom was verified using the PG-PET system, which consists of 16 detector modules. The performances of the PG and PET imaging were assessed by two simulations with 25 MBq point sources isotropically emitting single 4.4 MeV gamma and two 0.511 MeV gammas, respectively. The point sources were placed 2 mm away from the centre of the 100 × 100 × 100 mm3 water phantom on both x-, y-, and z-axis. For the PG and PET imaging, 3–7 MeV EW and 0.4–0.6 MeV EW were set for data processing, respectively, and the data was obtained for 200 s. The distance from the centre of the water phantom to the surface of each detector module was 246.34 mm, which was the same for both detector setups to acquire the PG and PET images. After performance evaluation with a point source, two proton beams of energies 80 MeV and 100 MeV in 10 mm diameter, which are 50 mm apart, were irradiated on the 100 × 100 × 100 mm3 water phantom. Total 1.12 × 10¹⁰ primary protons were irradiated and then, PG emitting from the phantom and PE (11C, 13N, and 15O) generation position in the phantom were recorded in two different files. We assumed that the proton beam was irradiated for 200 s, the PG image was obtained during the beam on, after then the PET image was obtained for 200 s, after 30 s from at the time of the beam off. For the PG imaging, all three detection data processing techniques, 2–7 MeV EW, DOI, and 6.0–6.5 ns time window (TW), were adopted to realize the ideal discrimination of the PG distribution. If a PE generation function is assumed that the amount of the PE linearly increases during the beam is turned on, and it constants after the beam is turned off, the remains of them were estimated by the convolution of the generation function and the decay function of each PE. We assumed that the transformation of the PG-PET system just after the beam off takes about 30 s. Customizable and advanced software for tomographic reconstruction (CASToR) version 2.1, an open-source C++ parallel platform, was employed to reconstruct the 3-D PG and PE distributions (Merlin et al 2018); in addition, the maximum-likelihood expectation maximization (MLEM) algorithm was applied (Shepp and Vardi 1982) as the iterative tomographic reconstruction algorithm in the CASToR program. The information of the detector geometry and the detection data in 16 different angles were reorganized as an input file suitable to the CASToR program.
3. Results
3.1. Determining the optimal parameters for the detector geometry
3.1.1. Collimator pitch.
The PG distributions were obtained and evaluated for the pitch sizes of 4 mm, 6 mm, and 8 mm to optimize the pitch size between two square-shaped holes of the collimator. Simulations were performed for the same geometrical parameters, except the pitch size of the collimator (table 1):
Septal thickness: 2 mm (hole width: 2 mm, 4 mm, and 6 mm),
Collimator thickness: 150 mm
Scintillator pitch: 4 mm, 6 mm, and 8 mm
Scintillator thickness: 50 mm
Scintillator material: Lu1.8Y0.2SiO5 (LYSO)
EW: 3–5 MeV
Table 1. Detailed geometrical conditions for optimizing detector components.
| Collimator | Pitch (mm) | — |
8 | 8 | 8 | 8 | 8 |
| Septal thickness/Hole width (mm) | 2/6 | — | 2/6 | 1/7 | 1/7 | 1/7 | |
| Thickness (mm) | 150 | 150 | — | 200 | 200 | 200 | |
| Scintillator | Pitch (mm) | — |
8 | 8 | — | 4 | 4 |
| Thickness (mm) | 50 | 50 | 50 | 50 | — | 30 | |
| Material | LYSO | LYSO | LYSO | LYSO | LYSO | — | |
| Energy window (MeV) | 3–5 | 3–5 | 3–5 | 3–5 | 3–5 | 3–5 | |
aTarget parameter for optimization. bSame size as the collimator pitch.
These geometrical parameters were selected by considering the commercially available SiPM geometry and based on previous studies on PG measurement (Min et al 2012, Testa et al 2014, Krimmer et al 2015). The results of the performance evaluation of the PG distribution are shown in figure 6(a); the optimal pitch size was determined as 8 mm, which exhibits an improvement in performance by 88% compared with that of 6 mm. If the pitch size of the collimator is less than 8 mm, the fall-off region of the PG distribution cannot be discriminated because the counts at the peak positions of the PG distribution for the pitches 4 mm and 6 mm decrease by 85% and 57%, respectively.
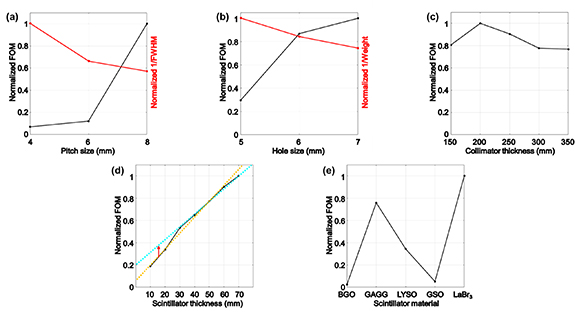
Figure 6. Evaluation of the PG-PET system performance based on different geometrical parameters of the detector module. (a) Collimator pitch; (b) collimator hole width; (c) collimator thickness; (d) scintillator thickness; (e) scintillator material.
Download figure:
Standard image High-resolution image3.1.2. Collimator hole width.
The PG distributions were obtained and evaluated for the hole widths of 5 mm, 6 mm, and 7 mm to optimize the hole width of the collimator. Simulations were performed for the same geometrical parameters, except the hole width of the collimator (table 1):
Collimator pitch: 8 mm
Collimator thickness: 150 mm
Scintillator pitch: 8 mm
Scintillator thickness: 50 mm
Scintillator material: LYSO
EW: 3-5 MeV
The results of the performance evaluation of the PG distribution are shown in figure 6(b); the optimal hole width was determined as 7 mm, which displays the highest performance that is improved by about 13% compared with that of 6 mm. Among the candidates of the hole widths, the 6 mm width displays the best performance for reducing the background of the PG distribution, however, there is no huge difference in all the 3 candidates. Meanwhile, the count at the peak position increases by about 20% corresponding to the increase in hole width by 1 mm.
3.1.3. Collimator thickness.
The PG distributions were obtained and evaluated for the thicknesses 150–350 mm at 50 mm intervals to optimize the collimator thickness. Simulations were performed for the same geometrical parameters, except the thickness of the collimator (table 1):
Collimator pitch: 8 mm
Septal thickness: 2 mm (hole width: 6 mm)
Scintillator pitch: 8 mm
Scintillator thickness: 50 mm
Scintillator material: LYSO
EW: 3-5 MeV
The results of the performance evaluation of the PG distribution are shown in figure 6(c); the optimal thickness was determined as 200 mm, which exhibits an improved performance by about 10% compared with that of 250 mm. As the collimator thickness increases from 150 mm to 350 mm, the background was reduced by about 30% almost linearly. Meanwhile, the count at the peak position was reduced by about 84% exponentially.
3.1.4. Scintillator pitch.
The pitch size between two pixels of the scintillator was determined by considering the spatial resolution of the PE distribution. Generally, a commercial PET scanner has a spatial resolution of less than 3 mm (Hutton et al 2018). If the pitch size of the scintillator is the same as that of the collimator, the spatial resolution degrades compared to that of the commercial PET scanner. Thus, as a feasibility study, we determined the scintillator pitch as 4 mm, half the optimal pitch size of the collimator, as close to the commercial size as possible.
3.1.5. Scintillator thickness.
The PG distributions were obtained and evaluated for the thicknesses 10–70 mm at 10 mm intervals to optimize the scintillator thickness. Simulations were performed for the same geometrical parameters excluding the scintillator thickness (table 1):
Collimator pitch: 8 mm
Collimator thickness: 200 mm
Septal thickness: 1 mm (hole width: 7 mm)
Scintillator pitch: 4 mm
Scintillator material: LYSO
EW: 3-5 MeV
The results of the performance evaluation of the PG distribution are shown in figure 6(d); the optimal thickness was determined as 30 mm, where the increasing gradient of the FOM changes. As the scintillator thickness was increased from 10 mm to 70 mm, the background noise level remained almost constant, however, the count at the peak position increased logarithmically by about five times.
3.1.6. Scintillator material.
To optimize the scintillator material, the PG distributions were obtained and evaluated for five different materials, namely, Bi4Ge3O12 (BGO), Gd3Al2Ga3O12 (GAGG), LYSO, Gd2SiO5 (GSO), and LaBr3. Simulations were performed for the same geometrical parameters, excluding the scintillator material (table 1):
Collimator pitch: 8 mm
Collimator thickness: 200 mm
Septal thickness: 1 mm (hole width: 7 mm)
Scintillator pitch: 4 mm
Scintillator thickness: 30 mm
EW: 3-5 MeV
The results of the performance evaluation of the PG distribution are shown in figure 6(e); the optimal material was determined as GAGG considering the cost and the light yield of the scintillator. To determine the optimal scintillating material, we slightly modified the equation of FOM by multiplying the normalized light yields of scintillators, because the light yield relates to the capability of deposited energy discrimination, which may affect the efficiency of the EW and DOI techniques. The LaBr3 displays the best discriminating performance in the deposited energy in the scintillator because of the high light yield (63 000 photons/MeV) and the fall-off region of the PG distribution owing to the lowest background noise level; therefore, it had the highest FOM, as shown in figure 6(e); however, the count at the peak position was the lowest because of low density (5.06 g cm−3) and the scintillator is quite expensive. Among the 5 scintillators, the GAGG and LYSO scintillators displayed the poorest performance in discriminating the peak with about 1.6 and 1.7 times higher background noise level, respectively, than that of LaBr3. However, they exhibited the best performance in the case of sensitivity with 2.2 and 2.3 times higher counts at the peak position than that of LaBr3 owing to their high densities of 6.63 g cm−3 and 7.3 g cm−3, respectively. The decay time (50–150 ns) of the GAGG scintillator was higher than that of the LYSO (40–44 ns), indicating the high applicability of LYSO to the TOF technique. Meanwhile, the light yield of GAGG (40 000–60 000 photons/MeV) is higher than that of LYSO (33 000 photons/MeV).
3.2. Determining the optimal parameters for the detection data processing techniques
3.2.1. Energy window and depth of interaction.
The 2-D PG distributions were evaluated using the FOM to determine an optimal EW based on 11 different EWs: 1–10 MeV, 1–4 MeV, 1–7 MeV, 2–10 MeV, 2–4 MeV, 2–7 MeV, 3–10 MeV, 3–5 MeV, 3–7 MeV, 4–10 MeV, and 4–7 MeV. As illustrated in figure 7 (black solid line with circle marker), the 3–5 MeV EW was the optimal window with the highest FOM. When the DOI technique is applied to data processing (red solid line with triangle marker in figure 7), the 3–7 MeV EW was obtained as the optimal window, exhibiting an increased performance of about 38% compared with that of the 3–5 MeV window without the DOI technique. Figure 8 illustrates the 2-D PG images of 8 mm pixel size and central profiles on the beam path, and the PG imaging performances for six representative EWs can be seen intuitively.

Figure 7. Evaluation of the PG-PET system performance based on the applied detection data processing techniques: EW (black solid line with circle marker), EW and DOI (red solid line with triangle marker), EW, DOI, and TOF6.0–7.5 ns window (blue solid line with square marker), and EW, DOI, and TOF6.0–6.5 ns window (greed dotted line with cross marker).
Download figure:
Standard image High-resolution image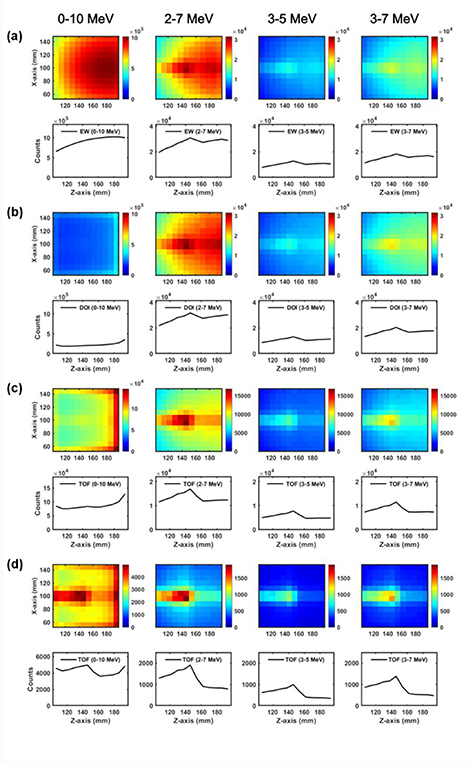
Figure 8. Comparison of the 2-D PG distributions and central profiles on the beam path based on the applied detection data processing techniques: (a) 4 EWs: 0–10 MeV, 2–7 MeV, 3–5 MeV, and 3–7 MeV, (b) 4 EWs and DOI, (c) 4 EWs, DOI and TOF6.0–7.5 ns window, and (d) 4 EWs, DOI and TOF6.0–6.5 ns window.
Download figure:
Standard image High-resolution image3.2.2. Time of flight.
The performance of the TOF technique was evaluated in two different TWs: 6.0–6.5 ns and 6.0–7.5 ns. Regarding the time structure illustrated in figure 5, 18% and 97% PG and 1% and 36% background radiations can be processed in the DAQ system for the 6.0–6.5 ns and 6.0–7.5 ns TWs, respectively. When all the background reduction techniques are applied to data processing with these TWs, the 2–7 MeV EW shows the best performance (figure 7). The shorter TW (6.0–6.5 ns) shows worse FOM by about 22% than that of the 3–7 MeV window for the DOI technique because the statistics of the measured data were lower; however, the SNR was much better owing to the smaller and dominant contributions of the background and PG, respectively. On the other hand, longer TW (6.0–7.5 ns) shows better FOM by about 94% but worse SNR for the opposite reasons. The peak count of the PG distribution for the shorter TW is smaller by about 89% than that for the longer TW; however, the SNR for the shorter TW is higher by about 256%. Therefore, as illustrated in figure 8(d), the discriminating capability of the PG distribution is much better when applying the shorter TW.
3.3. Performance evaluation of the optimized PG-PET system
Figure 9(a) shows the PG-PET system using 16 optimized detector modules; the figures on the left and right show the setup for acquiring the PG and PET images, respectively. When the proton beam is on, the system starts detecting the PG distribution. After the beam is turned off, all the collimators (grey box) move forward toward the beam direction; simultaneously, all the detectors (red box) move toward the centre and meet each other to minimize the loss of information in some angles.
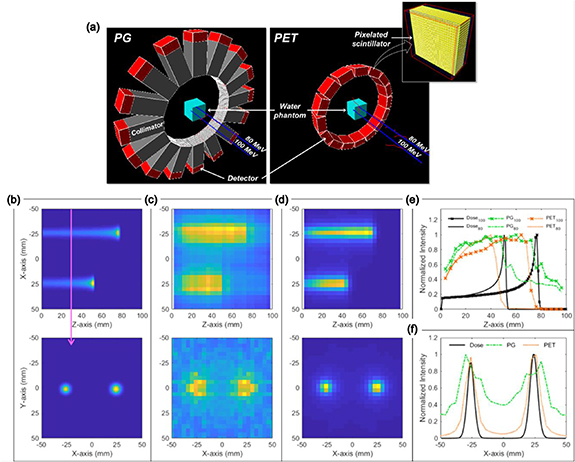
Figure 9. (a) Geant4 simulation model of the PG-PET system, (b) proton dose distributions, (c) PG distribution, (d) PE distribution reconstructed by the MLEM algorithm, (e) comparison of depth-directed image profiles to assess the capability of proton range verification, and (f) comparison of the lateral image profiles to assess the capability of lateral dose distribution verification.
Download figure:
Standard image High-resolution imageThe PG and PET images for point sources were reconstructed using the MLEM algorithm with the condition of one iteration and three iteration subsets. As the results of the performance evaluation of the PG and PET imaging, the spatial resolutions that are full width at half maximums (FWHMs) of the point source images were 11.4 mm and 6.1 mm, respectively. Total 5.0 × 10⁹ single 4.4 MeV gamma and the pair of 511 keV gammas were generated, and about 7.1 × 10⁶ single events and 3.5 × 10⁷ coincidence events (86.8% trues, 12.7% scatters, 0.5% randoms) were detected and used for the image reconstruction.
The PG and PET images illustrated in figure 9 were reconstructed using the MLEM algorithm with the conditions of one iteration and three iteration subsets, and one iteration and four iteration subsets, respectively. The voxel size of the proton dose distribution and the PG and PE distributions were 1 × 1 × 1 mm3 and 4 × 4 × 4 mm3, respectively. The XY planes of them are the planes at the depth of 28 mm (indicated by pink arrow). As shown in figure 9(e), the depth-directed image profiles were obtained at the central positions of those beams. If the proton ranges were assessed as 90% intensity in the distal falloff for three different images, the ranges of 80 MeV and 100 MeV proton beams were 51.5 mm, 48.2 mm, and 41.2 mm, and, 76.7 mm, 72.3 mm, and 68.0 mm, in dose, PG, and PE distributions, respectively. In the lateral image profiles shown in figure 9(f), if the beam sizes were assessed as the width of the FWHMs of the two peaks, the sizes of 80 MeV and 100 MeV proton beams were 7.2 mm, 19.3 mm, and 10.6 mm, and 6.4 mm, 16.5 mm, and 9.7 mm in dose, PG, and PE distributions, respectively.
4. Discussion
Just like the PG distribution obtained without any background reduction technique, if the sensitivity for the PG detection decreases as the pitch size is getting smaller, the image intensity in deeper regions of the PG distribution is emphasized, thus, the fall-off region of the PG distribution cannot be discriminated. The simulations were not performed for large pitch sizes because the spatial resolution of the 2-D distribution is an important factor for verifying the 3-D proton dose distribution. As illustrated in figure 6(a), the inverse values of FWHM of an image profile of a point source decrease with the increase in size of the collimator pitch. Among other candidates of pitch sizes, we determined the optimal pitch size of the collimator as 8 mm based on the overall dimension of the detector corresponding to the first and smallest size available for discriminating the fall-off region.
A larger hole width is advantageous not only for the FOM but also in reducing the weight of the system; as the hole width increases from 6 mm to 7 mm, the weight decreases from 15.5 kg to 8.3 kg. Further, because the number of collimators increases according to the number of detector modules, and the collimators must be detached from the detector modules to enable the detector setup to measure the PE distribution, the weight of the system is an important factor in system construction.
Similarly to the pitch size and hole width, the sensitivity of the detector strongly affects the optimization of the thickness.
If our system is focused only on PG detection, the optimal scintillator thickness must be 70 mm or higher. However, to measure the PE distribution, a thickness of less than 25 mm is generally recommended because of the light collection efficiency and the collection timing performance (Peng and Levin 2010, Vinke et al 2010, Nakanishi et al 2017). Furthermore, as illustrated in figure 6(d), the increase in the FOM according to the increase in thickness changes at the FOM of thickness 30 mm. Thus, the optimal scintillator thickness was determined as 30 mm.
The five scintillating materials selected in this study possess unique interaction properties with the PG and other various radiations including neutrons. Even though the LaBr3 shows the best performance in discriminating against the PG distribution, we did not select the LaBr3 as the optimal scintillator owing to the low sensitivity and high costs. When considering the detector sensitivity, the GAGG and LYSO scintillators could be the candidates, and we determined the GAGG as the optimal scintillator. This is because the flux of the secondary radiations entering each scintillator pixel will be sufficiently low in the PG measurement setup as following the use of the collimator, thus, the timing performance was relatively less important in selecting the optimal scintillator.
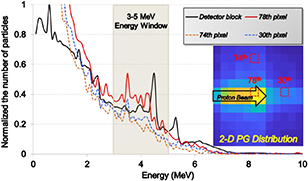
Figure 10 illustrates the comparison of energy spectra deposited in the detector block and in three scintillator pixels (one pixel of them are on proton beam path and two pixels of them are out of beam path). Similarly to the kinetic energy spectrum of figure 3, the energy spectrum of the detector block (black solid line of figure 10) shows two peaks at 4.4 MeV and 5.2 MeV energies; this indicates that the 4.4 MeV and 5.2 MeV PG can be fully absorbed in the scintillator array. If the DOI technique is applied, all the scattered events in a very short time can be processed as a single event with the total energy deposited in the scintillator array; therefore the energy spectrum of each scintillator pixel is quite similar to the spectrum deposited in the detector block of figure 10. However, if the measured data is processed by the conventional data-processing technique, the peaks of the energy spectrum at 4.4 MeV and 5.2 MeV are shifted to 3.4 MeV and 4.1 MeV, respectively, and they become less discriminable. For this reason, in the evaluation results of the detector performance according to the different EW (figure 7), the 3–7 MeV EW and 3–5 MeV EW showed the best performance when the DOI technique is applied and not applied, respectively. With the DOI technique, the PG detection efficiency can be improved; the discriminating capability of the PG distribution and the intensity of the 2-D image in figure 8 increases after applying both the EW and DOI techniques. If the DOI technique is applied to the data processing, the single position of the scintillator pixel responding at the shallowest depth in the array is determined by analysing the interaction positions of the multiple scattered events. If the low energy gamma rays are involved in this algorithm, the positioning errors are unavoidable as illustrated in figures 8(b, c, d) for 0–10 MeV EW.
Figure 10. Comparison of energy spectra deposited in the detector block (black solid line) and three different scintillator pixels (solid line for the pixel on the proton beam path, and two dashed lines for the pixels on the out of the beam path) for optimizing the EW.
Download figure:
Standard image High-resolution image
The TOF technique is to set the TW just like the EW technique to reduce the portion of the background noise. As illustrated in figure 8(c), this technique enables to considerably increase the impact of the detected count distribution by the PG for most of the EWs. After applying the TOF technique, the EW showing the best detector performance was changed to 2–7 MeV. The reason is that the 2–7 MeV EW is wider than the 3–7 MeV EW, and the peak count of the PG distribution increases by including the larger amount of detected counts by the scattered PG in the energy spectra.
The reconstructed PG and PET images showed similar distributions to the proton dose distributions. In the estimation of the proton range, the range of the PG distribution has a better similarity with that of the dose distribution than that of the PE distribution. Comparing the depth-directed image profiles of the PG and dose distributions, the intensity falloff region of the PG image is much broader. Therefore, the proton range in the PG image was differed by 3.3 mm and 4.4 mm for 80 MeV and 100 MeV protons, respectively. For a more accurate estimation, the range in the PG image should be determined by different criteria; if the range in the PG distribution was determined as 55% intensity in the distal falloff, the ranges for both proton energies were almost similar as that of the dose distribution. For determining the proton range more accurately, we are considering the 4-D PG detection technique by fast moving the detector module back and forth during the beam irradiation to improve the spatial resolution to the depth direction. In the estimation of the beam size, the lateral sizes of the PE distribution are similar within a 3.4 mm difference to that of the dose distribution. Because the PET image has a better spatial resolution than the PG image, it has advantages in estimating the shape of the dose distribution. These results indicate that it is possible to verify the in vivo dose distribution by analysing the PG and PET images during and after patient treatment, respectively.
Machine learning (ML) already became a very familiar technique in image processing and is quite useful for making workflow in the clinic more efficiently. For example, the ML plays a key role in improving diagnostic image quality (Kang et al 2017, Wu et al 2017, Han et al 2016, Chen et al 2017, Lee et al 2018), contouring the target (Lustberg et al 2018, Ibragimov and Xing 2017, Guo et al 2016, Fechter et al 2017), and optimizing a treatment plan (Nguyen et al 2019, Shiraishi and Moore 2016, Ziemer et al 2017, Mardani et al 2016, Nguyen et al 2017, Mahmood et al 2018). Regarding for in vivo proton range verification, (Gueth et al 2013) proposed a ML methodology to build classifiers during the planning stage that can then be used during a treatment session and detect deviations in the delivered dose based on the PG detection data. (Tian et al 2018) employed the ML technique to reduce the uncertainties in range prediction from the PG distribution due to tissue heterogeneities and PG detection efficiency. (Liu et al 2019) used recurrent neural network models to assess the dose distribution based on the PE distribution. All these studies have shown the usefulness of the ML technique for in vivo proton range verification. Thus, we expect that the well-trained ML technique based on the MC-based big data sets can be substituted for the conventional complex post-processing of obtained PG and PET images to verify 3-D proton dose distribution. Furthermore, we also expect that the PG-PET system providing two independent physical information regarding the delivered dose in a medium enables for developing the highly accurate ML technique for assessing the 3-D dose distribution.
5. Conclusion
This study investigated the possibility of integrating the PG and PET imaging systems for an in vivo dose verification. The optimization results of the detector demonstrated that the PG distribution can be measured by simply combining the 2-D parallel hole collimator and the PET detector module. This implies that the overall geometry of the PG-PET system is not that complex in fusing two independent systems compared to the other techniques such as Compton camera, and PG-ray timing (Hueso-González et al 2016). The PG distribution was successfully obtained by applying the optimal EW, and additionally, the DOI, and TOF techniques were proposed for more clearly discriminating the PG distribution. In the future, experimental validation of the PG-PET system will be performed using two detector modules. Along with this, we will develop an accurate 3-D dose evaluation technique using deep learning algorithms based on the image sets of dose, PG, and PET distributions acquired using MC method for various proton energies.
Acknowledgments
This research was supported by the Basic Science Research Program through the National Research Foundation of Korea (NRF), which is funded by the Ministry of Science, ICT & Future Planning (NRF‐2017R1A2B4010416), and the Nuclear Safety Research Program through the Korea Foundation Of Nuclear Safety (KoFONS) using the financial resource granted by the Nuclear Safety and Security Commission (NSSC) of the Republic of Korea (No. 1803027).