Article

Characterization of Mineralogy in the Highland Valley Porphyry Cu District Using Hyperspectral Imaging, and Potential Applications

1
Department of Earth and Atmospheric Sciences, University of Alberta, Edmonton, AB T6G 2E3, Canada
2
Teck Resources Limited, Suite 3300, 550 Burrard Street, Vancouver, BC V6C 0B3, Canada
3
Geology Department, Lakehead University, 955 Oliver Road, Thunder Bay, ON P7B 5E1, Canada
4
Mineral Deposit Research Unit, The University of British Columbia, Vancouver, BC V6T 1Z4, Canada
*
Author to whom correspondence should be addressed.
Minerals 2020, 10(5), 473; https://doi.org/10.3390/min10050473
Submission received: 4 April 2020 / Revised: 13 May 2020 / Accepted: 19 May 2020 / Published: 23 May 2020
(This article belongs to the Section Mineral Deposits)

Abstract

:
The Highland Valley Copper (HVC) district in British Columbia, Canada, is host to at least four major porphyry Cu systems: Bethlehem (~209 Ma), and Valley, Lornex, and Highmont (~208 to 207 Ma). High spatial resolution (0.2–1.0 mm/pixel) hyperspectral imagery in the shortwave infrared (SWIR) were acquired on 755 rock samples and 400 m of continuous drill core. Spectral metrics are used to measure the relative abundance of 12 minerals and an additional metric is derived to estimate white mica grain size. In the Valley and Lornex deposits, coarse-grained white mica is associated with mineralization and is detectable up to 4 km away from the deposits. Kaolinite is present within 2 km of the mineralized centers but does not necessarily occur within strongly mineralized intervals. Prehnite is ubiquitous from 4 to 8 km from the deposits. In the Bethlehem deposit, tourmaline and epidote are associated with mineralization. We propose a spectral alteration score based on these proximal hyperspectral SWIR mineralogical patterns to assist explorers in targeting porphyry Cu systems when using drill core, surface rock samples and potentially remote sensing imagery. In a production environment, this metric could serve to facilitate ore-sorting.

1. Introduction

Numerous mineral deposits are formed by hydrothermal fluids that, in addition to potentially concentrating metallic elements, also produce an extensive alteration halo in the surrounding host rocks [1]. In porphyry Cu deposits, mineral zonations occur in generally well understood, approximately concentric patterns [1,2]. If correctly identified as such, changes in mineralogy may be used to vector towards mineralized centers. However, hydrothermal alteration often consists of fine-grained assemblages that are difficult to identify with the unaided eye. Alteration is also often telescoping, and early minerals may be partially or fully overprinted by later, lower temperature assemblages, complicating geological interpretations [1,2]. In practice, in a mineral exploration context, the mineralogical patterns expected from genetic models may be difficult to recognize. Consistently identifying alteration mineralogy requires highly skilled geological expertise, the cutting of, and the analysis of petrographic thin sections, and usually also necessitates the support of more complex instrumentation, such as electron probe micro-analyzers (EPMA) or X-ray diffractometers (XRD). Samples investigated using these methods, however, are limited in physical size to fit the instruments (i.e., thin section or hand samples at best) and may not encompass the entirety of the mineralogical variability present within a given rock. In addition, while providing quality data, these instruments are generally expensive and time consuming to operate. Because of this, datasets are generally limited in volume (i.e., at most a few hundred samples), which only allows defining broad trends in regional alteration patterns.
In contrast, shortwave infrared (SWIR) reflectance spectroscopy is a well-suited method to rapidly identify alteration mineralogy, as no sample preparation is required and data acquisition times are of the order of a few seconds per sample. In hydrated minerals, cation-OH bonds produce characteristic absorption features in the SWIR wavelength range that can be used to identify mineralogy, and in many cases also allow estimating mineral chemistry [3,4]. Additionally, reflectance spectroscopy is not negatively affected by the fine-grained nature of alteration minerals [5]. SWIR data has been used in numerous studies to characterize alteration mineralogy in various geological settings, including several porphyry-Cu deposits. For example, airborne hyperspectral imagery acquired at 3 to 10 m/pixel over a porphyry-skarn-Cu system near Yerington, Nevada, revealed large-scale mineralogical and mineral chemistry patterns associated with mineralization [6]. At the Pebble Cu-Au-Mo porphyry deposit in Alaska, 3900 SWIR point measurements were acquired from a total of 150 drill holes and revealed that Cu mineralization occurs with pyrophyllite and low-wavelength white mica [7]. At the Los Bronces porphyry-Cu deposit, high-resolution hyperspectral imagery (0.2 mm/pixel) was acquired for 43 hand samples, with the aim of discriminating between ore and waste material [8,9]. It was reported that white mica crystallinity and the relative abundances of chlorite and tourmaline could be used to that effect. Near porphyry-Cu deposits at Orange Hill and Bond Creek, Alaska, both airborne (6 m/pixel) and laboratory-based (0.5 mm/pixel) hyperspectral imagery were used to identify and map changes in chlorite and white mica chemistry near mineralized areas [10], offering potential vectors to mineralization.
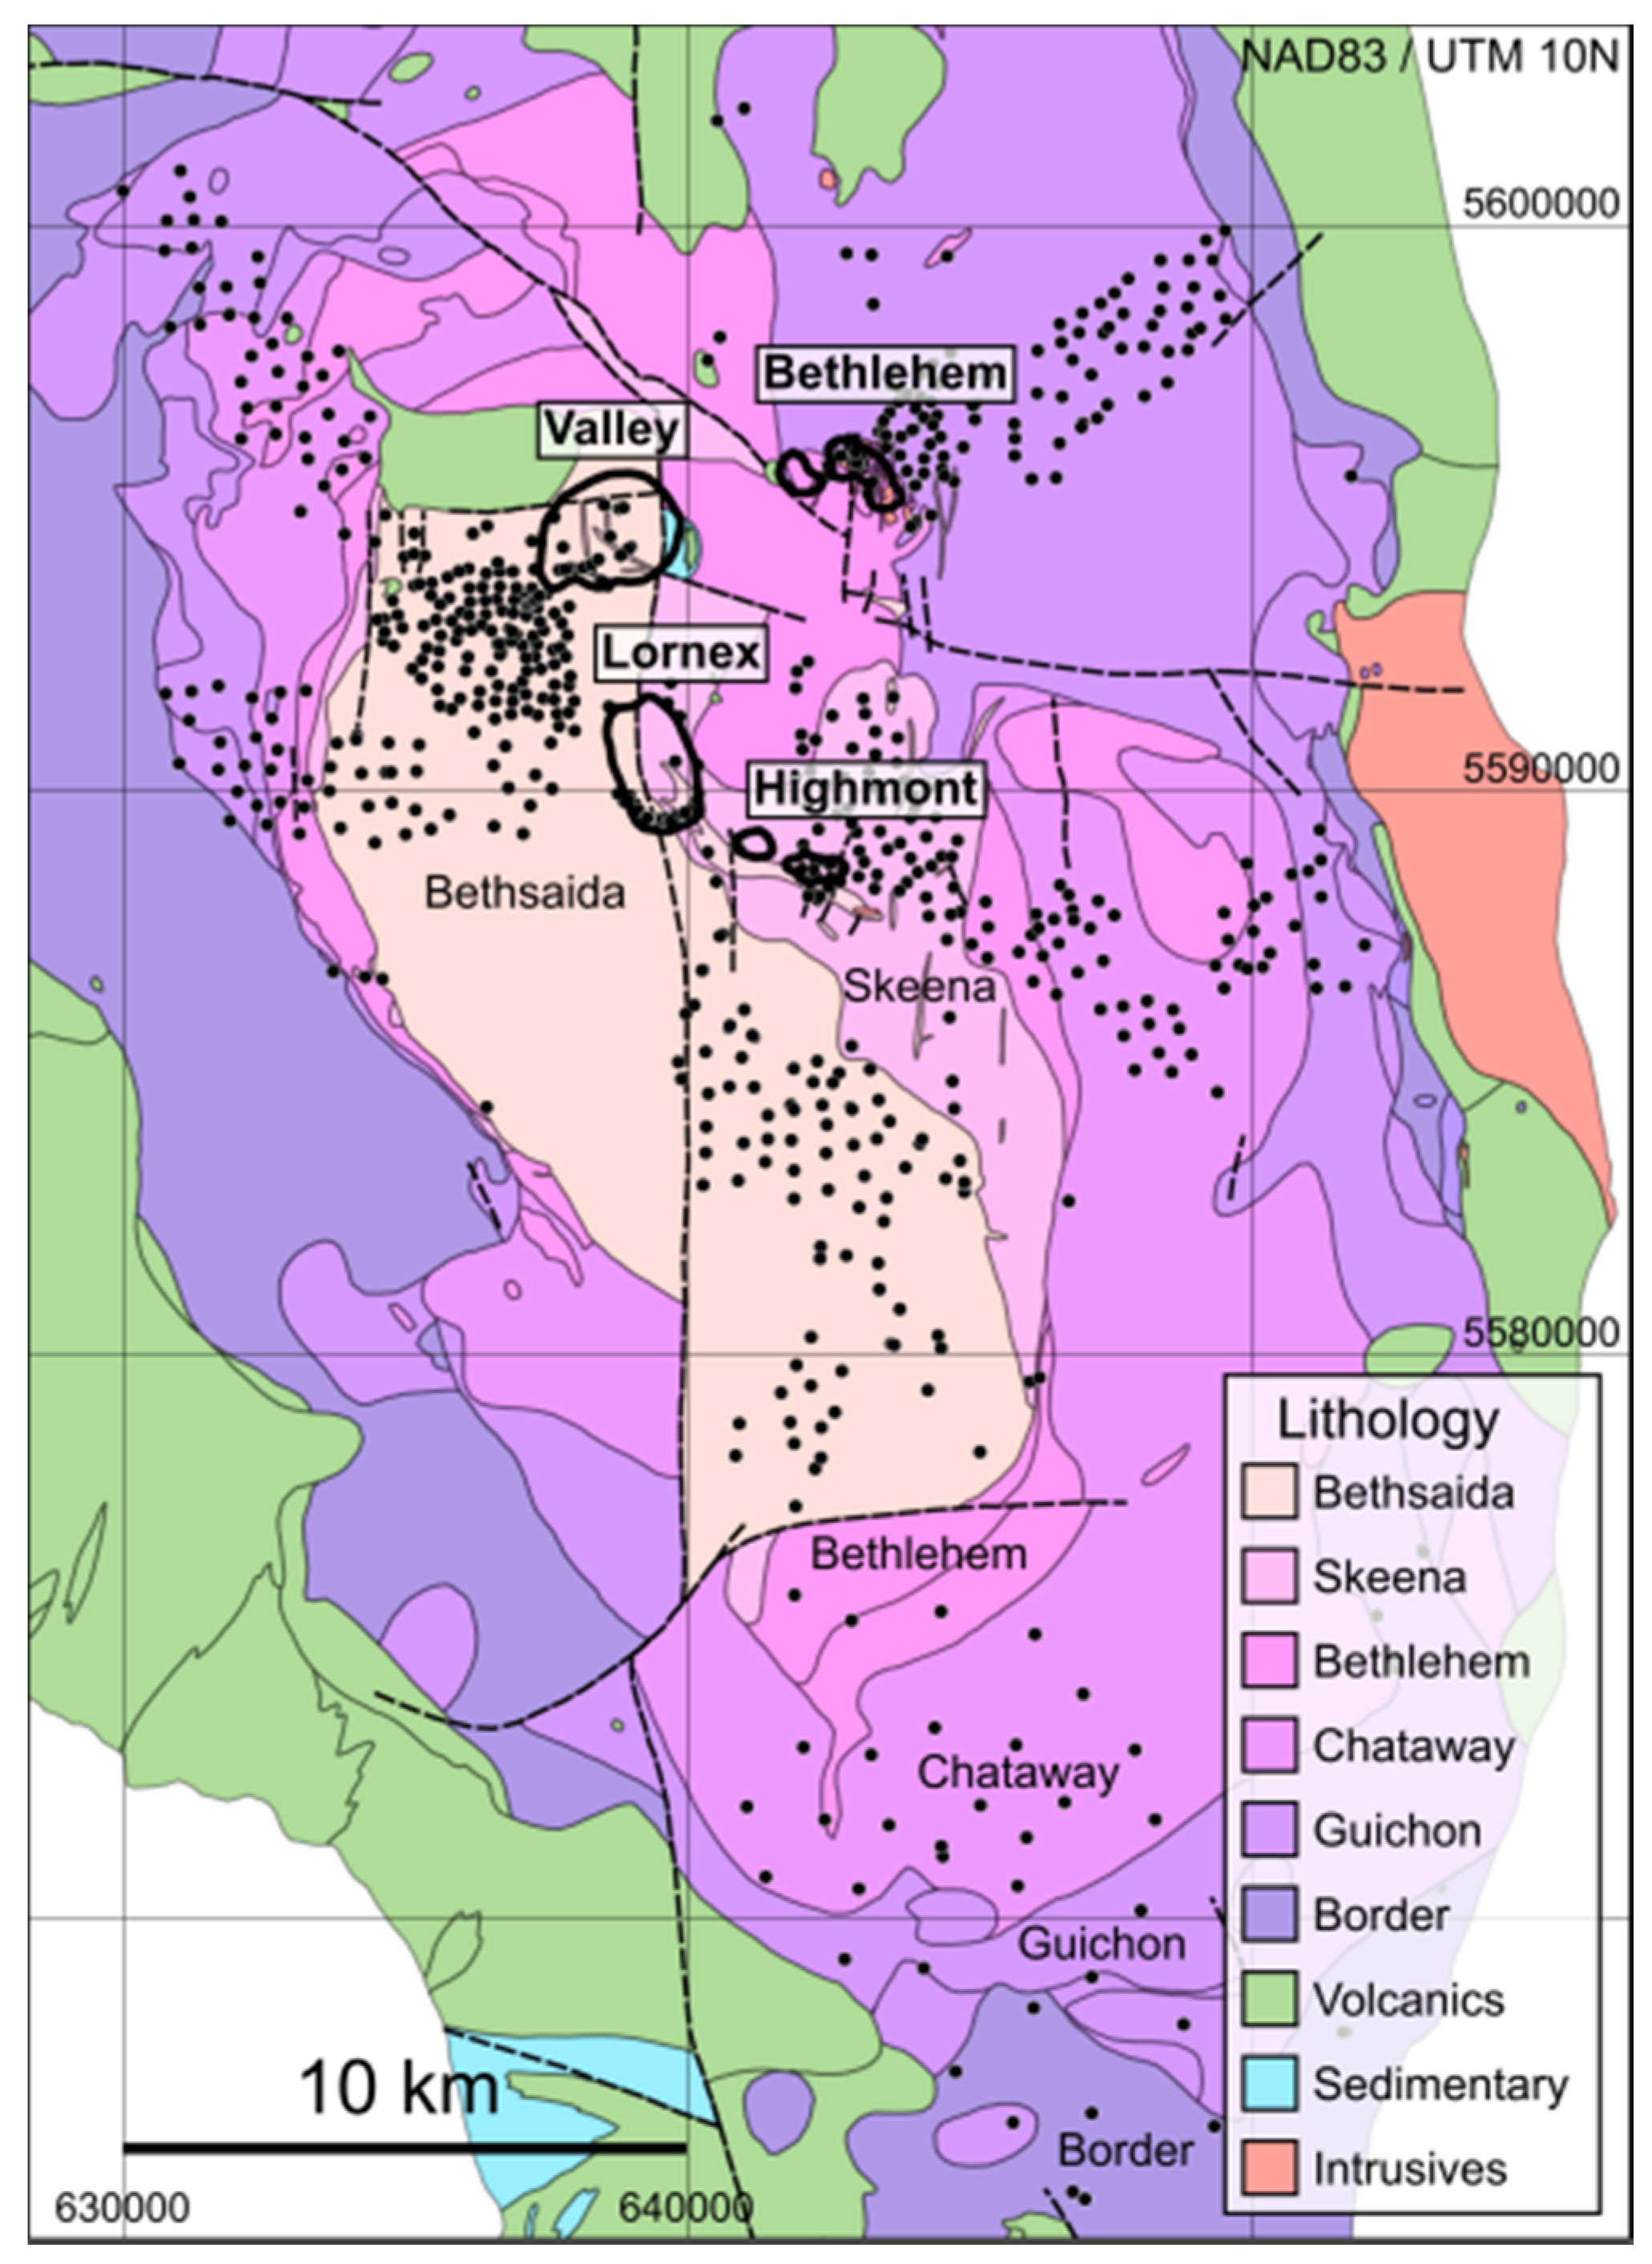
The Highland Valley Copper (HVC) district in British Columbia, Canada, is host to four major porphyry Cu-(Mo) systems that formed at deeper levels than typical porphyry-Cu deposits, and show a relatively restricted alteration halo [11,12,13], complicating exploration work. The HVC deposits are investigated here as part of the Natural Sciences and Engineering Research Council of Canada (NSERC) and Canada Mining Innovation Council (CMIC) Footprints project, which aims to identify large-scale alteration signatures around mineralized systems using a variety of analytical techniques. To this effect, several studies investigated numerous aspects of the deposits, and have recently been, or are soon to be published. D’Angelo (2016), D’Angelo et al. (2017) and Lee et al. (2020) investigated the petrogenesis and evolution of the Guichon Creek batholith hosting the HVC deposits [13,14,15], and Byrne (2019), Byrne et al. (2020) and Lesage (2020) investigated the mineralogical signature of alteration [11,12,16]. The geophysical signature of mineralization was described in Byrne et al. (2019), and the 3D structure of the deposit was investigated in Lesage et al. (2019) [17,18].
The current study builds on the datasets acquired as part of these investigations and utilizes a common sample suite. Here, SWIR hyperspectral imagery is acquired on 755 samples common to the Footprints project, obtained by, and for, the theses of D’Angelo (2016), Byrne (2019), and Lesage (2020) [11,14,16]. In addition, several hundred meters of continuous drill core were also scanned in SWIR specifically for this study. Because rocks in the HVC district present significant mineralogical complexity on centimeter-scales (several photographs, including feldspar staining results, are available in [12]), hyperspectral imagery is acquired at high-resolution (0.2–0.5 mm/pixel) in order to discern changes occurring between veins, veinlets and vein selvages. Data is also acquired at 1 mm/pixel on all of the continuous drill core to determine the full extent of alteration surrounding mineralized intervals.
Spectrally detectable mineralogical patterns are investigated on regional scales and summarized by a single spectral alteration score, which is valid for the entirety of the HVC district. This single score could facilitate exploration on regional scales, by providing explorers with a rapid, relatively inexpensive, and objective metric to quantify hydrothermal alteration in a given sample. Airborne hyperspectral imagery (remote sensing data) could be used to generate regional alteration maps, albeit only in environments with lesser vegetation cover than at HVC. In a production environment, on smaller, sample-scales, spectrally detectable changes in mineralogy could enhance the accuracy of core logging, or could potentially predict if a sample is mineralized, which has potential applications for ore sorting. However, as discussed in this paper, a number of caveats need to be considered for an accurate interpretation of hyperspectral data.

2. Background

2.1. Regional Geology

The HVC district, comprising at least four mineralized centers, is located in southern British Columbia, Canada, 50 km southwest of the town of Kamloops. The district is hosted by the approximately 60 km by 25 km wide, concentrically-zoned Guichon Creek batholith (Figure 1) in the southern portion of the Quesnel Terrane, within the Intermontane Belt physiographic province [13,19,20,21,22]. The I-type, calc-alkaline Guichon Creek batholith was emplaced into the Nicola Group volcano-sedimentary rocks of the Quesnel Terrane by at least three magmatic pulses [13,19,23] between ≈ 211 Ma and ≈ 207 Ma (petrographic descriptions and zircon uranium-lead dates referenced below are summarized from [13], unless otherwise indicated).
Continuous magma differentiation resulted in a concentrically zoned batholith comprising six texturally and compositionally distinct facies, ranging from gabbros at the margins to granites near the core, but mostly consisting of granodiorites. The earliest intrusive event occurred with the Gump Lake stock at 218.01 ± 0.18 Ma, located along the eastern edge of the main Guichon Creek batholith [15]. From the margins inwards, the remainder of the batholith is subdivided into five facies, namely the (1) Border and (2) Highland Valley facies (subdivided into the Guichon and the Chataway sub-facies), which were emplaced by a first magmatic pulse starting at 211.02 ± 0.17 Ma (a slightly older date of 215.6 ± 0.5 Ma is also reported [25]). A second magmatic pulse was emplaced prior to complete solidification of the Highland Valley facies, as evidenced by gradational contacts [19,23]. This second pulse started at 209.81 ± 0.27 Ma and formed the porphyritic (3) Bethlehem facies, and a third pulse was responsible for the (4) Skeena and (5) Bethsaida facies, and associated dikes [13,15]. The youngest Bethsaida facies rocks are dated to 208.55 ± 0.20 Ma. At least six varieties of pre-, syn-, to post-mineralization dikes are recognized throughout the district. Quartz-feldspar-phyric and quartz-rich porphyry dikes in the Bethsaida facies, interpreted to be syn-to-late-mineralization, are dated to ≈206.95 ± 0.22 Ma and represent the last magmatic events to occur in the batholith [13,15,22,26].
From the generally equigranular rocks formed in the first magmatic pulse, the Border facies rocks are the most heterogeneous, and often contain basaltic xenoliths near the outer margins of the batholith. Border rocks range from gabbros with minor olivine (altered to serpentine, talc and iddingsite) and two pyroxenes (often rimmed by amphiboles) to quartz monzodiorites with amphibole, plagioclase and quartz [13]. Because of their highly heterogeneous nature (ranging from 44 to 63 wt% SiO2), the eastern and western sections of the Border facies are excluded from this study, but the less variable southern section (51 to 64 wt% SiO2, average 58%) is included. The Highland Valley facies comprises the Guichon (≈62 wt% SiO2) and Chataway (≈64 wt% SiO2) sub-facies, consisting of granodiorites to minor quartz monzodiorites. Amphibole and biotite occur in approximately equal proportions and account for up to 25% of the Guichon facies, whereas amphibole is dominant over biotite, which together account for up to 15% of the Chataway facies. The second magmatic pulse generated the porphyritic Bethlehem facies granodiorites (≈65 wt% SiO2), with up to 9% mafic minerals, consisting mainly of 2–4 mm sized amphibole phenocrysts and lesser biotite. Felsic phases consist of plagioclase, K-feldspar and fine-grained quartz. The Skeena granodiorites to monzogranites (≈67 wt% SiO2) are intermediate between the Bethlehem and Bethsaida facies (≈69 wt% SiO2), which is a porphyritic granodiorite to granite. The Bethsaida contains approximately 50% plagioclase and 30% quartz phenocrysts, and lesser K-feldspar. Mafic phases consist of up to 6% biotite phenocrysts in books up to 5 mm in diameter, and minor amphiboles [23]. Numerous feldspar-(quartz)-(mafic mineral) porphyritic dikes are reported throughout, and are described in detail in [13,22].
At least four major porphyry-Cu deposits (Valley, Lornex, Highmont and Bethlehem, Figure 1) and over 160 Cu showings are known to occur in the batholith [22,24]. The porphyry-Cu centers currently under production or in past-production occur within the more felsic core of the Guichon Creek batholith, and two mineralizing events are recognized [22,27]. The first Cu-mineralizing event followed the formation of the Bethlehem facies, and occurred with the emplacement of porphyry dikes and breccias into this facies, forming the Bethlehem deposit. The second and larger Cu-Mo mineralizing event followed the emplacement of the Bethsaida facies and resulted in the formation of the Valley–Lornex and Highmont deposits. The originally contiguous Valley–Lornex deposit was cut by late faulting (the Lornex fault), offsetting the Valley and Lornex deposits by ≈3.5 km [19,22,28]. Re-Os ages for molybdenite from the Valley deposit have been reported at 206.7 ± 1.5 Ma and 205.8 ± 1.5 Ma [29], although molybdenite mineralization is interpreted to occur late relative to the main Cu mineralization at Valley [25]. Similar Re-Os ages (within error) have been reported in [13] for the Highmont and Lornex deposits (208.3 ± 1.0 Ma, and 208.4 ± 0.9 Ma).

2.2. Deposit Geology

The Highland Valley district is the largest producing porphyry camp in Canada [25] and has been mined since 1962. Production from 1986 to the end of 2012 is approximately 1160 million tonnes grading 0.391% copper and 0.009% molybdenum [30]. In 2018, Highland Valley Copper produced 100,800 tonnes of copper in concentrate and 8.7 million pounds of molybdenum in concentrate and has proven and probable reserves of 535 Mt at 0.30% Cu and 0.007% Mo [31].
The Highland Valley deposits were emplaced by cogenetic plutonic host rocks at relatively deeper levels (4–5 km, [12,13,14]) than typical porphyry deposits that form in stocks above parental plutons (generally the upper 4 km of the crust [2,32,33]). The deposits present a relatively restricted alteration footprint, with alteration selvages limited to a few centimeters around veins or veinlets. Nonetheless, hydrothermal alteration in the Highland Valley district broadly follows the alteration patterns typically recognized in porphyry-Cu deposits, and described in numerous seminal publications [2,34,35]. The Highland Valley district has been the subject of numerous early [19,36,37,38] and more recent studies [11,12,13,15,20,21,39], where the typical potassic, phyllic, argillic, and propylitic alteration zones have been documented. Mineralization predominantly occurs in veins, fractures, faults, and in the case of the Bethlehem deposit, in breccias. Generally, near the core of the deposits, bornite is the most common sulfide, grading outwards into chalcopyrite and pyrite [21,22,38].
Quartz is most prominent at the Valley and Lornex deposits, where, in the central portion of the deposits, quartz veins with no apparent selvages are Cu-barren [21,22]. These zones are referred to as a “silicic zone” [27,38], “silicic re-entrant” [20,30], and more recently as the “barren core” [22]. At Valley–Lornex, potassic alteration occurs adjacent to mineralized quartz veins, and is characterized by K-feldspar and by minor secondary biotite [21,38]. At Bethlehem, biotite is the principal mineral defining the potassic alteration assemblage near the core of the deposit (biotite is identified mainly in a 400 m wide region near the center or the Jersey open pit [21]), but commonly occurs with or is replaced by chlorite [21,40]. Locally, tourmaline cemented breccias occur near the Bethlehem and Highmont deposits. Phyllic alteration, closely associated with mineralization, is most conspicuous at the Valley and Lornex deposits, consisting of coarse grey muscovite selvages around quartz veins, on widths of up to several centimeters. This muscovite-rich alteration is in some cases referenced to as “sericitic” [38] or “early halo-type” [12]. Coarse-grained, greenish phengitic muscovite was also described as forming part of the outer phyllic alteration zone at the Valley and Bethlehem deposits [21]. Pervasive argillic alteration (kaolinite ± montmorillonite) is adjacent to the phyllic zones [20,22,36], and grades into pervasive propylitic alteration (epidote ± prehnite ± chlorite ± carbonate), which is most apparent in the more mafic facies of the batholith, and in the vicinity of the Bethlehem deposit [16,20]. From SWIR measurements performed during the course of the Footprints project, prehnite has been recognized as an important mineral in the distal propylitic alteration zone in the Guichon Creek batholith [12], and may have previously been identified as “zeolite” in Olade and Fletcher (1976) and Alva-Jimenez (2011) [21,36]. Prehnite occurs either as dark to light mint-green, mm-sized veinlets with extensive disseminated prehnite haloes in more felsic rocks, or as selvages around epidote veins in more mafic rocks. It has been noted that prehnite veinlets (and associated chlorite-white mica alteration) commonly refracture and overprint earlier veins and their alteration haloes, which lead to complex alteration patterns in most samples and complicates their interpretation [12].

3. Methods

3.1. Sample Suite

In this work, hyperspectral imaging is used to investigate the mineralogical variability across the Guichon Creek batholith and associated Highland Valley deposits. As part of the NSERC-CMIC Footprints project, a collection of over 800 common samples were acquired during the works of D’Angelo (2016), Byrne (2019) and Lesage (2020) [11,14,16], from which thin sections and whole-rock major and trace element compositions (including Cu grade) are available. Each slab, approximately 10 × 10 × 1 cm in size, was acquired with a rock saw from outcrops in a 20 km × 40 km region encompassing the deposit, and the slabs span all lithofacies present in the batholith (see Figure 1 for sample locations). Near the deposit, samples were acquired at a spacing of approximately 200 m, but sampling density decreased to one per kilometer towards the outer margins of the batholith. A subset of 755 rock slabs from this sample suite were imaged in SWIR in order to identify the mineral assemblages related to proximal and distal alteration. This high-resolution hyperspectral dataset provides insights into small scale (millimeter to centimeter) mineralogical variability often observed between veins, veinlets, and their alteration selvages. Collectively, this sample suite provides insights into regional-scale mineralogical patterns occurring in the Guichon Creek batholith.
A second sample suite, consisting of 400 m of continuous drill core was also selected for hyperspectral imaging at 1 mm/pixel. This core, from the Bethsaida granodiorite, intersects both mineralized and unmineralized intervals in close proximity to the Valley open pit, and serves to better define the spatial continuity of alteration scales near Cu-mineralized zones on intermediate scales (i.e., tens of centimeters to meters), beyond what is observable on a single slab sample. This continuous dataset also allows the establishment of correlations between mineral assemblages and Cu grades, as assayed by the mining company.

3.2. Hyperspectral Data Acquisition

Hyperspectral imagery was acquired in the SWIR (1000 to 2500 nm) using a Specim SisuROCK hyperspectral scanner (a line-scan imager) at the University of Alberta, Edmonton, Canada. This instrument contains a 256 spectral by 320 spatial pixels mercury-cadmium-telluride (MCT) detector array that acquires data with a 6.3 nm sampling interval, and a 10 nm spectral bandwidth. The instrument was equipped with either an OLES56 (high-resolution) or an OLES15 (low-resolution) lens which, respectively, yielded a spatial resolution of 0.2–0.5 mm/pixel or 1 mm/pixel. Dark current and a 99% reflectance Spectralon™ white panel were measured at the beginning of each data acquisition sequence, and radiance data of the geological target were converted to reflectance by subtracting dark current, and then by normalizing to the radiance data of the white panel. Drill cores in 1.2 m long wooden core boxes (four rows per box) were scanned at 1 mm/pixel using the low-resolution lens, and rock slabs were scanned at 0.5 mm/pixel or 0.2mm/pixel using the high-resolution lens. The reported absorption positions (spectral accuracy) of the instrument were calibrated against a National Institute of Standards and Technology (NIST) referenced Mylar standard, as described in [41]. The strongest absorption of the standard is measured at 1660 nm, matching the NIST reference value of 1659.9 nm ±1 nm. Spectral drift (i.e., changes in reported absorption positions over time) was assessed using a reference biotite sample measured with every scanning session and remained below 1 nm for the entirety of the dataset.

3.3. Spectral Data Analysis

The analysis of spectral data requires the detection of absorption features that are used to uniquely identify mineralogy [3,4]. For certain minerals, mineral chemistry or grain size can also be estimated from spectral characteristics, either from the exact position or from the strength of specific absorption features [4,41,42]. Given the relatively coarse 6.3 nm sampling interval of the imaging spectrometer, spectra need to be interpolated in order to derive precise (and ultimately accurate) absorption positions. Here, spectral data analysis is performed using the method described in detail in [43], where additional supporting data was provided to show the efficacity of the interpolation methodology, including comparisons to a NIST-reference material, as well as regressions established between interpolated absorption positions and mineral chemistry derived from electron microprobe data. Spectra are analyzed on a per-pixel basis, and are first linearly interpolated to a sampling rate of 1 nm. Interpolated spectra are then smoothed by convolution with a Gaussian function with a full width half maximum (FWHM) of 25 nm. Absorption feature strength and position are then retrieved by derivative analysis, from the maxima of the second derivative of the convolved spectra. On a sample level (i.e., for an image of a 10 cm by 10 cm slab consisting of 200 × 200 pixels), the average absorption position of all pixels is reported, calculated as the absorption position for each pixel weighed by the absorption strength of the given pixel. To aid in the identification of certain minerals, a spectral slope between two specific wavelengths is also reported, and is calculated on raw data (i.e., non-interpolated, not continuum removed spectra).

3.4. Mineral Identification

The analysis of spectral data as performed in this study requires a degree of geological and spectroscopic knowledge to correctly identify mineralogy. In the first place, minerals that are likely to occur within the investigated sample suite are identified from ancillary geological knowledge of porphyry copper deposits, as well as from known characteristics of the Highland Valley deposits. Previous studies (summarized in Section 2.2) have identified the presence of, among others, coarse grained muscovite, kaolinite, tourmaline, chlorite, epidote, smectite and prehnite. Spectral characteristics of these minerals are examined either from existing spectral libraries (e.g., the USGS spectral library [44]) or from samples where the mineral is known to occur, ideally in pure form. Absorption features unique to these minerals are then identified (if existing), and one or more diagnostic absorptions is selected for each mineral. If no diagnostic absorption exists, a combination of a non-diagnostic absorption and a specific spectral slope in a given spectral region is selected. Hyperspectral data for all samples is then processed by derivative analysis to identify all absorption features occurring in the dataset. Any absorption occurring at positions not identified during the mineral identification step is further investigated, as it could indicate the presence of unidentified minerals. Several additional minerals were identified in this way, including pumpellyite (absorption at 1510 nm) and gypsum (absorption at 1490 nm).
The samples investigated here commonly show the presence of at least 10 spectrally active minerals (i.e., presenting characteristic absorptions features), in addition to spectrally inactive quartz and sulfides (i.e., intrinsically presenting a flat spectral response). For each mineral, a typical spectrum derived from the current sample suite is presented in Figure 2, and spectral parameters used for identification are indicated.
The spectral features used for mineral identification presented in Figure 2 are also reported in Table 1, which in addition provides a list of minerals that could potentially cause spectral interference, and also lists references to recent studies investigating the spectra of the given mineral, if available. As an example of the mineral identification process, prehnite can be uniquely identified by the presence of a single diagnostic absorption at 1477 nm (Figure 2c). Tourmaline, on the other hand, can only be identified by the combination of a non-diagnostic absorption at 2205 nm (an absorption at this position could also be from kaolinite or white mica), and by a strong negative spectral slope between 1000 and 1200 nm and a strong positive slope between 1400 and 2100 nm (spectral slopes are indicated by dashed lines on Figure 2b). The presence of spectrally inactive minerals can also be inferred from spectral characteristics. For example, quartz is identified by the presence of a broad water-related absorption near 1450 nm (from fluid inclusions), while the presence of sulfides is inferred from pixels that show a flat spectral response across the entire SWIR spectral range (i.e., aspectral pixels). Aspectral pixels are identified as those having no detectable absorptions near 1400, 1900, 2200 or 2350 nm, and are then further filtered to exclude pixels with a spectral slope between 1000 nm and 1200 nm, related to Fe electronic absorptions [5]. In all cases, the spectra presented here have a high degree of similarity to those in the listed references, as well as to those available in the USGS spectral library [44]. Several thin sections available from the sample suite also served to confirm the nature of minerals that were spectrally identified but not apparent to the naked eye (i.e., the presence of green epidote or black tourmaline can be readily confirmed with the naked eye, but pale greenish prehnite and pumpellyite are not readily visually identifiable).
In the majority of samples in the current study, mineral mixtures are common, where several minerals can be present within a given pixel (i.e., in a single spectrum). In many cases, such as the mixture spectrum shown in Figure 2d, absorption features unique to a given mineral nonetheless allow for an unambiguous identification. In the example spectrum, prehnite and epidote can be identified from diagnostic absorptions at 1477 nm and 1550 nm, respectively. The presence of white mica is identified from the absorption near 2200 nm, combined with the lack of absorptions near 1467 nm or 2160 nm (ruling out the presence of montmorillonite or kaolinite, respectively). In other instances, however, white mica cannot be unambiguously identified. Illite (inferred from a deeper 1900 nm absorption) cannot be spectrally discriminated from muscovite in the current dataset, as several other phases show absorptions near this position. Spectral mixtures of either montmorillonite (absorptions at 1467 nm and 2200 nm) or kaolinite (absorptions at 2160 nm and 2205 nm) would also make the detection of fine-grained white mica (single major absorption near 2200 nm) ambiguous at best, as no absorptions unique to white mica would be present. The effects of spectral mixtures between kaolinite and fine-grained white mica are further addressed in the Section 5.4.

3.5. White Mica Thickness Estimation

In addition to allowing the identification of mineralogy, spectral metrics can provide information on physical characteristics of certain minerals. White mica is a relatively weak absorber (i.e., as opposed to darker minerals such as biotite), and is translucent even for relatively large crystal thicknesses (along the c-axis). Reflectance measurements performed with crystal samples of increasing thickness (increasing optical path length) yield spectra that appear to follow the Beer–Lambert law, for samples up to a few millimeters in thickness. That is, absorption features become increasingly pronounced with increasing sample thickness, up to band saturation. With increasing sample thickness, several minor absorptions become increasingly apparent, for example near 1840 nm or 2125 nm. Figure 3a presents reflectance measurements from increasingly thick white mica sheets (parted from the same original crystal book) laid flat on a Spectralon white panel. With increasing thickness, the absolute reflectance decreases across the entire spectral range, and the strong absorptions rapidly become saturated (e.g., at 2200 nm). Of interest is that the relative strengths of the weak to strong absorptions increase differentially with sample thickness (i.e., the weak 2125 nm absorption increases in depth while the strong 2200 nm absorption becomes saturated). Thus, as presented in Figure 3b, the ratio between the strength of the second derivative of the 2125 nm to the 2200 nm absorptions can be used to estimate white mica thickness, up to 3 mm. Above this thickness, the relationship is not valid as the saturated absorptions become too broad for strengths to be correctly estimated. A single measurement performed along the ab-axes qualitatively appeared similar to the coarse-grained white mica spectrum (Figure 3a, 4.4 mm), although it appears to be thicker, with a lower overall reflectance.
Although the quantitative relationship was established here using white mica layers parted from a pure crystal and placed on a white panel (in laboratory conditions), a similar relationship appears to exist in natural samples, at least in a qualitative sense. In HVC samples, fine-grained matrix white mica (e.g., from alteration defined as weak sericitization) is spectrally distinguishable from coarse-grained white mica phenocrysts (e.g., those identified as “medium to coarse-grained pervasive muscovite (Mc)” in [21], which were described as individual grains ranging from 0.4 to 1.0 mm in size, intergrown with quartz). A caveat for the use of this metric is that it is affected by spectral mixtures with minerals that present an absorption near 2100–2200 nm. For example, mixing with kaolinite produces apparently small mica thicknesses, down to zero in pure or mostly pure kaolinite pixel. This is because the 2160 nm absorption of kaolinite creates an inflection point near 2120 nm, which causes a trough in second derivative spectra, as opposed to the expected peak, resulting in a negative estimated thickness (here shown as zero). Nonetheless, spectral mixing effects did not appear to cause significant adverse effects in the use of this metric in a qualitative sense. In this study, the metric is used to detect the presence of thick, or coarse-grained white mica (i.e., pixels showing an apparently large white mica optical thickness), defined here as those with a 2125 nm over 2200 nm ratio of approximately 0.16 or above, corresponding to an apparent white mica thickness of 1 mm or greater. For brevity, this metric is referred to as white mica “grain size”, even though the metric measures the white mica optical thickness, which might not always correspond to the true physical size of white mica crystals in natural samples.

3.6. Estimation of Relative Modal Mineral Abundances

Hyperspectral data for the 755 slabs from the Guichon Creek batholith were analyzed to extract relative modal abundances of the 12 minerals listed in Table 1, as well as apparent white mica thickness (referred to as grain size). Spectral imagery is analyzed on a per-pixel basis, with each pixel possibly indicating the presence of one or several minerals, based on the criteria presented in Figure 2 and Table 1. For each slab sample, a relative modal abundance for each mineral is calculated as the number of pixels with the given mineral over the total number of pixels in the sample (note that a single pixel can have multiple, one, or no minerals detected). That is, the relative modal abundances reported in this study only represent relative changes in abundance for the investigated mineral within the sample suite, and are not true modal abundances, as these do not take into account all phases present in a rock (e.g., feldspars cannot be accounted for). As an example of the modal abundance estimation process, Figure 4 shows the relative abundance of prehnite in two samples, respectively at 12% and 54%. For continuous drill core, a relative mineral abundance value is reported for every 20 cm section of core.

3.7. Alteration Score Used for the Detection of Mineralized Samples

In most mineral deposits, mineralogy in altered and mineralized samples is distinct from that of background, unaltered and unmineralized samples. At Highland Valley, mineralization in the form of copper-iron sulfides occurs in quartz veins with coarse muscovite selvages, and kaolinite is also common within the deposit. In some areas, tourmaline breccias are reported to be associated with mineralization, and may be overprinted by epidote. Prehnite is common in distal propylitic alteration zones [12].
Here, a simple alteration score is developed based on the presence or absence of minerals that are known to occur with mineralization, and that are spectrally detectable in the SWIR spectral range. This metric can be used to estimate the degree of alteration in a given sample (or drill core interval) and could potentially be used to discriminate mineralized from unmineralized samples (i.e., for ore-sorting). For each sample, a modal abundance is calculated for each of the minerals associated with mineralization (here including sulfides, quartz, coarse-grained muscovite, kaolinite, tourmaline, and epidote). An alteration score is then calculated by adding a value of one for each alteration mineral present above a given threshold in a sample, and a score of two is added for tourmaline and sulfides, which occur exclusively in mineralized samples. Generally, a threshold of 5% of the pixels (i.e., modal abundance) is used to determine the presence of a mineral within a sample, or 0.1% for sulfides. That is, a sample with a spectrally estimated modal abundance (pixel count) of over 5% for both kaolinite and tourmaline would obtain an alteration score of three. An example of modal abundance estimation was shown in Figure 4. Note that, as each mineral is identified independently, several minerals could potentially be present within a single pixel, as shown in the mixture spectrum in Figure 2d.

4. Results

Unlike conventional analytical techniques that provide information on limited scales (i.e., thin sections), imaging spectroscopy can provide mineralogical information on a range of scales, from thin sections offcuts (2 cm by 4 cm) or hand samples (10 cm by 10 cm), to entire drill cores (m) for proximal sensing platforms, or from mine walls (m) to entire exposed land surfaces (km) from remote sensing platforms. In the following section, hyperspectral data is presented for samples at increasingly larger scales, from hand samples to drill cores. High-resolution imagery on small scales allows the characterization of veins, veinlets and vein selvages. Mineralogical patterns related to alteration can thus be recognized, and spectral metrics to identify mineralized samples can be developed. These metrics can then be applied on large-scales, to delineate mineralized interval in drill cores and facilitate core logging, or to outline potential mineral deposits on regional-scales.

4.1. Sample Scale Variability in the Bethsaida and Skeena Facies

The Bethsaida granites to granodiorites are one of the main hosts to mineralization in the Highland Valley district, hosting the Valley and part of the Lornex deposit, both of which formed during the younger mineralizing event in the district. In these deposits, mineralization is intimately linked to quartz veins that present coarse-grained grey muscovite selvages (early-halo veins [21,22]). Kaolinite may also be present throughout these systems. A total of 331 slab samples were acquired in the Bethsaida facies and enclosed felsic dykes, and a total of 42 samples from this group were mineralized (defined here by grades above 1000 ppm Cu). 
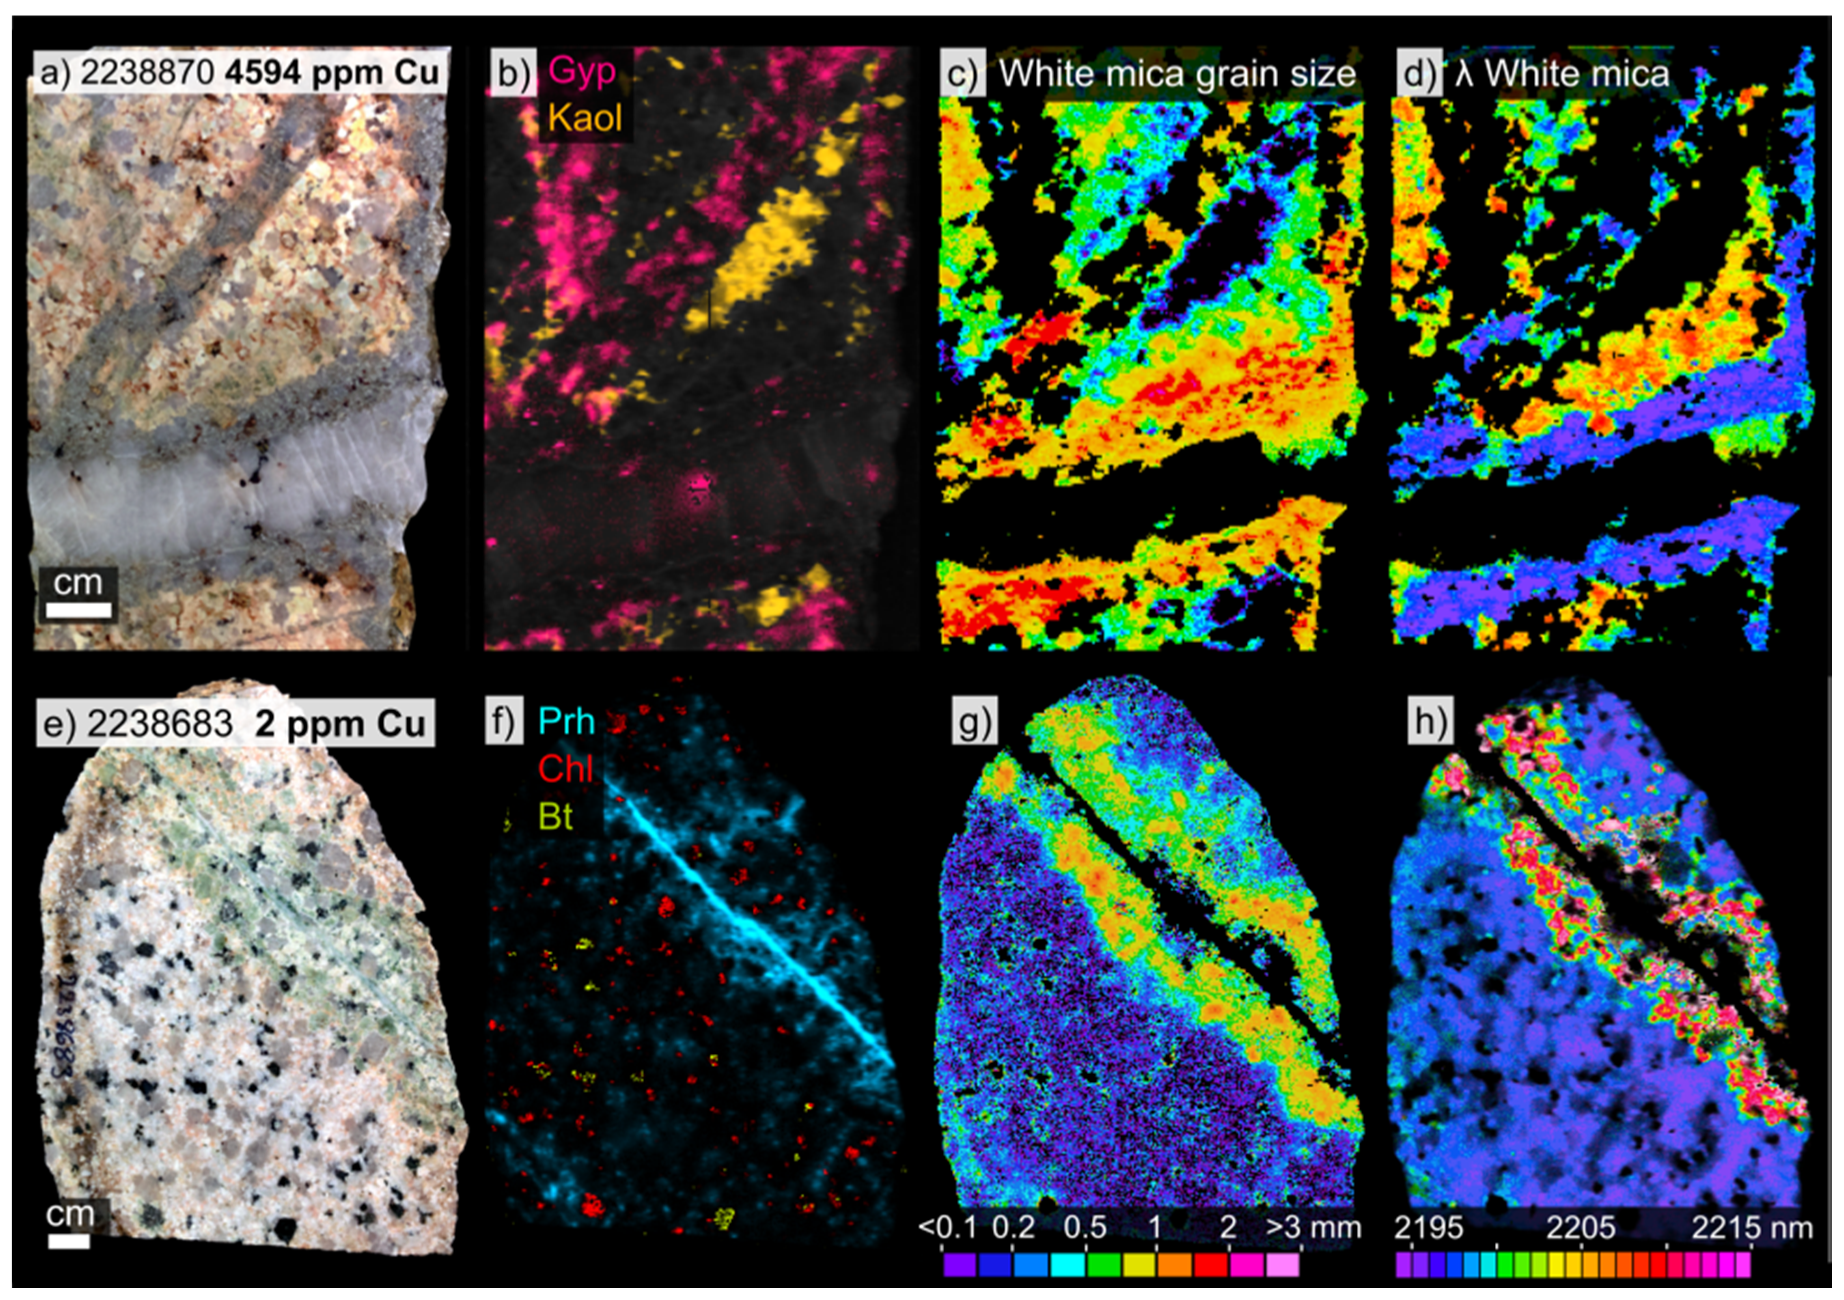
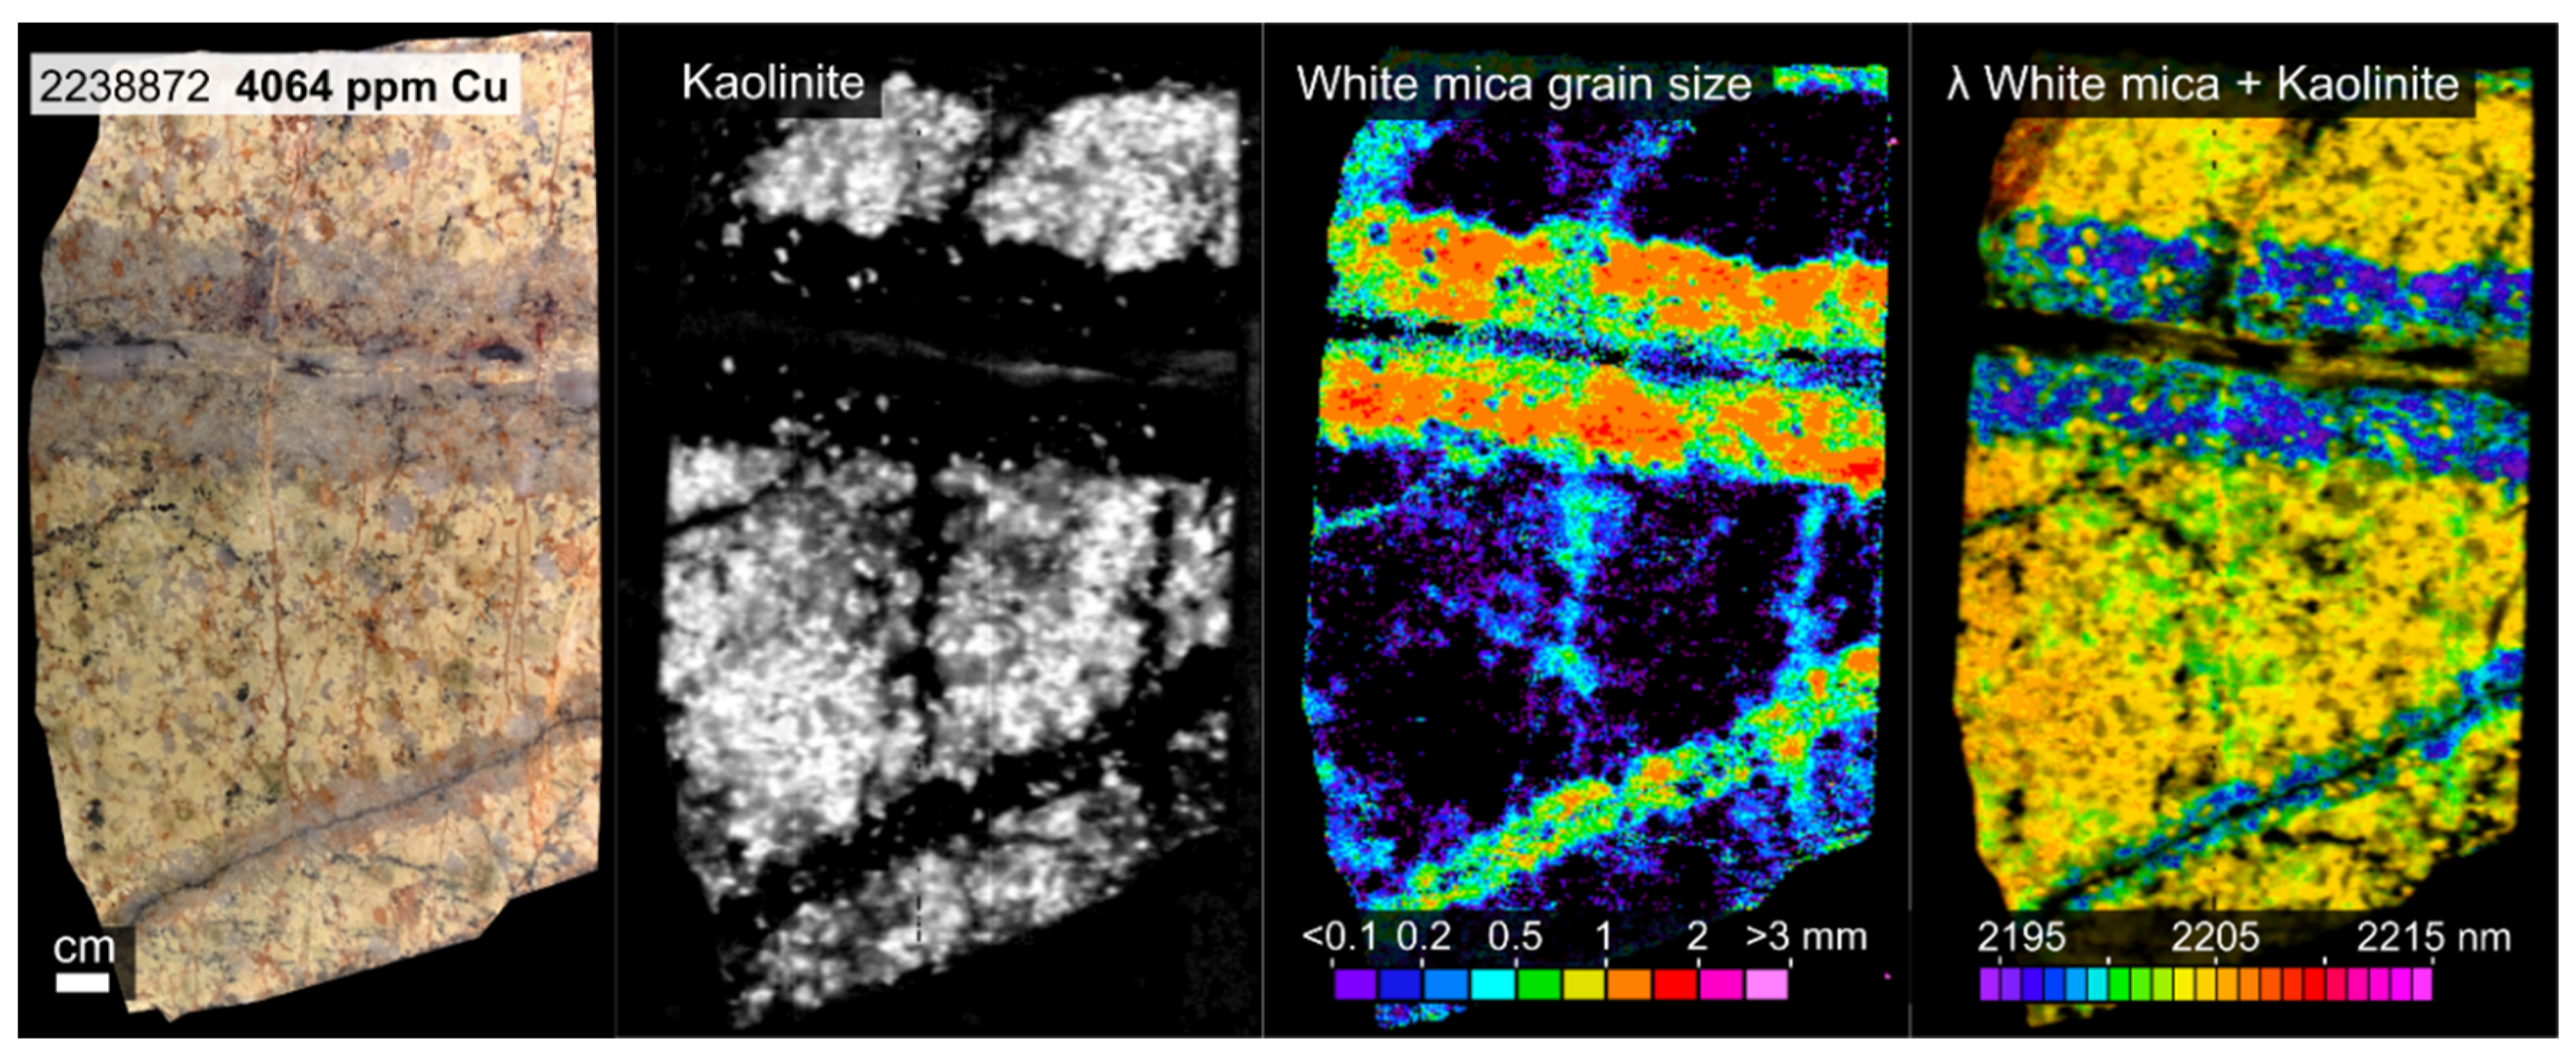
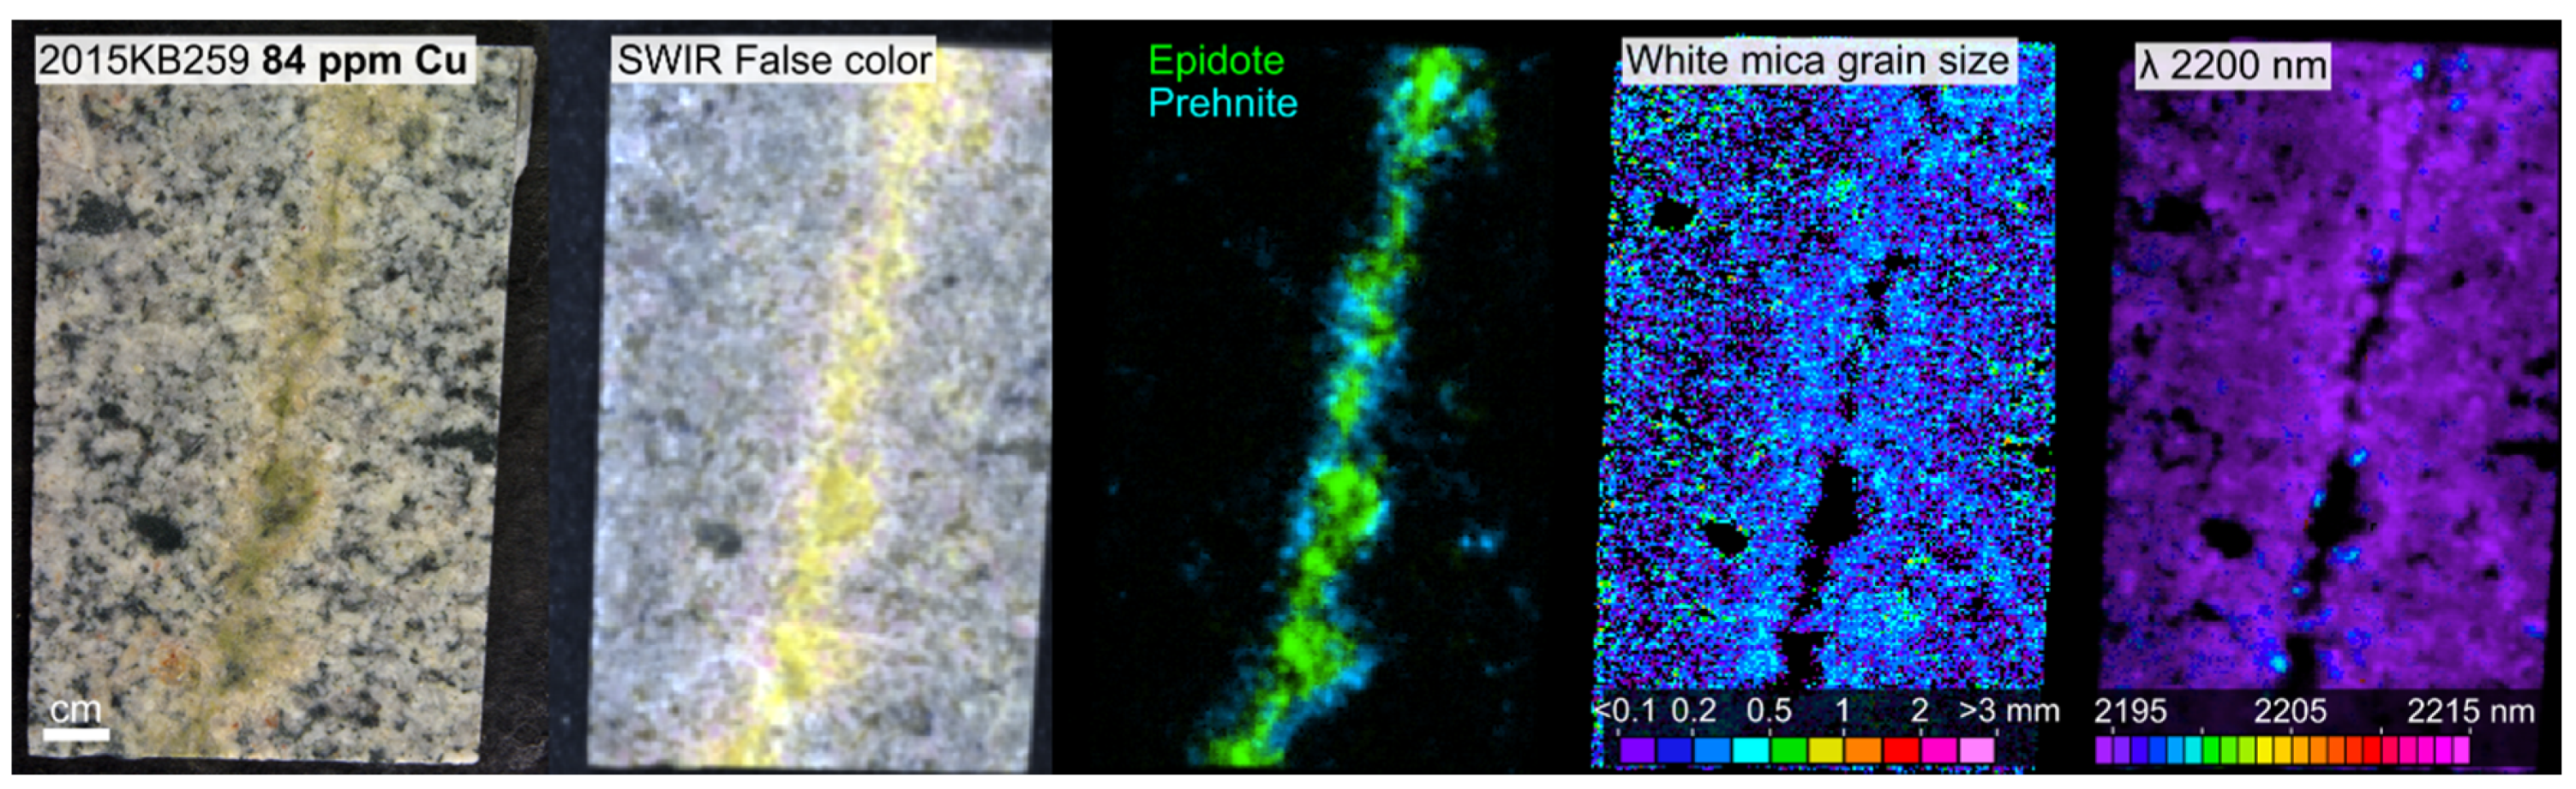
Figure 5 presents hyperspectral imagery of typical samples from the Bethsaida facies, with a mineralized sample from the Valley deposit, and an unmineralized sample from 2 km west of the open pit.
In the mineralized sample (
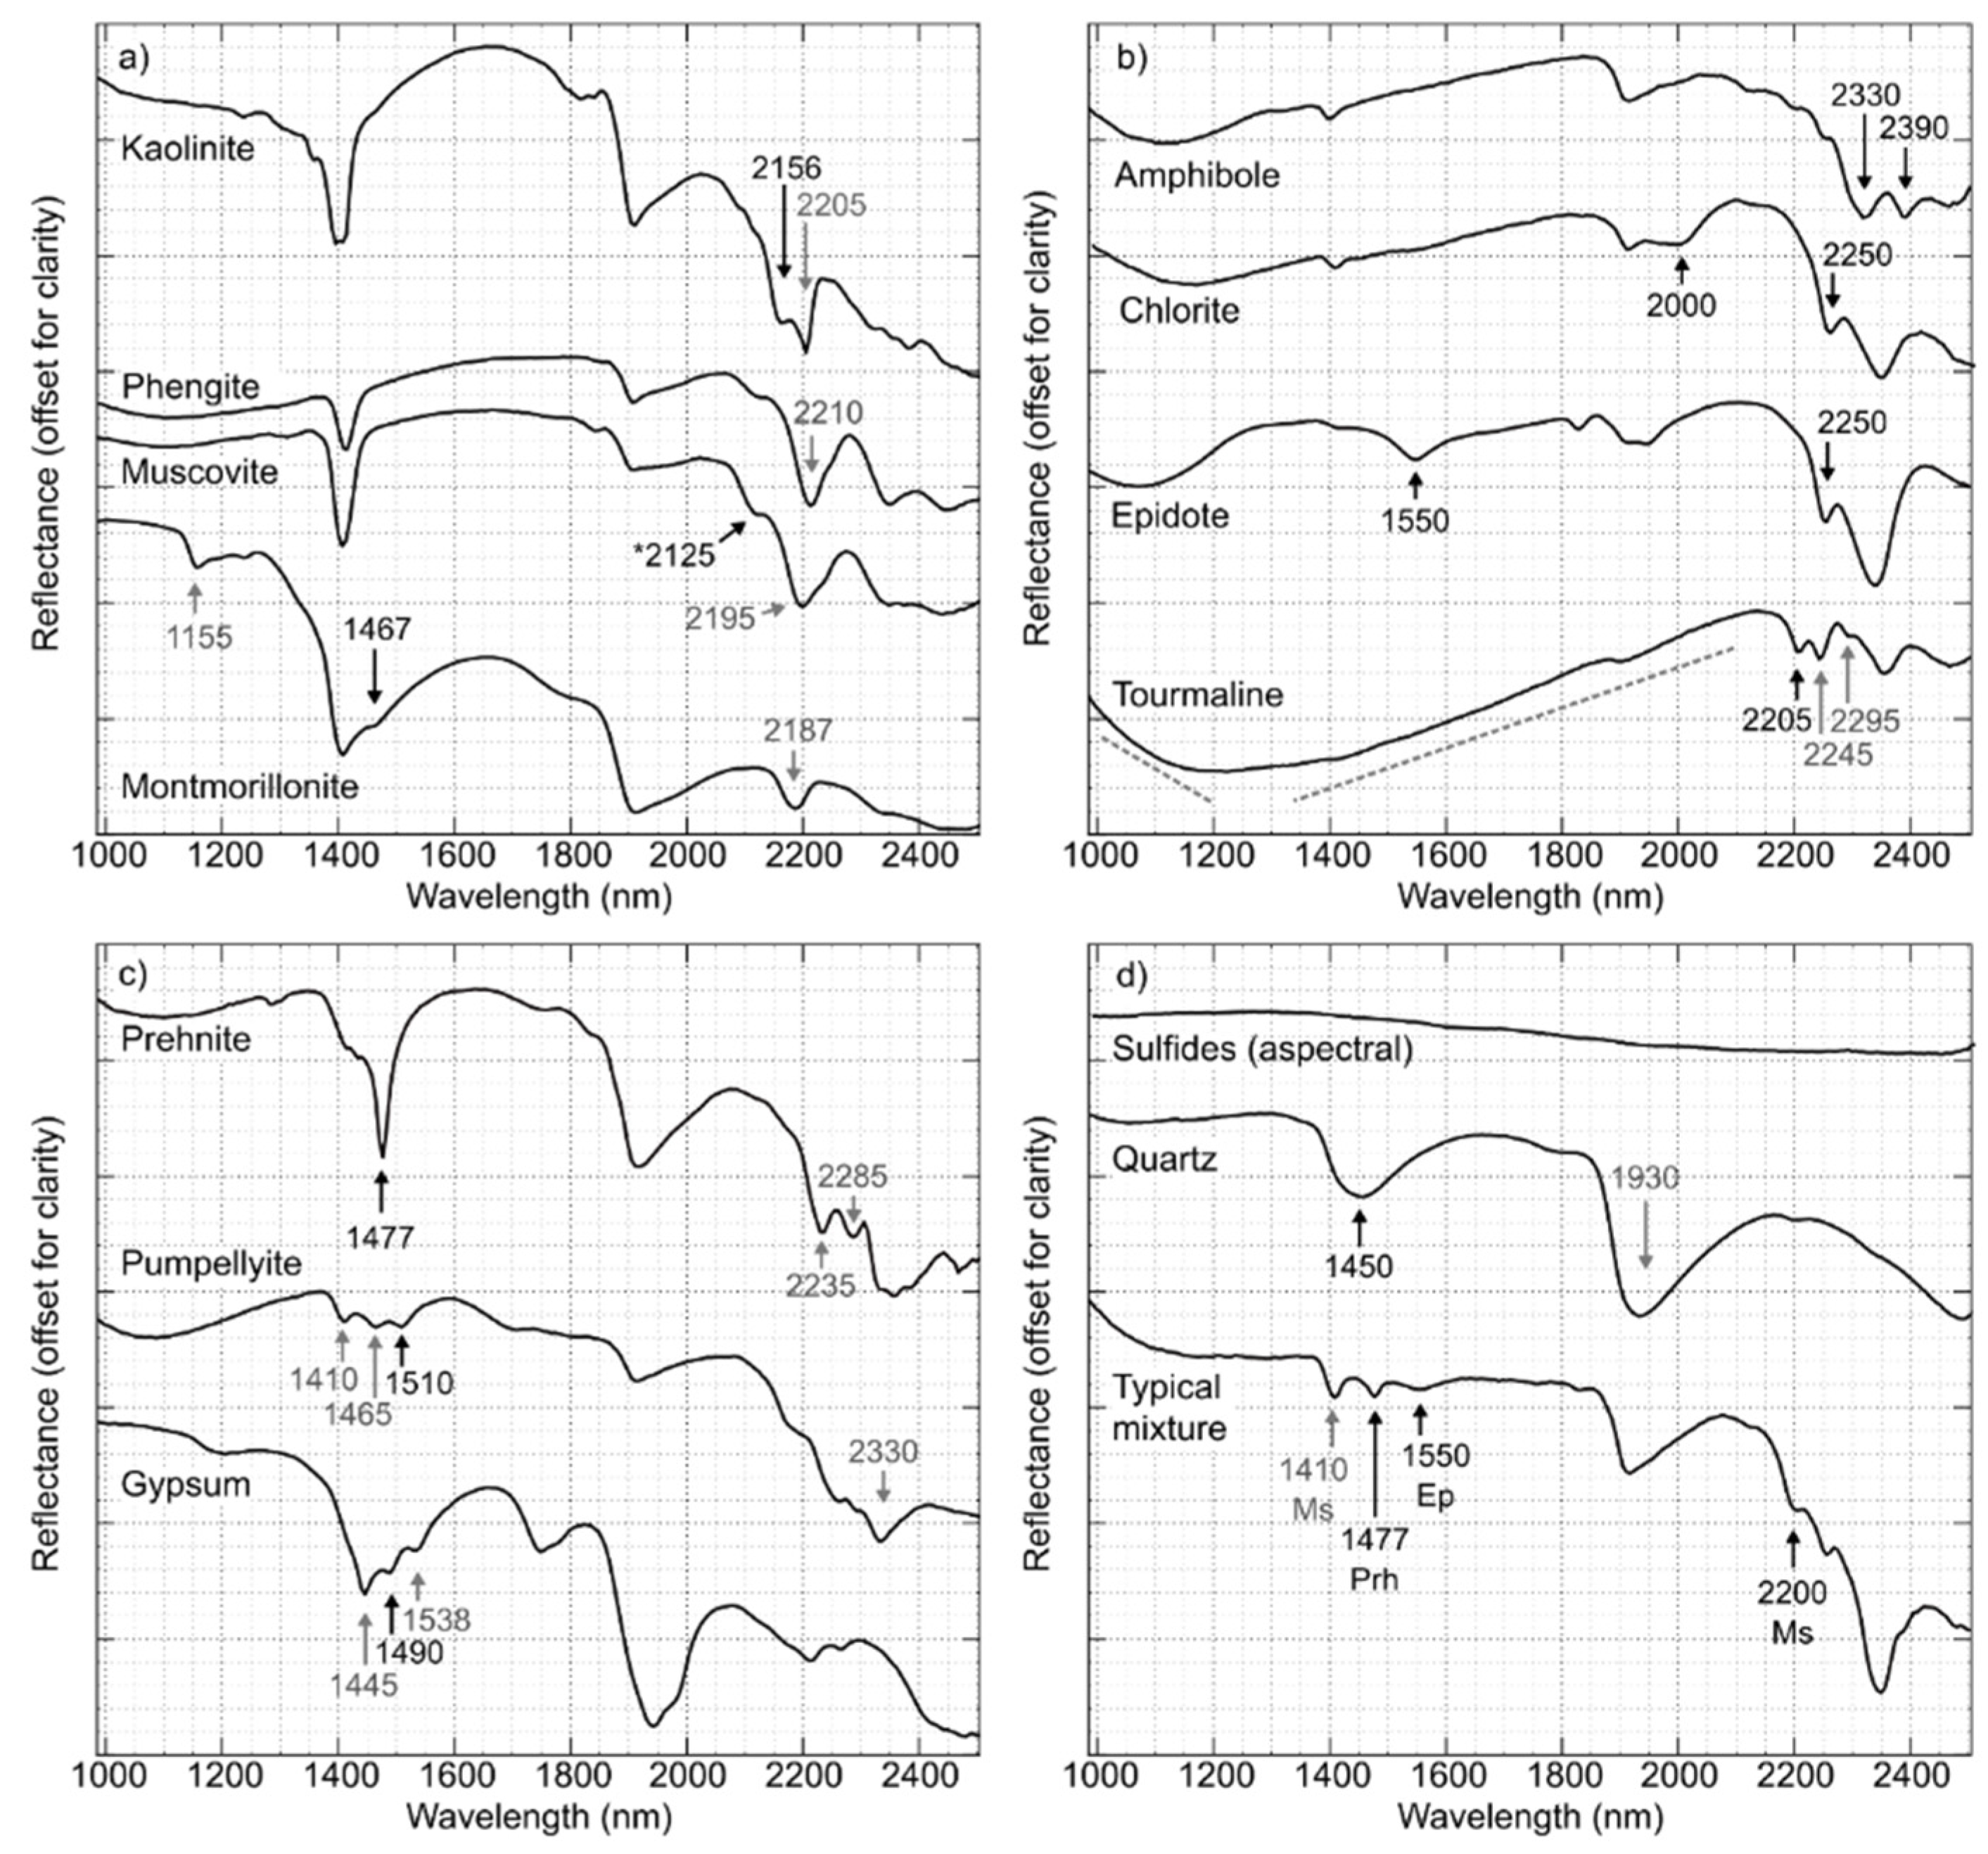
Figure 5, top), spectrally detected mineralogy is consistent with the reported alteration styles in the Bethsaida facies. The quartz vein selvage consists of coarse-grained white mica, and kaolinite is present in the altered groundmass (Figure 5b). Gypsum is present throughout as an overprinting mineral (Figure 5b), although it may not be present in most samples (an additional mineralized sample with no gypsum is presented in Figure A1). The grey muscovite, forming the selvage of mineralized veins described in previous studies, corresponds here to the coarse-grained (generally above 1 mm, Figure 5c) muscovitic (high-Al) white mica, with an Al2-OH absorption feature near 2195 nm (Figure 5d and Figure A1). Immediately adjacent to this grey muscovite, coarse-grained green white mica (described in [21]) is phengitic (Figure 5d), with an absorption near 2210 nm, although in other mineralized samples this phengitic white mica may be absent (Figure A1). Note that the sample in 
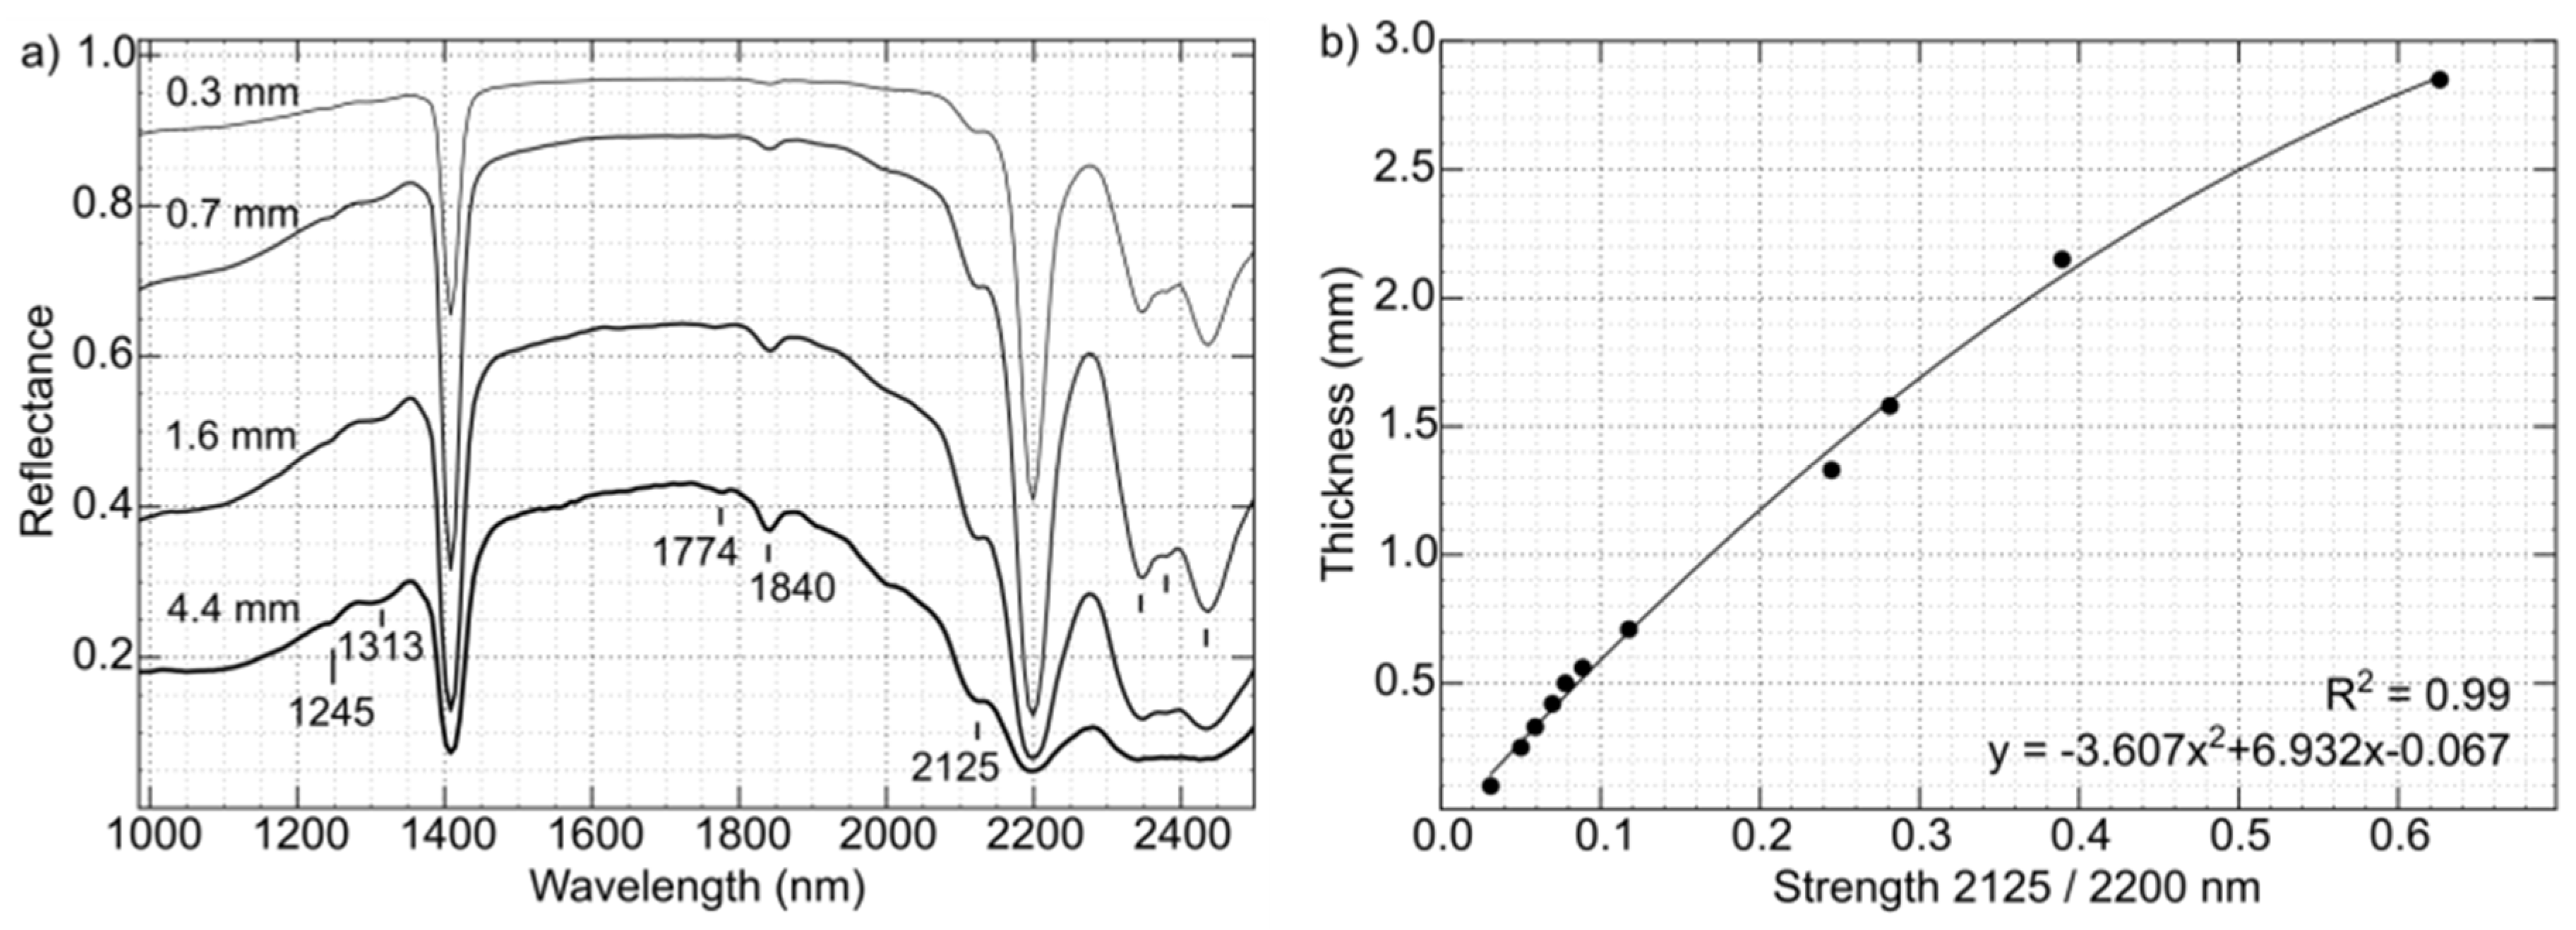
Figure 5d was filtered to remove interference from gypsum, and from kaolinite (further discussed in Section 5.4) by only showing pixels with coarse-grained white mica, with a ratio of the 2125 nm to 2200 nm absorptions above 0.1 (corresponding to a thickness above 0.5 mm). Kaolinite does not have any absorption near 2125 nm, resulting in a ratio of zero. Masking pixels with a ratio below 0.1 therefore eliminates both fine-grained white mica and kaolinite.
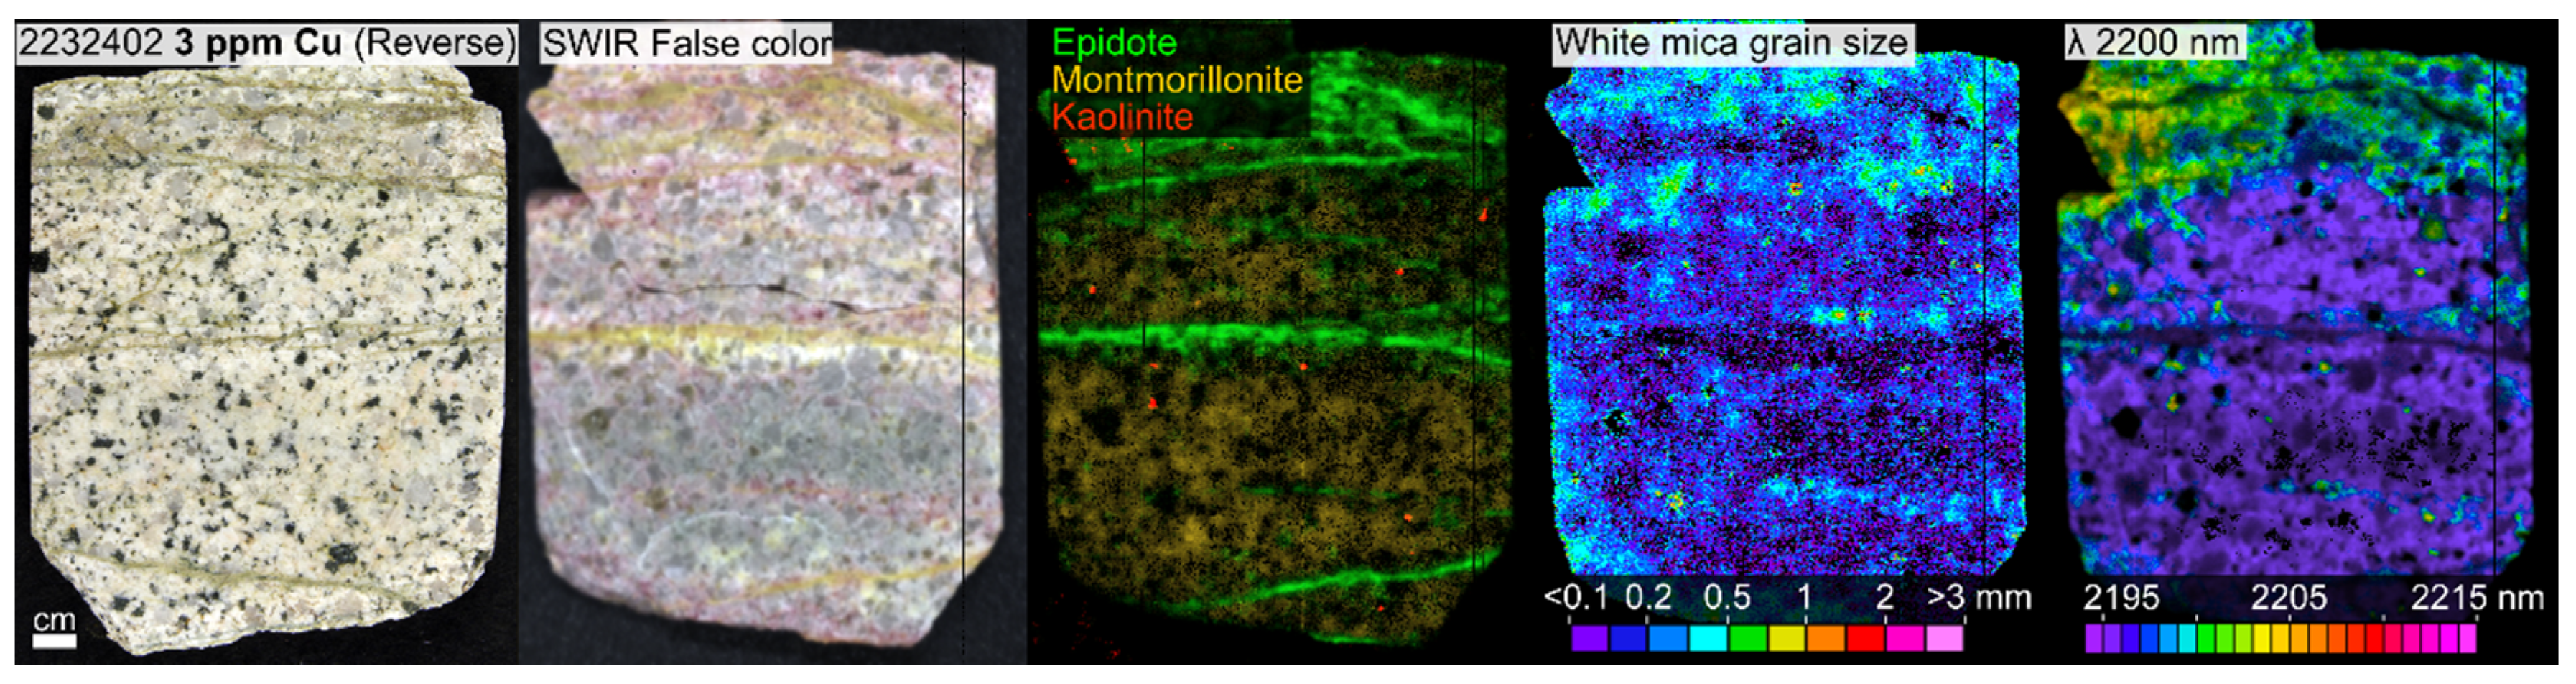
A typical unmineralized (but altered) sample from the Bethsaida facies is presented in Figure 5 (bottom). Spectrally identified mineralogy is consistent with the prehnite-rich propylitic alteration domain described in [12]. Figure 5f displays spectral imagery highlighting the presence of a prehnite vein, with a selvage consisting of low amounts of prehnite and coarse-grained (Figure 5g) phengitic white mica (Figure 5h), with an absorption near 2210 nm. In most samples, this coarse-grained white mica is restricted to the immediate vicinity of veins (1 to 5 cm). In many cases, weakly altered to unaltered background mineralogy is detectable away from veins (e.g., on the lower-left portion of the unmineralized sample in Figure 5). Here, this consists of fine-grained white mica (muscovite and/or illite) ± montmorillonite, which together always show low absorption wavelengths, at or below 2195 nm. In many cases, least altered rocks contain minor amounts of prehnite throughout (Figure 5f, bottom left part), or may alternatively at times be dominated by montmorillonite (Figure A2), or rarely by pumpellyite (Figure A3). In the Bethsaida facies, epidote veins are at times present within the propylitic alteration zone but are subordinate to prehnite veins and veinlets.
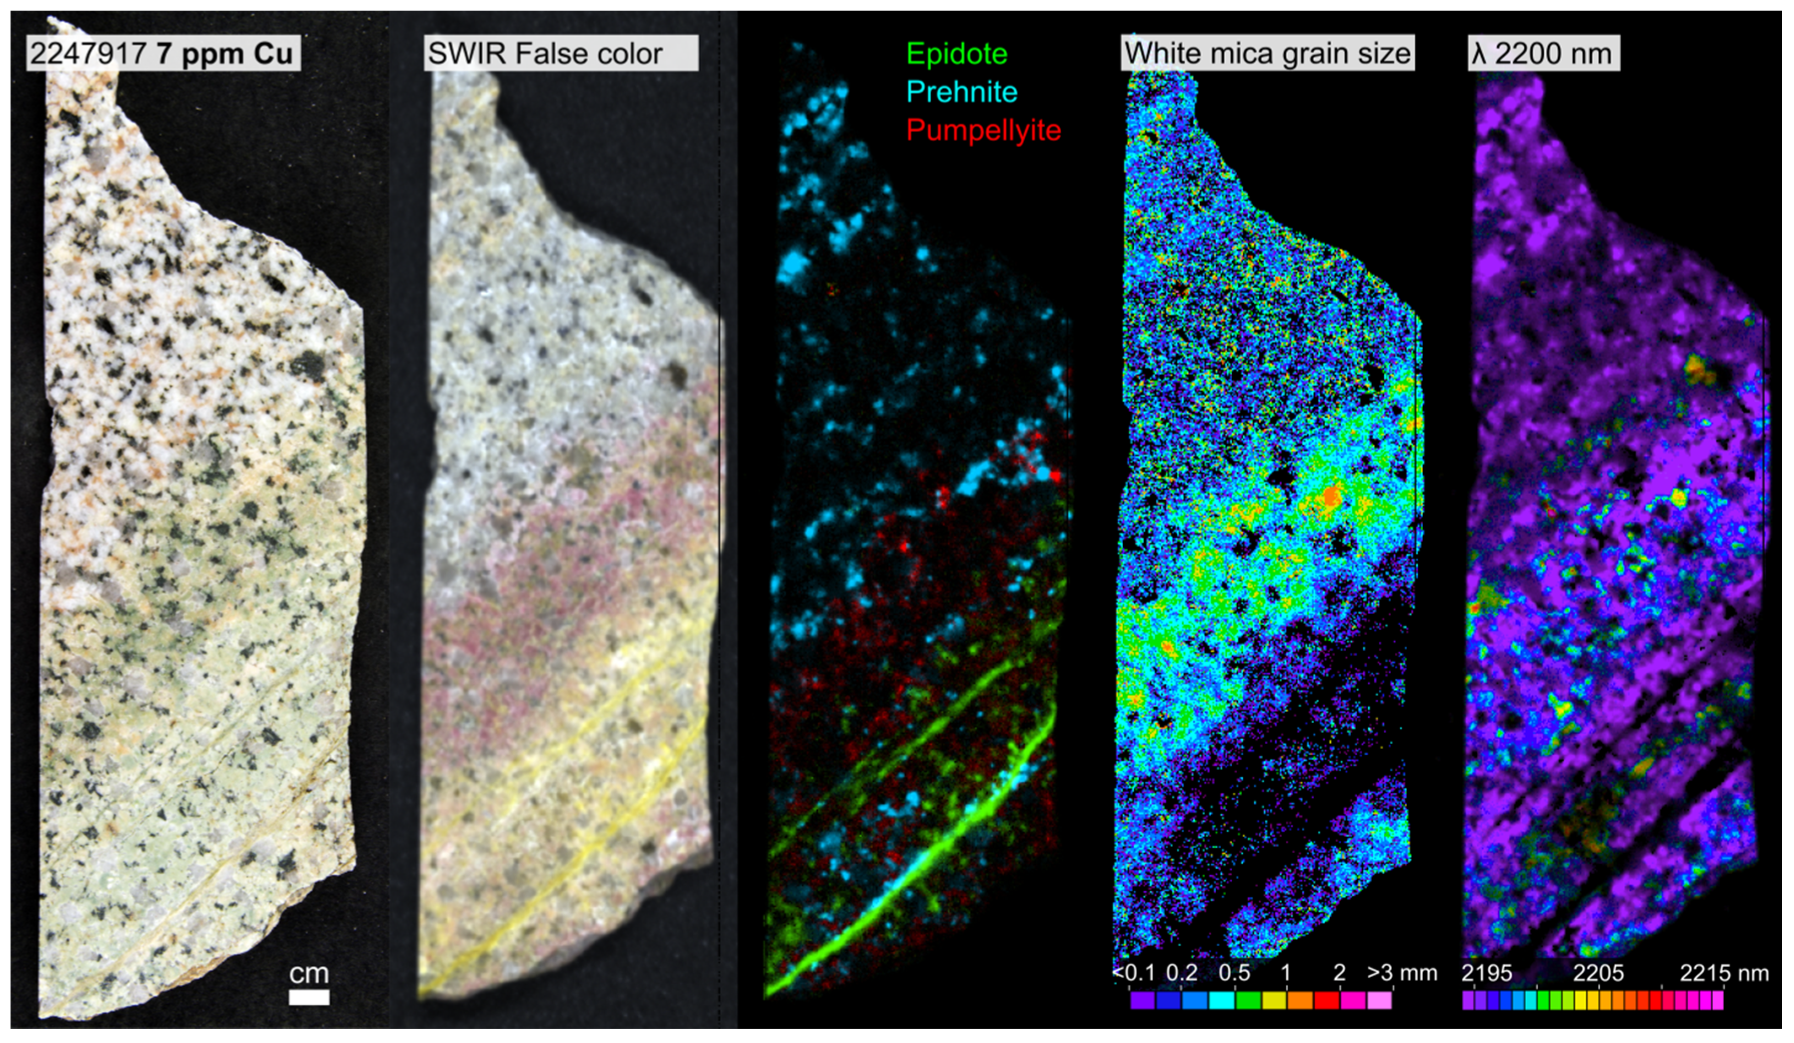
The Skeena facies is represented by a total of 118 samples, 15 of which contain sulfide mineralization. This facies is the main host rock for the Lornex and part of the Bethlehem deposits, and the entirety of the Highmont deposit. Skeena facies rocks present similar mineralogy to Bethsaida, with a major difference being that epidote veins or veinlets are ubiquitous, often with selvages consisting of prehnite (Figure A4), with or without associated coarse-grained phengitic white mica (long wavelength, near 2210 nm).

4.2. Sample Scale Variability in the Bethlehem and Other Facies

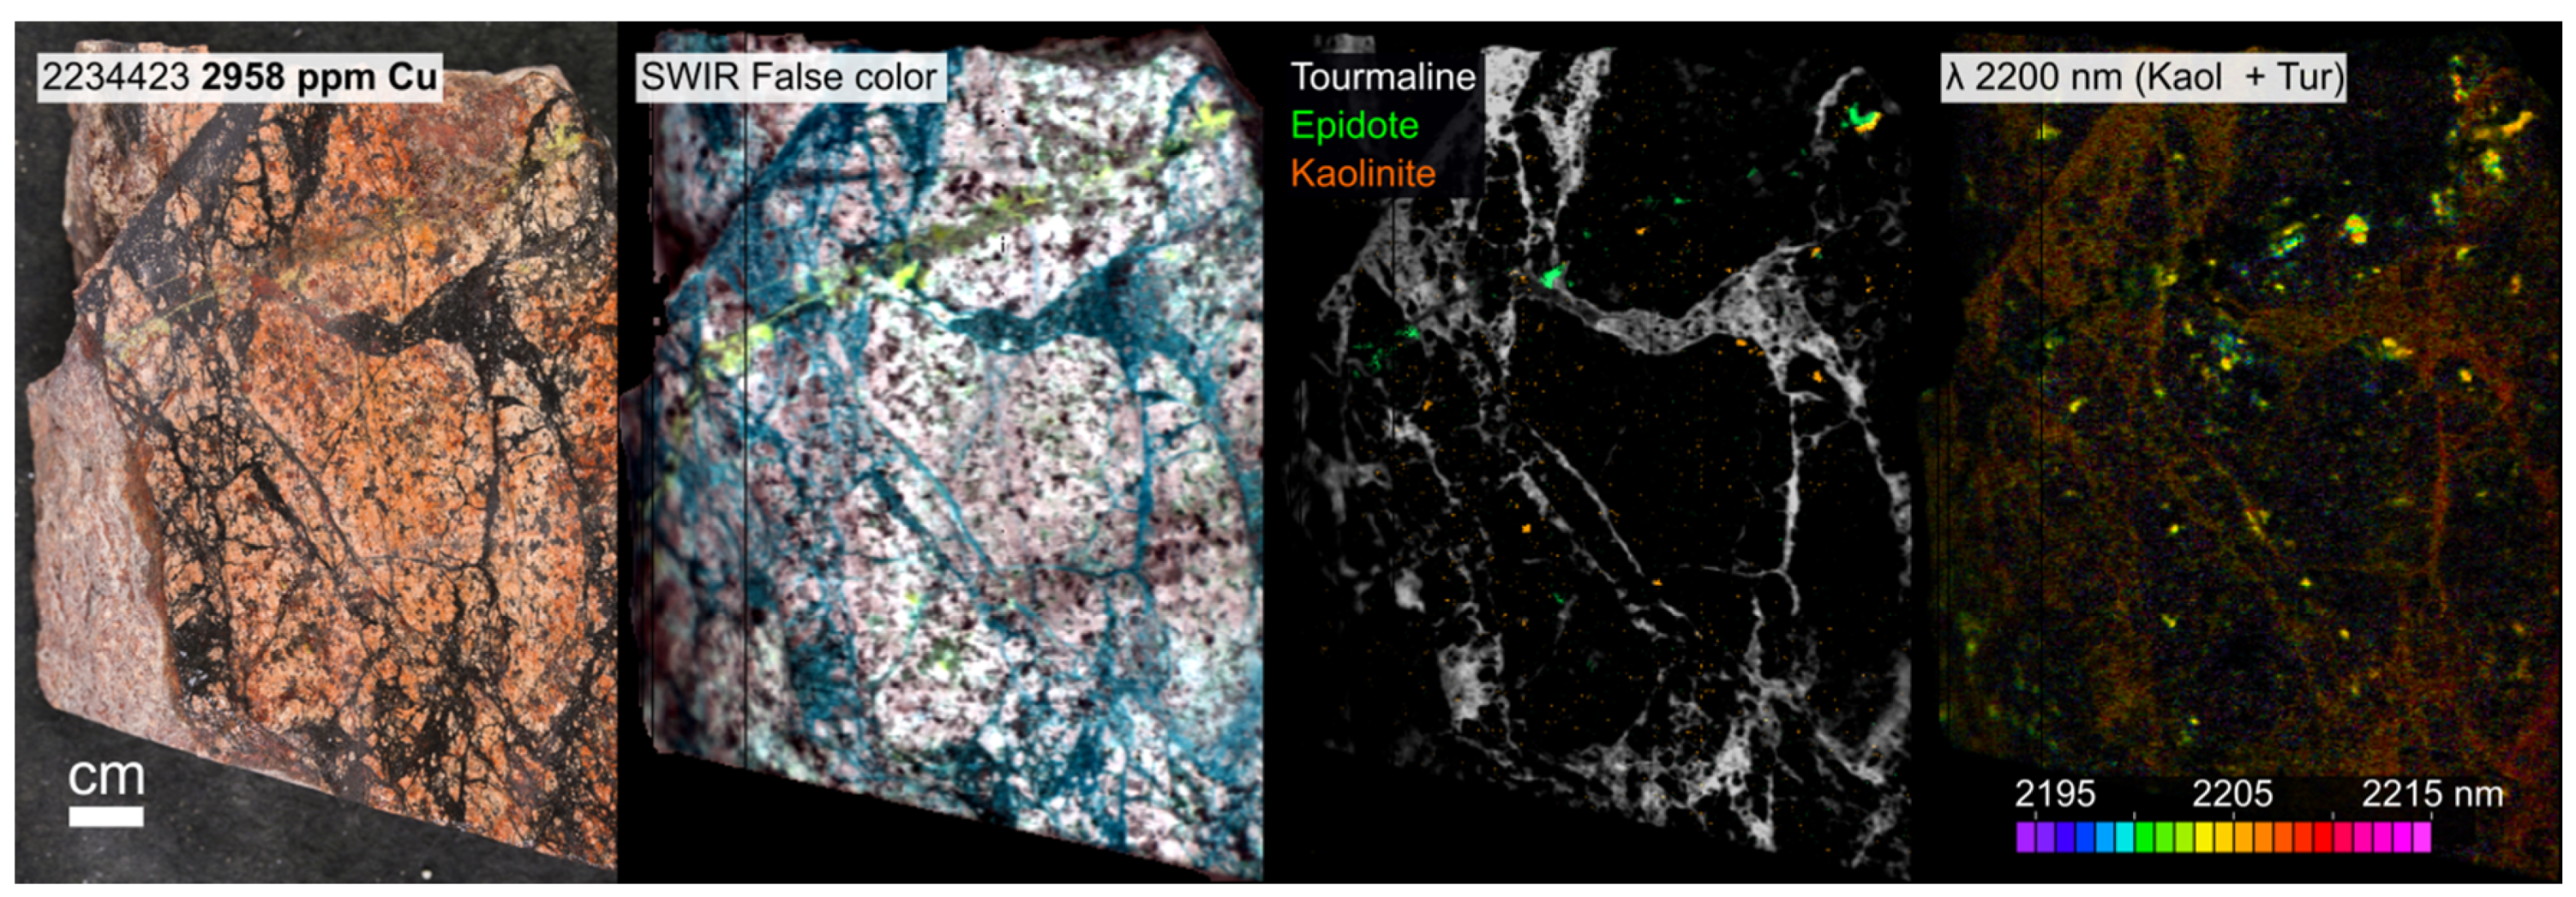
The Bethlehem deposit (not currently in production) and the >160 distal showings across the Guichon Creek batholith were not the focus of the NSERC-CMIC Footprints project, but several samples were nonetheless collected as part of investigations of the distal alteration footprint, and are briefly described here. The Bethlehem lithofacies rocks are grouped with the other two more mafic facies forming the outer margins of the Guichon Creek batholith (the Highland Valley and Border facies), and include samples from the Bethlehem deposit and numerous peripheral Cu showings. Of the 306 samples from these lithofacies, 11 were mineralized (here defined as >1000 ppm Cu), and, although the majority were from distal showings, all present broadly similar alteration patterns.
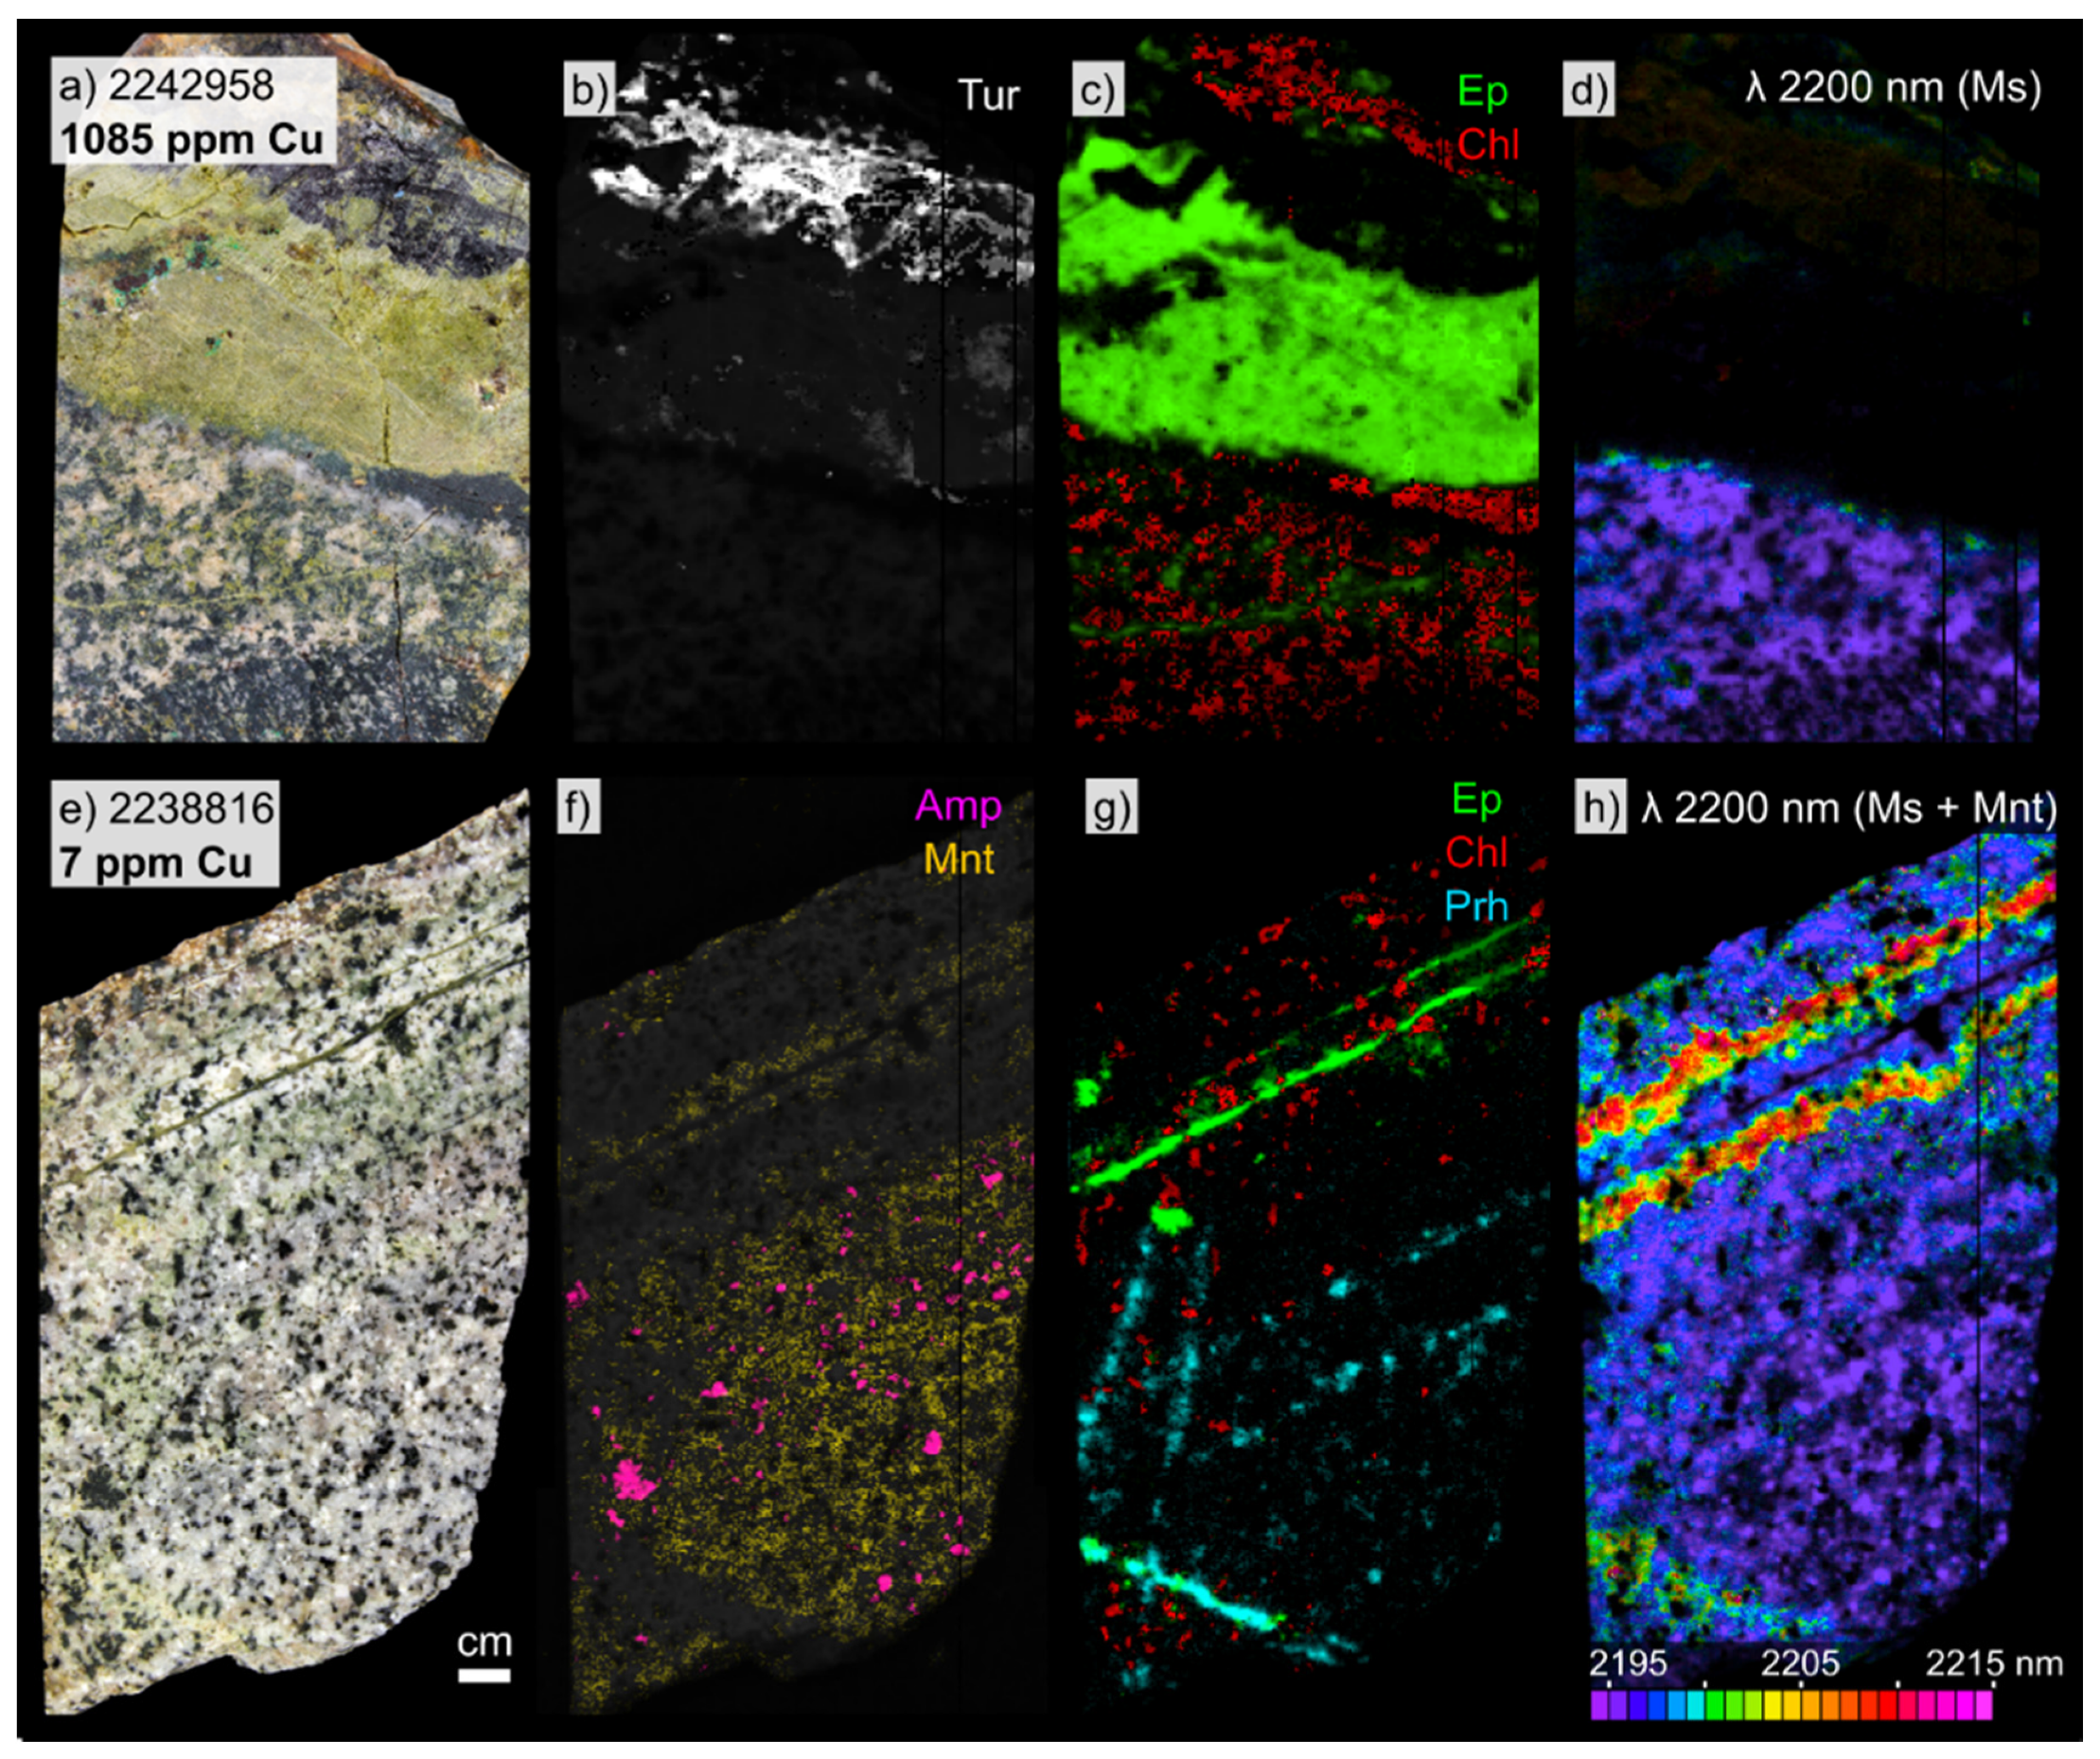
Figure 6 (top) presents a typical mineralized sample from the Guichon subfacies of the Highland Valley facies, and is located less than 200 m northeast of the Bethlehem open pit. Figure 6 (bottom) presents a typical unmineralized (but partially altered) sample from the Bethlehem facies, located 6 km to the west of the Lornex pit. This sample corresponds to the propylitic alteration zone described in [12].
In the Bethlehem deposit (and in the Bethlehem or Highland Valley facies rock) mineralization occurs in the presence of tourmaline veins (or breccia, Figure A5), often associated with significant amounts of epidote (Figure 6, top), but generally lack the coarse-grained grey muscovite (Al-rich) that is characteristic of mineralization in the Bethsaida and Skeena facies. In vein selvages, chlorite is abundant, and gives way to amphibole in unaltered portions of the samples (Figure 6f,g). The felsic mineral matrix consists of fine-grained Al-rich muscovite (absorption near 2195 nm, Figure 6d), generally without montmorillonite (no absorption near 1467 nm). In unmineralized (but partially altered) samples (Figure 6, bottom), small epidote veins or veinlets are widespread, and present centimeter-sized selvages that may contain intermediate to coarse-grained (0.2 to 0.5 mm) phengitic white mica (long absorption positions, near 2215 nm). In many samples, however, phengitic alteration is weak, and appears to either not have developed, or to have been partially or completely overprinted by short-wavelength (2195 nm) white mica, illite and/or montmorillonite (e.g., Figure 6f). Prehnite is common in the least altered samples (it is present in over half the samples in this group), and can variably occur as overprinting veinlets, as relict veinlets overprinted (cross-cut) by epidote veinlets, as vein selvages, or as dissemination. The general alteration pattern in the Bethlehem deposit therefore ranges from tourmaline and epidote veins with proximal chlorite (± phengite) selvages, to more distal prehnite (± montmorillonite) selvages or groundmass alteration, and finally to unaltered protolith amphibole.

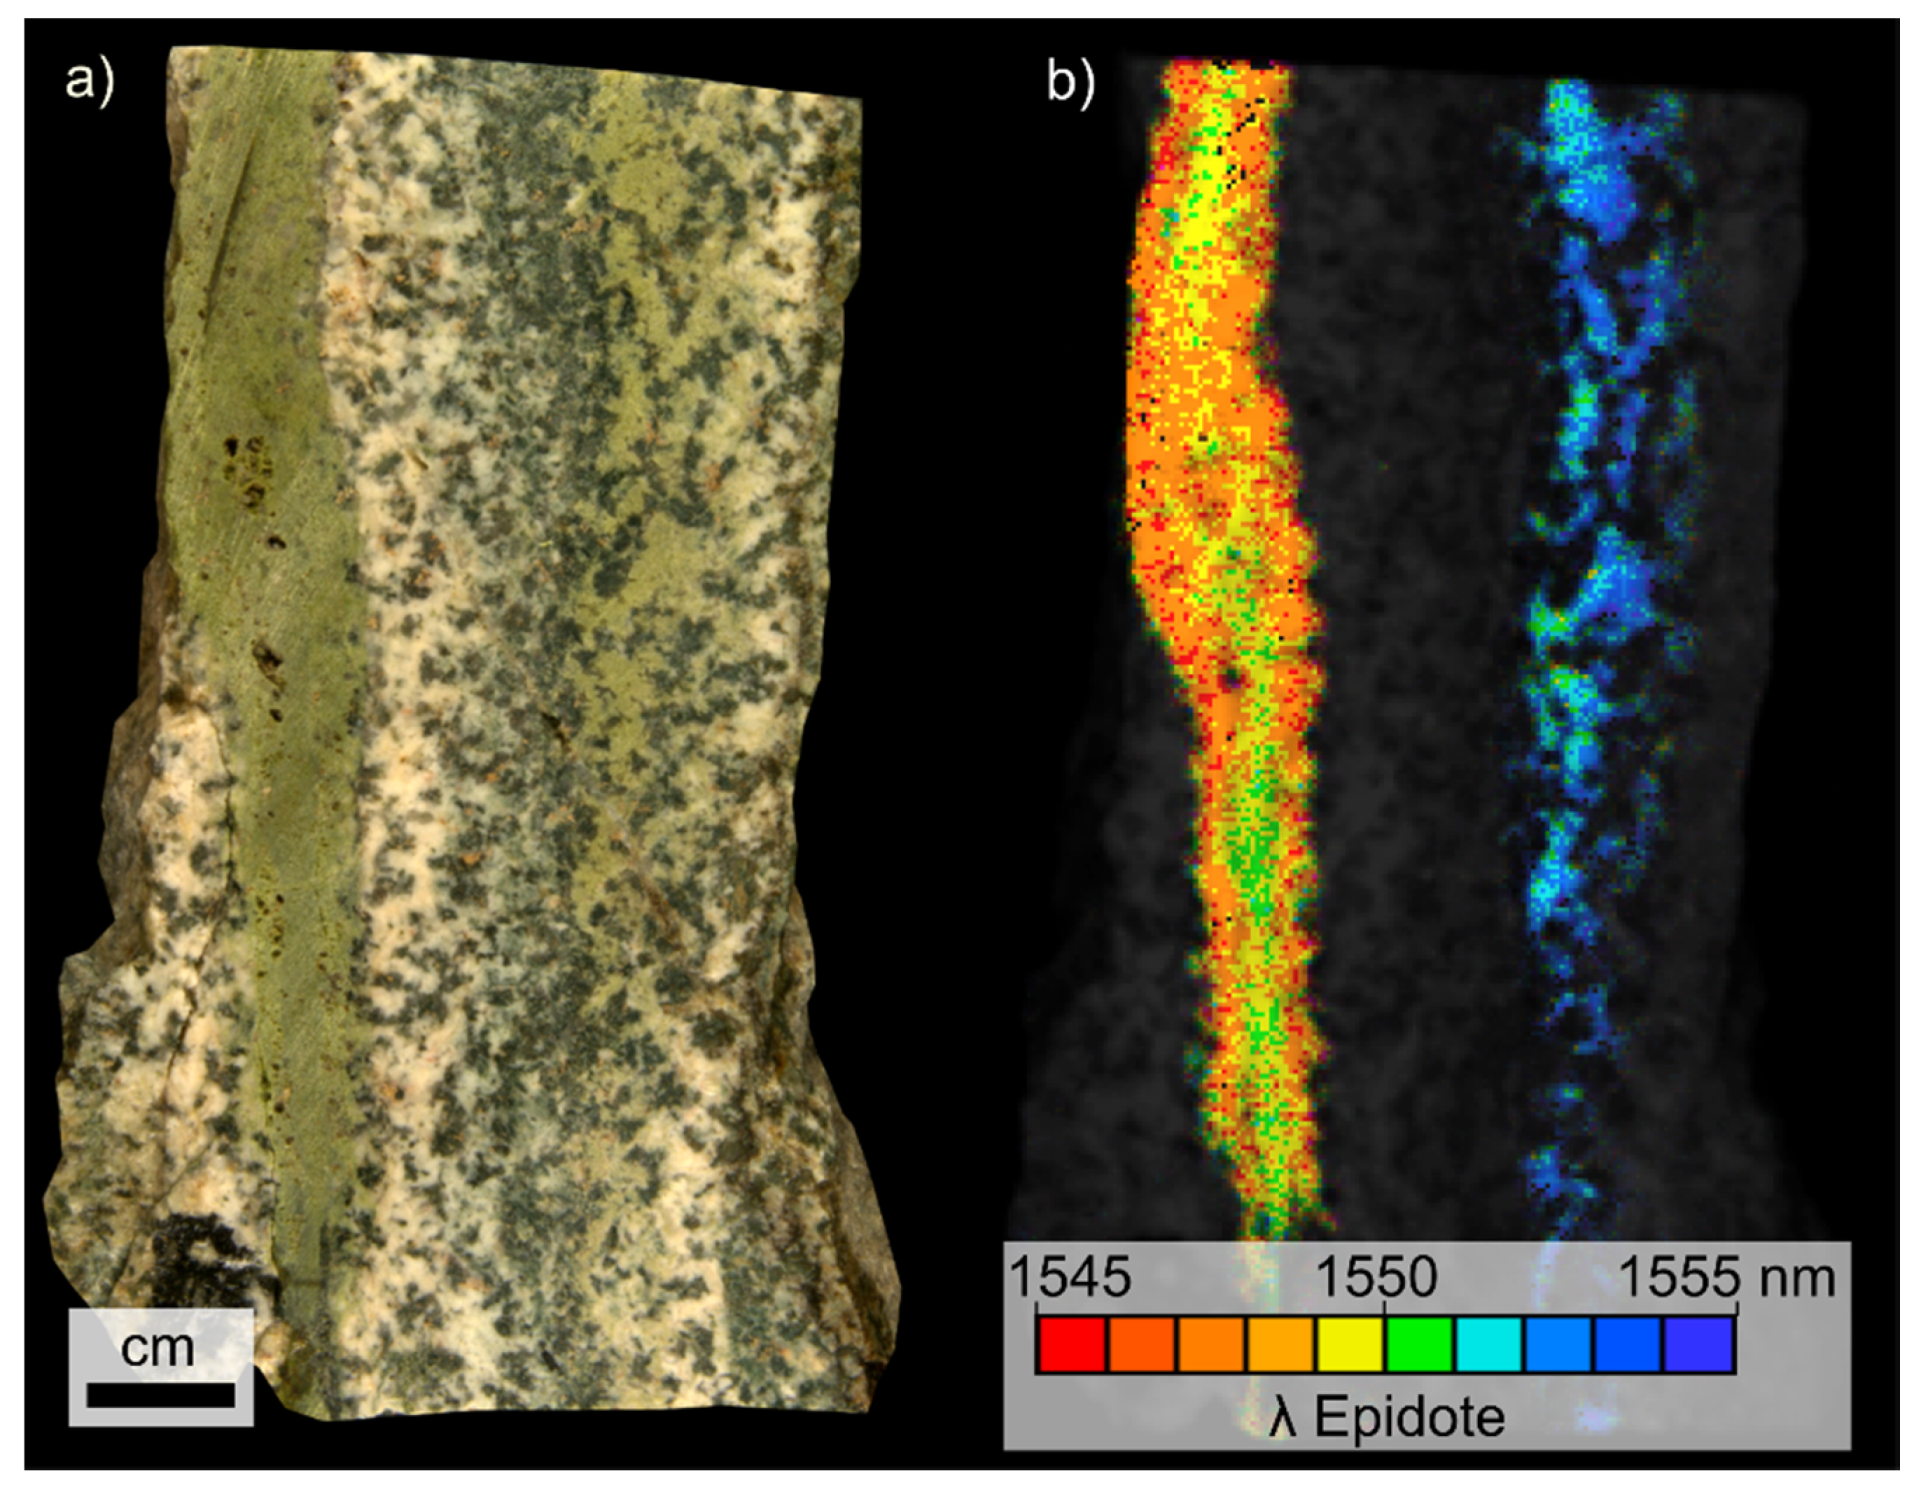
4.3. Mineral Chemistry of Epidote

Epidote group minerals are important alteration minerals in porphyry-Cu systems and are one of the most conspicuous indicators of alteration, often presenting an easily identifiable pistachio-green color. Epidote is ubiquitous at HVC, particularly in the Bethlehem and more mafic lithofacies. As for several other minerals investigated using hyperspectral imaging, the mineral chemistry of the epidote-clinozoisite solid solution can be estimated from the position of the characteristic absorption near 1550 nm. Epidote endmember, with an XFe = (Fe3+/(Fe3+, Al)) of ≈0.33 has its main absorption near 1542 nm, while endmember clinozoisite (XFe = 0) has its main absorption near 1558 nm, and variations in this position were recorded to vary within various alteration zones in an Australian Archean gold deposit [49]. This metric was investigated here as a potential vector to mineralization, with inconclusive results. Variability in absorption position (i.e., changes in mineral chemistry) was noted to occur within single veins, and veins within a given sample could present markedly different compositions. Both patterns are illustrated in Figure 7. Here, the left epidote vein shows a core with absorptions near 1551 nm (green colors), grading to 1545 nm near the edges of the vein (red colors). The second vein, on the right side of the sample, shows a main absorption position between 1552 nm and 1555 nm (blue colors). Because of the potential for variable epidote chemistry within any given sample, no systematic alteration patterns emerged on the 755 slab samples from epidote chemistry (systematic changes in trace element in epidote with distance to mineralization were reported [16], but these are not detectable using SWIR hyperspectral imaging). Similarly, no systematic changes in epidote relative modal abundances were apparent around the deposits.

4.4. Alteration Score and Detection of Mineralized Samples

Based on the detectable changes in mineralogy described in Section 4.1 and Section 4.2, a spectral alteration score can be defined to estimate the degree of alteration in a given sample (the methodology was described in Section 3.7). This metric relies on the presence or absence of a given set of minerals in each sample, where the presence of a mineral above (or below) a given modal abundance threshold yields a score of one (or two in certain cases). 
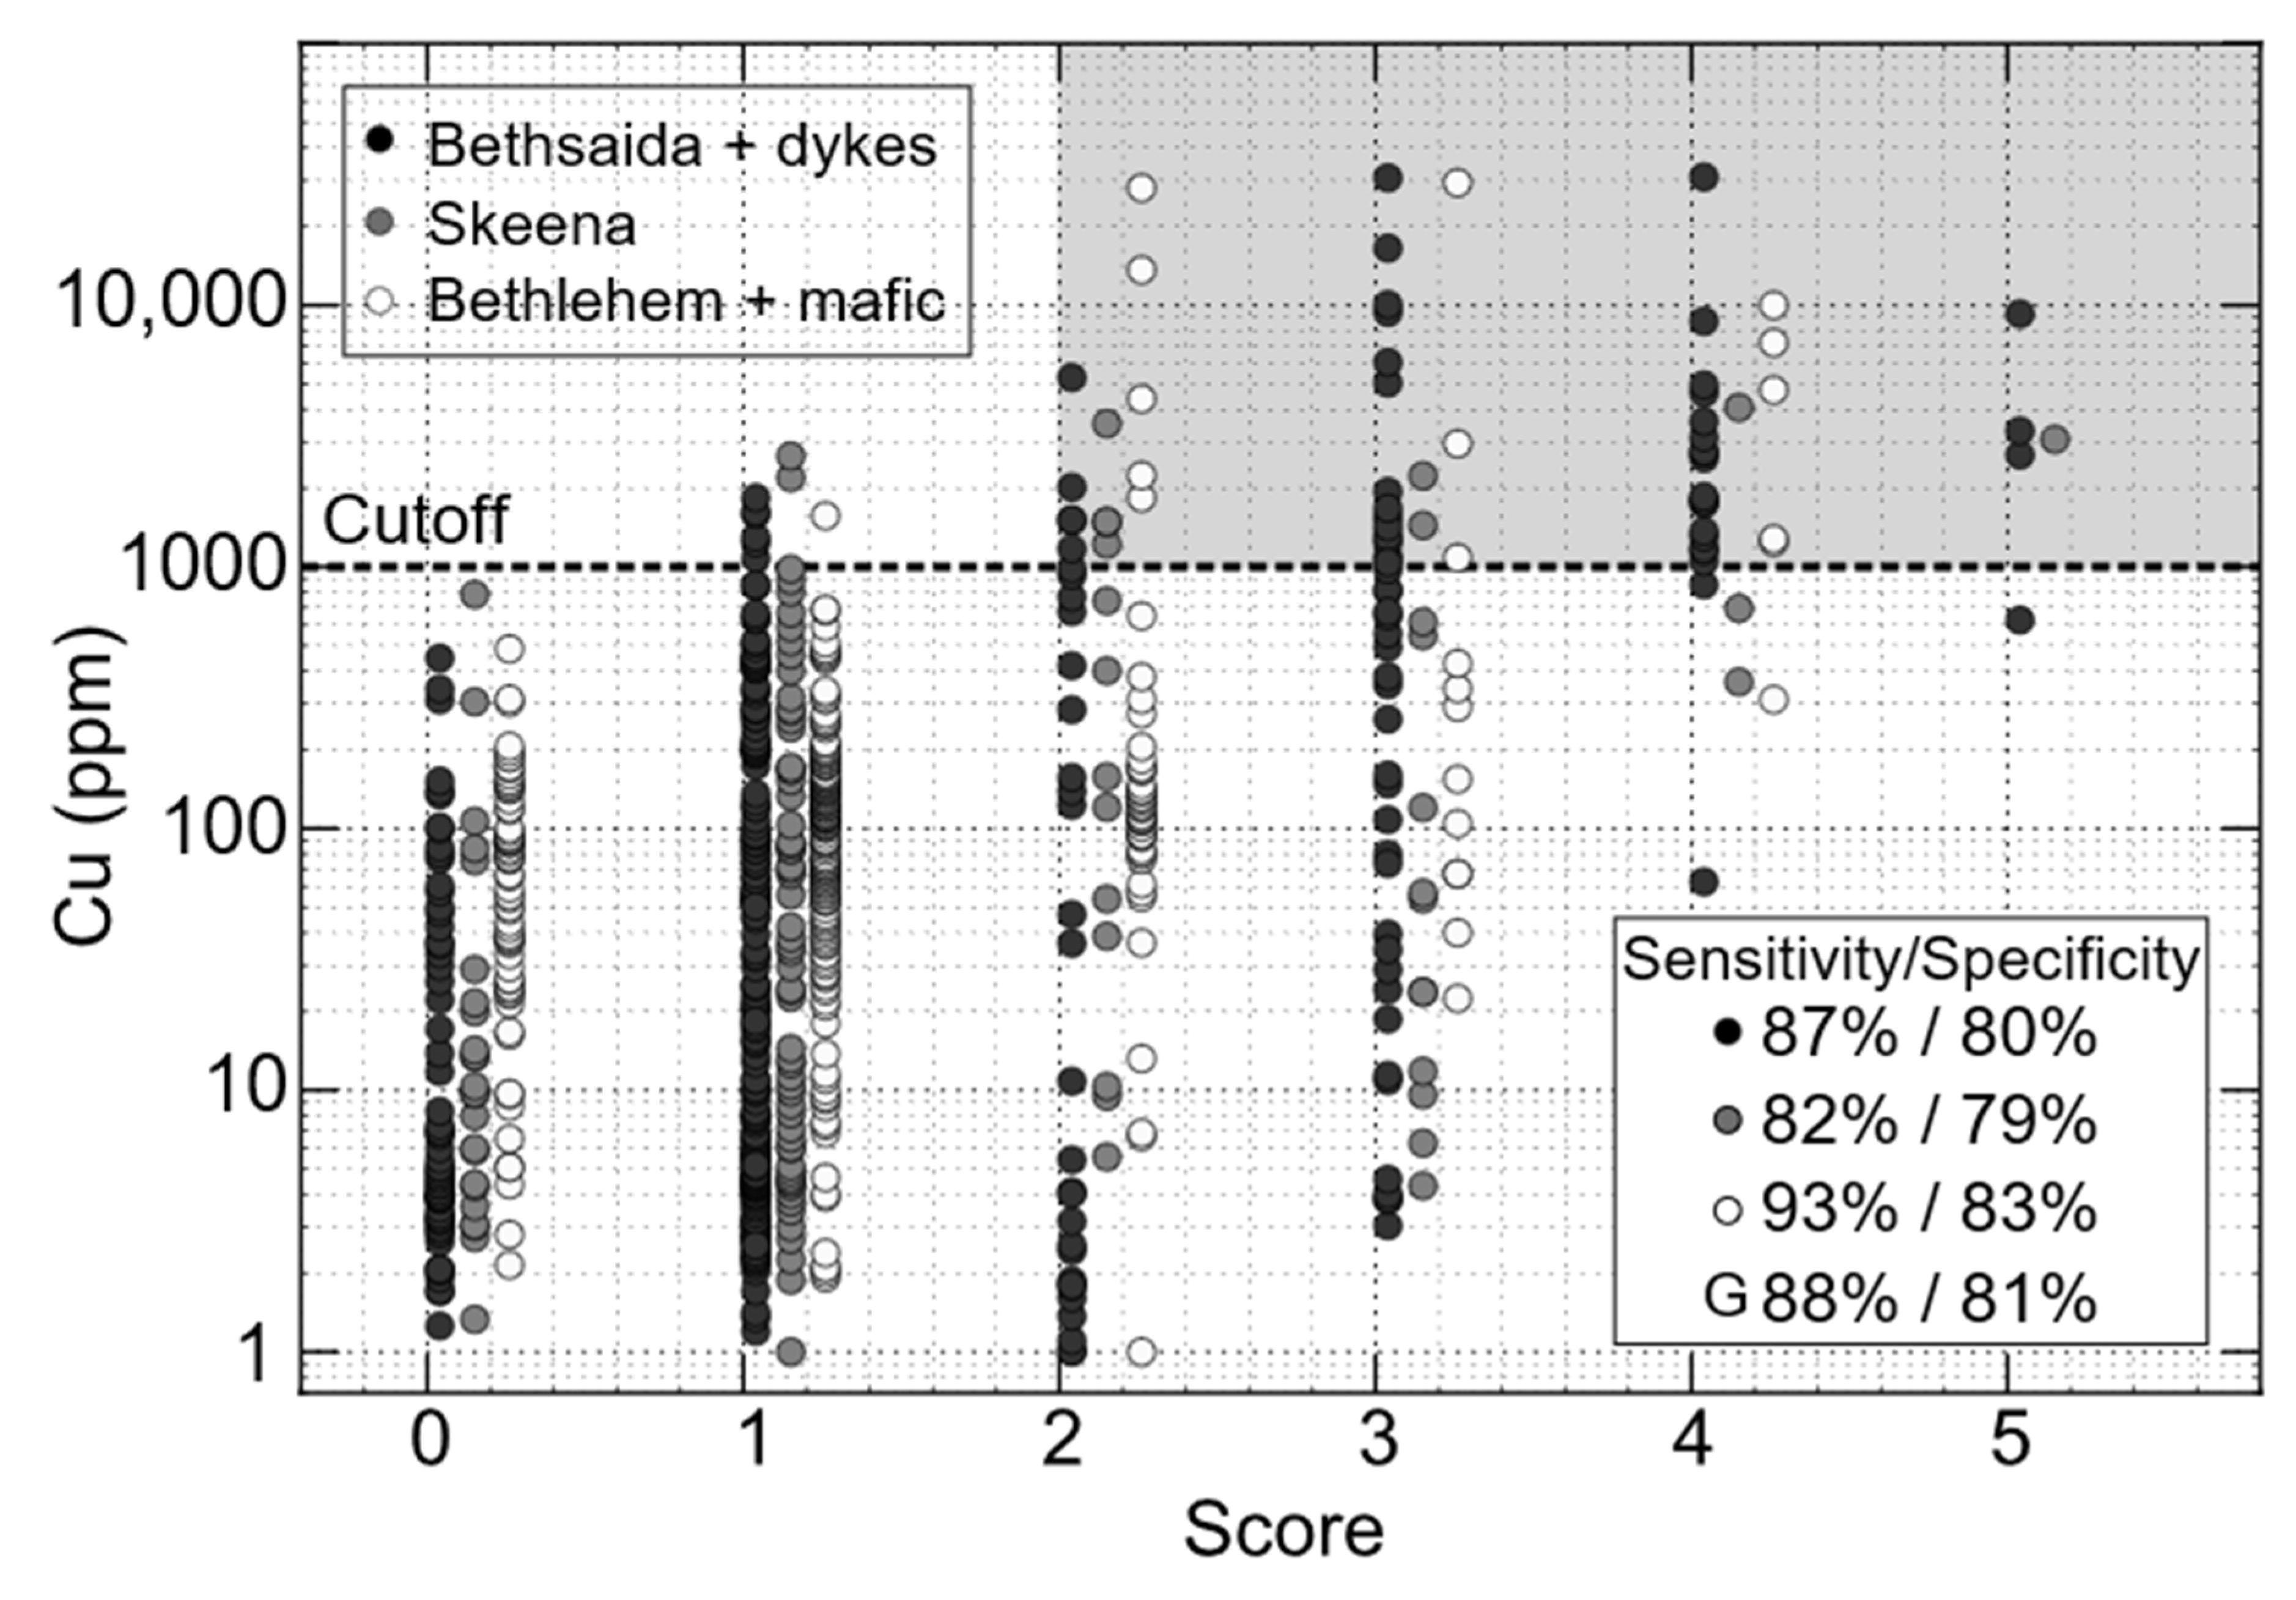
Table 2 presents a set of minerals that can serve to determine the degree of alteration in each of the rock groups in the Guichon Creek batholith and can also be used to distinguish between mineralized and unmineralized samples, as defined by a grade cut off value of 1000 ppm Cu.
For the Bethsaida facies and associated felsic dykes, the presence of over 5% of quartz, kaolinite, or coarse-grained muscovite (using a threshold of 1 mm), or the presence of less than 5% prehnite in a given sample each give a value of one to the alteration score. For the Skeena variety, the presence of over 5% of coarse-grained muscovite, less than 5% prehnite, and either less than 0.5% or over 20% epidote each give a value of one. For the Bethlehem and more mafic facies, less than 5% prehnite, less than 0.5% or over 20% epidote each give a value of one, and the presence of over 5% tourmaline or over 0.1% sulfides each give a value of two. Note that the exact abundance threshold is not critical to the good performance of the metric, but may serve to fine-tune results.
A scatter plot between the alteration score (obtained using the global metric defined in Table 2) and Cu concentration for the 755 slab samples is presented in Figure 8. Samples scoring two or above are considered mineralized. That is, samples with two minerals above (or below) the set threshold are classified as mineralized, and samples with tourmaline or sulfides (each giving a score of two) are always considered to be mineralized. The performance of this metric is reported for each rock group in the lower right side of Figure 8, and the last row reports the performance for the global set of mineralogical parameters, used to classify the 755 rock slabs regardless of lithofacies. Here, sensitivity refers to the true positive rate (i.e., the percentage of mineralized samples correctly identified as such), and specificity refers to the true negative rate (i.e., the percentage of unmineralized samples identified as such). For example, for the Bethsaida and associated felsic dykes, 87% of the mineralized samples obtain an alteration score at or above two, and 80% of the unmineralized samples obtain a score of zero or one. Importantly, by varying the abundance thresholds presented in Table 2, the resulting sensitivity or specificity may easily be adjusted. For example, changing the threshold for prehnite from 5% to 0.5%, decreases sensitivity in the Bethsaida facies from 87% to 85%, but increases specificity from 80% to 85%.
Generally, increasing spectral alteration scores are linked to higher Cu concentrations. Determining the exact Cu content of a given sample, however, is not possible, as Cu concentrations can vary by orders of magnitude within a given score value. For example, samples with a score of zero can have a Cu content between 1 and 1000 ppm, while those with a spectral alteration score of five can have Cu concentrations between 500 and 10,000 ppm.

4.5. Mineralogical Patterns on Drill Core Scales

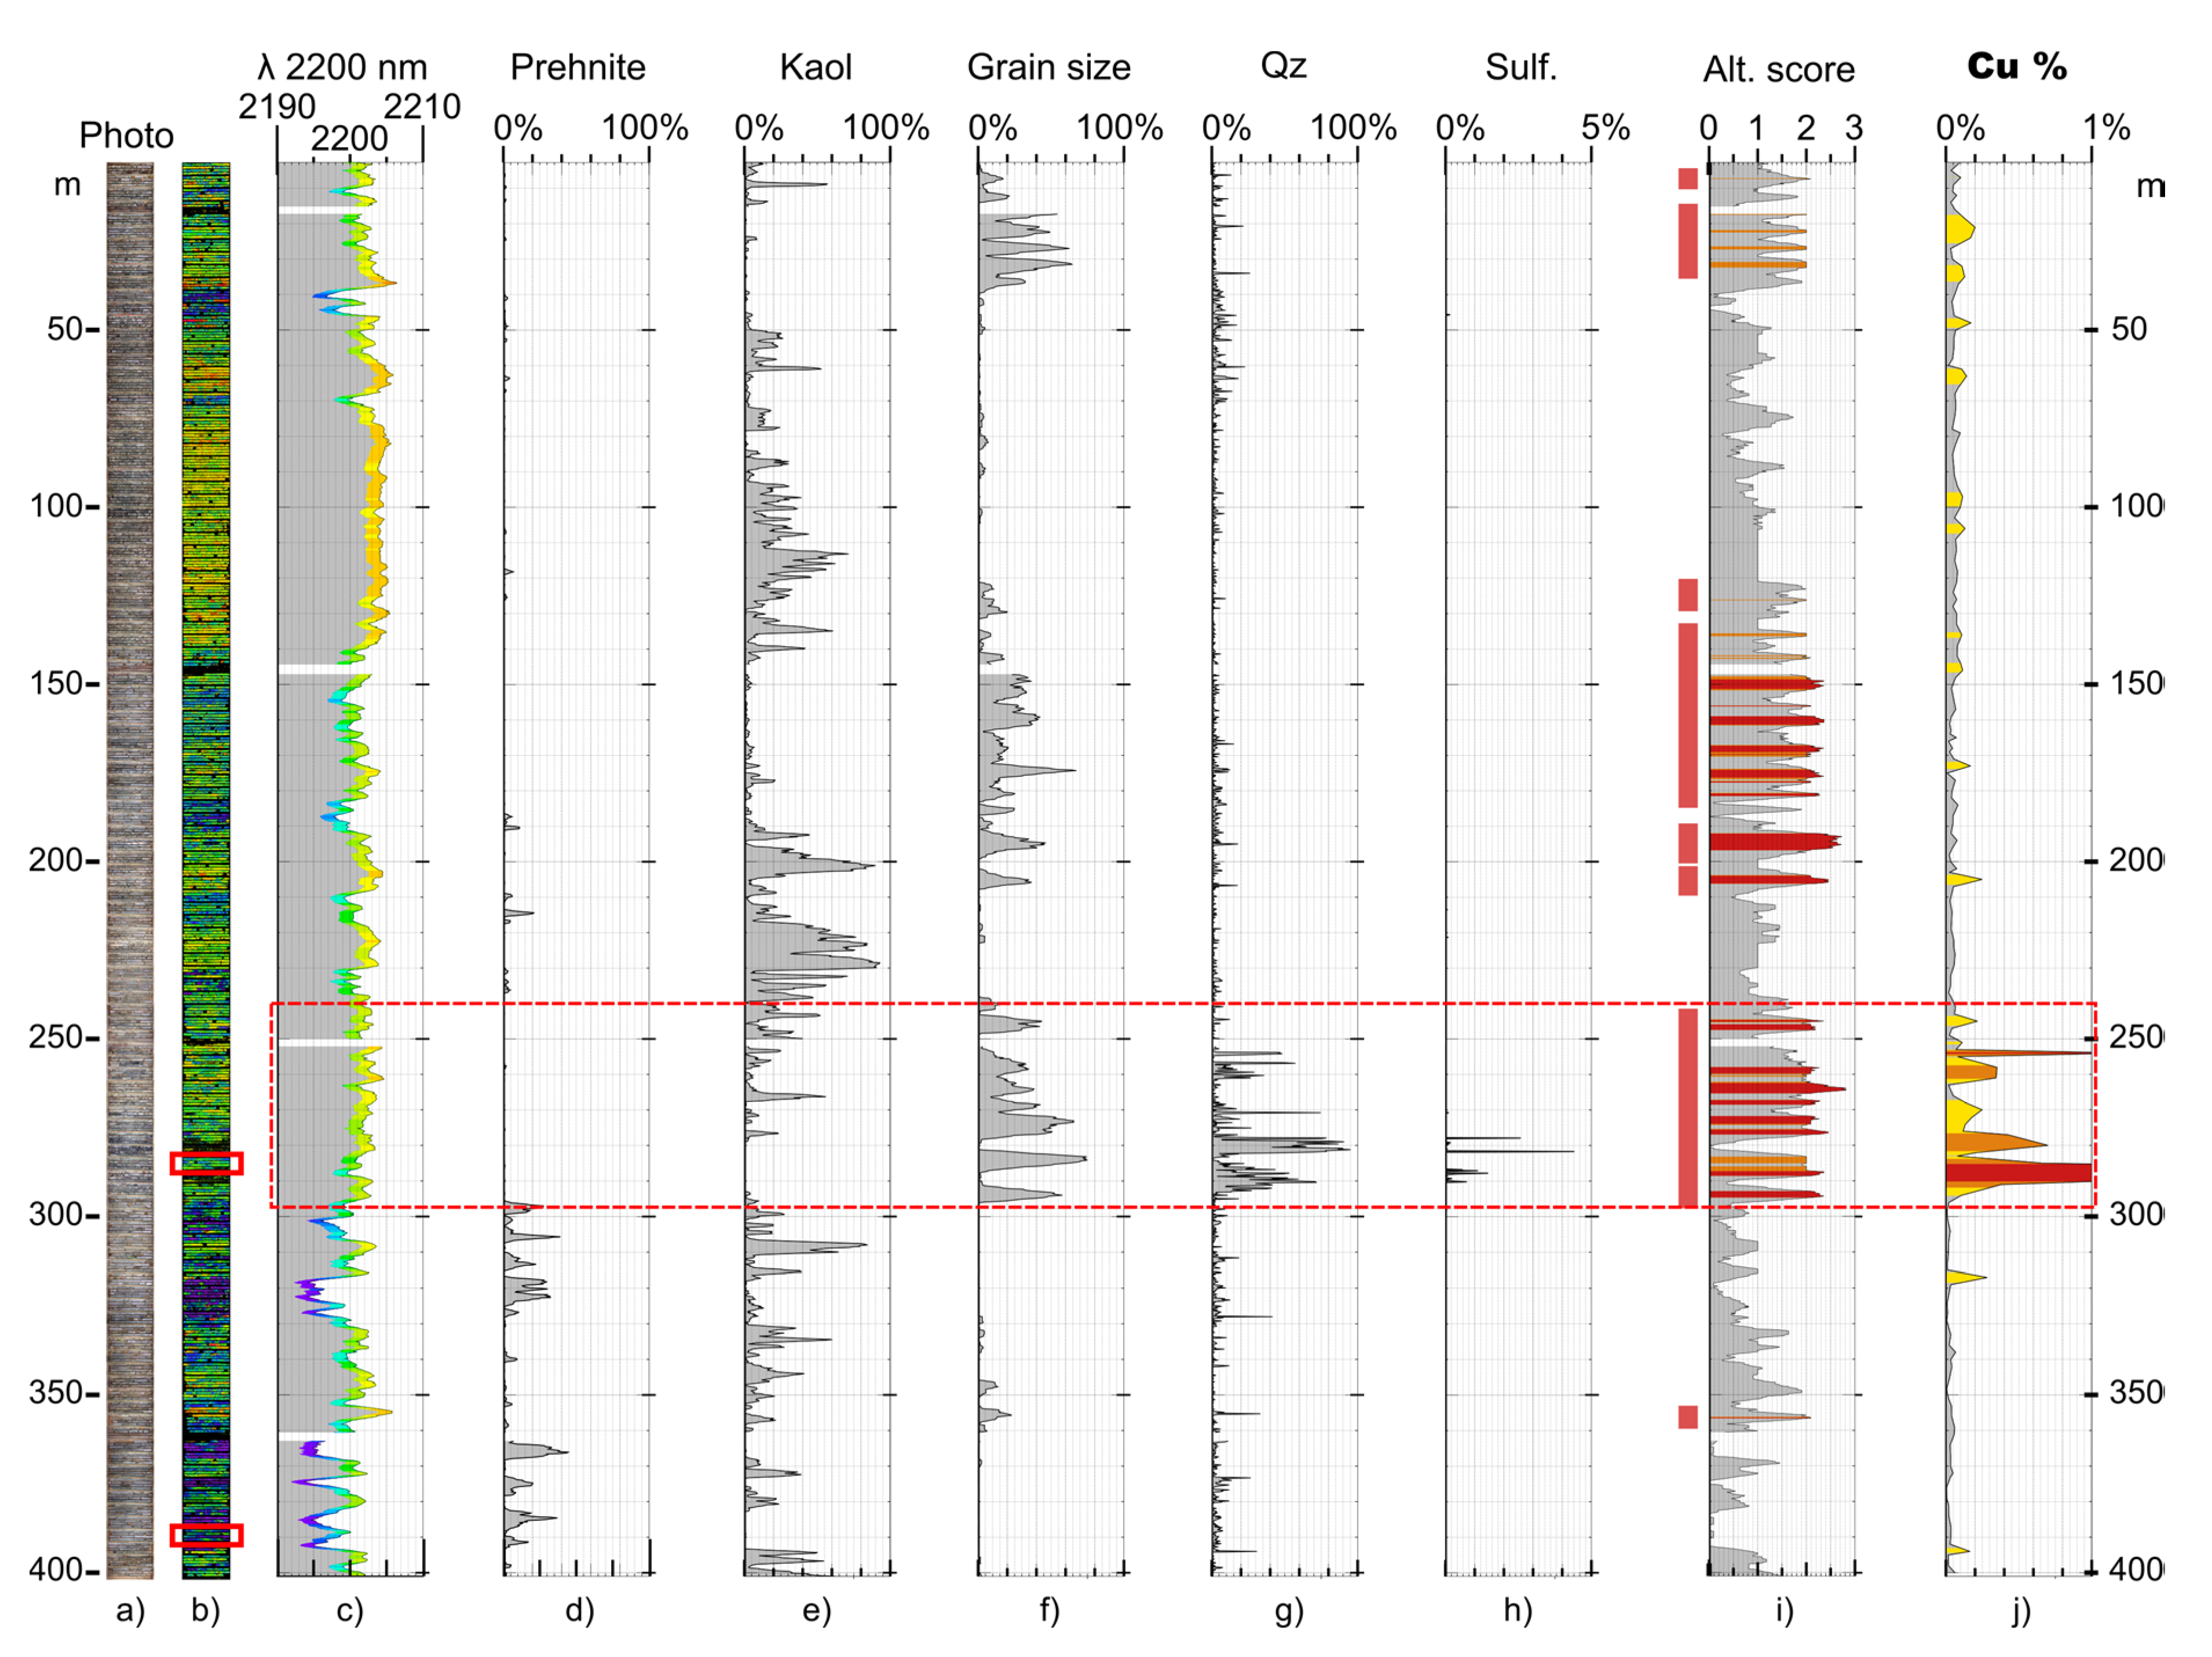
Hyperspectral imaging allows the analysis of large samples (e.g., drill cores), which may reveal decimeter- to meter-scale mineralogical patterns that would otherwise not be detectable on smaller scales. It may also provide insights into the continuity (or discontinuity) of hydrothermal alteration around mineralized intervals. The mineralogical patterns previously identified from hand samples and the resulting spectral alteration score are employed here to delineate potentially mineralized intervals directly on 400 m of continuous drill core.
Figure 9 presents summary downhole plots for drill hole V15–021, drilled into the Bethsaida granodiorite, 900 m southwest of the Valley deposit. The core intersects both mineralized and unmineralized intervals, and ore grades, as assayed by the mining company, are reported in Figure 9j. The main ore zone is highlighted by the red dashed outline. Within this particular drill hole, the most obvious change in mineralogy within nearly the entirety of the mineralized interval is the presence of intense quartz veining (Figure 9g), with sulfides detected within restricted intervals (Figure 9h, several cm-sized sulfide veins are present in the core at these locations). Intense quartz veining, however, is not always indicative of mineralization at HVC, as barren quartz-rich zones (the barren core) are known to occur in portions of the deposit. On the other hand, coarse-grained white mica (generally above 1 mm in thickness, from the spectral metric defined in Section 3.5), is nearly always indicative of mineralization, and is abundant within and immediately surrounding the quartz veins (Figure 9f). Low abundances of kaolinite can also occur within the mineralized zone, but the largest amounts occur over several hundred meters immediately surrounding the main ore zone (Figure 9e). Distally, where kaolinite alteration is less intense, prehnite veins become sporadically apparent (Figure 9d). Together, these minerals define the spectral alteration score (Table 2). The effectiveness of this metric can be assessed from downhole data, where all intervals assayed above 0.3% Cu (between 250 m and 300 m), and most intervals above 0.1% Cu show a score at or above two (Figure 9i). Note that, although in this specific drill core, the spectral alteration score appears to be particularly dependent on white mica grain size, the other minerals defining this metric are essential to obtain adequate classification results in other HVC samples.
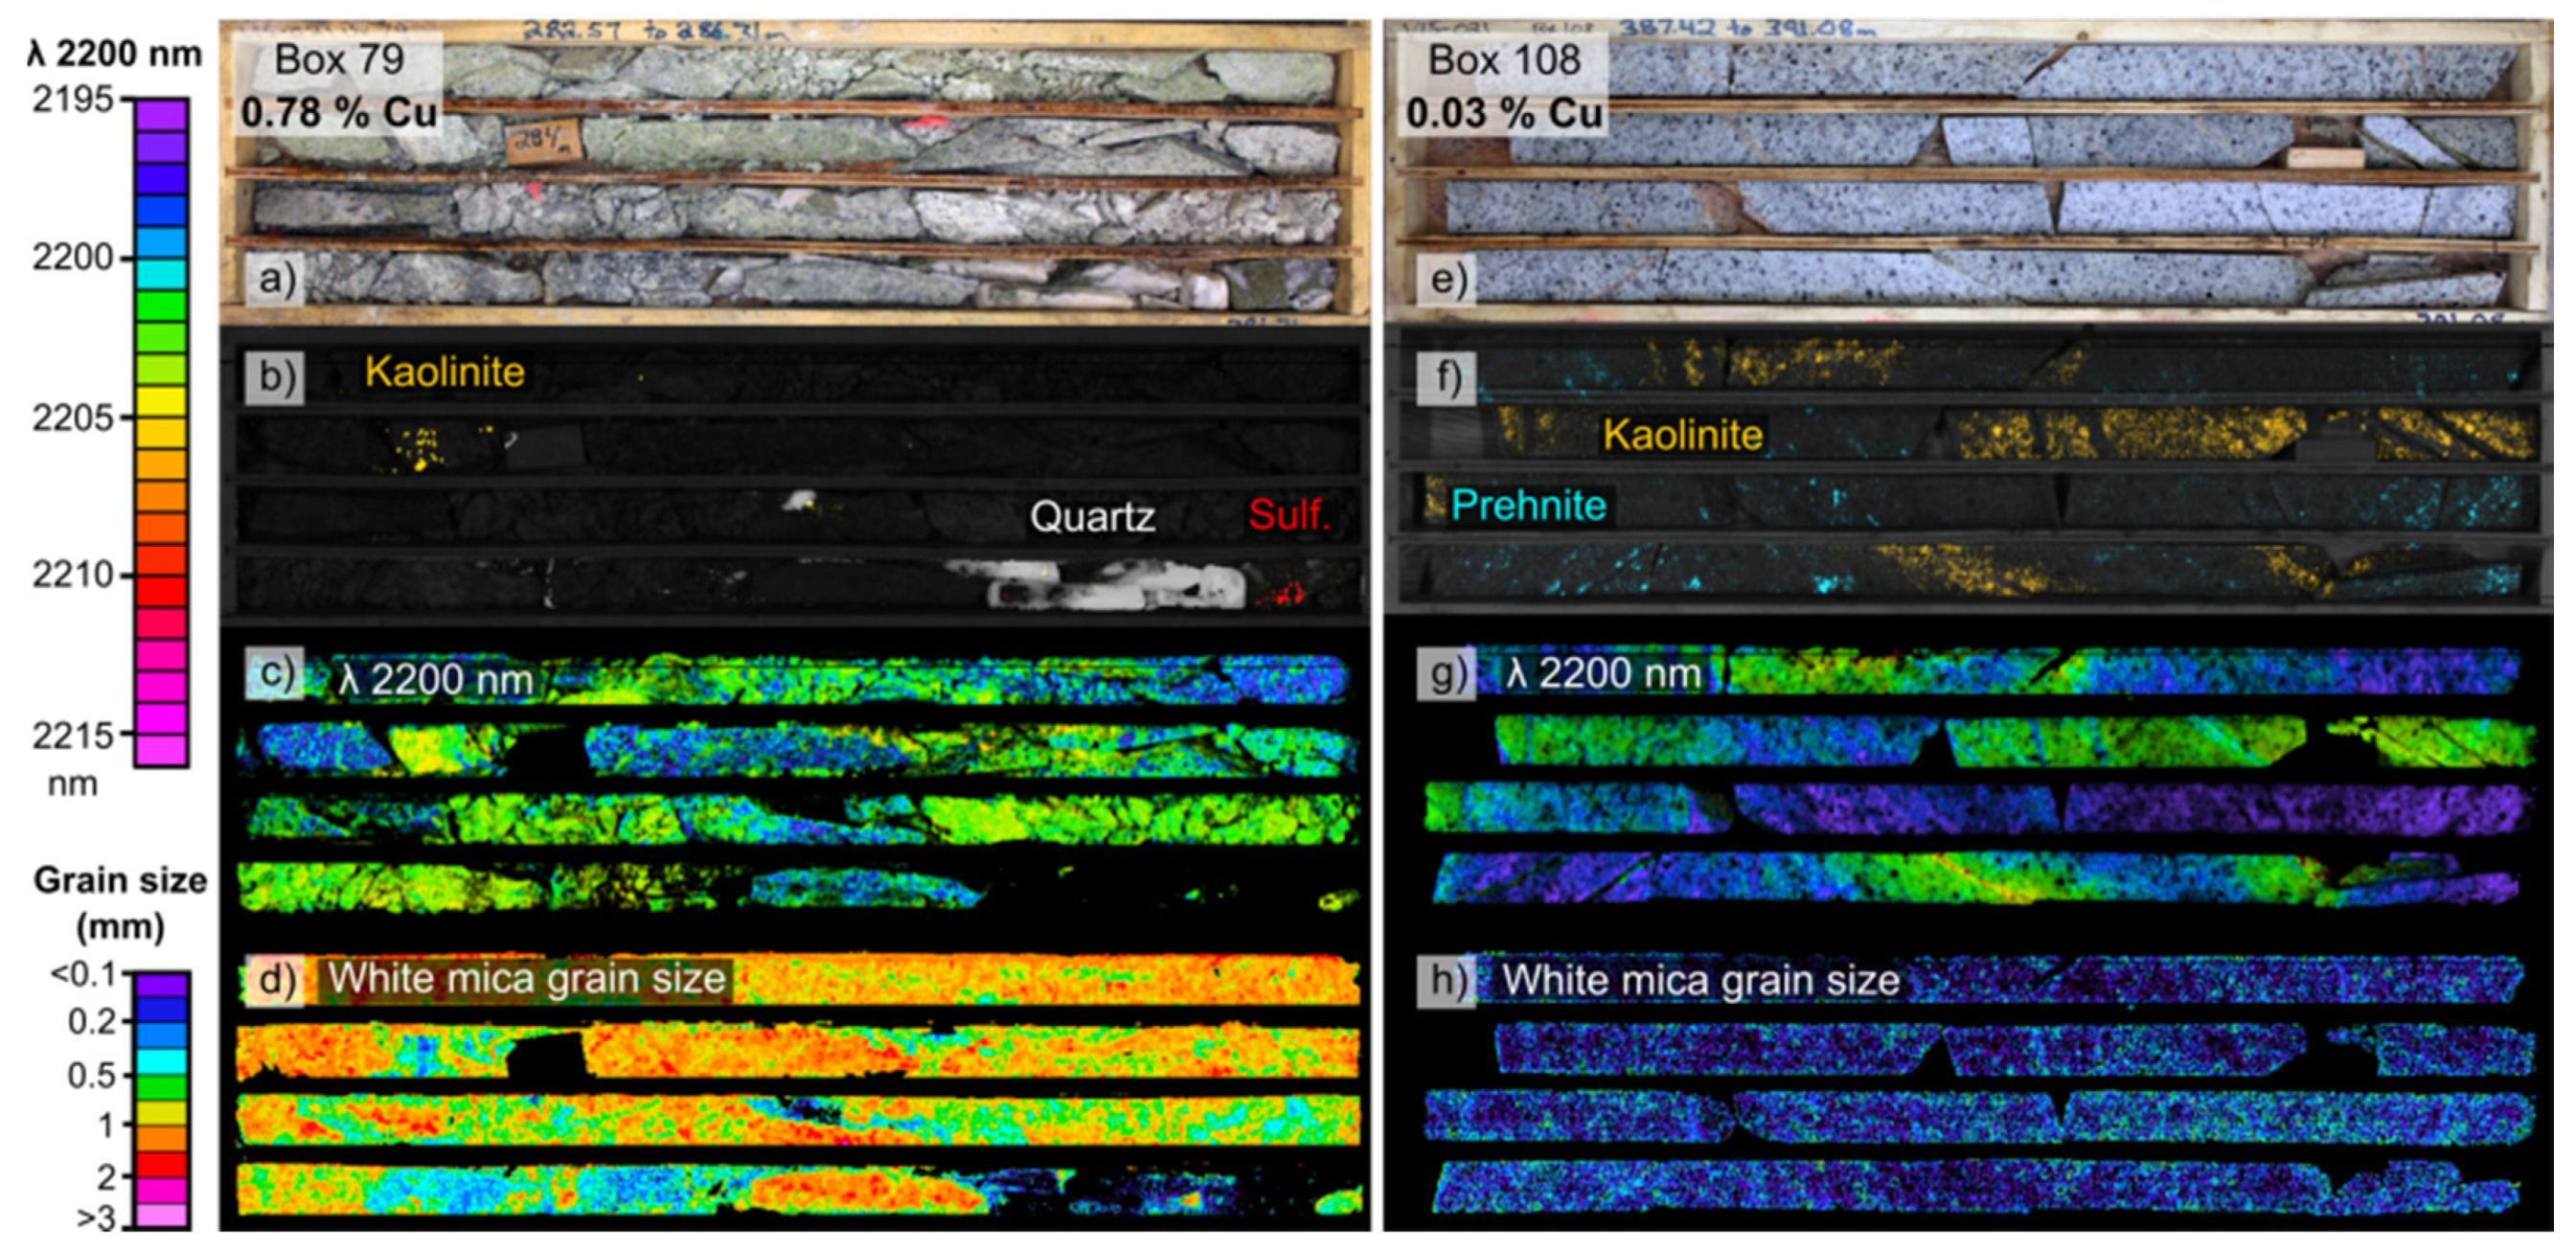
Figure 10 presents close-up imagery of two core boxes selected from the continuous drill core (location highlighted in Figure 9b), showcasing typical mineralogical patterns in both a strongly mineralized interval (Figure 10 left, 0.78% Cu), and a weakly altered but barren interval (Figure 10, right, 0.03% Cu), 100 m away from the mineralized zone.
The mineralogical changes seen over several hundred meters of drill core surrounding the ore zone are repeated here on smaller spatial scales (Figure 10b). A sulfide vein (3 cm) is present within or directly adjacent to a wide quartz vein-rich zone (30 cm), which is then surrounded by coarse-grained white mica (a 3 m zone) that is muscovitic in composition (low wavelength, 2195 nm within the coarsest grains on Figure 10c). Kaolinite may be present throughout and may interfere with the estimation of white mica chemistry. Prehnite and kaolinite occur sporadically in barren intervals in the form of veins of varying orientations, with centimeter- to decimeter-scale selvages. As veins are generally 10 to 50 cm apart, these could not fully be captured on a single hand sample scale (10 cm by 10 cm). Outside of the vein haloes, background, fine-grained white mica (Figure 10h, variably with or without montmorillonite, not shown) always shows Al-rich composition (low-wavelengths, below 2195 nm, Figure 10g). In transitional areas between the kaolinite veins and white mica background (i.e., in the vein haloes), the apparently intermediate 2200 nm absorptions positions (all yellow-green-blue colors, 2204 nm to 2196 nm) are likely caused by mixing between the 2195 nm absorption of background, Al-rich white mica and the 2205 nm absorption of kaolinite (note how all areas above 2195 nm on Figure 10g show some amounts kaolinite in Figure 10f, and is further discussed in Section 5.4).

4.6. Regional Scale Mineralogical Patterns

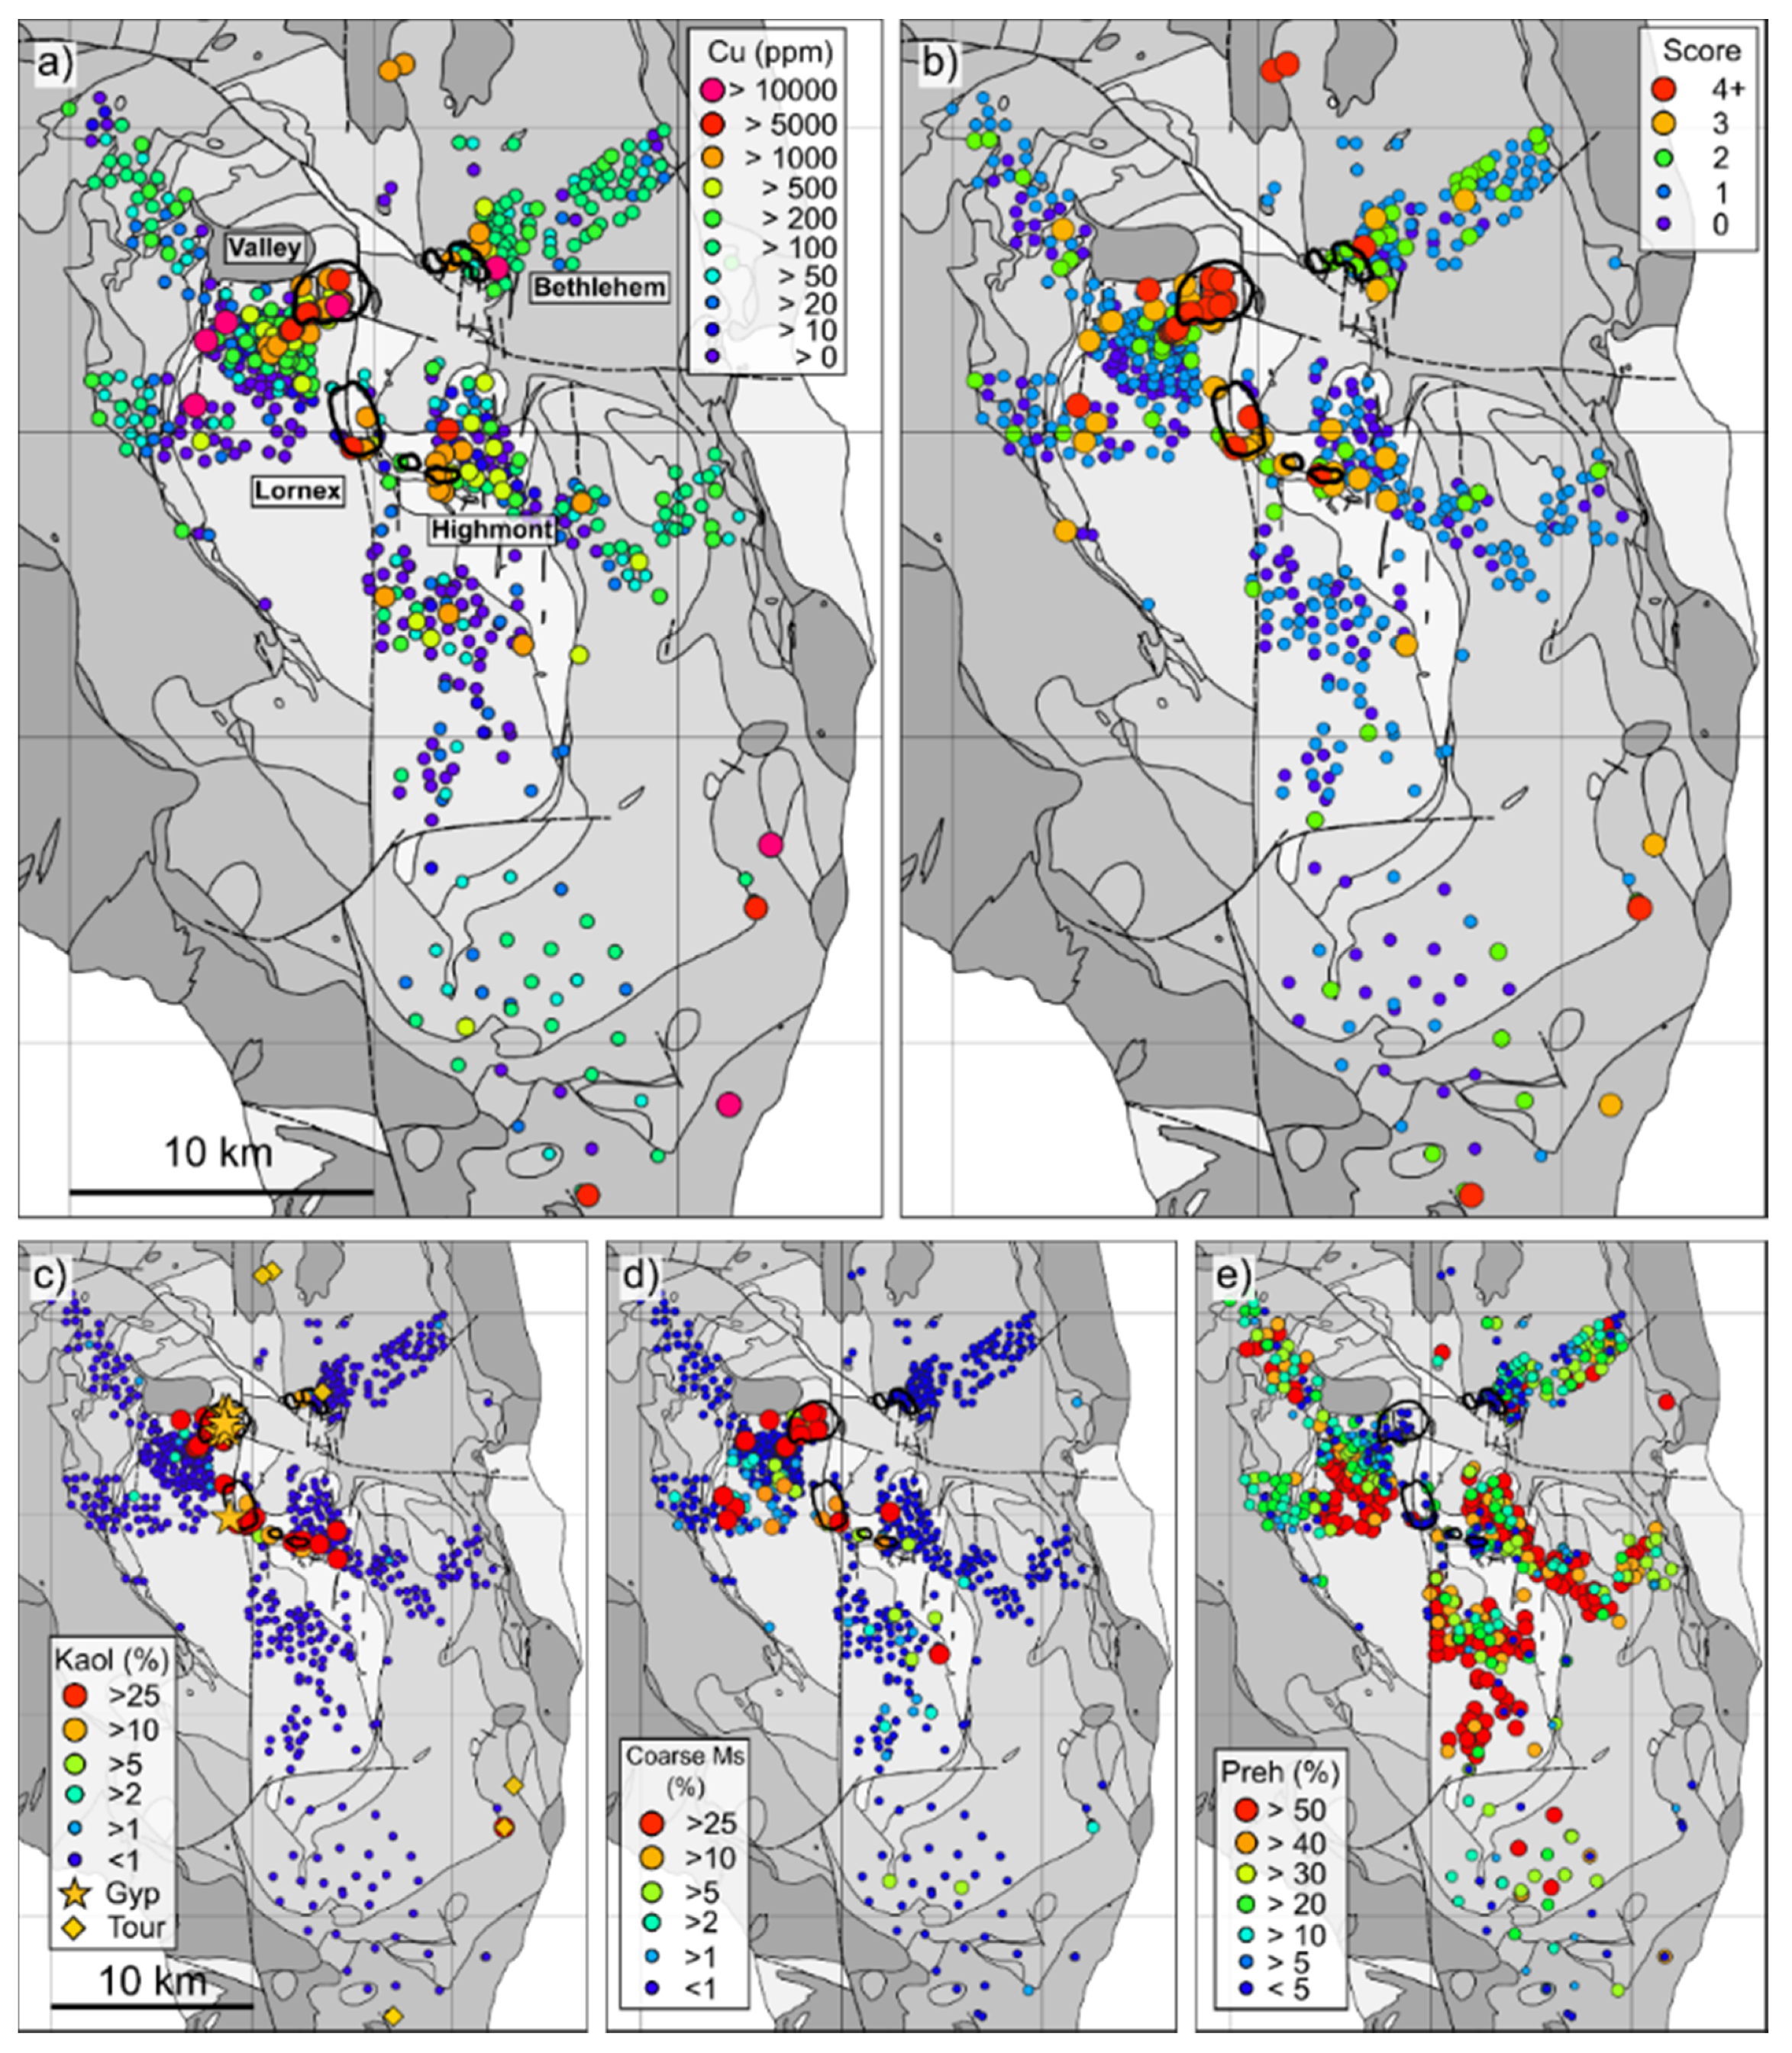
The 755 slab samples investigated in this study span a roughly 20 km by 40 km area surrounding the Highland Valley deposits and encompass a large portion of the Guichon Creek batholith. Regional mapping of the mineralogy related to hydrothermal alteration described in Section 4.1 through Section 4.5 can potentially highlight (or allow vectoring to) mineral deposits. Figure 11 presents regional scale geochemical and spectral data for all slab samples, with Cu concentration presented in Figure 11a. Most samples above 1000 ppm Cu occur within, or close to the open pits (Valley, Lornex, Bethlehem and Highmont), but several small showings also occur at the periphery of the batholith. Individually, several minerals serve to indicate proximity to mineralization. Gypsum occurs exclusively in mineralized areas within the limits of the open pits, while tourmaline occurs with mineralization in the individual showings. Kaolinite can occur up to 2 km outside the pits, and coarse-grained white mica (above 1 mm in thickness, determined from the spectral metric defined in Section 3.5) can be detected up to 4 km away from the deposits. Within the open pits, coarse-grained white mica is muscovitic (high-Al) in composition, showing absorptions near 2195 nm (this corresponds to the grey muscovite referenced in [21,22]). Prehnite is the most distant spectrally detectable alteration mineral, defining an annular alteration zone extending from 4 km to 8 km around the deposits.
In many cases, prehnite veinlets present selvages of coarse-grained, green-colored phengitic white mica (low-Al, long absorption wavelengths near 2215 nm), while background white mica (which may variably contain illite and/or montmorillonite) always shows small grain sizes (below 0.2 mm, Figure 5g) and low absorption wavelengths (near 2195 nm, Figure 5h). These mineralogical parameters define the spectral alteration score (as defined in Table 2 and Figure 8). Samples with high spectral alteration scores are spatially related to the mineralized zones, both within the open pits and in individual showings. Samples also generally show increasingly higher scores as mineralization is approached (e.g., immediately southwest of the Valley open pit, from a score of zero at 5 km, to a score of four within the pit). This score could therefore serve as a vector to mineralization on regional scales.

4.7. Regional Scale Variability of the 2200 nm Feature

The exact position of the 2200 nm absorption of white mica varies with its mineral chemistry and can therefore be used to estimate its AlVI content [42,46,56]. Absorption positions range from 2190 nm for Al-rich (muscovitic) white mica to 2215 nm for Al-poor white mica (phengitic, with substitution of AlVI by Fe or Mg). In many hydrothermal deposits, white mica often presents chemistry that is distinct from background compositions and can therefore serve as an effective vector towards mineralization. The use of this metric has been investigated at numerous mineral deposits, for example, it was reported that white mica at the Pebble Cu-Au-Mo porphyry is muscovitic (low-wavelength) near mineralization [7]. In Archean gold deposits, white mica is reported to either be muscovitic (Archean Sunrise Dam gold deposit) or phengitic (Kanowna Belle gold deposit; Canadian Malartic gold deposit) near mineralization [43,57]. Other factors such as protolith composition, metamorphic grade, or spectral interference may also affect apparent white mica absorption positions and need to be taken into consideration. For example, variations in the 2200 nm absorption have been used to map regional metamorphic gradients, where increasingly Al-rich (muscovitic, shorter wavelengths) white mica indicated higher metamorphic grades [43,46,58].
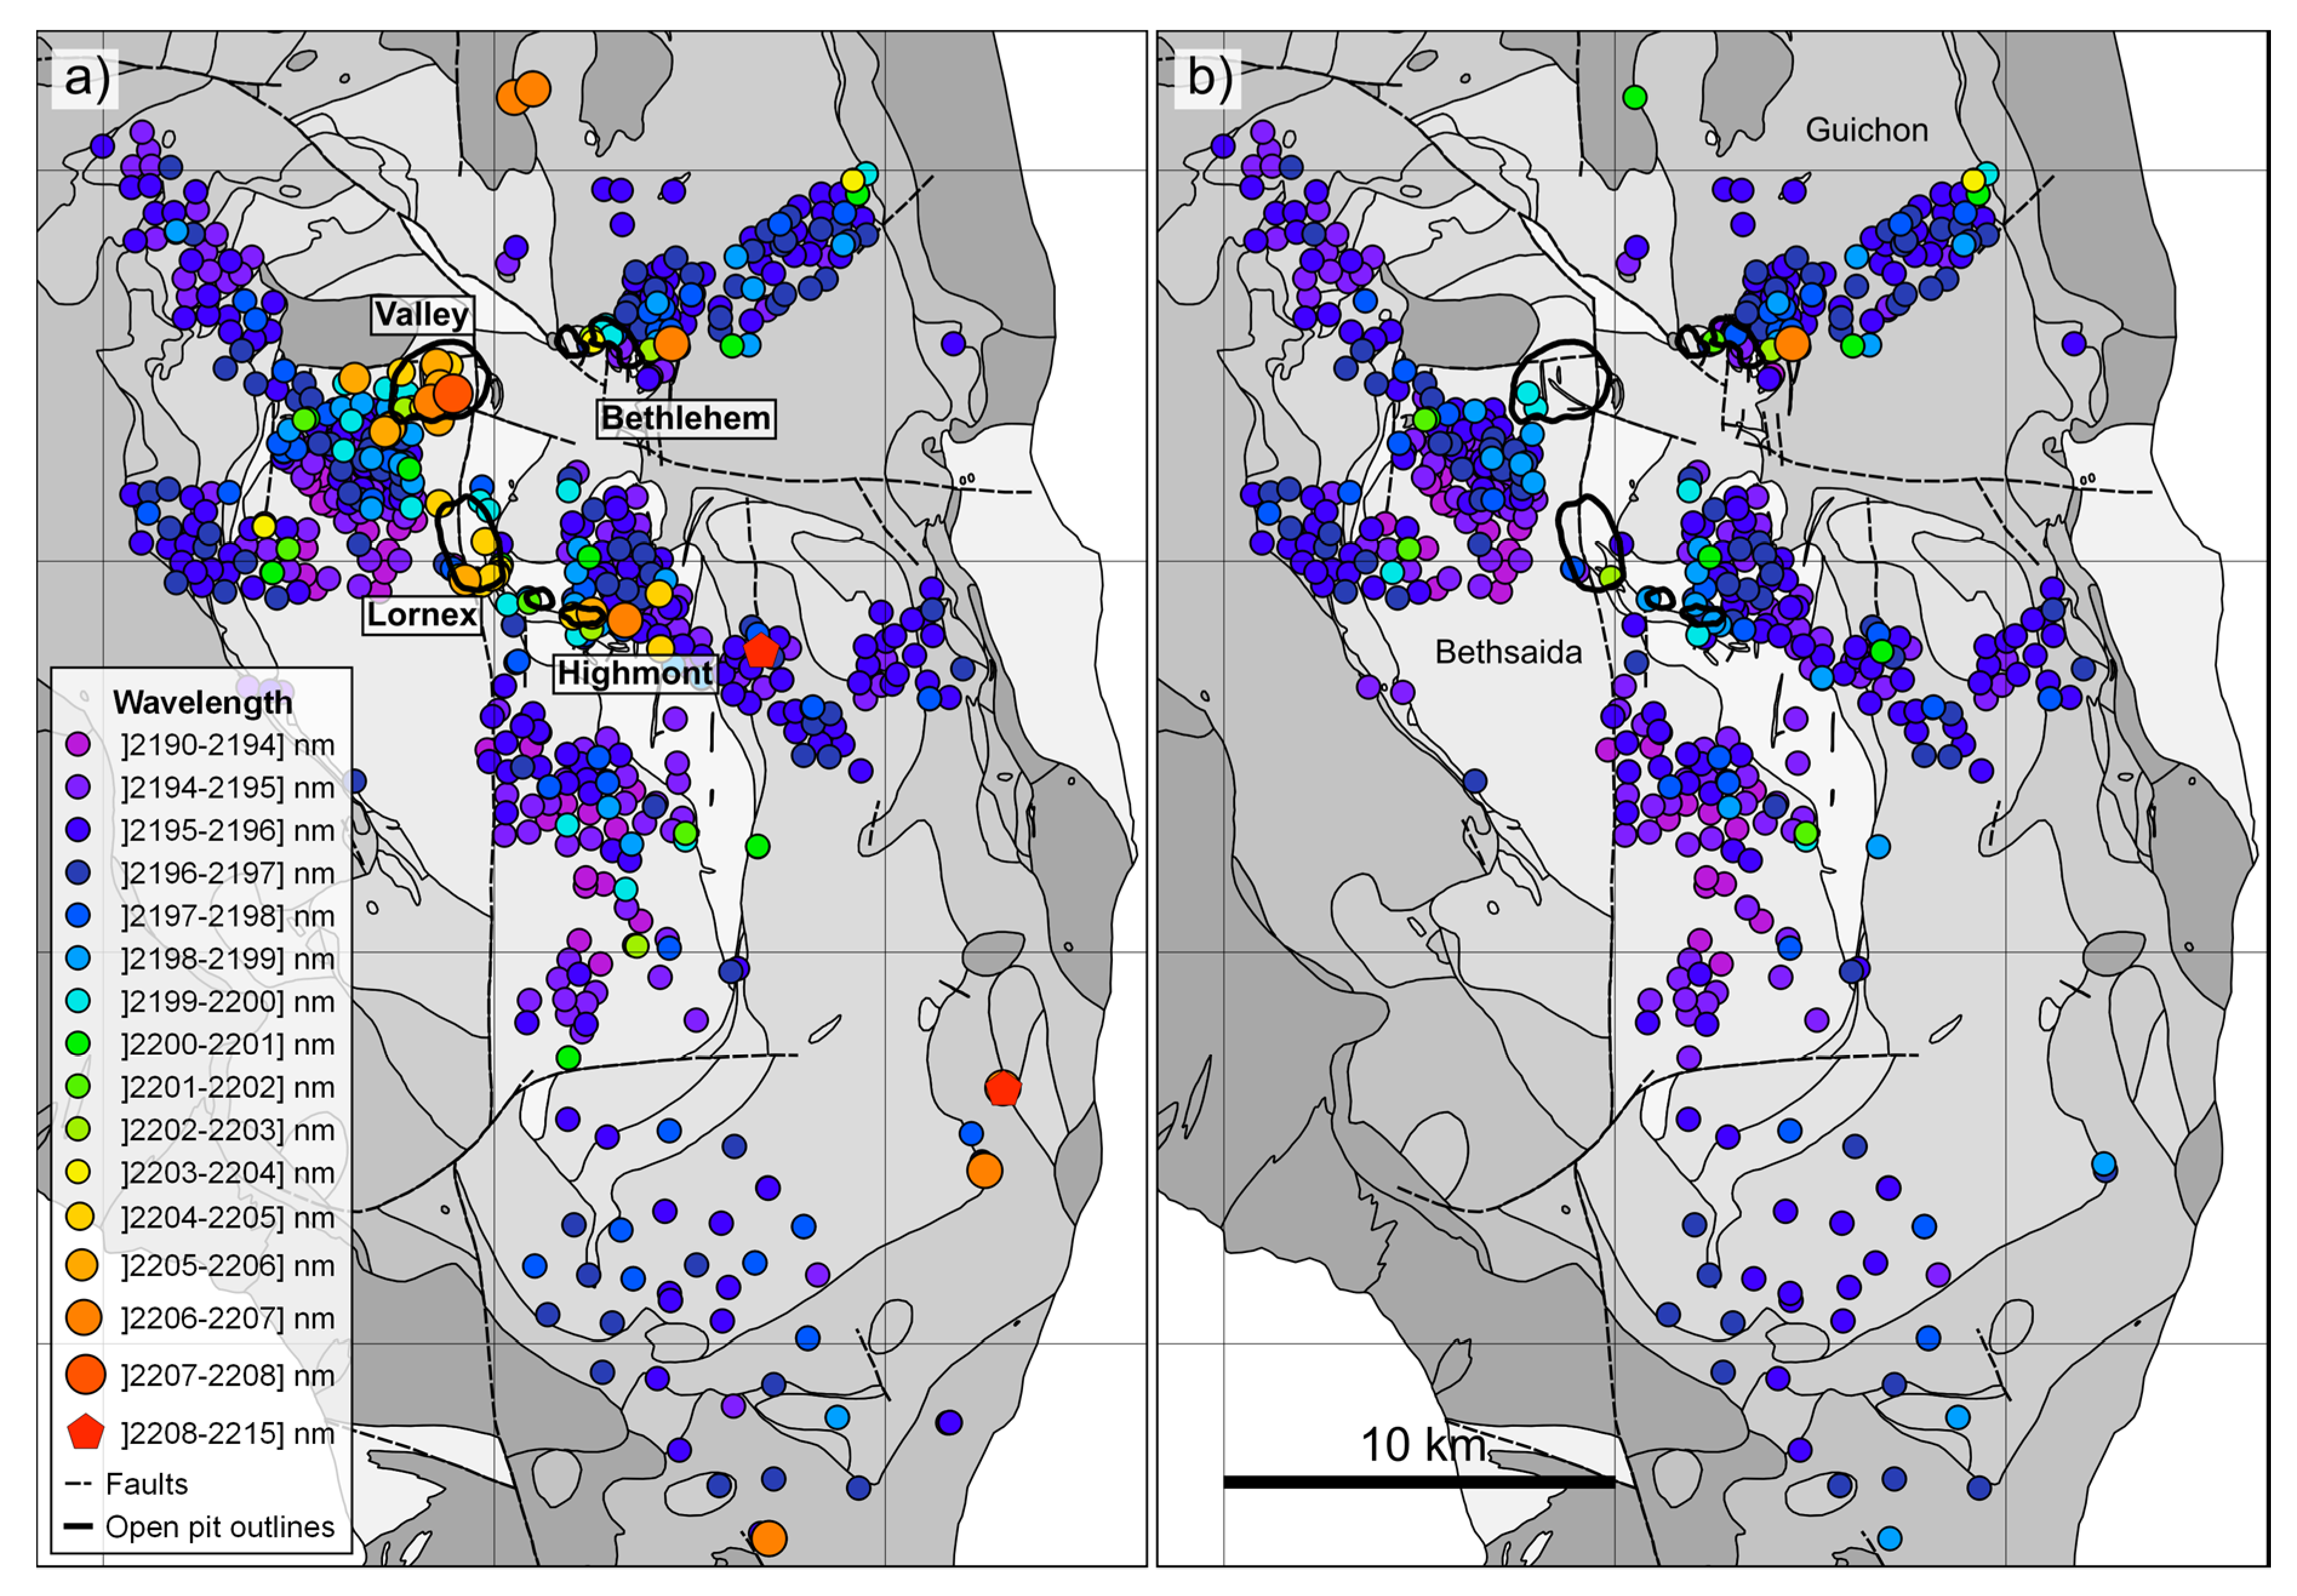
At HVC, spectral interference is found to be problematic. Several minerals present a potentially interfering absorption near 2200 nm, including kaolinite (2207 nm) and tourmaline (2208 nm). As a result, regional scale mapping of the average 2200 nm position for each sample (Figure 12) may yield misleading results if the presence of these minerals is not identified. The data presented in Figure 12a illustrate the effect of spectral interference on the 2200 nm absorption of white mica, where the average position appears to increase from a 2195 nm background, to 2207 nm in the vicinity of the open pits. At HVC, this apparent regional gradient is mainly caused by interference of coexisting kaolinite, and not by changes in white mica chemistry (note the lack of white mica of intermediate composition on high-resolution hyperspectral imagery, e.g., in Figure 5h, where the background is at 2195 nm, while vein selvages are at 2215 nm). Similarly, samples from isolated showings near the periphery of the batholith show absorptions near 2208 nm, caused by interference from tourmaline. Figure 12b shows the same dataset, but now filtered to remove samples containing above 0.1% kaolinite (by pixel count), or those containing above 5% tourmaline. In this filtered dataset, most samples in the open pit have been removed, and no clear gradient is seen towards the deposit, although a few samples near the open pits have absorptions near 2199–2200 nm. As discussed in Section 5.4, this is likely due to trace amounts of kaolinite that cannot reliably be detected. Another weak shift in white mica composition in this filtered dataset appears linked to protolith composition. Unaltered samples in the relatively felsic Bethsaida facies (69 wt% SiO2) show white mica (muscovite ± illite ± montmorillonite) with absorptions near 2193 nm, while unaltered samples from the more distal and mafic Guichon facies (62 wt% SiO2) show slightly more phengitic compositions, with absorptions near 2196 nm. For these reasons, while the position of the 2200 nm absorption can be a highly beneficial tool to map regional compositional gradients, possible spectral interference needs to be accounted for when interpreting results, particularly if obtained from low spatial resolution hyperspectral measurements (e.g., airborne data at 1 m/pixel, or non-imaging data from a point spectrometer).

5. Discussion

5.1. Mineralogical Variability in the Highland Valley District

At least 10 spectrally active minerals and two spectrally inactive (but nonetheless identifiable) minerals were recognized in samples from the Highland Valley district (Table 1). Other minerals identified in a few samples include malachite, carbonates, and biotite. These minerals however are difficult to detect in the SWIR in the current sample suite, either due to low modal abundances (e.g., malachite, or non-chloritized, fresh biotite), spectral mixing (i.e., for carbonates, the 2330 nm absorption is difficult to detect in the presence of a number of spectrally active minerals), low signal-to-noise ratios due to the dark nature of the minerals (e.g., large, unaltered biotite books), or most likely a combination of these factors. Minerals presenting an ambiguous, weak, or interfering spectral response may be underestimated in their relative abundance, and spectrally inactive minerals, for the most part, cannot be detected (e.g., feldspars). The use of midwave infrared (MWIR) or longwave infrared (LWIR) hyperspectral instruments may be better suited to investigate some of these minerals. Carbonates, for example, present several absorptions between 3300 nm and 4000 nm [44] that may mitigate issues of spectral interference seen in the SWIR. Similarly, feldspars can be identified and characterized in the LWIR [59,60], which may provide additional details on the extent of potassic (K-feldspar) or sodic-calcic (albite) alteration. The integration of those additional spectral ranges would likely benefit hyperspectral studies in obtaining a comprehensive understanding of mineralogical changes across ore deposits.
With these constraints in mind, proximal SWIR hyperspectral imaging nonetheless provides novel information on alteration mineralogy in the Highland Valley district. The most conspicuous change related to hydrothermal alteration at the Valley and Lornex deposits is the presence of coarse-grained white mica, as defined from the ratio of its 2125 nm and 2200 nm absorptions. In hand samples, coarse-grained white mica was seen to be limited to a few centimeters around mineralized veins (e.g., Figure 5c) and is generally muscovitic (2195 nm) in the deposit (Figure 5d, and Figure A1), and phengitic (2215 nm) away from the deposit (Figure 5h). Continuous drill core imagery, however, revealed that the zone of coarse-grained white mica may occur over several meters within and around strongly mineralized intervals (Figure 10d). Kaolinite, if detected during regional exploration, could be indicative of potential mineralization. On deposit-scales, however, downhole imagery reveals that the largest kaolinite abundances occur immediately adjacent to, but not within, strongly mineralized intervals (Figure 9e). The use of interpreted mineralogy must therefore take into account the scale of observation. In a regional exploration context, kaolinite would be a targeted mineral as its presence could be indicative of a nearby (less than a few hundreds of meter) deposit. In a production environment, however, the presence of large amounts of kaolinite could indicate that the mineralized target was missed. Prehnite is ubiquitous in hand samples collected from 4 km to 8 km away from the deposits, and its abundance decreased dramatically in samples near (<4 km) and within the deposits. Prehnite is the most distant spectrally detectable alteration mineral at HVC (up to 8 km). Because of its distinctive spectral response (no other common mineral shows an absorption near 1477 nm), it is easily identified in mineral mixtures, and may therefore serve as an effective distal indicator of mineralization on regional scales.

5.2. Spectral Alteration Score and Implications for the Mining Industry

In addition to sulfides, minerals generally associated with mineralization at the Valley, Lornex and Highmont deposits include quartz, coarse-grained white mica, and kaolinite. In the Bethlehem deposit, tourmaline and abundant epidote are also common alteration minerals. Prehnite and minor epidote occur in the distal alteration halo in all cases and are not expected to occur within mineralized samples. Together, these seven key minerals can serve to produce a spectral alteration score that is valid across the entirety of the Guichon Creek batholith. Several other minerals may also be either positively or negatively correlated to mineralization and may serve to improve the spectral alteration score developed in this study. For example, gypsum occurs exclusively within the Valley and Lornex deposits (Figure 11c), and its presence could indicate potentially mineralized samples. Amphibole, on the other hand, is a primary magmatic mineral and is generally chloritized in altered zones (Figure 6e,f). Its presence would therefore indicate unaltered samples (i.e., a value of one could be subtracted to the spectral alteration score for amphibole bearing samples).
Although additional minerals could increase the accuracy of the spectral alteration score within a given area of the mine, the intended goal of the metric presented here is to serve as a proof-of-concept that could easily be implemented by the mining industry, and aims for simplicity. This metric could be employed, for example, as an exploration tool during regional-scale sampling (Figure 11b), or could potentially be utilized for resource characterization as part of a suite of measurements for ore-sorting (e.g., with a hyperspectral camera installed atop a conveyor belt transporting bulk-ore, or integrated within existing ore-sorting equipment). This would require the metric to be computationally inexpensive, and to perform well on the entirety of the Guichon Creek batholith rock samples (rather than to be limited to a sample subset). For these reasons, a minimal set of minerals or spectral parameters are preferred over a complex set of spectral metrics. The oft-used position of the 2200 nm absorption feature (representing white mica chemistry) was not included in the current spectral alteration score, as it would require interpolation of the spectral data [43], which would be computationally intensive and may be difficult to implement. Rather, the proposed metric relies exclusively on the presence or absence of a set of key minerals that occur within altered zones, all of which can potentially be identified by computationally simple methods such as band ratios. Importantly, the metric also does not rely on complex, statistically derived parameters. If needed, the metric can therefore easily be modified with geological knowledge available to mine geologists, (e.g., in specific portions of a given mine, another set of minerals may perform better than those presented here).
With these considerations in mind, the spectral alteration score performs adequately on the entirety of the sample suite. The global metric, utilizing all minerals listed in Table 2, achieves a detection of 88% of the mineralized samples, and 81% of the barren samples, over a total of 755 slabs (regardless of lithofacies). The misidentified mineralized samples generally contain low Cu abundances, near the 1000 ppm Cu cut-off grade. Of a total of 72 mineralized samples, 63 were correctly identified, and nine were misidentified as unmineralized. Of those, seven contained between 1045 and 1827 ppm Cu, and two had between 2191 and 2651 ppm Cu, all below the mineral reserve grade of 0.3% Cu [31] at HVC. Generally, samples with a higher spectral alteration score contain greater Cu concentrations (Figure 8). However, because mineralization may be concentrated in a few veins, while alteration selvages are generally more extensive, it is not possible to determine the exact Cu concentration for any given sample based on alteration mineralogy alone (e.g., Bethsaida rocks with a score of five can have Cu contents of between 500 and >10,000 ppm).

5.3. Quartz Veining and Alteration in Continuous Drill Core

In the continuous drill core presented here, the spectrally estimated abundance of quartz (Figure 9g; and associated sulfides in Figure 9h) was found to be closely correlated to assayed Cu grades. However, the presence of quartz alone is not necessarily an indicator of mineralization, as quartz veins are known to be barren in the central portions of the deposit (the barren core). It is therefore likely that the correlation between spectrally detected quartz abundance and mineralization is valid only in certain sections of the open pits, but not across the entirety of the deposits. Still, as the barren core was not sampled in this study, it may yet present spectrally detectable differences to quartz from mineralized zones. Barren quartz may, for example, lack the associated spectrally detectable sulfides, or could have fewer fluid inclusions, resulting in weaker water-related absorptions, or could be associated with minerals that are not closely associated with mineralization (e.g., prehnite).
The spectral alteration score presented here, taking into account several minerals indicative of alteration, is a generally more inclusive estimator of mineralization across all deposits in the HVC district, and accurately identifies alteration and potential mineralization both in hand samples and in drill core. Although in the particular drill core section shown in this study, the spectral alteration score appears to be mainly dependent on the presence of coarse-grained white mica, the other minerals are nonetheless required to obtain a reliable metric over all samples in the district.

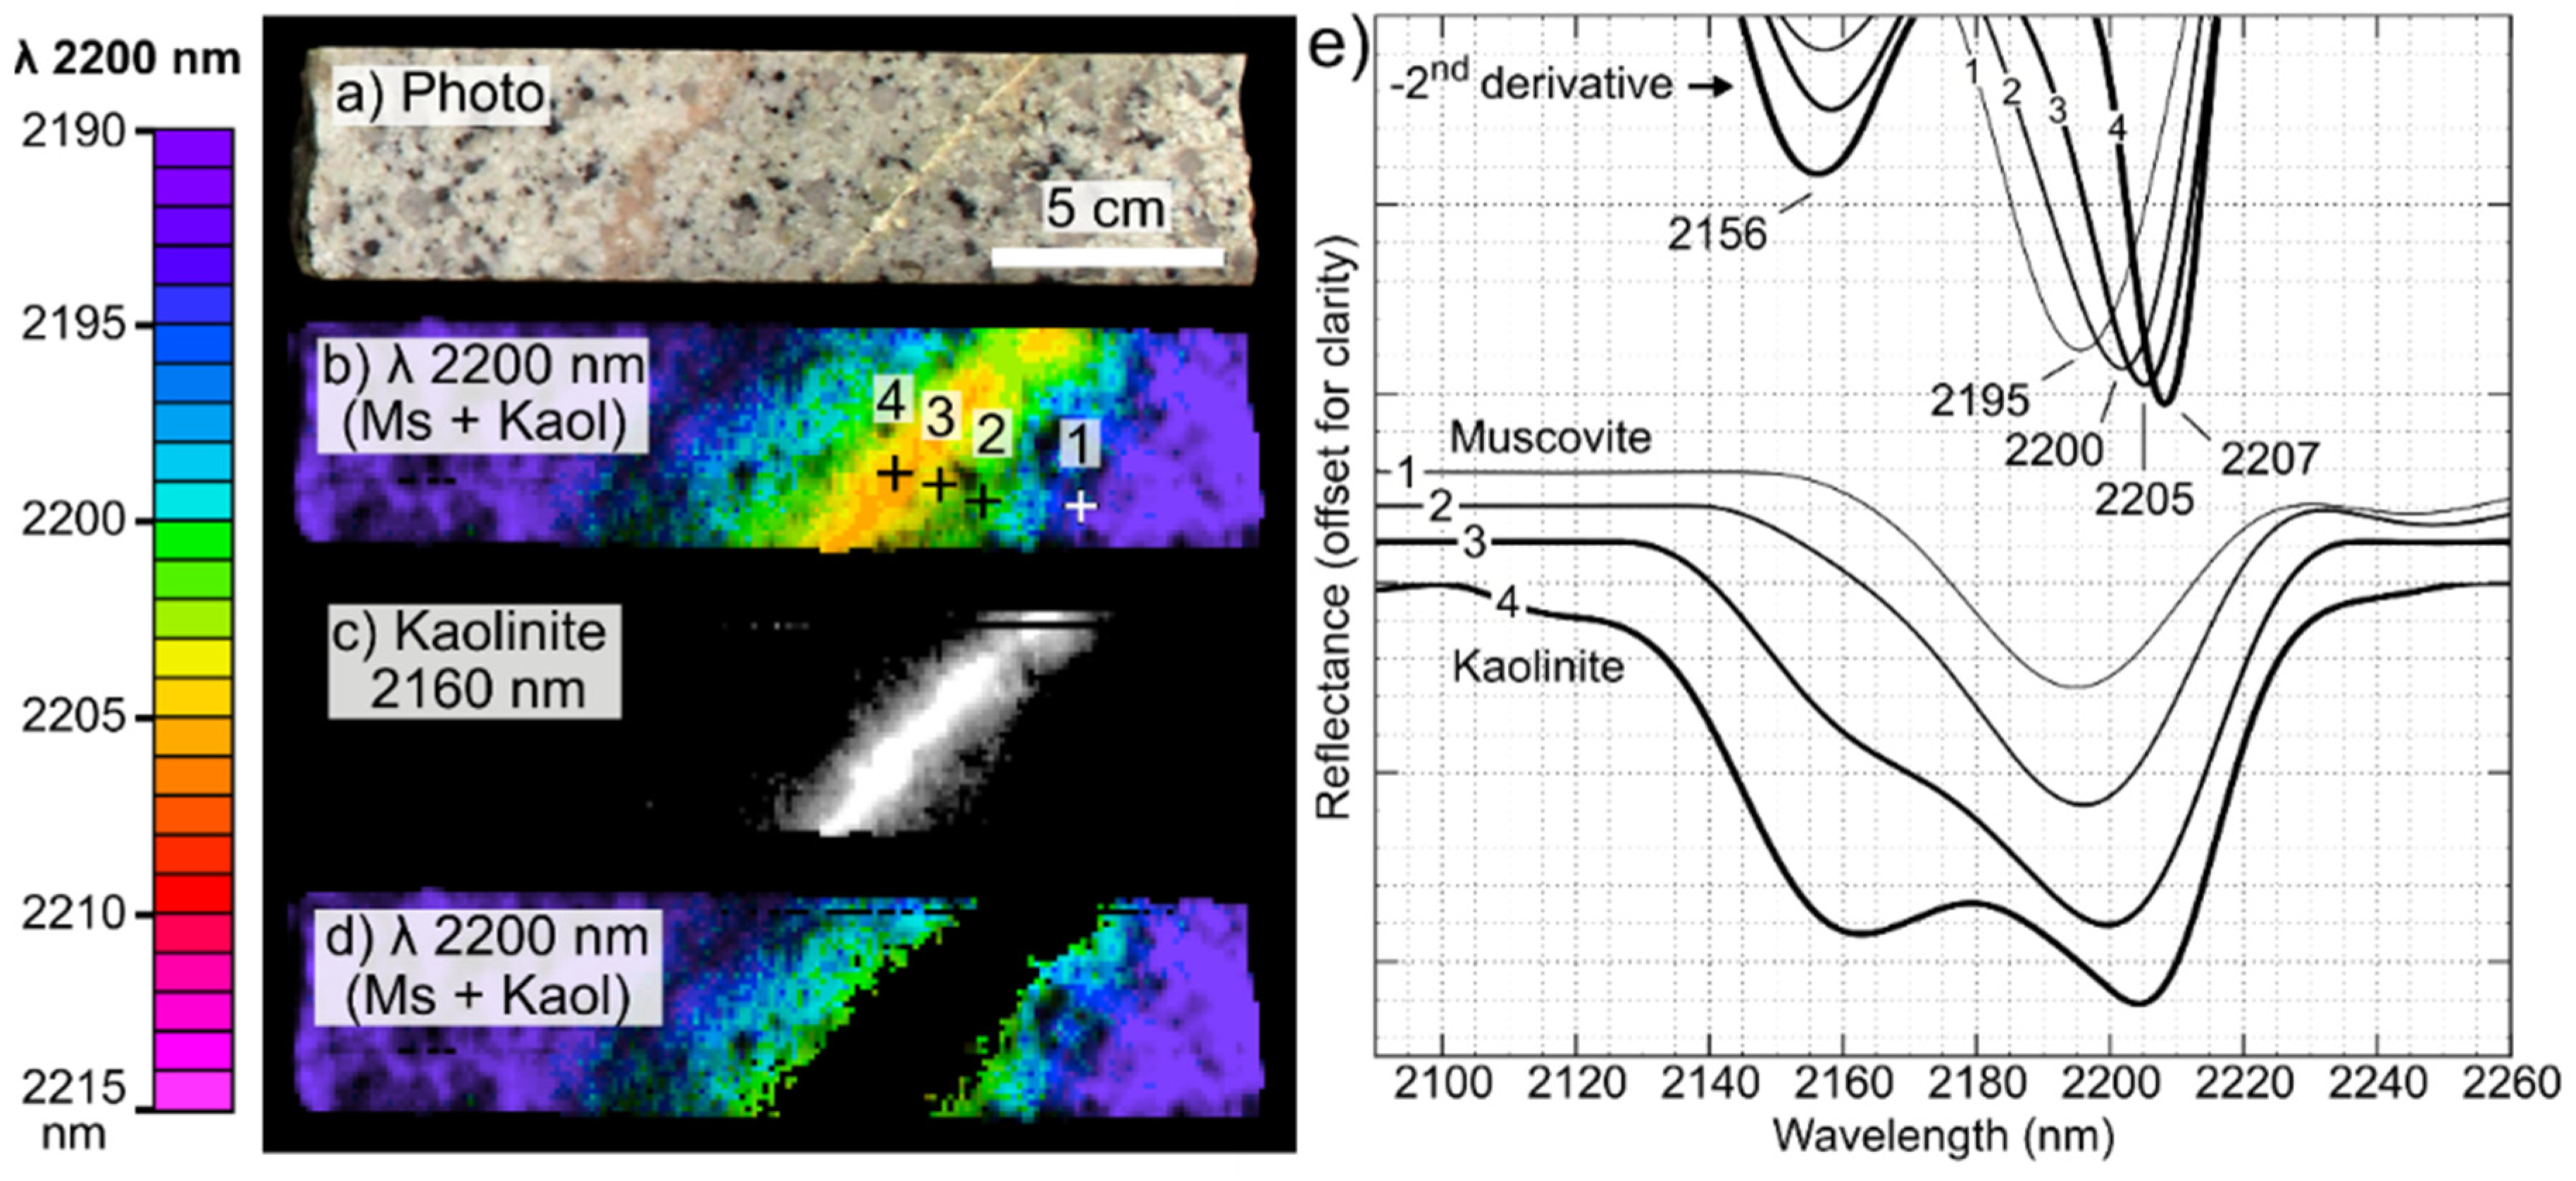
5.4. Interference in Estimating White Mica Chemistry

Although high-resolution hyperspectral imaging allows identification of mineralogy on small areas (e.g., 1 mm2), which minimizes spectral mixing often encountered in point measurements (covering, for example, 1 cm2), certain minerals occur as intimate mixtures (on micron-scales) and, when presenting overlapping absorptions, pose a challenge in their analysis. A commonly occurring mixture that is spectrally difficult to investigate involves the Al-bearing phyllosilicates muscovite (i.e., white mica with an interlayer occupancy ≈ 1 apfu), illite (i.e., with an interlayer occupancy <0.85 apfu), smectites (i.e., montmorillonite), and kaolin group minerals. In this study, spectra of background mineralogy in unaltered samples nearly always shows an absorption near or below 2195 nm, indicating Al-rich white mica, but often show variably developed 1467 nm and ≈1900 nm absorptions, which may respectively indicate coexisting montmorillonite and/or illite. As the 1467 nm absorption of montmorillonite is relatively weak and overlaps with the ≈1430 nm absorption of free water (e.g., fluid inclusions in coexisting quartz grains), montmorillonite can only be reliably detected when present in relatively large abundances. For this reason, while the background, unaltered Al-phyllosilicate mineralogy is referred to as fine-grained white mica, it is always a possible mixture of Al-rich (low wavelength, ≈2195 nm) muscovite, illite, and/or montmorillonite.
The presence of kaolinite is also problematic for the estimation of white mica (muscovite) mineral chemistry, as the 2207 nm absorption of kaolinite fully overlaps with, and overshadows, the Al2-OH absorption of white mica near 2200 nm. Kaolinite can be detected from the presence of a unique ≈ 2160 nm absorption, but, as with the 1467 nm absorption of montmorillonite, it is relatively weak and may be difficult to detect when kaolinite occurs in small abundances. The 2207 nm absorption of kaolinite appears much stronger, and where coexisting with white mica, influences the overall estimated position Al2-OH towards 2207 nm, even when kaolinite is present in such small abundance that it cannot reliably be detected from the 2160 nm absorption. As an example, Figure 13 illustrates kaolinite interference on the 2200 nm absorption position near a kaolinite-rich vein and vein selvage. Background white mica shows absorptions near 2195 nm, while pure kaolinite shows an absorption feature at 2207 nm. The presence of kaolinite, as detected from the 2160 nm feature, is presented in Figure 13c, and is masked in Figure 13d. While a large portion of interfering kaolinite was masked from this secondary feature, at larger distances, in the vein halo, it appears that trace amounts of kaolinite significantly influence the position of the 2200 nm absorption (by 5 nm). In the detailed spectra shown in Figure 13e, a slight inflection occurs near 2160 nm in spectrum 2 (visible in the second derivative) and is essentially undetectable on single image pixels (the presented spectra are always 3 × 3 averages).
If spectral measurements are averaged on the scale of a sample (either from analysis on pulps, measurements performed using point spectrometers, or from low-spatial resolution, airborne imagery), because of the interference of kaolinite, the commonly investigated 2200 nm white mica absorption position must be carefully interpreted. The apparent 2200 nm absorption position may reflect white mica chemistry, but at HVC would mostly reflect the amount of interfering kaolinite, as shown in Figure 12. Samples from the core of the deposits (which may have kaolinite present) show an absorption near 2207 nm, while distal samples (with no kaolinite) present an average absorption near 2195 nm. As shown in previous figures, hydrothermal white mica (veins and vein selvages) are expected to be muscovitic (low-Al, 2195 nm) within the deposit (Figure 5d), but may sit within a kaolinite-rich matrix showing longer absorptions (Figure 5b). Nonetheless, a detectable shift in the apparent 2200 nm absorption may prove to be an effective tool to vector towards mineralization in regional exploration campaigns, whether caused by real changes in muscovite composition or by interference from kaolinite, as either can be indicative of hydrothermal alteration.

6. Conclusions

Proximal shortwave infrared hyperspectral imaging was shown to be an effective method to characterize complex, fine-grained mineralogy in the Highland Valley porphyry district. Over twelve minerals can be spectrally identified and quantified, and physical parameters, such as white mica grain size can be spectrally estimated. At the Valley, Lornex and Highmont deposits, in addition to sulfides, quartz, and kaolinite, the most conspicuous change related to mineralization is the presence of coarse-grained (>1 mm) white mica veins that are muscovitic (2195 nm) in composition. Prehnite is the most distant spectrally detectable alteration minerals (defining an annular alteration zone, up to 8 km from the deposits), and veins often present selvages of coarse-grained phengitic (2215 nm) white mica. At the Bethlehem deposit, and in individual showings at the periphery of the batholith, tourmaline and large amounts of epidote form with sulfide mineralization. Collectively, the presence of these seven minerals is used to define a spectral alteration score that performs well in the entirety of the Guichon Creek batholith and can discriminate between mineralized and unmineralized samples. As the alteration score exclusively relies on the presence or absence of these key minerals, which can be identified by computationally simple methods, it could serve to enhance core logging methodologies, as an effective proxy for geometallurgical performance, or as a metric that could be employed for resource characterization to facilitate ore sorting. As acquiring hyperspectral data on rock samples is rapid and requires little to no sample preparation, SWIR imaging spectroscopy could serve as a rapid regional exploration tool in prospective environment. Alternatively, in areas that are relatively free of vegetal cover such as in the Canadian north, airborne or satellite-based hyperspectral data could be used to the same effect.

Supplementary Materials

The following are available online at https://www.mdpi.com/2075-163X/10/5/473/s1, Table S1: Data table containing regional mineral abundances. Table S2: Mineralogical data and spectral score derived for the 755 rock slabs.

Author Contributions

Data curation, G.L., K.B., M.D. and R.G.L.; Formal analysis, P.L.; Investigation, P.L., G.L., K.B., M.D. and R.G.L.; Methodology, P.L.; Project administration, B.R. and R.G.L.; Supervision, B.R.; Visualization, P.L.; Writing—original draft, P.L.; Writing, review and editing, B.R., K.B. and R.G.L. All authors have read and agreed to the published version of the manuscript.

Funding

Funding was provided by the Natural Sciences and Engineering Council of Canada and the Canada Mining Innovation Council through the NSERC Collaborative Research and Development Program. NSERC-CMIC Mineral Exploration Footprints Project Contribution Number 214.

Acknowledgments

We are grateful to Teck Resources Limited for providing access to the mine site and the drill core database. We would like to acknowledge the support offered by the mine and exploration personnel at Highland Valley Copper during the sampling campaign. We thank our numerous fellow researchers of the Mineral Exploration Footprints Research Network (http://www.cmic-footprints.ca/) and industry sponsors for their continuous support and feedback. We are also grateful to Jilu Feng and Iman Entezari at the University of Alberta for their help and productive discussions during hyperspectral data acquisitions.

Conflicts of Interest

The authors declare no conflict of interest.

Appendix A

Figure A1. Sample 2238872, a mineralized sample (4064 ppm Cu) from the Skeena facies. The sample shows coarse grained, low-wavelength white mica veins in a kaolinite-rich matrix.
Minerals 10 00473 g0a1
Figure A2. Sample 2232402, montmorillonite-rich matrix.
Minerals 10 00473 g0a2
Figure A3. Sample 2247917, pumpellyite-rich zone.
Minerals 10 00473 g0a3
Figure A4. Sample 2015KB249, epidote vein with prehnite selvage.
Minerals 10 00473 g0a4
Figure A5. Sample 2234423, tourmaline breccia.
Minerals 10 00473 g0a5

References

  1. Seedorff, E.; Dilles, J.H.; Proffett, J.M.; Einaudi, M.T.; Zurcher, L.; Stavast, W.J.A.; Johnson, D.A.; Barton, M.D. Porphyry Deposits: Characteristics and Origin of Hypogene Features; Economic GeologyOne Hundredth Anniversary Volume; Society of Economic Geologists: Littleton, CO, USA, 2005; pp. 251–298. [Google Scholar]
  2. Sillitoe, R.H. Porphyry copper systems. Econ. Geol. 2010, 105, 3–41. [Google Scholar] [CrossRef] [Green Version]
  3. Hunt, G.R. Spectral signatures of particulate minerals in the visible and near infrared. Geophysics 1977, 42, 501–513. [Google Scholar] [CrossRef] [Green Version]
  4. Clark, R.N.; King, T.V.V.; Klejwa, M.; Swayze, G.A.; Vergo, N. High spectral resolution reflectance spectroscopy of minerals. J. Geophys. Res. 1990, 95, 12653–12680. [Google Scholar] [CrossRef] [Green Version]
  5. Hunt, G.R.; Salisbury, J.W. Visible and Near Infrared Spectra of Minerals and Rocks: I Silicate Minerals. Mod. Geol. 1970, 1, 283–300. [Google Scholar]
  6. Cudahy, T.J.; Wilson, J.; Hewson, R.; Linton, P.; Harris, P.; Sears, M.; Okada, K.; Hackwell, J.A. Mapping porphyry-skarn alteration at Yerington, Nevada, using airborne hyperspectral VNIR-SWIR-TIR imaging data. In Proceedings of the IGARSS 2001. Scanning the Present and Resolving the Future. Proceedings. IEEE 2001 International Geoscience and Remote Sensing Symposium, Sydney, NSW, Australia, 9–13 July 2001; Volume 2, pp. 631–633. [Google Scholar]
  7. Harraden, C.L.; McNulty, B.A.; Gregory, M.J.; Lang, J.R. Shortwave infrared spectral analysis of hydrothermal alteration associated with the Pebble porphyry copper-gold-molybdenum deposit, Iliamna, Alaska. Econ. Geol. 2013, 108, 483–494. [Google Scholar] [CrossRef]
  8. Agus, A.J.L. Mapping White Mica in Milled Porphyry Copper Pebbles Using Hyperspectral Imagery: An Exploratory Study. Master’s Thesis, University of Twente, Enschede, The Netherlands, 2011. [Google Scholar]
  9. Dalm, M.; Buxton, M.W.N.; van Ruitenbeek, F.J.A. Discriminating ore and waste in a porphyry copper deposit using short-wavelength infrared (SWIR) hyperspectral imagery. Miner. Eng. 2017, 105, 10–18. [Google Scholar] [CrossRef]
  10. Graham, G.E.; Kokaly, R.F.; Kelley, K.D.; Hoefen, T.M.; Johnson, M.R.; Hubbard, B.E. Application of imaging spectroscopy for mineral exploration in Alaska: A study over porphyry Cu deposits in the eastern Alaska Range. Econ. Geol. 2018, 113, 489–510. [Google Scholar] [CrossRef]
  11. Lesage, G. Distribution of District-Scale Hydrothermal Alteration, Vein Orientations and White Mica Compositions in the Highland Valley Copper District, British Columbia, Canada: Implications for the Evolution of Porphyry Cu-Mo Systems. Ph.D. Thesis, University of British Columbia, Vancouver, BC, Canada, 2020. [Google Scholar]
  12. Byrne, K.; Lesage, G.; Gleeson, S.A.; Piercey, S.J.; Lypaczewski, P.; Kyser, K. Linking Mineralogy to Lithogeochemistry in the Highland Valley Copper District: Implications for Porphyry Copper Footprints. Econ. Geol. 2020. [Google Scholar] [CrossRef]
  13. D’Angelo, M.; Alfaro, M.; Hollings, P.; Byrne, K.; Piercey, S.; Creaser, R.A. Petrogenesis and magmatic evolution of the Guichon Creek batholith: Highland valley porphyry Cu ± (Mo) district, South-Central British Columbia. Econ. Geol. 2017, 112, 1857–1888. [Google Scholar] [CrossRef]
  14. D’Angelo, M. Geochemistry, Petrography and Mineral Chemistry of the Guichon Creek and Nicola Batholiths, Southcentral British Columbia. Master’s Thesis, Lakehead University, Thunder Bay, ON, Canada, 2016. [Google Scholar]
  15. Lee, R.G.; Byrne, K.; D’Angelo, M.; Hart, C.J.R.; Hollings, P.; Gleeson, S.A.; Alfaro, M. Using zircon trace element composition to assess porphyry copper potential of the Guichon Creek batholith and Highland Valley Copper deposit, south-central British Columbia. Miner. Depos. 2020. [Google Scholar] [CrossRef]
  16. Byrne, K. Diagnostic Features of the Rocks and Minerals Peripheral to the Highland Valley Copper District, British Columbia, Canada: Implications for the Genesis of Porphyry Cu Systems and Their Footprints. Ph.D. Thesis, University of Alberta, Edmonton, AB, Canada, 2019. [Google Scholar]
  17. Byrne, K.; Lesage, G.; Morris, W.A.; Enkin, R.J.; Gleeson, S.A.; Lee, R.G. Variability of outcrop magnetic susceptibility and its relationship to the porphyry Cu centers in the Highland Valley Copper district. Ore Geol. Rev. 2019, 107, 201–217. [Google Scholar] [CrossRef]
  18. Lesage, G.; Byrne, K.; Morris, W.A.; Enkin, R.J.; Lee, R.G.; Mir, R.; Hart, C.J.R. Interpreting regional 3D fault networks from integrated geological and geophysical data sets: An example from the Guichon Creek batholith, British Columbia. J. Struct. Geol. 2019, 119, 93–106. [Google Scholar] [CrossRef]
  19. McMillan, W. Geology and genesis of the Highland Valley ore deposits and the Guichon Creek batholith. Can. Inst. Min. Metall. 1976, 15, 85–104. [Google Scholar]
  20. Casselman, M.J.; McMillan, W.J.; Newman, K.M. Highland Valley porphyry copper deposit near Kamloops, British Columbia: A review and update with emphasis on the Valley deposit. Can. Inst. Min. Metall. Pet. 1995, 46, 142–158. [Google Scholar]
  21. Alva-Jimenez, T.R. Variation in Hydrothermal Muscovite and Chlorite Composition in the Highland Valley Porphyry Cu-Mo District, British Columbia, Canada. Master’s Thesis, University of British Columbia, Vancouver, BC, Canada, 2011. [Google Scholar]
  22. Byrne, K.; Stock, E.; Ryan, J.; Johnson, C.; Nisenson, J.; Alva-Jimenez, T.; Lapointe, M.; Stewart, H.; Grubisa, G.; Sykora, S. Porphyry Cu-(Mo) deposits in the Highland Valley district, south-central British Columbia. Soc. Econ. Geol. F. Trip Guideb. 2013, 43, 99–116. [Google Scholar]
  23. Northcote, K.E. Geology and Geochronology of the Guichon Creek Batholith. Ph.D. Thesis, University of British Columbia, Vancouver, BC, Canada, 1969. [Google Scholar]
  24. McMillan, W.J.; Anderson, R.G.; Chen, R.; Chen, W. Geology and Mineral Occurrences (MINFILE), the Guichon Creek Batholith and Highland Valley Porphyry Copper District, British Columbia; Open File 6079; Geological Survey of Canada: Ottawa, ON, Canada, 2009. [CrossRef]
  25. Whalen, J.; Davis, W.; Anderson, R. Temporal and Geochemical Evolution of the Guichon Creek Batholith and Highland Valley Porphyry Copper District, British Columbia: Implications for Generation and Tectonic Setting of Porphyry Systems; Open File 8334; Geological Survey of Canada: Ottawa, ON, Canada, 2017. [CrossRef]
  26. Lee, R.G.; Dilles, J.H.; Tosdal, R.M.; Wooden, J.L.; Mazdab, F.K. Magmatic evolution of granodiorite intrusions at the El Salvador porphyry copper deposit, Chile, based on trace element composition and U/Pb age of zircons. Econ. Geol. 2017, 112, 245–273. [Google Scholar] [CrossRef]
  27. McMillan, W.J. Geology and ore deposits of the Highland Valley camp. In Mineral Deposits Division Field Guide and Reference Manual Series; Sinclair, A.J., Ed.; Geological Association of Canada: Ottawa, ON, Canada, 1985; p. 121. [Google Scholar]
  28. Hollister, V.F.; Allen, J.M.; Anzalone, S.A.; Seraphim, R.H. Structural Evolution of Porphyry Mineralization at Highland Valley, British Columbia. Can. J. Earth Sci. 1975, 12, 807–820. [Google Scholar] [CrossRef]
  29. Ash, C.H.; Reynolds, P.H.; Creaser, R.A.; Mihalynuk, M.G.; Quesnellia, K. 40Ar/39Ar and Re-Os Isotopic Ages for Hydrothermal Alteration and Related Mineralization at the Highland Valley Cu-Mo Deposit (NTS 092I), Southwestern British Columbia; Geoscience BC Report 2007-1; British Columbia Geological Survey: Victoria, BC, Canada, 2007.
  30. Graden, R. NI 43-101 Technical Report. Teck Highland Valley Copper; Teck Resources Limited: Vancouver, BC, Canada, 2013. [Google Scholar]
  31. Teck Resources Limited. Annual Information Form; Teck Resources Limited: Vancouver, BC, Canada, 2019. [Google Scholar]
  32. Sillitoe, R.H. The tops and bottoms of porphyry copper deposits. Econ. Geol. 1973, 68, 799–815. [Google Scholar] [CrossRef]
  33. Singer, D.A.; Berger, V.I.; Moring, B.C. Porphyry Copper Deposits of the World: Database and Grade and Tonnage Models: USGS Open-File Report 2008-1155; USGS: Reston, VA, USA, 2008.
  34. Lowell, J.D.; Guilbert, J.M. Lateral and vertical alteration-mineralization zoning in porphyry ore deposits. Econ. Geol. 1970, 65, 373–408. [Google Scholar] [CrossRef]
  35. Dilles, J.H.; Einaudi, M.T. Wall-rock alteration and hydrothermal flow paths about the Ann-Mason porphyry copper deposit, Nevada; a 6-km vertical reconstruction. Econ. Geol. 1992, 87, 1963–2001. [Google Scholar] [CrossRef]
  36. Briskey, J.A.; Bellamy, J.R. Bethlehem Coppers’s Jersey, East Jersey, Huestis and Iona Deposits. In Porphyry Deposits of the Canadian Cordillera; Sutherland Brown, A., Ed.; Canadian Institute of Mining and Metallurgy: Montreal, QC, Canada, 1976. [Google Scholar]
  37. Olade, M.A.; Fletcher, W.K. Trace element geochemistry of the Highland Valley and Guichon Creek Batholith in relation to porphyry copper mineralization. Econ. Geol. 1976, 71, 733–748. [Google Scholar] [CrossRef]
  38. Osatenko, M.J.; Jones, M.B. Valley Copper. In Porphyry Deposits of the Canadian Cordillera; Sutherland Brown, A., Ed.; Canadian Institute of Mining and Metallurgy: Montreal, QC, Canada, 1976; pp. 130–143. [Google Scholar]
  39. Cohen, J.F. Compositional Variations in Hydrothermal White Mica and Chlorite from Wall-Rock Alteration at the Ann-Mason Porphyry Copper Deposit, Nevada. Master’s Thesis, Oregon State University, Corvallis, OR, USA, 2011. [Google Scholar]
  40. Briskey, J.A. Geology, Petrology, and Geochemistry of the Jersey, East Jersey, Huestis, and Iona Porphyry Copper-Molybdenum Deposits, Highland Valley, Britsh Columbia. Ph.D. Thesis, University of British Columbia, Vancouver, BC, Canada, 1980. [Google Scholar]
  41. Lypaczewski, P.; Rivard, B. Estimating the Mg# and AlVI content of biotite and chlorite from shortwave infrared reflectance spectroscopy: Predictive equations and recommendations for their use. Int. J. Appl. Earth Obs. Geoinf. 2018, 68, 116–126. [Google Scholar]
  42. Post, J.L.; Noble, P.N. The near-infrared combination band frequencies of dioctahedral smectites, micas, and illites. Clays Clay Miner. 1993, 41, 639–644. [Google Scholar] [CrossRef]
  43. Lypaczewski, P.; Rivard, B.; Gaillard, N.; Perrouty, S.; Piette-Lauzière, N.; Bérubé, C.L.; Linnen, R.L. Using hyperspectral imaging to vector towards mineralization at the Canadian Malartic gold deposit, Québec, Canada. Ore Geol. Rev. 2019, 111, 102945. [Google Scholar] [CrossRef]
  44. Kokaly, R.F.; Clark, R.N.; Swayze, G.A.; Livo, K.E.; Hoefen, T.M.; Pearson, N.C.; Wise, R.A.; Benzel, W.M.; Lowers, H.A.; Driscoll, R.L.; et al. USGS Spectral Library Version 7; USGS: Reston, VA, USA, 2017.
  45. Bishop, J.L.; Lane, M.D.; Dyar, M.D.; Brown, A.J. Reflectance and emission spectroscopy study of four groups of phyllosilicates: Smectites, kaolinite-serpentines, chlorites and micas. Clay Miner. 2008, 43, 35–54. [Google Scholar] [CrossRef]
  46. Duke, E.F. Near infrared spectra of muscovite, Tschermak substitution, and metamorphic reaction progress: Implications for remote sensing. Geology 1994, 22, 621–624. [Google Scholar] [CrossRef]
  47. Harrison, T.N. Experimental VNIR reflectance spectroscopy of gypsum dehydration: Investigating the gypsum to bassanite transition. Am. Mineral. 2012, 97, 598–609. [Google Scholar] [CrossRef]
  48. White, A.J.R.; Laukamp, C.; Stokes, M.A.; Legras, M.; Pejcic, B. Vibrational spectroscopy of epidote, pumpellyite and prehnite applied to low-grade regional metabasites. Geochemistry Explor. Environ. Anal. 2017, 17, 315–333. [Google Scholar]
  49. Roache, T.J.; Walshe, J.L.; Huntington, J.F.; Quigley, M.A.; Yang, K.; Bil, B.W.; Blake, K.L.; Hyvärinen, T. Epidote-clinozoisite as a hyperspectral tool in exploration for Archean gold. Aust. J. Earth Sci. 2011, 58, 813–822. [Google Scholar] [CrossRef]
  50. Laukamp, C.; Termin, K.A.; Pejcic, B.; Haest, M.; Cudahy, T. Vibrational spectroscopy of calcic amphiboles—Applications for exploration and mining. Eur. J. Mineral. 2012, 24, 863–878. [Google Scholar] [CrossRef]
  51. McLeod, R.L.; Gabell, A.R.; Green, A.A.; Gardavski, V. Chlorite Infrared Spectral Data as Proximity Indicators of Volcanogenic Massive Sulphide Mineralization. In Proceedings of the Pacific Rim Congress 87, Gold Coast, Queensland, Australia, 26–29 August 1987; pp. 321–324. [Google Scholar]
  52. Taran, M.N.; Lebedev, A.S.; Platonov, A.N. Optical absorption spectroscopy of synthetic tourmalines. Phys. Chem. Miner. 1993, 20, 209–220. [Google Scholar] [CrossRef]
  53. Bierwirth, P. Laboratory and imaging spectroscopy of tourmaline—A tool for mineral exploration. In Proceedings of the 14th Australasian Remote Sensing & Photogrammetry Conference, Darwin, Australia, 29 September–3 October 2008. [Google Scholar]
  54. Clark, R.N. The spectral reflectance of water-mineral mixtures at low temperatures. J. Geophys. Res. Solid Earth 1981, 86, 3074–3086. [Google Scholar] [CrossRef]
  55. Entezari, I.; Rivard, B.; Geramian, M.; Lipsett, M.G. Predicting the abundance of clays and quartz in oil sands using hyperspectral measurements. Int. J. Appl. Earth Obs. Geoinf. 2017, 59, 1–8. [Google Scholar] [CrossRef]
  56. Swayze, G.A.; Clark, R.N.; Goetz, A.F.H.; Livo, K.E.; Breit, G.N.; Kruse, F.A.; Sutley, S.J.; Snee, L.W.; Lowers, H.A.; Post, J.L.; et al. Mapping advanced argillic alteration at Cuprite, Nevada, using imaging spectroscopy. Econ. Geol. 2014, 109, 1179–1221. [Google Scholar] [CrossRef]
  57. Wang, R.; Cudahy, T.; Laukamp, C.; Walshe, J.L.; Bath, A.; Mei, Y.; Young, C.; Roache, T.J.; Jenkins, A.; Roberts, M.; et al. White mica as a hyperspectral tool in exploration for the sunrise dam and Kanowna belle gold deposits, Western Australia. Econ. Geol. 2017, 112, 1153–1176. [Google Scholar] [CrossRef]
  58. Duke, E.F.; Lewis, R.S. Near infrared spectra of white mica in the Belt Supergroup and implications for metamorphism. Am. Mineral. 2010, 95, 908–920. [Google Scholar] [CrossRef]
  59. Hecker, C.; van der Meijde, M.; van der Meer, F.D. Thermal infrared spectroscopy on feldspars—Successes, limitations and their implications for remote sensing. Earth-Sci. Rev. 2010, 103, 60–70. [Google Scholar] [CrossRef]
  60. Cudahy, T. Mineral mapping for exploration: An australian journey of evolving spectral sensing technologies and industry collaboration. Geoscience 2016, 6, 52. [Google Scholar] [CrossRef] [Green Version]
Figure 1. Regional lithological map of the Guichon Creek batholith, with labelled lithofacies. The locations of the major porphyry centers are indicated, and black outlines indicate open pits. The dots represent the locations of 755 rock samples used in this study. Modified after [24].
Minerals 10 00473 g001
Figure 2. Mineral spectra derived from the sample suite, in all cases obtained from 3 × 3 pixel averages. Absorptions used for identifications are indicated with black arrows, and additional distinctive absorptions (not used here) are indicated in grey. Dashed lines indicate regions where minerals are identified using the slope of the spectrum (band ratios). Spectra are offset and scaled for clarity but are not continuum removed. (a) Spectra of Al-bearing phyllosilicates. Note that the 2125 nm absorption of white mica is only detectable in coarse-grained samples. (b) Spectra of (Fe, Mg)-bearing minerals. (c) Spectra of Ca-bearing minerals. (d) Spectra of aspectral minerals (top), and a typical mineral mixture (bottom) occurring in the sample suite, showing prehnite, epidote and white mica within a single spectrum.
Minerals 10 00473 g002
Figure 3. Variation of the spectral response of white mica as a function of thickness. (a) Spectra of white mica sheets of variable thickness measured with precision calipers. Reflectance spectra are shown without any offset and are not continuum removed. Spectra are available in Table S1. (b) Correlation between the relative second derivative strengths of the 2125 nm and 2200 nm absorptions and sample thickness.
Minerals 10 00473 g003
Figure 4. Relative abundance pixel count example. (a) False color shortwave infrared (SWIR) imagery. (b) Processed hyperspectral image showing the relative strength of the second derivative of the 1477 nm absorption, indicating the presence of prehnite. (c) Pixel count of the image shown in (b), indicating 12% of the total pixels contain prehnite for the top sample, and 54% for the bottom sample.
Minerals 10 00473 g004
Figure 5. Photographs and processed hyperspectral imagery of samples from the Bethsaida facies. Top: A mineralized sample from within the Valley open pit; (a) color photograph; (b) distribution of kaolinite (orange) and gypsum (pink); (c) spectrally determined white mica grain size (color-scale at bottom), gypsum masked and; (d) absorption position of the 2200 nm Al2-OH feature exclusively for white mica pixels above 0.5 mm in thickness (color scale at bottom), which masks kaolinite. Gypsum is also independently masked. Bottom: An unmineralized sample located 2 km west of the Valley open pit; (e) color photograph; (f) distribution of prehnite; (g) spectrally determined white mica grain size, and; (h) absorption position of the 2200 nm Al2-OH feature for white mica.
Minerals 10 00473 g005
Figure 6. Photographs and processed hyperspectral imagery of samples from the Bethsaida deposit. Top: Sample 2242958, a mineralized sample from the Guichon facies; (a) color photograph; (b) distribution of tourmaline; (c) distribution of epidote (green) and chlorite (red), and (d) position of the 2200 nm absorption. Bottom: Sample 2238816, an unmineralized sample from 6 km away from the open pit, with 7 ppm Cu; (e) color photograph; (f) distribution of montmorillonite (yellow); (g) distribution of chlorite (red), epidote (green), prehnite (blue), and amphibole (purple), and (h) the absorption position of the 2200 nm Al2-OH feature for white mica, the mixture of white mica and montmorillonite.
Minerals 10 00473 g006
Figure 7. Non-mineralized sample 2015KB102 (21 ppm Cu) from the propylitic alteration zone of the Guichon lithofacies, 3 km east of the Bethlehem deposit. (a) Sample photograph. (b) Hyperspectral imagery processed to display the position of the 1550 nm absorption feature of epidote.
Minerals 10 00473 g007
Figure 8. Correlation between the Cu concentration and the spectral alteration score obtained for the 755 slabs using the common mineralogical parameters. Samples scoring 2 or above are considered mineralized (>1000 ppm Cu). Classification results (sensitivity/specificity) are listed in the lower right for each rock group, as well as for the entirety of the dataset (G). Mineralogical data and spectral score derived for the 755 rock slabs is provided in supplementary Table S2.
Minerals 10 00473 g008
Figure 9. Downhole data from 400 m of drill core V15–021. (a) Stacked photographs of 111 core boxes. (b) Color-coded hyperspectral imagery displaying the position of the 2200 nm absorption feature (not filtered by mineralogy). The locations of boxes shown in Figure 10 are indicated. (c) Downhole graph of the 2200 nm absorption position, for every 20 cm interval of core, smoothed using a 2 m moving average. The following plots are smoothed downhole modal abundances of (d) prehnite; (e) kaolinite; (f) coarse-grained white mica, and non-smoothed modal abundances of (g) quartz; (h) sulfides; (i) spectral alteration score. Intervals of core with a score above 2 are shaded in red, and red outlines immediately to the left provide a 3 m buffer on either side of any altered zone. (j) Downhole Cu grade. The plot is capped at 1% Cu, with areas above this grade highlighted in red (the maximum grade is 2.1% Cu). Zones above 0.3% Cu are highlighted in orange, and zones above 0.1% Cu in yellow.
Minerals 10 00473 g009
Figure 10. Left: Core box 79 from a mineralized interval. (a) Color photograph. Hyperspectral imagery processed to display; (b) the distribution of kaolinite (orange), quartz (white) and sulfides (red); (c) the position of the 2200 nm absorption feature; (d) white mica grain size. Right: Core box 108 from a barren interval. (e) Color photograph. Hyperspectral imagery processed to display; (f) the distribution of kaolinite (orange) and prehnite (blue); (g) the position of the 2200 nm absorption feature; (h) white mica grain size.
Minerals 10 00473 g010
Figure 11. Regional map of the Guichon Creek batholith presenting data obtained from the 755 slab samples. (a) Copper concentration (in ppm) for all samples. Several small showings are present at the periphery of the batholith. (b) Spectral alteration score as defined in Table 2 (using all minerals). Spectrally derived relative modal abundance of; (c) kaolinite, with the presence of gypsum and tourmaline (>5%) indicated by stars and diamonds, respectively, (d) coarse grained white mica (>1 mm), and (e) prehnite. Geology and contacts after Figure 1.
Minerals 10 00473 g011
Figure 12. Regional map of the Guichon Creek batholith presenting the average 2200 nm absorption position for each of 755 slab samples with (a) no filtering by mineralogy and (b) only showing samples with no detected kaolinite or tourmaline.
Minerals 10 00473 g012
Figure 13. Drill core interval from core presented in Figure 9. (a) Core photograph. (b) Hyperspectral imagery processed to display the position of the 2200 nm absorption feature, not filtered by mineralogy and including interference from kaolinite. (c) Presence of kaolinite, derived from the presence of an absorption near 2160 nm. (d) Image presented in a), with masking of the pixels showing the 2160 nm absorption. (e) Detail of continuum removed and second derivative spectra extracted from the approximate 3 × 3 pixels area indicated in (b).
Minerals 10 00473 g013
Table 1. Spectrally detectable mineralogy at Highland Valley.
General GroupMineralDiagnostic AbsorptionsCauses Interference to:Reference
Al-bearingMontmorillonite (Mnt)
(Na,Ca)0.33(Al,Mg)2(Si4O10)(OH)2· nH2O
1467 nm [42,45]
Kaolinite (Kaol)
Al2Si2O5(OH)4
2160 nmMt, Ms, Tr[45]
Muscovite (Ms)
KAl2(AlSi3O10)(OH)2
2125 nm, 2200 nm (coarse grained only)Kaol, Mt, Tr[43,46]
Ca-bearingGypsum (Gyp)
CaSO4.2H2O
Pump[47]
Prehnite (Prh)
Ca2Al2Si3O10(OH)2
1477 nmChl (2250 nm)[48]
Pumpellyite (Pmp)
Ca2(Mg, Fe)Al2(SiO4)(Si2O7)(OH)2·(H2O)
1510 nm-[48]
(Fe,Mg)-bearingEpidote (Ep)1540 nmChl (2250 nm), Tr[49]
Ca2(Al, Fe)2(SiO4)3(OH)2250 nm
Amphibole (Am)2330 nmChl[50]
Ca2(Mg, Fe)5Si8O22(OH)22390 nm
Chlorite (Chl)2000 nmAmp, Ep, Tr[41,51]
(Mg, Fe)5Al(AlSi3)O10(OH)82250 nm
Tourmaline (Tur)
Na(Mg, Fe)3Al6(Si6O18)(BO3)3(OH)3 (OH)
2205 nm
2245 nm
Slope 1000 nm/1180 nm
Ms, Kaol, Mt, Chl (2250 nm)[52,53]
Spectrally inactiveSulfides (Sulf.)
([Cu], Fe)S2
Flat spectrum-[44]
Quartz (Qz)
SiO2
Inferred from 1450 nm H2O absorption-[54,55]
Table 2. Mineralogical parameters used for the spectral alteration score *.
GroupQz
>5%
Kaol.
>5%
Coarse Ms
>5%
Prh
<5%
Ep
<0.5%
Ep
>20%
Tur.
>5%
Sulf.
>0.1%
Bethsaida + Dykes
(N = 331)
1111
Skeena
(N = 118)
1111
Bethlehem and more mafic
(N = 306)
11122
Global
(N = 755)
11111122
* For each mineral, the modal percentage shown is the cut-off above (or below) which a sample will obtain the indicated score. Qz = quartz, Kaol = kaolinite, Coarse Ms = coarse grained white mica, Prh = prehnite, Ep = epidote, Tur. = tourmaline, Sulf. = sulfides.

