Research on the Price Fluctuation and Risk Formation Mechanism of Carbon Emission Rights in China Based on a GARCH Model

1
Data Analysis & Research Center, Fujian University of Technology, Fuzhou 350118, China
2
Research Center of Internet Finance and Blockchain, Fujian University of Technology, Fuzhou 350118, China
*
Author to whom correspondence should be addressed.
Sustainability 2020, 12(10), 4249; https://doi.org/10.3390/su12104249
Submission received: 23 March 2020
/
Revised: 5 May 2020
/
Accepted: 11 May 2020
/
Published: 22 May 2020
Abstract
:This paper examines the price of carbon emission rights published by the China Emissions Exchange (Shenzhen), analyzes the statistical characteristics of the price series and uses a generalized autoregressive conditional heteroskedasticity (GARCH) model to describe the price fluctuation of carbon emission rights and risk formation mechanisms. The study shows the following results: since 2013, China’s carbon emission rights prices have become more stable. The fluctuation of yield has gradually decreased and the market has approached a more mature stage. However, after 2018, due to factors such as the economic downturn and insufficient market information, the amplitude of price fluctuations has started to rise while frequency is increasing, which shows an asymmetry trend. The market trading risk is accumulating constantly.
1. Introduction
As an effective market scheme of responding to climate exchange, carbon emission allowance trading has already attracted a lot of attention from governments and scholars all over the world. As the world’s largest developing country and a responsible nation, how to effectively cope with climate change and achieve sustainable development is an important issue for China. At present, China has carried out pilot carbon emission trading in nine provinces. In the future, China will establish a national unified carbon emission trading market. At that time, the overall scale of China’s carbon market will have surpassed the EU Emission Trading System (EU ETS), and China’s carbon market will have become the world’s largest emissions trading market.
Due to the short time of pilot operation of China’s carbon trading market, the relevant system and market trading environment are not perfect; there are still many problems that we need to study.
1.1. Carbon Emission Allowance Trade Markets in China
As the largest developing country and the largest greenhouse gas discharging country, China faces a critical problem on how to effectively deal with climate change and to achieve sustainable development going forward. China declared it would set up nationwide carbon emission allowance trading markets starting in 2017, based on the “Climate Change Joint Declaration” jointly published by China and the United States of America in September 2015. The same announcement was made again at the Paris Climate Change Conference in December 2015. These agreements indicate the strong determination of the Chinese government to deal with climate change through setting up a nationwide carbon emission allowance trading scheme and markets.
However, establishment of nationwide carbon emission allowance trading markets in China is no doubt extremely challenging. There is no existing theory and mature pattern to follow and to use in China. Therefore, we need to learn and to explore from practice. On 18 June 2013, China established the Shenzhen emission rights exchange and began pilot carbon emission trading, and made the first deal on 18 June. Subsequently, some pilot work began in Beijing, Tianjin, Shanghai, Chongqing, Guangdong and Hubei provinces. From June 2013 to June 2014, China successively established seven carbon emission trading markets, in Shenzhen, Beijing, Tianjin, Guangdong, Shanghai, Hubei and Chongqing, which meant that China’s carbon emission trading pilot network had been launched. In January 2016, the Chinese government formulated a timetable for launching the national carbon trading market. In addition, two new carbon trading markets were established in Sichuan and Fujian provinces, to accelerate the start-up of China’s carbon trading market. On 18 December 2017 the National Development and Reform Commission (NDRC) promulgated its Plan for Building the National Carbon Emission Trading Market, signaling that its issuance constituted the official start of the national carbon emission trading system. By the end of June 2019, China’s carbon market had sold 337 million tons, with a turnover of 7.296 billion yuan (RMB). According to some forecasts, China’s carbon trading volume is expected to reach 120 billion yuan (RMB), and the futures derivatives trading could reach 500 billion yuan (RMB). (China’s carbon market has sold 337 million tons, stock. Xinhua energy daily [11 July 2019]. XINHUA FINANCE. https://xinhua08.com/a/20190711/1863341.shtml.)
It is a key issue to analyze the operation of China’s carbon emission trading market in managing China’s carbon trading market. Thus, this paper analyzes the volatility characteristics and risk formation mechanisms of Chinese carbon emission pricing.
1.2. Literature Review
Studies on carbon emission allowance pricing in the literature focus on the following two aspects. The first one is theoretical research focusing on the carbon emission allowance pricing scheme and its theoretical models. Researchers in this field include: Bahn et al. (2001), Paolella and Taschini (2008), Benz and Truck (2009), Daskalakis et al. (2009), Hintermann (2010), Carmona and Hinz (2011, 2015), Wang (2011), Chen et al. (2012), Rickels et al. (2012), Aatola and Anne (2013), Nordhaus (2014), and Recka and Scasny (2016) [1,2,3,4,5,6,7,8,9,10,11,12,13]. The second one is empirical studies concentrating on carbon emission allowance pricing and its impacting factors. Researchers in this field include: Christianse and Wettestad (2003), Klaassen (2005), Bunn and Fezzi (2007), Alberola et al. (2009), Rickels et al. (2010), Bredin and Muckley (2011), and Cotton and Mello (2014) [14,15,16,17,18,19,20].
In 2013, China’s carbon emission trading market was pilot operated. Since then, China’s carbon emission trading has become one of the research interests of scholars. Wu and Hu (2013), in their commentary on the research into carbon emission prices, point out the research field on carbon emissions in the future [21]. With respect to study of Chinese carbon emission allowance markets, Hong and Chen (2009) made a theoretical analysis of the factors impacting on Chinese carbon emission allowance prices based on trading cost and international carbon emission demand [22]. Wang and Lin (2012), and He (2012) have conducted qualitative analyses of Chinese carbon emission allowance prices using demand, supply, government pricing and scientific factors [23,24]. Huang et al. (2013) found that the volatility of carbon emission rights prices would last for a long time and would not attenuate with time [25]. Mo et al. (2016) assessed the extent and the conditions under which a carbon ETS can deliver low carbon energy investment in China. Their results show that other policy measures will be needed to promote low carbon energy development in China [26]. Zhou and Xu (2016) estimated the volatility characteristics of domestic carbon emission yields by using the ARMA–GARCH (autoregressive moving average and generalized conditional heteroskedasticity) model and found that yields show an obvious conditional heteroskedasticity effect [27]. Zhao et al. (2019) took the carbon emission trading prices of seven of China’s carbon emission trading pilot provinces and cities as their research object, and found that there are significant negative correlations between traditional energy prices and carbon emission trading prices [28]. Research on the Chinese carbon emission allowance market has focused on qualitative and theoretical research, and seldom involves statistical rules and factors impacting on carbon emission prices.
As the largest carbon emitter, China has successively launched pilot carbon emission trading markets since June 2013. After seven years of operation, it has shown some good economic and social effects. However, due to the short operation time of China’s carbon trading market, the system and trading environment are not perfect, so there are still many problems, such as: the trading volume is relatively small; the price fluctuation is relatively fierce; and the linkage mechanism of relevant prices has not yet been formed. At present, empirical research on China’s carbon emission rights market is just in its infancy, and only a few research projects have focused directly on China’s carbon emission rights market. Based on the existing research, this paper uses the GARCH model to explore the volatility characteristics and risk mechanism of China’s carbon emission rights pricing.
1.3. Main Contribution of This Paper
In this paper, we study the statistical characteristics of the prices of carbon emission allowance and their effect based on a time series analysis of the China Emissions Exchange from August 2013 to September 2019.
The research comprises the following three parts. The first part introduces the background knowledge and the literature review of carbon emission exchanging in China. The second part introduces the GARCH model and asymmetric arch model. The third part focuses on the carbon emission price, volume and beneficial rate of the carbon emission exchanging market; a statistical analysis has been conducted to establish a carbon price GARCH model to analyze its fluctuation law and risk formation mechanism. Finally, the fourth part provides the conclusions and policy recommendations of the study.
2. Research Methods and Models
The generalized autoregressive conditional heteroskedasticity (GARCH) process is an econometric term developed in 1982 by Robert F. Engle [29], an economist and winner of the Nobel Memorial Prize for Economics in 2003. GARCH models are conditionally heterogenous models with a constant unconditional variance. They have been widely used to account for non-uniform variance in financial modeling and analysis since the 1980s. Models such as GARCH, TARCH, EGARCH and PARCH can describe the price formation mechanism and fluctuation risk of the carbon emission price (SZA). All models that need to be referenced are shown below.
(1) GARCH
where is the vector of the dimensional variable , is the dimension coefficient vector of , is the conditional variance, and is a constant term.
(2) TARCH
TARCH was introduced independently by Zakoian in 1994 [30] and Glosten, Jaganathan and Runkle in 1993 [31].
Where is a dummy variable when , , otherwise, ; as long as , there is an asymmetry effect; the item becomes an asymmetrical utility, or a TARCH item in (2).
(3) EGARCH
The EGARCH model was proposed by Nelson in 1991 [32]. An EGARCH is another improved GARCH model that is also known as exponential GARCH. The EGARCH model modifies the constraints of the GARCH parameters in the case of positive parameters. The logarithm form is used to describe the conditional variance of the asymmetry. The specific form is:
The left side of Equation (3) is the logarithm of the conditional variance, which means that the leveraged effect is exponential rather than quadratic, so the predicted value of the conditional variance must be non-negative. The existence of leveraged effect can be achieved via the following assumptions when is tested; as long as , there is an asymmetry in the effect of the impact.
(4) PARCH
Ding et al. [33] proposed the PARCH (Power ARCH) model in 1993, which has the following conditional variance form:
When , for , then ; when , then . The power parameter of standard deviation is estimated to assess the magnitude of the impact on the conditional variance.
(5) MSGARCH
Markov-switching GARCH models are popular methods to account for regime changes in the conditional variance dynamics of time series. MSGARCH focuses on the conditional variance process, and there is no equation for the mean. The MSGARCH model of Haas et al. (2004) [34] is given by:
where , and allows for regime-switching in the conditional variance process.
3. Analysis of the Price Characteristics of Carbon Emission Trading
3.1. Data Description
Currently, the China Emissions Exchange is the one which plays the most representative role among the nine exchanging markets in China, from the perspective of exchanging time, size, activity, and the standardization and accuracy of exchanging data. In view of this, this paper uses the carbon closing price of the China Emissions Exchange as the research object. As a comparison, it also analyzes the trend of EU carbon exchanging prices. The data comes from the Wind Economic Database.
3.2. Descriptive Statistical Analysis
In order to analyze the trend characteristics and operation rules of carbon emission exchanges, the following is a statistical description of the carbon emission rights price data from 5 August 2013 to 27 September 2019.
3.2.1. Descriptive Statistical Analysis of Prices
At first, the statistical description of the China emission exchanging price (SZA) and EU carbon exchanging futures price (EUA) are provided in Table 1. In Table 1, the average price of carbon exchanging (SZA) is 34.739 and the standard deviation is 16.878. Further, the EU carbon exchanging futures price (EUA) has an average value of 10.33 and a standard deviation of 7.044.
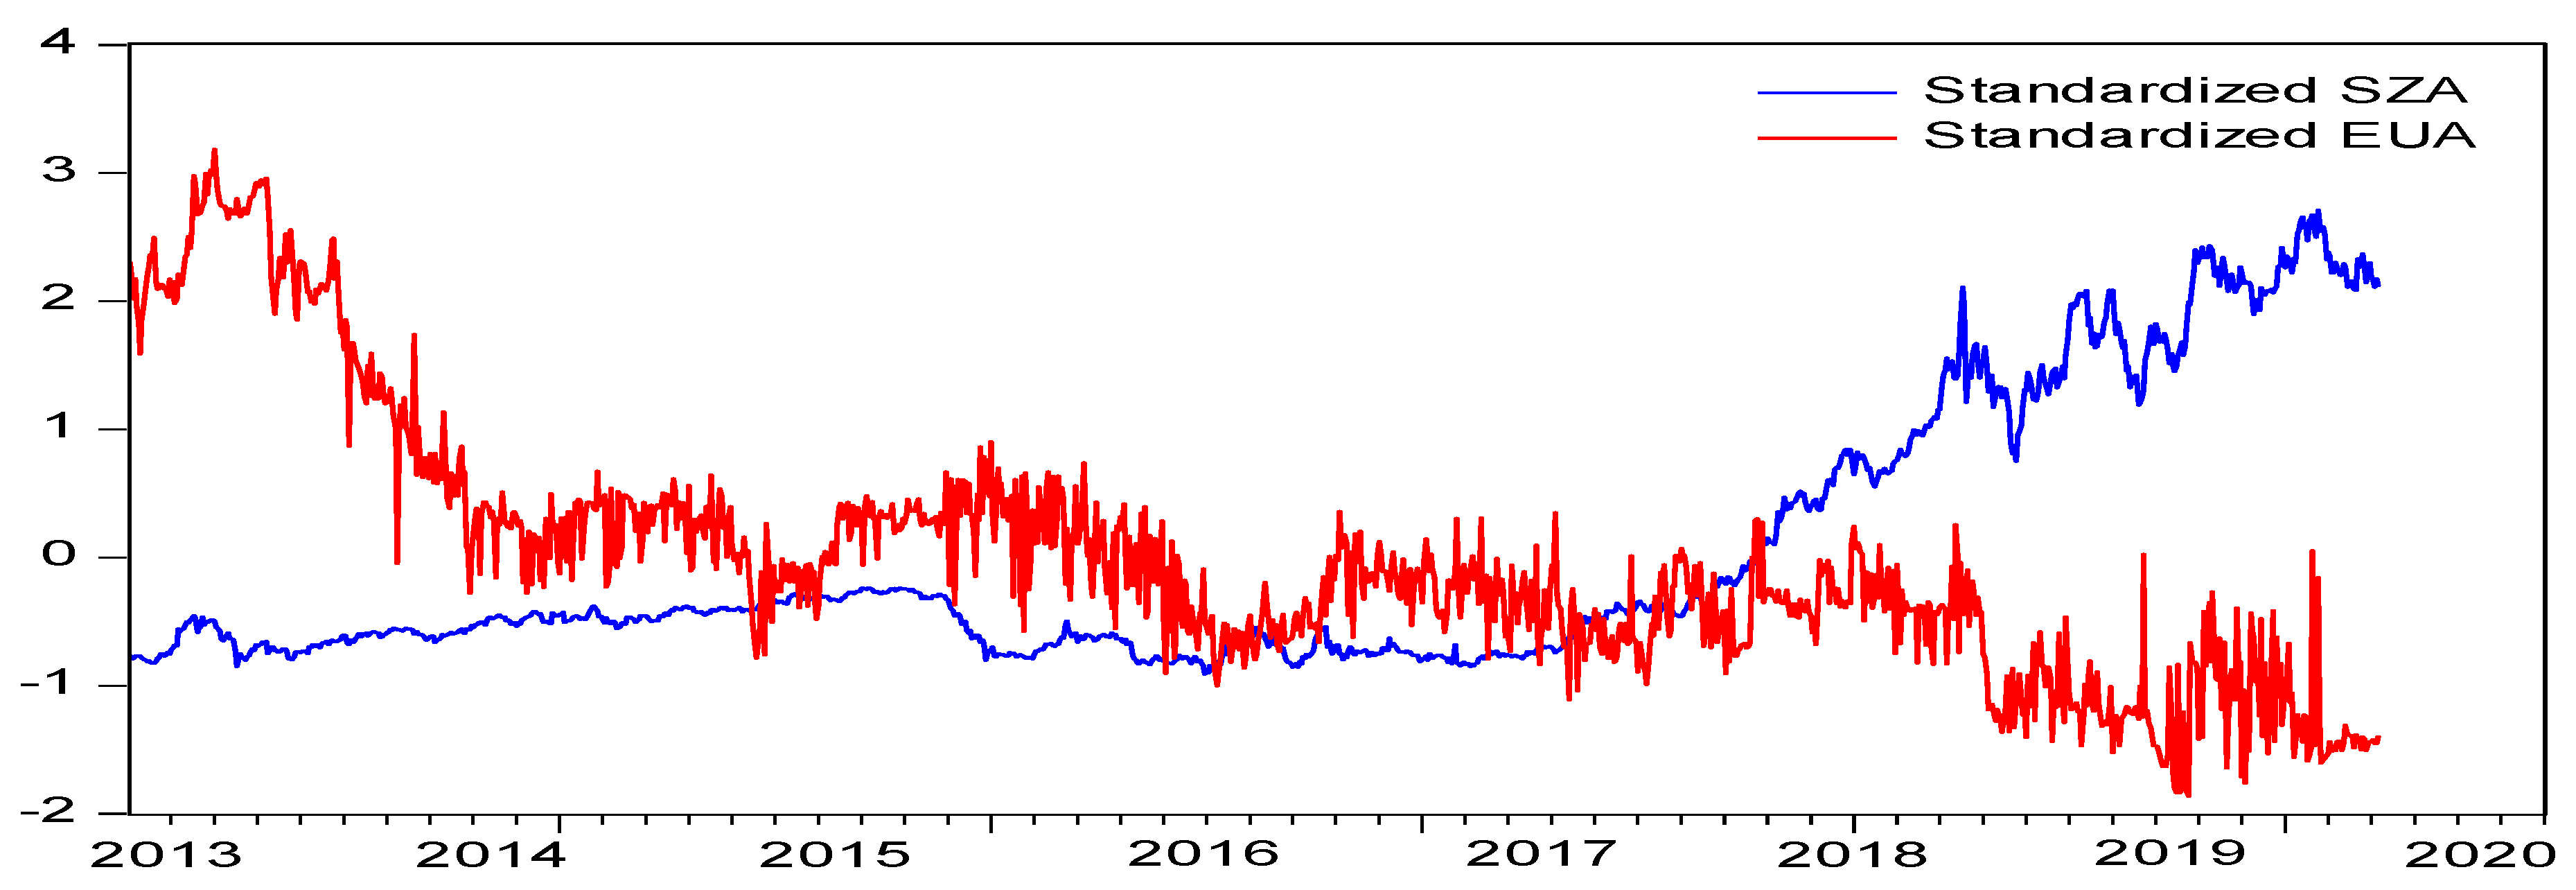
As can be seen from Figure 1, in China carbon emissions exchanging market prices were very volatile and gradually stabilized. After the official opening of the carbon emissions exchanges, the price of carbon exchanging fluctuated greatly. The price rose slightly, the overall trend declined rapidly and stabilized after one year (roughly during March 2013 to September 2014). In the following three years (roughly during October 2014 to December 2017), the performance of the China carbon exchanging price (SZA) was relatively stable. During this period, as China’s carbon emission rights spot exchanging products continued to increase, the market price was stabilized from the increase in supply. The increase in market size and liquidity made enterprises and investors become more rational, gradually resulting in a reasonable carbon price. However, in the past year (roughly during January 2018 to September 2019), the carbon exchanging price (SZA) showed a large fluctuation range. Obviously, the carbon exchanging price (SZA) was affected by carbon exchanging itself and the external market, and the market risks were gradually accumulating and increasing. In contrast to the shock downward trend of the SZA, the trend of the EUA was relatively stable, and there was a shock upward trend after 2017.
3.2.2. Characteristic Analysis of the Rate of Return
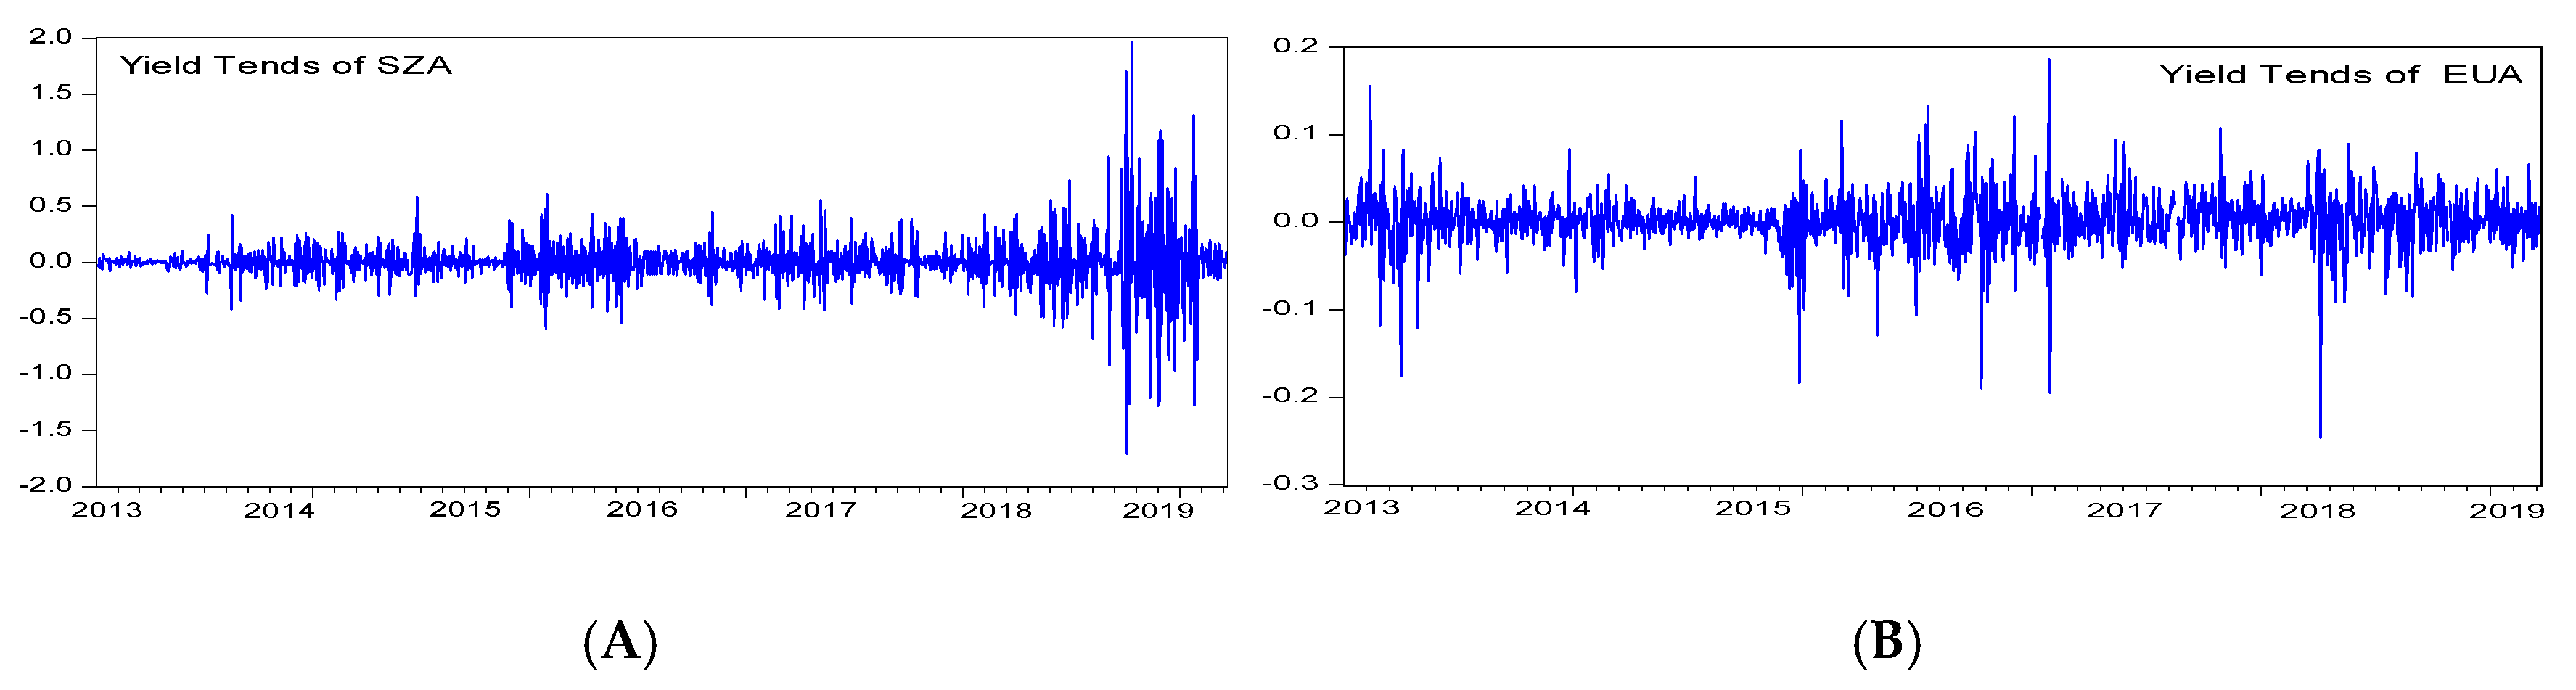
In this subsection, we investigate the price mechanisms of the SZA and the change patterns of the yield of the SZA using a GARCH model. The yield of the SZA is , where is the daily closing price. The statistical descriptions of the SZA and EUA are displayed in Table 2, and their trend graphs are displayed in Figure 2.
As shown in Figure 2A, the price fluctuation of the SZA remained relatively stable during the performance period, especially after the market had officially operated for one year. This is consistent with the price volatility analysis of the previous price characteristics analysis, and the market is gradually becoming stable. The SZA rate of return trend clustering phenomenon is observable, showing typical financial product fluctuation characteristics. Over the past year and a half, the volatility of yield of the SZA in China increased. Observing the trend of the EUA in the same period, there were also cluster fluctuations but it was relatively stable.
3.3. Establishment and Analysis of ARCH Model
3.3.1. Data Stationarity Test
A stationarity test can be used to avoid spurious regression. So, we used an augmented Dickey–Fuller (ADF) to test the stationary of the yield series of SZA. The results are displayed in Table 3.
The ADF test results in Table 3 show that the SZA is considered to be a first order differential stationary time series, and the yield of the SZA (RSZA) is a stationary time series.
3.3.2. ARCH Model Establishment
Firstly, the RSZA sequence of the carbon emission price was used as the dependent variable estimation and the RSZA (−1) as the explanatory variable; the model was established by OLS (ordinary least square). Looking at the regression equation residuals of the model, we find that there were clusters of fluctuations.
This indicates that there was heterogeneity and the model was tested for heteroskedasticity. The model residual ARCH LM test (Lagrange multiplier test) yielded an F value of 58.2210 and an accompanying probability P of 0.0000, indicating the presence of heteroskedasticity. Since the RSZA sequence often appears as a special unit root process, and is a random walk, the model for estimating the rate of return is ARCH (1), and the result is displayed in Table 4.
3.4. Establishment of the GARCH Model
The price index of carbon emission rights of the China Emissions Exchange has fluctuated clusters. Therefore, the GARCH model is established, and the GARCH (1, 1) model for the price trend of the RSZA is shown in Table 4.
The carbon emission rights price has financial product characteristics and reacts differently to information disclosure in the exchanging market. In order to better describe its financial attributes, it is necessary to further consider its asymmetrical nature. The TARCH, EGARCH and PARCH models were used to describe the market’s new information asymmetric reflection, which is provided in Table 4.
In the original GARCH model, dummy variables are introduced and a threshold is set to capture the impact of positive and negative information. When good news or bad news come, market price fluctuations show an asymmetric conditional variance effect. Based on the time-varying risk premium theory, the “volatility feedback theory” of financial markets states that good news in the market will increase the fluctuation of financial product price expectations, and investors will seek higher return on investment, so the price of financial products will naturally decrease. This has weakened the positive impact of good news on product prices. In contrast, the impact of bad news will reduce investors’ expected yield on the financial products, resulting in a drop in prices. It can be seen that negative news can cause the price of financial products to fall. New information will have an impact on financial product transactions, increasing market turmoil and risks. Moreover, whether it is bad news or good news, the market volatility will be sustainable.
In the TARCH model, the significant factor of the leverage term is 0.0793. means that the expected fluctuations in the price of carbon emission rights in China have a “leverage effect”; the negative expectations in the transaction are expected to generate greater fluctuations than the positive expectations. When price volatility has a good expectation, , and then , the impact will bring a 0.0865 times impact on price fluctuation. On the other hand, when there is a bad expectation, and then , it will bring a 0.1658 (0.0793 + 0.0865) times of the impact. Obviously, the judgment of price trends by carbon emission traders is not the same. Negative or positive expectations will cause the carbon exchanging market to slump and swell, and negative expectations can always cause greater market volatility. Bad expectations have obviously led to unstable sentiment and investment, so the market is more motivated to respond to bad information. In the past year and a half, the price trend of carbon emission rights has shown a continuous decline, and the amplitude has been increasing. As mentioned earlier, the carbon exchanging price (SZA) showed a large fluctuation range (roughly during January 2018 to September 2019).
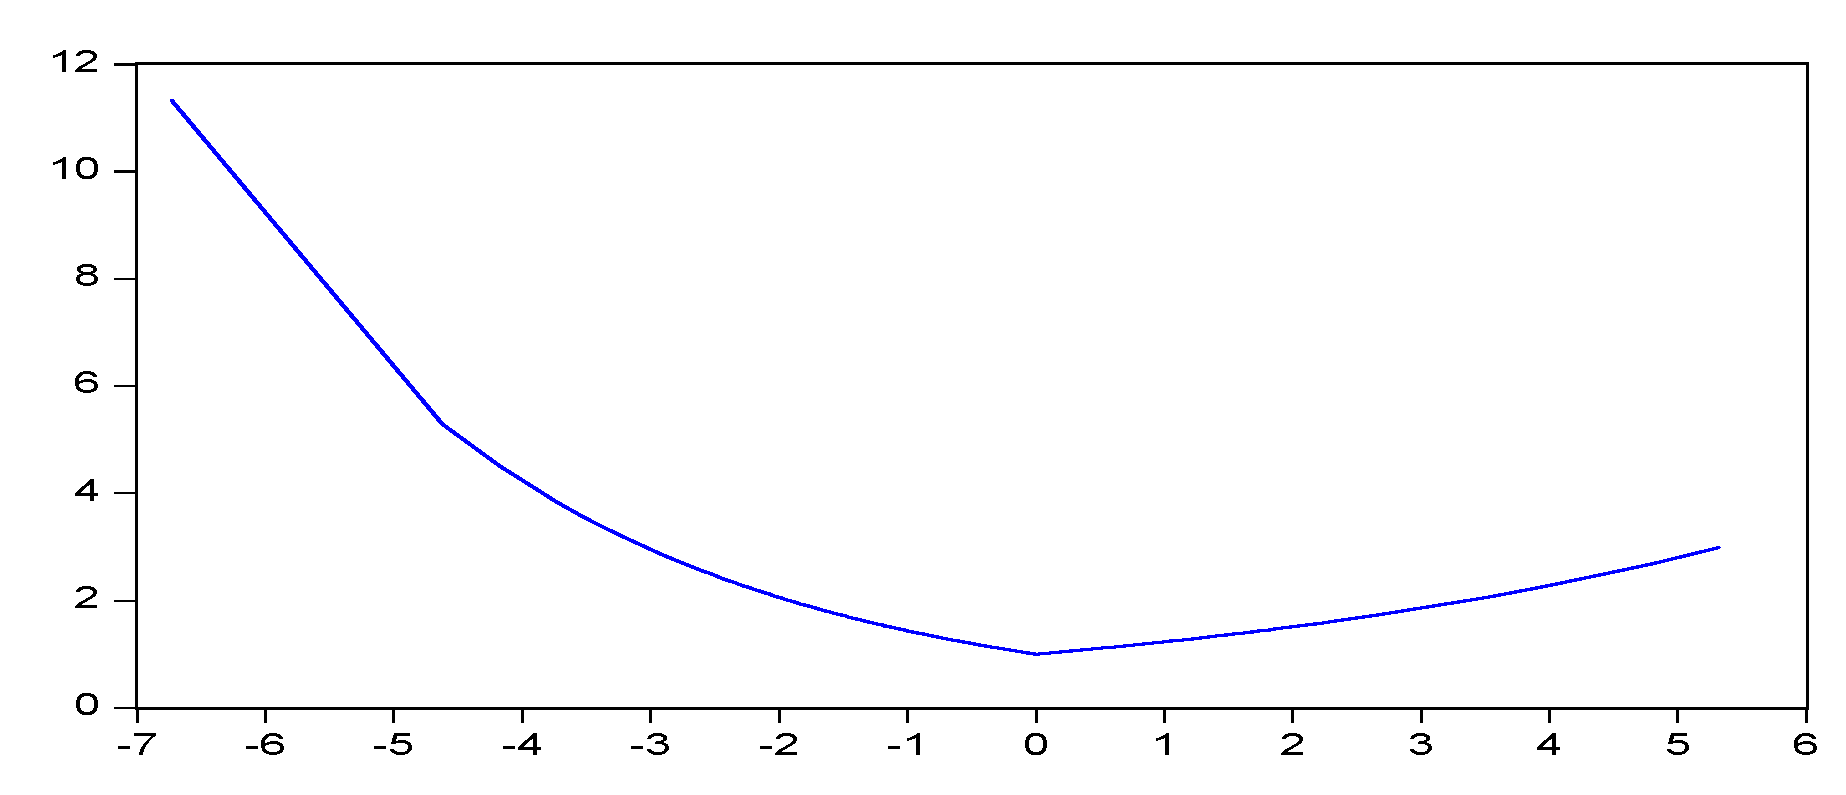
This asymmetry fluctuation is also observed in the EGARCH and PARCH models, and the impact is in the logarithm of the variance. In the EGARCH model, the coefficient of is estimated 0.2832, is the coefficient of asymmetric term , and its estimated value is −0.0773. This shows that when , the information has a 0.2059 [0.2832 + (−0.0773)] impact on the logarithm of the conditional variance. When , the information has a logarithm of 0.3605 [0.2832 + (−0.0773) × (−1)] on the logarithm of the conditional variance. According to the estimated results of the EGARCH model, the corresponding information curve can be drawn, as shown in Figure 3. As can be seen from Figure 3, when the information impact is less than 0, that is to say, when a negative impact is represented, this curve is steep, while when there is a positive impact it is relatively gentle. This suggests that negative shocks increase volatility.
By using GARCH, TARCH, EGARCH and PARCH models we can study the yield and risk formation mechanisms of carbon emission rights prices in China. The results show that there are significant conditional heteroskedastic effects and obvious “leverage effects” in carbon emission rights prices.
Using R (“MSGARCH” package) (The R package MSGARCH was described by Ardia et al. (2019) [35], you can find MSGARCH: https://CRAN.R-project.org/package=MSGARCH.), and assuming two regime-switching in the model, the MSGARCH model with normal-distribution (norm) and student-distribution (std) errors is established. The results are displayed in Table 5.
We mainly analyzed the estimation results of the MSGARCH (norm); the MSGARCH (std) was similar to this. The unconditional variances of regime 1 and regime 2 were 0.005 and 0.129, respectively. It was determined that regime 1 with small variance was a low fluctuation regime, and the regime with large variance was a high fluctuation regime. The probability of a low fluctuation regime was 71.72%, and the probability of a high fluctuation regime was 86.79%. This fully reflected the persistence of RSZA volatility. The average duration of regime 1 and regime 2 was 3.53 days and 7.57 days, respectively. The duration of a high volatility regime was 2.14 times that of a low volatility regime. This shows that the RSZA lasts longer under high volatility.
4. Conclusions
According to the practice of developed countries, carbon emission trading schemes play an important role in the government response to climate change. It is a big challenge for China to respond to climate change, to realize carbon emission reductions with the lowest cost using economic market means, and to relieve the increasing trend of greenhouse gas emissions. This paper examines the price of carbon emission rights published by the China Emissions Exchange, and uses a GARCH model to describe the price fluctuation of carbon emission rights and risk formation mechanisms. The study shows the following results: since 2013, China’s carbon emission rights prices have become more stable. The fluctuation of yield has gradually decreased and the market has approached a more mature stage. However, after 2018, due to factors such as the economic downturn and insufficient market information, the amplitude of price fluctuations has started to rise while the frequency has been increasing, which shows an asymmetry trend. This means that market trading risks are accumulating.
Based on the above analysis, three suggestions are proposed.
Firstly, accelerating the standardization and institutionalization of the carbon emission exchanging market. The carbon emission exchanging market system is the core of establishing a modern environmental protection economy and an important link with the international community. The development of the carbon emission exchanging market lags behind, which will not only affect the efficiency of environmental protection resource allocation in society overall, but also lead to distortion and deformation of the entire market mechanism, and affect China’s environmental protection projects.
The second is to increase the transparency of information on the carbon emission exchanging market and reduce market risks. Throughout China’s financial markets, information opacity is an important factor causing market volatility. Judging by the transactions on the China Emissions Exchange in the past year and a half, market volatility has been increasing and the risks have been accumulating, which leads to market ups and downs. China should speed up the release of capital market information, and guide and strengthen the publicity and supervision of the news media reporting on the carbon emission exchanging market. At the same time, China should avoid shocks of the carbon emission exchanging market due to the release of false news, and reduce market risks.
The third is cultivating rational investors actively. At present, China’s carbon emission exchanging market is still immature. Investors are unclear about the future status of the market, information, policies and regulations. They are vulnerable to market information and price fluctuations, which increases market exchanging risks. Therefore, cultivating rational investors actively, expanding the institutional investor team, and guiding investors’ rational investment behavior will be conducive to the stability of the market and reduce the risk of the carbon emissions exchanging market.
The results of this research are theoretically important to further study of carbon emission allowances. Additionally, they are practically important for reducing carbon emissions and objectively identifying the trading characteristics and rules of the carbon emissions allowance trade. They also will provide a reference for setting up nationwide carbon emission allowance trading markets.
Author Contributions
Conceptualization, J.Z.; analysis of the current situation of the carbon emission market, J.Z.; collection and analysis of data, Y.X.; model building, Y.X.; writing, J.Z. and Y.X. All authors have read and agreed to the published version of the manuscript.
Funding
This research was funded by: The New Century Excellent Talents Support Plan for Fujian Provincial Universities: 2016 and 2017; the Undergraduate teaching reform research projects of Fujian University of Technology (JG-SJ-201915); and the Research initiation fund project of Fujian University of Technology (GY-S20006).
Conflicts of Interest
The authors declare no conflict of interest.
References
- Bahn, O.; Barreto, L.; Kypreos, S. Modelling and assessing inter-regional trade of Co2 emission reduction units. Environ. Model. Assess. 2001, 6, 173–182. [Google Scholar] [CrossRef]
- Paolella, M.S.; Taschini, L. An Econometric Analysis of Emission Trading Allowances. J. Bank. Financ. 2008, 32, 2022–2032. [Google Scholar] [CrossRef] [Green Version]
- Benz, E.; Truck, S. Modeling the Price Dynamics of CO2 Emission Allowances. Energy Econ. 2009, 31, 4–15. [Google Scholar] [CrossRef]
- Daskalakis, G.; Psychoyios, D.; Markellos, R. Modeling CO2 Emission Allowance Prices and Derivatives: Evidence from the European Trading Scheme. J. Bank. Financ. 2009, 33, 1230–1241. [Google Scholar] [CrossRef]
- Hintermann, B. “Allowance price drivers in the first phase of the EU ETS”. J. Environ. Econ. Manag. 2010, 59, 43–56. [Google Scholar] [CrossRef] [Green Version]
- Carmona, R.; Fehr, M.; Hinz, J. Optimal Stochastic Control and Carbon Price Formation. Siam J. Control Optim. 2015, 48, 2168–2190. [Google Scholar] [CrossRef]
- Carmona, R.; Hinz, J. Risk-Neutral Models for Emission Allowance Prices and Option Valuation. Manag. Sci. 2011, 57, 1453–1468. [Google Scholar] [CrossRef] [Green Version]
- Wang, W.J. The Market Efficiency and Price behavior of Emission Allowance in EU ETS. Ph.D. Thesis, University of Science and Technology of China , Hefei, China, 2011. (In Chinese). [Google Scholar]
- Chen, X.H.; Wang, B.J. Empirical Research on Price Impact Factor of Carbon Emission Exchange Evidence from EU ETS. Syst. Eng. 2012, 30, 53–60. [Google Scholar]
- Rickels, W.; Rehdanz, K.; Oschlies, A. Economic prospects of ocean iron fertilization in an international carbon market. Resour. Energy Econ. 2012, 34, 129–150. [Google Scholar] [CrossRef] [Green Version]
- Aatola, P.; Ollikainen, M.; Toppinen, A. Price Determination in The EU ETS Market: Theory and Econometric Analysis with market fundamentals. Energy Econ. 2013, 36, 380–395. [Google Scholar] [CrossRef]
- Nordhaus, W. Estimates of the Social Cost of Carbon: Concepts and Results from the DICE-2013R Model and Alternative Approaches. J. Assoc. Environ. Resour. Econ. 2014, 1, 273–312. [Google Scholar] [CrossRef]
- Recka, L.; Scasny, M. Impacts of carbon pricing, brown coal availability and gas cost on Czech energy system up to 2050. Energy 2016, 108(c), 19–33. [Google Scholar] [CrossRef]
- Christiansen, A.C.; Wettestad, J. The EU as a frontrunner on greenhouse gas emissions trading: How did it happen and will the EU succeed. Clim. Policy 2003, 3, 3–18. [Google Scholar] [CrossRef]
- Klaassen, G.; Nentjes, A.; Smith, M. Testing the theory of emissions trading: Experimental evidence on alternative mechanisms for global carbon trading. Ecol. Econ. 2005, 53, 47–58. [Google Scholar] [CrossRef]
- Bunn, D.W.; Fezzi, C. Interaction of European Carbon Trading and Energy Prices. Milan: Fondazione Eni Enrico Mattei Working Paper. No.63; Fondazione Eni Enrico Mattei: Milan, Italy, 2007. [Google Scholar]
- Alberola, E.; Chevallier, J.; Chze, B. Emissions compliances and carbon prices under the EU ETS: A country specific analysis of Industrial sectors. J. Policy Model. 2009, 31, 446–462. [Google Scholar] [CrossRef]
- Rickels, W.; Gorlich, D.; Oberst, G. Explaining European Emission Allowance Price Dynamics: Evidence from Phase II. Kiel Working Paper 1650; Kiel Institute for the World Economy: Kiel, Germany, 2010. [Google Scholar]
- Bredin, D.; Muckley, C. An emerging equilibrium in the EU emissions trading scheme. Energy Econ. 2011, 33, 353–362. [Google Scholar] [CrossRef]
- Cotton, D.; Mello, L. Econometric analysis of Australian emissions markets and electricity prices. Energy Policy 2014, 74, 475–485. [Google Scholar] [CrossRef]
- Wu, H.Y.; Hu, G.H. Review of Carbon Emission Trading Outside China. Resour. Sci. 2013, 35, 1828–1838. (In Chinese) [Google Scholar]
- Hong, J.; Chen, J. Analysis on the Impacting Factor of Chinese Carbon Exchange Price. Price Theory Pract. 2009, 12, 65–66. [Google Scholar]
- Wang, Y.L.; Lin, J. Research on Pricing System of Chinese Carbon Emission Allowance. Price Theory Pract. 2012, 2, 87–88. (In Chinese) [Google Scholar]
- He, H.B. Analysis of Impacting Factor on Chinese Carbon Emission. Econ. Res. Guide 2012, 15, 24–25. (In Chinese) [Google Scholar]
- Huang, X.F.; Cheng, Y.X.; Tang, J.H. Research on Trading Price Volatility of the International Carbon Emission Rights: Based on the Mechanism of CDM. Theory Pract. Financ. Econ. 2013, 34, 93–97. (In Chinese) [Google Scholar]
- Mo, J.; Agnolucci, P.; Jiang, M.; Fan, Y. The impact of Chinese carbon emission trading scheme (ETS) on low carbon energy (LCE) investment. Energy Policy 2016, 89, 271–283. [Google Scholar] [CrossRef]
- Zhou, T.Y.; Xu, R.X. The Formation and Volatility Features of China’s Carbon Emission Trading Price Based on the Data of Shenzhen Carbon Emission Exchange. J. Financ. Dev. Res. 2016, 1, 16–25. (In Chinese) [Google Scholar]
- Zhao, X.M.; Wei, X. Research on the Relationship between Traditional Energy Prices and China’s Carbon Emission Trading Prices: Based on the Panel Data from Seven China’s Pilot Provinces and Cities of Carbon Emission Trading. Ecol. Econ. 2019, 35, 31–34. (In Chinese) [Google Scholar]
- Engle, R.F. Autoregressive Conditional Heteroscedasticity with Estimates of the Variance of United Kingdom Inflation. Econometrica 1982, 50, 987–1007. [Google Scholar] [CrossRef]
- Zakoian, J.M. Threshold Heteroskedastic Models. J. Econ. Dyn. Control 1994, 18, 931–955. [Google Scholar] [CrossRef]
- Glosten, L.R.; Jagannathan, R.; Runkle, D. On the Relation between the Expected Value and the Volatility of the Nominal Excess Return on Stocks. J. Financ. 1993, 48, 1779–1801. [Google Scholar] [CrossRef]
- Nelson, D.B. Conditional Heteroskedasticity in Asset Returns: A New Approach. Econometrica 1991, 59, 347–370. [Google Scholar] [CrossRef]
- Ding, Z.; Granger, C.W.J.; Engle, R.F. A long memory property of stock market returns and a new model. J. Empir. Financ. 1993, 1, 83–106. [Google Scholar] [CrossRef]
- Haas, M.; Mittnik, S.; Paolella, M.S. A new approach to Markov-switching GARCH models. J. Financ. Econom. 2004, 2, 493–530. [Google Scholar] [CrossRef]
- Ardia, D.; Bluteau, K.; Boudt, K.; Catania, L.; Trottier, D.-A. Markov-switching GARCH models in R: The MSGARCH package. J. Stat. Softw. 2019, 91, 1–38. [Google Scholar] [CrossRef] [Green Version]
Figure 1.
Price trends of the SZA and EUA.

Figure 2.
Yield trends of SZA (A) and EUA (B).

Figure 3.
The information shock curve of RSZA (EGARCH model).


Table 1.
Descriptive statistics of SZA and EUA.
| Sample | Minimum | Maximum | Mean | Median | Std. Dev. | Kurtosis | |
|---|---|---|---|---|---|---|---|
| SZA | 1304 | 3.300 | 88.450 | 34.739 | 32.080 | 16.878 | 4.209 |
| EUA | 1304 | 3.930 | 29.420 | 10.332 | 7.090 | 7.044 | 3.185 |
Table 2.
Descriptive statistics of yields of SZA and EUA.
| Sample | Minimum | Maximum | Mean | Std. Dev. | Skewness | Kurtosis | |
|---|---|---|---|---|---|---|---|
| yield of SZA | 1304 | −1.7055 | 1.9635 | 0.0014 | 0.2238 | −0.3297 | 19.5185 |
| yield of EUA | 1304 | −0.2458 | 0.1859 | 0.0015 | 0.0321 | −0.7318 | 11.1320 |
Table 3.
ADF testing result of yield of SZA.
| SZA | △SZA | RSZA | |
|---|---|---|---|
| ADF test | −1.7618 | −19.9344 *** | −21.9062 *** |
Note: The test critical values 1% level: −3.4351, *** means passing the 1% significance level test.
Table 4.
The model of RSZA.
| Variable | ARCH | GARCH | TARCH | EGARCH | PARCH |
|---|---|---|---|---|---|
| AR (1) | −0.2133 *** | −0.3867 *** | −0.3832 *** | −0.3872 *** | −0.3923 *** |
| (−0.2133) | (0.0247) | (0.0239) | (0.0243) | (0.0225) | |
| 1.0696 *** | 0.0002 *** | 0.0001 *** | −0.2936 *** | 0.0002 *** | |
| (0.0323) | (0.00002) | (0.00002) | (0.0167) | (0.0007) | |
| 0.1353 *** | 0.0865 *** | 0.2832 *** | 0.1418 *** | ||
| (0.0118) | (0.0129) | (0.0166) | (0.0009) | ||
| 0.0793 *** | −0.0773 *** | 0.4231 *** | |||
| (0.0251) | (0.0155) | (0.0634) | |||
| 0.8763 *** | 0.8853 *** | 0.9776 *** | 0.8839 *** | ||
| (0.0077) | (0.0069) | (0.0023) | (0.0063) | ||
| 0.9172 *** | |||||
| (0.0983) | |||||
| AIC | −0.7091 | −1.1621 | −1.1647 | −1.1775 | −1.1741 |
Note: *** means passing the 1% significance level test, the value in () is the standard deviation.
Table 5.
Parameter estimates of MSGARCH (1,1) models.
| Variable | MSGARCH (norm) | MSGARCH (std) |
|---|---|---|
| 0.0001 *** | 0.0039 *** | |
| (0.0001) | (0.0012) | |
| 0.5564 *** | 0.4178 *** | |
| (0.3710) | (0.8010) | |
| 0.4239 *** | 0.5697 *** | |
| (0.0275) | (0.0422) | |
| 0.0008 *** | 0.0009 *** | |
| (0.0004) | (0.0005) | |
| 0.0600 *** | 0.9980 *** | |
| (0.0394) | (0.0399) | |
| 0.9338 *** | 0.0000 | |
| (0.0040) | (0.0001) | |
| 0.7172 | 0.9736 | |
| 0.8679 | 0.0871 | |
| AIC | −1583.1687 | −1624.3936 |
Note: *** means passing the 1% significance level test, the value in () is the standard deviation.
© 2020 by the authors. Licensee MDPI, Basel, Switzerland. This article is an open access article distributed under the terms and conditions of the Creative Commons Attribution (CC BY) license (http://creativecommons.org/licenses/by/4.0/).
Share and Cite
MDPI and ACS Style
Zhang, J.; Xu, Y. Research on the Price Fluctuation and Risk Formation Mechanism of Carbon Emission Rights in China Based on a GARCH Model. Sustainability 2020, 12, 4249. https://doi.org/10.3390/su12104249
AMA Style
Zhang J, Xu Y. Research on the Price Fluctuation and Risk Formation Mechanism of Carbon Emission Rights in China Based on a GARCH Model. Sustainability. 2020; 12(10):4249. https://doi.org/10.3390/su12104249
Chicago/Turabian StyleZhang, Jilin, and Yukun Xu. 2020. "Research on the Price Fluctuation and Risk Formation Mechanism of Carbon Emission Rights in China Based on a GARCH Model" Sustainability 12, no. 10: 4249. https://doi.org/10.3390/su12104249
Note that from the first issue of 2016, this journal uses article numbers instead of page numbers. See further details here.