MonkeyCBP: A Toolbox for Connectivity-Based Parcellation of Monkey Brain
 Bin He1,2,3†
  Zhengyi Yang2†
  Lingzhong Fan2,4
  Bin Gao2
  Hai Li2
  Chuyang Ye2
  Bo You1*
  Tianzi Jiang2,3,4,5,6,7,8*
- 1School of Mechanical and Power Engineering, Harbin University of Science and Technology, Harbin, China
- 2Brainnetome Center, Institute of Automation, Chinese Academy of Sciences, Beijing, China
- 3National Laboratory of Pattern Recognition, Institute of Automation, Chinese Academy of Sciences, Beijing, China
- 4University of Chinese Academy of Sciences, Beijing, China
- 5Key Laboratory for NeuroInformation of the Ministry of Education, School of Life Sciences and Technology, University of Electronic Science and Technology of China, Chengdu, China
- 6CAS Center for Excellence in Brain Science and Intelligence Technology, Institute of Automation, Chinese Academy of Sciences, Beijing, China
- 7Queensland Brain Institute, The University of Queensland, Brisbane, QLD, Australia
- 8Chinese Institute for Brain Research, Beijing, China
Non-human primate models are widely used in studying the brain mechanism underlying brain development, cognitive functions, and psychiatric disorders. Neuroimaging techniques, such as magnetic resonance imaging, play an important role in the examinations of brain structure and functions. As an indispensable tool for brain imaging data analysis, brain atlases have been extensively investigated, and a variety of versions constructed. These atlases diverge in the criteria based on which they are plotted. The criteria range from cytoarchitectonic features, neurotransmitter receptor distributions, myelination fingerprints, and transcriptomic patterns to structural and functional connectomic profiles. Among them, brainnetome atlas is tightly related to brain connectome information and built by parcellating the brain on the basis of the anatomical connectivity profiles derived from structural neuroimaging data. The pipeline for building the brainnetome atlas has been published as a toolbox named ATPP (A Pipeline for Automatic Tractography-Based Brain Parcellation). In this paper, we present a variation of ATPP, which is dedicated to monkey brain parcellation, to address the significant differences in the process between the two species. The new toolbox, MonkeyCBP, has major alterations in three aspects: brain extraction, image registration, and validity indices. By parcellating two different brain regions (posterior cingulate cortex) and (frontal pole) of the rhesus monkey, we demonstrate the efficacy of these alterations. The toolbox has been made public (https://github.com/bheAI/MonkeyCBP_CLI, https://github.com/bheAI/MonkeyCBP_GUI). It is expected that the toolbox can benefit the non-human primate neuroimaging community with high-throughput computation and low labor involvement.
Introduction
Non-human primates (NHPs) resemble high similarities in the neuroanatomical structures and cognitive functions to humans (Perretta, 2009). NHP models are essential in understanding brain structures and functions, as well as neurodegenerative diseases and pathological disorders. The neuroimaging on NHPs has provided vital information in basic and translational neuroscience research for various diseases, such as Parkinson’s disease (Zhang et al., 2000), Alzheimer’s disease (Smith et al., 1999), and autism (Amaral et al., 2003). There is an increasing interest in magnetic resonance imaging (MRI) of monkeys for neuroscience research, imposing a significant challenge in high-quality brain atlas constructed from MRI data.
Building an atlas involves dividing the brain into regions with certain homogeneity within each region. The definition of region boundaries has always been challenging since the development of the well-known Brodmann atlas (Brodmann, 1909). Various atlases have been constructed from MRI (Toga et al., 2006; Amunts and Zilles, 2015; Fan et al., 2016; Glasser et al., 2016), and they diverge in the boundary defining criteria, ranging from cytoarchitectonic features, neurotransmitter receptor distributions, myelination fingerprints, transcriptomic patterns to structural and functional connectomic profiles, and any combination of the above. Among them, connectivity-based parcellation (CBP) has attracted increasing interest from the community. The rationale behind CBP is that the function of a certain cortical area is mainly determined by the unique connectional pattern defined by inputs and outputs (“connectional fingerprint”), and its local infrastructure characterized by microstructural properties (Passingham et al., 2002). Therefore, brain areas should be definable by aggregating voxels/vertices demonstrating similar connectivity patterns, characterized by structural, functional, or meta-analytic connectivity (Behrens et al., 2003; Kim et al., 2010; Eickhoff et al., 2011), and so forth into clusters. Researchers have used CBP to form cartographic maps of specific brain regions or the entire cortex (Eickhoff et al., 2015), and the whole human brain—the human brainnetome atlas (Fan et al., 2016)—which is based on the anatomical connectivity profiles derived from structural neuroimaging data.
A brain atlas of macaque monkey has been constructed using a CBP pipeline similar to Automatic Tractography-Based Brain Parcellation (ATPP) (Wang et al., 2018). However, previous work involves many operator interventions throughout the process, including manual delineation of brain tissue, fine-tuning registration, and fiber tracking parameters. To facilitate researchers with limited programming skills in using CBP, we have published an automatic pipeline for building brainnetome atlas of human brain, named ATPP. In this paper, we present a variation of ATPP, which is dedicated to monkey brain parcellation, to address the significant differences in the process between the two species. The new toolbox, MonkeyCBP, has major alterations in three aspects: brain extraction, image registration, and validity indices. By parcellating two different brain regions [posterior cingulate cortex (PCG) and frontal pole (FP)] of the rhesus monkey, we demonstrate the efficacy of these alterations.
Framework of MonkeyCBP
Overview
The toolbox takes single or multiple user-defined regions of interest (ROIs) and a set of parameters as input and automatically parcellates the brain and output the parcellation results, as well as debug information in a text file. Figure 1 is the flowchart of the toolbox. As a pipeline tailored for monkey brain, MonkeyCBP toolbox has several steps that are significantly different from the ATPP package. First, two methods for monkey brain extraction have been incorporated to the toolbox. One is a modified version of the Brain Extraction Tool (BET) method (Luo et al., 2018); the other is based on multi-atlas segmentation (MaS). Second, the SPM registration method used for human brain has been replaced by methods based on Advanced Normalization Tools (ANTs)1 (Avants et al., 2011), which are more suitable for monkey brain processing. Third, the parcellation validity indices have been improved. In addition to preserving the previous verification method on the basis of the information of standard space, we introduced a statistical framework method of principal component analysis (PCA), which is simple and effective to facilitate users to select cluster numbers and further improves the reliability of the conclusion by analyzing the original data, to verify the results of brain parcellation.
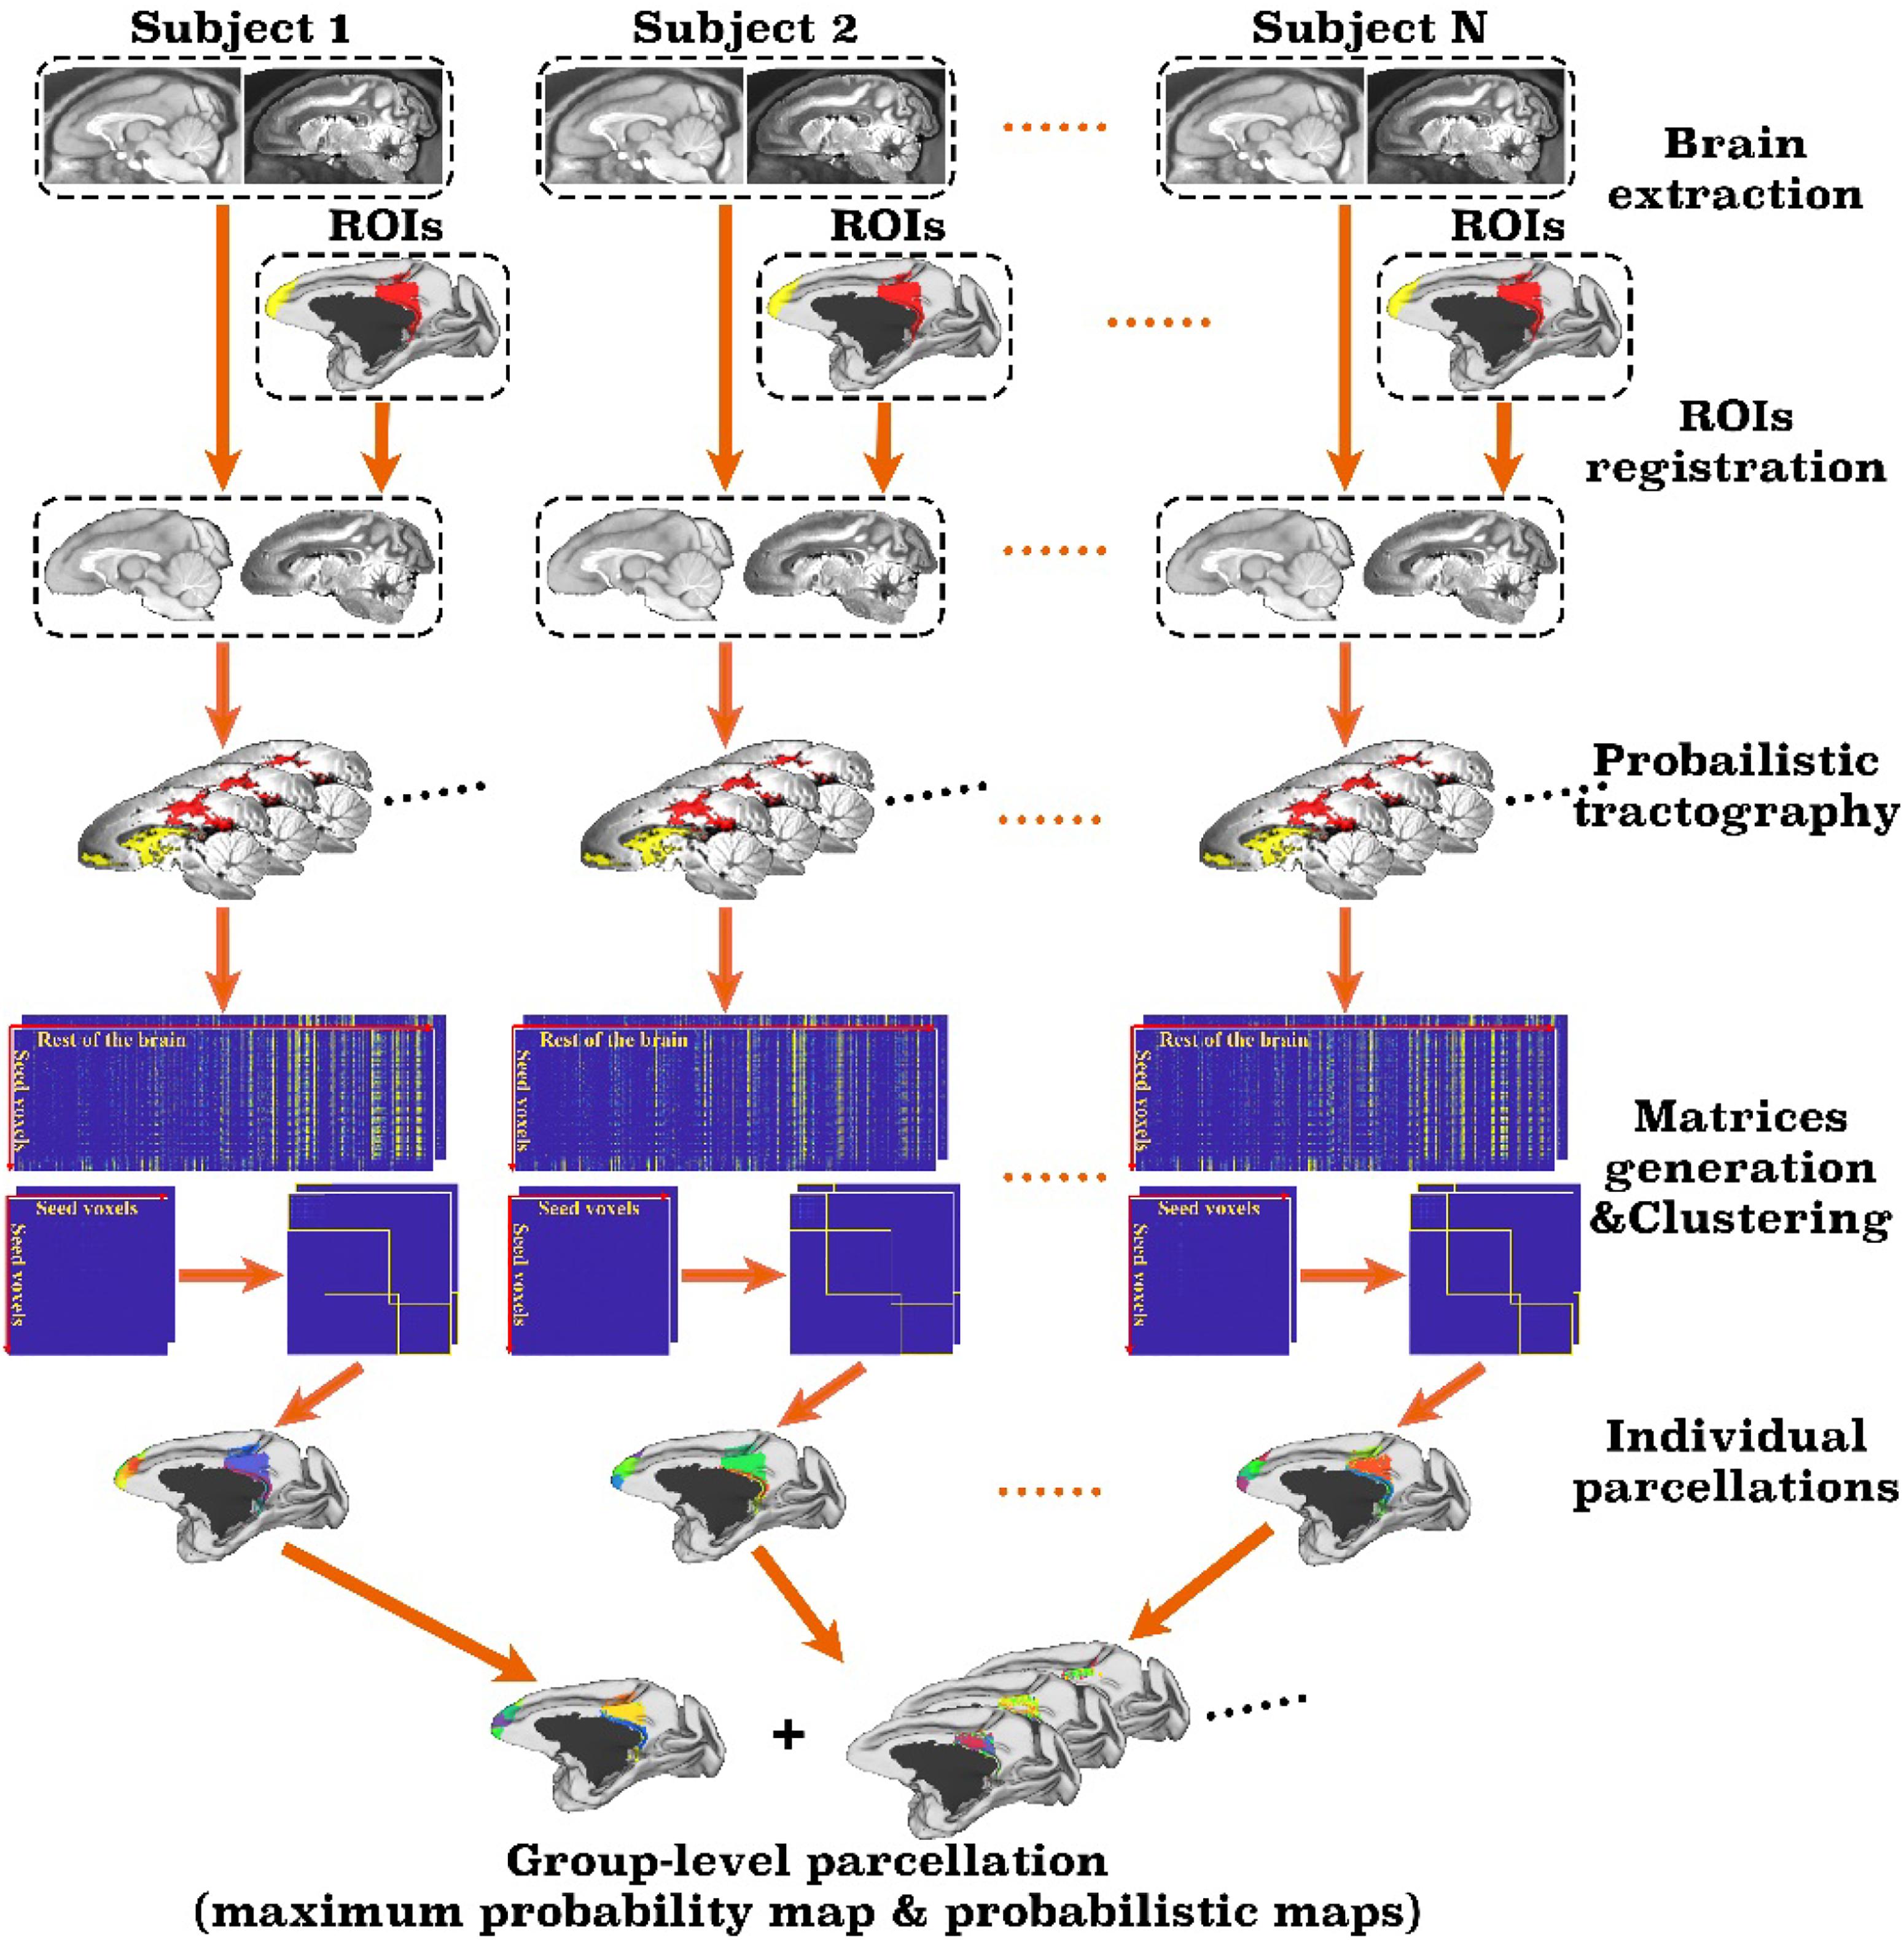
Figure 1. Framework of the MonkeyCBP toolbox. The processing steps of the pipeline mainly including brain extraction, registration, probabilistic tractography, and clustering. First, the technique of brain extraction for monkey MRI data was performed; then based on T1w and diffusion tensor images of the same subjects, two defined regions of interest (ROIs), including the right posterior cingulate cortex and the bilateral frontal pole, are parcellated simultaneously. After pipeline processing, the parcellation results at both individual level and group level with a maximum probability map and probabilistic maps of each subarea of the right posterior cingulate cortex and the bilateral frontal pole are generated.
Brain Extraction
Brain extraction, or skull stripping, from human MRI data has been widely examined in the development of neuroimaging, as a stepping stone for subsequent analyses, such as intracranial volume calculation, tissue classification, subregion segmentation, connectivity computation, and brain network construction. Nevertheless, the technique of brain extraction for monkey MRI data has not been as mature as that for human data. The task of brain extraction is to retain the brain tissue only and remove the non-brain tissues, including scalp, skull, and eyeballs, which often negatively affect automated image registration, segmentation, and further analyses. As reviewed in Kalavathi and Prasath (2016), human brain extraction methods can be broadly classified into four categories on the basis of morphology, intensity, deformable surface, and atlas/template. In addition, hybrid methods combining any of the four types have also been explored.
We have reported a BET (Smith, 2002) variation for rhesus brain extraction (Luo et al., 2018). Hereby, we briefly review a subset of the atlas/template-based and hybrid methods, in which multiple atlases are used. An atlas is defined by a pair of structural images and its manual segmentation, or labels. Besides preprocessing (e.g., intensity inhomogeneity correction) and postprocessing (e.g., morphological hole filling), MaS involves three major steps:
• label mapping: registering the images in multiple atlases to the image under segmentation and transforming the manual labels accordingly;
• atlas selection: choosing the atlases best matched to the image under segmentation; and
• label fusion: fusing the multiple transformed labels to obtain the final segmentation.
General-purpose MaS methods were reviewed in Iglesias and Sabuncu (2015) and was initially introduced to neuroimaging for segmenting brain into anatomical structures (Aljabar et al., 2009), and it was demonstrated that image similarity and age were both suitable for atlas selection. Artaechevarria et al. (2009) prompted local weighting scheme for label fusion and highlighted that not a single fusion method was optimal to all structures. Lötjönen and colleagues reported a hybrid method combining MaS and expectation maximization (Lötjönen et al., 2010). Wang J. et al. (2014) used a graph-based atlas selection method to reduce overall computational time. A recent advance was the sparsity-based atlas selection strategy applied to newborn brains (Serag et al., 2016).
Dedicated to brain extraction, Leung et al. presented a multi-atlas propagation and segmentation (MAPS) method (Leung et al., 2011) that outperformed three methods without using atlases, including BET. BEaST was proposed to speed up the time-consuming label mapping step by reducing the areas to be applied patch-based segmentation, the number of atlases, and patches (Eskildsen et al., 2012). Doshi et al. (2013) developed a method called Multi-Atlas Skull Stripping (MASS), to enhance atlas representativeness by defining study-specific atlases selected from the images under segmentation, rather than existing atlases. In their method, extra effort is needed for semi-automatically segmenting the selected images. Joint label fusion (JLF) was proposed to overcome the invalid assumption that the atlases are independent, and significant improvement was reported (Wang et al., 2013). MaS methods were also adapted to segment fetal brains (Tourbier et al., 2015) and brain/ventricles simultaneously (Tang et al., 2015).
A variant of BET was developed for rhesus monkey brain extraction and achieved a dice similarity coefficient (DSC) of 92.6% (Fu et al., 2016). However, there has been limited work on the use of MaS approaches for rhesus monkey brain extraction. Ballanger et al. applied MaS method to extract brain from T1-weighted (T1w) MR images of crab-eating monkeys (Macaca fascicularis) (Ballanger et al., 2013), and they reported the first MaS dataset for NHP. Maldjian et al. (2016) presented study-specific atlases for rhesus, vervet, and cynomolgus monkeys. Brain extraction was used to transform the labels in the best performed atlas judged by image similarity; no quantitative evaluation was reported though. A hybrid method combining MaS for coarse extraction with surface deforming guided by local intensity and priors was developed and tested on both human and NHP brain images (Wang Y. et al., 2014). Tested on a single dataset of 20 adult healthy rhesus macaques, it achieved overall DSC of around 97%, mean absolute surface distance (MASD) of around 0.6 mm, and maximum surface distance of around 4 mm, which significantly outperformed Brain Surface Extractor (BSE), Hybrid Watershed Algorithm (HWA), Analysis of Functional NeuroImages (AFNI), and BET and its two variations.
In this study, we developed a MaS-based protocol for automatically extracting brain tissues from structural MRI data of rhesus macaque (Macaca mulatta). We evaluated the performance by comparing the results against manual segmentations. The brain tissue boundaries of all subjects were manually traced on the axial view using ITK-SNAP (Yushkevich et al., 2006), whereas the other two views were displayed for reference. Manual delineations along with original images were visually inspected by a co-author slice by slice to rectify incorrectly segmented regions, recover over-segmented brain tissues, and remove non-brain tissues. Thus, an atlas was obtained for each subject from its T1w MR image, with brain tissue voxels manually labeled as 1 and others as 0. Then the three major steps of MaS were followed: (i) For label mapping, the software package ANTs was used for non-linear registration because of its outstanding performance (Klein et al., 2009). (ii) For atlas selection, we built study-specific atlases for D24 and D30, using a leave-one-out (LOO) cross-validation (CV) scheme. In each LOO CV run, for each subject, the manual segmentations of the remaining subjects were non-linearly registered and mapped to its space. The label fusion methods were then applied to combine the mapped segmentations and extract the brain of the left-out subject. (iii) For label fusion, we tested majority voting (MV) (Lötjönen et al., 2010) and JLF (Wang et al., 2013). To shorten the overall time, we applied label fusion to voxels within a mask around the brain boundary, which was generated by subtracting the intersection of all mapped atlas segmentations from their union.
Two independent datasets (24 and 30 subjects, named D24 and D30, respectively) were used for testing the generalizability of the developed pipeline. The accuracy was evaluated using DSC, MASD, and relative volume difference (RVD) measures (Yang et al., 2015) with manual segmentations as reference. We visually inspected the segmentation results of both MaS methods, and we found that all images (54 in total) were reasonably segmented without obvious failure, indicated by DSC values (108 in total) larger than 0.85. As illustrated in Figures 2, 3, JLF significantly outperformed MV on both datasets, in terms of DSC, MASD, and RVD (paired t-test, p < 0.05). The quantitative evaluation is shown in Table 1. The extractions on D24 are generally better than D30. However, the maximum symmetric surface-to-surface distance of D24 (2.97 ± 2.83 mm) is notably larger than that of D30 (1.94 ± 1.90 mm), designating worse extreme case of local segmentation error in D24 than D30.
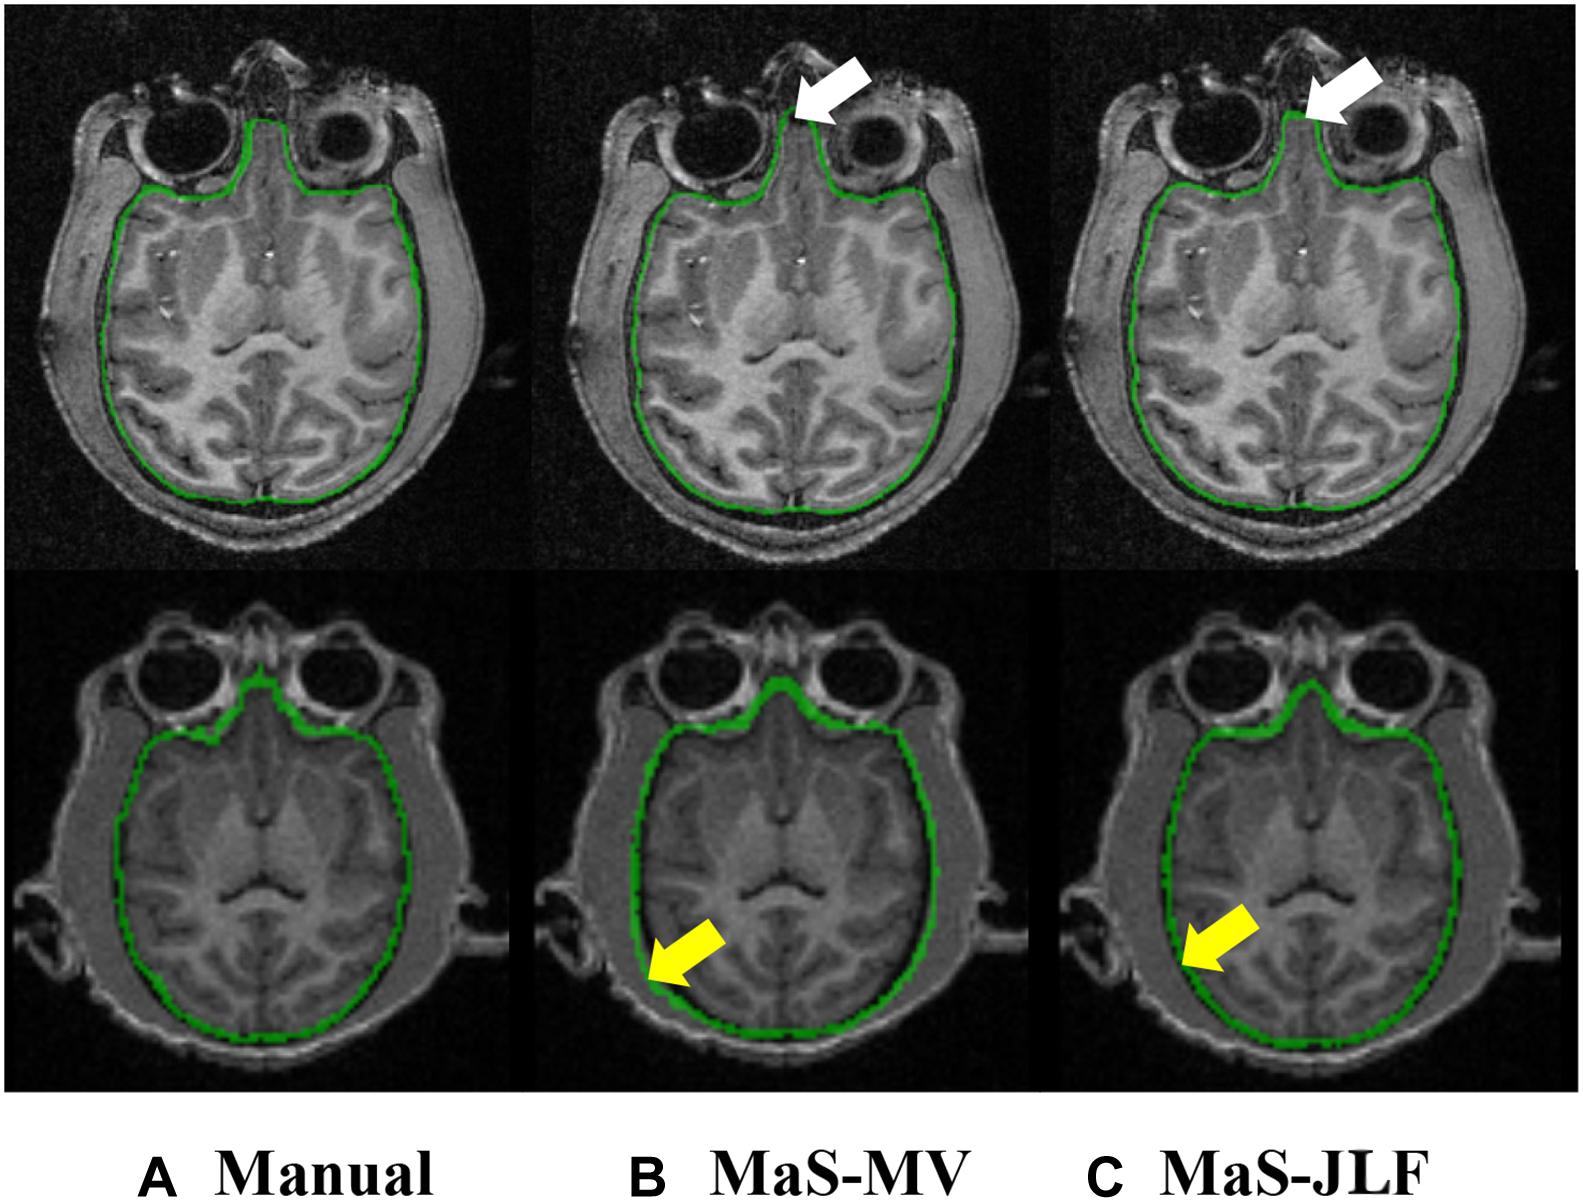
Figure 2. Example T1 images from D24 (top) and D30 (bottom), overlaid with manual segmentation, MaS-MV, and MaS-JLF from left to right. Arrows indicate differences in segmentations. MaS, multi-atlas segmentation; MV, majority voting; JLF, joint label fusion.
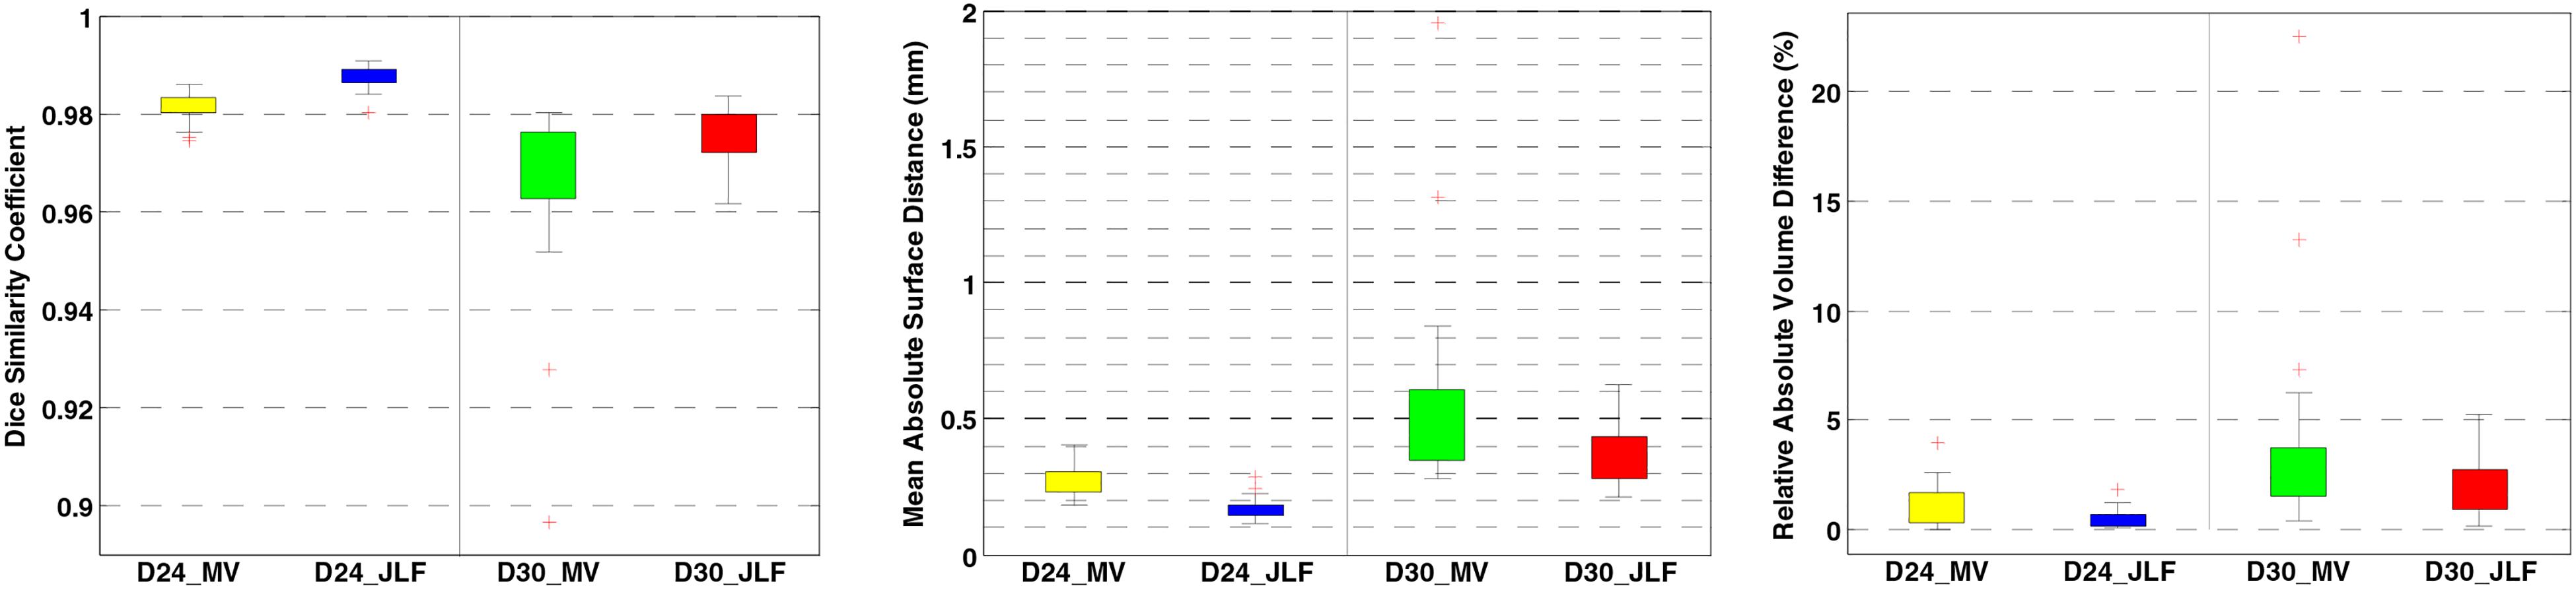
Figure 3. Brain extraction evaluation results on D24 and D30. From left to right: DSC, MASD, and RVD. DSC, dice similarity coefficient; MASD, mean absolute surface distance; RVD, relative volume difference; MV, majority voting; JLF, joint label fusion.
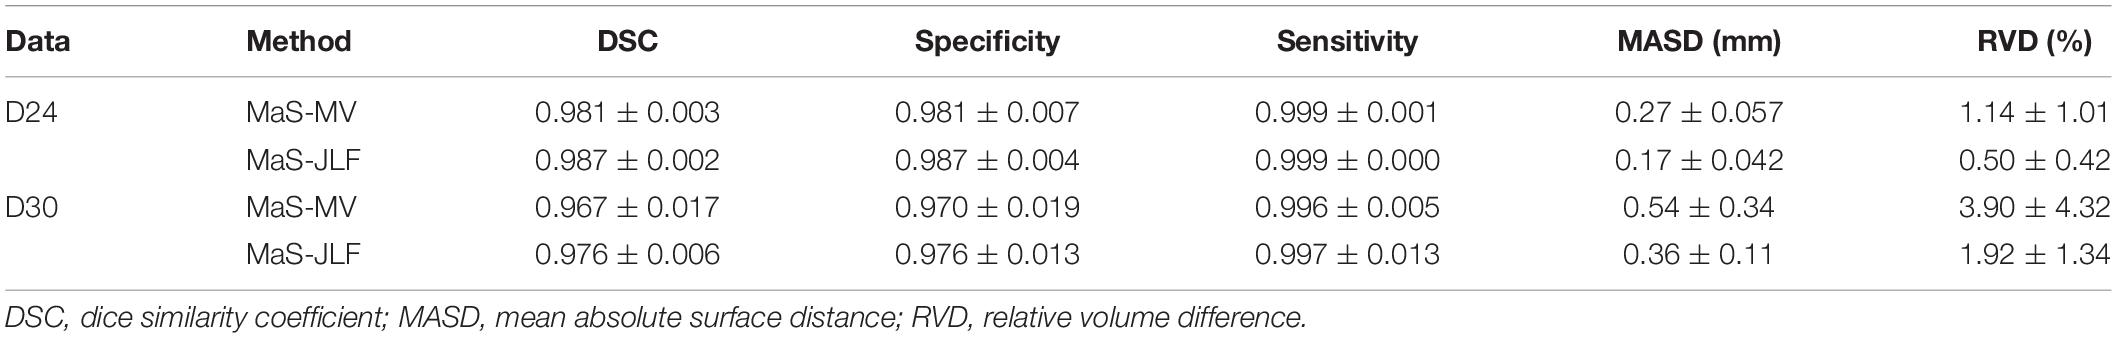
Table 1. Quantitative evaluation of the tested methods on the two datasets.
Registration
Registration is a critical step in CBP for generating probability maps of parcellations. For each subject in a cohort, the skull-stripped structural and diffusion-weighted imaging (DWI) data are transformed to a standard template (e.g., INIA19 structure template) using linear and non-linear registration algorithm, to obtain the forward and inverse transformations. CBP starts with transforming a predefined ROI in the standard space, either extracted from an existing atlas or drawn manually, into a seed mask in the individual DWI space using the inverse transformation. After the seed mask is parcellated, the forward transformation is employed to transform the parcellation from the individual space to the standard template space. In MonkeyCBP toolbox, the image registration between the individual and the template space is performed using ANTs (see text footnote 1), owing to its superior performance (Nazib et al., 2018) in deformable registration evaluated on large-scale datasets (Avants et al., 2011). There are many strategies, ranging from linear algorithms to diffeomorphic algorithms, in ANTs that use different transformation models and similarity metrics and their combinations to improve the performance and alleviate over-fitting problems in various application scenarios. For example, symmetric diffeomorphic image registration of ANTs was proven to be effective for MRI registration with large deformation (Avants et al., 2008) and algorithm parameters, such as regularization terms, could be fine-tuned to prevent over-fitting. In addition, to quantitatively evaluate the registrations results, three different similarity measurements (mean square difference, cross-correlation, and mutual information) were used in MonkeyCBP. The similarity metrics between the registered image pairs were calculated, and if they were below a threshold determined on the basis of experience, the toolbox would issue a warning and request human inspection.
Probabilistic Tractography
Probabilistic diffusion tractography is implemented in FSL by taking repetitively samples many times from the distribution of voxel-wise streamlines to generate the connectivity probability. All streamlines are synchronously yield to the orientations sampled from the diffusion distributions produced by bedpostx tool, as expounded in Behrens et al. (2007). Subsequently, the connectivity profiles at whole-brain level for each voxel in the seed mask are generated in the form of image. For each single image, it represents a set of connectivity value between that voxel and all brain voxels, and per-connectivity value of the voxel represents the number of true streamlines that pass through that voxel. The connection probability between voxels is defined as the connectivity value divided by the total number of streamlines sampled from the seed voxel. In order to compensate for the deviation caused by distance from the seed mask, the connectivity distribution is corrected using the length of the pathways (Tomassini et al., 2007; Mars et al., 2011). A curvature threshold is used to exclude implausible pathways by limiting the angle between two steps (Thomas et al., 2014). Finally, a small threshold value is employed to discard the sample values with a small number of streamlines (Makuuchi et al., 2009; Sinke et al., 2018). By applying this fixed threshold, it enables the images not only to have fewer spurious connections but also to retain enough sensitivity to the true connections (Heiervang et al., 2006; Johansen-Berg et al., 2007). For monkey data, compared with the parameter settings from previous process from ATPP in this step (Li et al., 2017), MonkeyCBP re-recommended new parameter values (e.g., number of samples - default = 10,000; Steplength in mm - default = 0.2) (Thomas et al., 2014; Folloni et al., 2019; Sani et al., 2019). To facilitate individual brain parcellation, the down-sampling rate of the connectivity profile in subsequent steps is also suggested to be modified (e.g., 3-mm isotropic voxels) (Johansen-Berg et al., 2004).
Individual Parcellation, Probabilistic Maps, and Maximum Probability Maps
Based on the native connectivity matrix, a cross-correlation matrix was calculated and fed into a spectral clustering algorithm for the parcellation of each individual brain region. The maximum number of clusters K was decided by the experimenter, and the clustering results can be generated as a range from 2 to K in MonkeyCBP at a draught, which is flexible to facilitate making decisions for final parcellation. Then the corresponding clusters of individual subjects are transformed into the template space using previous transformation profiles. Owing to the cluster label of clustering algorithms for each subject is random, we attempt to find a solution to make the parcellation results above comply with the most consistent labeling scheme. First, the labeling schemes of each individual are all incorporated into a thresholded group-level cross-correlation matrix. Each element in the matrix represents the connection similarity between any two voxels in ROI. Second, the spectral clustering algorithm is employed again for the similarity matrix to generated a group-level labeling result. Finally, the labeling result is propagated back to all the individual cluster using an assignment algorithm that ensures maximum spatial overlap (Munkres, 1957). Furthermore, in virtue of convergent evidences from previous studies (Brodmann, 1909; Petrides and Pandya, 2002; Chen et al., 2012; Bludau et al., 2014; Cui et al., 2016), it also supports the topological homology of bilateral brain. Scilicet, if the ROIs are the corresponding regions of bilateral hemispheres, the label consistency across hemispheres is guaranteed before the labeling scheme is propagated. Considering interindividual variability in the parcellation results of the ROI, MonkeyCBP calculated the maximum probability map (MPM), which quantitatively reflects which cluster a given voxel of the ROI most likely belonged, of each subregion across all the subjects to indicate the final results (Eickhoff et al., 2005, 2006; Caspers et al., 2008). Subsequently, a smoothing step (Wang et al., 2012) is applied to correct the noisy voxels whose labels are different from most labels of the six immediate neighbors.
Validity Indices
Determining the optimal number of clusters is always a fundamental and challenging issue in partitioning clustering. The optimizing for number of clusters is somehow subjective, and there is no precise answer. To refrain from arbitrarily choosing the number of the subdivisions, previous ATPP has provided many effective verification indicators on the basis of the data in standard space. Based on ATPP, MonkeyCBP not only retained the verification indices but also added the analysis of the original connectivity data in diffusion space. In MonkeyCBP, we introduce the PCA-based statistical models for determining k of the optimal solution, which further constrains the choice of clustering numbers and effectively complements the shortcomings of previous validation methods.
Consistency Criterion
The consistency criteria mainly consist of three aspects: (1) consistency across parcellations criterion, (2) consistency within parcellation criterion, and (3) consistency of topology criterion, which are consistent with those of a previous study (Li et al., 2017). In brief, the first criterion contains Dice coefficient (Dice, 1945), Cramer’s V (Cramér, 1946), normalized mutual information (Witten et al., 2017), and variation of information (Meila, 2003); the second criterion contains averaged silhouette value (Rousseeuw, 1987) and continuity index (Li et al., 2017; Wang et al., 2018); the third criterion contains consistency of topology criterion, hierarchical index (Kahnt et al., 2012), and topological distance index (Tungaraza et al., 2015); and the detailed descriptions are in keeping with ATPP.
Principal Component Analysis
PCA, as one of the simplest and robust ways to analyze multidimensional data, is a powerful statistical framework for the analysis of tractography-based parcellation (Thiebaut de Schotten et al., 2014; Cerliani et al., 2017) and has become increasingly popular recently in different studies (Markiewicz et al., 2011; Craddock et al., 2012; Leonardi et al., 2013; Tian et al., 2013; Nayal et al., 2014; Smith et al., 2018). Based on the theory of DWI and tractography techniques, the whole-brain connectivity of each voxel is deemed as multivariate dataset in the process of individual brain parcellation. Generally, this method allows identifying k components on the basis of k initial attributes and further determines the number of the subregions without a priori. Referring to a large number of the previous studies (Kaiser, 1960; Cattell, 1966; Wold, 1978; Jolliffe, 1986; Ferré, 1995; Teipel et al., 2007; Brown, 2009; Thiebaut de Schotten et al., 2014; Ledoit and Wolf, 2015; Rea and Rea, 2016; Pasini, 2017), MonkeyCBP offers three criteria for estimating the number of clusters to select for each subject: (1) cumulative contribution, (2) eigenvalues, and (3) scree test. Statistical analysis was performed using MATLAB, and all of the connectivity matrices for each animal derived from the data of the probabilistic tractography were fed into PCA to calculate the above indicators. First, the cumulative contribution, which means cumulative proportion of the variation explained, is an indispensable benchmark to determine the principal components for its simplicity and effectiveness. As usual sort of standards, the threshold often varies between 70 and 90%, which depends on the context. The high threshold means loose selection of clustering number subsequently, which means more choice for the number of clusters. However, by investigating a large number of studies, the minimum threshold that was suggested should be greater than 70%. Second, only factors with eigenvalues greater than 1 are retained. Finally, under criteria 1 and 2, a scree test was performed for each subject with their eigenvalues to separate the principal from residual components (Cattell, 1966). A power curve was plotted by fitting the data derived from the probabilistic tractography, and the inflexion point was extracted for each subject as the number of principal components using a homemade routine written in MATLAB R2017. Then all the subjects were averaged to obtain a mean value, and a fixed clustering number or very limited integer values within a narrow range were estimated as a guide to group together ROIs for the bilateral hemispheres.
Determination of the Optimal K Solution
A key step in the MonkeyCBP pipeline is to identify the optimal number of clusters k. Data clustering have been intensively developing for last decades; however, it still is a long-standing ill-posed problem intrinsically where the goal is to partition the data into some unknown number of clusters on the basis of inherent information alone (Jain, 2010). It is very difficult to select an intrinsic number of clusters because of the data-driven nature of clustering, and there is no definitive answer to this question. In general, these methods for determining the optimal clustering number include direct methods that consist of optimizing a criterion, statistical testing methods that consist of comparing evidence against null hypothesis, and decisions based on investigators, that is, cluster validity criteria. ATPP provides a variety of effective indicators to facilitate user selection. There is no doubt that these validity indices are very effective; in spite of this, previous methods primarily focused on the analysis of data in standard common space. It means that the input data are mainly the results of the registration of individual results into the standard space, whereas information contained in the data of individual diffusion space was not fully utilized, especially the most fundamental connectivity profiles. Although the method is proved to be effective in building the human brainnetome atlas, it requires high quality of original data itself and high sensitivity to the accuracy of registration process, transforming individual image to the common space. In this context, MonkeyCBP provides another statistical testing method based on PCA, exploiting the information in individual space. To a large extent, PCA could help users directly remove the unnecessary extremal points and in turn verify the previous indicator results offered by ATPP. Finally, on the basis of all the above indicators, users will be recommended a more detailed optimization scheme.
Implementation
Overview
Compared with ATPP, MonkeyCBP is mainly devoted to the parcellation of monkey brain and introduces the process of brain extraction. More specifically, the tractography-based monkey brain parcellation pipeline also consists of 12 steps, in which the methods of image registration and the final verification parts are modified respectively. Meanwhile, the brain extraction is added before the brain parcellation pipeline in MonkeyCBP. In addition, the users with different programming skills could choose the command line (CLI) version (Figure 4) and graphical user interface (GUI) (Figure 5) version to use according to their preferences.
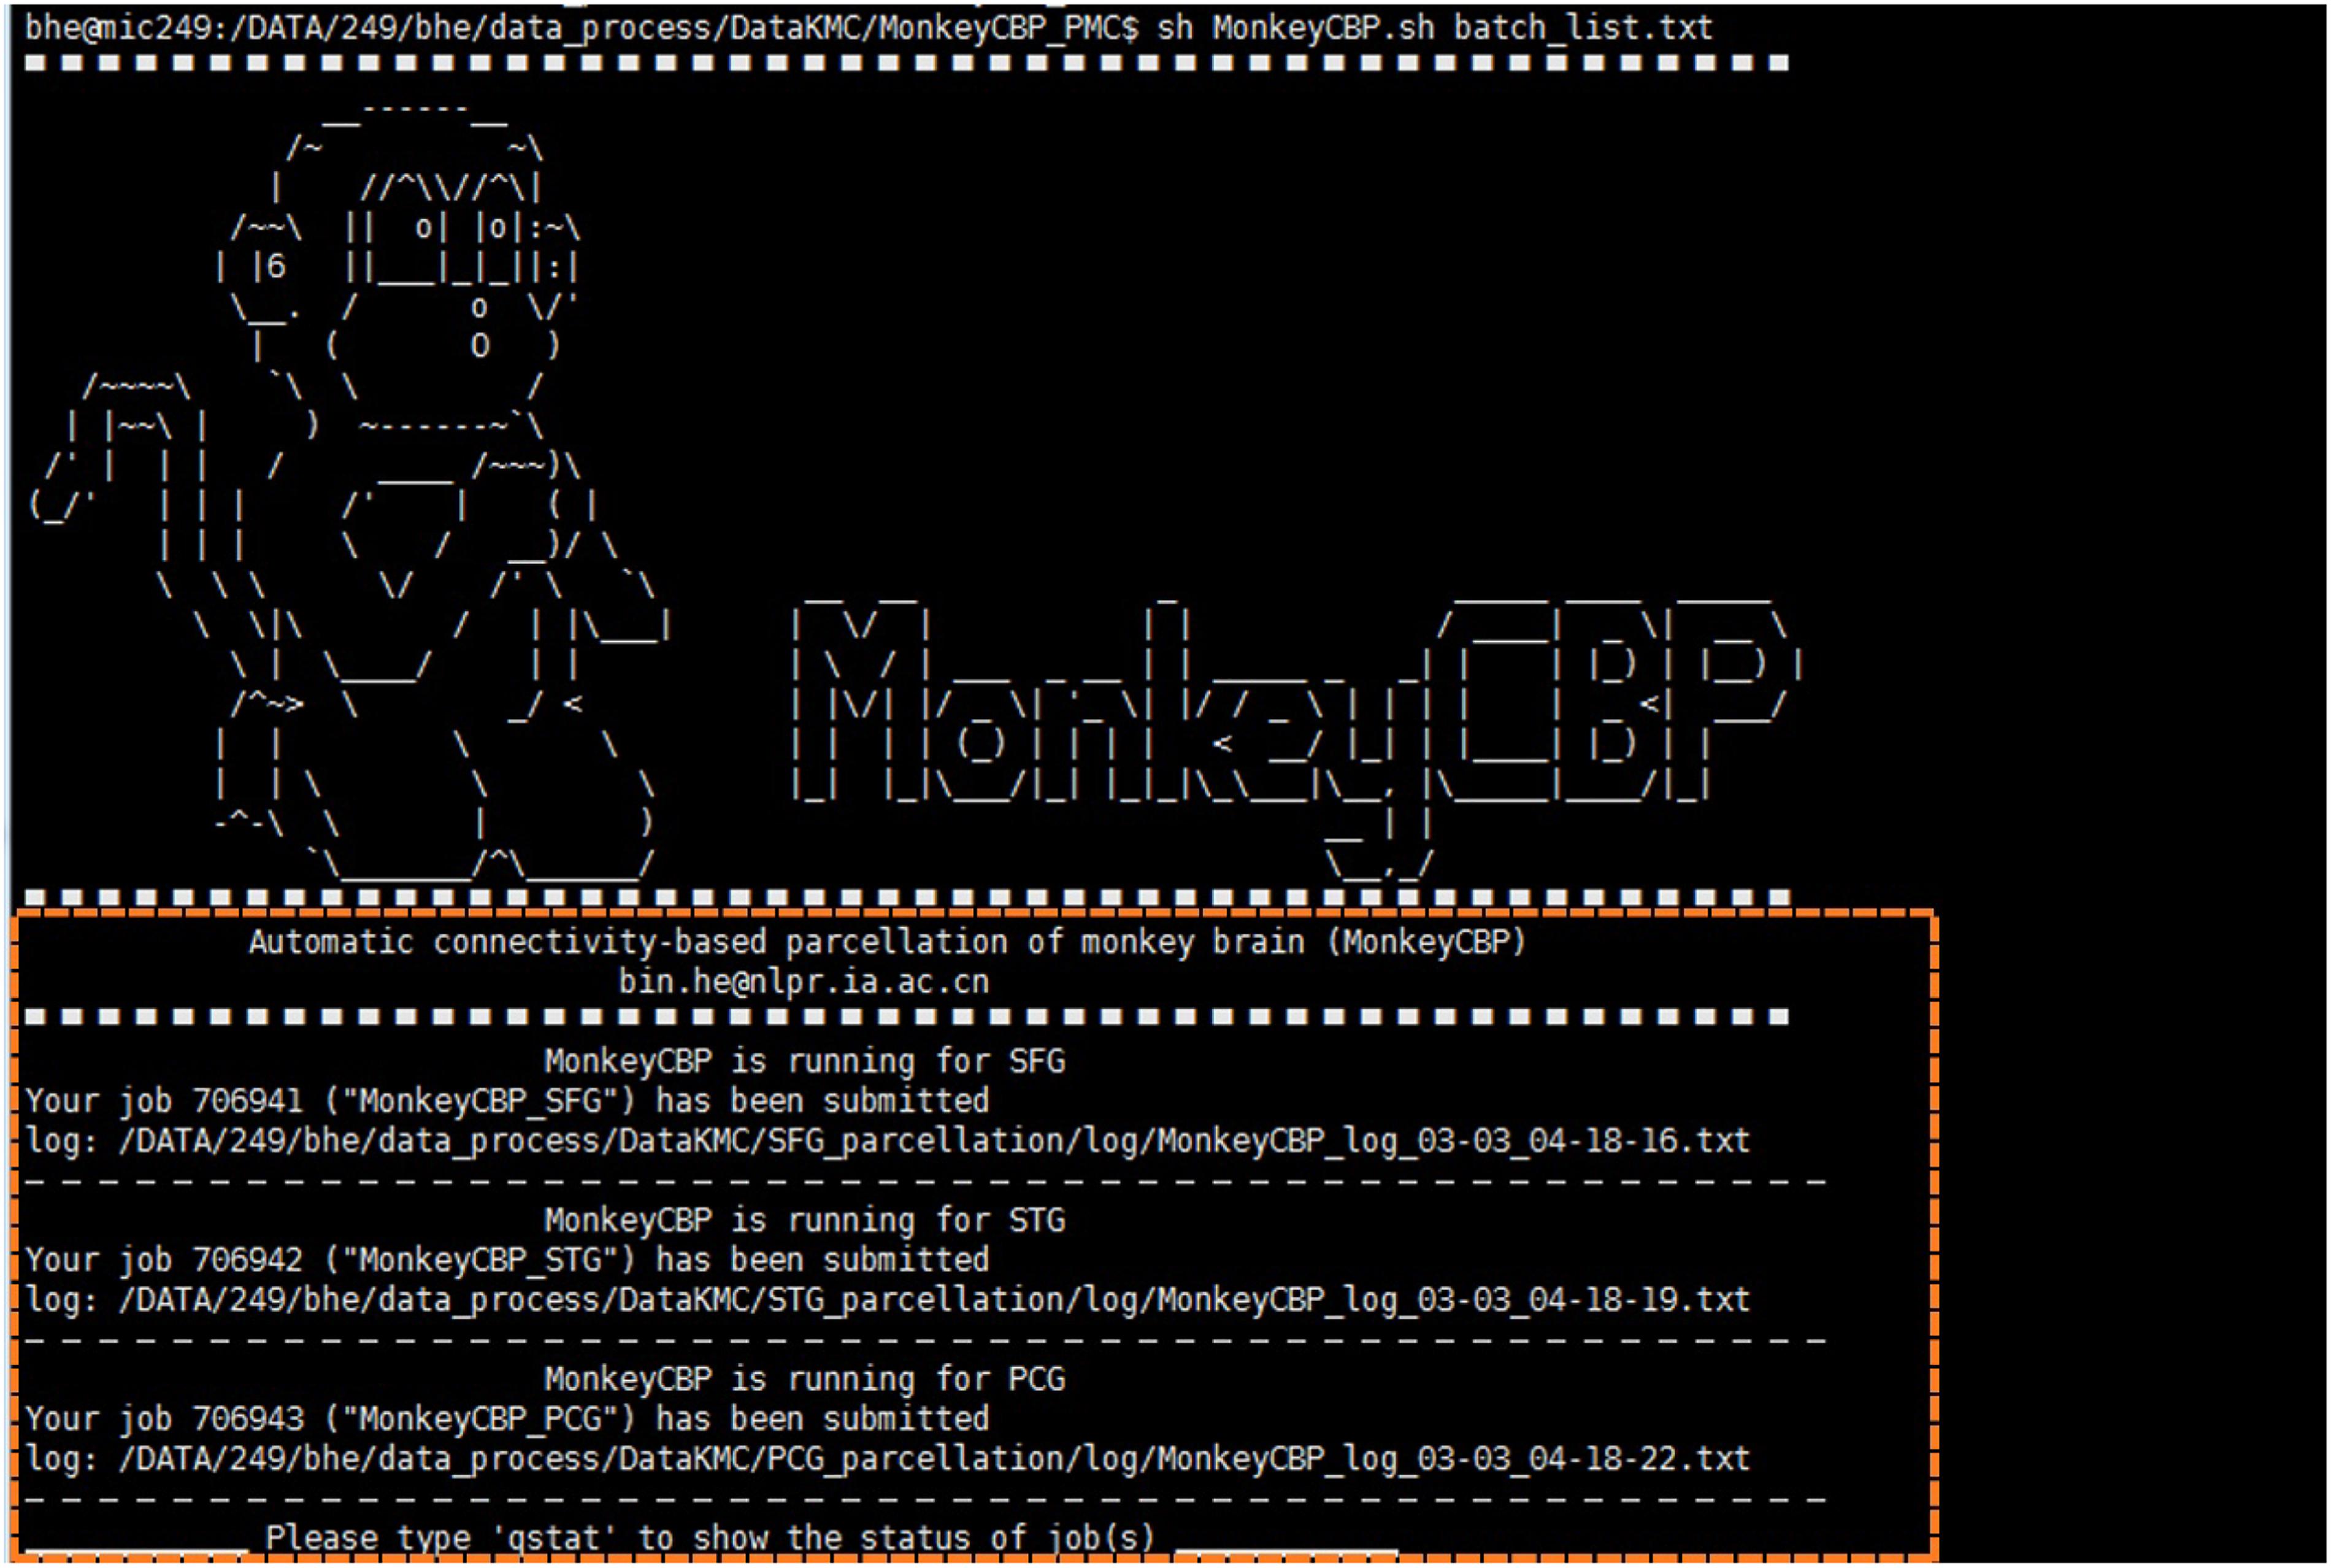
Figure 4. Command line (CLI) version of MonkeyCBP. CLI version is multi-region of interest (ROI) oriented; therefore, users could parcellate multiple brain regions synchronously. The diagram shows that the user submitted three concurrent tasks for the parcellations of superior frontal gyrus (SFG), superior temporal gyrus (STG), and posterior cingulate gyrus (PCG) at the same time.
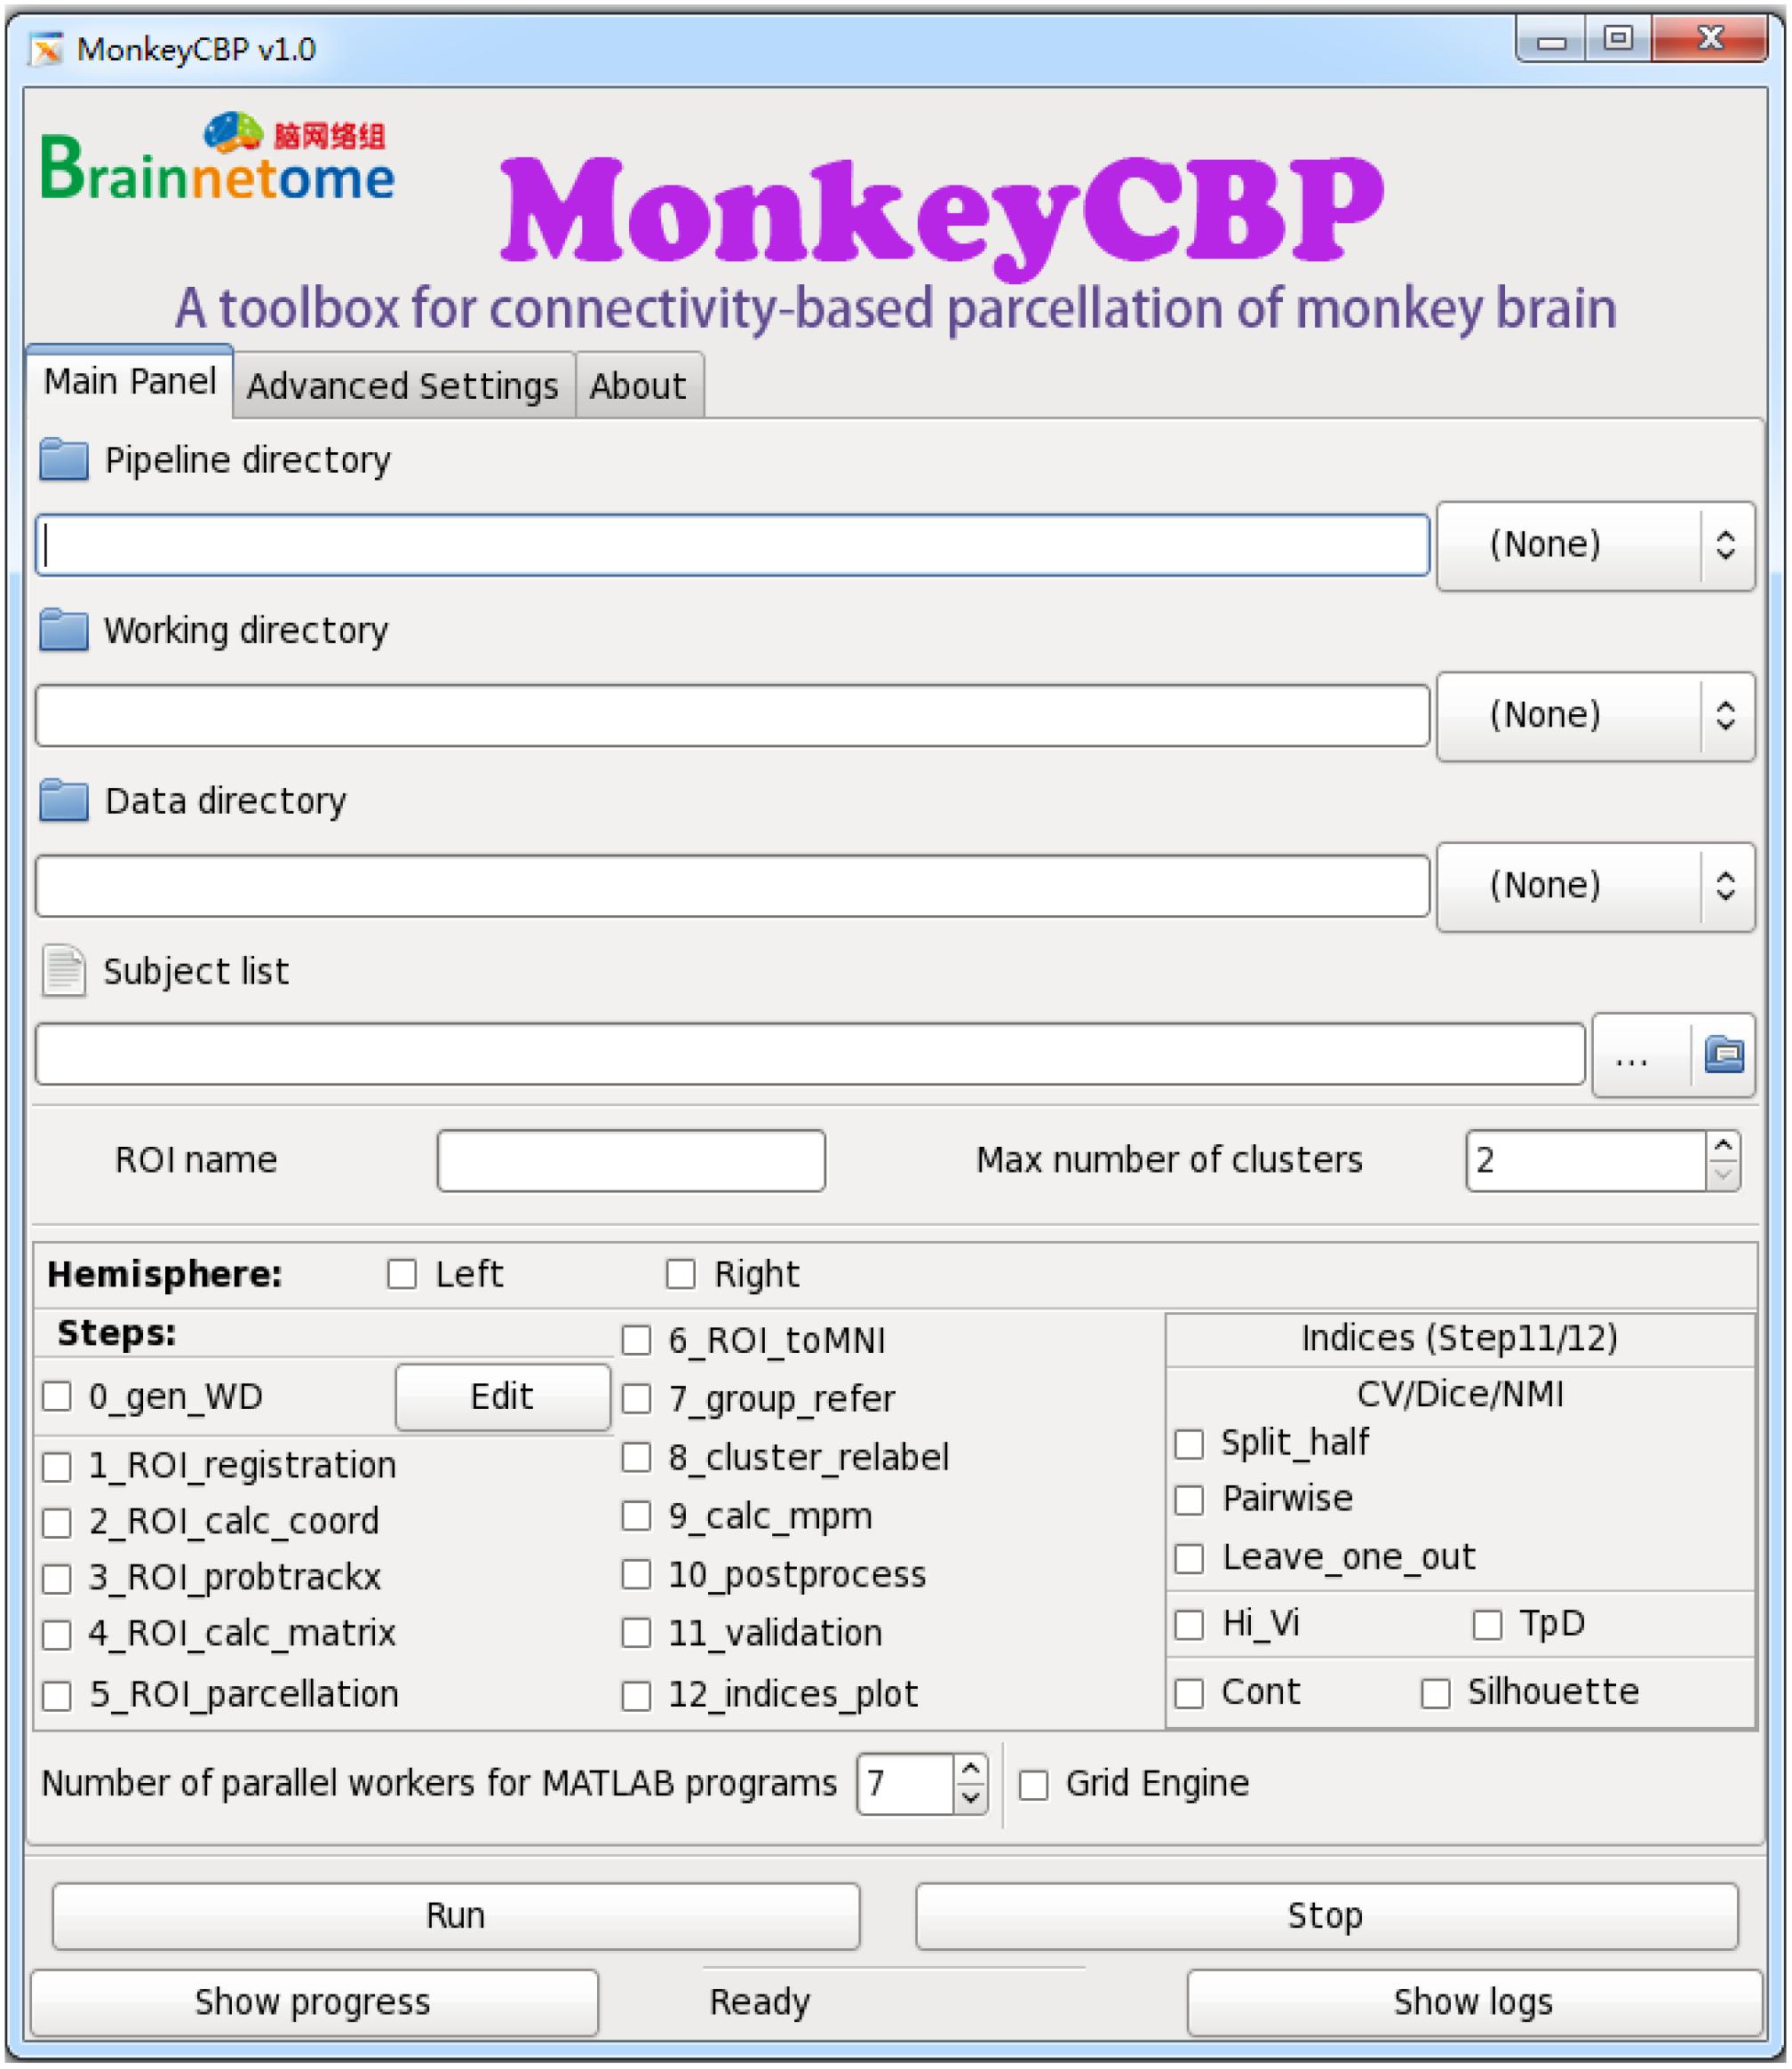
Figure 5. Graphical user interface (GUI) version of MonkeyCBP. The “Main Panel” menu including settings for input files and directories as well as configuration information. The “Advanced Settings” menu including advanced parameters for the command path and file as well as some specific parameters. The “About” menu displays the information relevant to the developer and license. At the bottom of the interface are several fixed buttons designed for users to control the start-up and shutdown of tasks, as well as to check the running progress and processing logs in real time. In addition, MonkeyCBP GUI version also supports parallel computing, but it is just single-ROI oriented, which is not like the CLI version that could parcellate multiple brain regions at the same time.
From the implementation perspective, the tractography-based parcellation of monkey is mainly split into the following steps:
(1) Preprossing: Brain extraction, eddy current correction, DTIFIT, Bedpostx.
(2) ROI registration: The registration is performed between the data of individual space and standard space, and then ROI of standard space is registered to individual diffusion space.
(3) Probabilistic tractography: For the registered ROI of each subject in diffusion space, a plain text that contains the xyz coordinates of all the voxels in the seed mask is obtained; subsequently, probabilistic tractography is performed.
(4) Individual parcellation: For each registered ROI, a cross-correlation matrix is calculated based on the results of probabilistic tractography, and then clustering algorithm is applied to parcellate the registered ROI.
(5) Group results: The parcellation results are inversely transformed from individual diffusion space to the standard template space. For each subdivision, probabilistic maps and the maximum probability map across subjects are generated.
(6) Validity indices: Various validity indices of the parcellation are computed and the graphs that depict the trends of these indices are generated.
Prerequisites
Before running MonkeyCBP, users must check the following prerequisites. (1) Input data. First, make sure the images are in correct orientation. If not, we recommend a freely available Medical Image Processing, Analysis, and Visualization (MIPAV)2 (McAuliffe et al., 2001) toolbox to reorient the image. Second, MonkeyCBP requires non-DWI (b0) and those images preprocessed by bedpost (part of the FSL software package) for all the subjects. (2) Environment and tools. Comparing the requirements of environment and software tools, MonkeyCBP is mostly similar to ATPP. Note that SPM has been replaced with ANTs for the image registration. Other major computational environment configurations are the same as ATPP, for both GUI and CLI versions of MonkeyCBP.
Directory Structure and File Naming Conventions
A simple, normative, and consistent directory structure enables pipeline software more flexible to plan, schedule, and check jobs, which will dramatically improve its work efficiency. MonkeyCBP uniformly creates the initialized working directory for the ROI of each subject that contains the following: (1) a template subdirectory including the files for registration and the predefined ROIs, (2) a log subdirectory covering the running logs of each step, and (3) subject_id subdirectories comprising the images of each subject (e.g., T1w/T2w image, b0 image, or FA image). After the software starts, a string of intermediate results and logs with specific and uniform names will be produced.
Modular and Hierarchical Structure of the Implementation
In order to improve the software easily and flexibly, the core algorithms of per process in MonkeyCBP are modular in design. In MonkeyCBP, the top-level script of CLI version, or callback functions of GUI version, is responsible for reading the configuration file and submitting jobs. The second-level script is applied to activate a series of predefined procedures and record running logs. The third-level scripts are used to perform specific jobs, employing either internal MATLAB functions or third-party programs.
Implementation Details
MonkeyCBP actualizes parallel computing within or across machines via SGE and MATLAB PCT, which ensured the efficiency of the software. In addition, users can freely choose between two software versions. First, MonkeyCBP CLI version comprises a standard set of hierarchical bash shell scripts that glue together the codes of MATLAB and/or third-party programs. A list file of TXT format defines a series of inherent information (data directory, list of subjects, working directory, ROI name, and maximum number of subregions) of one brain region in per row. The top script, which named MonkeyCBP.sh, submits jobs that each consists of a second-level script, pipeline.sh, and the information about ROI as well as the configuration parameter in config.sh, to opportune machines across the cluster. The third-level scripts are triggered to perform specific works by the second-level scripts that produce the processing logs for users to debug and examine the results. If the user’s hardware supports graphics processing unit (GPU) computing, we also provide an interface of GPU to speed up the data processing process. Second, the other version of MonkeyCBP with a GUI is convenient for users with few programming skills. Based on GTK-server, it is designed with three menus: (1) “Main Panel,” (2) “Advanced Settings,” and (3) “About.” The “Main Panel” menu includes settings for input files and directories as well as configuration information. The “Advanced Settings” menu includes advanced parameters for the command path and file as well as some specific parameters. The “About” menu displays the information relevant to the developer and license. At the bottom of the interface are several fixed buttons designed for users to control the start-up and shutdown of tasks, as well as check the running progress and processing logs in real time. In addition, MonkeyCBP GUI version also supports parallel computing, but it is just single-ROI oriented, which is not like the CLI version that could parcellate multiple brain regions at the same time.
Results and Discussion
In the current study, we developed a toolbox named MonkeyCBP for CBP of monkey brain with automatic processing and large-scale parallel computing. MonkeyCBP provides two skull-stripping methods dedicated for rhesus monkey. The CLI version implements simultaneous parcellation of multiple brain regions, and the user-friendly interactive GUI version offers the parcellation for a single brain region.
Performance Test: We tested MonkeyCBP on two batches of data in a local 12-node high-performance computing cluster, including six nodes that have 16 cores of Intel Xeon E5-2630@2.3GHz and 128GB memory and another six nodes that have 12 cores of Intel Xeon E5-2630@2.3GHz and 128GB memory. One dataset consists of eight monkeys (Macaca mulatta, two male and six female, 4–23 years old, weighted at 2.9–4.2 kg, and DWI with 0.6-mm isotropic voxels) obtained from Kunming Institute of Zoology, Chinese Academy of Sciences. All animals of Kunming were conducted according to policies set forth by the National Institutes of Health Guide for the Care and Use of Laboratory Animals and conformed to the protocol of the animal care and use committee of the Institute of Automation, CAS. To test the toolbox, we used the CLI and GUI version of MonkeyCBP to parcellate the right PCG. The parcellation results, including optimal number of subdivisions and stability indices, are shown in Figure 6 Then a high degree of consistency among the indicators can be observed. In addition, combined with other different indices, we parcellated the bilateral FP, and the simplified results are shown in Figures 7, 8. Wang et al. (2018) parcellated the cingulate cortex into eight anatomical areas and the frontal cortex into 14 anatomical areas. Further, MonkeyCBP found more subregions in different cortical areas, even small ones (e.g., the FP cortex). The parcellation results showed that the right PCG could be subdivided into four subregions and that the FP of each hemisphere could be subdivided into eight subregions, which is a finer parcellation result. It is worth mentioning that we have described the parcellation details of the FP in another paper that is under review. The time consumed of the entire process was approximately 5 and 3 h. Another dataset consists of five monkeys (M. mulatta) in vivo obtained from an open resource (Milham et al., 2018). To validate the stability of the parcellation scheme, we parcellated the left PCG on the basis of the two datasets. We calculated the number of all non-zero voxels in each postprocessed MPM, the number of overlapping voxels for the postprocessed MPM, and the number of overlapping voxels of each subregion. The overall proportion of overlapping voxels is 78.24%. Additionally, on each dataset, we calculated the proportion of overlapping voxels of each subregion; see Table 2 for more details. The parcellation results and the overlapping areas were transformed and combined into F99 brain space (Van Essen, 2002) using the Caret software (Van Essen et al., 2001) for visual inspection (Figure 9). Topological similarities in the parcellations between the two datasets can be observed.
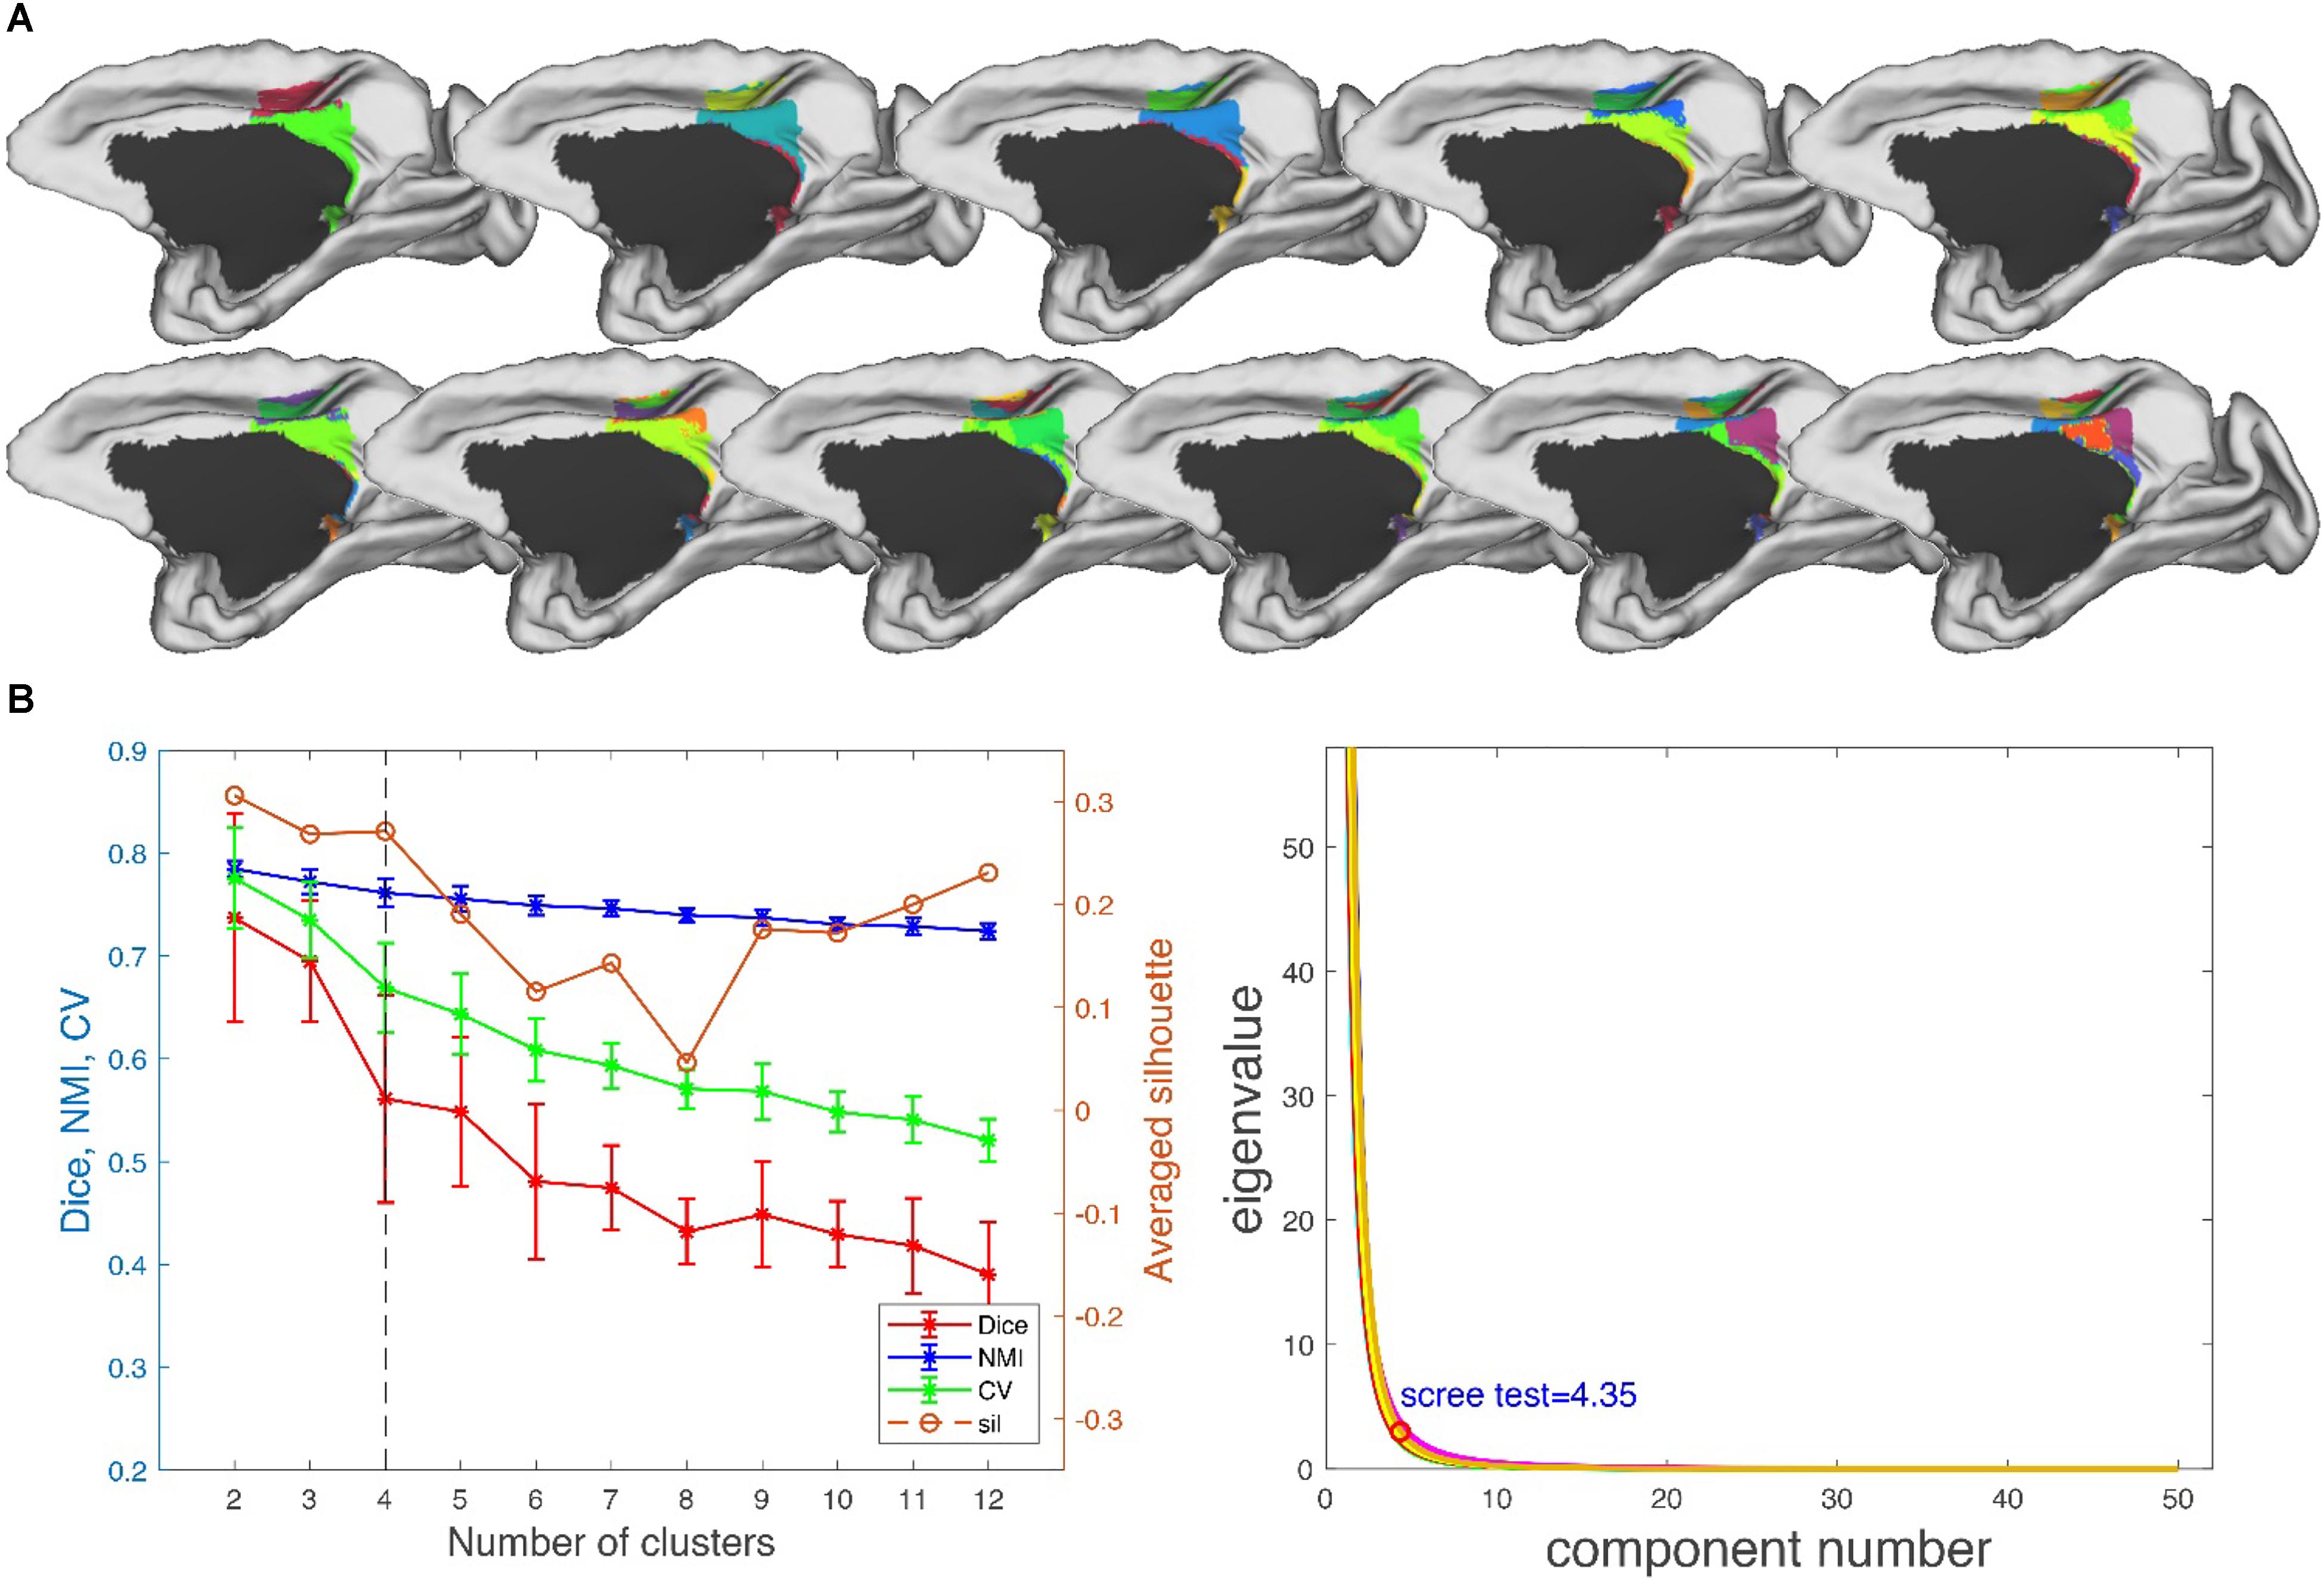
Figure 6. Parcellation results of right posterior cingulate gyrus (PCG.R). (A) The maximum probability maps (MPMs) of PCG. R with 2–12 clusters. Note that there is no consistency among subareas with the same color in different results. (B) Validity indices of the parcellation results for PCG. R using leave-one-out resampling technique with 200 repetitions (left) and principal component analysis (PCA) (right). Thereinto, the relative higher value of Dice, NMI, CV, and sil hint the more consistent result across the whole parcellations. The error bars represent standard deviation. The optimal result of 4 clusters seems the most reasonable according to these indices, which is consistent with the result of PCA.
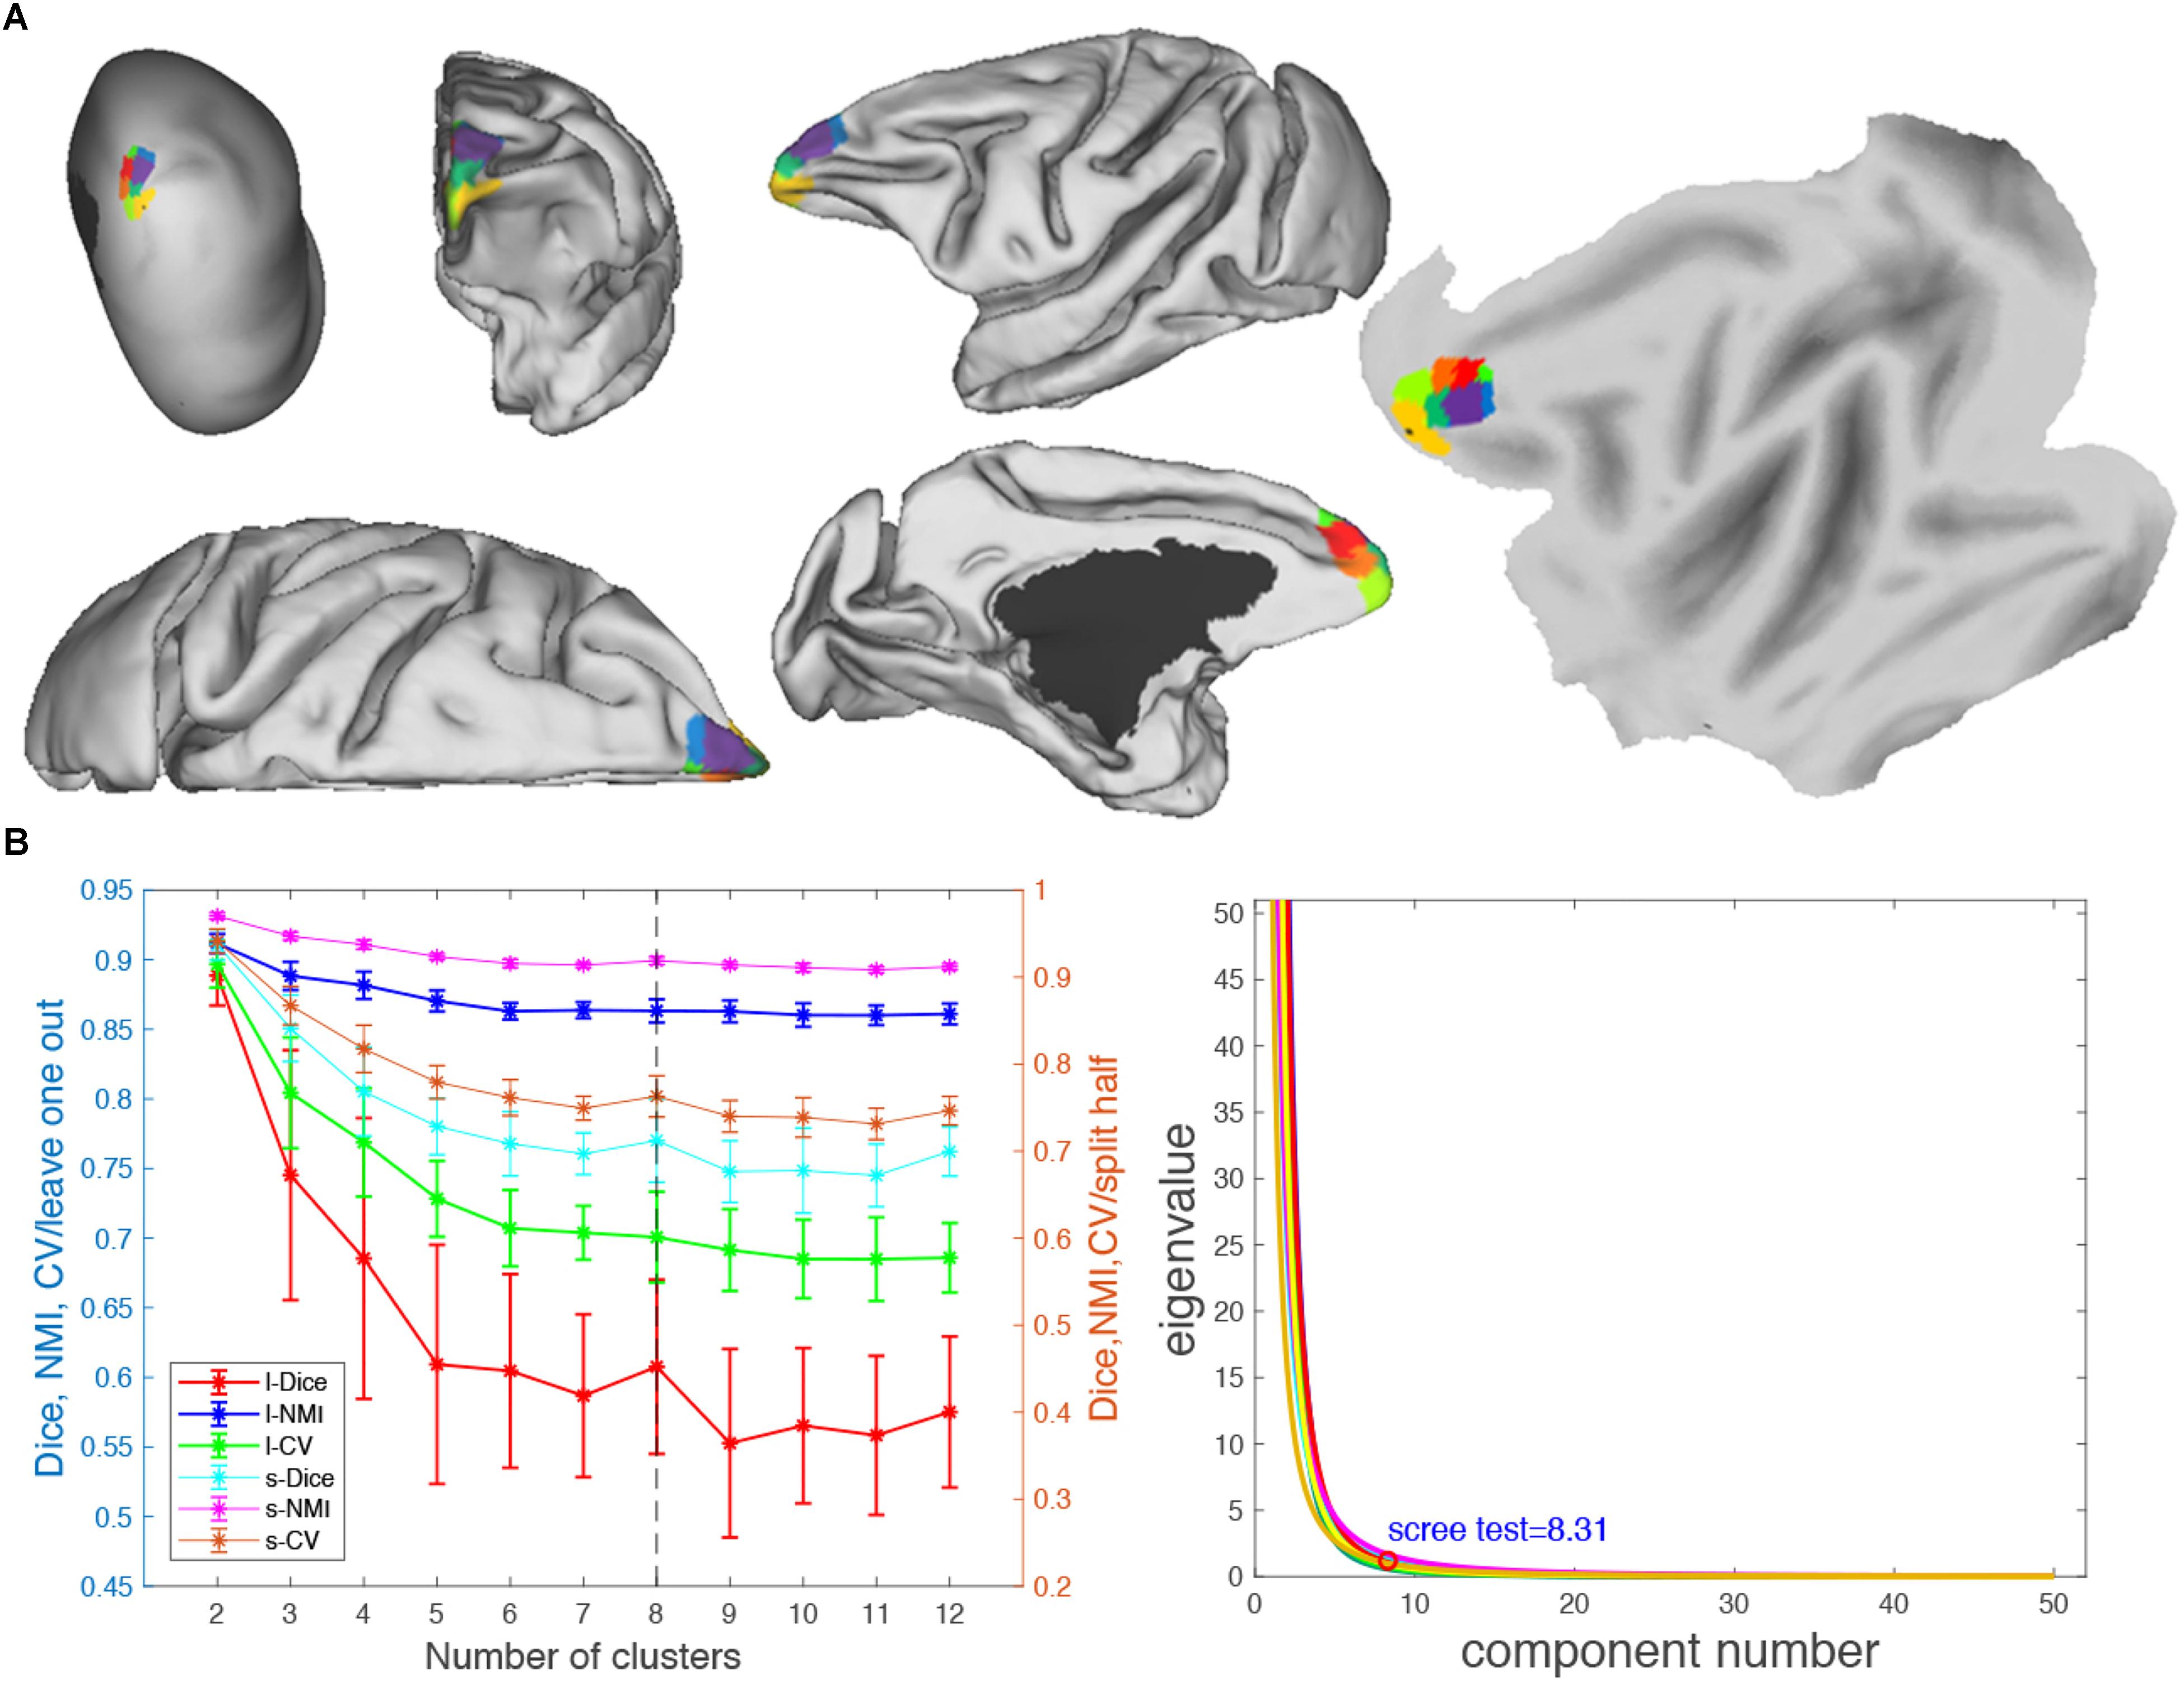
Figure 7. Parcellation results of left frontal pole (FP.L). (A) The MPMs of FP. L with 8 clusters in flat, fiducial (lateral, medial, anterior, superior) surface, very inflated (dorsal-lateral) view. (B) Validity indices of the parcellation results for FP.L. Thereinto, the results of Dice, NMI, and cross-validation (CV) using leave-one-out (l-Dice, l-NMI, and l-CV) and spilt-half (s-Dice, s-NMI, and s-V) resampling technique (left), and PCA (right) suggest that the optimal result of eight clusters seems the most reasonable. The error bars represent standard deviation.
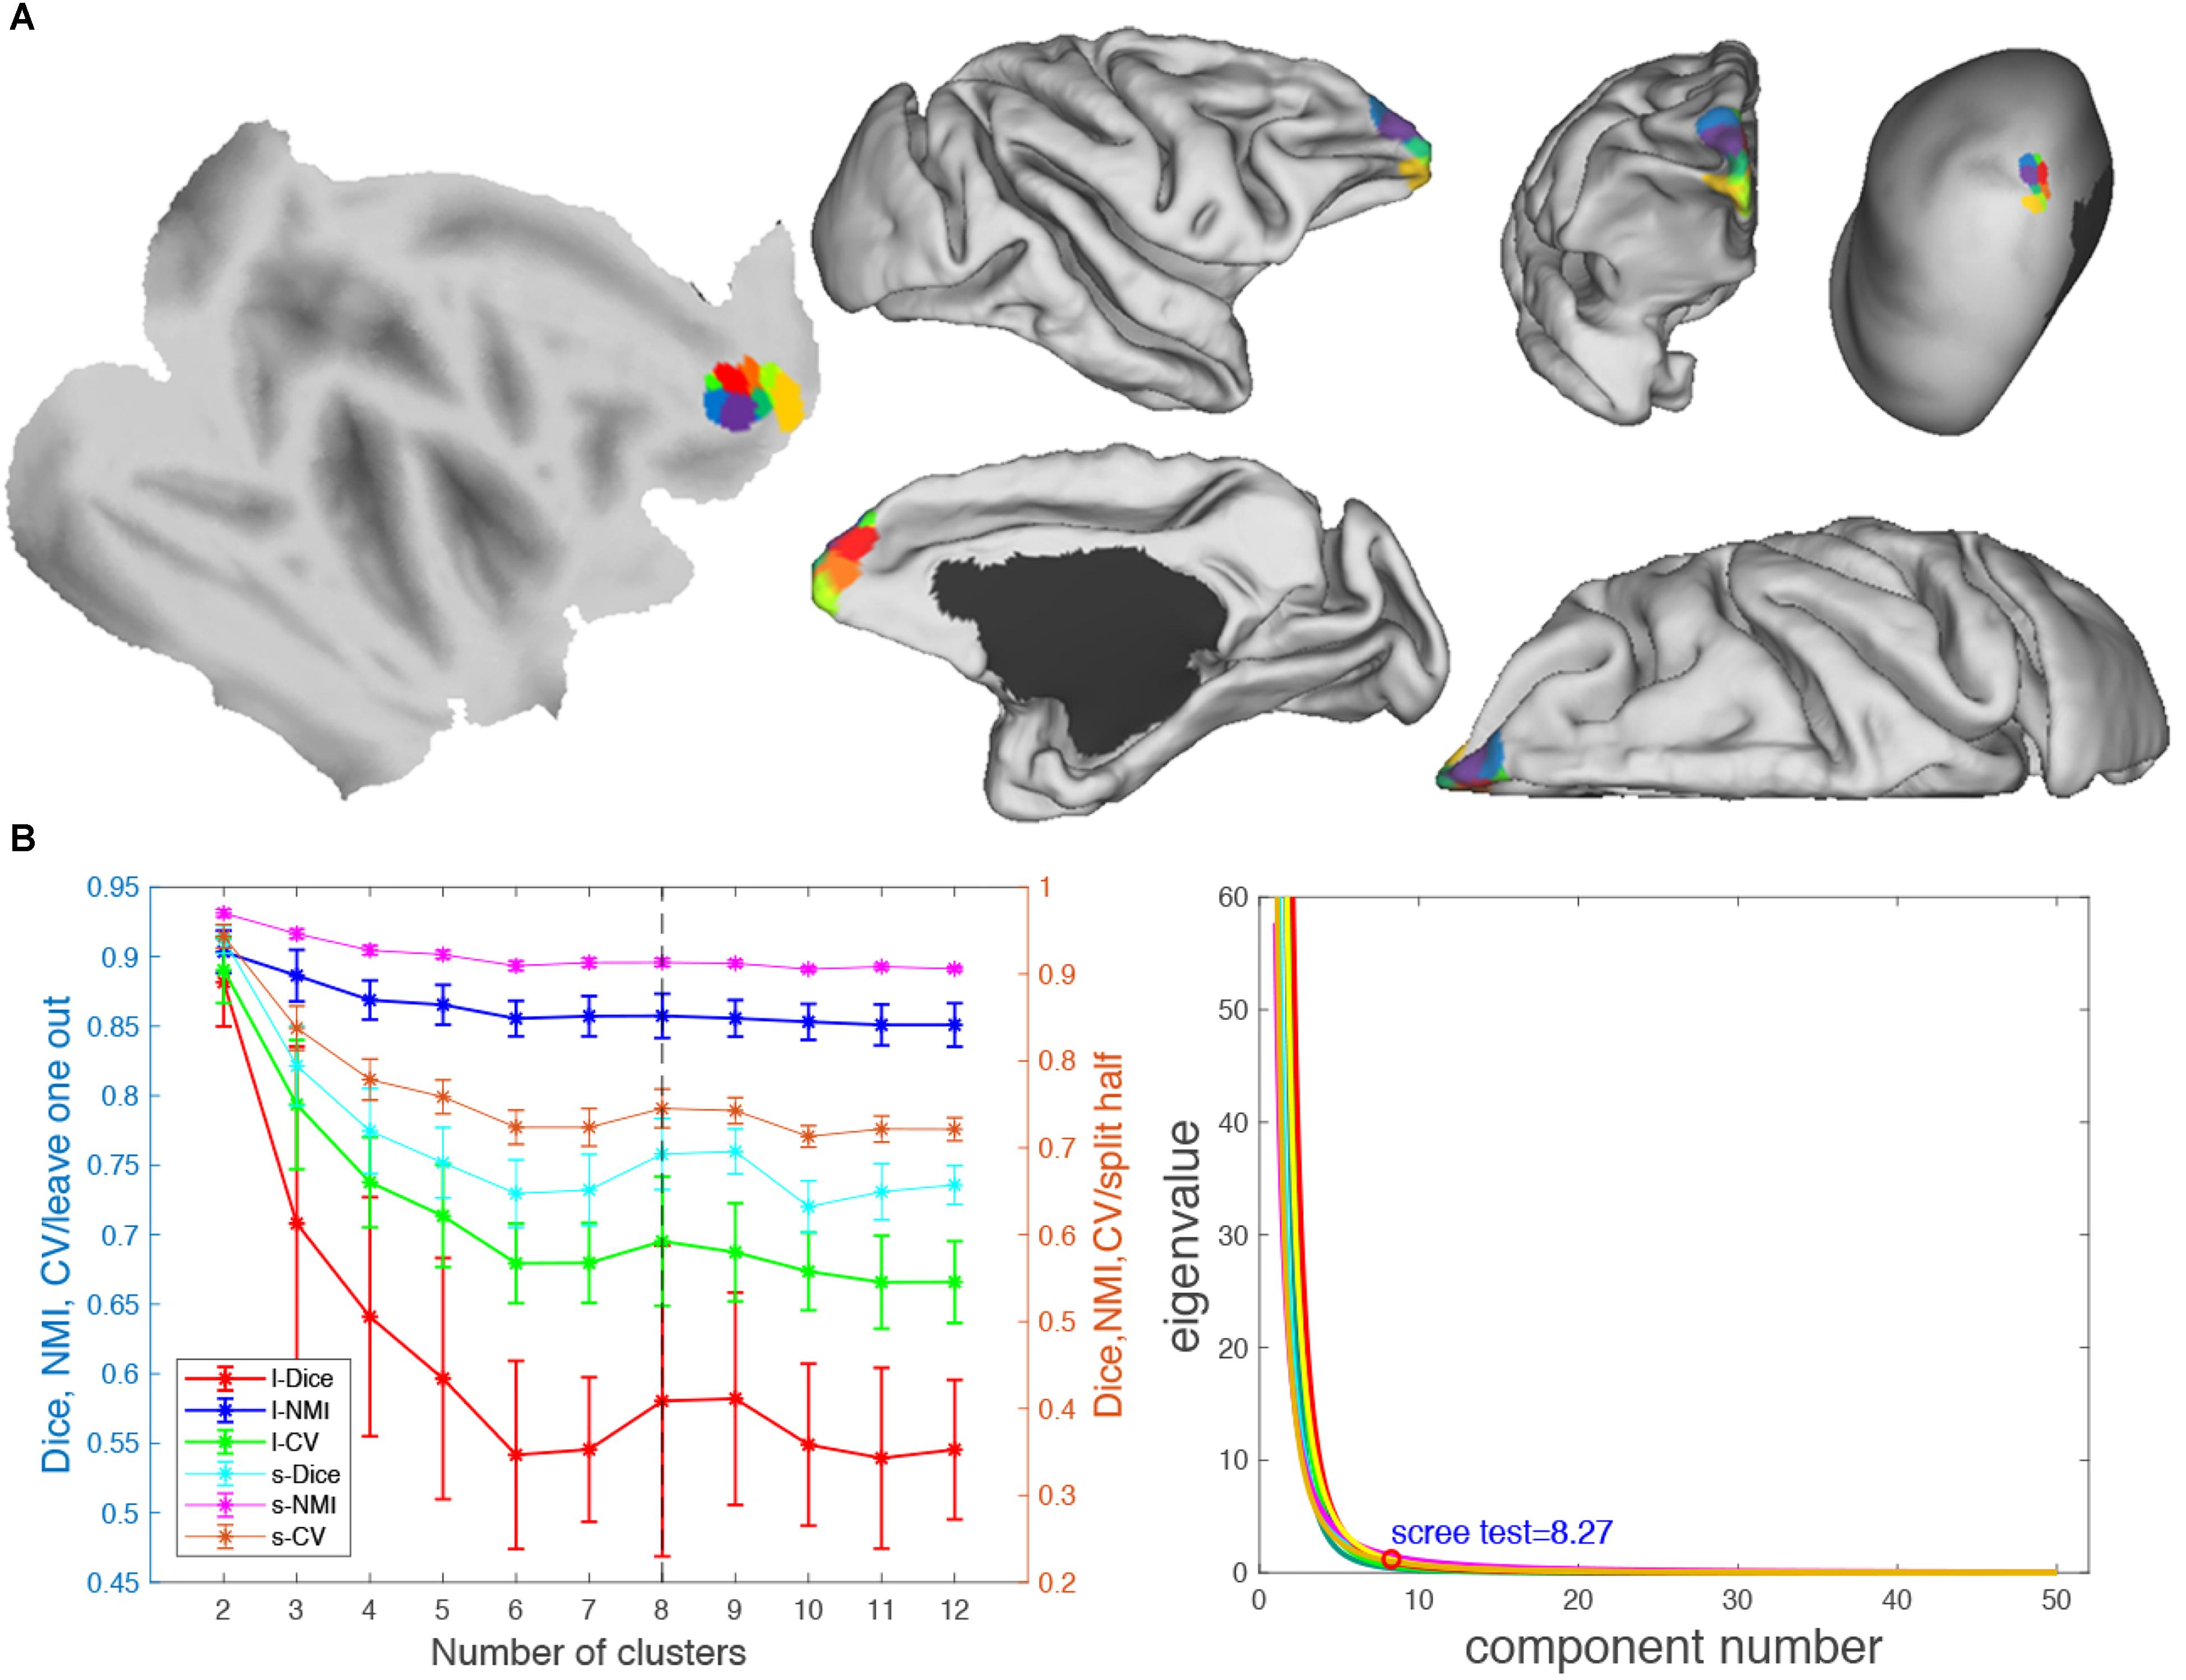
Figure 8. Parcellation results of right frontal pole (FP.R). (A) The maximum probability maps (MPMs) of FP. R with eight clusters in flat, fiducial (lateral, medial, anterior, and superior) surface, with very inflated (dorsal-lateral) view. (B) Validity indices of the parcellation results for FP.R. Thereinto, the results of Dice, NMI, and CV using leave-one-out (l-Dice, l-NMI, and l-CV) and spilt-half (s-Dice, s-NMI, and s-V) resampling technique (left) and principal component analysis (PCA) (right) suggest that the optimal result of right clusters seems the most reasonable. The error bars represent standard deviation.
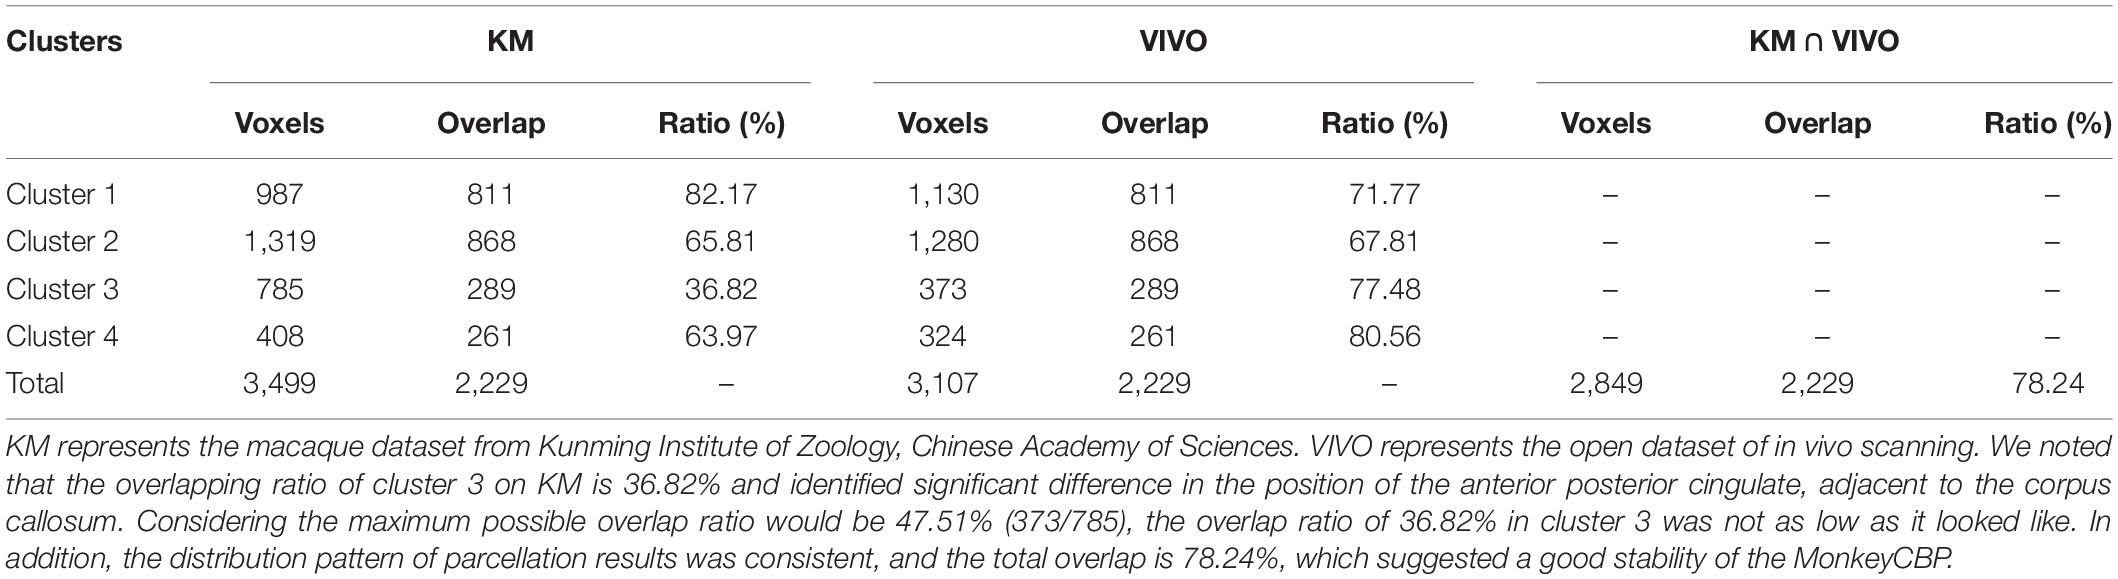
Table 2. The overlapping ratios of the parcellations of the two datasets.
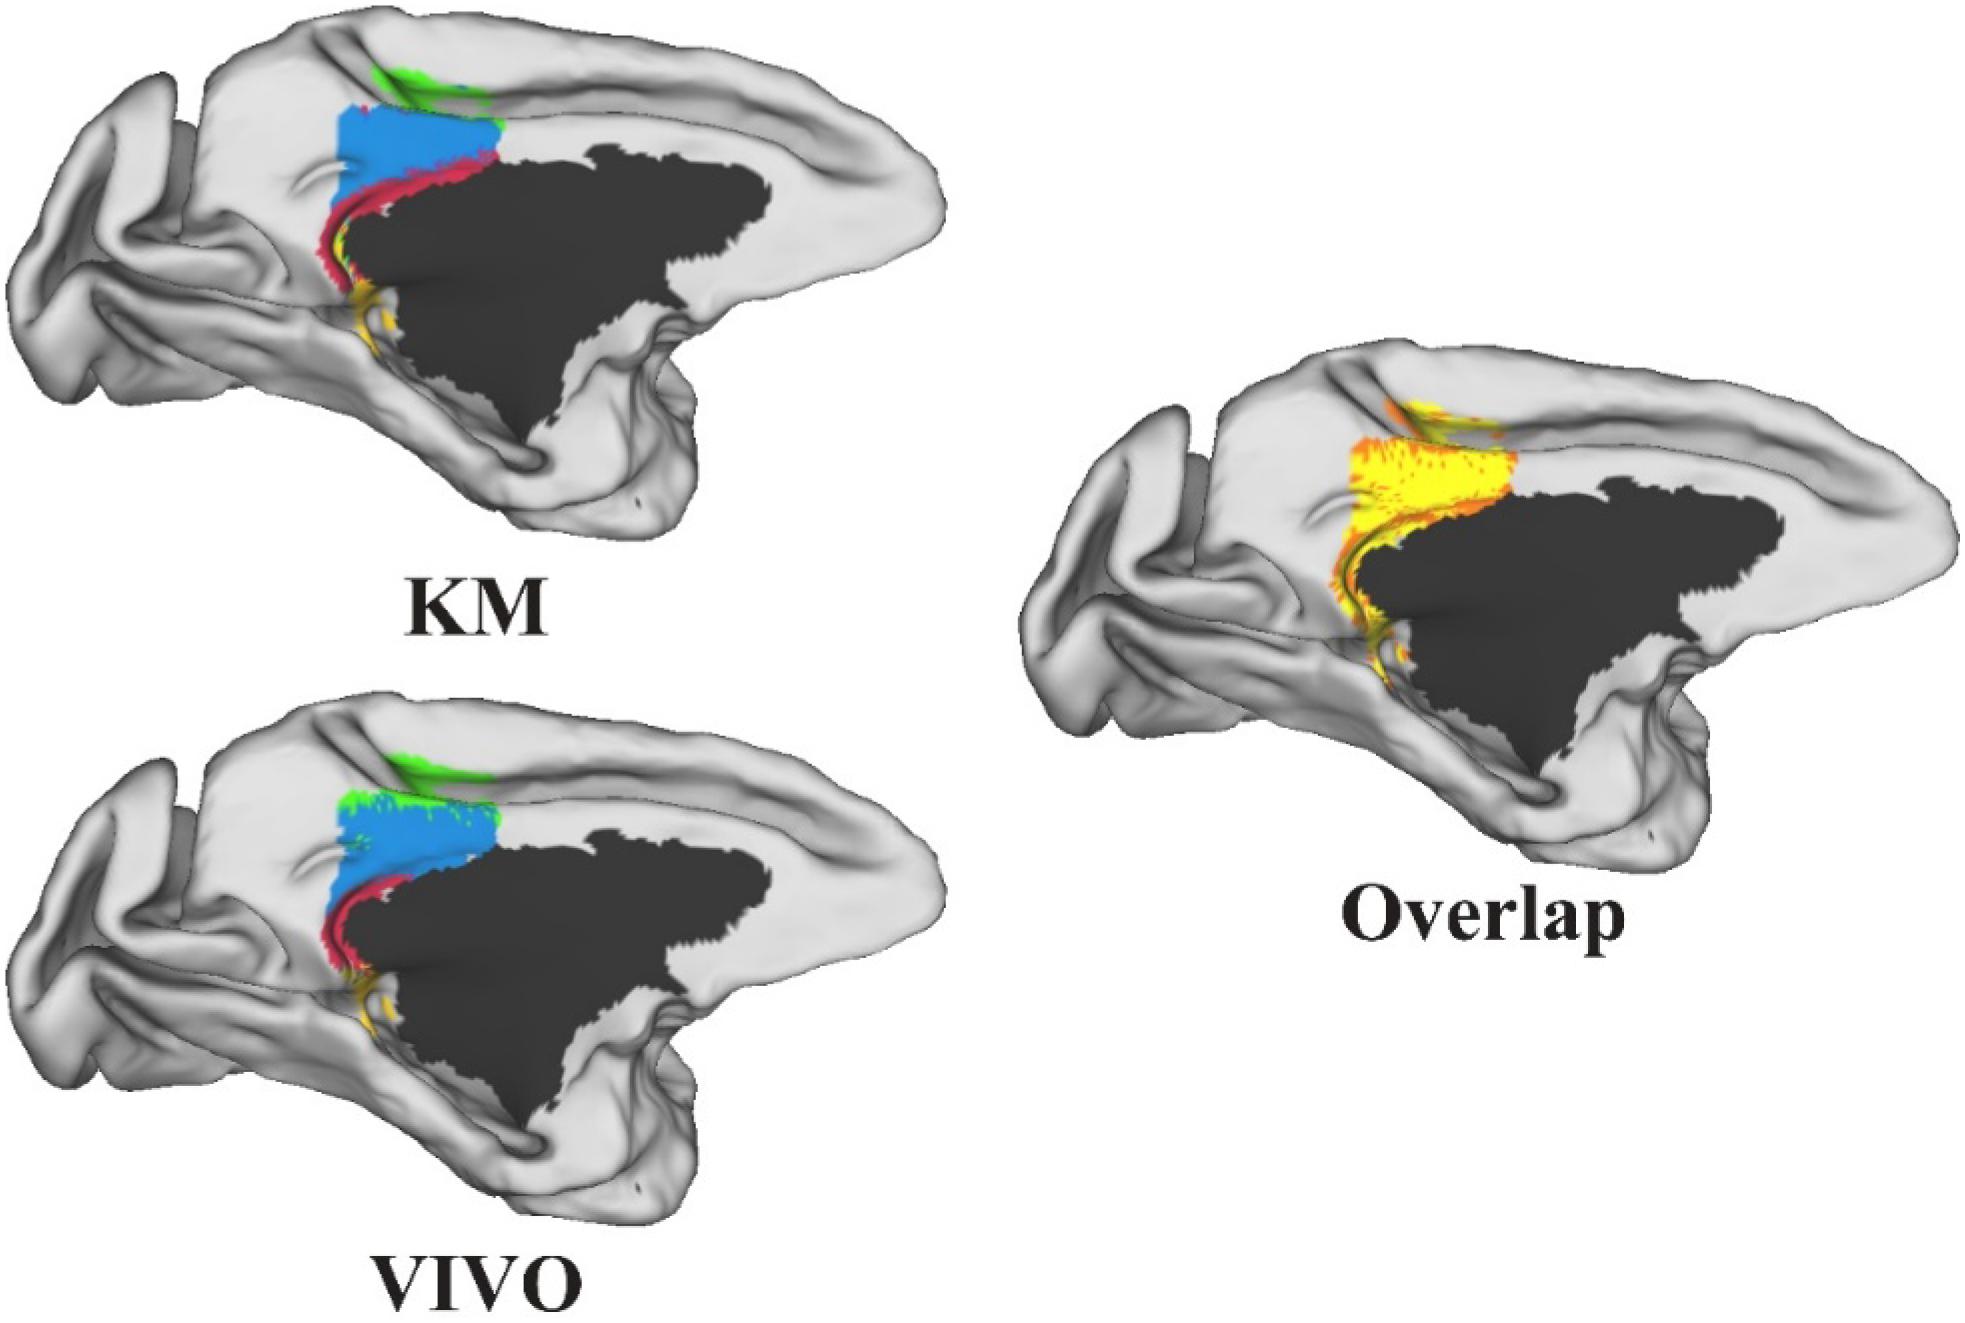
Figure 9. The parcellation results of the left posterior cingulate gyrus on the two datasets and the overlap between the two parcellation results. All the results were transformed and combined into F99 brain space. The yellow-shaded areas represent areas of overlap, and the orange-shaded areas represent the difference.
To our best knowledge, this is the first toolbox dedicated for rhesus monkey brain parcellation based on connectivity profiles. On the basis of diffusion MRI data of macaque monkey in vivo, Wang et al. (2018) subdivided the monkey cortex into 80 subregions in each brain hemisphere using CBP. The registration was implemented using the FLIRT tool, and the cluster numbers were determined by continuity index. Wang et al. parcellated the frontal cortex into 14 subregions, the somatosensory cortex into 9 subregions, the parietal cortex into 13 subregions, the temporal cortex into 16 subregions, the occipital cortex into 16 subregions, and the limbic system into 12 subregions. In comparison, the two regions we have parcellated using MonkeyCBP were subdivided into finer regions, that is, the PCG and bilateral FP; we provide a segmentation result with more subdivisions. Although Wang et al. (2018) constructed the macaque cortex atlas using CBP, the pipeline was not published, and the automation performance of the process was not enough.
This toolbox inherited the advantages of ATPP, compared with other existing parcellation tools, including massive parallel computing within and across machines for high-throughput processing of high-resolution multimodal data, modularized software structure for easy extension and rapid development, and detailed intermediate results and abundant log information generated for quality control and reproducibility. MonkeyCBP follows open science protocol and is publicly accessible in Neuroimaging Informatics Tools and Resources Clearinghouse3 (NITRC)4; the Digital Object Identifiers (DOIs)4 (10.25790/bml0cm.56) are associated with MonkeyCBP. Its source codes are hosted in Github,5,6 under the GNU generic purpose license version 37 (GPLv3), and are available for download and fork. Besides, to promote Resource Identification Initiative (Bandrowski et al., 2016), which aims to promote research resource identification, discovery, and reuse, Research Resource Identifier (RRID) was curated (MonkeyCBP, RRID:SCR_017640). by SciCrunch Resource Registry8 to avoid ambiguities on the tool name in addition to its version (Nichols et al., 2017).
Apart from the features mentioned above, MonkeyCBP includes a robust skull-stripping module for rhesus monkey. The deformable registration is performed using ANTs, instead of SPM, resulting in better registration. A PCA-based parcellation verification index is also included to exploit information from individual image space for accurate determination of number of parcels. The highly automated process and high-throughput performance supported by GPU option make the toolbox ready to be used by a wider research community.
Data Availability Statement
The datasets presented in this article are not readily available because the data is still being used for scientific research. Requests to access the datasets should be directed to jiangtz@nlpr.ia.ac.cn.
Author Contributions
All authors were responsible for design and prototyping of the pipeline, and reviewed and approved the final version of the manuscript. BH, ZY, and BG were responsible for the implementation of the pipeline. BH did the test experiment of the pipeline. ZY and BH drafted the manuscript.
Funding
This work was partially supported by the National Natural Science Foundation of China (Grant Nos. 31620103905 and 81671855), the Strategic Priority Research Program of the Chinese Academy of Sciences (Grant No. XDB02030300), the Science Frontier Program of the Chinese Academy of Sciences (Grant No. QYZDJ-SSW-SMC019), the Beijing Brain Initiative of Beijing Municipal Science & Technology Commission (Z181100001518004), and Beijing Municipal Science & Technology Commission (Grant No. Z161100000216139).
Conflict of Interest
The authors declare that the research was conducted in the absence of any commercial or financial relationships that could be construed as a potential conflict of interest.
Acknowledgments
The authors thank all of developers of FSL, ANTs, SGE, GTK-server, NIfTI toolbox, and export_fig toolbox, whose functions are used or modified in the toolbox.
Footnotes
- ^ http://www.picsl.upenn.edu/ANTS/
- ^ https://mipav.cit.nih.gov/
- ^ https://www.nitrc.org
- ^ https://www.nitrc.org/projects/monkey-cbp
- ^ https://www.github.com
- ^ https://github.com/bheAI/MonkeyCBP
- ^ https://www.gnu.org/licenses/gpl-3.0.html
- ^ https://www.scicrunch.org/resources
References
Aljabar, P., Heckemann, R. A., Hammers, A., Hajnal, J. V., and Rueckert, D. (2009). Multi-atlas based segmentation of brain images: atlas selection and its effect on accuracy. Neuroimage 46, 726–738. doi: 10.1016/j.neuroimage.2009.02.018
Amaral, D. G., Bauman, M. D., and Mills Schumann, C. (2003). The amygdala and autism: implications from non-human primate studies. Genes Brain Behav. 2, 295–302. doi: 10.1034/j.1601-183x.2003.00043.x
Amunts, K., and Zilles, K. (2015). Architectonic mapping of the human brain beyond brodmann. Neuron 88, 1086–1107. doi: 10.1016/j.neuron.2015.12.001
Artaechevarria, X., Munoz-Barrutia, A., and Ortiz-de-Solorzano, C. (2009). Combination strategies in multi-atlas image segmentation: application to brain MR data. Med. Imaging IEEE Trans. 28, 1266–1277. doi: 10.1109/TMI.2009.2014372
Avants, B. B., Epstein, C. L., Grossman, M., and Gee, J. C. (2008). Symmetric diffeomorphic image registration with cross-correlation: evaluating automated labeling of elderly and neurodegenerative brain. Med. Image Anal. 12, 26–41. doi: 10.1016/j.media.2007.06.004
Avants, B. B., Tustison, N. J., Song, G., Cook, P. A., Klein, A., and Gee, J. C. (2011). A reproducible evaluation of ANTs similarity metric performance in brain image registration. Neuroimage 54, 2033–2044. doi: 10.1016/j.neuroimage.2010.09.025
Ballanger, B., Tremblay, L., Sgambato-Faure, V., Beaudoin-Gobert, M., Lavenne, F., Le Bars, D., et al. (2013). A multi-atlas based method for automated anatomical Macaca fascicularis brain MRI segmentation and PET kinetic extraction. Neuroimage 77, 26–43. doi: 10.1016/j.neuroimage.2013.03.029
Bandrowski, A., Brush, M., Grethe, J. S., Haendel, M. A., Kennedy, D. N., Hill, S., et al. (2016). The resource identification initiative: a cultural shift in publishing. Neuroinformatics 14, 169–182. doi: 10.1007/s12021-015-9284-3
Behrens, T. E., Berg, H. J., Jbabdi, S., Rushworth, M. F., and Woolrich, M. W. (2007). Probabilistic diffusion tractography with multiple fibre orientations: what can we gain? Neuroimage 34, 144–155. doi: 10.1016/j.neuroimage.2006.09.018
Behrens, T. E. J., Johansen-Berg, H., Woolrich, M. W., Smith, S. M., Wheeler-Kingshott, C. A. M., Boulby, P. A., et al. (2003). Non-invasive mapping of connections between human thalamus and cortex using diffusion imaging. Nat. Neurosci. 6, 750–757. doi: 10.1038/nn1075
Bludau, S., Eickhoff, S. B., Mohlberg, H., Caspers, S., Laird, A. R., Fox, P. T., et al. (2014). Cytoarchitecture, probability maps and functions of the human frontal pole. Neuroimage 93(Pt 2), 260–275. doi: 10.1016/j.neuroimage.2013.05.052
Brodmann, K. (1909). Vergleichende Lokalisationslehre der Grosshirnrinde in ihren Prinzipien dargestellt auf Grund des Zellenbaues. Basel: Barth.
Brown, J. D. (2009). Statistics Corner. Questions and answers about language testing statistics: choosing the right number of components or factors in PCA and EFA. Shiken 13, 19–23.
Caspers, S., Eickhoff, S. B., Geyer, S., Scheperjans, F., Mohlberg, H., Zilles, K., et al. (2008). The human inferior parietal lobule in stereotaxic space. Brain Struct. Funct. 212, 481–495. doi: 10.1007/s00429-008-0195-z
Cattell, R. B. (1966). The scree test for the number of factors. Multivar. Behav. Res. 1, 245–276. doi: 10.1207/s15327906mbr0102_10
Cerliani, L., D’Arceuil, H., and Thiebaut de Schotten, M. (2017). Connectivity-based parcellation of the macaque frontal cortex, and its relation with the cytoarchitectonic distribution described in current atlases. Brain Struct. Funct. 222, 1331–1349. doi: 10.1007/s00429-016-1280-3
Chen, C. H., Gutierrez, E. D., Thompson, W., Panizzon, M. S., Jernigan, T. L., Eyler, L. T., et al. (2012). Hierarchical genetic organization of human cortical surface area. Science 335, 1634–1636. doi: 10.1126/science.1215330
Craddock, R. C., James, G. A., Holtzheimer, P. E. III, Hu, X. P., and Mayberg, H. S. (2012). A whole brain fMRI atlas generated via spatially constrained spectral clustering. Hum. Brain Mapp. 33, 1914–1928. doi: 10.1002/hbm.21333
Cramér, H. (1946). Mathematical Methods of Statistics (PMS-9). Princeton: Princeton University Press.
Cui, Y., Liu, B., Zhou, Y., Fan, L., Li, J., Zhang, Y., et al. (2016). Genetic effects on fine-grained human cortical regionalization. Cereb. Cortex 26, 3732–3743. doi: 10.1093/cercor/bhv176
Dice, L. R. (1945). Measures of the amount of ecologic association between species. Ecology 26, 297–302. doi: 10.2307/1932409
Doshi, J., Erus, G., Ou, Y., Gaonkar, B., and Davatzikos, C. (2013). Multi-atlas skull-stripping. Acad. Radiol. 20, 1566–1576. doi: 10.1016/j.acra.2013.09.010
Eickhoff, S. B., Bzdok, D., Laird, A. R., Roski, C., Caspers, S., Zilles, K., et al. (2011). Co-activation patterns distinguish cortical modules, their connectivity and functional differentiation. Neuroimage 57, 938–949. doi: 10.1016/j.neuroimage.2011.05.021
Eickhoff, S. B., Heim, S., Zilles, K., and Amunts, K. (2006). Testing anatomically specified hypotheses in functional imaging using cytoarchitectonic maps. Neuroimage 32, 570–582. doi: 10.1016/j.neuroimage.2006.04.204
Eickhoff, S. B., Stephan, K. E., Mohlberg, H., Grefkes, C., Fink, G. R., Amunts, K., et al. (2005). A new SPM toolbox for combining probabilistic cytoarchitectonic maps and functional imaging data. Neuroimage 25, 1325–1335. doi: 10.1016/j.neuroimage.2004.12.034
Eickhoff, S. B., Thirion, B., Varoquaux, G., and Bzdok, D. (2015). Connectivity-based parcellation: critique and implications. Hum. Brain Mapp. 36, 4771–4792. doi: 10.1002/hbm.22933
Eskildsen, S. F., Coupe, P., Fonov, V., Manjon, J. V., Leung, K. K., Guizard, N., et al. (2012). BEaST: brain extraction based on nonlocal segmentation technique. Neuroimage 59, 2362–2373. doi: 10.1016/j.neuroimage.2011.09.012
Fan, L., Li, H., Zhuo, J., Zhang, Y., Wang, J., Chen, L., et al. (2016). The human brainnetome atlas: a new brain atlas based on connectional architecture. Cereb Cortex 26, 3508–3526. doi: 10.1093/cercor/bhw157
Ferré, L. (1995). Selection of components in principal component analysis: a comparison of methods. Comput. Stat. Data Anal. 19, 669–682. doi: 10.1016/0167-9473(94)00020-j
Folloni, D., Sallet, J., Khrapitchev, A. A., Sibson, N., Verhagen, L., and Mars, R. B. (2019). Dichotomous organization of amygdala/temporal-prefrontal bundles in both humans and monkeys. eLife 8:e47175.
Fu, Z., Deng, Y., Jia, X., Gao, B., Zhu, X., and Luo, Y. (2016). Automated brain extraction and associated 3D inspection layers for the Rhesus macaque MRI datasets. Paper Presented at the 15th ACM SIGGRAPH Conference on Virtual-Reality (New York, NY: ACM).
Glasser, M. F., Coalson, T. S., Robinson, E. C., Hacker, C. D., Harwell, J., Yacoub, E., et al. (2016). A multi-modal parcellation of human cerebral cortex. Nature 536, 171–178. doi: 10.1038/nature18933
Heiervang, E., Behrens, T. E., Mackay, C. E., Robson, M. D., and Johansen-Berg, H. (2006). Between session reproducibility and between subject variability of diffusion MR and tractography measures. Neuroimage 33, 867–877. doi: 10.1016/j.neuroimage.2006.07.037
Iglesias, J. E., and Sabuncu, M. R. (2015). Multi-atlas segmentation of biomedical images: a survey. Med. Image Anal. 24, 205–219. doi: 10.1016/j.media.2015.06.012
Jain, A. K. (2010). Data clustering: 50 years beyond K-means. Patt. Recogn. Lett. 31, 651–666. doi: 10.1111/desc.12868
Johansen-Berg, H., Behrens, T. E., Robson, M. D., Drobnjak, I., Rushworth, M. F., Brady, J. M., et al. (2004). Changes in connectivity profiles define functionally distinct regions in human medial frontal cortex. Proc. Natl. Acad. Sci. U.S.A. 101, 13335–13340. doi: 10.1073/pnas.0403743101
Johansen-Berg, H., Della-Maggiore, V., Behrens, T. E., Smith, S. M., and Paus, T. (2007). Integrity of white matter in the corpus callosum correlates with bimanual co-ordination skills. Neuroimage 36(Suppl. 2), T16–T21.
Kahnt, T., Chang, L. J., Park, S. Q., Heinzle, J., and Haynes, J. D. (2012). Connectivity-based parcellation of the human orbitofrontal cortex. J. Neurosci. 32, 6240–6250. doi: 10.1523/JNEUROSCI.0257-12.2012
Kaiser, H. F. (1960). The application of electronic computers to factor analysis. Educ. Psychol. Meas. 20, 141–151. doi: 10.1177/001316446002000116
Kalavathi, P., and Prasath, V. B. (2016). Methods on skull stripping of MRI head scan images-a review. J. Digit. Imaging 29, 365–379. doi: 10.1007/s10278-015-9847-8
Kim, J. H., Lee, J. M., Jo, H. J., Kim, S. H., Lee, J. H., Kim, S. T., et al. (2010). Defining functional SMA and pre-SMA subregions in human MFC using resting state fMRI: functional connectivity-based parcellation method. Neuroimage 49, 2375–2386. doi: 10.1016/j.neuroimage.2009.10.016
Klein, A., Andersson, J., Ardekani, B. A., Ashburner, J., Avants, B., Chiang, M.-C., et al. (2009). Evaluation of 14 nonlinear deformation algorithms applied to human brain MRI registration. Neuroimage 46, 786–802. doi: 10.1016/j.neuroimage.2008.12.037
Ledoit, O., and Wolf, M. (2015). Spectrum estimation: a unified framework for covariance matrix estimation and PCA in large dimensions. J. Multivar. Anal. 139, 360–384. doi: 10.1016/j.jmva.2015.04.006
Leonardi, N., Richiardi, J., Gschwind, M., Simioni, S., Annoni, J. M., Schluep, M., et al. (2013). Principal components of functional connectivity: a new approach to study dynamic brain connectivity during rest. Neuroimage 83, 937–950. doi: 10.1016/j.neuroimage.2013.07.019
Leung, K. K., Barnes, J., Modat, M., Ridgway, G. R., Bartlett, J. W., Fox, N. C., et al. (2011). Brain MAPS: an automated, accurate and robust brain extraction technique using a template library. Neuroimage 55, 1091–1108. doi: 10.1016/j.neuroimage.2010.12.067
Li, H., Fan, L., Zhuo, J., Wang, J., Zhang, Y., Yang, Z., et al. (2017). ATPP: a pipeline for automatic tractography-based brain parcellation. Front. Neuroinform. 11:35. doi: 10.3389/fninf.2017.00035
Lötjönen, J. M. P., Wolz, R., Koikkalainen, J. R., Thurfjell, L., Waldemar, G., Soininen, H., et al. (2010). Fast and robust multi-atlas segmentation of brain magnetic resonance images. Neuroimage 49, 2352–2365. doi: 10.1016/j.neuroimage.2009.10.026
Luo, Y., Gao, B., Deng, Y., Zhu, X., Jiang, T., Zhao, X., et al. (2018). Automated brain extraction and immersive exploration of its layers in virtual reality for the rhesus macaque MRI data sets. Comput. Anim. Virt. Worlds 30:e1841. doi: 10.1002/cav.1841
Makuuchi, M., Bahlmann, J., Anwander, A., and Friederici, A. D. (2009). Segregating the core computational faculty of human language from working memory. Proc. Natl. Acad. Sci. U.S.A. 106, 8362–8367. doi: 10.1073/pnas.0810928106
Maldjian, J. A., Shively, C. A., Nader, M. A., Friedman, D. P., and Whitlow, C. T. (2016). Multi-atlas library for eliminating normalization failures in non-human primates. Neuroinformatics 14, 183–190. doi: 10.1007/s12021-015-9291-4
Markiewicz, P. J., Matthews, J. C., Declerck, J., and Herholz, K. (2011). Robustness of correlations between PCA of FDG-PET scans and biological variables in healthy and demented subjects. Neuroimage 56, 782–787. doi: 10.1016/j.neuroimage.2010.05.066
Mars, R. B., Jbabdi, S., Sallet, J., O’Reilly, J. X., Croxson, P. L., Olivier, E., et al. (2011). Diffusion-weighted imaging tractography-based parcellation of the human parietal cortex and comparison with human and macaque resting-state functional connectivity. J. Neurosci. 31, 4087–4100. doi: 10.1523/JNEUROSCI.5102-10.2011
McAuliffe, M. J., Lalonde, F. M., McGarry, D., Gandler, W., Csaky, K., and Trus, B. L. (2001). Medical image processing, analysis & visualization in clinical research. Comp. Med. Syst. 14, 381–386.
Meila, M. (2003). Comparing clusterings by the variation of information. Lect. Notes Artif. Int. 2777, 173–187. doi: 10.1007/978-3-540-45167-9_14
Milham, M. P., Ai, L., Koo, B., Xu, T., Amiez, C., Balezeau, F., et al. (2018). An open resource for non-human primate imaging. Neuron 100, 61.e2–74.e2.
Munkres, J. (1957). Algorithms for the assignment and transportation problems. J. Soc. Ind. Appl. Math. 5, 32–38.
Nayal, O., Zhang, J., Rezai, A., and Knopp, M. (2014). Application of principal component analysis in dynamic 18F-FDG PET/CT neuroimaging of patients undergoing deep brain stimulation. J. Nucl. Med. 55:2033.
Nazib, A., Fookes, C., and Perrin, D. (2018). A comparative analysis of registration tools: traditional vs deep learning approach on high resolution tissue cleared data. arXiv [preprint]. Available online at: https://arxiv.org/abs/1810.08315 (accessed March 27, 2020).
Nichols, T. E., Das, S., Eickhoff, S. B., Evans, A. C., Glatard, T., Hanke, M., et al. (2017). Best practices in data analysis and sharing in neuroimaging using MRI. Nat. Neurosci. 20, 299–303. doi: 10.1038/nn.4500
Pasini, G. (2017). Principal component analysis for stock portfolio management. Int. J. Pure Appl. Math. 115, 153–167.
Passingham, R. E., Stephan, K. E., and Kötter, R. (2002). The anatomical basis of functional localization in the cortex. Nat. Rev. Neurosci. 3, 606–616. doi: 10.1038/nrn893
Perretta, G. (2009). Non-human primate models in neuroscience research. Scand. J. Lab. Anim. Sci. 36, 77–85. doi: 10.1089/aid.1990.6.77
Petrides, M., and Pandya, D. N. (2002). Comparative cytoarchitectonic analysis of the human and the macaque ventrolateral prefrontal cortex and corticocortical connection patterns in the monkey. Eur. J. Neurosci. 16, 291–310. doi: 10.1046/j.1460-9568.2001.02090.x
Rea, A., and Rea, W. (2016). How many components should be retained from a multivariate time series PCA? arXiv [preprint]. Available online at: https://arxiv.org/abs/1610.03588 (accessed March 27, 2020).
Rousseeuw, P. J. (1987). Silhouettes - a graphical aid to the interpretation and validation of cluster-analysis. J. Comput. Appl. Math. 20, 53–65. doi: 10.1016/0377-0427(87)90125-7
Sani, I., McPherson, B. C., Stemmann, H., Pestilli, F., and Freiwald, W. A. (2019). Functionally defined white matter of the macaque monkey brain reveals a dorso-ventral attention network. eLife 8:e40520.
Serag, A., Blesa, M., Moore, E. J., Pataky, R., Sparrow, S. A., Wilkinson, A. G., et al. (2016). Accurate Learning with Few Atlases (ALFA): an algorithm for MRI neonatal brain extraction and comparison with 11 publicly available methods. Sci. Rep. 6:23470. doi: 10.1038/srep23470
Sinke, M. R. T., Otte, W. M., Christiaens, D., Schmitt, O., Leemans, A., van der Toorn, A., et al. (2018). Diffusion MRI-based cortical connectome reconstruction: dependency on tractography procedures and neuroanatomical characteristics. Brain Struct. Funct. 223, 2269–2285. doi: 10.1007/s00429-018-1628-y
Smith, D. E., Roberts, J., Gage, F. H., and Tuszynski, M. H. (1999). Age-associated neuronal atrophy occurs in the primate brain and is reversible by growth factor gene therapy. Proc. Natl. Acad. Sci. U.S.A. 96, 10893–10898. doi: 10.1073/pnas.96.19.10893
Smith, R. X., Jann, K., Dapretto, M., and Wang, D. J. J. (2018). Imbalance of functional connectivity and temporal entropy in resting-state networks in autism spectrum disorder: a machine learning approach. Front. Neurosci. 12:869. doi: 10.3389/fnins.2018.00869
Smith, S. M. (2002). Fast robust automated brain extraction. Hum. Brain Mapp. 17, 143–155. doi: 10.1002/hbm.10062
Tang, X., Kutten, K., Ceritoglu, C., Mori, S., and Miller, M. I. (2015). Simultaneous skull-stripping and lateral ventricle segmentation via fast multi-atlas likelihood fusion. SPIE Med. Imaging 9413:94130W.
Teipel, S. J., Stahl, R., Dietrich, O., Schoenberg, S. O., Perneczky, R., Bokde, A. L., et al. (2007). Multivariate network analysis of fiber tract integrity in Alzheimer’s disease. Neuroimage 34, 985–995. doi: 10.1016/j.neuroimage.2006.07.047
Thiebaut de Schotten, M., Urbanski, M., Valabregue, R., Bayle, D. J., and Volle, E. (2014). Subdivision of the occipital lobes: an anatomical and functional MRI connectivity study. Cortex 56, 121–137. doi: 10.1016/j.cortex.2012.12.007
Thomas, C., Ye, F. Q., Irfanoglu, M. O., Modi, P., Saleem, K. S., Leopold, D. A., et al. (2014). Anatomical accuracy of brain connections derived from diffusion MRI tractography is inherently limited. Proc. Natl. Acad. Sci. U.S.A. 111, 16574–16579. doi: 10.1073/pnas.1405672111
Tian, X., Liu, C., Jiang, T., Rizak, J., Ma, Y., and Hu, X. (2013). Feature-reduction and semi-simulated data in functional connectivity-based cortical parcellation. Neurosci. Bull. 29, 333–347. doi: 10.1007/s12264-013-1339-6
Toga, A. W., Thompson, P. M., and Sowell, E. R. (2006). Mapping brain maturation. Trends Neurosci 29, 148–159. doi: 10.1016/j.tins.2006.01.007
Tomassini, V., Jbabdi, S., Klein, J. C., Behrens, T. E., Pozzilli, C., Matthews, P. M., et al. (2007). Diffusion-weighted imaging tractography-based parcellation of the human lateral premotor cortex identifies dorsal and ventral subregions with anatomical and functional specializations. J. Neurosci. 27, 10259–10269. doi: 10.1523/jneurosci.2144-07.2007
Tourbier, S., Hagmann, P., Cagneaux, M., Guibaud, L., Gorthi, S., Schaer, M., et al. (2015). Automatic brain extraction in fetal MRI using multi-atlas-based segmentation. SPIE Med. Imaging 9413:94130Y.
Tungaraza, R. L., Mehta, S. H., Haynor, D. R., and Grabowski, T. J. (2015). Anatomically informed metrics for connectivity-based cortical parcellation from diffusion MRI. IEEE J. Biomed. Health Inform. 19, 1375–1383. doi: 10.1109/JBHI.2015.2444917
Van Essen, D. C. (2002). Windows on the brain: the emerging role of atlases and databases in neuroscience. Curr. Opin. Neurobiol. 12, 574–579. doi: 10.1016/s0959-4388(02)00361-6
Van Essen, D. C., Drury, H. A., Dickson, J., Harwell, J., Hanlon, D., and Anderson, C. H. (2001). An integrated software suite for surface-based analyses of cerebral cortex. J. Am. Med. Inform. Assoc. 8, 443–459. doi: 10.1136/jamia.2001.0080443
Wang, H., Suh, J. W., Das, S. R., Pluta, J. B., Craige, C., and Yushkevich, P. A. (2013). Multi-atlas segmentation with joint label fusion. IEEE Trans. Patt. Anal. Mach. Intell. 35, 611–623. doi: 10.1109/TPAMI.2012.143
Wang, J., Fan, L., Zhang, Y., Liu, Y., Jiang, D., Zhang, Y., et al. (2012). Tractography-based parcellation of the human left inferior parietal lobule. Neuroimage 63, 641–652. doi: 10.1016/j.neuroimage.2012.07.045
Wang, J., Vachet, C., Rumple, A., Gouttard, S., Ouziel, C., Perrot, E., et al. (2014). Multi-atlas segmentation of subcortical brain structures via the AutoSeg software pipeline. Front. Neuroinform. 8:7. doi: 10.3389/fninf.2014.00007
Wang, J., Zuo, Z., Xie, S., Miao, Y., Ma, Y., Zhao, X., et al. (2018). Parcellation of macaque cortex with anatomical connectivity profiles. Brain Topogr. 31, 161–173. doi: 10.1007/s10548-017-0576-9
Wang, Y., Nie, J., Yap, P. T., Li, G., Shi, F., Geng, X., et al. (2014). Knowledge-guided robust MRI brain extraction for diverse large-scale neuroimaging studies on humans and non-human primates. PLoS One 9:e77810. doi: 10.1371/journal.pone.0077810
Witten, I. H., Frank, E., Hall, M. A., and Pal, C. J. (2017). Data Mining : Practical Machine Learning Tools and Techniques, 4th Edn. Amsterdam: Morgan Kaufmann.
Wold, S. (1978). Cross-validatory estimation of the number of components in factor and principal components models. Technometrics 20, 397–405. doi: 10.1080/00401706.1978.10489693
Yang, Z., Fripp, J., Chandra, S. S., Neubert, A., Xia, Y., Strudwick, M., et al. (2015). Automatic bone segmentation and bone-cartilage interface extraction for the shoulder joint from magnetic resonance images. Phys. Med. Biol. 60, 1441–1459. doi: 10.1088/0031-9155/60/4/1441
Yushkevich, P. A., Piven, J., Hazlett, H. C., Smith, R. G., Ho, S., Gee, J. C., et al. (2006). User-guided 3D active contour segmentation of anatomical structures: significantly improved efficiency and reliability. Neuroimage 31, 1116–1128. doi: 10.1016/j.neuroimage.2006.01.015
Keywords: parcellation, brain atlas, neuroimaging pipeline, diffusion tractography, parallel computing
Citation: He B, Yang Z, Fan L, Gao B, Li H, Ye C, You B and Jiang T (2020) MonkeyCBP: A Toolbox for Connectivity-Based Parcellation of Monkey Brain. Front. Neuroinform. 14:14. doi: 10.3389/fninf.2020.00014
Received: 12 December 2019; Accepted: 10 March 2020;
Published: 28 April 2020.
Edited by:
Xi-Nian Zuo, Nanning Normal University, ChinaReviewed by:
Stavros I. Dimitriadis, Cardiff University, United KingdomAnqi Qiu, National University of Singapore, Singapore
Copyright © 2020 He, Yang, Fan, Gao, Li, Ye, You and Jiang. This is an open-access article distributed under the terms of the Creative Commons Attribution License (CC BY). The use, distribution or reproduction in other forums is permitted, provided the original author(s) and the copyright owner(s) are credited and that the original publication in this journal is cited, in accordance with accepted academic practice. No use, distribution or reproduction is permitted which does not comply with these terms.
*Correspondence: Bo You, youbo@hrbust.edu.cn; Tianzi Jiang, jiangtz@nlpr.ia.ac.cn
†These authors have contributed equally to this work