Evaluation of Hot Deformation Behaviour of UNS S32750 Super Duplex Stainless Steel (SDSS) Alloy


Materials Science and Engineering Faculty, University POLITEHNICA of Bucharest, 060042 Bucharest, Romania
*
Author to whom correspondence should be addressed.
Metals 2020, 10(5), 673; https://doi.org/10.3390/met10050673
Submission received: 22 April 2020
/
Revised: 13 May 2020
/
Accepted: 18 May 2020
/
Published: 21 May 2020
Abstract
:The super-duplex stainless steel UNS S32750 consists of two main phases, austenite and ferrite, which differ not only by their morphology, physical, and mechanical properties, but also by their deformation behaviour. A heterogenous deformation can be obtained during thermomechanical processing, generating internal stresses and sometimes fissures or cracks on sample lateral surfaces, due to ferrite’s phase lower potential of plastic deformation accommodation in comparison with austenite phase. The research objective is to determine the optimum range of the applied deformation degree, during hot deformation processing by upsetting of the super-duplex steel (SDSS) UNS S32750. In the experimental program several samples were hot deformed by upsetting, by applying a deformation degree between 5–50%, at 1050 °C and 1300 °C. The most representative hot-deformed samples were selected and analysed by scanning electron microscope-Electron Backscatter Diffraction (SEM-EBSD), to determine the main microstructural characteristics obtained during thermomechanical processing. When considering the experimental results, the influence of the applied deformation degree on the microstructure has been evaluated. Microstructural features, such as nature, distribution, morphology and relative proportion of constituent phases, Grain Reference Orientation Deviation (GROD), and recrystallization (RX), were analysed, in correlation with the applied deformation degree. Finally, it was concluded that the UNS S32750 alloy can be safely hot deformed, by upsetting, at 1050 °C and 1300 °C, with a maximum applied deformation degree of 20% at 1050 °C and, respectively, by 50% at 1300 °C.
1. Introduction
Super Duplex Stainless Steels (SDSS) are defined as a class of stainless steels with a microstructure consisting of two phases: ferrite δ and austenite γ, in approximately equal proportions, containing enough Cr, Mo, and N to provide high resistance to pitting corrosion. SDSS successfully combine the properties of ferritic and austenitic stainless steels, possessing a good combination of strength, ductility, and corrosion resistance in different corrosive environments [1,2,3,4]. Although they represent a very small percentage from the total of stainless steels (approx. 1%), the SDSS are an industrial success, due to the exceptional combination between superior mechanical strength, high toughness, and increased corrosion resistance under critical conditions (a strong resistance to stress corrosion cracking, to pitting corrosion, etc.) [5,6].
The hot workability of a metallic material depends in a very complex manner on the material composition and on the thermomechanical processing parameters. However, these two categories of factors cannot be treated independently, as they are closely interconnected, since process parameters can induce important changes in properties. The ability of the material to withstand deformation, without appearance of internal/external defects, such as: cracks/micro-cracks, depends on many factors, including deformation temperature and applied deformation degree [7,8,9]. For modelling the hot deformation behaviour, it is necessary to identify the constitutive equations showing the relation between the flow stress and the deformation conditions (temperature, deformation degree, etc.), while also considering the chemical composition and evolution of microstructure during various thermo-mechanical treatments. In the case of SDSS, additional difficulties arise due to the austenite-ferrite microstructure, while taking the different mechanical behaviour of these two phases and the wide range of possibilities for microstructural arrangements into account [10,11,12,13].
As is known, super-duplex stainless steels mainly consist of two phases with different mechanical and physical properties (elastic modulus, flow stress, strain hardening coefficient, etc.) and distinct morphology; therefore, they exhibit a non-uniform deformation. For that reason, both stresses and strains are unevenly distributed in phases, making the mechanism of deformation different for various deformation degrees [14,15,16,17,18]. Generally, the initial γ grains are smaller than δ grains due to the previous recrystallization treatments, so that the subsequent deformation of austenite phase is more homogeneous when compared to the ferrite phase deformation [19,20]. Additionally, it has been shown that micro-cracks usually appear in δ phase, expanding to the phase boundaries and leading to ferrite fracture before the final failure of the sample [18].
Thermomechanical processing parameters, such as deformation temperature and applied deformation degree, play a decisive role in any process of hot metal working and their control is of the utmost importance, because an inadequate thermomechanical regime can lead to the appearance of defects in the final products [21,22,23,24]. This study is the continuation of a previous research [25], where the optimal deformation temperature range for the UNS S32750 SDSS was determined. The research program aimed to determine the optimum values for the applied deformation degree, in the case of UNS S32750 SDSS hot deformed, by upsetting, at 1050 °C and 1300 °C, and to study the main microstructural changes that occur.
2. Materials and Methods
2.1. Thermomechanical Processing Route
The material used in the experimental program had the same preliminary processing history as the one used in the previous research [25]. This condition is being considered as the initial (as-received) structural state. The used samples had the following geometric configuration: the diameter d = 18 mm and the height h = 27 mm (ratio h/d = 1.5). All of the samples were checked for pre-existing defects, such as micro-cracks, porosity, laps, etc., on the lateral surface, while using liquid penetrant inspection technique.
The samples were hot deformed at two different temperatures of 1050 °C and, respectively, 1300 °C. The deformation temperatures were selected according to previous results [25]. After heating, the samples were hot deformed, by upsetting, in axial compression, with different deformation degrees, ranging from 5% to 50%, in 5% steps, at a constant strain rate of approx. 0.37 [s−1]. Table 1 presents the performed experimental program for UNS S32750 SDSS alloy.
All of the samples were heated using a NABERTHERM HTC 08–16 furnace (Nabertherm GmbH, Lilienthal, Germany), at a temperature higher by 20 °C than the desired deformation temperature, while taking the cooling of the samples from the moment of extraction from the furnace until the beginning of the upsetting processing into account. As deformation equipment, a 200 tf hydraulic press was used, using a constant crosshead speed of approx. 10 mm/s (strain rate of approx. 0.37 [s−1]). The holding duration, in the above furnace, at the prescribed temperatures was 20 min., to equalize the temperature over the entire volume of the sample. After hot deformation, by upsetting, the samples were water cooled to ambient temperature in order to freeze sample internal microstructure. After cooling, all of the samples were checked for micro-cracks/fissures, while using the liquid penetrant inspection technique.
2.2. Microstructural Characterization
Several representative samples, marked by * in Table 1, were selected for SEM-EBSD analysis.
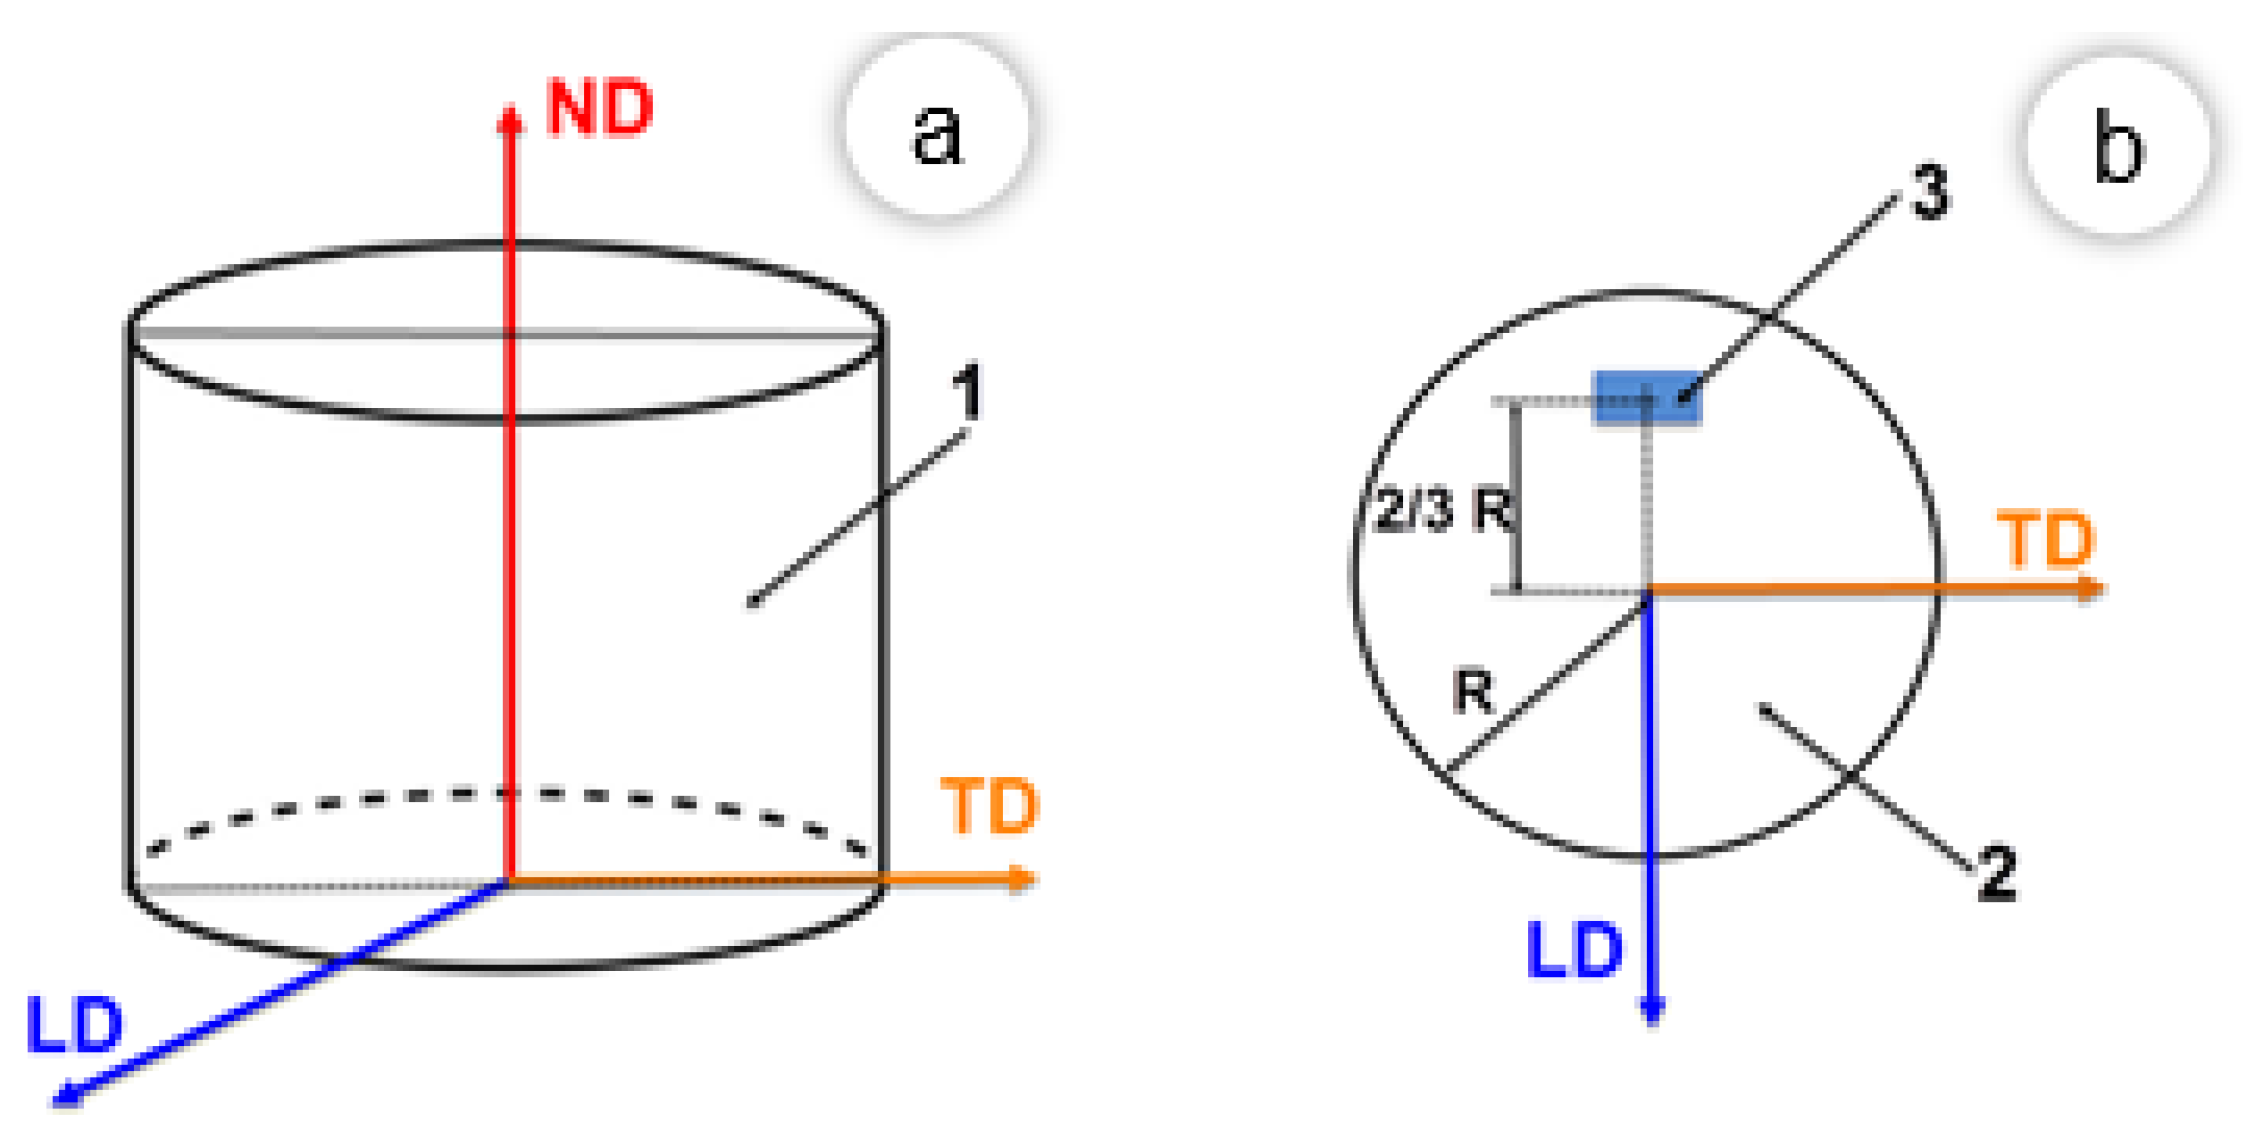
Figure 1 shows schematically the reference system of the analysed samples. The samples were cut at the middle hight and analysed in the LD-TD plan (Longitudinal Direction-Transverse Direction), in selected area 3 (2/3 from sample centre), depending on this system. The sample cutting was performed using a Metkon MICRACUT 200 (Metkon Instruments Inc., Bursa, Turkey) precision diamond cutting machine. The cut samples were embedded in conductive phenolic resin. Special attention was paid to the embedding operation, to avoid, as much as possible, overheating the sample and to induce any potential microstructural transformation. The samples were hot-embedded, in conductive phenolic resin, at a temperature of 138 °C, with a holding time of 10 min. at the embedding temperature. The embedded samples were then prepared by polishing on a Metkon Digiprep ACCURA (Metkon Instruments Inc., Bursa, Turkey) equipment. After these operations, an additional super-final polishing was performed with a Buehler VibroMet2 (Buehler, Lake Bluff, Illinois, IL, USA) equipment in order to improve the quality of the sample surface. The polishing and super-final polishing steps are presented in detail in a previous paper [25].
SEM-EBSD microstructural analysis was performed with a scanning electron microscope (SEM), model TESCAN VEGA II-XMU (TESCAN, Brno, Czech Republic). This microscope was equipped with an EBSD detector model BRUKER Quantax e-Flash (Bruker Corporation, Billerica, MA, USA). The analysis was performed in the LD-TD plane, at 1/2 hight and 2/3 distance from the middle of the sample (see Figure 1). The SEM-EBSD analysis had the role of highlighting the main microstructural characteristics of the UNS S32750 SDSS alloy in the following microstructural states: initial (as received) and hot deformed, by upsetting, with different deformation degrees, ε = 5–50%, at deformation temperatures of 1050 °C and 1300 °C.
In order to identify the microstructure constituent phases of the UNS S32750 SDSS alloy, the following phases were considered: γ-phase (austenite), indexed in the cubic system (225), space group Fm3m (with the lattice parameter a = 3.66 Å) and δ-phase (ferrite), indexed in the cubic system (229), space group Im3m (with the lattice parameter a = 2.86 Å). The following SEM-EBSD parameters were used: 200× magnification, 320 × 240 pixels resolution, 10 ms acquisition time/pixel, 1 × 1 binning size, and less than 3% zero solutions.
The nature, distribution, morphology, and proportion (weight fraction) of the constituent phases, structural homogeneity, grain size, and dynamic recrystallization were studied, in relation to the applied deformation temperature and deformation degree.
3. Results and Discussion
3.1. SEM-EBSD Microstructural Analysis of As-Received UNS S32750 Alloy
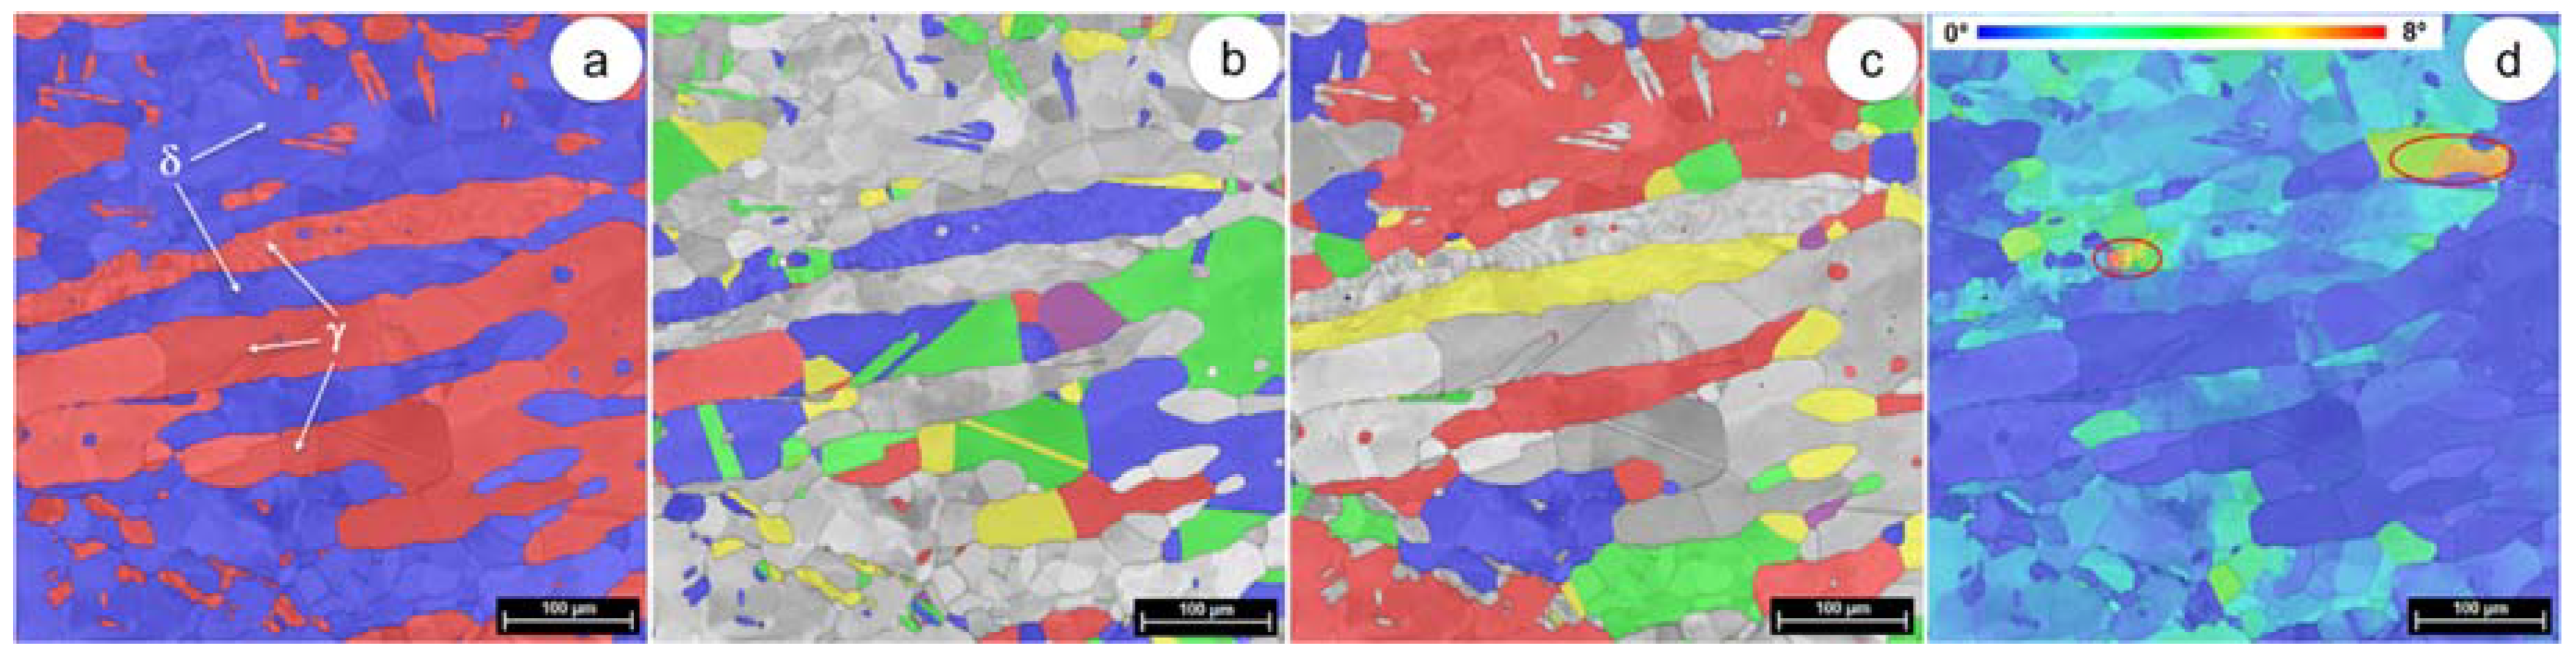
Figure 2 illustrates a series of representative SEM-EBSD composite images, resulting from the microstructural analysis that was performed for the super-duplex steel in the initial structural state (see Table 1, sample 0). Figure 2a shows the distribution of the austenite (γ-phase) and ferrite (δ-phase) within the microstructure, Figure 2b,c show the distribution of size and shape of austenite and ferrite grains, and Figure 2d shows the GROD (Grain Reference Orientation Deviation) distribution of both austenite and ferrite phases in the analysed field.
The analysis of the images presented in Figure 2 revealed that the initial microstructure of UNS S32750 is homogeneous, being identified only two phases: ferrite (δ phase), which acts as a metallic matrix, with large grains (up to 400 µm in size), and austenite (γ-phase), which is dispersed, showing elongated and irregular grains of different sizes between 50 μm and 200 μm, generally smaller than ferrite grains. The proportion of constituent phases is about (50–52%) ferrite (δ-phase), and (50–48%) austenite (γ-phase). No other secondary phases were detected in the microstructure of the UNS S32750 alloy in the initial state.
The Grain Reference Orientation Deviation (GROD) map distribution was a tool used to assess the accumulated deformation/strain at the microstructural level [26,27]. The GROD map distribution is based on the misorientation (MO) between a reference point and other points of the considered grain. The average orientation of the considered grain can be taken into account as a reference point [28,29]. As shown, the GROD map distribution presents grains with deviations from the average grains orientation, deviations that occur either due to the accumulated strain induced by the slip/twinning/rotation of the grains, or by other effects of deformation, such as strain hardening, dynamic recrystallization, etc.
The GROD distribution in the initial structural state (Figure 2d) shows that both ferrite and austenite have low stressed grains; the maximum GROD was equal to 8° and it was recorded in the case of ferrite. From the analysis of the distribution of the accumulated stress/strain in the ferrite and austenite phases, it can be observed that, generally, the austenite phase shows a more uniform distribution and a lower level of accommodated stress/strain in comparison with the ferrite phase (Figure 2d). Additionally, one can observe that high stress/strain areas (marked with red circles in Figure 2d) are presented in both phases. Due to the low GROD, it can be assumed that these areas have a low susceptibility to generate micro-cracks. In the as-received state, the internal stressed/strained areas are most likely created by the previously applied thermomechanical processing procedure.
3.2. Hot Deformation, by Upsetting, of As-Received UNS S32750 Alloy.
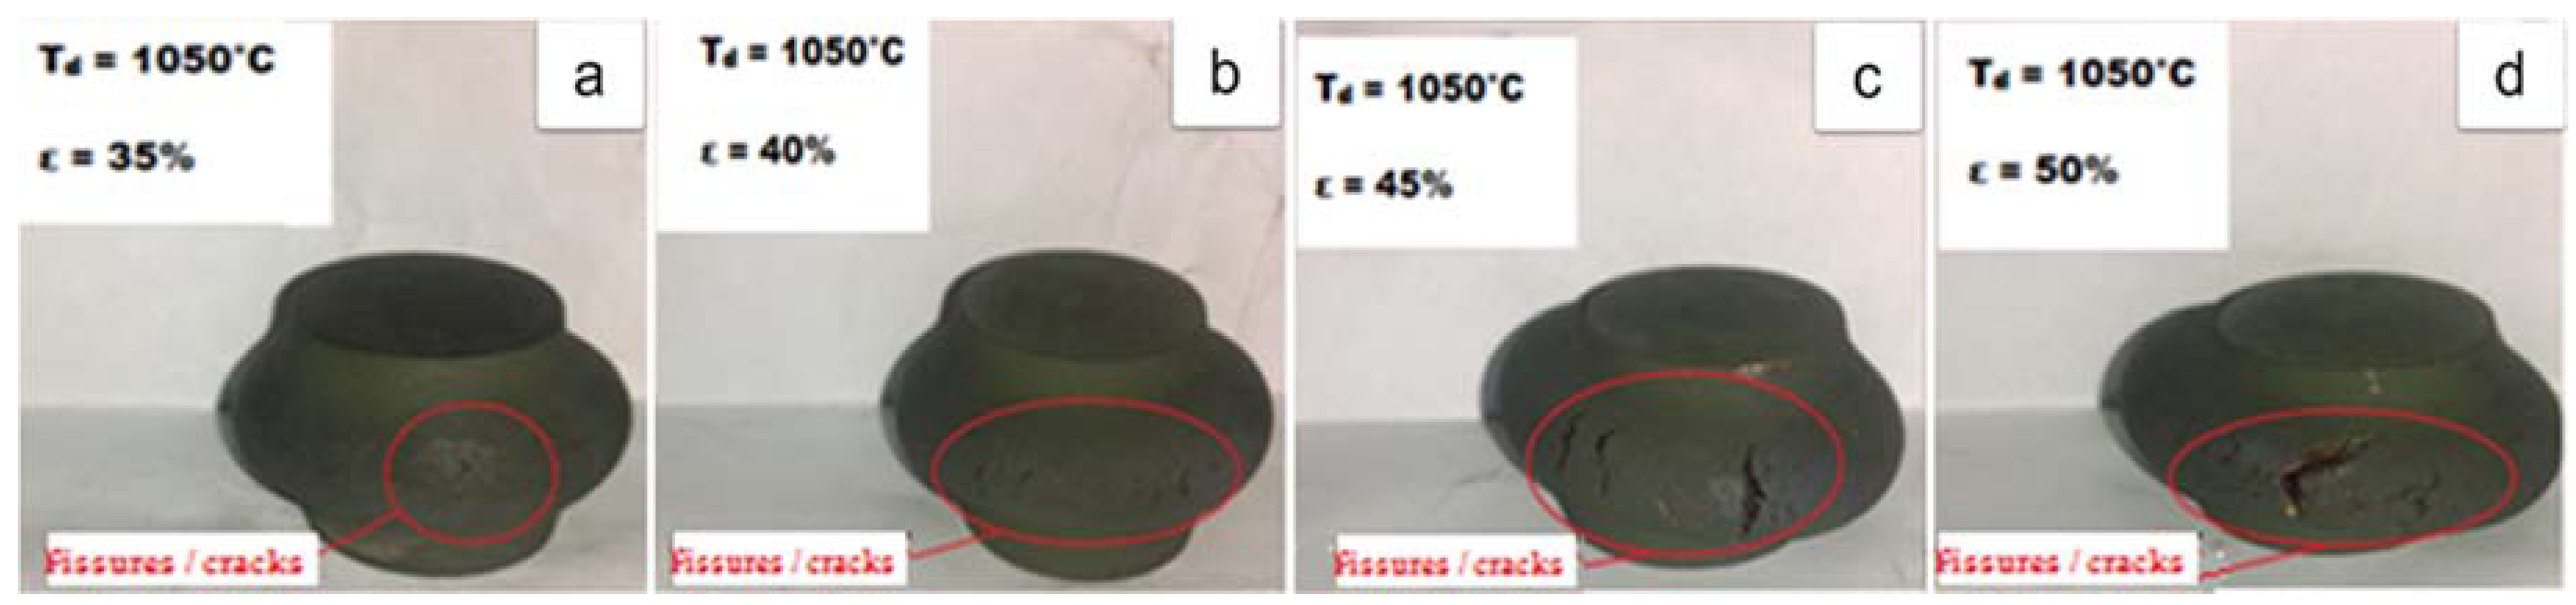
Figure 3 shows the specimens where cracks were observed on the samples lateral surface after hot deformation, by upsetting, at 1050 °C, in the case of following applied deformation degrees: ε = 35% (Figure 3a), ε = 40% (Figure 3b), ε = 45% (Figure 3c), and ε = 50% (Figure 3d). It can be observed that the increase of applied deformation degree leads to the development of larger cracks on the samples lateral surface, due to the limited plasticity of UNS S32750 SDSS alloy at 1050 °C (mainly due to the limited plasticity of the ferrite).
In the case of samples that were deformed at 1300 °C, fissures or cracks were not observed on the samples lateral surface, the UNS S32750 SDSS alloy maintained its structural integrity, even after upsetting with a higher deformation degree, ie ε = 50% (maximum deformation degree applied within the experimental program).
3.3. SEM-EBSD Microstructural Analysis
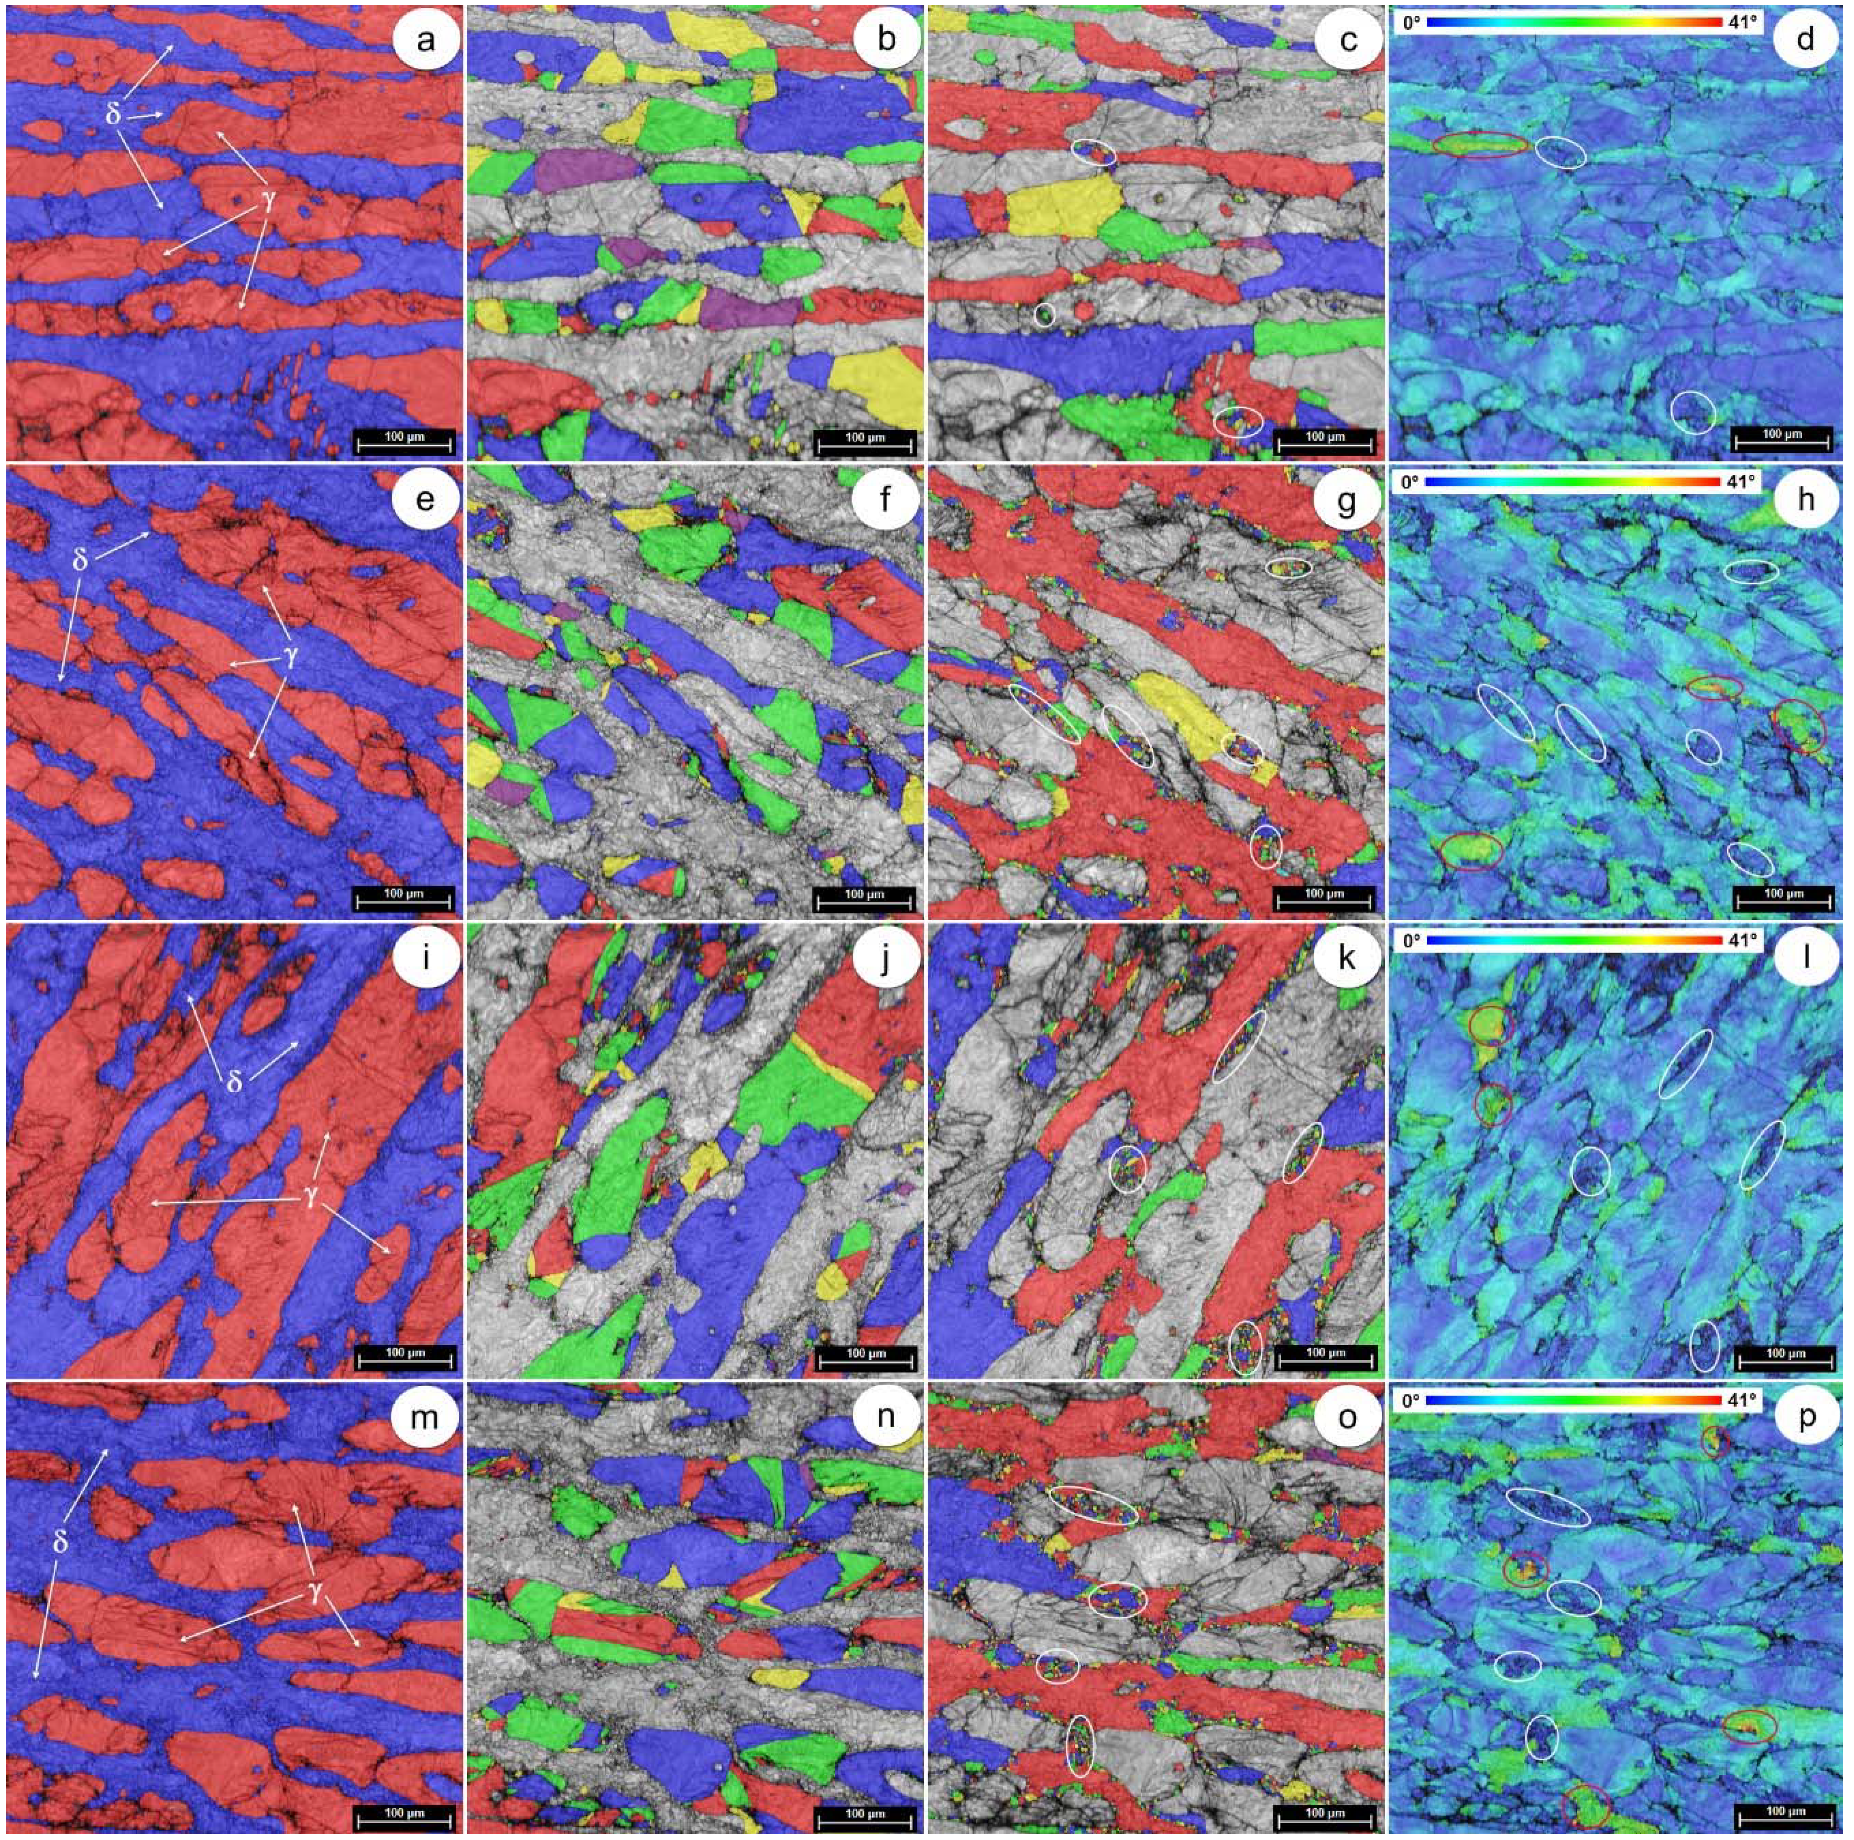
Figure 4 shows a series of representative SEM-EBSD images, which result from SEM-EBSD analysis of samples processed, by upsetting, at 1050 °C, with the following deformation degrees: ε = 10% (Figure 4a–d), ε = 20% (Figure 4e–h), ε = 30% (Figure 4i–l), and ε = 35% (Figure 4m–p) (see Table 1—samples 2,4,6,7). By upsetting, the following microstructure characteristics were analysed in order to determine the optimum deformation degree: constituent phases, distribution and proportion of phases, size and shape of grains, GROD distribution of constituent phases, and occurrence of recrystallization (RX) of new δ-phase grains.
At 1050 °C, the SEM-EBSD analysis only revealed the presence of two phases, austenite and ferrite, in approximately equal proportions; the ferrite (δ-phase) acts as a metal matrix and the austenite (γ-phase) being uniform dispersed in the ferrite matrix. Also, austenite shows elongated and irregular grains, of different shapes and sizes. No other secondary phases were detected in the UNS S32750 alloy that was processed at 1050 °C. While analysing the influence of deformation degree on the microstructural characteristics, it can be seen that the increase of the deformation degree leads to the fragmentation of both austenite and ferrite, with the fragmented grains showing a continuously decreasing average size (see Figure 4b,c,f,g,j,k,n,o). Starting even with small deformation degrees (ε = 10%), new small recrystallized ferrite grains are visible (see Figure 4c,g,k,o), indicating the occurrence of dynamic recrystallization (DRX) mechanism in ferrite phase (marked with withe circles in Figure 4d,h,l,p). It can also be seen that the increase of the applied deformation degree leads to a slight intensification of the RX phenomena, increasing the weight fraction of recrystallized ferrite grains (see Figure 4c,g,k,o). No RX process was observed in the austenite phase (see Figure 4b,f,j,n).
The GROD distributions, as illustrated in Figure 4d,h,l,p, indirectly show that the level of internal local strain is high for the UNS 32750 alloy, hot deformed at 1050 °C, in comparison with as-received/initial state (see Figure 2d). Areas with a higher strain level can be observed in ferrite grains as compared to austenite grains, even at small applied deformation degrees (i.e., ε = 10% and ε = 20%). Analysing the misorientation spread, one can observe that, in the case of ε = 10% (Figure 4d), the maximum recorded deviation was close to 25°, while, in the case of ε = 20% (Figure 4h), the maximum recorded deviation was close to 38°, which indicates a high increase of approx. 52%. This high increase in orientation deviation, from 25° to 38° of approx. 52%, shows that the added deformation, from ε = 10% to ε = 20%, induced intense effects on both austenite and ferrite grains (slip/twinning/rotation of grains, strain hardening, DRX, etc.). Analysing the misorientation spread in the case of ε = 30% (Figure 4l), the maximum recorded deviation was close to 40°, while, in the case of ε = 35% (Figure 4p), when the first cracks/fissures are observed/detected on sample lateral surface, the maximum recorded deviation was close to 41°. This small increase in maximum recorded deviation, from 38° to 41°, corresponding to a high increase in applied deformation degree, from 20% to 35%, shows, firstly, that the risk of cracks/fissures development arises if the maximum GROD value exceeds 38–40° and, secondly, that the UNS S32750 SDSS alloy can be safely processed, at 1050 °C, up to an applied deformation degree of ε = 20%, if higher deformation degrees are used that the risk of cracking is arising.
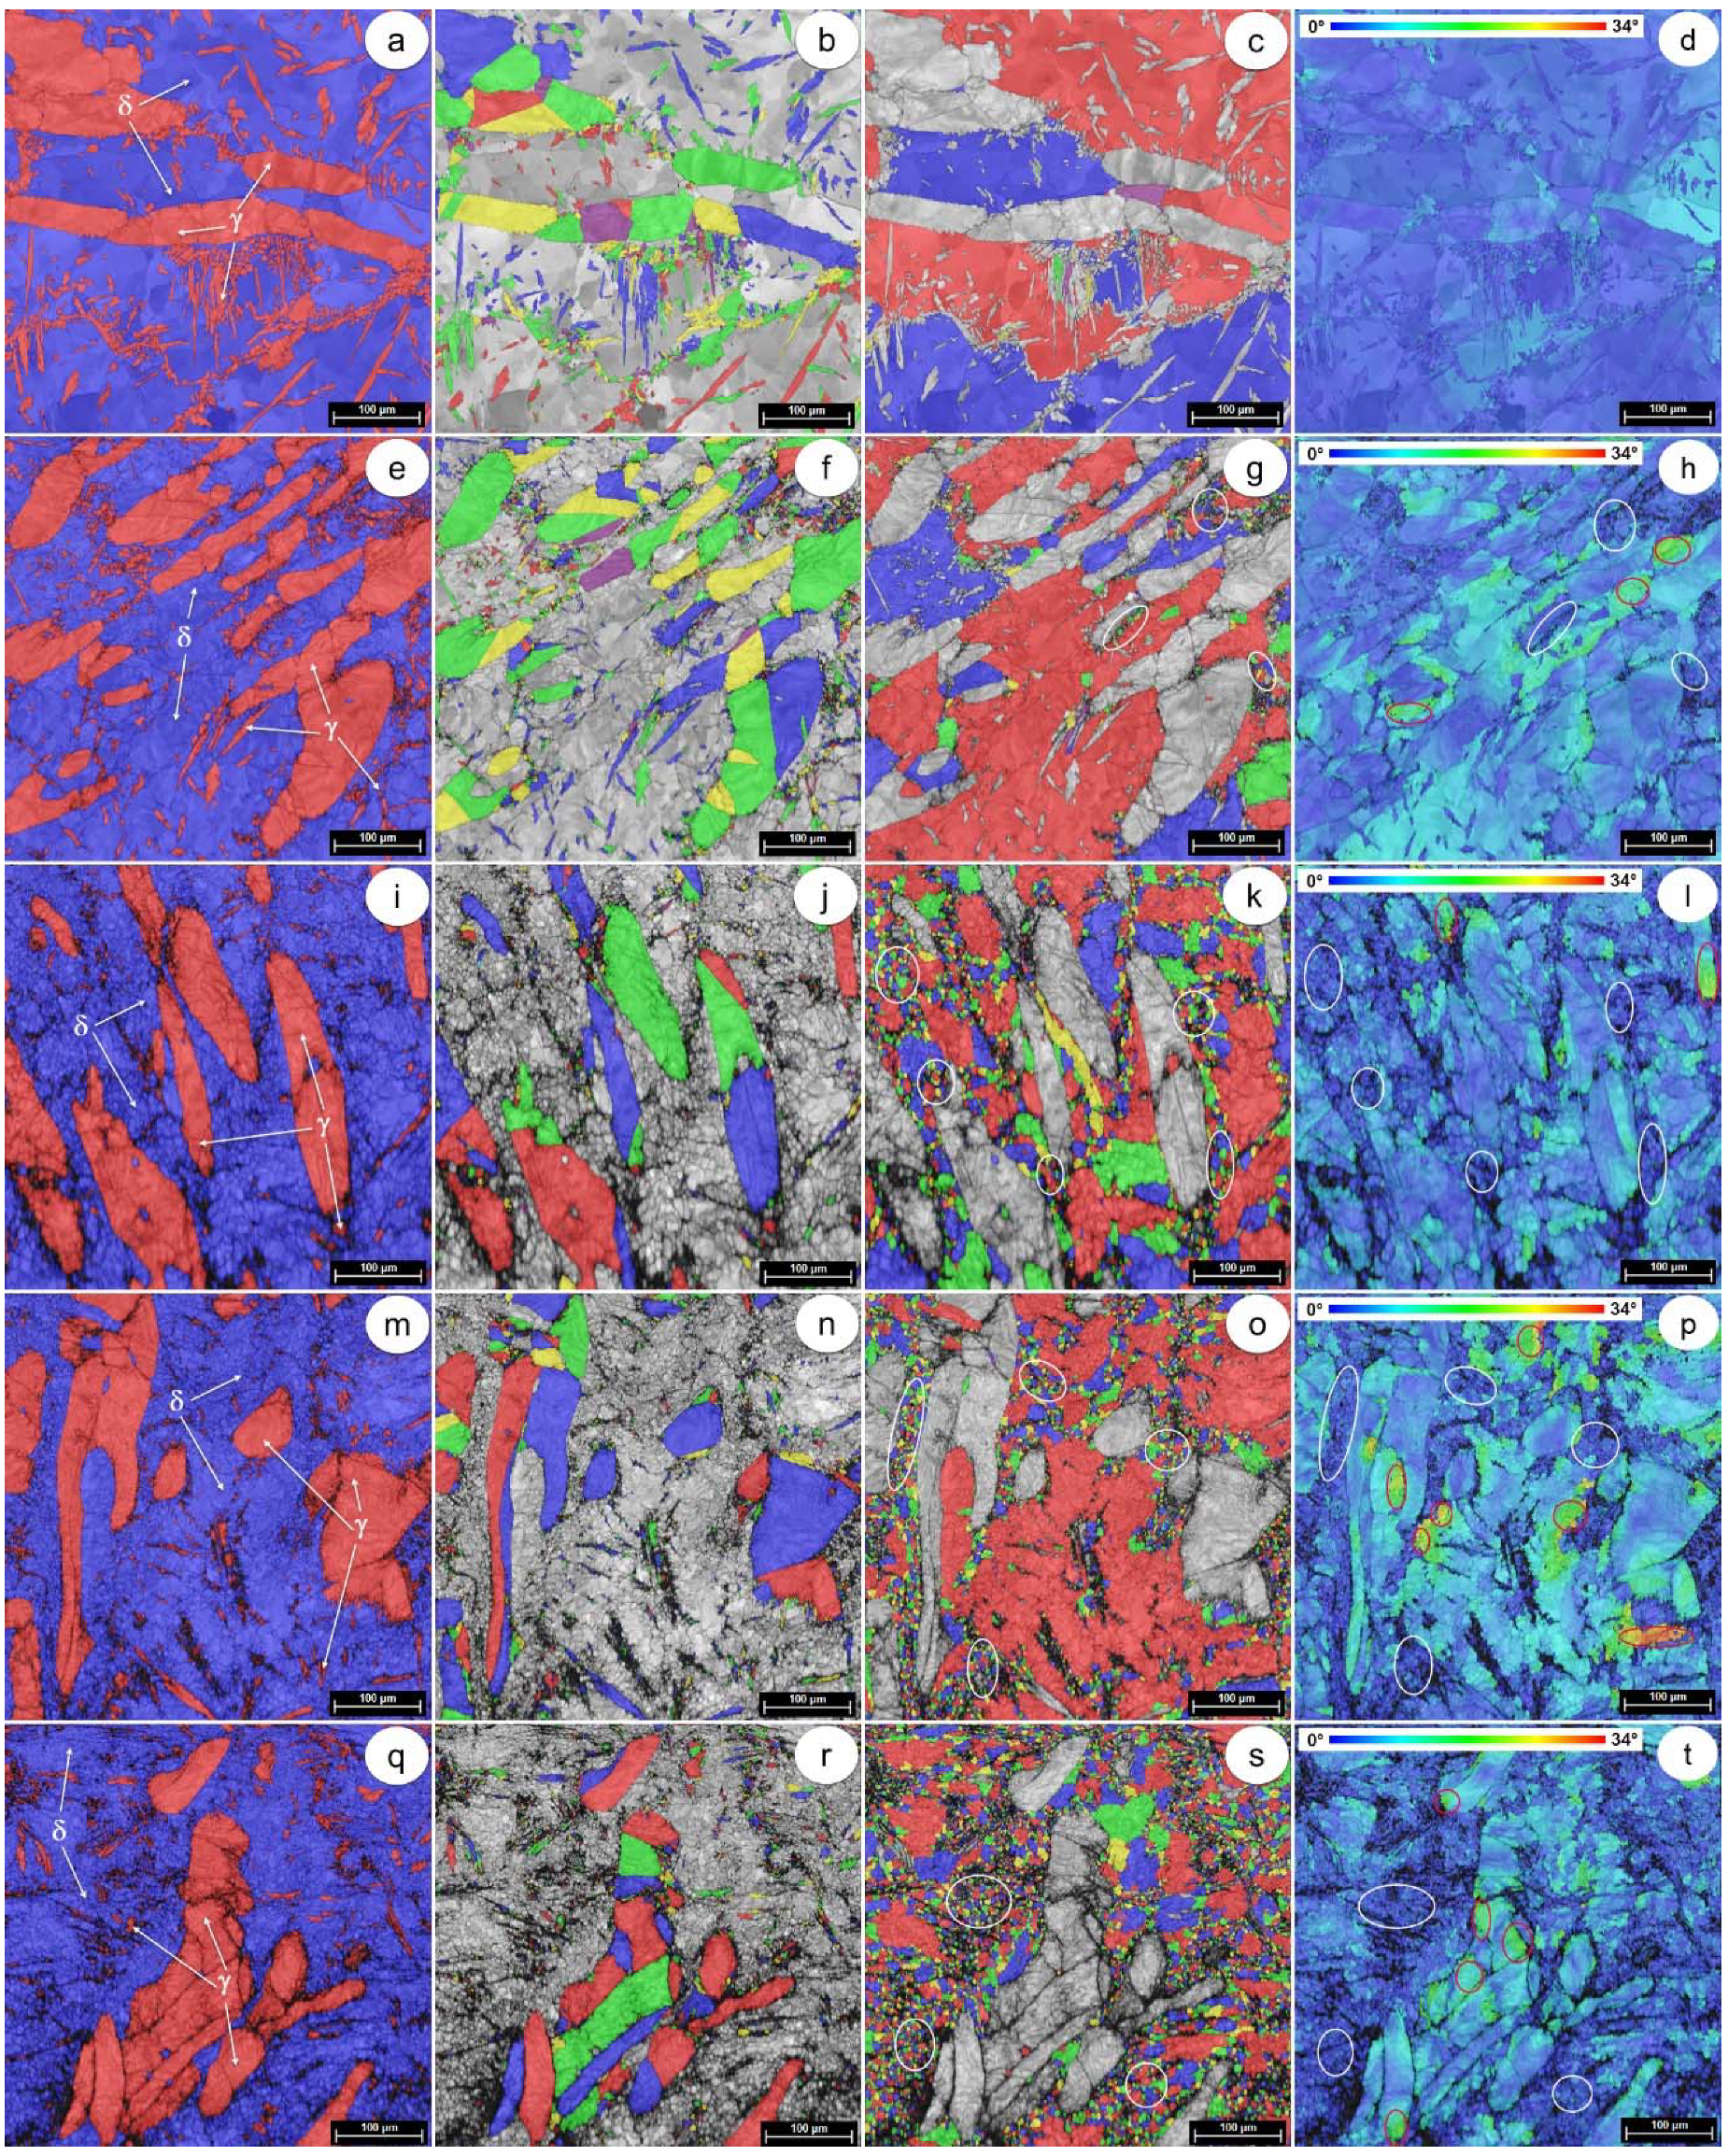
Figure 5 shows a series of representative SEM-EBSD images, which result from SEM-EBSD analysis of samples processed, by upsetting, at 1300 °C, with the following deformation degrees: ε = 10% (Figure 5a–d), ε = 20% (Figure 5e–h), ε = 30% (Figure 5i–l), ε = 40% (Figure 5m–p), and, ε = 50% (Figure 5q–t) (see Table 1—samples 12,14,16,18,20). By upsetting, the following microstructure characteristics were analysed in order to determine the optimum deformation degree: constituent phases, distribution and proportion of phases, size and shape of grains, GROD distribution of constituent phases, and occurrence of recrystallization (RX) of new δ-phase grains.
At 1300 °C, the SEM-EBSD analysis only revealed the presence of two main phases, the austenite (γ-phase) and the ferrite (δ-phase). The weight fraction of constituent phases averages 35% austenite and 65% ferrite, which shows that increasing the deformation temperature from 1050 °C to 1300 °C leads to the increasing of ferrite weight fraction, due to the dissolution of austenite within ferrite matrix by the γ- > δ-phase transformation. Additionally, at 1300 °C, ferrite acts as a metallic matrix and the austenite shows elongated and irregular grains of different shapes and sizes, evenly dispersed in the ferrite matrix. No other secondary phases were detected.
Analysing the influence of deformation degree on microstructure shows that increasing the applied deformation degree leads to the fragmentation of both austenite and ferrite phases, resulting in fragmented grains with a continuously decreasing average grain size (see Figure 5b,c,f,g,j,k,n,o,r,s). Starting even with small applied deformation degrees, new small ferrite grains are visible in the microstructure, indicating the occurrence of RX mechanism in the ferrite phase (in areas marked with white circles in Figure 5c,g,k,o,s). It can also be observed that the increase of the deformation degree leads to the intensification of the RX in ferrite phase, significantly increasing the weight fraction of the new recrystallized ferrite grains (see areas marked with white circles in Figure 5c,g,k,o,s). At 1300 °C, no RX process was observed in the austenite phase.
The GROD distributions of both austenite and ferrite grains, as illustrated in Figure 5d,h,l,p,t, indirectly show that the level of accumulated internal stress/strain fields is quite high, but lower when compared to the ones observed in the case of hot deformation, by upsetting, at 1050 °C. Analysing the misorientation spread, one can observe that in the case of ε = 10% (Figure 5d) maximum recorded deviation was close to 12°, in the case of ε = 20% (Figure 5h) maximum recorded deviation was close to 26°, in the case of ε = 30% (Figure 5l) maximum recorded deviation was close to 28°, in the case of ε = 40% (Figure 5p) maximum recorded deviation was close to 34° and, in the case of ε = 50% (Figure 5t), the maximum recorded deviation was close to 30°. These maximum GROD deviations are situated to an inferior level compared with critical ones (38–40°), indicating why no-cracks/fissures were induced on samples lateral surfaces during hot deformation. When considering that the maximum GROD deviation was situated close to 34°, below critical one (38–40°), indicates that the UNS S32750 SDSS alloy can safely be processed, by upsetting, using a deformation degree of ε = 50% at 1300 °C.
In general, when trying to explain the deformation behaviour, the specific mechanisms and phenomena that occur during the thermo-mechanical processing of the material must be taken into account. If an attempt is made to explain all of the observations made using the SEM-EBSD microstructural analysis, the crystallographic characteristics of all of the observed phases must be first considered. In the case of UNS S32750 alloy, only two phases were observed, the δ-phase and the γ-phase. Phase δ (belonging to bcc-body centred cubic crystallographic system) and phase γ (belonging to fcc-face centred cubic crystallographic system) have different potentials to accommodate deformation, either by slip/twinning and/or rotations of grains [26,27,28,29]. If the main driving force for accommodating deformation is considered to be slip/twinning, then the main influential factor in accommodation the plastic deformation is the atomic density on the slip/twinning planes [30,31]. In fcc crystals, when considering the minimum activation energy criterion, the slip system most easy to activate is the primary system {111} <110> and the twinning system most easy to activate is the primary system {111} <112>. In bcc crystallographic systems, when considering the minimum activation energy criterion, the slip system most easy to activate is the primary system {110} <111>, while the twinning system most easy to activate is the primary system {112} <111> [26,27,28,29,32]. The analyse of the atomic density on the slip/twinning plane in both fcc and bcc systems revealed that a higher atomic density, almost double, is exhibited by fcc {111} atomic slip/twinning plane as compared to bcc {110} and {112} slip/twinning planes, indicating why fcc crystalline phases better accommodates deformation compared to bcc crystalline phases, for the same external stress level/processing conditions. In addition to the influence of slip/twinning mechanisms, the influence of other deformation mechanisms and phenomena must also be considered.
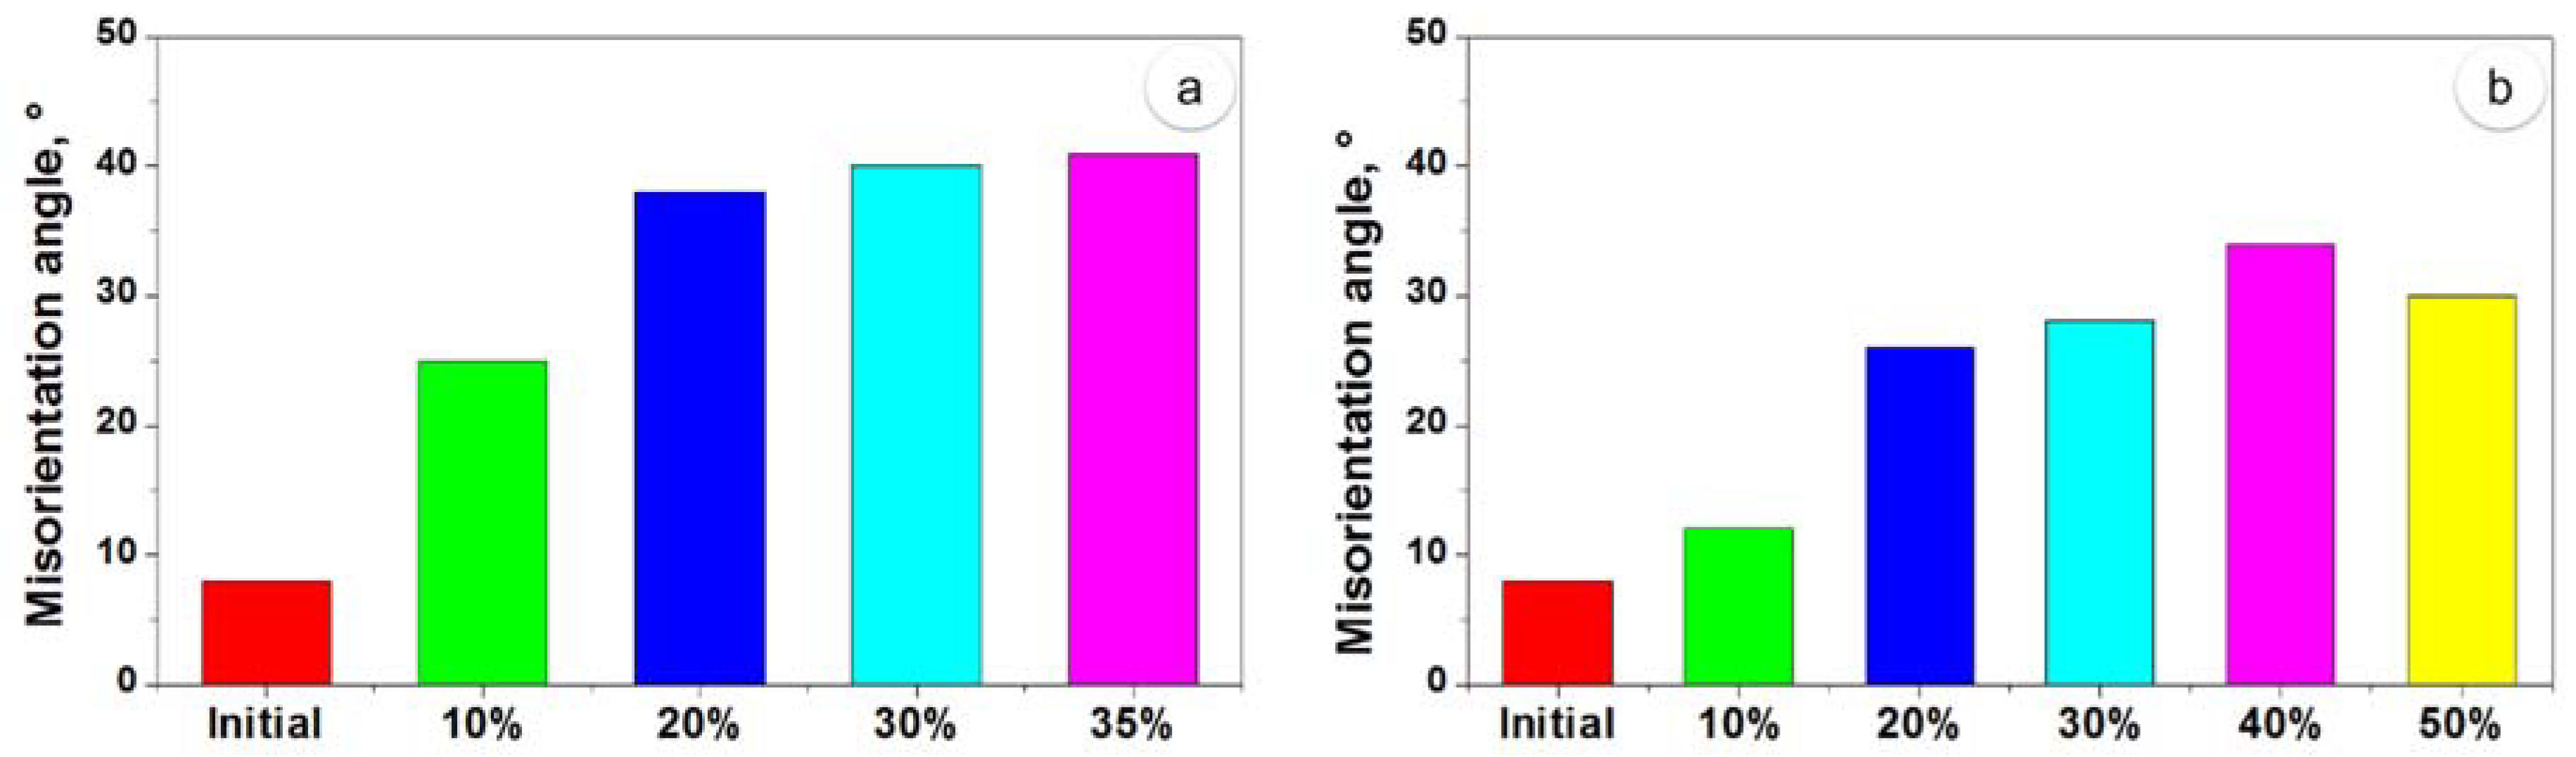
Figure 6 shows the variation of maximum misorientation angle as a function of the deformation degree at 1050 °C (Figure 6a) and 1300 °C (Figure 6b), in the case of δ-phase. It can be seen that, when upsetting at 1050 °C, the maximum misorientation rapidly reaches a plateau value, close to (38–40°), starting even with a 20% deformation degree, plateau close to the critical value. As critical misorientation, one can consider when first cracks/fissures are observed/detected on sample lateral surface, in our case 41° as maximum deviation. In the case of upsetting at 1300 °C, the maximum misorientation limit of (38–40°) is not reached, even for a 50% deformation degree.
In the case of hot deformation, by upsetting, at 1300 °C, the maximum misorientation, around 34°, was recorded for an applied deformation degree of 40%, increasing the applied deformation degree to 50%, results in a decrease of the maximum misorientation to about 30°; this indicates that, for more intense deformations, besides primary slip/twinning systems, secondary slip/twinning systems may be activated, to accommodate increased deformation. An increased stress/strain level is necessary in order to activate secondary slip/twinning systems (characterised by higher Miller indices), possessing a lower atomic density on slip/twinning plane in comparison with primary ones. This necessary increased stress/strain level is assured by the increased applied deformation degree.
Dynamic recrystallization (DRX) is another phenomenon that occurs during upset forging at high temperatures [33]. When analysing all of the microstructural states, it can be seen that both δ and γ phases show typical morphologies of strain-hardened microstructures, but only in the δ-phase can new RX grains be observed (see Figure 4 and Figure 5). The small size of the new RX grains being due to the short duration of hot deformation, by upsetting, at both 1050 °C and 1300 °C.
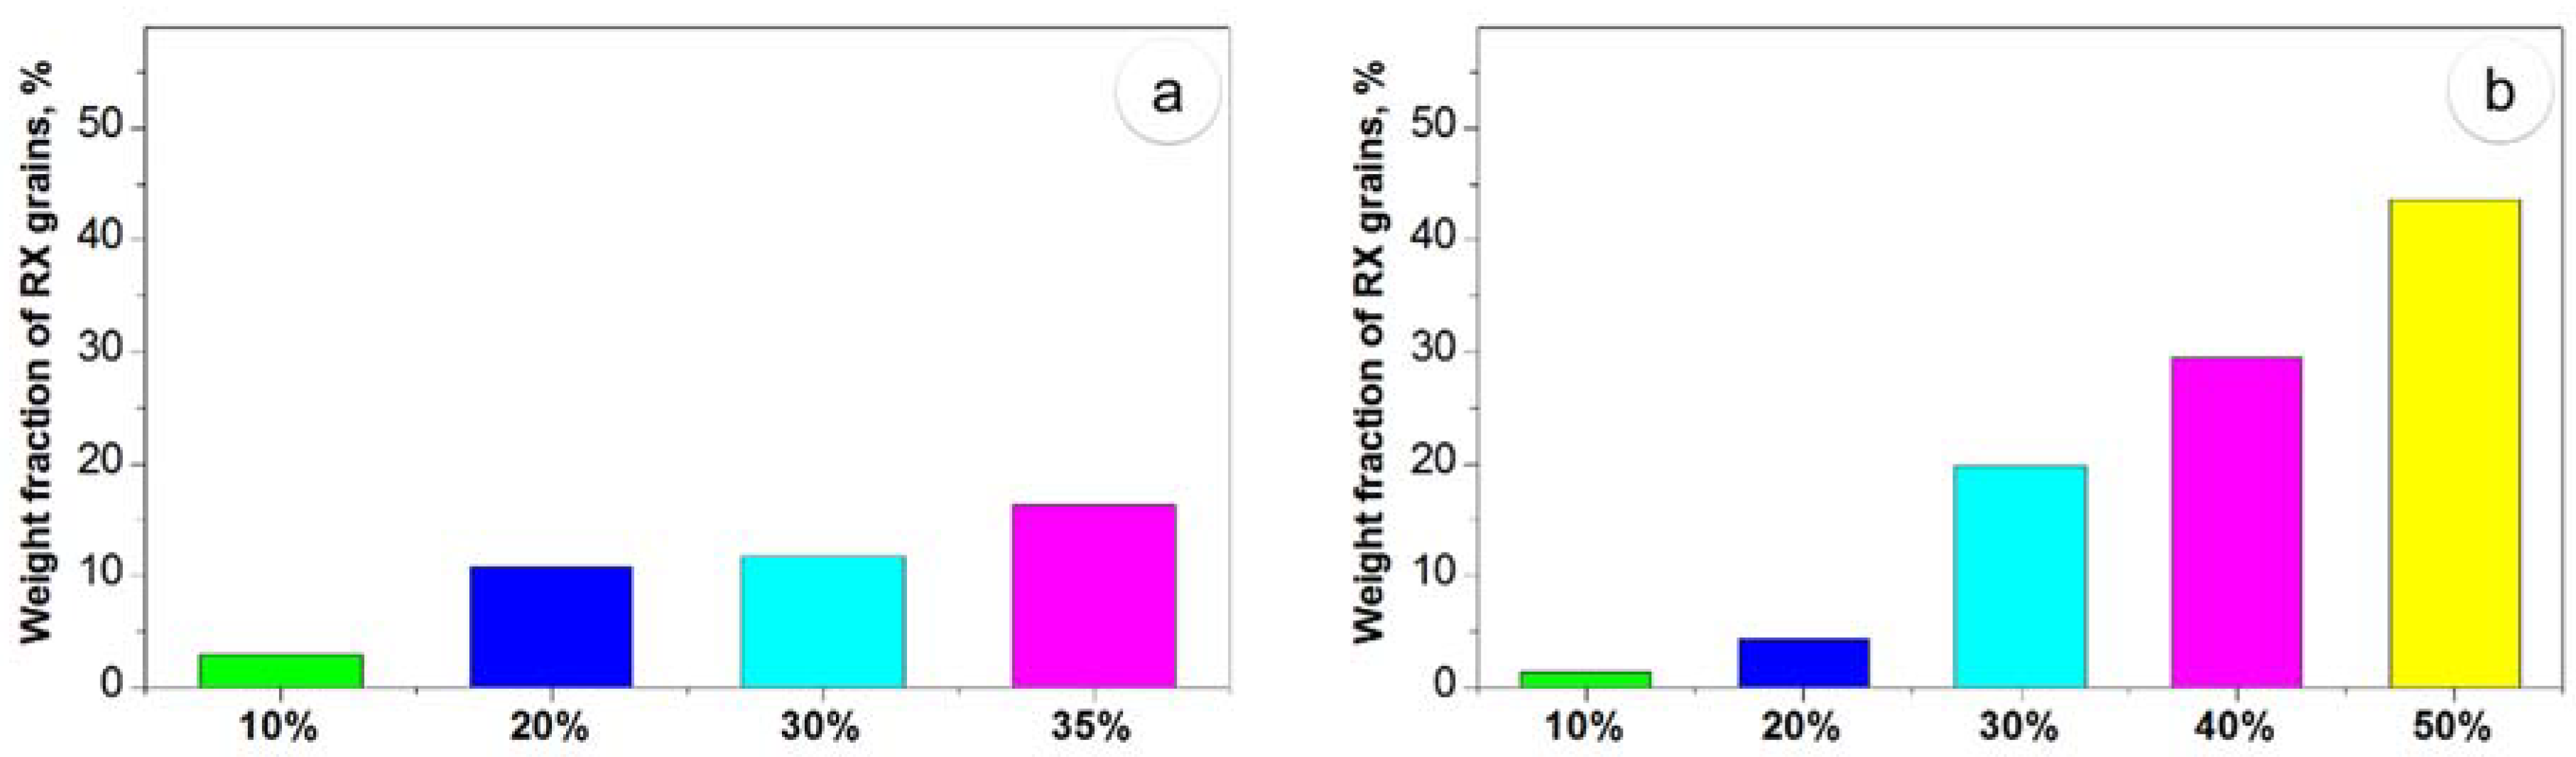
Figure 7 shows the variation of weight fraction of RX δ-phase grains, as a function of applied deformation degree at 1050 °C (Figure 7a) and 1300 °C (Figure 7b). One can consider that all of the new grains, with an average size bellow 10 μm, are RX grains, due to the short duration of hot deformation, by upsetting, at 1050 °C and 1300 °C. When the UNS S32750 SDSS alloy is hot deformed, by upsetting, at 1050 °C, the weight fraction of δ-phase RX grains shows a continuous increase up to a deformation degree of 20%, when it reaches a value that is close to 10.8%. A further increase of the applied deformation degree, up to 30%, will result in a small increase of the weight fraction of RX grains, up to 11.6%. At 35% deformation, when the first micro-cracks are observed, the weight fraction of RX grains shows a value close to 16.3%. This increase in RX δ-phase weight fraction shows that the RX mechanism is related to both deformation temperature and applied deformation degree. When the alloy is hot deformed, by upsetting, at 1300 °C, the weight fraction of the RX δ-phase grains shows a continuous increase up to 43.7%, which corresponds to an applied deformation degree of 50%, when almost half of the δ-phase is recrystallized. This high weight fraction of RX δ-phase grains explains the improved plasticity of δ-phase at 1300 °C.
4. Conclusions
The main results of the present research can be summarized, as follows:
- (1).
- After hot deformation, by upsetting, at 1050 °C the microstructure of the UNS S32750 SDSS alloy consists of approximately equal proportions of the γ-phase and δ-phase. However, after deformation at 1300 °C, the weight fraction of δ-phase increases up to about 65%, due to the initiation of γ → δ phase transition;
- (2).
- Development of cracks/fissures, on the lateral surface of UNS S32750 SDSS alloy samples, were observed only in the case of hot deformation, by upsetting, at 1050 °C with a deformation degree exceeding 30%, being related to the limited plasticity of the δ-phase at 1050 °C;
- (3).
- Grain Reference Orientation Deviation (GROD) analysis showed a limit/critical value, close to (38–40°), must be reached in order to develop cracks/fissure on lateral surface of UNS S32750 SDSS alloy samples; and,
- (4).
- Recrystallization (RX) of δ-phase grains is observed for all UNS S32750 SDSS alloy processed samples, both at 1050 °C and 1300 °C; a higher weight fraction of RX δ-phase grains is noticed in the case of hot deformation at 1300 °C in comparison 1050 °C; maximum weight fraction of RX δ-phase grains, close to 43.7%, was recorded for an applied deformation degree of 50% at 1300 °C.
As a general conclusion, the super-duplex stainless steel UNS S32750 can be safely hot deformed, by upsetting, at temperatures between 1050–1300 °C, provided that the applied deformation degree at 1050 °C is not exceeding 20%, while at 1300 °C is not exceeding 50%.
The authors are currently undertaking further optimization of the thermomechanical processing parameters for the UNS S32750 SDSS alloy, in order to obtain a favourable balance between plasticity, mechanical properties, and corrosion resistance.
Author Contributions
M.L.A., E.M.C., N.Ș. and V.D.C. conceived and designed the experiments; M.L.A., E.M.C., N.Ș. and V.D.C. performed the experiments; M.L.A., E.M.C., N.Ș. and V.D.C. analysed the data; M.L.A. and E.M.C. wrote—reviewed and edited the paper. All authors have read and agreed to the published version of the manuscript.
Funding
This work was supported by a grant of the Romanian National Authority for Scientific Research, CCCDI–UEFISCDI, Project PN-III-P2-2.1-BG-2016-0367, contract No. 104 BG/2016.
Conflicts of Interest
The authors declare no conflict of interest.
References
- Zanotto, F.; Grassi, V.; Balbo, A.; Monticelli, C.; Zucchi, F. Stress corrosion cracking of LDX 2101® duplex stainless steel in chloride solutions in the presence of thiosulphate. Corros. Sci. 2014, 80, 205–212. [Google Scholar] [CrossRef]
- Tavares, S.S.M.; Silva, V.G.; Pardal, J.M.; Corte, J.S. Investigation of stress corrosion cracks in a UNS S32750 superduplex stainless steel. Eng. Fail. Anal. 2013, 35, 88–94. [Google Scholar] [CrossRef]
- Xiong, J.; Tan, M.Y.; Forsyth, M. The corrosion behaviors of stainless steel weldments in sodium chloride solution observed using a novel electrochemical measurement approach. Desalination 2013, 327, 39–45. [Google Scholar] [CrossRef]
- Zanotto, F.; Grassi, V.; Balbo, A.; Zucchi, F.; Monticelli, C. Investigation on the Corrosion Behavior of Lean Duplex Stainless Steel 2404 after Aging within the 650–850 °C Temperature Range. Metals 2019, 9, 529. [Google Scholar] [CrossRef] [Green Version]
- Nilsson, J.O. Super Duplex Stainless Steels. J. Mater. Sci. Technol. 1992, 8, 685–700. [Google Scholar] [CrossRef]
- Hoseinpoor, M.; Momeni, M.; Moayed, M.H.; Davoodi, A. EIS assessment of critical pitting temperature of 2205 duplex stainless steel in acidified ferric chloride solution. Corros. Sci. 2014, 80, 197–204. [Google Scholar] [CrossRef]
- Gutierrez, I.; Iza-Mendia, A. Process: Hot Workability. In Duplex Stainless Steels; John Wiley & Sons: Hoboken, NJ, USA, 2013. [Google Scholar]
- Martin, G. Hot Workability of Duplex Stainless Steels. Ph.D. Thesis, Autre. Université de Grenoble, Cities of Grenoble, France, 04 November 2011. [Google Scholar]
- Kang, J.H.; Heo, S.J.; Yoo, J.; Kwon, Y.C. Hot working characteristics of S32760 super duplex stainless steel. J. Mech. Sci. Technol. 2019, 33, 2633–2640. [Google Scholar] [CrossRef]
- Cojocaru, V.D.; Serban, N.; Angelescu, M.L.; Cotrut, M.C.; Cojocaru, E.M.; Vintila, A.N. Influence of Solution Treatment Temperature on Microstructural Properties of an Industrially Forged UNS S32750/1.4410/F53 Super Duplex Stainless Steel (SDSS) Alloy. Metals 2017, 7, 210. [Google Scholar] [CrossRef] [Green Version]
- Cojocaru, V.D.; Raducanu, D.; Angelescu, M.L.; Vintila, A.N.; Serban, N.; Dan, I.; Cojocaru, E.M.; Cinca, I. Influence of Solution Treatment Duration on Microstructural Features of an Industrial Forged UNS S32750/1.4410/F53 Super Duplex Stainless Steel (SDSS) Alloy. JOM 2017, 69, 1439–1445. [Google Scholar] [CrossRef]
- Örnek, C.; Engelberg, D.L. Towards understanding the effect of deformation mode on stress corrosion cracking susceptibility of grade 2205 duplex stainless steel. Mater. Sci. Eng. A 2016, 666, 269–279. [Google Scholar] [CrossRef]
- Serban, N.; Cojocaru, V.D.; Angelescu, M.L.; Raducanu, D.; Cinca, I.; Vintila, A.N.; Cojocaru, E.M. High temperature deformation behaviour of an industrial S32760/1.4501/F55 super duplex stainless steel (SDSS) alloy. Metall. Ital. 2019, 111, 41–48. [Google Scholar]
- Rys, J.; Cempura, G. Microstructure and deformation behavior of metastable duplex stainless steel at high rolling reductions. Mater. Sci. Eng. A 2017, 700, 656–666. [Google Scholar] [CrossRef]
- Primig, S.; Ragger, K.S.; Buchmayr, B. EBSD Study of the Microstructural Evolution during Hot Compression Testing of a Superduplex Steel. Mat. Sci. Forum 2013, 783, 973–979. [Google Scholar] [CrossRef]
- Kim, S.K.; Kang, K.Y.; Kim, M.S.; Lee, J.M. Low-Temperature Mechanical Behavior of Super Duplex Stainless Steel with Sigma Precipitation. Metals 2015, 5, 1732–1745. [Google Scholar] [CrossRef] [Green Version]
- Pettersson, N.; Wessman, S.; Thuvander, M.; Hedström, P.; Odqvist, J.; Pettersson, R.F.A.; Hertzman, S. Nanostructure evolution and mechanical property changes during aging of a super duplex stainless steel at 300 °C. Mater. Sci. Eng. A 2015, 647, 241–248. [Google Scholar] [CrossRef]
- Liu, G.; Wang, Y.; Li, S.; Du, K.; Wang, X. Deformation behavior of thermal aged duplex stainless steels studied by nanoindentation, EBSD and TEM. Mater. High. Temp. 2016, 33, 15–23. [Google Scholar] [CrossRef]
- Wroński, S.; Tarasiuk, J.; Bacroix, B.; Baczmański, A.; Braham, C. Investigation of plastic deformation heterogeneities in duplexsteel by EBSD. Mater. Charact. 2012, 73, 52–60. [Google Scholar] [CrossRef]
- Dakhlaoui, R.; Baczmański, A.; Braham, C.; Wroński, S.; Wierzbanowski, K.; Oliver, E.C. Effect of residual stresses onindividual phase mechanical properties of austeno-ferriticduplex stainless steel. Acta Mater. 2006, 54, 5027–5039. [Google Scholar] [CrossRef]
- Fargas, G.; Anglada, M.; Mateo, A. Effect of the annealing temperature on the mechanical properties, formability and corrosion resistance of hot-rolled duplex stainless steels. J. Mater. Process. Technol. 2009, 209, 1770–1782. [Google Scholar] [CrossRef]
- Maki, T.; Furuhara, T.; Tsuzaki, K. Microstructure Development by Thermomechanical Processing in Duplex Stainless Steel. ISIJ Int. 2001, 41, 571–579. [Google Scholar] [CrossRef]
- Moverare, J.J.; Odén, M. Deformation behaviour of a prestrained duplex stainless steel. Mater. Sci. Eng. A 2002, 337, 25–38. [Google Scholar] [CrossRef]
- Kleber, S.; Hafok, M. Multiaxial Forging of Super Duplex Steel. Mater. Sci. Forum 2010, 638, 2998–3003. [Google Scholar] [CrossRef]
- Angelescu, M.L.; Cojocaru, V.D.; Serban, N.; Cojocaru, E.M. Evaluation of Optimal Forging Temperature Range for an Industrial UNS S32750 SDSS Alloy Using SEM-EBSD Analysis. Metals 2018, 8, 496. [Google Scholar] [CrossRef] [Green Version]
- Schayes, C.; Bouquerel, J.; Vogt, J.B.; Palleschi, F.; Zaefferer, S. A comparison of EBSD based strain indicators for the study of Fe-3Si steel subjected to cyclic loading. Mater. Charact. 2016, 115, 61–70. [Google Scholar] [CrossRef]
- Kamaya, M. Characterization of microstructural damage due to low-cycle-fatigue by EBSD observation. Mater. Charact. 2009, 160, 1454–1462. [Google Scholar] [CrossRef]
- Wright, S.I.; Nowell, M.M.; Field, D.P. A review of strain analysis using electron backscatter diffraction. Microsc. Microanal. 2011, 17, 316–329. [Google Scholar] [CrossRef]
- Kamaya, M. Assessment of local deformation using EBSD: Quantification of local damage at grain boundaries. Mater. Charact. 2012, 66, 56–67. [Google Scholar] [CrossRef]
- Christian, J.W.; Mahajan, S. Deformation twinning. Prog. Mater. Sci. 1995, 39, 1–157. [Google Scholar] [CrossRef]
- Liang, Z.Y.; Huang, M.X. Deformation twinning in small-sized face-centred cubic single crystals: Experiments and modelling. J. Mech. Phys. Solids 2015, 85, 128–142. [Google Scholar] [CrossRef]
- Chen, Z.; Cai, H.; Li, S.; Zhang, X.; Wang, F.; Tan, C. Analysis of crystallographic twinning and slip in fcc crystals under plane strain compression. Mater. Sci. Eng. A 2007, 464, 101–109. [Google Scholar] [CrossRef]
- Li, N.; Wang, J.; Misra, A.; Zhang, X.; Huang, J.Y.; Hirth, J.P. Twinning dislocation multiplication at a coherent twin boundary. Acta Mater. 2011, 59, 5989–5996. [Google Scholar] [CrossRef]
Figure 1.
Schematic representation of the reference system of the analysed samples, showing position of the sample’s reference system (a) and, position of selected area for SEM-EBSD analysis (b); 1—initial sample; 2—LD-TD section from the middle of the sample; 3—position of the investigated SEM-EBSD area; LD—longitudinal direction; TD—transverse direction; ND—normal direction.

Figure 2.
SEM-EBSD composite images for the UNS 32750 alloy in the initial structural state (sample 0): (a) phase distribution (γ-phase in red and δ-phase in blue); (b) grain size, shape and distribution for γ-phase; (c) grain size, shape and distribution for δ-phase; and, (d) Grain Reference Orientation Deviation (GROD) map distribution for both γ and δ phases.

Figure 3.
Samples with cracks on the lateral surface after upsetting: (a) Td = 1050 °C, ε = 35%; (b) Td = 1050 °C, ε = 40%; (c) Td = 1050 °C, ε = 45%; and, (d) Td = 1050 °C, ε = 50%.
Figure 3.
Samples with cracks on the lateral surface after upsetting: (a) Td = 1050 °C, ε = 35%; (b) Td = 1050 °C, ε = 40%; (c) Td = 1050 °C, ε = 45%; and, (d) Td = 1050 °C, ε = 50%.

Figure 4.
SEM-EBSD composite images for the UNS 32750 alloy deformed at 1050 °C by ε = 10%: γ and δ phase distribution (a); grain size, shape and distribution for γ-phase (b) and δ-phase (c); GROD map distribution for both γ and δ phases (d); ε = 20%: γ and δ phase distribution (e); grain size, shape and distribution for γ-phase (f) and δ-phase (g); GROD map distribution for both γ and δ phases (h); ε = 30%: γ and δ phase distribution (i); grain size, shape and distribution for γ-phase (j) and δ-phase (k); GROD map distribution for both γ and δ phases (l); ε = 35%: γ and δ phase distribution (m); grain size, shape and distribution for γ-phase (n) and δ-phase (o); and, GROD map distribution for both γ and δ phases (p).

Figure 5.
SEM-EBSD composite images for the UNS 32750 alloy deformed at 1300 °C by ε = 10%: γ and δ phase distribution (a); grain size, shape and distribution for γ-phase (b) and δ-phase (c); GROD map distribution for both γ and δ phases (d); ε = 20%: γ and δ phase distribution (e); grain size, shape and distribution for γ-phase (f) and δ-phase (g); GROD map distribution for both γ and δ phases (h); ε = 30%: γ and δ phase distribution (i); grain size, shape and distribution for γ-phase (j) and δ-phase (k); GROD map distribution for both γ and δ phases (l); ε = 40%: γ and δ phase distribution (m); grain size, shape and distribution for γ-phase (n) and δ-phase (o); GROD map distribution for both γ and δ phases (p); ε = 50%: γ and δ phase distribution (q); grain size, shape and distribution for γ-phase (r) and δ-phase (s); and, GROD map distribution for both γ and δ phases (t).

Figure 6.
Comparative representation of δ-phase maximum misorientation angle distribution for the UNS 32750 alloy deformed at 1050 °C (a) and deformed at 1300 °C (b).
Figure 6.
Comparative representation of δ-phase maximum misorientation angle distribution for the UNS 32750 alloy deformed at 1050 °C (a) and deformed at 1300 °C (b).

Figure 7.
Comparative representation of weight fraction of RX δ-phase grains distribution for the UNS 32750 alloy deformed at 1050 °C (a) and 1300 °C (b).
Figure 7.
Comparative representation of weight fraction of RX δ-phase grains distribution for the UNS 32750 alloy deformed at 1050 °C (a) and 1300 °C (b).


Table 1.
Parameters of the experimental program.
| Sample Number | Deformation Temperature, Td (°C) | Heating Temperature, Th (°C) | Maintenance Duration at Th, t (min) | Deformation Degree, ε (%) |
|---|---|---|---|---|
| 0 * | - | - | - | - |
| 1 | 1050 | 1070 | 20 | 5 |
| 2 * | 1050 | 1070 | 20 | 10 |
| 3 | 1050 | 1070 | 20 | 15 |
| 4 * | 1050 | 1070 | 20 | 20 |
| 5 | 1050 | 1070 | 20 | 25 |
| 6 * | 1050 | 1070 | 20 | 30 |
| 7 *# | 1050 | 1070 | 20 | 35 |
| 8 # | 1050 | 1070 | 20 | 40 |
| 9 # | 1050 | 1070 | 20 | 45 |
| 10 # | 1050 | 1070 | 20 | 50 |
| 11 | 1300 | 1320 | 20 | 5 |
| 12 * | 1300 | 1320 | 20 | 10 |
| 13 | 1300 | 1320 | 20 | 15 |
| 14 * | 1300 | 1320 | 20 | 20 |
| 15 | 1300 | 1320 | 20 | 25 |
| 16 * | 1300 | 1320 | 20 | 30 |
| 17 | 1300 | 1320 | 20 | 35 |
| 18 * | 1300 | 1320 | 20 | 40 |
| 19 | 1300 | 1320 | 20 | 45 |
| 20 * | 1300 | 1320 | 20 | 50 |
* Samples for which the results of microstructural analysis are presented; # Samples in which, following the deformation, micro-cracks/cracks were observed on the side surface.
© 2020 by the authors. Licensee MDPI, Basel, Switzerland. This article is an open access article distributed under the terms and conditions of the Creative Commons Attribution (CC BY) license (http://creativecommons.org/licenses/by/4.0/).
Share and Cite
MDPI and ACS Style
Angelescu, M.L.; Cojocaru, E.M.; Șerban, N.; Cojocaru, V.D. Evaluation of Hot Deformation Behaviour of UNS S32750 Super Duplex Stainless Steel (SDSS) Alloy. Metals 2020, 10, 673. https://doi.org/10.3390/met10050673
AMA Style
Angelescu ML, Cojocaru EM, Șerban N, Cojocaru VD. Evaluation of Hot Deformation Behaviour of UNS S32750 Super Duplex Stainless Steel (SDSS) Alloy. Metals. 2020; 10(5):673. https://doi.org/10.3390/met10050673
Chicago/Turabian StyleAngelescu, Mariana Lucia, Elisabeta Mirela Cojocaru, Nicolae Șerban, and Vasile Dănuț Cojocaru. 2020. "Evaluation of Hot Deformation Behaviour of UNS S32750 Super Duplex Stainless Steel (SDSS) Alloy" Metals 10, no. 5: 673. https://doi.org/10.3390/met10050673
Note that from the first issue of 2016, this journal uses article numbers instead of page numbers. See further details here.