Experimental Investigation on Small-Strain Stiffness of Marine Silty Sand


1
Institute of Geotechnical Engineering, Nanjing Tech University, Nanjing 210009, China
2
Civil Engineering Department, Xi’an Jiaotong-Liverpool University, Suzhou 215123, China
3
Key Laboratory of Geomechanics and Geotechnical Engineering, Institute of Rock and Soil State Mechanics, Chinese Academy of Sciences, Wuhan 430071, China
*
Author to whom correspondence should be addressed.
J. Mar. Sci. Eng. 2020, 8(5), 360; https://doi.org/10.3390/jmse8050360
Submission received: 12 April 2020
/
Revised: 13 May 2020
/
Accepted: 14 May 2020
/
Published: 21 May 2020
(This article belongs to the Special Issue New Advances in Marine Engineering Geology)
Abstract
:The significance of small-strain stiffness (Gmax) of saturated composite soils are still of great concern in practice, due to the complex influence of fines on soil fabric. This paper presents an experimental investigation conducted through comprehensive bender element tests on Gmax of marine silty sand. Special attention is paid to the influence of initial effective confining pressure (), global void ratio (e) and fines content (FC) on Gmax of a marine silty sand. The results indicate that under otherwise similar conditions, Gmax decreases with decreasing e or FC, but decreases with increasing FC. In addition, the reduction rate of Gmax with e increasing is not sensitive to , but obviously sensitive to changes in FC. The equivalent skeleton void ratio (e*) is introduced as an alternative state index for silty sand with various FC, based on the concept of binary packing material. Remarkably, the Hardin model is modified with the new state index e*, allowing unified characterization of Gmax values for silty sand with various FC, e, and . Independent test data for different silty sand published in the literature calibrate the applicability of this proposed model.
1. Introduction
The small-strain stiffness Gmax of marine deposits plays a fundamental role in liquefaction potential assessment, site seismic response analyses, and the design of marine structures (e.g., pipeline, immersed tunnel, caisson foundation) subjected to storm or earthquake loading [1,2,3,4]. Generally, Gmax is defined as the stiffness of soil at small-strain level of 10−6, where the soil properties are considered to exhibit pure elasticity. Hardin and his co-authors [5,6,7] conducted comprehensive studies on Gmax of clean, uniform, quartz sands through well-controlled resonant column tests, and these investigations indicated that the global void ratio e and initial effective confining pressure are considered to be the most important ones among the various factors that may influence Gmax. Similar results were also presented by Seed et al. (1986) [8], Youn et al. (2008) [9], Yang and Gu (2013) [10], and Payan et al. (2016) [1].
While a large number of attempts have been carried out to characterize Gmax for clean sands, systematic studies on silty sand with different fines content (FC) are relatively few, despite the fact that naturally deposited sands are not clean, but contain a certain amount of fine particles [11,12,13,14]. A systematic study was first implemented by Iwasaki and Tatsuoka (1977) [11] to study the Gmax influence factors of Iruma silty sand. Their results showed that Gmax decreased with increasing FC, and at given e and , Gmax exhibited a decreasing trend as uniformity coefficient Cu increasing. The state parameter of skeleton void ratio esk was introduced by Wichtmann et al. (2015) [12] to uniquely characterize Gmax of silty sand. However, as discussed by Rahman et al. (2008) [13] and Yang and Liu (2016) [14], the application of esk might contribute to underestimation of Gmax at high FC. Goudarzy et al. (2017) [15] developed a new Gmax prediction method based on the binary packing state. A series of bender element tests has been conducted on Ottawa sand with FC = 5%–20% by Salgado et al. (2000) [16], the test results revealed that Gmax decreases dramatically with the increasing of FC at a constant relative density and . Salgado et al. (2000) [16] introduced a state parameter ψ to estimate Gmax in the framework of critical state soil mechanics by taking account of the stress dependence. However, compared with the Goudarzy et al. (2017) method [15], the introduction of state parameter ψ requires determination of the critical state line, thus complicating the application of this method [16].
Many natural silty sands contain a significant amount of fines. This is particularly true for marine deposits, which in most cases behave as composite soils. Therefore, study is needed on whether the Gmax prediction method established for clean sand is also applicable to that of marine silty sand. The main purpose of this study is to explore how FC, initial effective confining pressure (), and global void ratio (e) affect the Gmax of marine silty sand and whether the Gmax of silty sand can be predicted within the established framework based on clean sand. In addition, the influence of parameters in the Hardin model for Gmax prediction was discussed in a traditional way. In particular, the binary packing state concept [17,18,19] is implemented to establish the modified Hardin model for evaluation of Gmax of marine silty sand. For this purpose, a series of bender element tests were conducted on marine silty sand with FC = 0%~30%.
2. Materials and Methods
2.1. Testing Apparatus
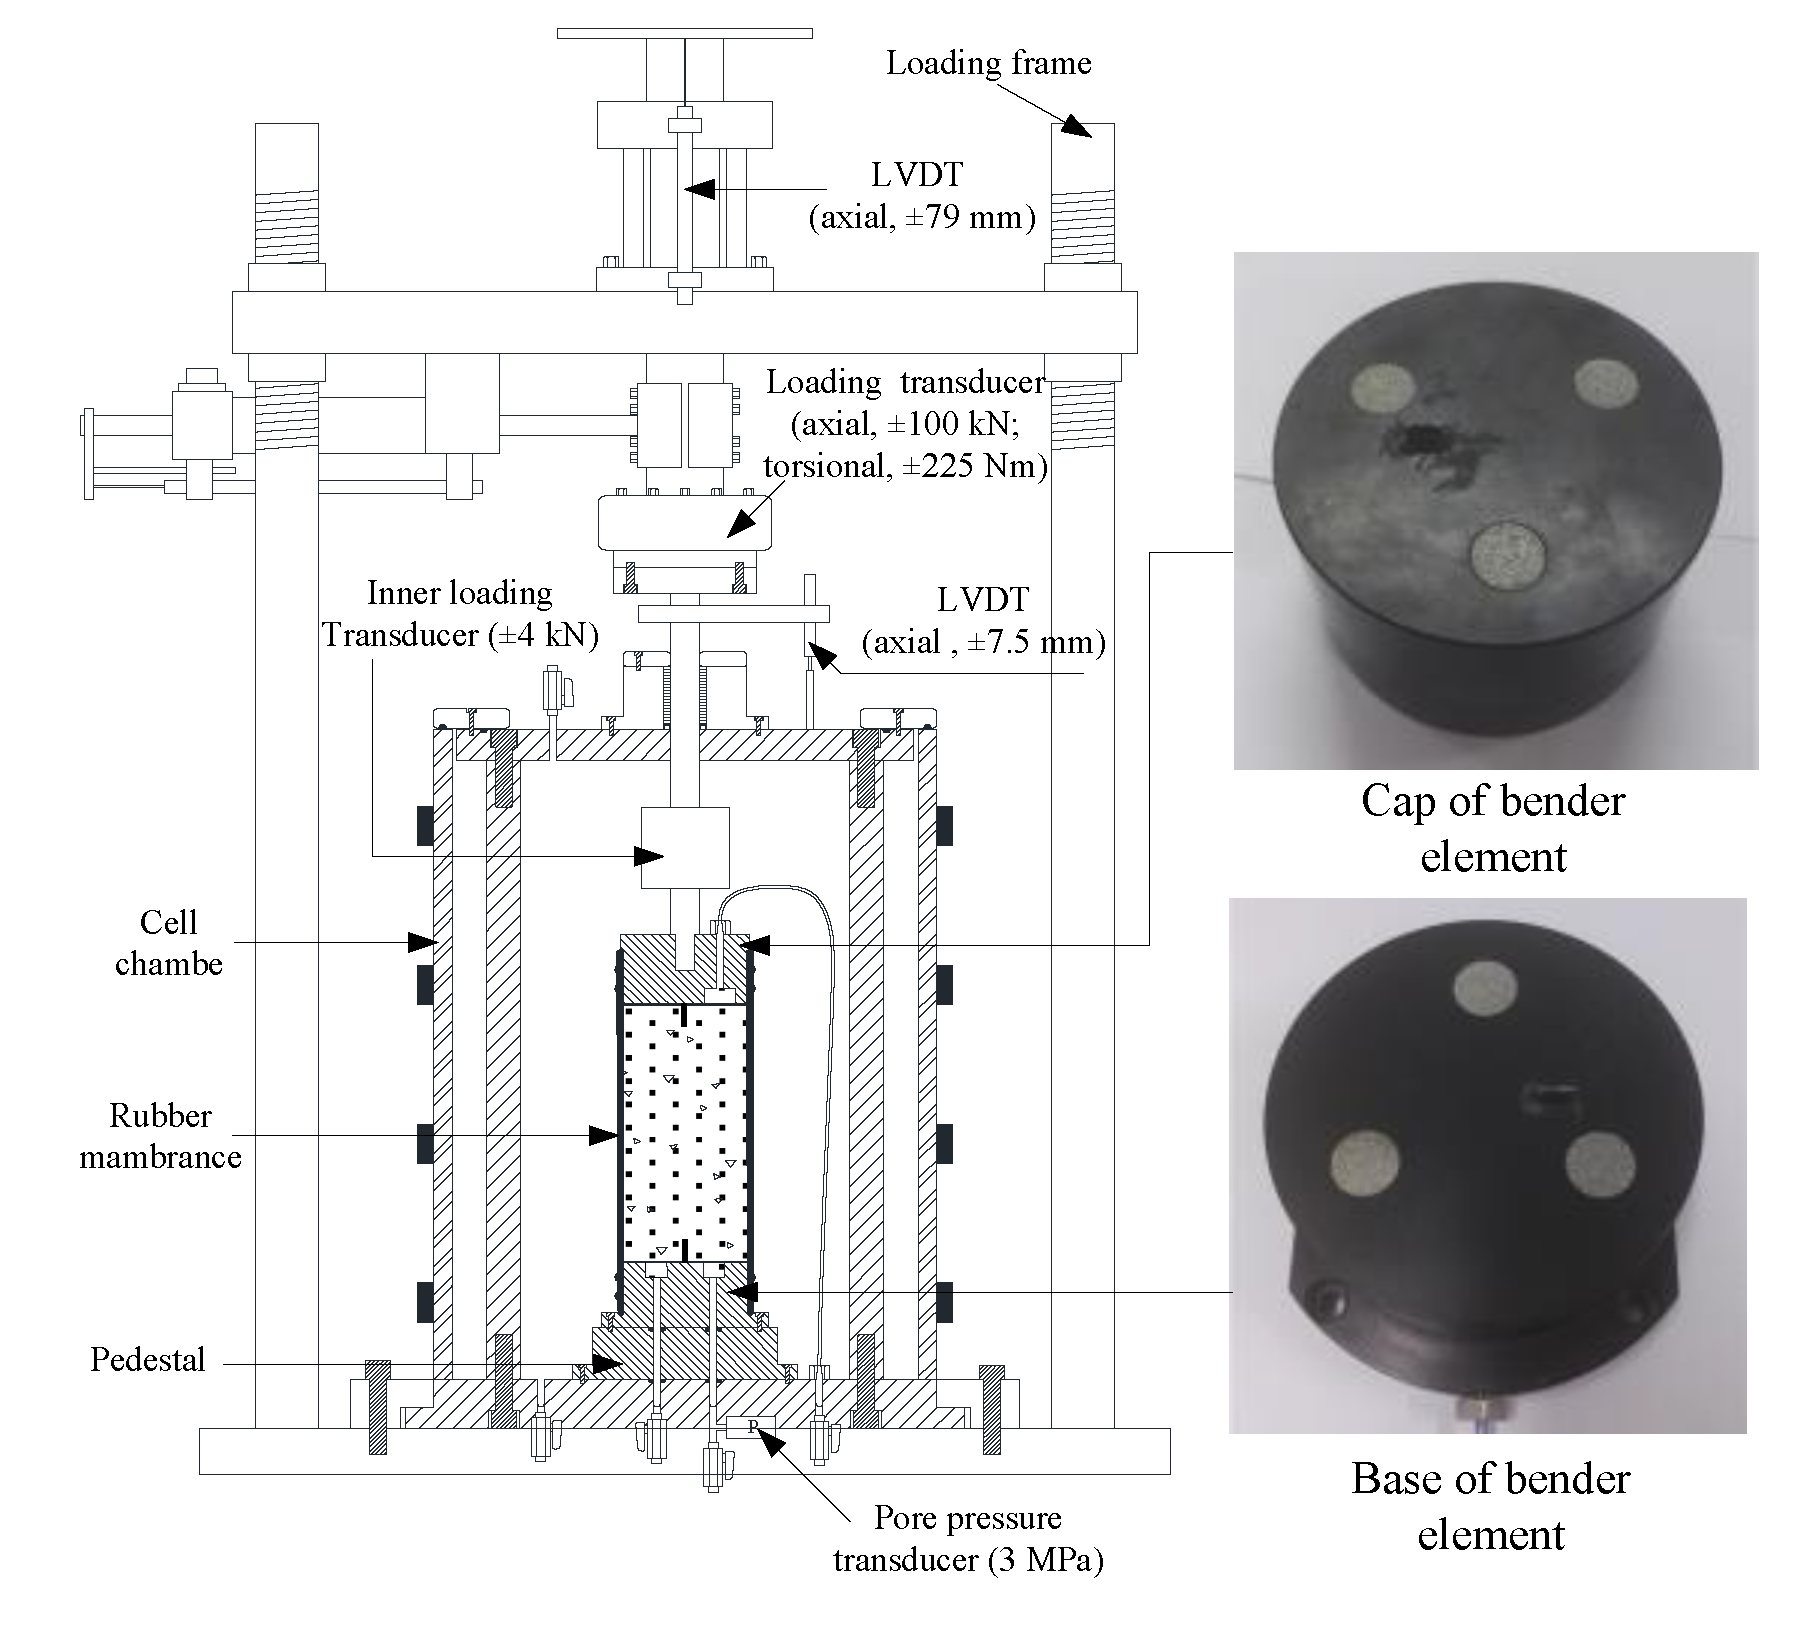
The measurement of shear wave velocity (Vs) or the associated Gmax was performed using a pair of piezoceramic bender elements (BE) installed in the cell chamber of a dynamic hollow/solid cylinder apparatus (HCA) [20], as shown in Figure 1. For each of the BE tests, a set of sinusoid signals from 1 to 40 kHz, rather than a single signal, was used as the excitation, and the received signals corresponding to these excitation frequencies were examined in whole to better identify the travel time of the shear wave, then, Gmax can be calculated as following [16].
2.2. Tested Materials
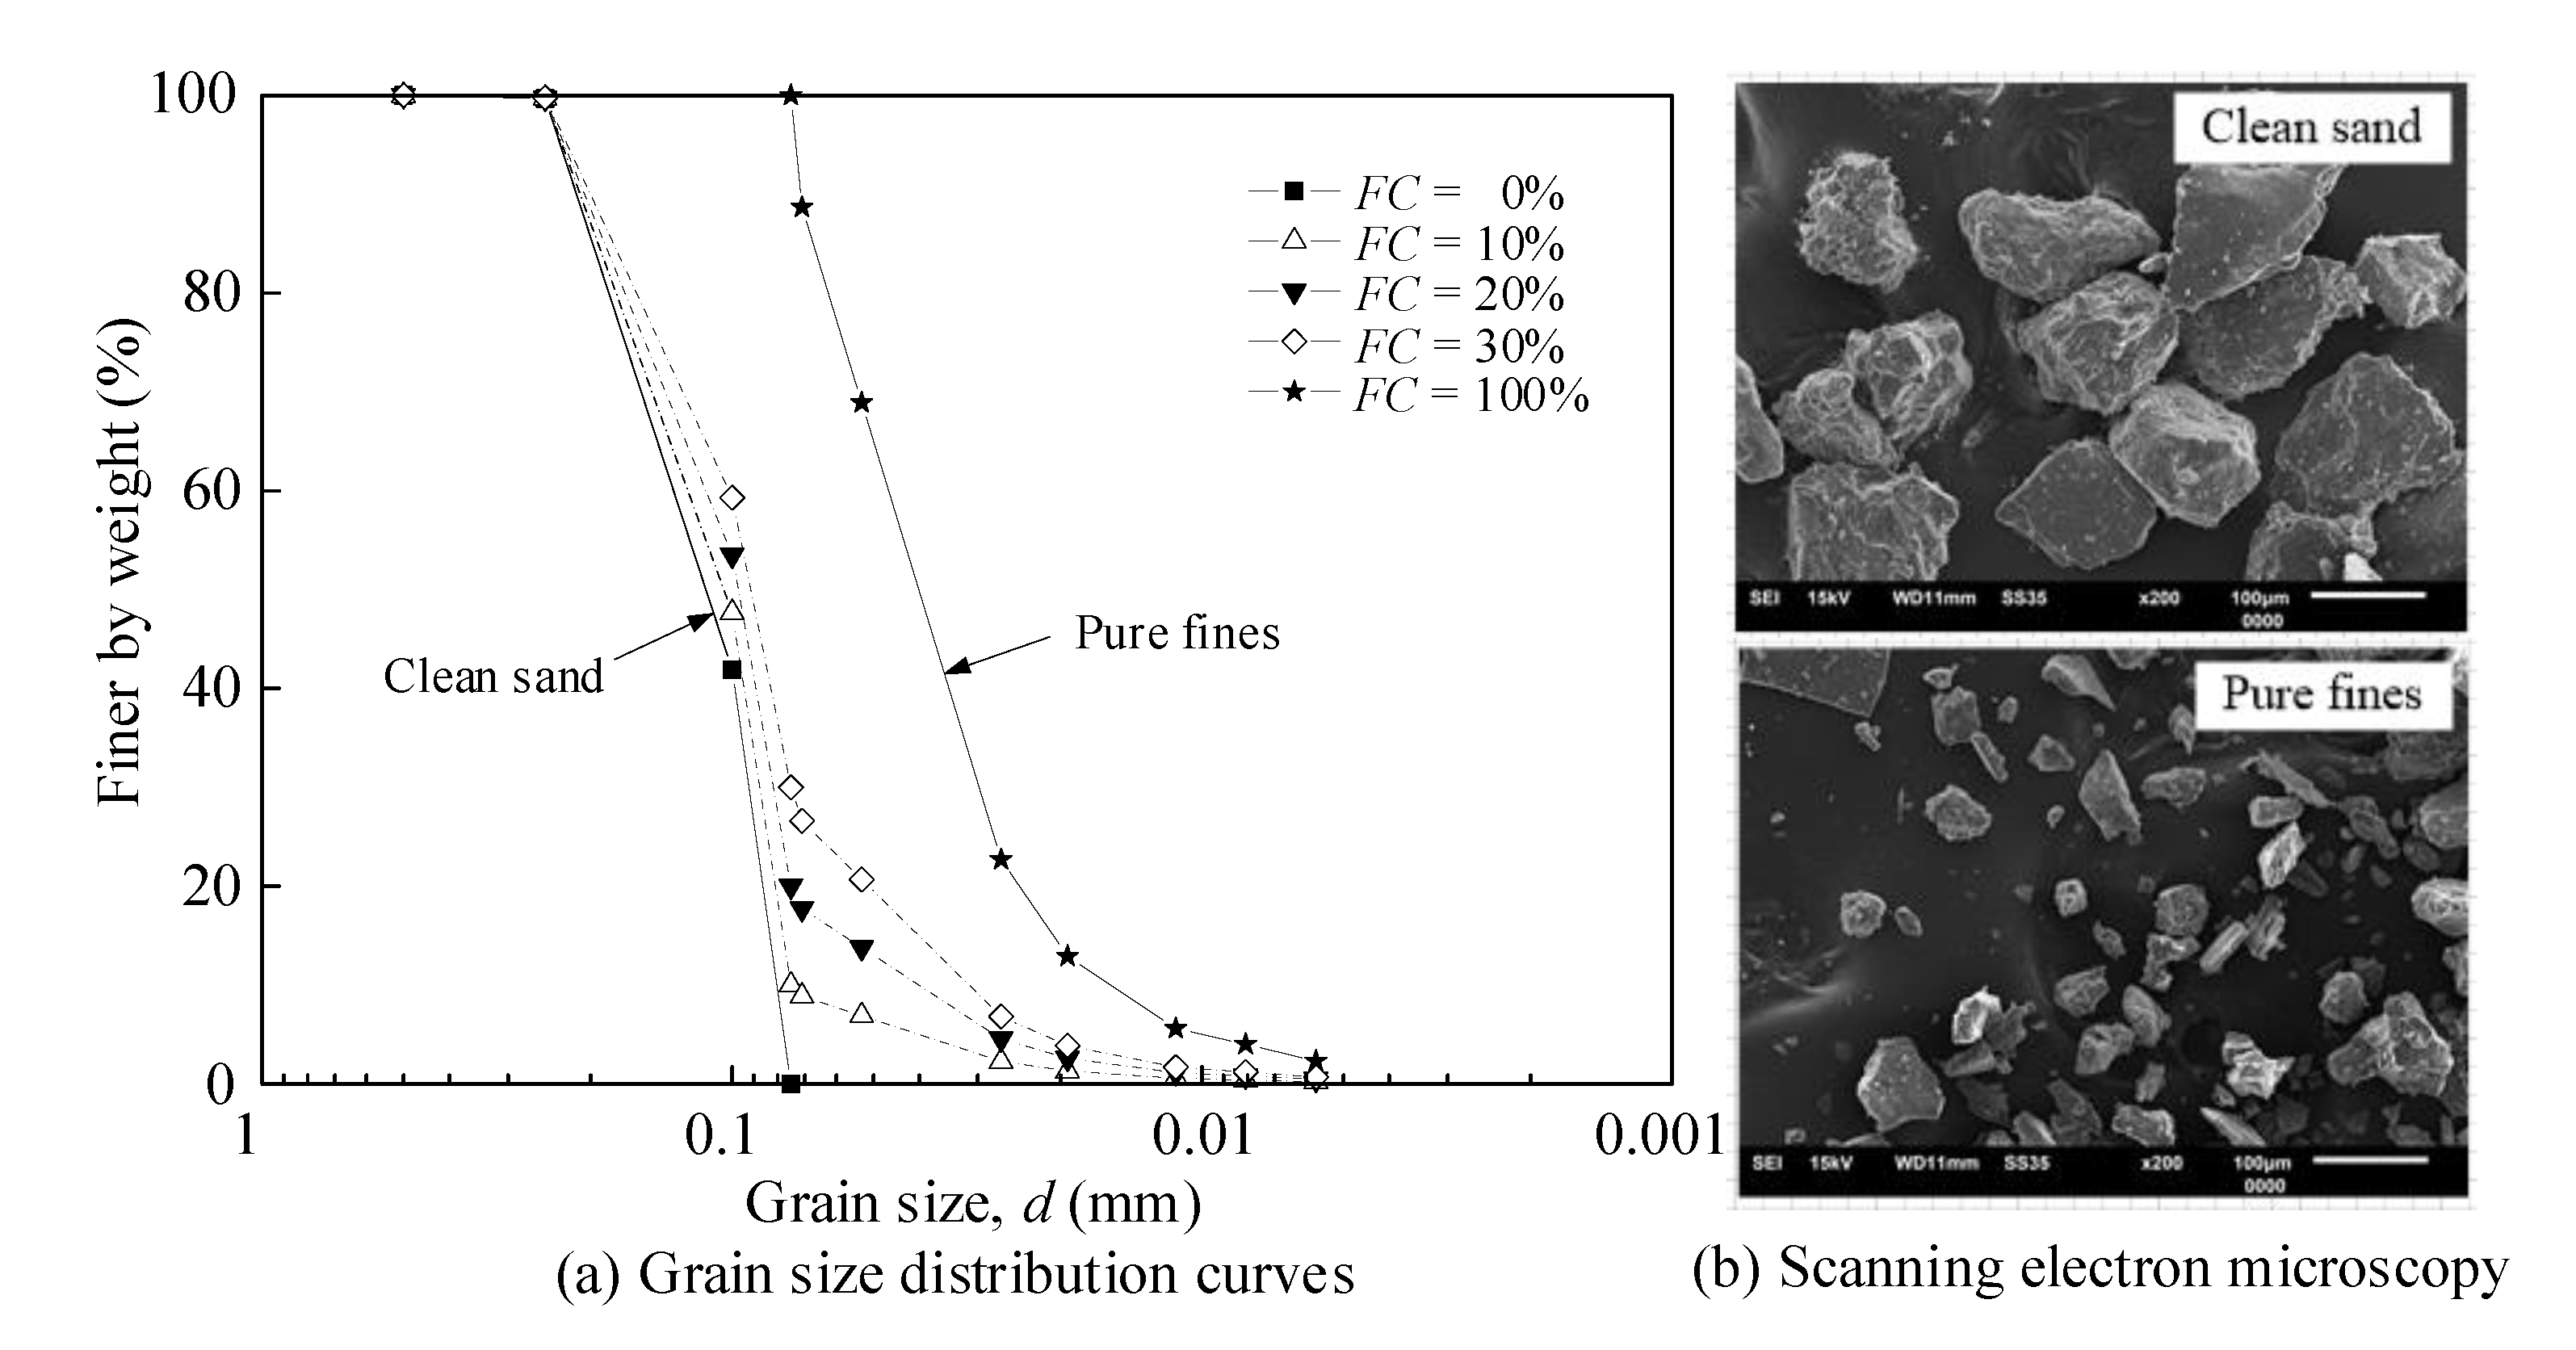
Nantong marine sand was used as clean sand and Nantong marine silt with sub-angular particles was used as pure fines to investigate the effects of FC on the Gmax of silty sand. Figure 2 shows the grain size distributions and scanning electron microscopy image of clean sand and pure fines, and the material properties are given in Table 1. Although the ASTM D4253 [21] and D4254 [22] test methods for the determination of minimum and maximum void ratios (emin and emax) are applicable to silty sand with FC < 15%, these methods were also used for silty sands with FC ≥ 15% in order to provide consistent measurements [23]. The clean sand was mixed with non-plastic Nantong silt (pure fines) corresponding to various FC from 0% to 30% by mass. The emin and emax of the silty sand are shown in Table 2.
2.3. Specimen Preparation, Saturation and Consolidation
The bender element tests were conducted on specimens with 100 × 200 mm (diameter × height), and all specimens of the tested silty sands were prepared by the moist tamping method; considering this method can ensure a very wide range of e for the specimens and contribute to preventing segregation and enhancing uniformity [24], all specimens of the tested silty sands were prepared by the moist tamping method using an under-compaction procedure. All samples were tested under saturated rather than other conditions, as the former is more practical [14]; in order to saturate the specimen fully, carbon dioxide flushing from bottom to top of the specimen was applied firstly; then, de-aired water flushing followed immediately [19]; finally, back pressure saturation at the back pressure of 400 kPa was used to guarantee Skempton’s B-value greater than 0.95 [25]. After saturation, all the specimens were isotropically consolidated.
2.4. Testing Program and Process
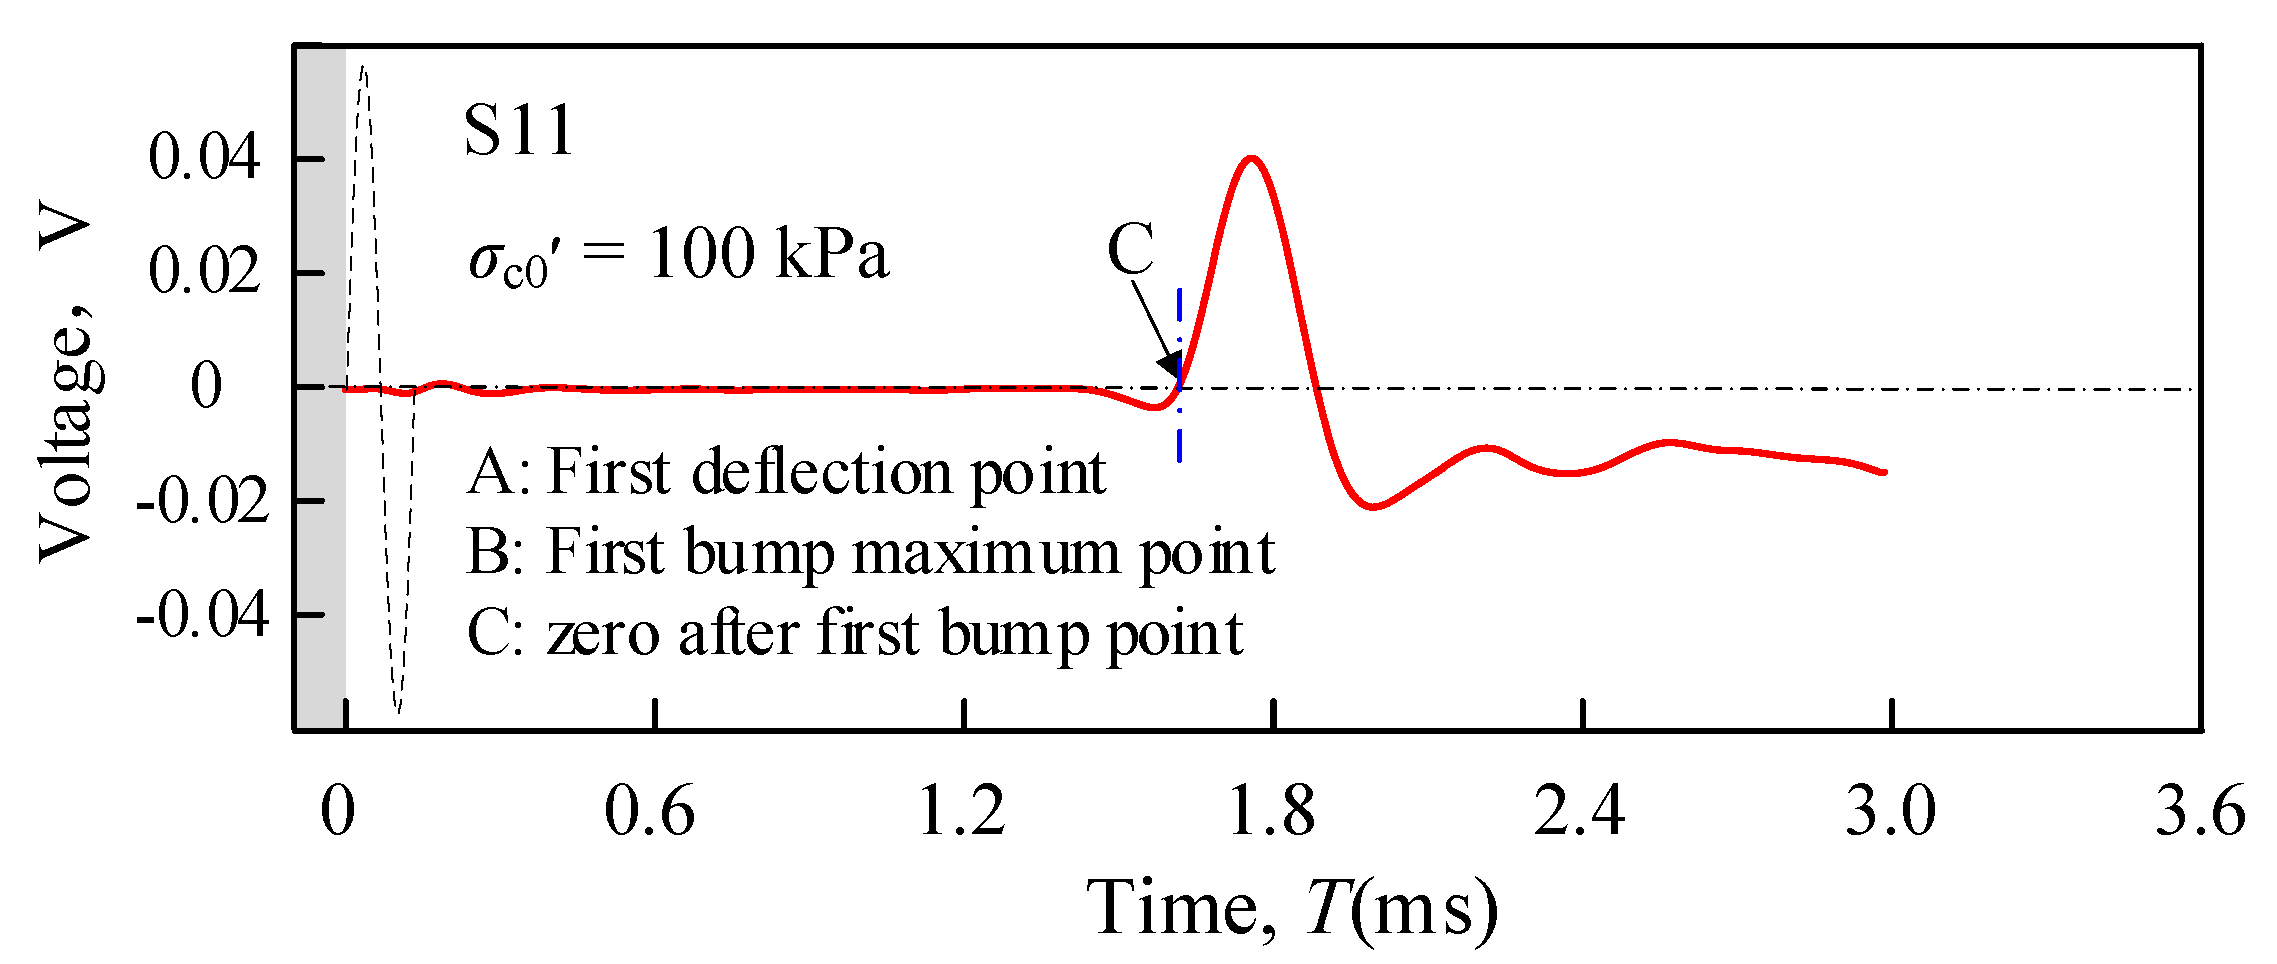
For the bender element tests, the 10 kHz excitation signal was found to consistently yield a clear arrival of the shear wave for both clean sand and silty sand with various FC, which is consistent with the test results of Yang and Liu (2016) [14]. Figure 3 presents a set of typical received signals captured from the bender element in different silty sand specimens. The first arrival time method was introduced to determine the shear wave travel time in this study [26,27,28], and the zero after first bump point corresponds to Point C marked in Figure 3, suggested by Yoo et al. (2018) [29] and Lee and Santamarina (2005) [30], was selected as the shear wave arrival time.
In order to investigate the influences of FC, e, and on Gmax of silty sand, FC = 0, 10, 20, and 30% were considered, and three samples were prepared at different e for silty sand at a fixed FC. The Gmax were measured subjected to at 100, 200, 250, 300, and 400 kPa in five stages, Table 3 details the test conditions.
3. Results and Discussion
3.1. Factors Influencing Maximum Shear Modulus
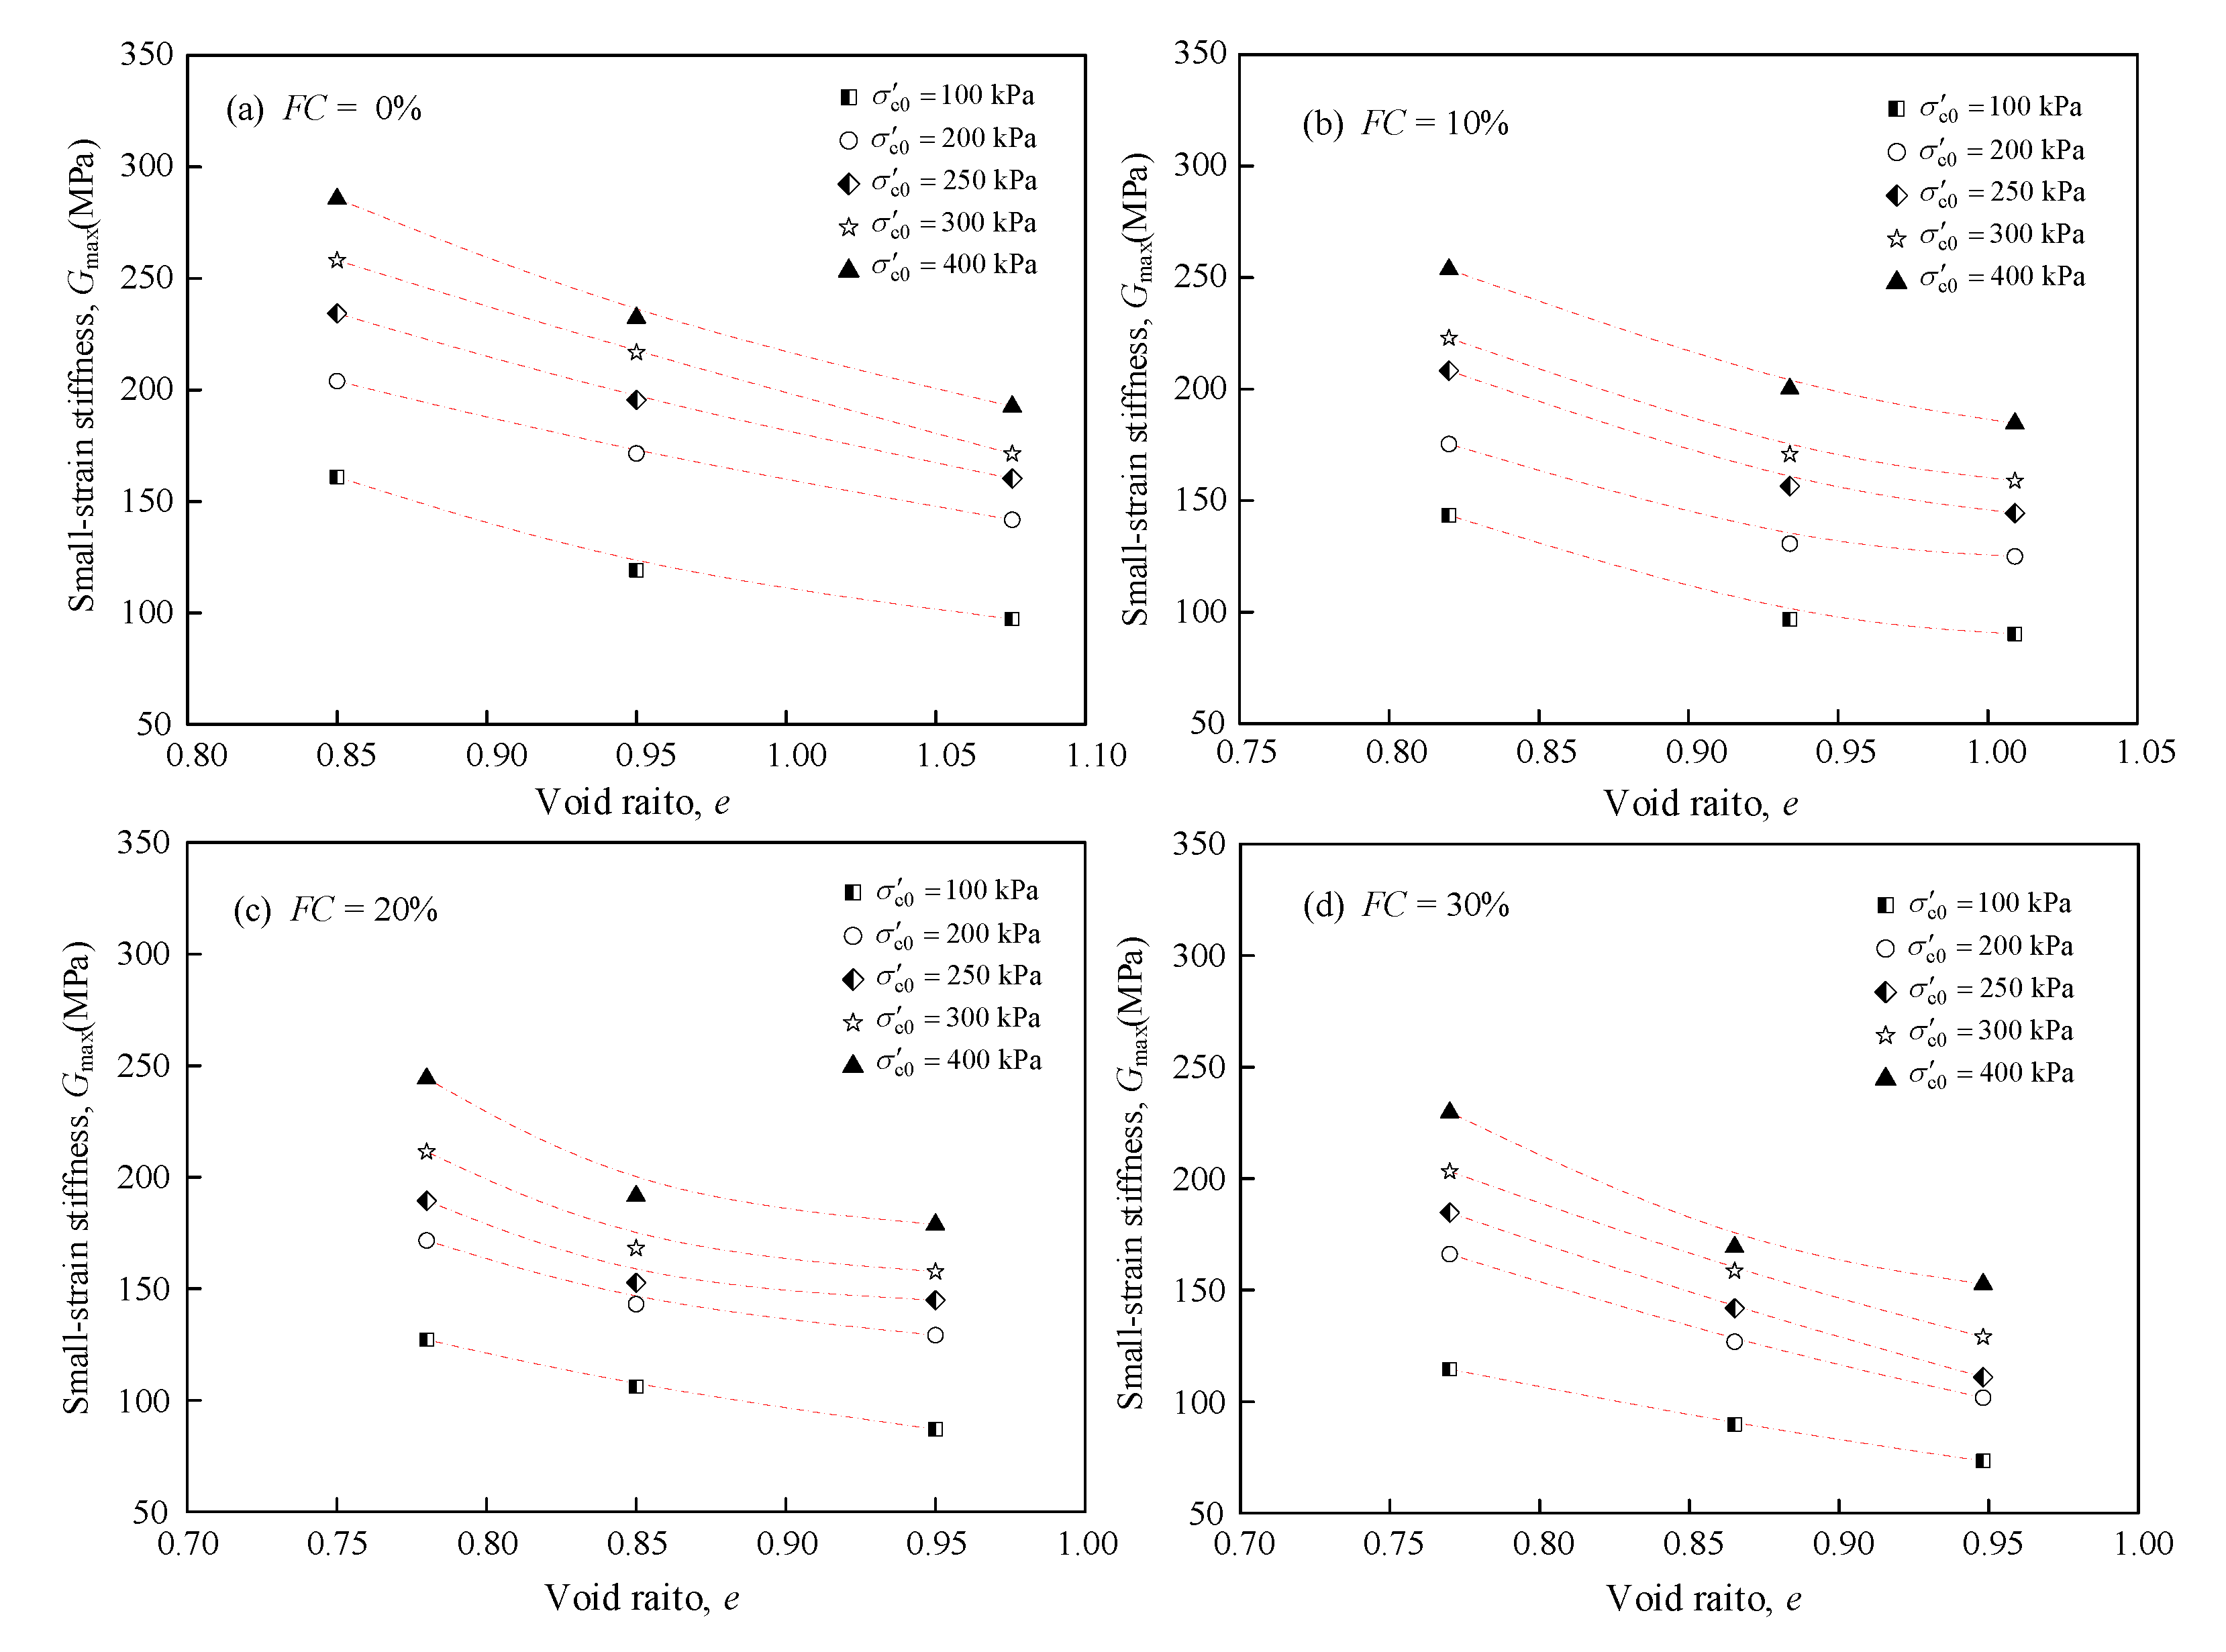
Figure 4 present the comprehensive view of the measured Gmax values of silty sand with different FC, e, and . A remarkable finding from the figure is that FC, e, or all has a significant impact on Gmax, the increase of e will significantly reduce Gmax for silty sand at different FC and . Furthermore, in each plot, the five trend lines describe the effect of e on Gmax, and the range of trend lines revealed the influence of varying . Under otherwise similar conditions, Gmax decreases with increasing e or FC, but increases with increasing FC. The existing explanation that: as e increases, the dense state changes from compact to loose, which reduces the amount of force chain between particles, contribute to a attenuation in the stiffness of silty sand; while at a fixed e, the amount of sand grains composed of soil skeleton is constant as FC increases, a certain amount of grains participate in the composition of soil skeleton, and the grain contact area increases, eventually leading to an increase in Gmax. In addition, the relationship between Gmax and e is insensitive to , but obviously sensitive to FC. According to Yang and Liu (2016) [14], there is a linear function relationship between Gmax with e for Toyoura silty sand, and the void ratio dependence appears to be similar to silty sand with different FC. Incorporating the test results in the study, an obvious soil-specific relationship between Gmax and e can be found, and a more comprehensive study needs to be conducted for addressing this concern.
For silty sand at a specific FC, given that Gmax is dependent on both e and , e must be taken into account when quantifying the impact of . Therefore, a void ratio function F(e) was introduced to characterize the influence of e on Gmax:
where c is a soil-specific fitting parameter dependent on the particle shape—2.97 for angular particles and 2.17 for rounded particles [5,15]. Considering that the particles of marine silty sand are angular (Figure 2b), c = 2.97 was used. An empirical relation for Gmax prediction, incorporating material, particle shape, e and , was proposed originally by Hardin and Black (1966) [5], then a more general form was developed based on the research of Iwasaki and Tatsuoka (1977) [11], Seed et al. (1986) [8], Youn et al. (2008) [9], Yang and Gu (2013) [10], Wichtmann et al. (2015) [12], and Payan et al. (2016) [1]:
where A = material constant depends on soil type; Pa = atmospheric pressure (≈100 kPa); n = stress exponent, the values of n typically distribute between 0·35 and 0·6 for silty sand. Iwasaki and Tatsuoka (1977) [11] and Yang and Liu (2016) [14] present a common phenomenon that the stress exponent n is a soil-specific constant.
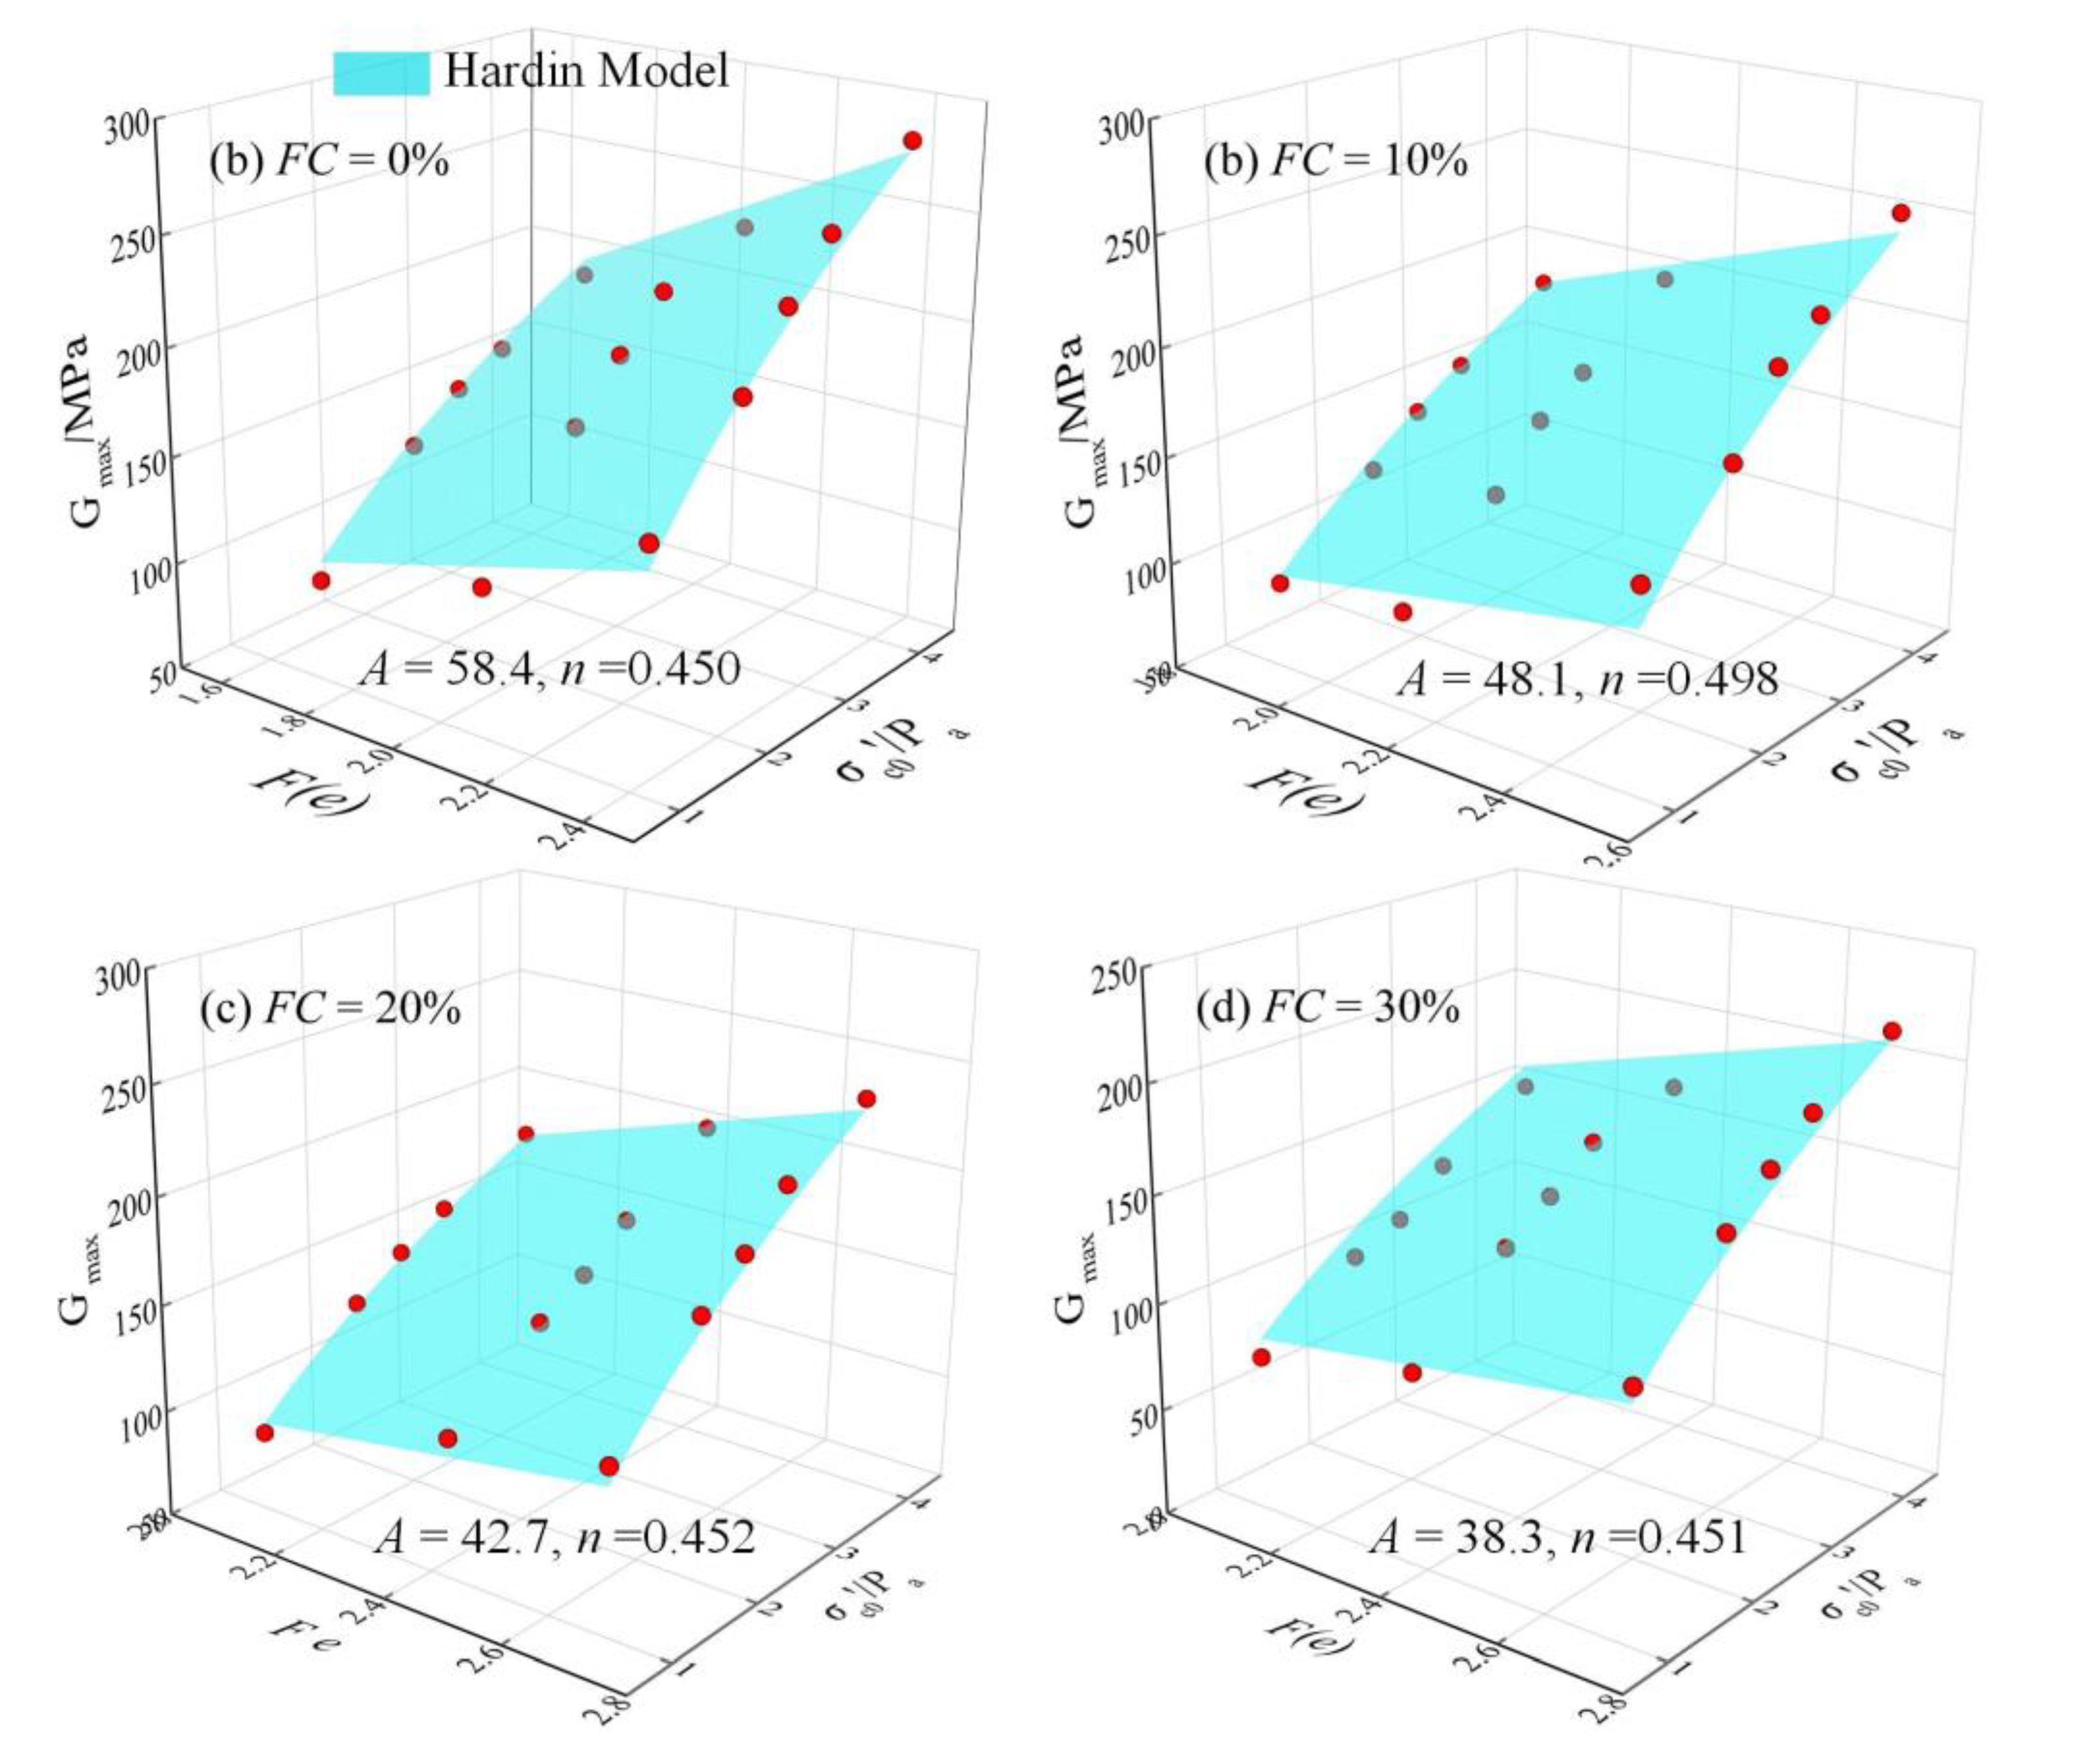
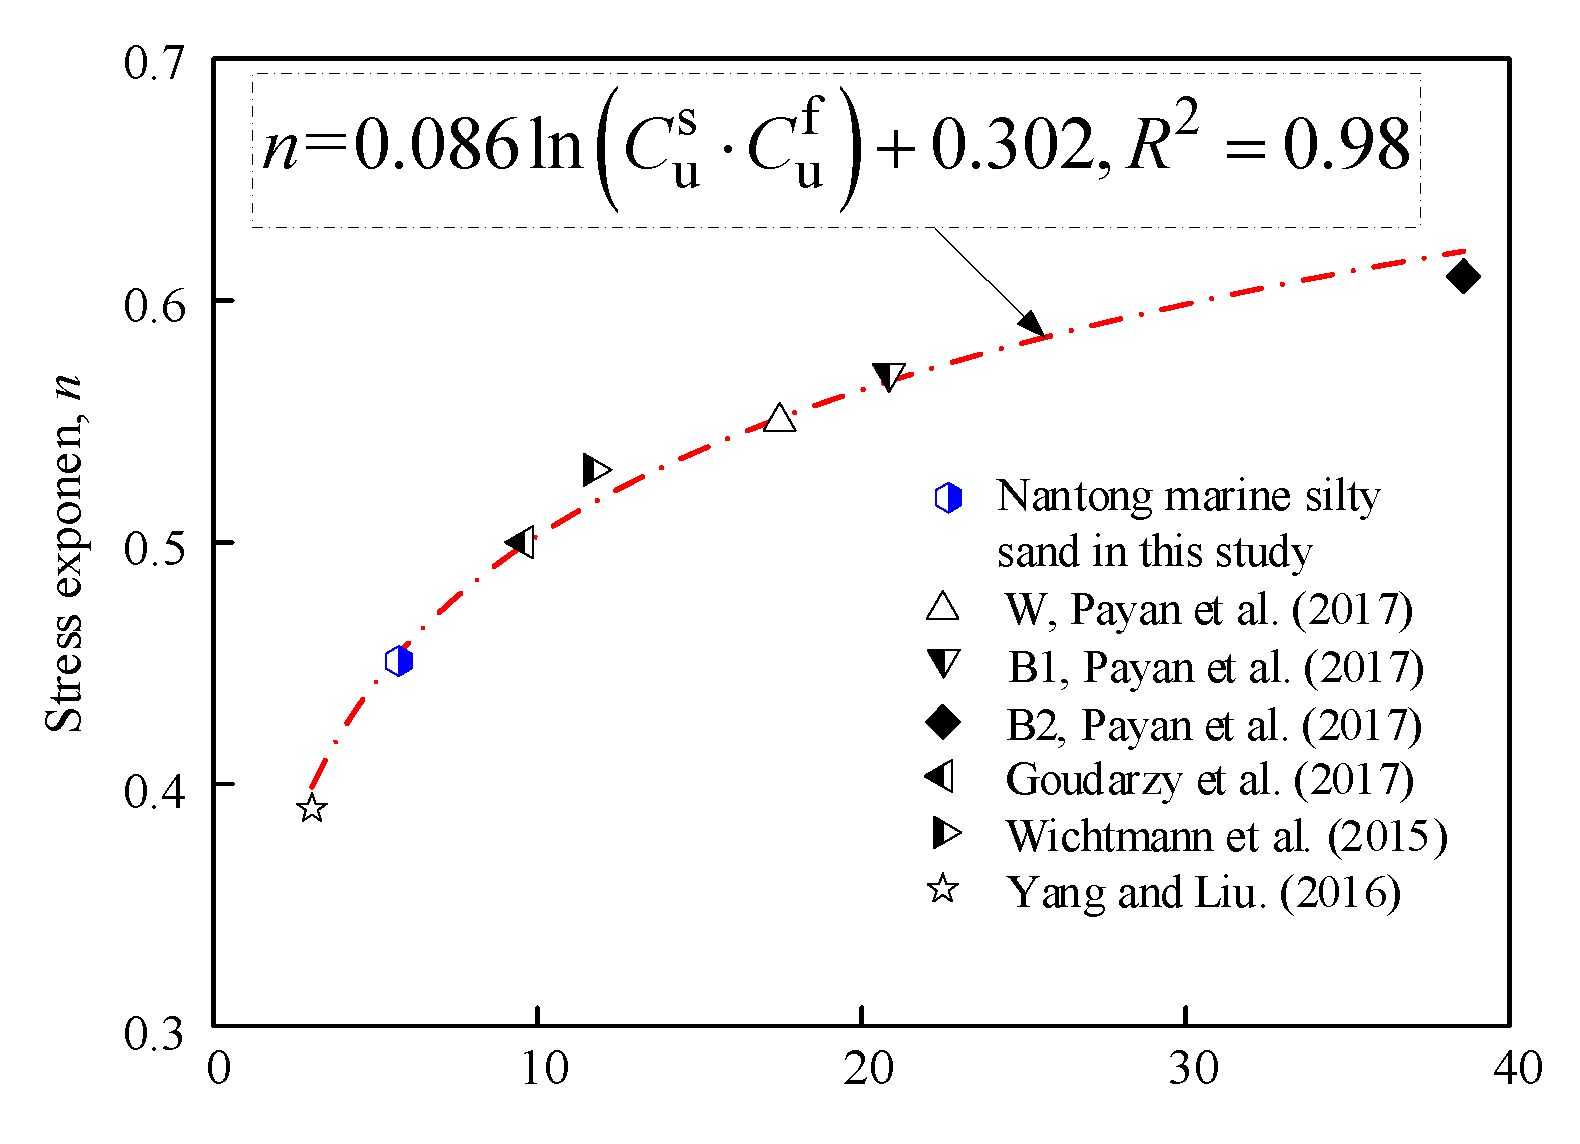
In order to explore the distribution of A and n values, the Gmax values of silty sand are plotted as function of /Pa and F(e) in Figure 5. Under otherwise identical conditions, Gmax increases with increasing in normalized effective confining stress /Pa and void ratio function F(e). In addition, R-square of the Hardin model are all greater than 0.9, which means that the Hardin model can characterize the influence of e and on Gmax of silty sand at a specific FC well. However, for a specific silty sand, the exponent n is insensitive to FC and e, which is consistent with the results demonstrated by Iwasaki and Tatsuoka (1977) [11] and Yang and Liu (2016) [14]. The exponent n, reflecting the incremental rate of Gmax due to the enhancement of , is highly dependent on the types of silty sand and present as a soil-specific constant. Using the generalized nonlinear regression model for the test data of marine silty sand tested in this study and six silty sands compiled from the literature, the soil-specific constant n is closely related to the synthesizing material parameter of sandy soils (as shown in Figure 6). It is seen that n increases with the increase of , indicating a logarithmic function relation. The soil-specific constant n can be determined empirically by the following equation:
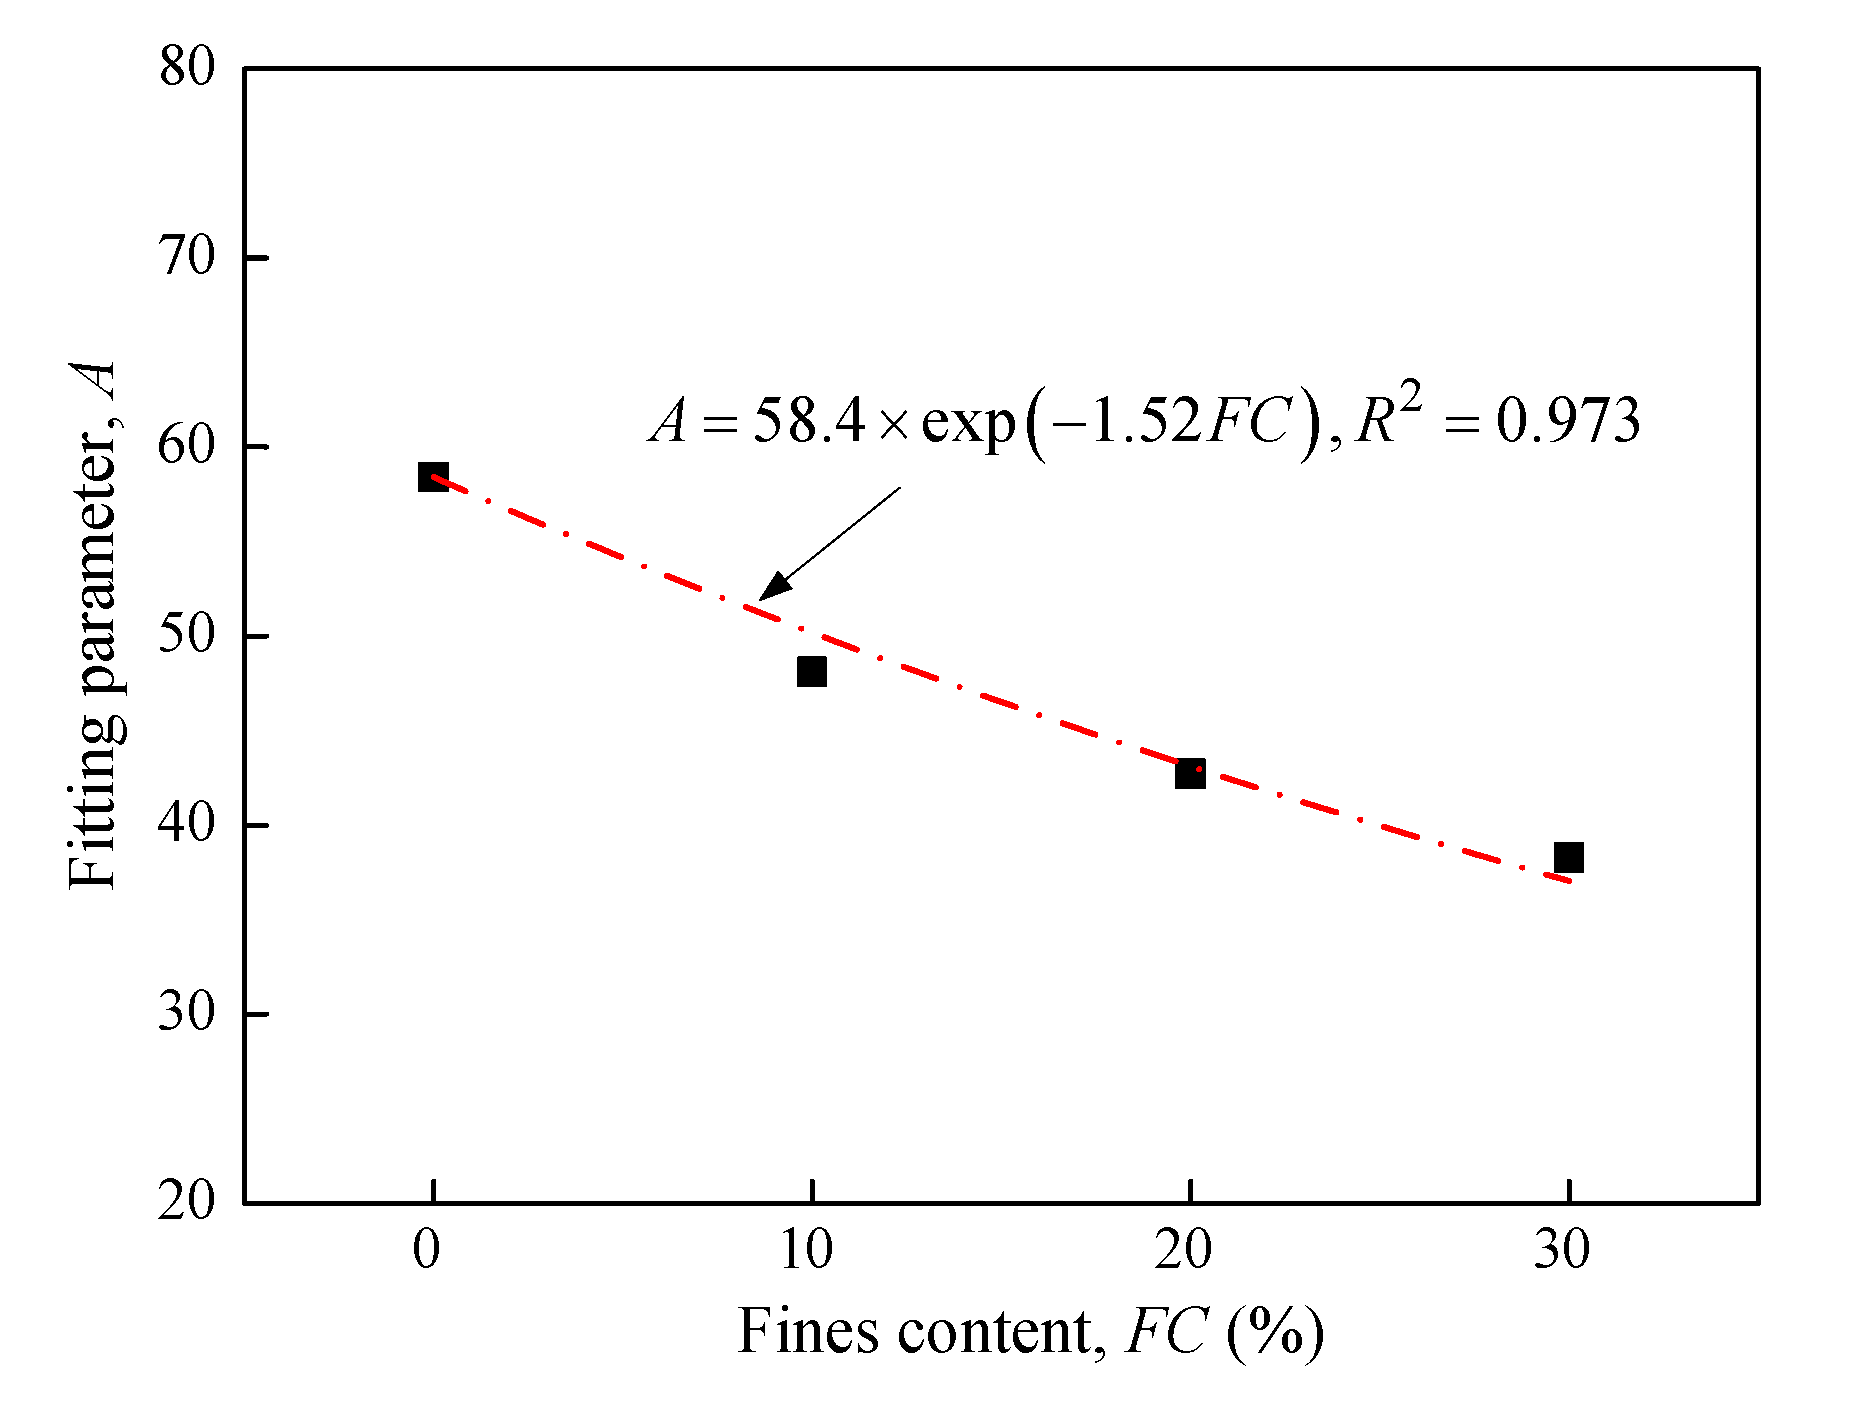
It is worth noting that the addition of FC will obviously alter the material-specific fitting parameter A, which describe the increment ratio of Gmax/F(e) caused by the increasing of (/Pa)n (Figure 7), and a fairly good exponential relationship can be given as following:
where, the value of A0 represents the parameter A for clean sand (FC = 0%) in the Hardin model, m is the fitting parameter and the value of m is −1.52 for Nantong silty sand. It is worth noting that care should be exercised when the Hardin model is directly used for predicting the Gmax of silty sand, considering the sensitivity of the A to FC. Therefore, a modified Hardin model needs to be explored for unified charactering Gmax of silty sand with different FC.
3.2. Modified Hardin Model Based on Binary Packing Model
The binary packing state concept [17,31] is adopted herein to interpret the behavior of granular soil. For the binary packing system, the FCth has been introduced to distinguish the difference of “coarse-dominated behavior” from “fines-dominated behavior” for silty sand with various FC [32,33]. The FCth can be determined empirically by semi-experience formula [13]:
where is the particle size disparity ratio, is the grain size at 10% finer for clean sand, is the grain size at 50% finer for pure fines.
As FC increases, fines may come in between the contact of sand grains and participate in the force chain. Thus, the effect of fines on the force transfer mechanism is considered by introducing an alternative equivalent skeleton void ratio e* [31,34], as defined by Equation (7).
The physical meaning of b is the fraction of fines that participate in the force chain between soil grains and 0 ≤ b ≤ 1. Equation (7) is based on coarse-dominated behavior soil fabric, this meaning b requires FC < FCth. Rahman and his co-authors developed a semi-empirical relation to predict the parameter b [13,15,35]:
where r = 1/χ, and k = 1 − r0.25, μ and nb are the fitting parameters which depend on the specific soil type. The experimental results, presented by Lashkari (2014), suggested that a μ of 0.30 and nb of 1.0 satisfy a large dataset and were later verified with new datasets. Goudarzy et al. (2016) acknowledged that these parameters might vary for different types of soil, the μ and nb value were optimized in Equation (8) to obtain the maximum value of R2. It has been well recognized that e*, instead of e, can well capture various aspects of the mechanical behavior of silty sand [36]. Notably, the binary packing state parameter has been introduced to uniquely quantify the critical state line, steady state line, and liquefaction resistance, etc. of the silty sand with different FC. Hence, an effort has been made to investigate whether e* determined by Rahman’s approach can better characterize Gmax by replacing e with e* in Equation (3):
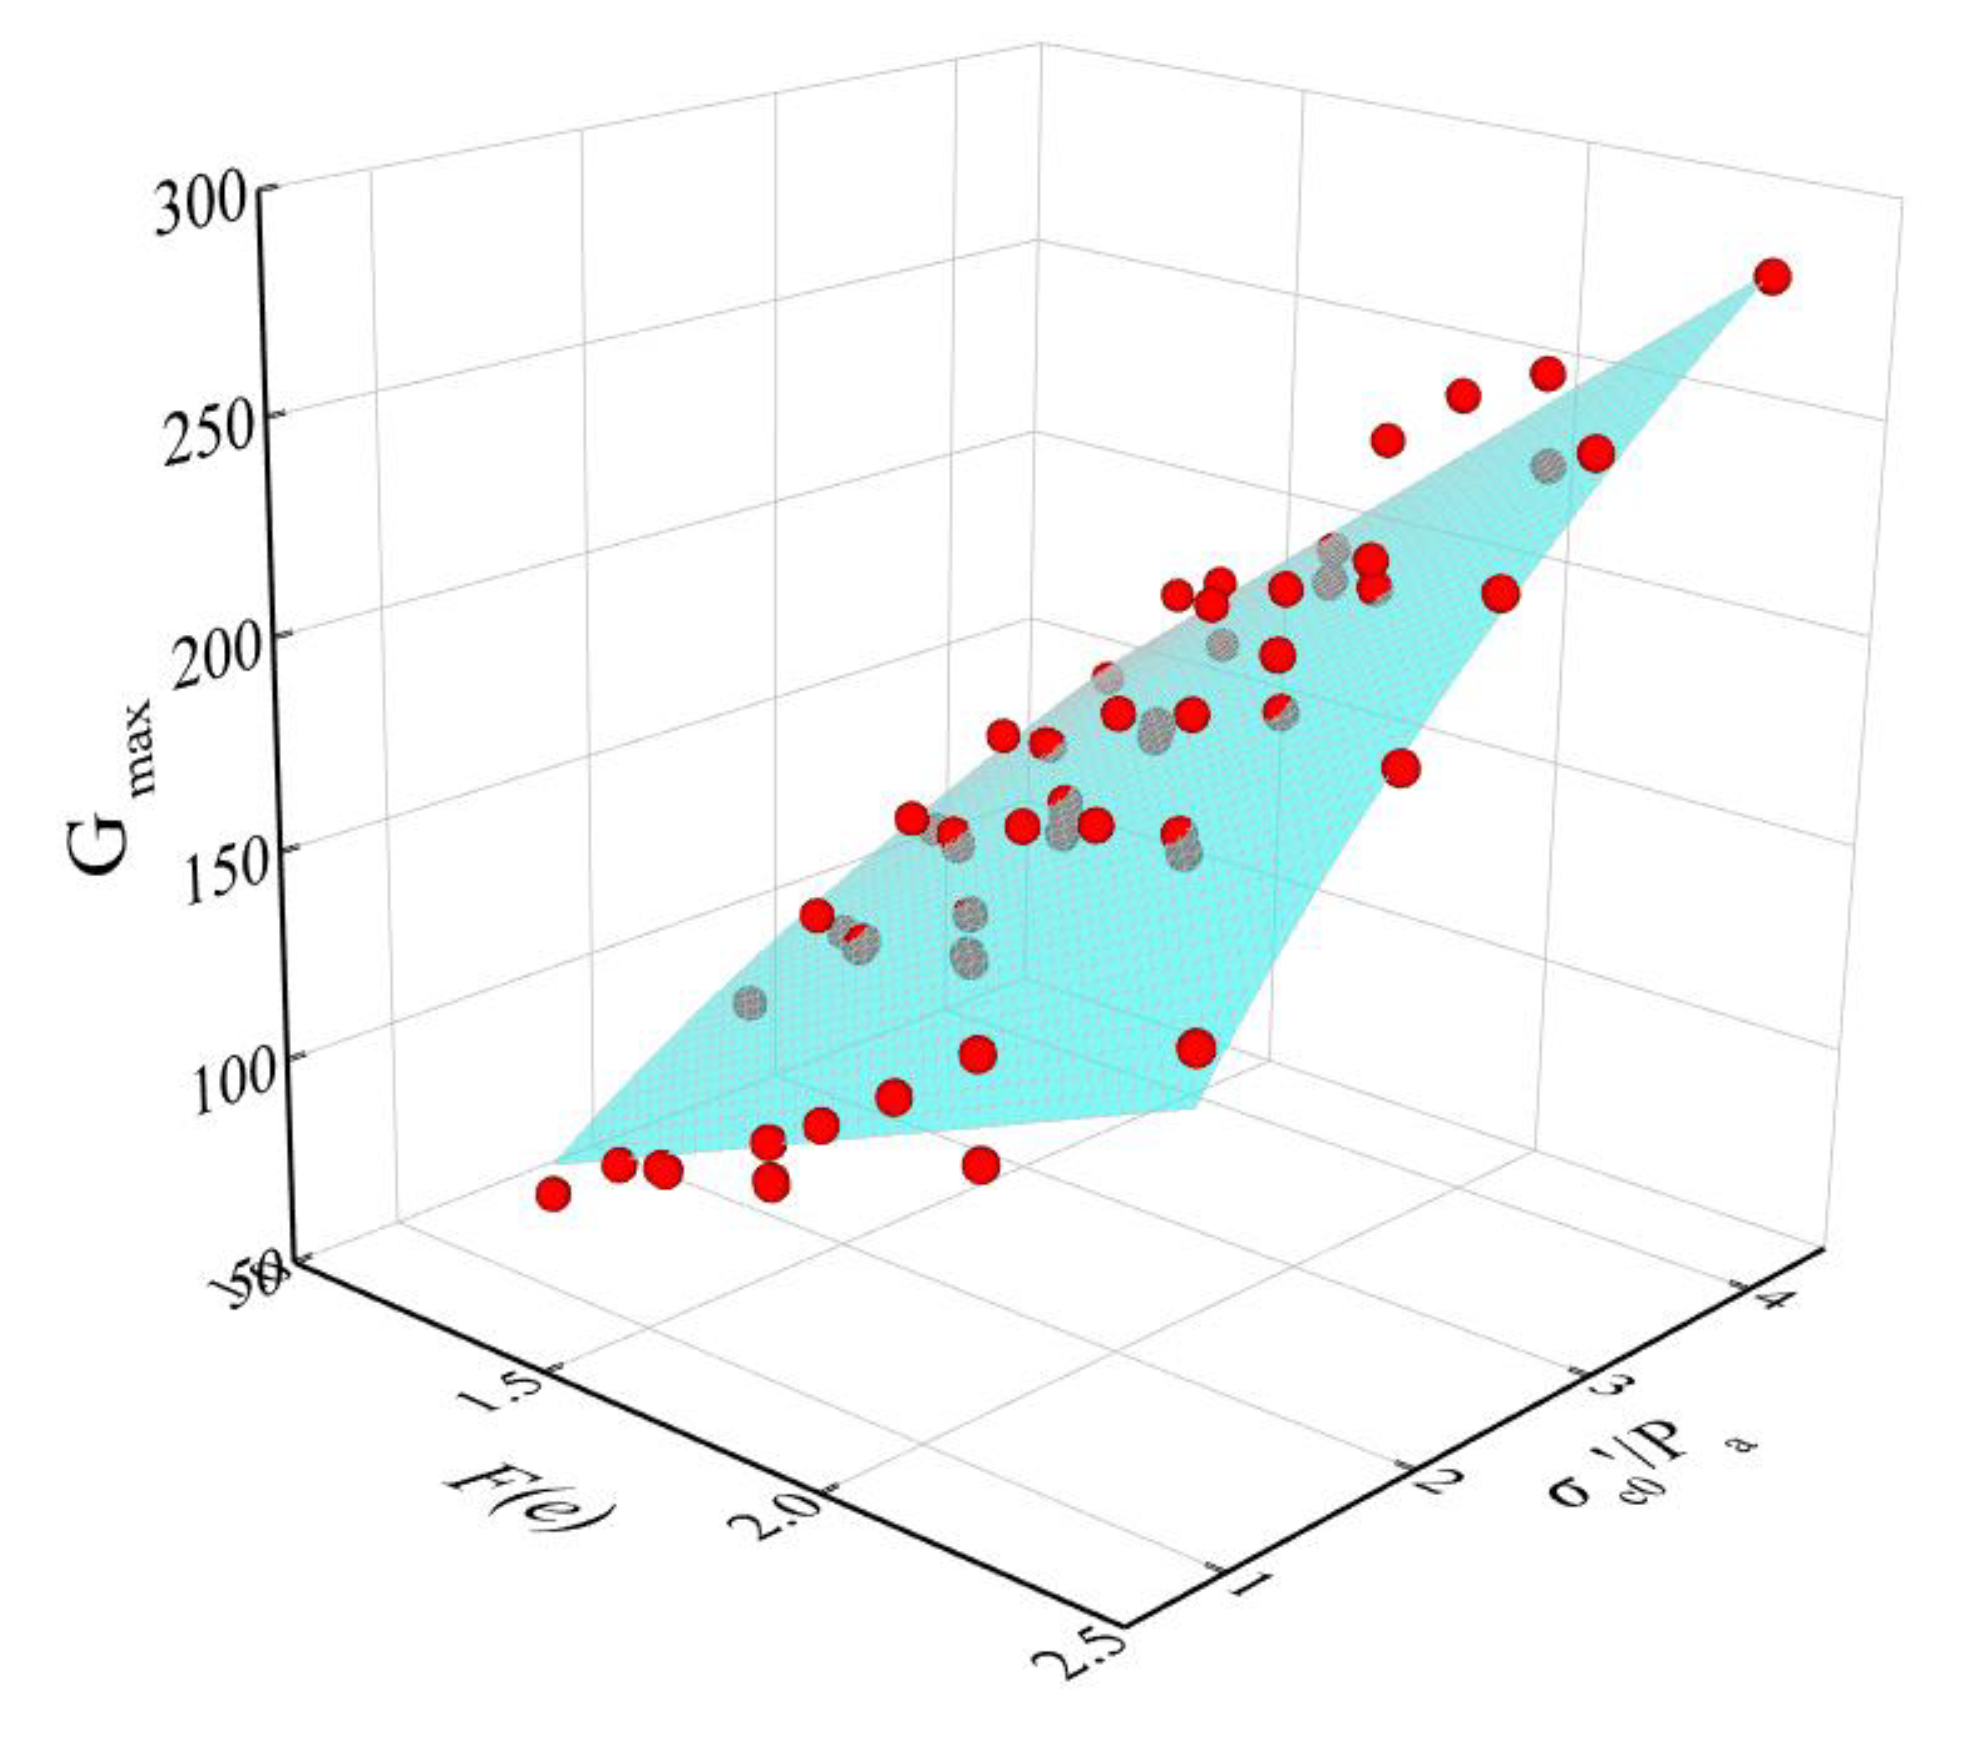
Figure 8 show the relationship between Gmax, F(e*), and normalized effective confining stress (/Pa)n of silty sands. Despite the variation in FC, e, or of the specimens, all of the test data points are located in a narrow surface, which means that e* appears to adequately capture the effects of FC, e, and particle gradations when FC < FCth. Therefore, the modified Hardin model based on the binary packing state parameter can be established:
A* = 59.3 MPa and R-square = 0.938 for Nantong silty sand, n was determined using Equation (4).
To validate the accuracy of the modified Hardin model, the comparison between the predicted Gmax in Equation (10) and the measured Gmax are presented in Figure 9. Almost all of the data pairs are close to the bisecting line, with the errors within 10%, indicating that the measured and predicted Gmax values are basically consistent. Considering the complexity of the effect of fines and man-made errors, such an error is acceptable. Therefore, the modified Hardin model can be used to predict the Gmax of silty sand when FC < FCth in a simple yet reliable way.
Given the complexity of material properties, further work to validate the applicability of the modified Hardin model evaluation Gmax by using experimental data is worthwhile. The similar Gmax testing series were carried out on four types of silty sand by Goudarzy et al. (2016) [15], Salgado et al. (2000) [16], Chien and Oh (1998) [37], and Thevanayagam and Liang (2001) [38]. Table 4 presents the physical index properties and fitting parameters of Nantong marine silty sand tested in this study and four silty sands using compiled data from the literature. Best fitting values of μ and nb in Equation (8) are 0.27~0.34 and 0.89~1.08, and the R-square value of the modified Hardin model for experimental data compiled from the literature are all over 0.9, which means the modified Hardin model can characterize Gmax for different types of silty sands well. It should be noted that A* for different types of silty sand presents an obvious soil-specific diversification. In addition, as shown in Figure 10, a power function relationship between A* and the synthesizing material property parameters ln(erange(s)∙Cu(s)∙χ) was established:
Thus, the modified Gmax prediction method based on the binary packing model can be established by combining Equations (4), (10), and (11), only considering basic indices of the clean sand and pure fines. It is worth noting that the application of the binary packing model should not be limited to the evaluation of Gmax. Existing test results show that e* presents a unified correlation with static liquefaction characteristics [39], drained and undrained triaxial compression behaviors [40], critical strength [41], liquefaction strength [42], etc., of silty sand, and the proposed procedure in this paper provides a significant improvement in the evaluation of the above mechanical properties in geotechnical engineering practice.
4. Conclusions
In order to investigate how e, FC and alter the Gmax of marine silty sand, comprehensive bender element tests were performed under isotropic consolidation, and a modified procedure based on the Hardin model was established to predict the Gmax. The main obtained results are summarized as follows.
- (1)
- Under otherwise similar conditions, Gmax decreases with decreasing e or FC, but decreases with increasing FC. In addition, the reduction rate of Gmax with e increasing is not sensitive to , but obviously sensitive to changes in FC.
- (2)
- For a specific FC, the traditional Hardin model can well characterize the influence of e and on the Gmax of silty sands. The stress exponent n does not appear to be sensitive to changes in FC and e, but sensitive to changes in the types of silty sand. In addition, the soil-specific constant n increases with increasing and shows a logarithmic function. However, the material-specific fitting parameter A in the Hardin model is sensitive to FC. The traditional Hardin model cannot incorporate the influence of FC on Gmax of marine silty sand.
- (3)
- e*, instead of e, can be an appropriate proxy to characterize the Gmax of marine silty sand with various FC. The modified Hardin model, established in the framework of the binary packing model, allowing unified characterization of Gmax values for silty sands, only considering basic indices of the clean sand and pure fines. The predicted errors are within 10% for the Nantong marine silty sand tested. Independent test data in the literature validate the applicability of this modified model.
Author Contributions
Conceptualization, Q.W. and K.Z.; validation, Q.L.; formal analysis, Q.L. and Q.G.; writing—original draft preparation, Q.W.; writing—review and editing, K.Z.; supervision, P.C. and G.C.; funding acquisition, K.Z. and G.C. All authors have read and agreed to the published version of the manuscript.
Funding
This research was funded by the Projects of the National Natural Science Foundation of China (NSFC), grant number 51978335, and by the Open Research Fund of State Key Laboratory of Geomechanics and Geotechnical Engineering, Institute of Rock and Soil Mechanics, Chinese Academy of Sciences, grant number Z019010.
Acknowledgments
The study in this paper was partly supported by the National Key Basic Research Program of China (Grant No. 2011CB013605). This financial support is highly appreciated.
Conflicts of Interest
The authors declare no conflict of interest.
References
- Payan, M.; Khoshghalb, A.; Senetakis, K.; Khalili, N. Effect of particle shape and validity of Gmax models for sand: A critical review and a new expression. Comput. Geotech. 2016, 72, 28–41. [Google Scholar] [CrossRef]
- Yang, J.; Yan, X.R. Site response to multi-directional earthquake loading: A practical procedure. Soil Dyn. Earthq. Eng. 2009, 29, 710–721. [Google Scholar] [CrossRef]
- Andrus, R.D.; Stokoe, K.H., II. Liquefaction resistance of soils from shear-wave velocity. J. Geotech. Geoenviron. Eng. 2000, 126, 1015–1025. [Google Scholar] [CrossRef]
- Chen, G.X.; Kong, M.Y.; Khoshnevisan, S.; Chen, W.Y.; Li, X.J. Calibration of Vs-based empirical models for assessing soil liquefaction potential using expanded database. Bull. Eng. Geol. Environ. 2019, 78, 945–957. [Google Scholar]
- Hardin, B.O.; Black, W.L. Sand stiffness under various triaxial stresses. J. Soil Mech. Found. Div. 1966, 92, 27–42. [Google Scholar]
- Hardin, B.O.; Drnevich, V.P. Shear modulus and damping in soil: Design equation and curves. J. Soil Mech. Found. Div. 1972, 98, 667–692. [Google Scholar]
- Hardin, B.O.; Richart, F.E. Elastic wave velocities in granular soils. J. Soil Mech. Found. Div. 1963, 89, 39–56. [Google Scholar]
- Seed, H.B.; Wong, R.T.; Idriss, I.M.; Tokimatsu, K. Moduli and damping factors for dynamic analyses of cohesionless soil. J. Geotech. Eng. 1986, 112, 1016–1032. [Google Scholar] [CrossRef]
- Youn, J.U.; Choo, Y.W.; Kim, D.S. Measurement of small-strain shear modulus Gmax of dry and saturated sands by bender element, resonant column, and torsional shear tests. Can. Geotech. J. 2008, 45, 1426–1438. [Google Scholar] [CrossRef]
- Yang, J.; Gu, X.Q. Shear stiffness of granular material at small-strain: Does it depend on grain size? Géotechnique 2013, 63, 165–179. [Google Scholar] [CrossRef] [Green Version]
- Iwasaki, T.; Tatsuoka, F. Effect of grain size and grading on dynamic shear moduli of sand. Soils Found. 1977, 17, 19–35. [Google Scholar] [CrossRef]
- Wichtmann, T.; Hernandez, M.; Triantafyllidis, T. On the influence of a non-cohesive fines content on small strain stiffness, modulus degradation and damping of quartz sand. Soil Dyn. Earthq. Eng. 2015, 69, 103–114. [Google Scholar] [CrossRef]
- Rahman, M.M.; Lo, S.R.; Gnanendran, C.T. On equivalent granular void ratio and steady state behaviour of loose sand with fines. Can. Geotech. J. 2008, 45, 1439–1455. [Google Scholar] [CrossRef] [Green Version]
- Yang, J.; Liu, X. Shear wave velocity and stiffness of sand: The role of non-plastic fines. Géotechnique 2016, 66, 1–15. [Google Scholar] [CrossRef] [Green Version]
- Goudarzy, M.; Rahemi, N.; Rahman, M.M.; Schanz, T. Predicting the maximum shear modulus of sands containing nonplastic fines. J. Geotech. Geoenviron. Eng. 2017, 143, 06017013. [Google Scholar] [CrossRef]
- Salgado, R.; Bandini, P.; Karim, A. Shear strength and stiffness of silty sand. J. Geotech. Geoenviron. Eng. 2000, 126, 451–462. [Google Scholar] [CrossRef]
- Evans, M.D.; Zhou, S.P. Liquefaction behavior of sand-gravel composites. J. Geotech. Geoenviron. Eng. 1995, 121, 287–298. [Google Scholar] [CrossRef]
- Chang, W.J.; Chang, C.W.; Zeng, J.K. Liquefaction characteristics of gap-graded gravelly soils in K0 condition. Soil Dyn. Earthq. Eng. 2014, 56, 74–85. [Google Scholar] [CrossRef]
- Chen, G.X.; Wu, Q.; Sun, T.; Zhao, K.; Zhou, E.Q.; Xu, L.Y.; Zhou, Y.G. Cyclic behaviors of saturated sand gravel mixtures under undrained cyclic triaxial loading. J. Earthq. Eng. 2018, 1–34. [Google Scholar] [CrossRef]
- Chen, G.X.; Wu, Q.; Zhou, Z.L.; Ma, W.J.; Chen, W.Y.; Sara, K.; Yang, J. Undrained anisotropy and cyclic resistance of saturated silt subjected to various patterns of principal stress rotation. Géotechnique 2020, 70, 317–331. [Google Scholar] [CrossRef]
- ASTM. Standard Test Methods for Maximum Index Density and Unit Weight of Soils Using a Vibratory Table; ASTM D4253; ASTM: West Conshohocken, PA, USA, 2006. [Google Scholar]
- ASTM. Standard Test Methods for Minimum Index Density and Unit Weight of Soils and Calculation of Relative Density; ASTM D4254; ASTM: West Conshohocken, PA, USA, 2006. [Google Scholar]
- Polito, C.P.; Martin, J.R., II. Effects of nonplastic fines on the liquefaction resistance of sands. J. Geotech. Geoenviron. Eng. 2001, 127, 408–415. [Google Scholar] [CrossRef]
- Ishihara, K. Soil Behaviour in Earthquake Geotechnics; Clarendon Press: Oxford, UK, 1996. [Google Scholar]
- Skempton, A.W. The pore-pressure coefficients A and B. Geotechnique 1954, 4, 143–147. [Google Scholar] [CrossRef]
- Huang, Y.T.; Huang, A.B.; Kuo, Y.C.; Tsai, M.D. A laboratory study on the undrained strength of a silty sand from Central Western Taiwan. Soil Dyn. Earthq. Eng. 2004, 24, 733–743. [Google Scholar] [CrossRef]
- Baxter, C.D.P.; Bradshaw, A.S.; Green, R.A.; Wang, J.H. Correlation between cyclic resistance and shear-wave velocity for providence silts. J. Geotech. Geoenviron. Eng. 2008, 134, 37–46. [Google Scholar] [CrossRef]
- Oka, L.G.; Dewoolkar, M.; Olson, S.M. Comparing laboratory-based liquefaction resistance of a sand with non-plastic fines with shear wave velocity-based field case histories. Soil Dyn. Earthq. Eng. 2018, 113, 162–173. [Google Scholar] [CrossRef]
- Yoo, J.K.; Park, D.; Baxter, C.D.P. Estimation of Drained Shear Strength of Granular Soil from Shear Wave Velocity and Confining Stress. J. Geotech. Geoenviron. Eng. 2018, 144, 04018027. [Google Scholar] [CrossRef]
- Lee, J.S.; Santamarina, J.C. Bender elements: Performance and signal interpretation. J. Geotech. Geoenviron. Eng. 2005, 131, 1063–1070. [Google Scholar] [CrossRef] [Green Version]
- Thevanayagam, S.; Shenthan, T.; Mohan, S.; Liang, J. Undrained fragility of clean sands, silty sands, and sandy silts. J. Geotech. Geoenviron. Eng. 2002, 128, 849–859. [Google Scholar] [CrossRef]
- Rahman, M.M.; Lo, S.R.; Baki, M.A.L. Equivalent granular state parameter and undrained behaviour of sand–fines mixtures. Acta Geotech. 2011, 6, 183–194. [Google Scholar] [CrossRef]
- Rahman, M.; Cubrinovski, M.; Lo, S.R. Initial shear modulus of sandy soils and equivalent granular void ratio. Geomech. Geoengin. 2012, 7, 219–226. [Google Scholar] [CrossRef]
- Thevanayagam, S. Liquefaction potential and undrained fragility of silty sands. In Proceedings of the 12th World Conference Earthquake Engineering CD-ROM, New Zealand Society for Earthquake Engineering, Wellington, New Zealand, 5–8 July 2000. [Google Scholar]
- Goudarzy, M.; Rahman, M.M.; König, D.; Schanz, T. Influence of non-plastic fines content on maximum shear modulus of granular materials. Soils Found 2016, 56, 973–983. [Google Scholar] [CrossRef]
- Goudarzy, M.; Rahemi, N.; Rahman, M.M. Closure to “Predicting the maximum shear modulus of sands containing nonplastic fines” by Meisam Goudarzy, Negar Rahemi, Md. Mizanur Rahman, and Tom Schanz. J. Geotech. Geoenviron. Eng. 2019, 145, 07019006. [Google Scholar] [CrossRef] [Green Version]
- Chien, L.K.; Oh, Y.N. Influence on the shear modulus and damping ratio of hydraulic reclaimed soil in West Taiwan. Int. J. Offshore Polar 1998, 8, 228–235. [Google Scholar]
- Thevanayagam, S.; Liang, J. Shear wave velocity relations for silty and gravely soils. In Proceedings of the 4th International Conference on Soil Dynamics & Earthquake Engineering, San Diego, CA, USA, 7–9 March 2001; pp. 1–15. [Google Scholar]
- Rahman, M.M.; Lo, S.C.R.; Dafalias, Y.F. Modelling the static liquefaction of sand with low-plasticity fines. Géotechnique 2014, 64, 881–894. [Google Scholar] [CrossRef]
- Nguyen, H.B.K.; Rahman, M.M.; Fourie, A.B. Characteristic behavior of drained and undrained triaxial compression tests: DEM Study. J. Geotech. Geoenviron. Eng. 2018, 144, 04018060. [Google Scholar] [CrossRef]
- Barnett, N.; Rahman, M.M.; Karim, M.R.; Nguyen, H.B.K.; Carraro, J.A.H. Equivalent state theory for mixtures of sand with non-plastic fines: A DEM investigation. Géotechnique 2020, 1–18. [Google Scholar] [CrossRef]
- Chen, G.X.; Wu, Q.; Zhao, K.; Shen, Z.F.; Yang, J. A binary packing material-based procedure for evaluating soil liquefaction triggering during earthquakes. J. Geotech. Geoenviron. Eng. 2020. [Google Scholar] [CrossRef]
Figure 1.
GCTS HCA-300 dynamic hollow cylinder-TSH testing system and bender element system.

Figure 2.
Scanning electron microscopy image and grain size distributions of clean sand, pure fines, and marine silty sand with different fines content: (a) grain size distribution; (b) scanning electron microscopy image.
Figure 2.
Scanning electron microscopy image and grain size distributions of clean sand, pure fines, and marine silty sand with different fines content: (a) grain size distribution; (b) scanning electron microscopy image.

Figure 3.
Shear wave signals in specimen for case ID: S11.

Figure 4.
The relationship between Gmax and e for Nantong marine silty sand with different FC: (a) FC = 0%; (b) FC = 10%; (c) FC = 20%; (d) FC = 20%.
Figure 4.
The relationship between Gmax and e for Nantong marine silty sand with different FC: (a) FC = 0%; (b) FC = 10%; (c) FC = 20%; (d) FC = 20%.

Figure 5.
The Hardin model for Nantong marine silty sand in Gmax-F(e*)-/Pa space: (a) FC = 0%; (b) FC = 10%; (c) FC = 20%; (d) FC = 20%.
Figure 5.
The Hardin model for Nantong marine silty sand in Gmax-F(e*)-/Pa space: (a) FC = 0%; (b) FC = 10%; (c) FC = 20%; (d) FC = 20%.

Figure 6.
Variation of stress exponent n versus the synthesizing material property parameter .

Figure 7.
The relationship between A of the Hardin model and FC for Nantong marine silty sand.

Figure 8.
The modified Hardin model for Nantong marine silty sand with different FC in Gmax-F(e*)-/Pa space.
Figure 8.
The modified Hardin model for Nantong marine silty sand with different FC in Gmax-F(e*)-/Pa space.

Figure 9.
Comparison of the measured Gmax and the predicted Gmax using the modified Hardin model.

Figure 10.
The relationship between A* of the modified Hardin model and ln(erange(s)∙Cu(s)∙χ).


Table 1.
Index properties of clean sand and pure fines.
| Clean Sand | Pure Fines | |
|---|---|---|
| Material | Nantong sand | Nantong silt |
| /mm | 0.114 | 0.040 |
| /mm | 0.080 | 0.016 |
| 1.672 | 2.931 | |
| 2.672 | 2.719 | |
| 1.262 | 1.481 | |
| 0.662 | 0.764 |
Table 2.
Physical index of Nantong marine silty sand with different FC.
| FC of Silty Sand (%) | ||||
|---|---|---|---|---|
| 0 | 10 | 20 | 30 | |
| emax | 1.290 | 1.232 | 1.221 | 1.212 |
| emin | 0.731 | 0.587 | 0.431 | 0.364 |
| G | 2.669 | 2.680 | 2.690 | 2.701 |
| d50 | 0.113 | 0.104 | 0.097 | 0.091 |
| Cc | 0.796 | 0.829 | 1.453 | 1.752 |
| Cu | 1.646 | 1.681 | 2.826 | 3.201 |
Table 3.
Schemes of bender element tests for Nantong marine silty sand.
| ID | FC/% | Dr/% | e | ρ (g/cm3) | b Value | e* | |
|---|---|---|---|---|---|---|---|
| S1 | 0 | 35 | 1.076 | 1.286 | 0 | 1.286 | 100 200 250 300 400 |
| S2 | 0 | 50 | 0.973 | 1.352 | 0 | 1.352 | |
| S3 | 0 | 60 | 0.890 | 1.412 | 0 | 1.412 | |
| S4 | 10 | 35 | 1.009 | 1.334 | 0.321 | 1.155 | |
| S5 | 10 | 50 | 0.934 | 1.386 | 0.321 | 1.075 | |
| S6 | 10 | 60 | 0.883 | 1.424 | 0.321 | 0.953 | |
| S7 | 20 | 35 | 0.936 | 1.348 | 0.454 | 1.189 | |
| S8 | 20 | 50 | 0.947 | 1.382 | 0.454 | 1.077 | |
| S9 | 20 | 60 | 0.824 | 1.475 | 0.454 | 0.998 | |
| S10 | 30 | 35 | 0.948 | 1.386 | 0.555 | 1.248 | |
| S11 | 30 | 50 | 0.865 | 1.448 | 0.555 | 1.152 | |
| S12 | 30 | 60 | 0.792 | 1.506 | 0.555 | 1.042 |
Table 4.
Physical index properties and fitting parameters of silty sands considered in this study.
| Data from | Material | Index Properties | In Equation (8) | In Equation (10) | ||||
|---|---|---|---|---|---|---|---|---|
| erange(s) | Cu(s) | χ | μ | nb | A* | R2 | ||
| This study | Nantong sand + Nantong silt | 0.60 | 1.67 | 2.0 | 0.32 | 0.94 | 62.1 | 0.932 |
| Goudarzy et al. (2017) | Hostun sand + Quartz powder | 0.35 | 2.01 | 63.3 | 0.33 | 1.05 | 30.3 | 0.943 |
| Salgado et al. (2000) | Ottawa sand + Sil-co-Sil | 0.30 | 1.48 | 11.8 | 0.34 | 0.92 | 44.7 | 0.895 |
| Chien and Oh (1998) | Yunling sand + Yunling silt | 0.55 | 1.69 | 2.17 | 0.27 | 1.08 | 64.9 | 0.883 |
| Thevanayagam and Liang (2001) | Foundary sand + Sil-co-Sil | 0.19 | 1.69 | 17.1 | 0.29 | 0.89 | 43.2 | 0.902 |
Note: erange(s)—void ratio range of clean sand (=emax − emin); Cu(s)—uniformity coefficient of clean sand; μ and nb—fitting parameters in Equation (8); A*—fitting parameter in Equation (10); R2—coefficient of determination for Equation (10).
© 2020 by the authors. Licensee MDPI, Basel, Switzerland. This article is an open access article distributed under the terms and conditions of the Creative Commons Attribution (CC BY) license (http://creativecommons.org/licenses/by/4.0/).
Share and Cite
MDPI and ACS Style
Wu, Q.; Lu, Q.; Guo, Q.; Zhao, K.; Chen, P.; Chen, G. Experimental Investigation on Small-Strain Stiffness of Marine Silty Sand. J. Mar. Sci. Eng. 2020, 8, 360. https://doi.org/10.3390/jmse8050360
AMA Style
Wu Q, Lu Q, Guo Q, Zhao K, Chen P, Chen G. Experimental Investigation on Small-Strain Stiffness of Marine Silty Sand. Journal of Marine Science and Engineering. 2020; 8(5):360. https://doi.org/10.3390/jmse8050360
Chicago/Turabian StyleWu, Qi, Qingrui Lu, Qizhou Guo, Kai Zhao, Pen Chen, and Guoxing Chen. 2020. "Experimental Investigation on Small-Strain Stiffness of Marine Silty Sand" Journal of Marine Science and Engineering 8, no. 5: 360. https://doi.org/10.3390/jmse8050360
Note that from the first issue of 2016, this journal uses article numbers instead of page numbers. See further details here.