

Abstract
Multiferroic materials endowed with both dielectric and magnetic orders, are ideal candidates for a wide range of applications. In this work, we reported two phase transitions of MnI2 at 3.45 K and 4 K by systemically measuring the magnetic-field and temperature-dependent magnetization of the MnI2 thin flakes. Furthermore, we observed similar temperature and field-dependent behaviours for the magnetic susceptibility of MnI2 and electronic capacitance of the Ag/MnI2/Ag devices below 3.5 K. Considering the related theory work, we discussed the relationship between the antiferromagnetic and ferroelectric orders in MnI2. Our work reveals the in-plane magnetic and electric properties of MnI2 materials, which might be helpful for the further investigation and application of MnI2 multiferroics in the future.
Export citation and abstract BibTeX RIS
1. Introduction
Multiferroics, materials endowed with both dielectric and magnetic orders, have attracted great interest in recent years [1–5]. Due to the strong ferroelectricity (FE) and magnetic coupling, the multiferroics materials are ideal candidates for a number of potentially important applications such as in memories, sensors, micro-electro-mechanical systems, and spintronics [6–13]. However, intrinsic magnetoelectric coupling are hard to obtain in experiments and only found in handful systems, such as YMnO3 [14, 15], BiMnO3 [16, 17], BiFeO3 [18, 19], TbMnO3 [20, 21], MnWO4 [22, 23] and so on. Recently, MnI2, a layer-structured material crystallizing in the CdI2 type structure with the centrosymmetric space group P-3 m1 (No. 164), was reported to exhibit multiferroicity [24]. As FE polarization is incompatible with centrosymmetry in general, the emergence of FE polarization in MnI2 attracts increasing interest. In 1995, Sato and coworkers observed three magnetic order phase transitions in MnI2 at low temperature: 3.95 K, 3.8 K and 3.45 K by neutron diffraction [25] and found that the MnI2 transit to antiferromagnetic (AFM) phase with magnetic q vector (0.181, 0, 0.439) below 3.45 K. Kurumaji et al observed a screw magnetic structure that induces FE polarization along the (110) direction of MnI2 below 3.45 K [26]. Wu and coworkers calculated the interplane and intraplane exchange interaction parameters, and found that spiral spin structure can exist along the (110) direction [27]. Considering the strong spin–orbit coupling for MnI2, the spiral magnetic order may break the inversion symmetry and consequently lead to the asymmetric charge distribution around the I-ions, resulting in the ferroelectric polarization. Based on this model, several theories were developed [28–31] and the previous experiments can be essentially understood. However, detailed experiments are still lacked to support the close relationship between the AFM and FE phases.
In this work, we report the clear magneto-capacitance in MnI2 single crystal by measuring the magnetic field and temperature dependent magnetization of the bulk and capacitance of the Ag/MnI2/Ag device. We observe similar temperature and field dependent behaviours for the magnetic susceptibility and electric capacitance, showing the close correlation between the AFM and FE orders in MnI2. As MnI2 is a layer-structured materials with the screw magnetic order and the FE polarization mainly located inside the single layers [32–34], our method might be applicable to two-dimensional materials for studying their novel multiferroic properties.
2. Methods
Single crystals of MnI2 were grown using chemical vapour transport method [35]. 2.5 g MnI2 powders and 0.1 g iodine were used as starting materials and were sealed in an evacuated quartz ampoule. Then, it was put into a slightly tilted horizontal two-temperature-zone furnace with the hot end containing starting materials. The cold/hot end temperature was optimized to be 520/590 °C and the reaction duration was about one week. Then, the furnace was cooled down to room temperature slowly. The crystals up to 5 × 5 × 0.02 mm3 in size were obtained near the cold zone of the ampoule.
The crystalline phases and structures were examined by x-ray diffraction (XRD) using RICOH-DX12 with Cu K (λ = 1.5418 Å) radiation. The magnetic field and temperature dependent magnetization were measured by a physical property measurement system (PPMS) equipped with a vibrating sample magnetometer from Quantum Design. Capacitance devices were fabricated by pasting two silver electrodes onto the two surfaces of the MnI2 single crystal. Electrical measurements were performed with a standard low-frequency lock-in technique using Agilent E4980 LCR meter with the PPMS system.
3. Experimental result
The structural model of MnI2 is illustrated in figure 1(a) with top and side views. A single sheet of MnI2 includes a layer of Mn atoms that is sandwiched by two layers of I atoms and each central Mn atom is surrounded by six I atoms that are located at the octahedral points (CdI2-type structure). Bulk MnI2 can be viewed as the AB stacking of MnI2 sheets. The chemical vapour transport techniques were optimized to produce MnI2 single crystals up to 5 × 5 × 0.02 mm3 in size with high quality as shown in figure 1(b). The as-prepared MnI2 single crystals exhibit a disk-like shape, indicating a typical feature of layer-structured materials. The crystal structure of MnI2 was checked by XRD measurements, as shown in figure 1(c). Three sharp diffraction peaks can be attributed to the (001), (002) and (004) planes of the single crystal MnI2, according to the JCPDS card no 98-003-3673. Energy-dispersive spectroscopy implemented in scanning electron microscopy revealed an atomic ratio of 1:2 with Mn and I in all the samples, well consistent with the chemical stoichiometry. Notably, as the MnI2 samples can be quickly deliquated in air [36], an easy glove bag full of nitrogen was used in the process of the sample transferring into the analyses chamber to protect the MnI2 crystals.

Figure 1. Crystal structure and characterization of MnI2 single crystals: (a) top view and views of MnI2 crystal structure; (b) optical image of the as-prepared MnI2 crystals inside the ampoule; (c) XRD pattern of MnI2 single crystal with (001)-oriented top.
Download figure:
Standard image High-resolution imageLet us firstly focus on the magnetic phase transition of MnI2. For this sake, we measured the temperature dependence of the magnetization of MnI2 under zero-field-cooling (ZFC) and field-cooling (FC) conditions with magnetic fields parallel to the (001) facet of the MnI2 single crystal. For the ZFC measurements, the samples were first cooled to 2 K in zero magnetic field. Then, a magnetic field of 0.5 T was applied. The M–T data were subsequently collected with temperature up to 10 K. The FC measurements were performed following the ZFC measurements with the same magnetic field. As shown in figure 2(a), no obvious difference between the M–T curves measured in ZFC and FC conditions can be distinguished, due to the weak magnetic coupling and weak magnetic domains. Therefore, we only recorded the M–T data in the ZFC condition in the following measurements. As shown in figure 2(b), the M–T data at 0.5 T exhibit a Curie–Weiss-like behaviour (the red dashed line), indicating a paramagnetic phase of MnI2 above 5 K. Meanwhile, the inflection point at ∼4 K and the negative Weiss temperature indicates a possible AFM transition below 4 K, consistent with previous reports that MnI2 undergoes an unusual antiferromagnetic order below Neel temperature of 3.45 K [32]. Figure 2(c) depicts the M–T data at various magnetic field. It is seen that the inflection point shifts to lower temperature with increasing field from 0.1 T to 8 T and finally disappears below the temperature limitation of our system (2 K) at 8 T. High magnetic field can suppress the AFM transition, in agreement with the reports about AFM materials [37, 38]. To see more details of the field-dependent phase transition, we plot the derivative of the normalized magnetization as a function of temperature (dM/HdT–T) in figure 2(d). Two types of inflection points can be observed in the curves. Both types of the inflection points shift simultaneously to lower temperature with increasing magnetic field as guided by the dashed line, which may be originated from two types of magnetic phase transitions.

Figure 2. Typical temperature dependent magnetization and magnetic susceptibility of the MnI2 single crystal measured in the temperature range of 2–10 K and the magnetic field range of 0–8 T. (a) Temperature dependence of the ZFC/FC magnetization taken under typical magnetic fields of 0.5 T, paralleling the (001) surface of MnI2 single-crystal samples; (b) inverse magnetic susceptibility, H/M, as a function of temperature. The dashed line indicates Curie–Weiss-like behaviour at high temperatures under 0.5 T field; (c) temperature dependence of magnetization taken under several magnetic fields from 0.1 T to 8 T; (d) temperature derivative of the magnetic susceptibility dM/HdT as a function of temperature under several magnetic fields from 0.1 T to 8 T. Two types of inflection points have been identified and the dashed lines are for guiding eyes.
Download figure:
Standard image High-resolution imageTo further clarify the type of magnetic order, we recorded the field-dependent magnetization behaviour of the MnI2 crystal in variable magnetic field that was parallel to the MnI2 (001) facet at different temperatures. Figure 3(a) presents the M–H curves at 2 K and 6 K. The magnetic moments of MnI2 is proportional to the applied magnetic field in the field range from 0 T to 5 T at 6 K, suggesting a paramagnetic or antiferromagnetic feature of MnI2. A saturation is observed in the M–H curve above 10 T, corresponding to the transition to a fully polarized phase. The M–H curve recorded at 2 K is quite similar to that at 6 K at first glance. However, comparing the two M–H curves at 2 K and 6 K, one can still distinguish a weak spontaneous magnetic moment at 2 K in the low field range (<2 T), as shown in the insert of figure 3(a). Although the magnetization is not exactly zero at 2 K, it becomes extremely weak. This behaviour indicates an antiferromagnetic phase of MnI2, in line with previous theoretic and experimental work by neutron diffraction [25, 32]. To magnify the magnetic phase transitions of MnI2, the dM/dH curves at 2 K and 6 K are depicted in figure 3(b). At 6 K, the magnetic susceptibility decreases progressively with increasing magnetic field and down to zero at 14 T, without showing any inflection point. By contrary, the magnetic susceptibility shows complex field-dependent behaviour at 2 K. Two field-induced magnetic phase transitions can be observed: one at 4 T and the other one at 2 T. Figure 3(c) illustrates the dM/dH curves at various temperatures. It is seen that the transition signal gradually weakens and disappears with the temperature increasing from 2 K to 6 K.
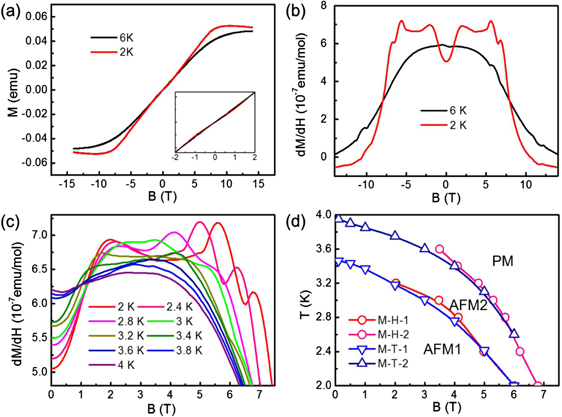
Figure 3. Typical field dependent magnetization of the MnI2 single crystal measured in the temperature range of 2–6 K and the magnetic field range of–14–14 T parallel to (001) facet. (a) Field dependence of magnetization taken at different temperature from 2 K to 6 K; (b) field derivative of the magnetization dM/dH as a function of field at 2 K and 6 K; (c) expended field derivative of the magnetization dM/dH as a function of field at different temperature from 2 K to 4 K; (d) T–H phase diagram determined by various T and H dependence of magnetization.
Download figure:
Standard image High-resolution imageGenerally, the M–T and M–H curves depend on the history of applied external magnetic field in a ferromagnetic material. However, comparing the temperature-dependent and field-dependent magnetization of the MnI2 crystal, we observe a similar magnetic phase transition behaviour due to the absence of hysteresis. Figure 3(d) plots the H–T phase diagram determined from the various temperature or field dependence of magnetization, where the critical temperature (TN) or magnetic field are determined from the inflection point in the dM/HdT or dM/dH curves. Two boundaries of the two AFM phases are clearly shown in figure 3(d). With low temperature and magnetic field, the MnI2 crystal maintain AFM phase; while it changes into another AFM phase in the higher temperature or field; furthermore, if the temperature or field is high enough, the MnI2 transfer into paramagnetic phase.
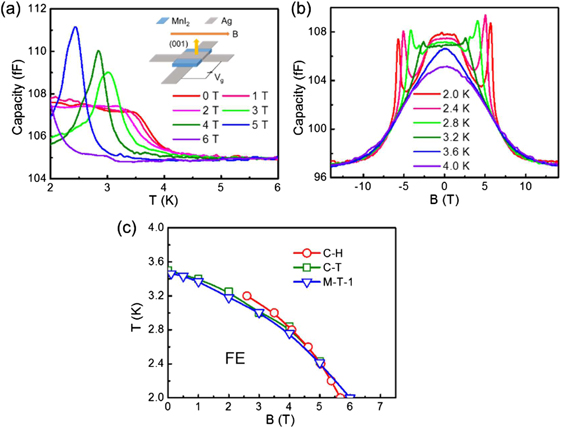
According to the theoretical calculations, the spiral spin structure in MnI2 contributes to the emergence of the FE polarization [27–31]. To investigate the magneto-electric coupling of MnI2, we fabricated a variety of capacitive Ag/MnI2/Ag devices with perpendicular top and bottom electrodes (the insert of figure 4(a)). Such an electrode structure is different from the ideal parallel plate capacitor and can construct an electrical field along the ab-plane, which allows to detect the modification of electric polarization in the ab facet by measuring the capacitance between the two electrodes. Capacitance was measured in the temperature ramping down and up process without external electric field during all the procedures. Figure 4(a) show the temperature dependence of the electrical capacities of the devices in the magnetic field. Under a zero magnetic field (H = 0 T), the capacitance keeps the same value with the temperature in the range of 10–4 K. At 3.7 K, it shows a clear jump, which indicates an abrupt change of the electric susceptibility. The temperature-dependent capacities under various magnetic field parallel to the (001) surface give the relationship between the inflection points and the magnetic fields: with higher magnetic field, the critical temperature for the anomalous jump shifts to the lower temperature. Compared with the inflection points in figure 2(d) (the magnetic susceptibility), a similar behaviour is obtained for the evolution of the electric susceptibility with the magnetic field. Figure 2(b) shows that MnI2 transits from the paramagnetic phase to antiferromagnetic phase, whereas the jump of electric susceptibility illustrated in figure 4(a) may be caused by the ferroelectric polarization. The similar critical temperature of phase transition reveals a close relationship between magnetic and electric properties of MnI2.
Figure 4. The magneto-electric behaviour of MnI2: (a) the temperature dependence of capacitance under various magnetic field, the field parallel to (001) surface. (b) The magnetic field dependence of capacitance under various temperatures. (c) T–H phase diagram determined by various T and H scans of capacitance.
Download figure:
Standard image High-resolution image
We also measured the field-dependent capacities of the Ag/MnI2/Ag devices at various temperature, as presented in figure 4(b). The capacitance monotonically decreases with increasing magnetic field at temperature >3.6 K. However, clear inflection points under the critical magnetic field can also be observed at temperature <3.6 K. Moreover, the magnetic field of the inflection point shifts to lower value with increasing temperature. For example, at T = 2 K the capacitance jumps suddenly at 6 T and at T = 3.2 K the inflection point is at 3 T. No inflection point can be observed in the curves collected at temperature >3.6 K. However, the magnetocapacitance may arise as an artifact of the magnetoelastic coupling, or even from the leakage of magnetoresistance [39, 40]. For comparison, we prepared symmetrical top and bottom electrodes in the ab-plane as shown in the supplementary materials (figure S2) (http://stacks.iop.org/JPhysCM/32/335803/mmedia). With symmetrical electrodes, phase-transfer point of temperature (around 3.5 K) and magnetic field (around 6 T at 2 K) cannot be observed in the curves of the temperature or the magnetic field dependent capacities. Furthermore, we can see the extrinsic effect like magnetoresistance can only make continuous evolution of capacity values with magnetic field. Thus, those abrupt change of capacities in figure 4(b) are more possibly caused by magnetic phase transitions. Figure 4(c) depicts an H–T phase diagram determined from the T and H dependence of the capacitance, showing a boundary of the FE phase. Compared with figure 3(d), we find that the boundary of the first AFM phase is similar with the FE phase, which confirms the strong correlation between electric and magnetic properties of MnI2. Notably, the C–H curve shows two kinds of inflection points in the temperature range of 2.6–3.2 K. For instance, at 2.8 K one inflection point is at 3.1 T while the other at 4.1 T. These features indicate the existence of an additional critical magnetic–electric coupling, which may be due to the second magnetic phase transition as we mentioned in the dM/dH curves in figure 3(d). Unfortunately, the detail of this magnetic phase transition is still unknown. Further investigation is underway.
The physical origin of the magnetic phase transitions mentioned above had been theoretically studied [27]. Using the mean-field theory based on a Heisenberg-type magnetic exchange Hamiltonian, Wu and coworkers found that the spiral magnetic order may break the inversion symmetry due to the strong spin orbit coupling in MnI2, leading to the asymmetric charge distribution. The asymmetric charge distribution around I-ions essentially contributes to the ferroelectric polarization. Our experiments reveal the possible coexistence of the ferroelectricity and magnetism in MnI2, and indicate that either high temperature or strong magnetic field can destroy the magnetic order, which consequently destroy the ferroelectric phase. Our results are well consistent with the scenario proposed by Wu et al [27].
4. Conclusion
In summary, we have synthesized MnI2 single crystals. To understand the relationship between magnetic and electric properties of MnI2, we analysed the magnetic-field and temperature-dependent magnetization of the MnI2 flakes. The results indicate two phase transitions of MnI2 at 3.45 K and 4 K. Furthermore, the capacitance of the Ag/MnI2/Ag devices were investigated. Magnetic susceptibility evolution indicated the boundary of AFM phase transition. Capacitance also indicated the boundary of FE phase transition. Both of them gave the similar temperature and field dependent behaviour, which revealed a close correlation between magnetic and electric properties of MnI2. These results might be helpful for the further investigation and application of MnI2 multiferroics in the future.
Acknowledgments
This work was supported by the National Key Research and Development Program of China (2016YFA0300904 and 2016YFA0300600) and the National Science Foundation of China (Grant Nos. 51661135026 and 11734003).